
2026-09-11
Informational purposes only. The content in this report, including allocations, analysis, and commentary, is provided solely for informational and educational purposes. It does not constitute financial advice, investment advice, trading advice, or any other type of advice. Past performance does not guarantee future results. Always conduct your own research and consult a qualified financial professional before making investment decisions.
This report is within the active 4-week tranche window. Subscribe to see the full allocation, trade instructions, macro checklists, crypto checklist, ETF charts with TA scoring, and category reasoning.
Subscribe — $39/monthWeekly Allocation
| Ticker | Category | Weight | Role |
|---|---|---|---|
| FBTC | 50% | Overlay | |
| XLE | Traditional Energy | 10% | Top-2 (10%) |
| MOO | Agriculture & Livestock | 10% | Top-2 (10%) |
| GDX | Precious Metals | 5% | Tier-2 (5%) |
| URA | Nuclear Energy | 5% | Tier-2 (5%) |
| IGF | Utilities & Infrastructure | 5% | Tier-2 (5%) |
| COPX | Industrial Metals | 5% | Tier-2 (5%) |
| ROKT | Defense & Aerospace | 5% | Tier-2 (5%) |
| IGV | Technology | 5% | Tier-2 (5%) |
Trade Instructions — Monday Open
Sell the tranche from 2026-08-14 (completing its 4-week hold). Buy the new tranche. Instructions show net portfolio changes — same-asset positions cancel, weight changes show the delta.
Trade instructions are for subscribers only. Subscribe to access →
Current Portfolio After Trade
Combined holdings across all 4 active tranches. Each tranche is 25% of the portfolio.
| Ticker | % of Portfolio | Weight Bar |
|---|---|---|
| FBTC | 50.00% | |
| XLE | 10.00% | |
| MOO | 7.50% | |
| COPX | 3.75% | |
| GDX | 3.75% | |
| ARKG | 3.75% | |
| IGF | 3.75% | |
| URA | 2.50% | |
| VEGI | 2.50% | |
| URNM | 2.50% | |
| ROKT | 2.50% | |
| IGV | 2.50% | |
| PAVE | 1.25% | |
| REMX | 1.25% | |
| GLD | 1.25% | |
| ITA | 1.25% |
Macro Regime — Stagflation Risk
Macro Evidence Charts
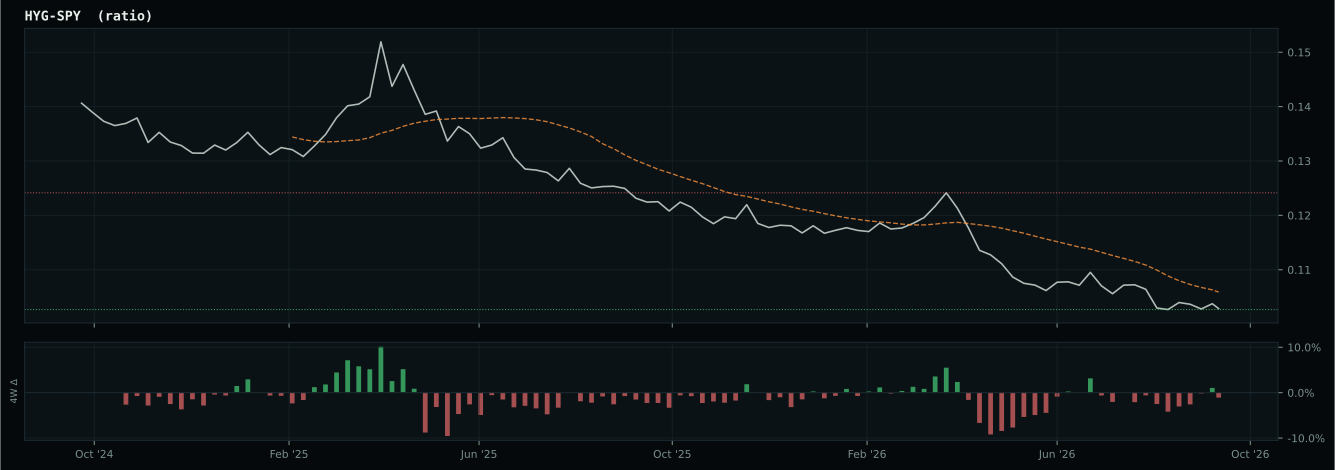
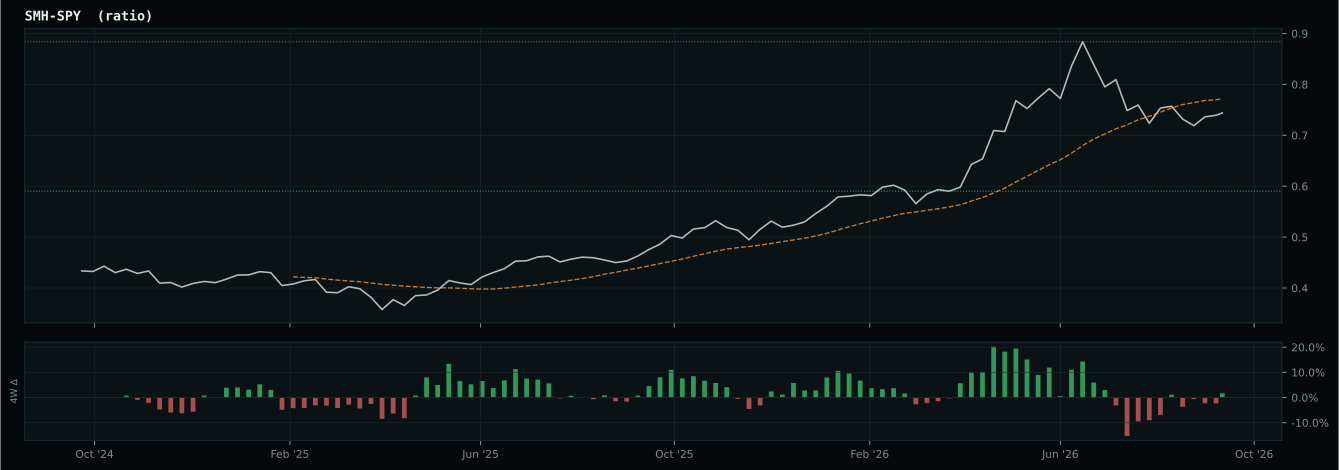
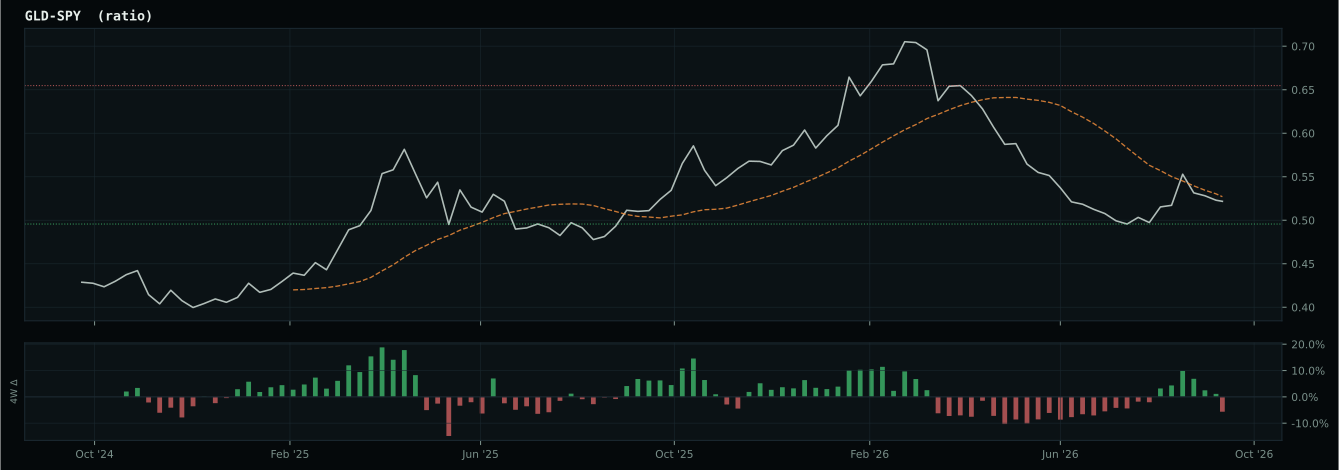
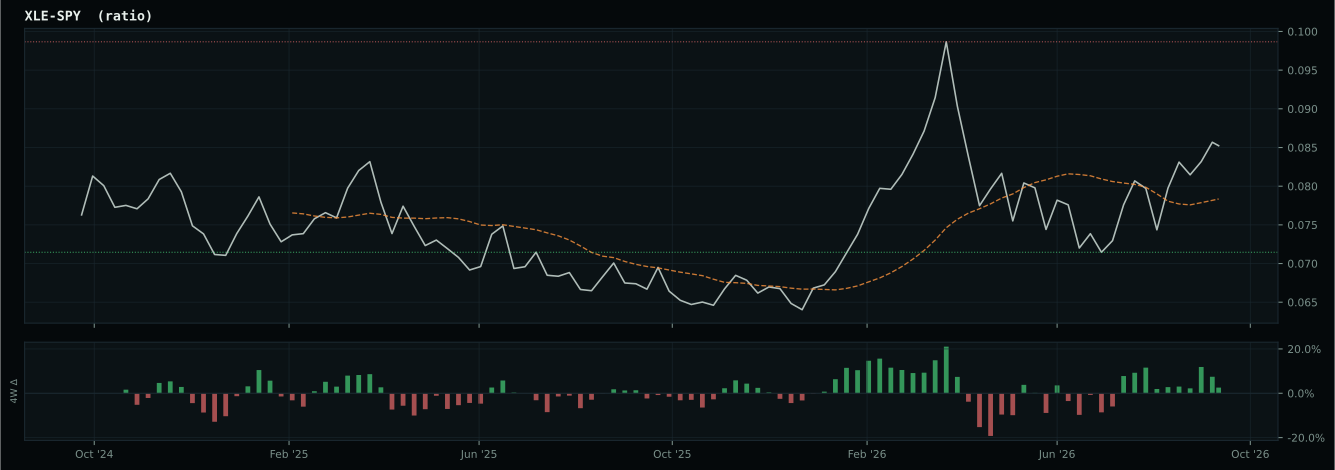
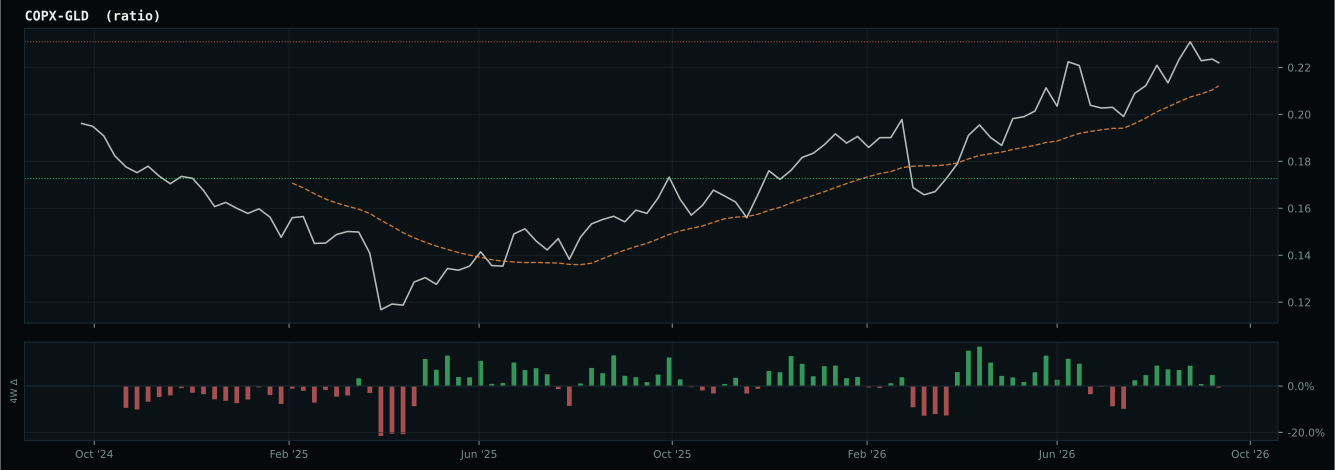
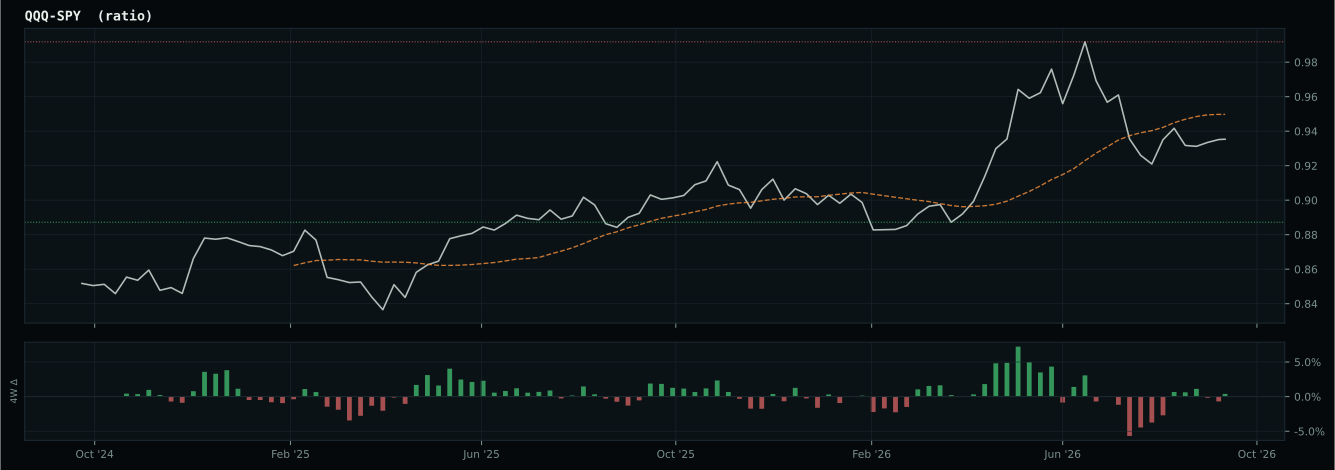
Market-implied signals behind the macro regime scores. Each ratio compares two assets; the direction and slope of the ratio is what the macro engine reads.
Crypto Regime — ValueBTC
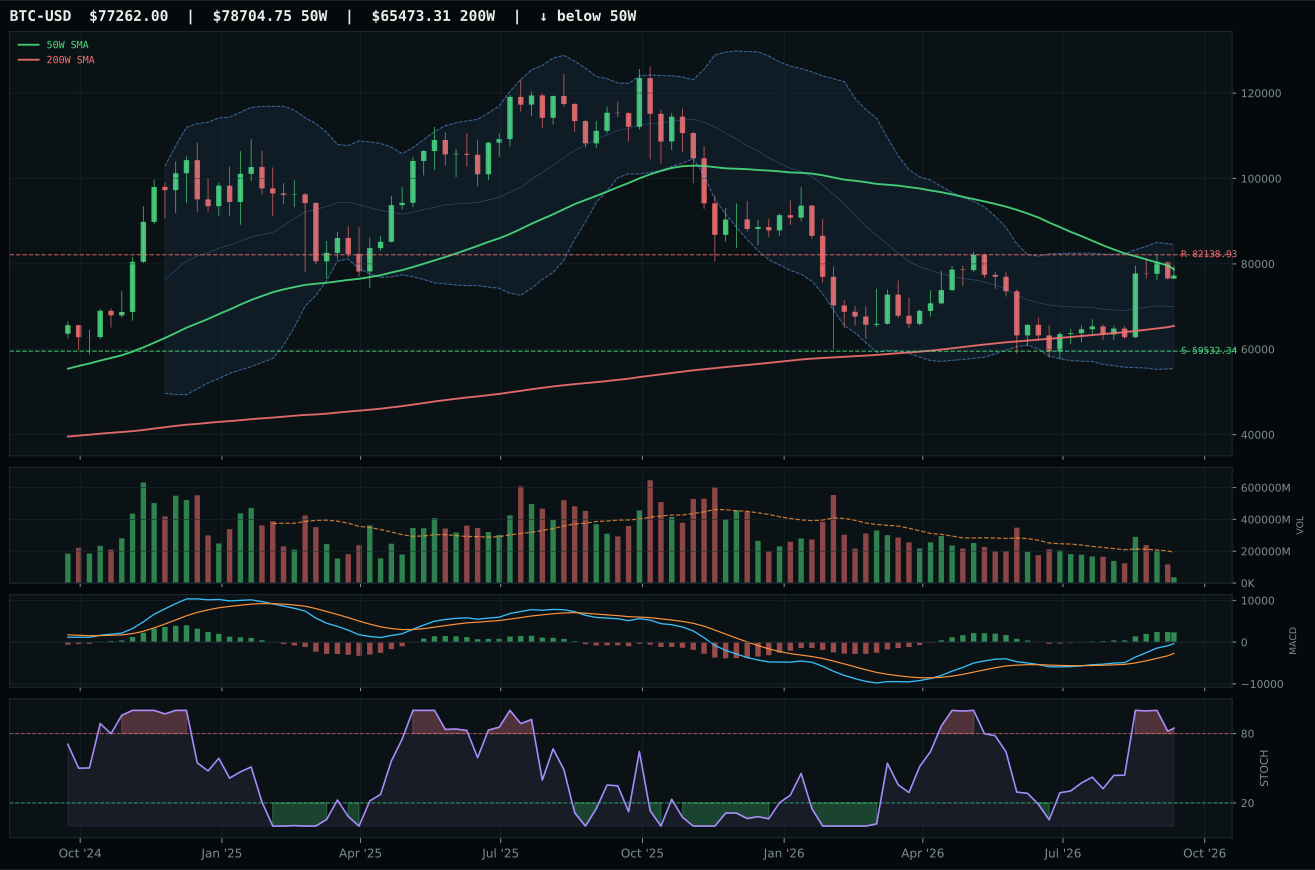
ValueBTC confirmed (timer expiry): 3rd bottom (12-week timer) complete (12 weeks since 2026-06-22 bottom at $59,532). Unconditional entry.
TrendBTC not confirmed
one or more available conditions failed
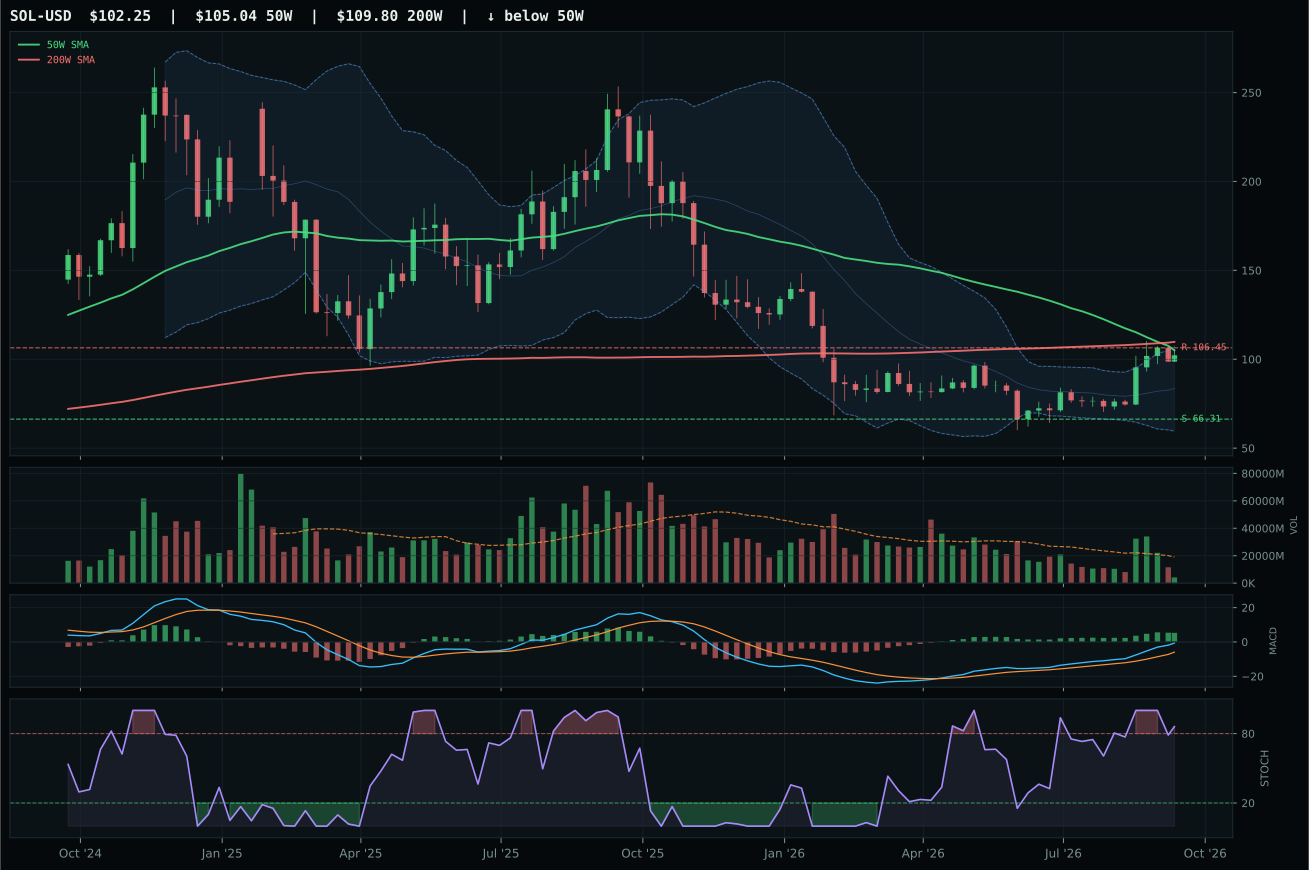
Shifting to Solana expression (FSOL): Two conditions stand between the current FBTC expression and an FSOL expression. ISM Manufacturing PMI (47.9) needs to recover above 50. This index publishes monthly, so the earliest opportunity is the next scheduled release. A reading below 50 signals contraction; a recovery above it would confirm that the manufacturing economy is no longer deteriorating — a prerequisite before committing to the higher-beta altcoin trade. The Fed balance sheet needs to be flat or rising (currently falling). A contracting balance sheet reduces system liquidity — the wrong backdrop for rotating into higher-beta assets. The TOTAL3/BTC 50-week slope (-1.01% per week) needs to turn positive. This measures whether altcoins as a group are gaining ground against Bitcoin on a sustained basis — the signature of early-cycle rotation into higher-beta assets. A positive slope means altcoins have been outperforming BTC consistently enough to shift the moving average upward.
Graduating to TrendBTC: The ValueBTC position matures into a full TrendBTC position when Bitcoin closes above the 50-week SMA ($78,703) while that SMA is flat or rising. BTC is currently 2.0% below the 50W SMA, and the SMA has been declining as the prior cycle's peak prices rotate out of the window. TrendBTC would signal that the new bull trend is structurally confirmed, at which point the full AltSeason conditions become evaluable and Solana exposure becomes available through the normal channel.
Exiting back to NoCrypto: Two consecutive weekly closes below the 200-week SMA ($65,473) and the prior range support level exit the ValueBTC position. Bitcoin is currently 17.9% above the 200W SMA. The two-week requirement prevents a single volatile candle from prematurely ending the position during normal consolidation above support.
Category Rankings
| Rank | Category | Winner | Score | Alloc | 4W Ret | Peers (4W) |
|---|---|---|---|---|---|---|
| 1 | Traditional Energy | XLE | 77.1 | 20% | — | XOP — · FCG — |
| 2 | Agriculture & Livestock | MOO | 76.5 | 20% | — | VEGI — · PDBA — |
| 3 | Precious Metals | GDX | 61.5 | 10% | — | GLD — · SLV — |
| 4 | Nuclear Energy | URA | 45.3 | 10% | — | NLR — · URNM — |
| 5 | Utilities & Infrastructure | IGF | 42.9 | 10% | — | PAVE — · XLU — |
| 6 | Industrial Metals | COPX | 40.6 | 10% | — | PICK — · REMX — |
| 7 | Defense & Aerospace | ROKT | 37.0 | 10% | — | ITA — · XAR — |
| 8 | Technology | IGV | 24.6 | 10% | — | CIBR — · XLK — |
| 9 | Biotech & Genomics | IBB | 17.6 | 0% | — | ARKG — · XBI — |
| 10 | AI | AIQ | 13.9 | 0% | — | BOTZ — · SMH — |
Traditional Energy — XLE
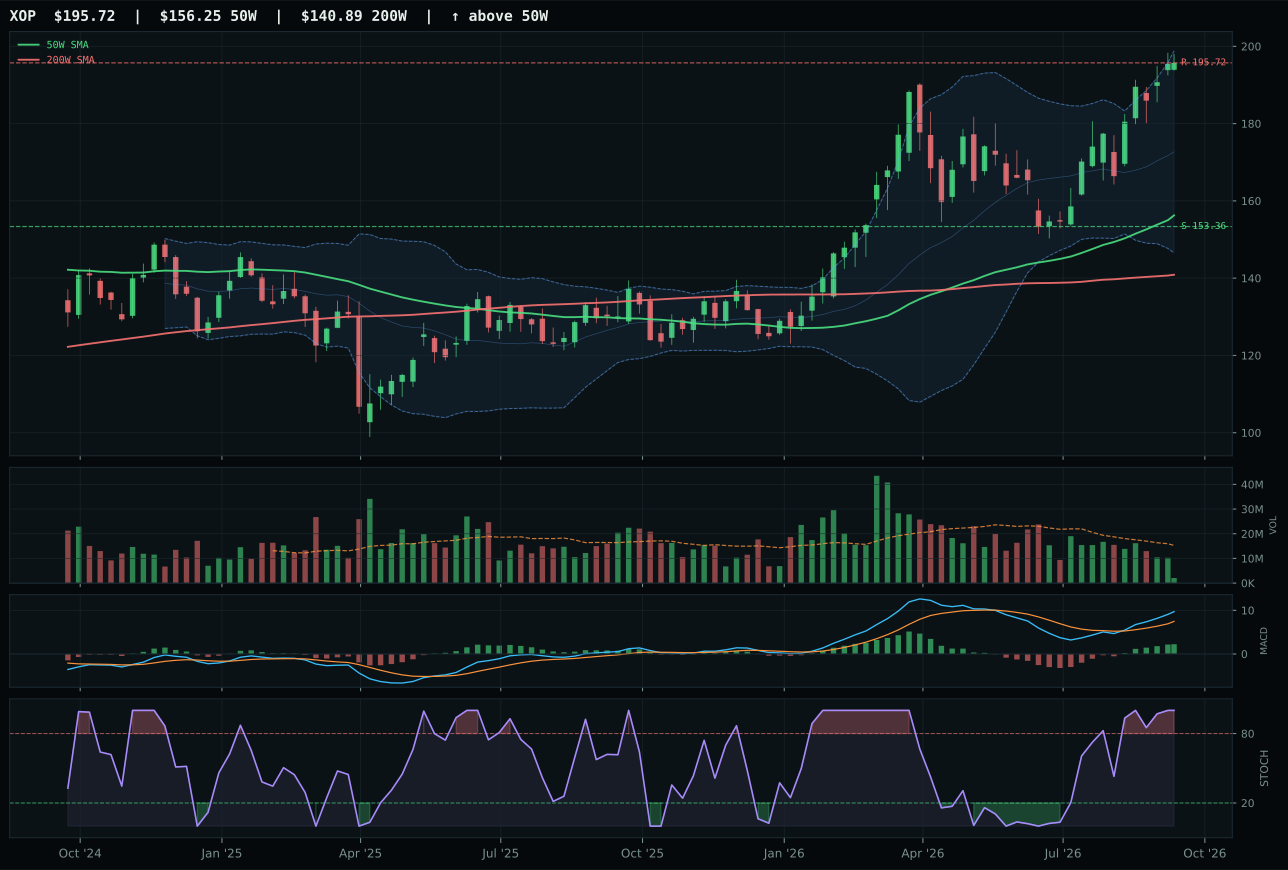
XOP has a vertical extension profile with 25.3% 13-week relative strength versus SPY.
A failed hold above support would weaken the setup.
Actionable but governed by invalidation levels.
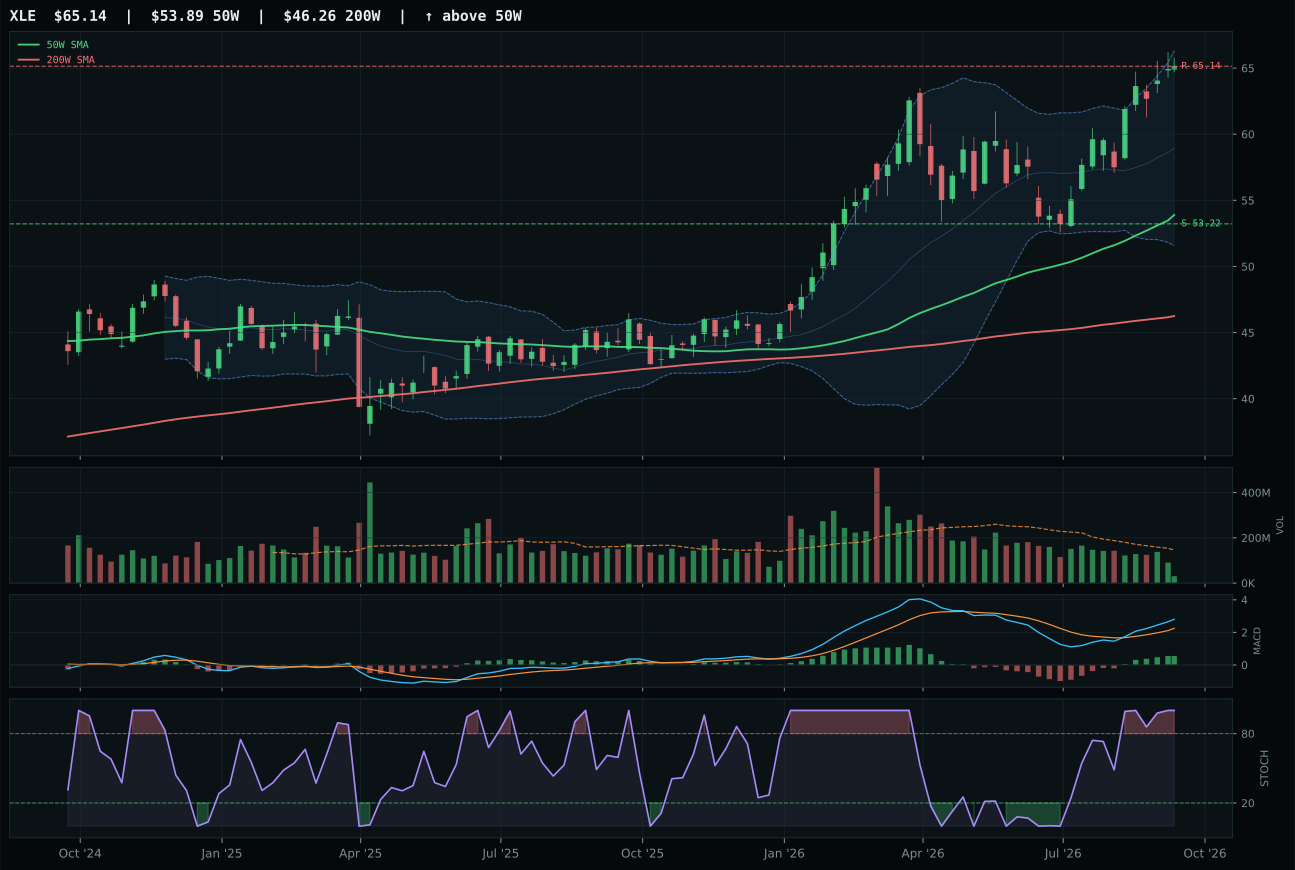
XLE has a vertical extension profile with 18.8% 13-week relative strength versus SPY.
A failed hold above support would weaken the setup.
Actionable but governed by invalidation levels.
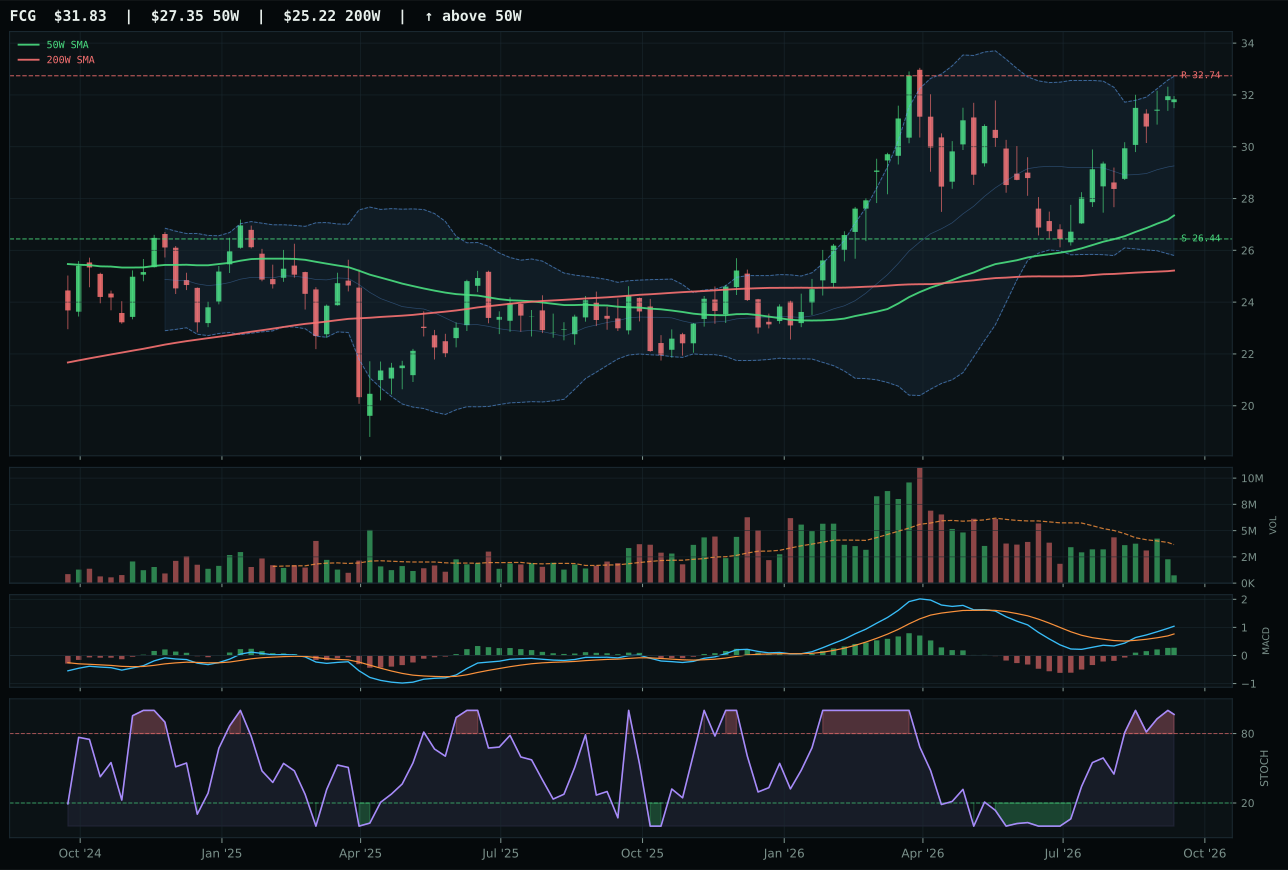
FCG has a vertical extension profile with 16.1% 13-week relative strength versus SPY.
A failed hold above support would weaken the setup.
Actionable but governed by invalidation levels.
XLE wins Traditional Energy and earns top-2 status at 10% allocation with a final category score of 77.1, the second-highest score in the portfolio. The win is powered by perfect trend scoring (100/100) combined with perfect momentum confirmation (100/100): the 13-week return of 21.1% with 18.8% SPY-relative outperformance shows that energy equities are outrunning the market by a meaningful margin. Price sits at resistance at 65.14 with stochastic RSI in full overbought momentum at 1.00, indicating that the move is extended and buyers are chasing, but XLE's integrated-cash-flow model (Exxon, Chevron, Shell exposure) provides valuation stability that prevents the move from feeling purely speculative. XOP lost because it is even more extended at +25.3% SPY-relative with higher implied volatility, making it a leveraged bet; XLE's marginally weaker risk/reward (43.4 vs 42.2) gives it the safer perch despite XOP's higher momentum numbers.
Traditional Energy receives 10% allocation as a top-2 category because its final score of 77.1 ranks second only to Agriculture among all ten categories this week, reflecting exceptional alignment between technicals and macro. The category macro fit of 81.0/100 is extraordinarily strong: stagflation itself contributes +10, energy scarcity adds +16, inflation pressure adds +10, supply shortage adds +9, and real-asset sponsorship adds +7—totaling +52 points of combined macro support before any headwinds. The only drags are growth slowdown (-5) and modest credit concerns, which pale against the energy-specific tailwinds. XLE's technical evidence of 73.2/100 paired with this macro fit creates a portfolio allocation with both technical confirmation and regime tailwind. This is one of the rare instances where both technicals and macro point to the same conviction: in stagflation with constrained oil and gas supply, energy integrateds provide cash returns that offset inflation, making them both tactically overbought on charts and strategically supported by regime. The 10% allocation reflects the highest conviction this week outside of a potential crypto allocation reversal.
Agriculture & Livestock — MOO
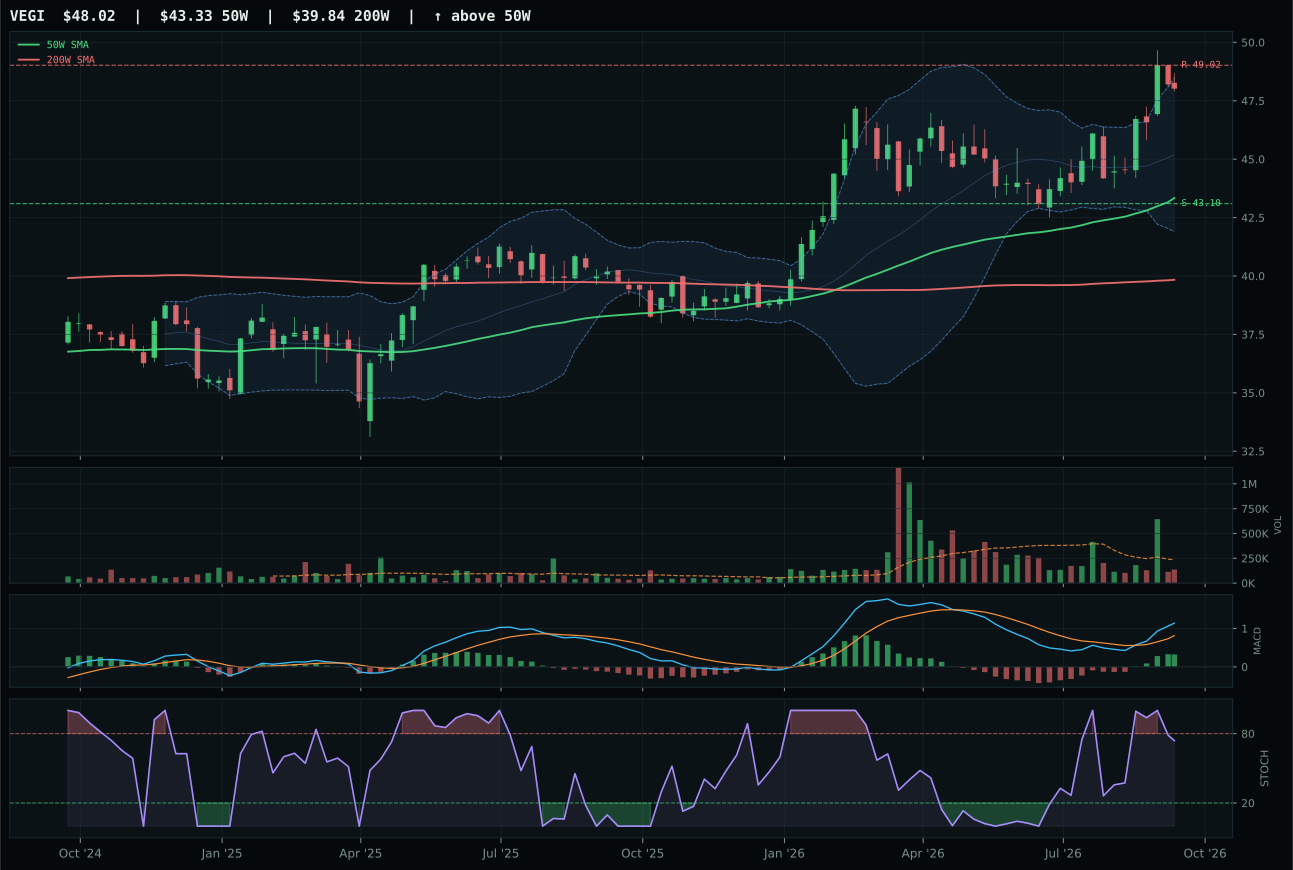
VEGI has a neutral structure profile with 9.1% 13-week relative strength versus SPY.
A failed hold above support would weaken the setup.
Actionable but governed by invalidation levels.
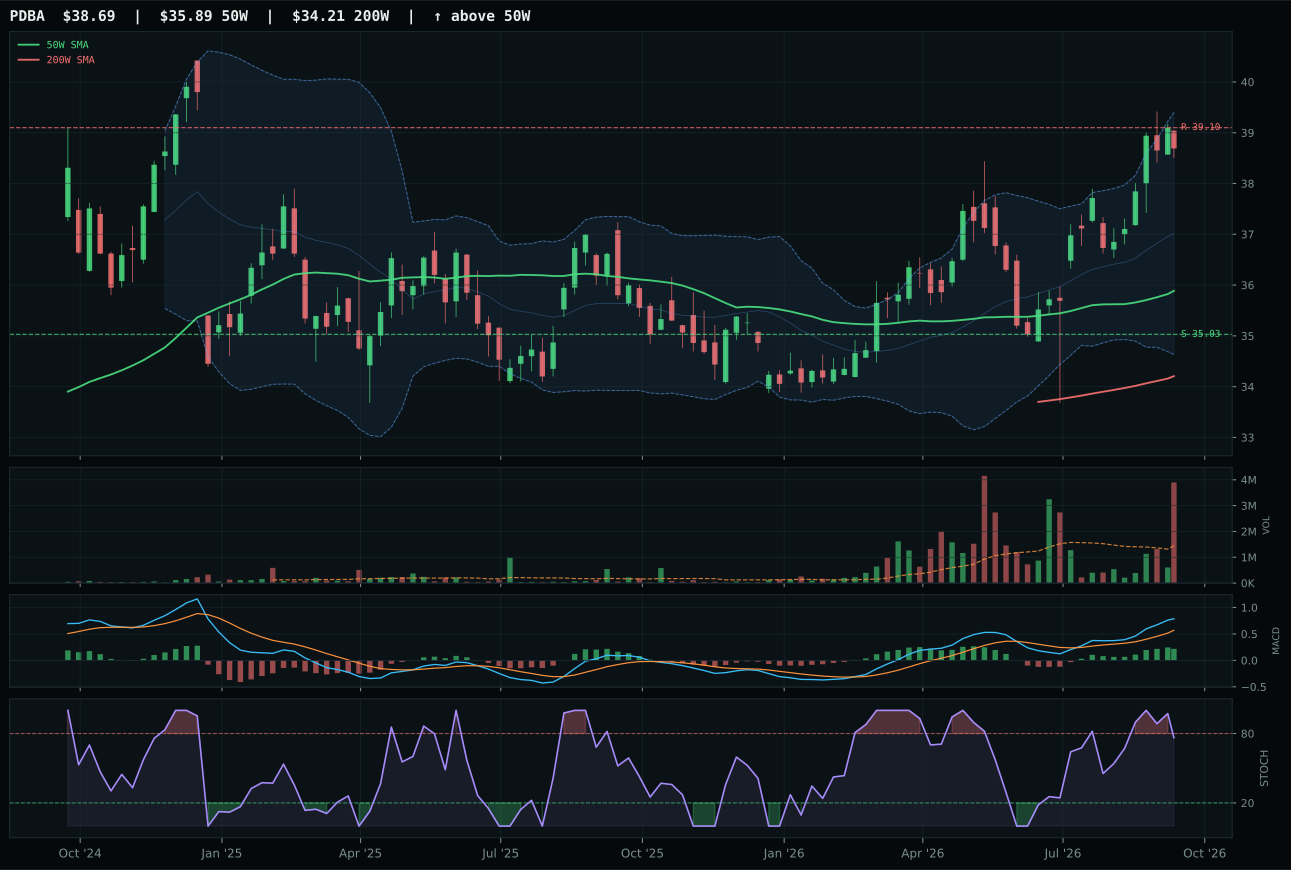
PDBA has a neutral structure profile with 6.6% 13-week relative strength versus SPY.
A failed hold above support would weaken the setup.
Actionable but governed by invalidation levels.
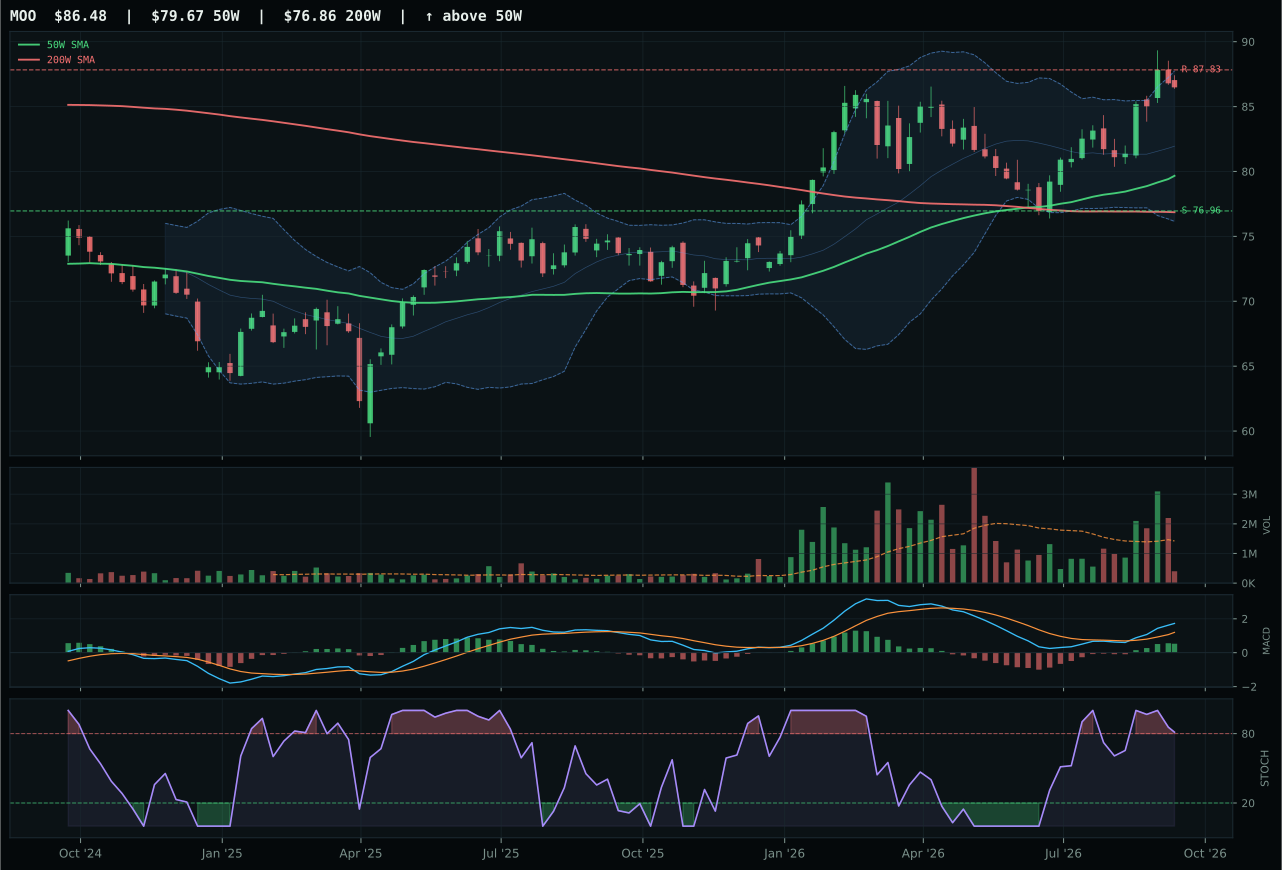
MOO has a neutral structure profile with 10.0% 13-week relative strength versus SPY.
A failed hold above support would weaken the setup.
Actionable but governed by invalidation levels.
MOO wins Agriculture & Livestock and earns a top-2 allocation at 10% because its technical evidence combines perfect trend scoring (100/100 for price above both 50W and 200W with positive slope) alongside real momentum confirmation. The 13-week return of 12.4% with 10.0% SPY-relative outperformance and 1.0% category-relative strength proves that MOO is accumulating despite stochastic RSI already in overbought territory at 0.81, signaling that buyers are pushing through exhaustion levels rather than fading. The setup is neutral structure at 73.7/100 compression, giving MOO a clean technical foundation without the brittleness of vertical extension. VEGI lost because although it scored higher on technical evidence (82.2/100 versus MOO's 68.3/100), it posted zero category-relative strength and its structure, while also neutral, lost the cleanness tiebreaker at 73.2 versus MOO's 73.7—a fraction-point difference that reflects VEGI's falling stochastic RSI versus MOO's overbought-rolling-over posture.
Agriculture & Livestock receives 10% allocation as a top-2 category because its final score of 76.5 ranks it among the two highest-scoring category baskets this week. The category macro fit is exceptionally strong at 89.0/100, driven by +13 points for active supply-shortage signals, +10 for inflation pressure, +8 for real-asset sponsorship, and +5 for commodity-breadth-positive conditions—creating a stacking of favorable macro descriptors that uniquely benefit agriculture in stagflation. Stagflation itself contributes +10 at the category level, meaning rising input costs and constrained planting offset any demand concerns from growth slowdown. MOO's technical evidence of 68.3/100 paired with macro/narrative fit of 67.0/100 creates a balanced, non-fragile allocation case: the charts are healthy without being extended, and the macro regime is actively supporting grain, livestock, and agricultural input prices. This is a rare instance where both technical confirmation and macro narrative point in the same direction, justifying the top-2 weight without relying on mean reversion or macro reversals.
Precious Metals — GDX
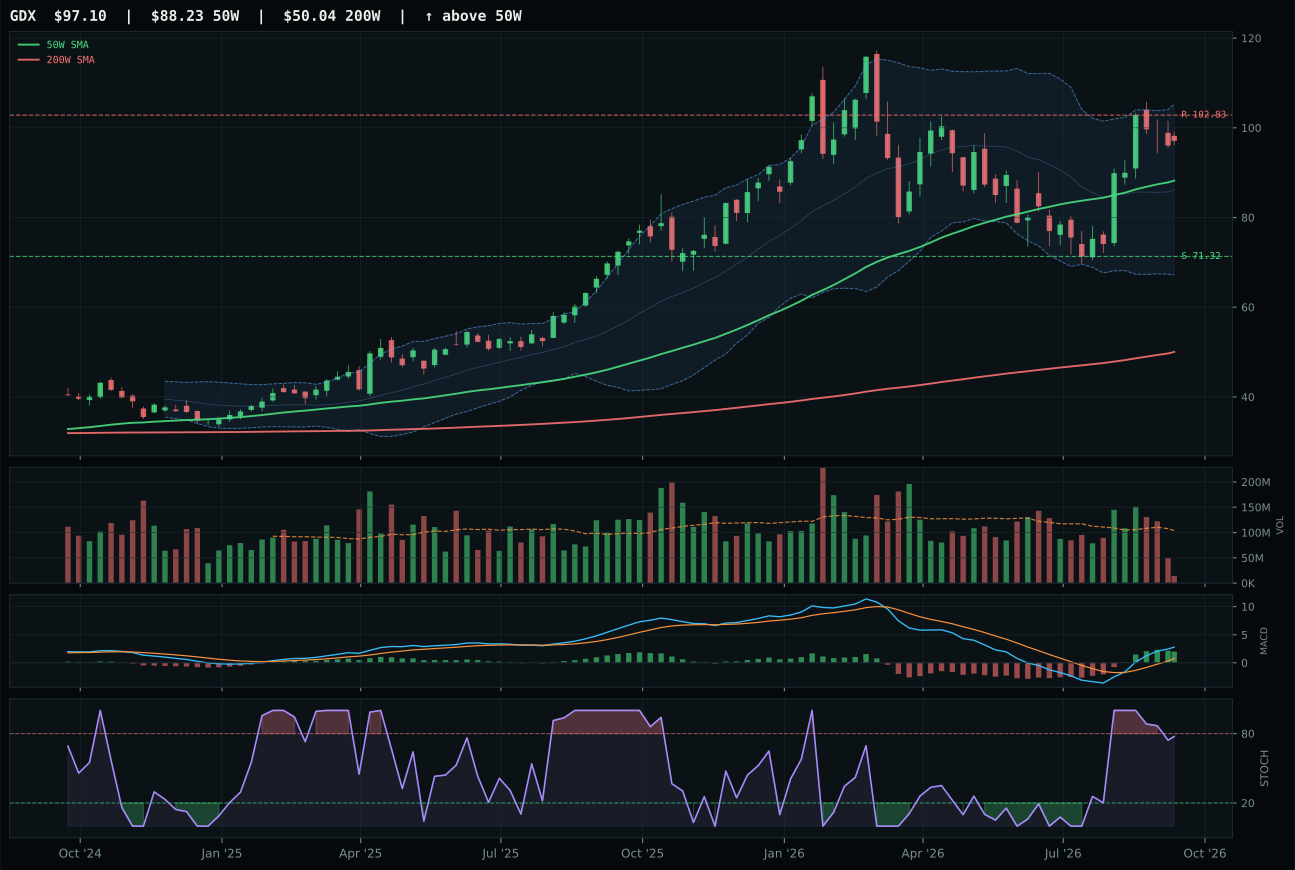
GDX has a neutral structure profile with 15.3% 13-week relative strength versus SPY.
A failed hold above support would weaken the setup.
Actionable but governed by invalidation levels.
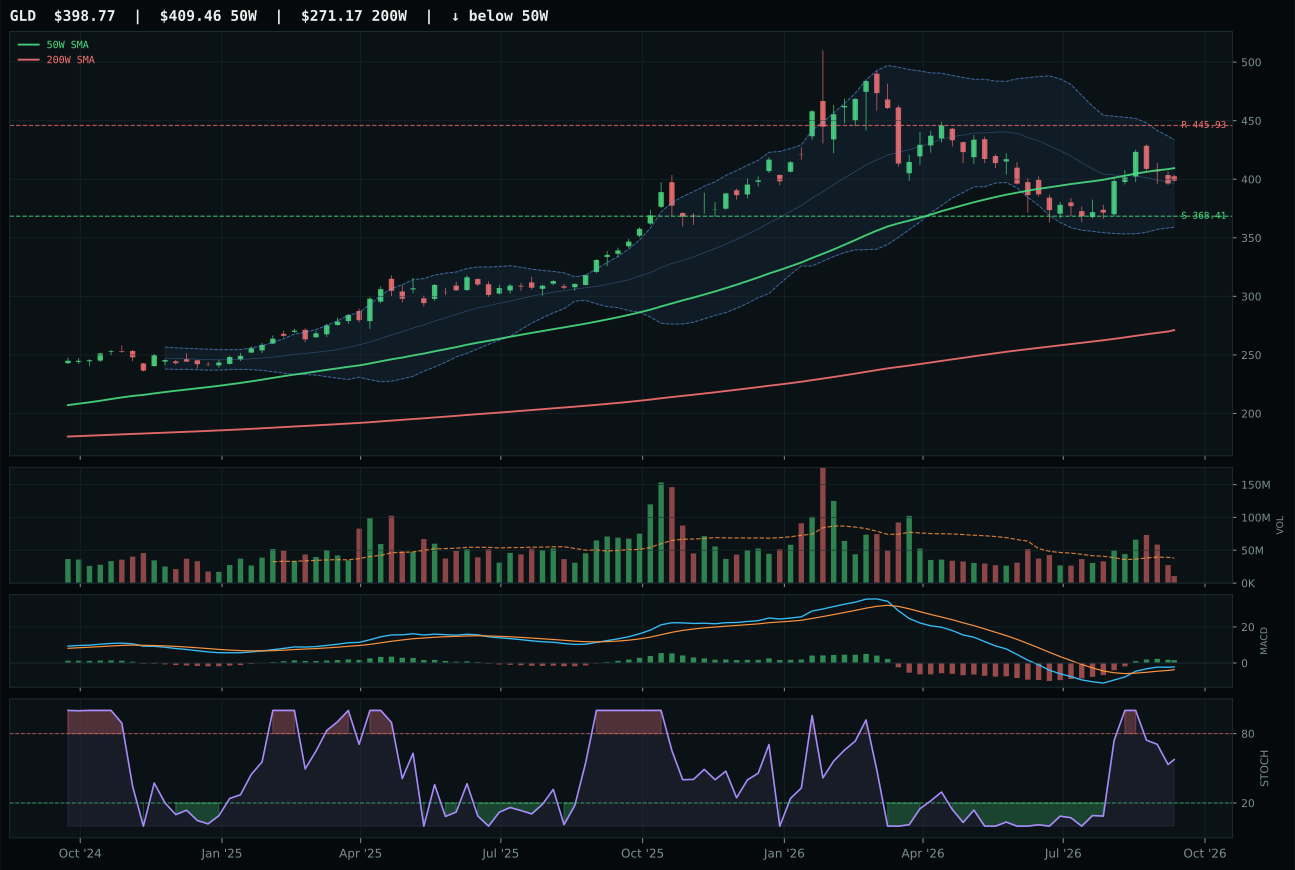
GLD has a compression near 50W profile with 0.7% 13-week relative strength versus SPY.
A failed hold above support would weaken the setup.
Actionable but governed by invalidation levels.
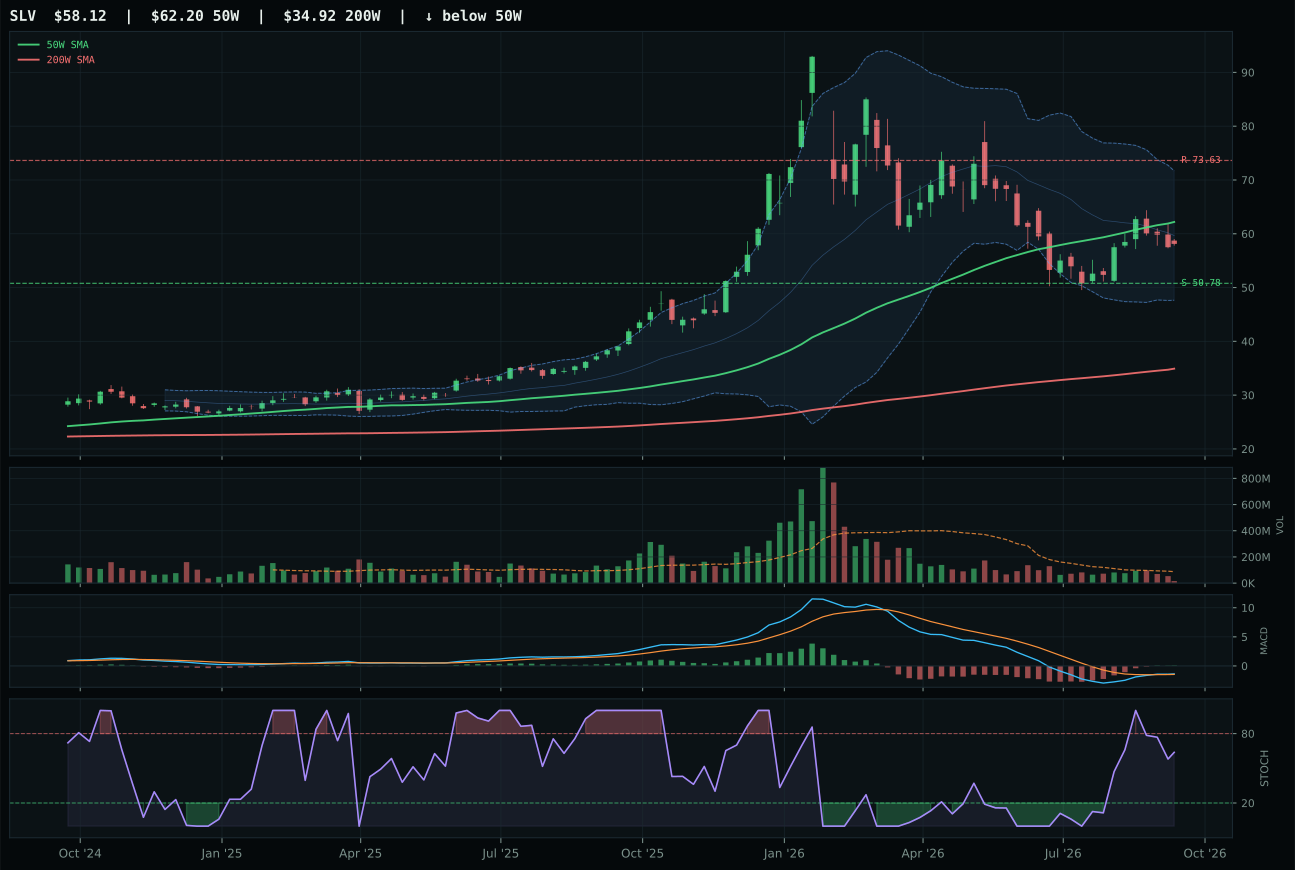
SLV has a neutral structure profile with -4.7% 13-week relative strength versus SPY.
A failed hold above support would weaken the setup.
Actionable but governed by invalidation levels.
GDX wins Precious Metals with a final category score of 61.5, earning tier-2 status at 5% allocation. The win is anchored in perfect trend scoring (100/100) combined with exceptional momentum confirmation (100/100)—the 13-week return of 17.7% and 15.3% SPY-relative outperformance prove that gold miners are performing while equities stall, a classic stagflation signature. Category-relative strength of 14.7% versus GLD's 0.0% and SLV's negative readings shows concentrated buyer preference for the leveraged miner exposure. Timing scores 82.0/100 because GDX sits 10.1% above its 50W (moderate, not extended) with MACD bullish-and-improving and stochastic RSI falling-neutral—conditions that suggest continued accumulation rather than exhaustion. GLD lost despite posting a respectable 72.2 technical evidence score because its 0.7% SPY-relative return and 0.0% category-relative strength reveal it is a static monetary hedge rather than a driven outperformer; it is held for insurance, not because it is being bought.
Precious Metals earns 5% allocation at tier-2 despite a category score of 61.5, because stagflation regimes provide a structural bid for both gold and miners. The category macro fit of 60.0/100 benefits from +10 points for stagflation itself, which benefits real assets during periods of rising input inflation and policy uncertainty. However, liquidity stress (-9), credit stress (-7), and risk-appetite-broken (-5) drag the macro fit down substantially, preventing precious metals from reaching top-2 status. The 5% allocation reflects a tactical holding: GDX's 17.7% thirteen-week return and momentum confirmation justify the position, but the category's rank below Agriculture and Energy shows that in this particular stagflation regime, supply-constrained real assets (food, energy) outrank monetary hedges (metals). GDX's technical setup is clean and momentum is real, making this a conviction allocation on technicals, but the macro fit ceiling ensures it does not expand beyond tier-2. Investors should view this as a portfolio hedge that is working, not as a primary growth or income driver.
Nuclear Energy — URA
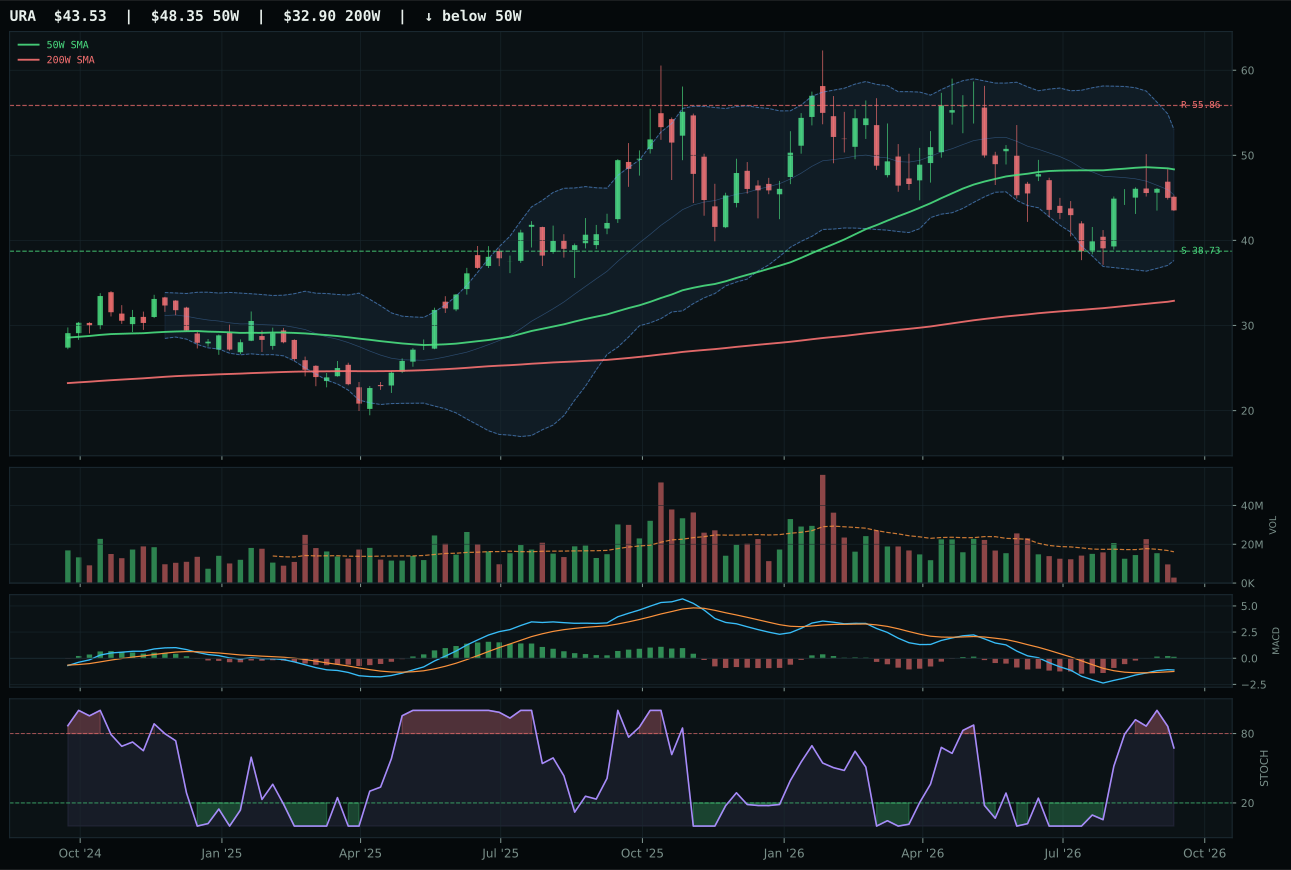
URA has a neutral structure profile with -11.2% 13-week relative strength versus SPY.
A failed hold above support would weaken the setup.
Actionable but governed by invalidation levels.
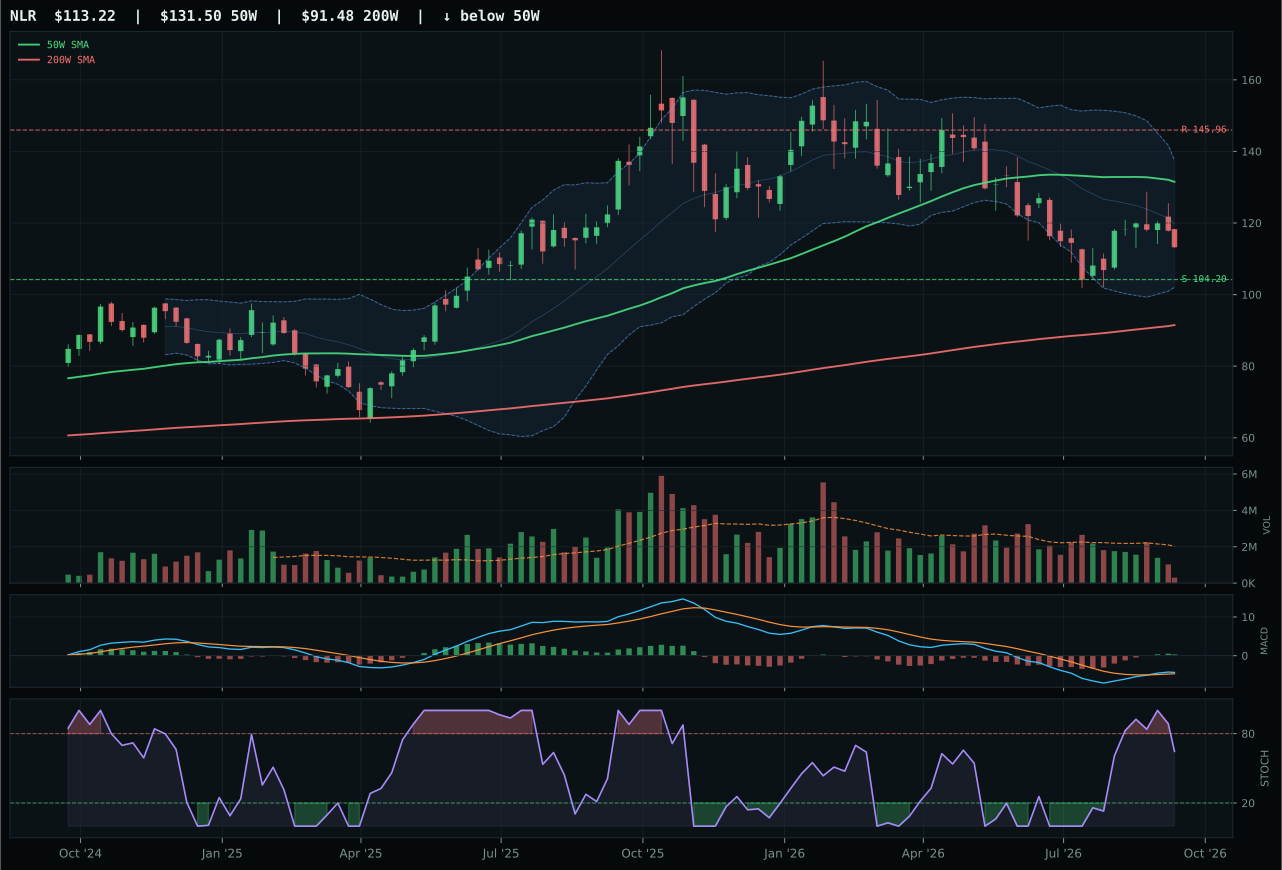
NLR has a neutral structure profile with -13.2% 13-week relative strength versus SPY.
A failed hold above support would weaken the setup.
Actionable but governed by invalidation levels.
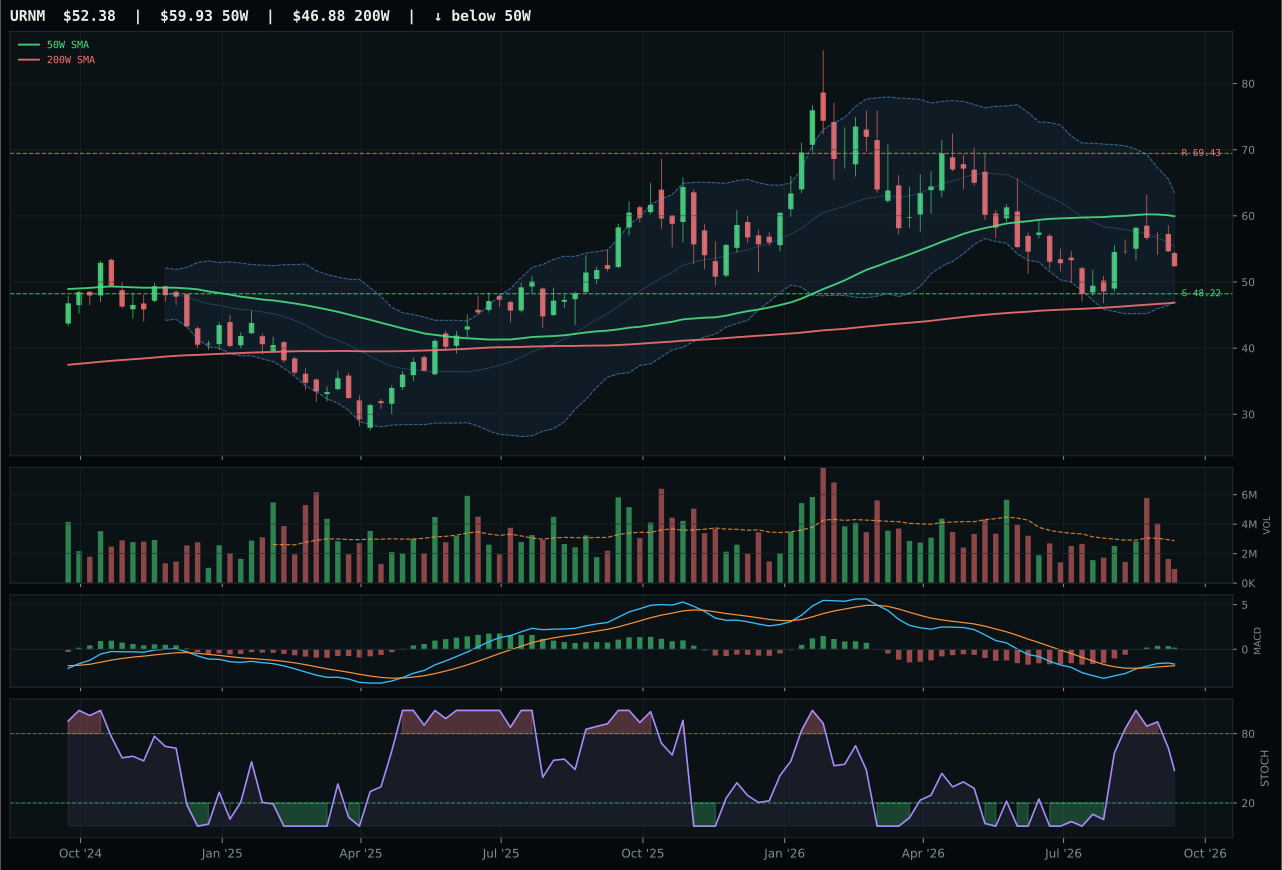
URNM has a neutral structure profile with -11.2% 13-week relative strength versus SPY.
A failed hold above support would weaken the setup.
Actionable but governed by invalidation levels.
URA wins Nuclear Energy with a final category score of 45.3, earning 5% tier-2 allocation. The win is anchored in an exceptional timing score of 82.0/100 despite URA trading 10.0% below its 50W average—a scenario that normally signals weakness but here represents a reset into value territory. Price sits in the deep retracement/value zone at Fib 0.786 with MACD bullish-and-improving and stochastic RSI falling-neutral, creating the technical picture of a washout reversal rather than continued deterioration. Risk/reward scores 70.1/100 because the 12.4% downside to support at 38.73 is balanced against 22.1% upside to resistance, despite the resistance being far away—this asymmetry is the setup's appeal. NLR lost because its timing score of only 55.0/100 reflects a chart still caught near 52-week lows with less clearly defined support structure, and its category-relative strength of -1.9% shows it is trailing within the nuclear sleeve.
Nuclear Energy earns 5% allocation at tier-2 despite a final score of 45.3, because energy scarcity (+9 points) and real-asset sponsorship (+7 points) provide macro scaffolding that supports nuclear specifically in stagflation. Stagflation itself adds +8 points at the category level, reflecting the fact that baseload power demand from industrial production and geopolitical uncertainty around traditional energy create conditions favorable for nuclear capacity. URA's technical evidence of 55.2/100 is held back by weak trend (60/100 because price is below the 50W) and negligible momentum confirmation (19.9/100 from the -8.9% thirteen-week return), but its 82.0/100 timing score compensates—the pullback-and-reset structure is tactically healthy even if near-term technicals are soft. This allocation would not exist if stagflation signals broke or if macro fit deteriorated, but it holds because nuclear is a beneficiary of both energy scarcity and decarbonization policy support regardless of short-term equity technicals. The 5% position is meant to be accumulated into weakness if URA breaks its support structure; it is not a momentum chase.
Utilities & Infrastructure — IGF
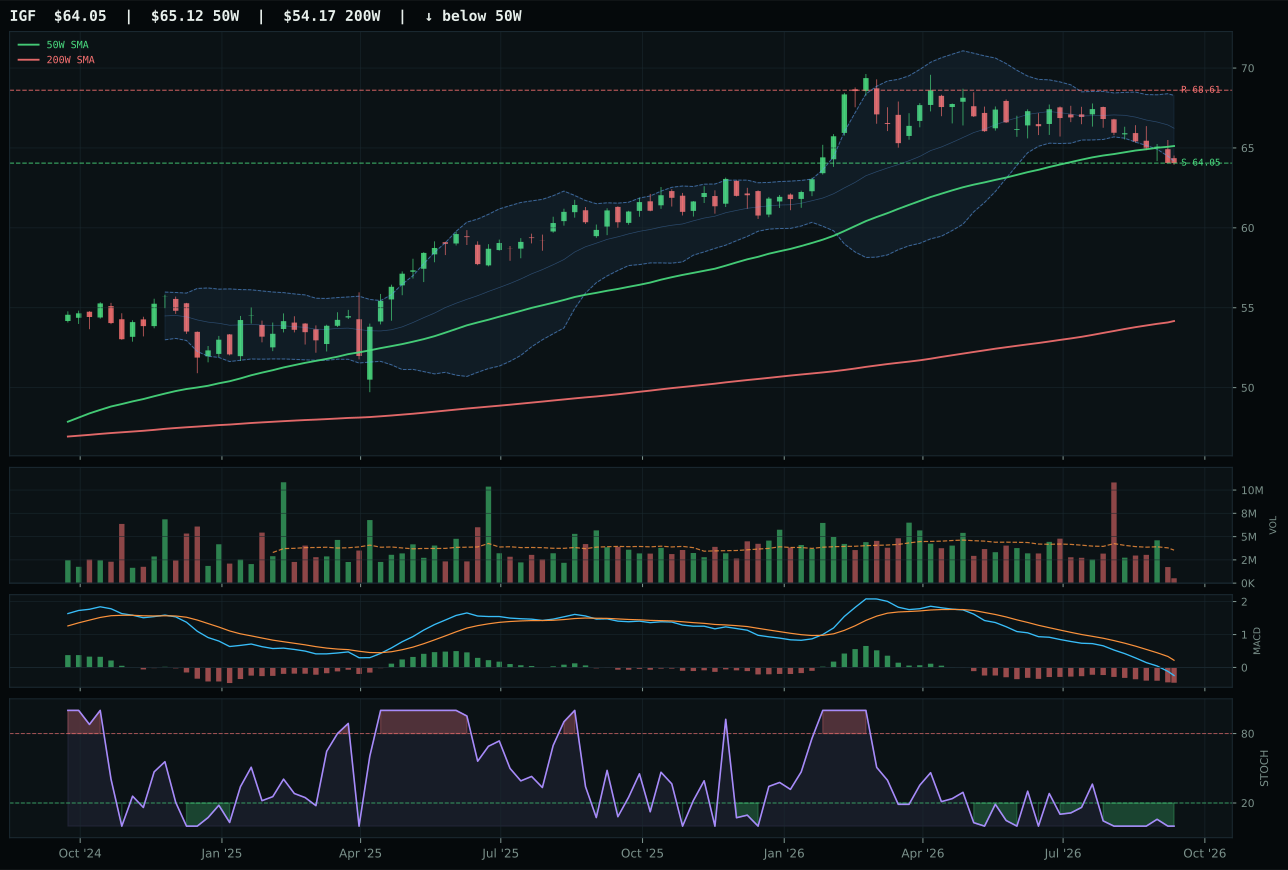
IGF has a pullback into support profile with -5.8% 13-week relative strength versus SPY.
A failed hold above support would weaken the setup.
Actionable but governed by invalidation levels.
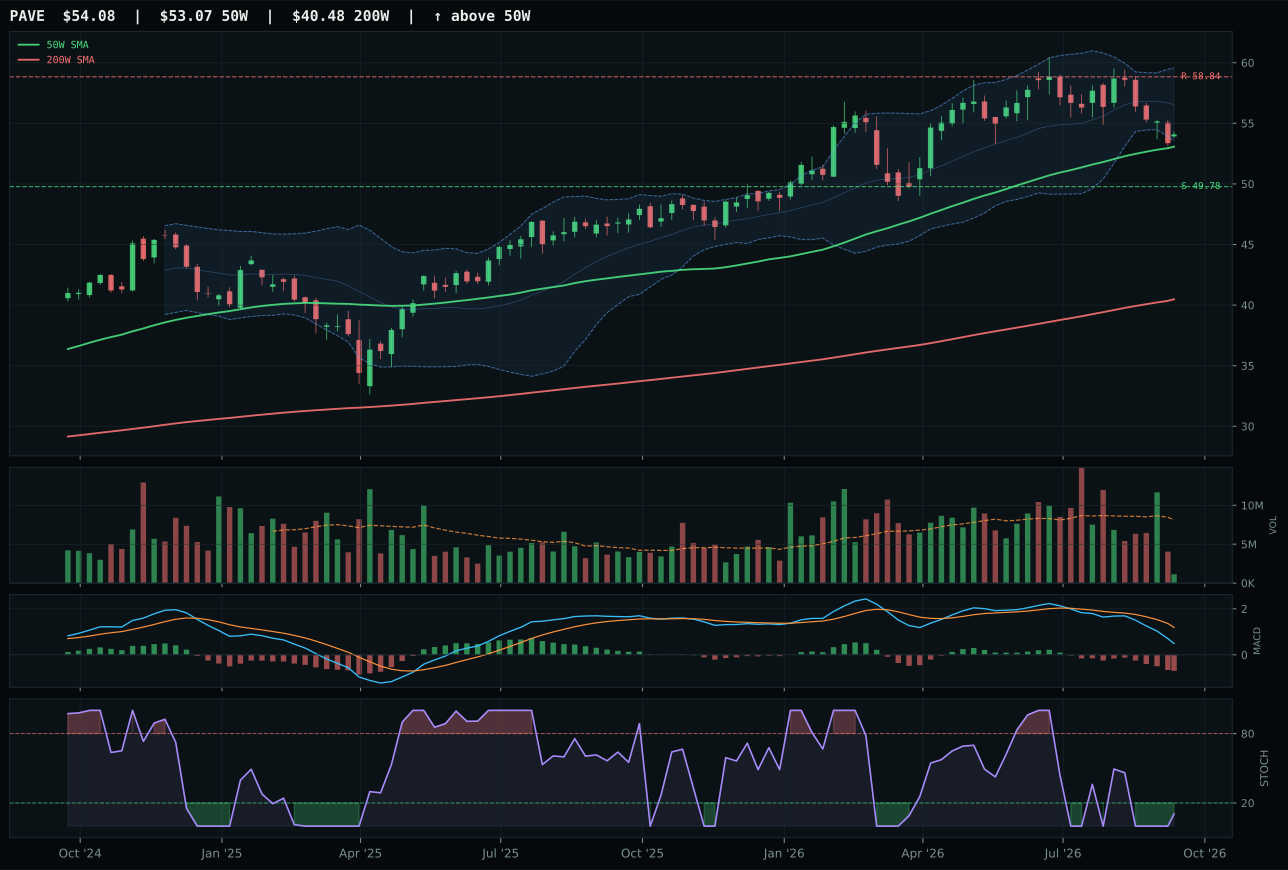
PAVE has a compression near 50W profile with -10.0% 13-week relative strength versus SPY.
A failed hold above support would weaken the setup.
Actionable but governed by invalidation levels.
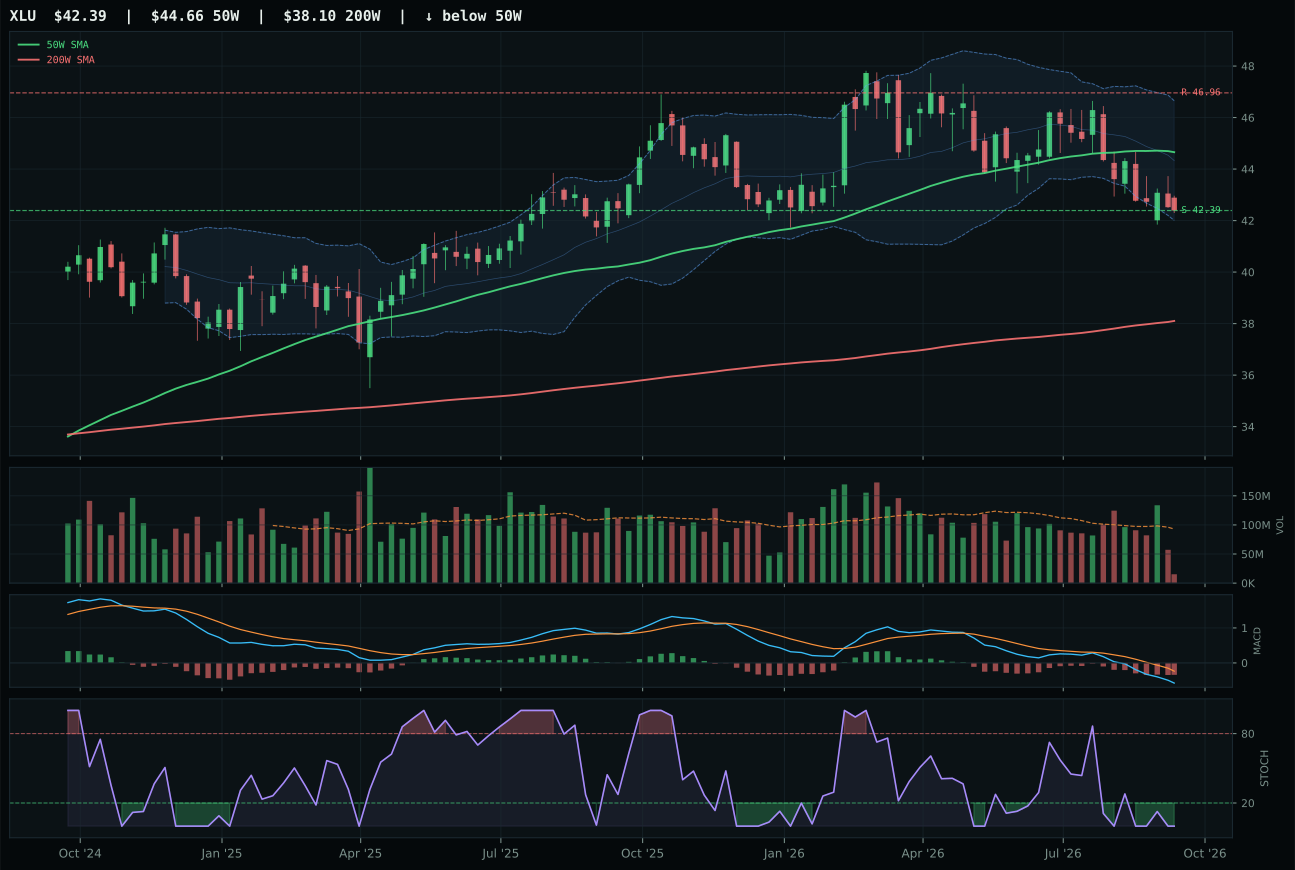
XLU has a pullback into support profile with -7.6% 13-week relative strength versus SPY.
A failed hold above support would weaken the setup.
Actionable but governed by invalidation levels.
IGF wins Utilities & Infrastructure with a final category score of 42.9, earning 5% tier-2 allocation. The win is driven by an exceptional timing score of 100.0/100: price sits only 1.6% below its 50W (pullback into support at 64.05) with stochastic RSI deeply oversold at 0.00 and MACD bearish/weakening, creating a textbook reversal setup. The risk/reward is heavily asymmetric at 68.0/100, with limited downside at 0.0% to support and modest upside constrained at -6.6% by resistance—but that definition of risk is precisely what makes this a controlled entry. PAVE lost because its structure score of 62.3 versus IGF's 67.1 reflects PAVE's compression-near-50W setup being less clearly defined as a reversal point than IGF's pullback-into-support structure, and PAVE's category-relative strength of -2.4% shows it is lagging IGF within the infrastructure sleeve.
Utilities & Infrastructure earns 5% allocation at tier-2 despite a category score of only 42.9, because growth slowdown is active (+6 points) and broad market bear is active (+4 points), creating a macro regime that favors income-generating, defensive equities. However, inflation pressure drags the category macro fit down by -6 points (rising input costs for utilities and infrastructure operators are a real margin risk), and liquidity stress (-3) prevents this category from reaching higher allocation. The 5% position reflects a tactical hedge: infrastructure and utilities are mean-reverting names that perform well during equity drawdowns and stagflation periods when investors rotate toward yield and cash-generative models. IGF's exceptional timing score and oversold stochastic RSI suggest a near-term reversal setup, but the absence of momentum confirmation (16.9/100) and weak trend (58.2/100 from price below the 50W) indicate this is not a conviction accumulation yet. The allocation holds because defensive positioning is never wasted in stagflation, but it would contract if liquidity stress intensified or if credit spreads widened further.
Industrial Metals — COPX
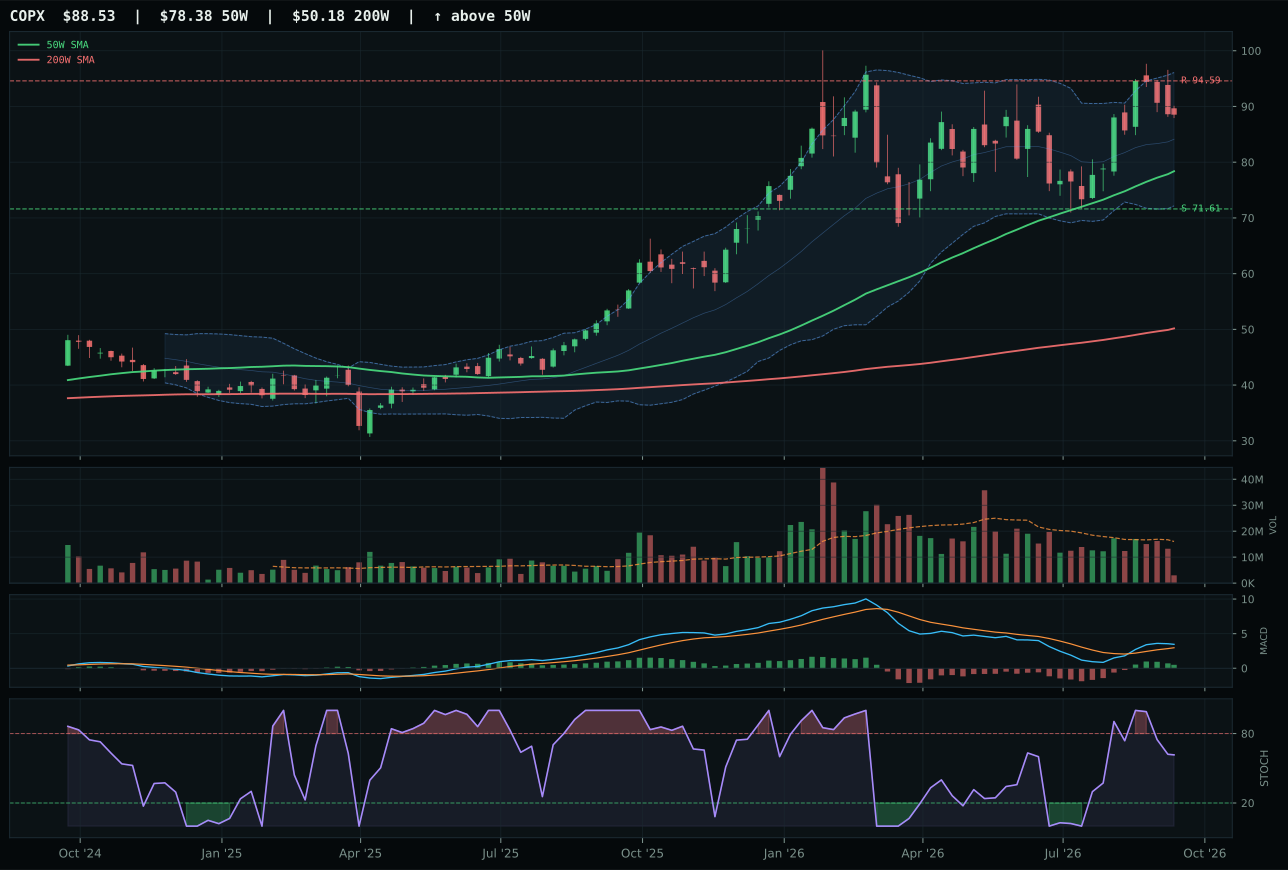
COPX has a neutral structure profile with 1.2% 13-week relative strength versus SPY.
A failed hold above support would weaken the setup.
Actionable but governed by invalidation levels.
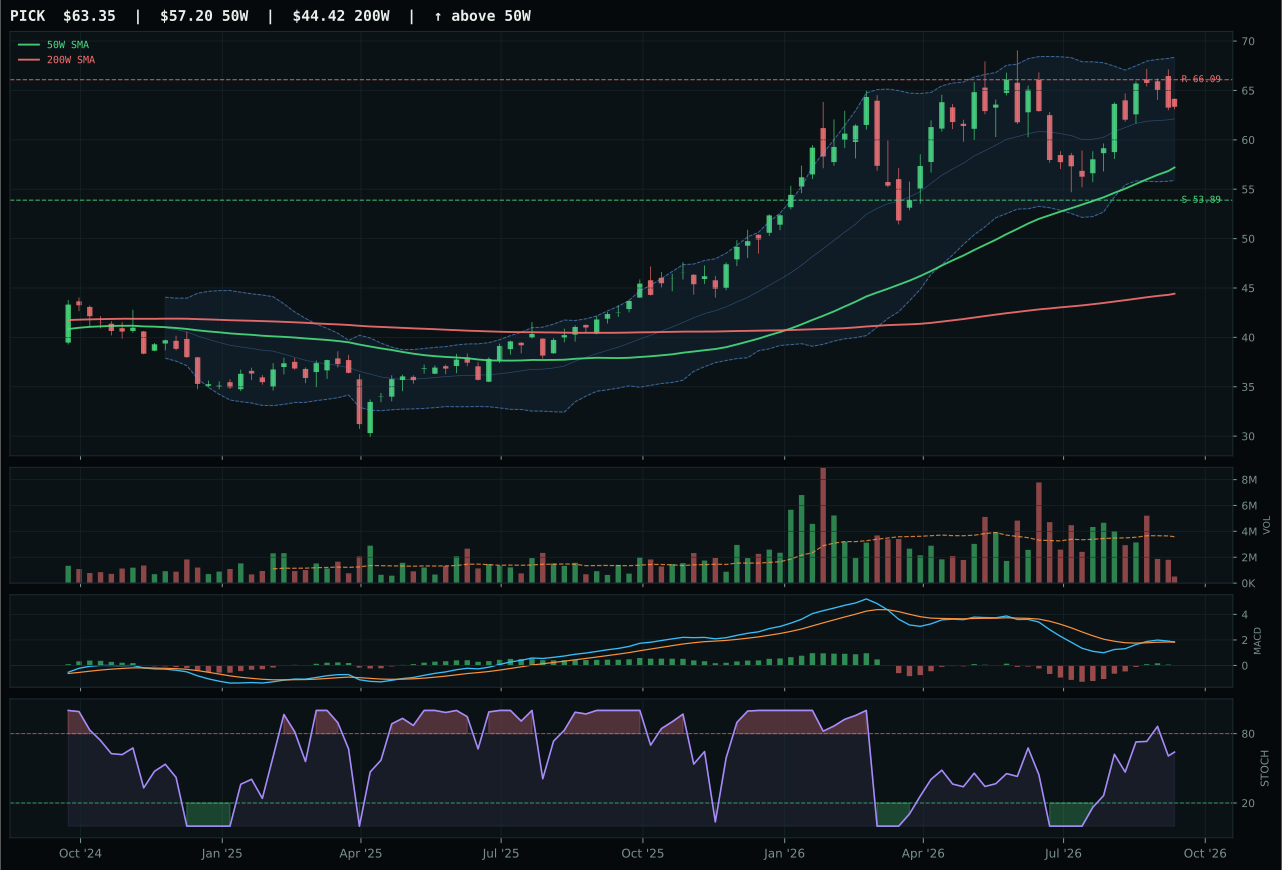
PICK has a neutral structure profile with -1.7% 13-week relative strength versus SPY.
A failed hold above support would weaken the setup.
Actionable but governed by invalidation levels.
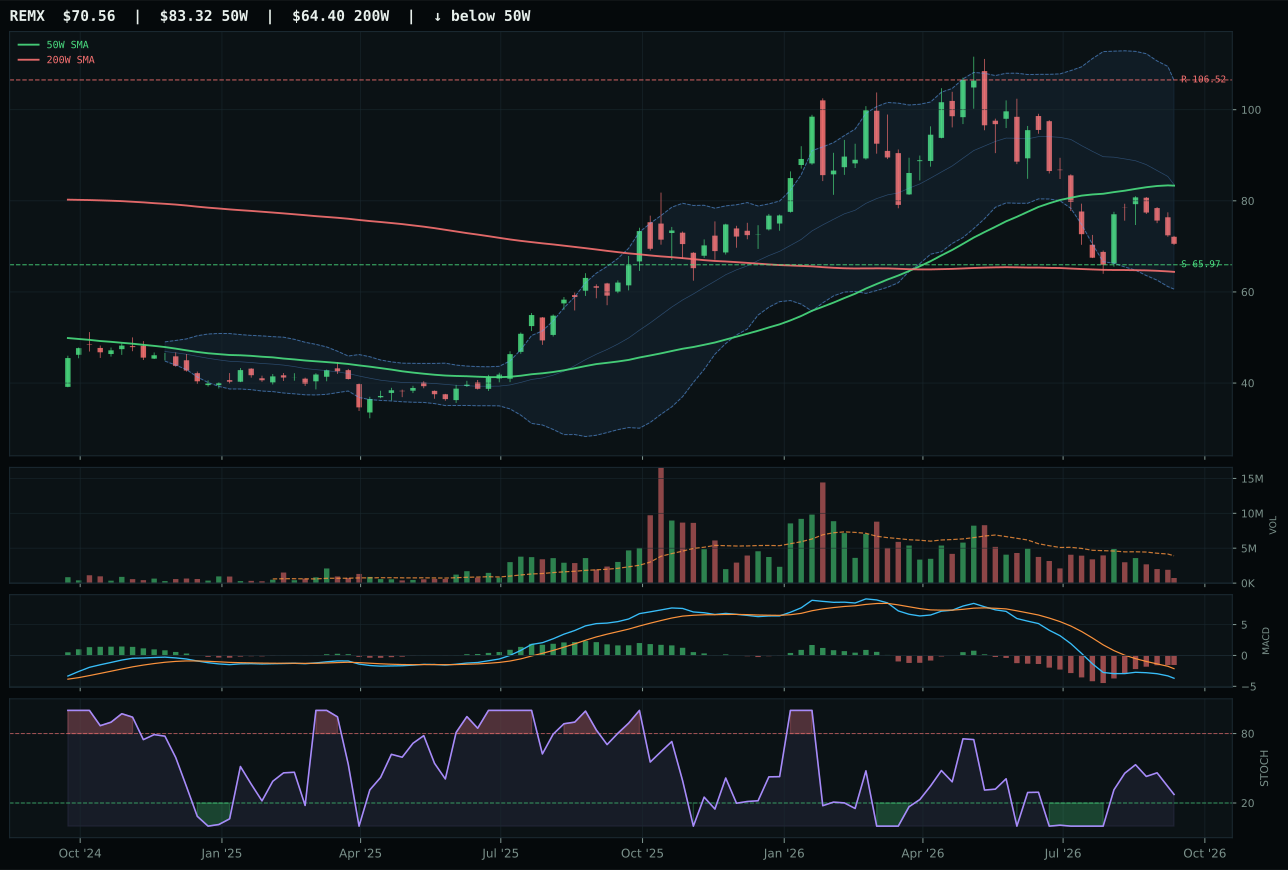
REMX has a neutral structure profile with -28.5% 13-week relative strength versus SPY.
A failed hold above support would weaken the setup.
Actionable but governed by invalidation levels.
COPX wins Industrial Metals with a final category score of 40.6, earning 5% tier-2 allocation. The category winner combines a trend score of 97.8/100 (price well above both moving averages) with bullish-but-flattening MACD, signaling that the move is still intact but losing acceleration. The 13-week return of 3.6% is modest, but the 1.2% SPY-relative outperformance and 2.9% category-relative strength edge out PICK's 0.0% relative strength despite PICK's higher composite score of 68. COPX's risk/reward of 49.9/100 edges PICK's 49.2/100 on a technical tiebreaker, and COPX's MACD remains bullish-but-flattening while PICK's has deteriorated into bearish-but-improving—a distinction that matters in this macro regime where copper demand (tied to industrial production and EV supply-chain build) is more supported than diversified mining. The real story is that neither COPX nor PICK shows conviction from buyers, but COPX's fading bullish MACD suggests recent buyers are not yet backing down.
Industrial Metals receives 5% allocation at tier-2 despite a final category score of 40.6, because metals scarcity descriptors (+14 points) and commodity-breadth-positive signals (+10 points) create enough macro support to justify holding this exposure despite weak technicals. The category macro fit of 55.0/100 is held back by growth slowdown (-10), liquidity stress (-8), and credit stress (-7)—conditions that typically hurt cyclical industrial metals. However, supply-constrained narratives around copper (energy transition infrastructure), nickel (battery supply chains), and molybdenum (semiconductor manufacturing) provide structural support that overrides short-term demand concerns. COPX at 5% represents a residual position: the technicals are not broken (MACD is still bullish), but momentum is fading and relative strength is minimal. This allocation would shrink to zero if either growth slowdown accelerated further or if supply concerns reversed; conversely, it would expand to tier-1 if energy-transition capex accelerated or if copper prices broke above resistance on volume. For now, it holds as a thin hedge against continued industrial-metals supply tightness.
Defense & Aerospace — ROKT
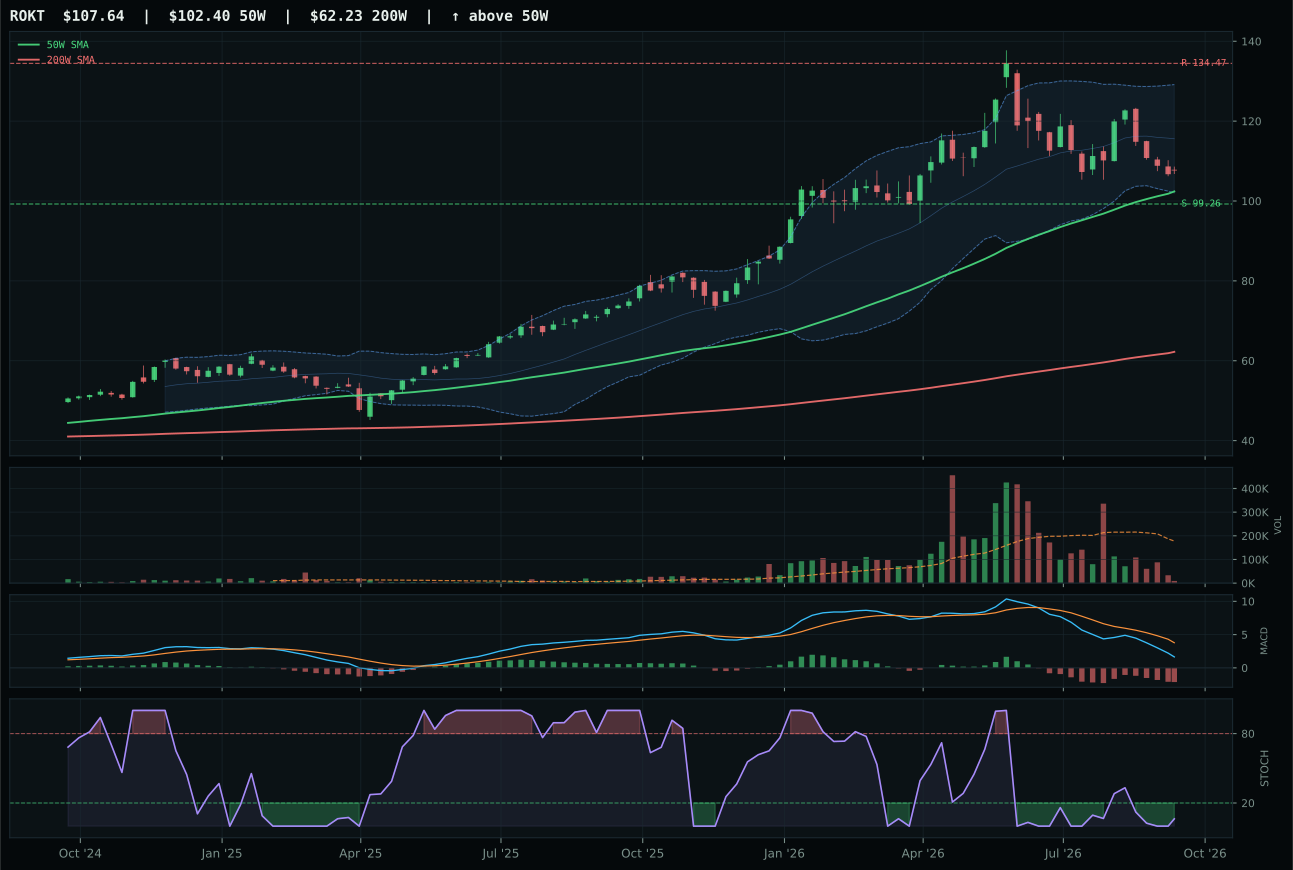
ROKT has a neutral structure profile with -10.8% 13-week relative strength versus SPY.
A failed hold above support would weaken the setup.
Actionable but governed by invalidation levels.
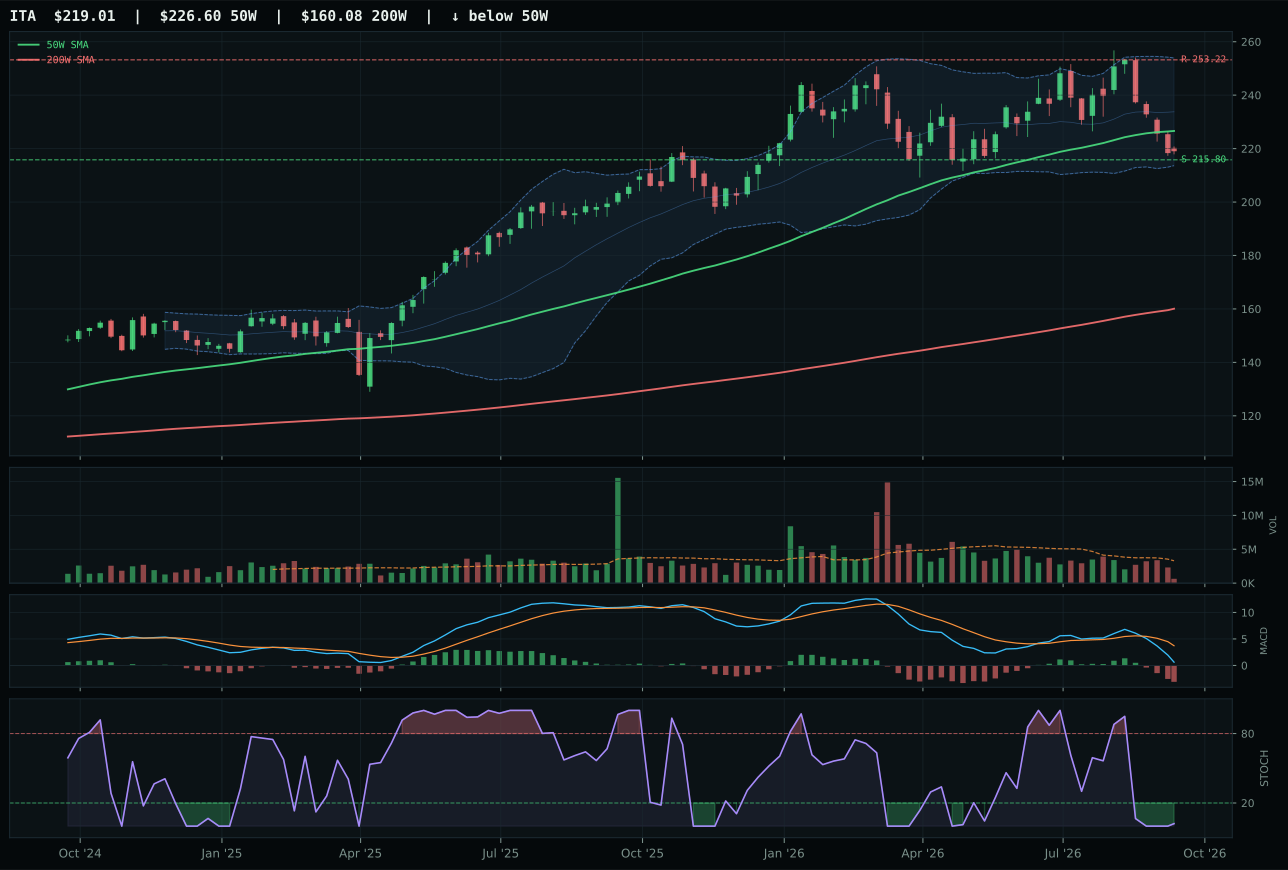
ITA has a pullback into support profile with -10.7% 13-week relative strength versus SPY.
A failed hold above support would weaken the setup.
Actionable but governed by invalidation levels.
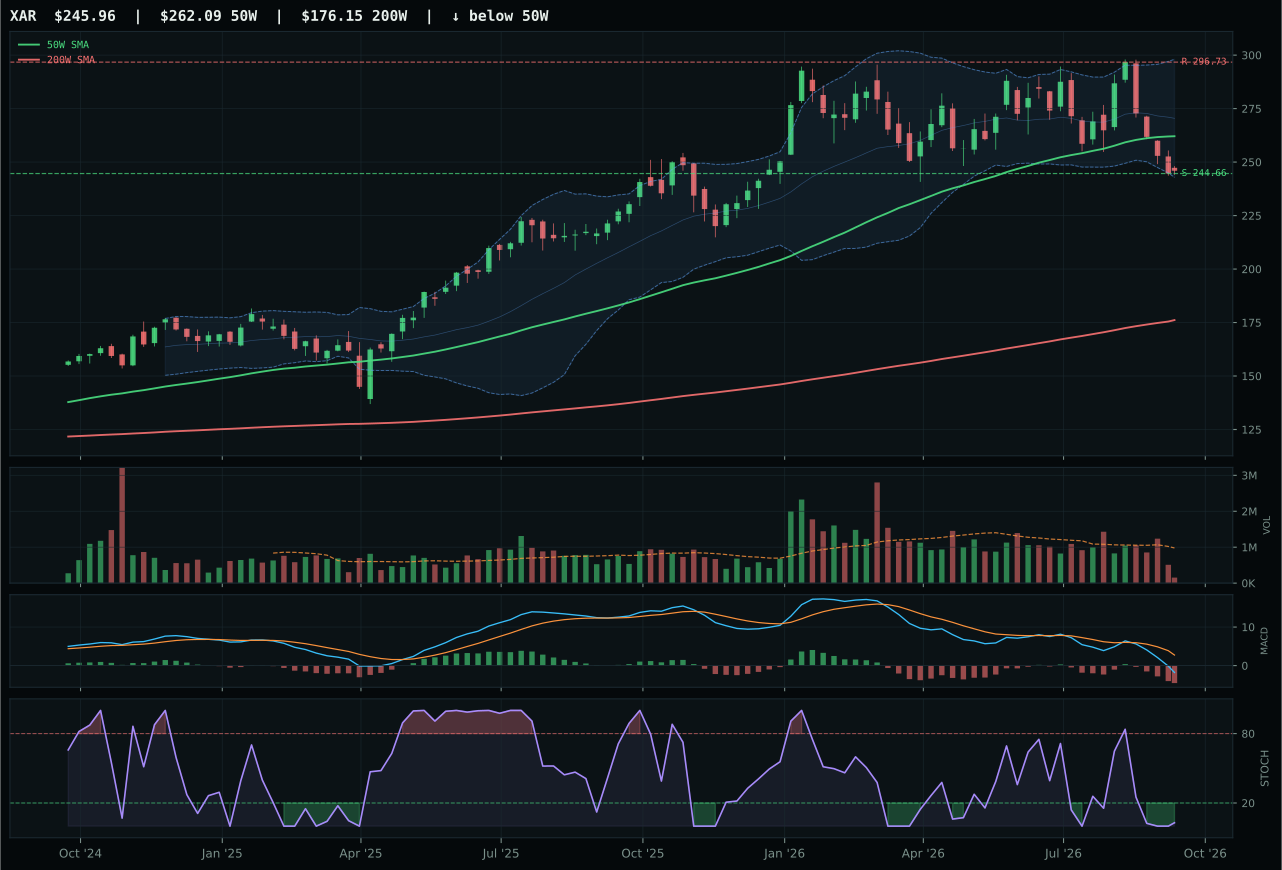
XAR has a pullback into support profile with -15.8% 13-week relative strength versus SPY.
A failed hold above support would weaken the setup.
Actionable but governed by invalidation levels.
ROKT wins Defense & Aerospace with a final category score of 37.0, earning it a tier-2 position at 5% allocation. The win is driven by ROKT's exceptional timing score of 91.0/100—price sits only 5.1% below its 50W high, stochastic RSI is oversold and beginning to turn up at 0.06, and the Fibonacci level at 0.500 provides a clear decision point. Risk/reward is asymmetric at 95.5/100, with downside limited to 8.4% to support while upside is constrained to -19.9% by the resistance ceiling, creating a definition of acceptable loss. ITA lost despite similar momentum characteristics because its technical evidence scored 31.5/100 versus ROKT's 34.0/100—a tight margin that turned on ROKT's slightly sharper structure at 65.1 versus ITA's interpretation as a pullback-into-support setup. Neither ETF shows real momentum (both momentum scores are effectively zero), but ROKT's neutral structure avoids the extra complexity of ITA's support-dependent narrative.
Defense & Aerospace earns 5% allocation despite its category score of 37.0 ranking it tier-2, because stagflation regimes paradoxically help defense and aerospace exposure. The category macro fit of 61.0/100 benefits from +6 points for broad market bear (a reversal of typical risk-off pressure, since defense is a tactical safe haven in drawdowns) and +6 from stagflation itself, which creates geopolitical uncertainty and elevated spending. However, liquidity stress remains active at -4, and credit stress chips in another -2, preventing this category from rising to top-2 status despite its favorable macro positioning. The 5% allocation represents a deliberate hedge: stagflation creates demand for defensive equities, and aerospace-defense offers both a real earnings narrative (supply-chain driven scarcity) and a geopolitical hedge. ROKT's pullback into oversold territory with improving stochastic RSI offers a lower-risk entry than chasing vertical extension, making this a textbook tier-2 allocation—meaningful enough to capture mean reversion if sentiment shifts, but small enough to avoid over-committing to a sector where momentum confirmation is entirely absent.
Technology — IGV
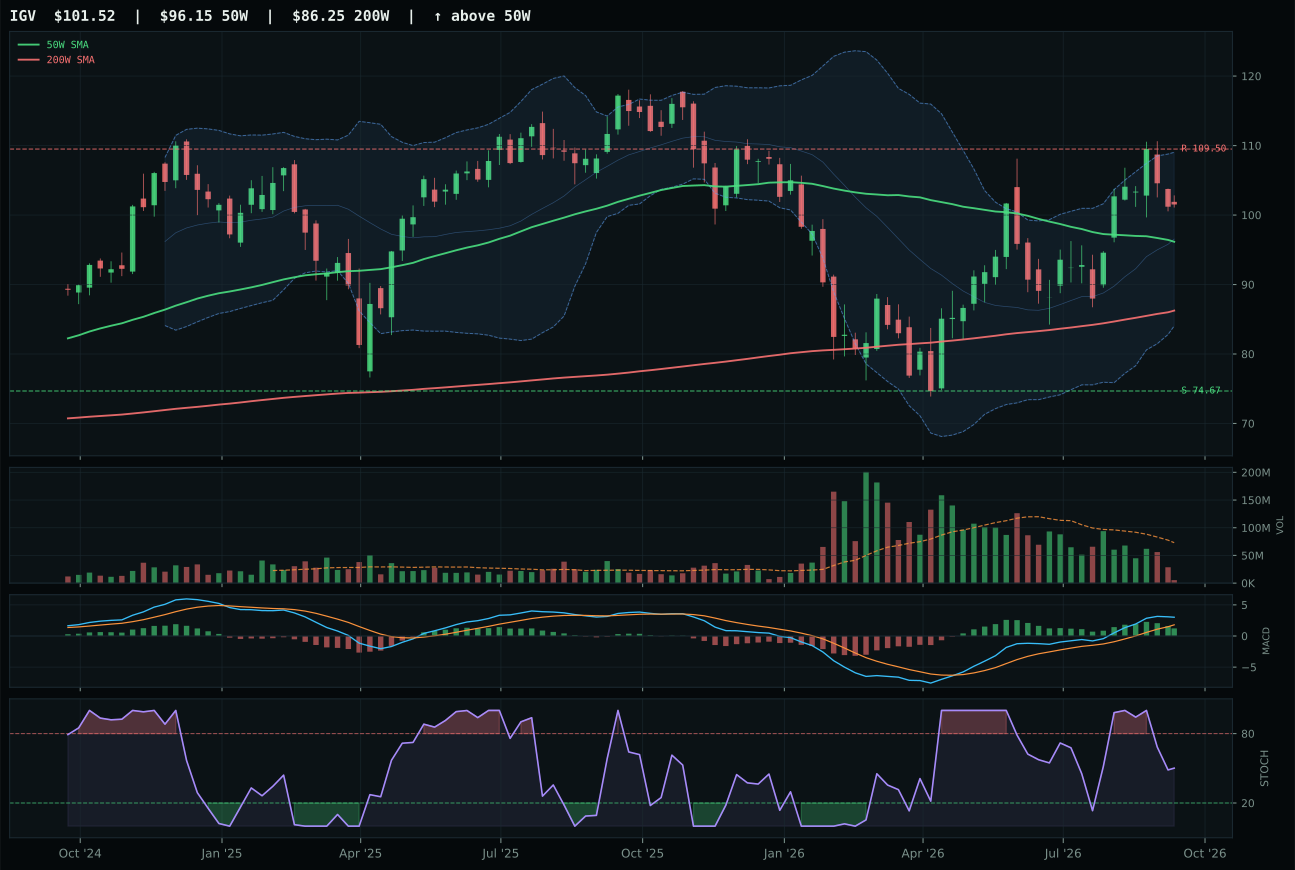
IGV has a neutral structure profile with 11.6% 13-week relative strength versus SPY.
A failed hold above support would weaken the setup.
Actionable but governed by invalidation levels.
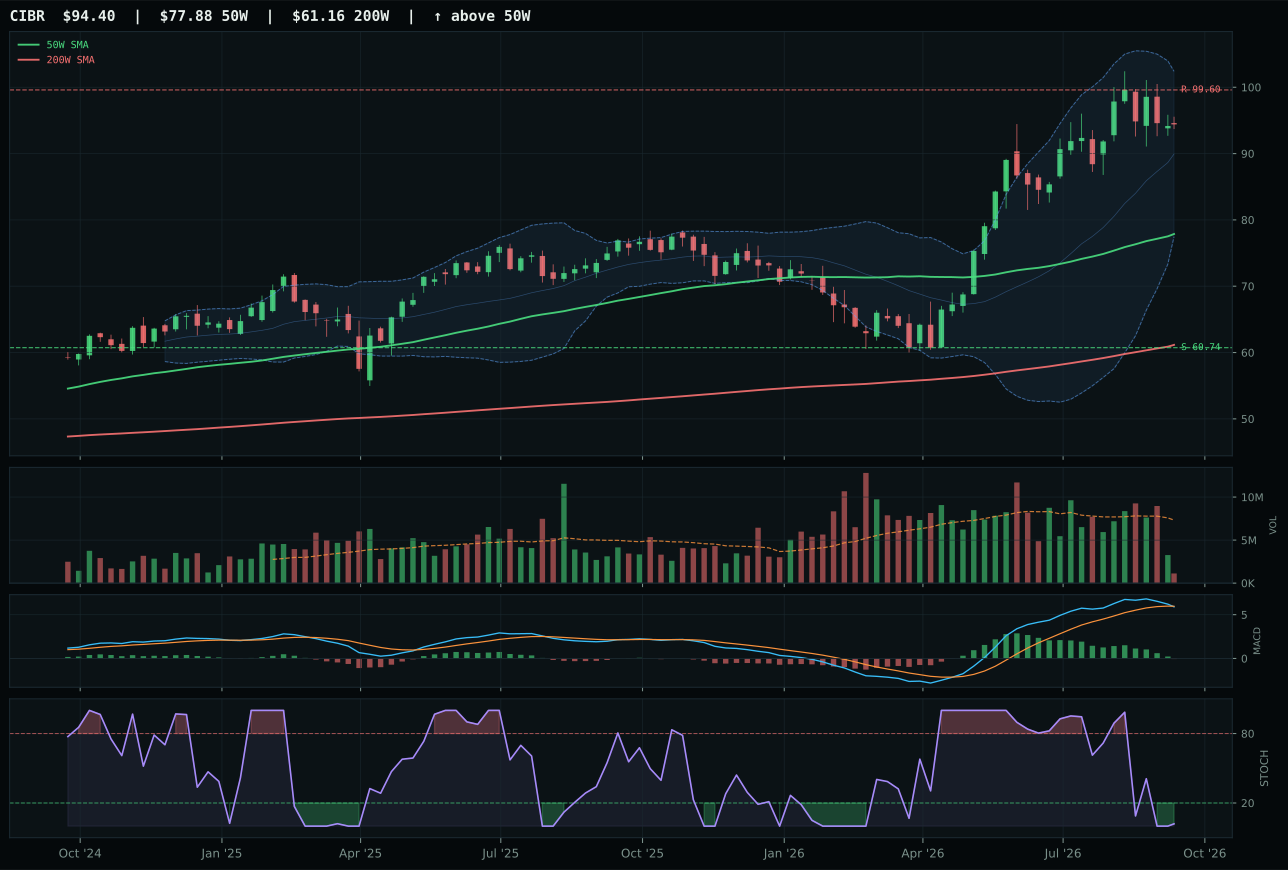
CIBR has a vertical extension profile with 9.3% 13-week relative strength versus SPY.
A failed hold above support would weaken the setup.
Actionable but governed by invalidation levels.
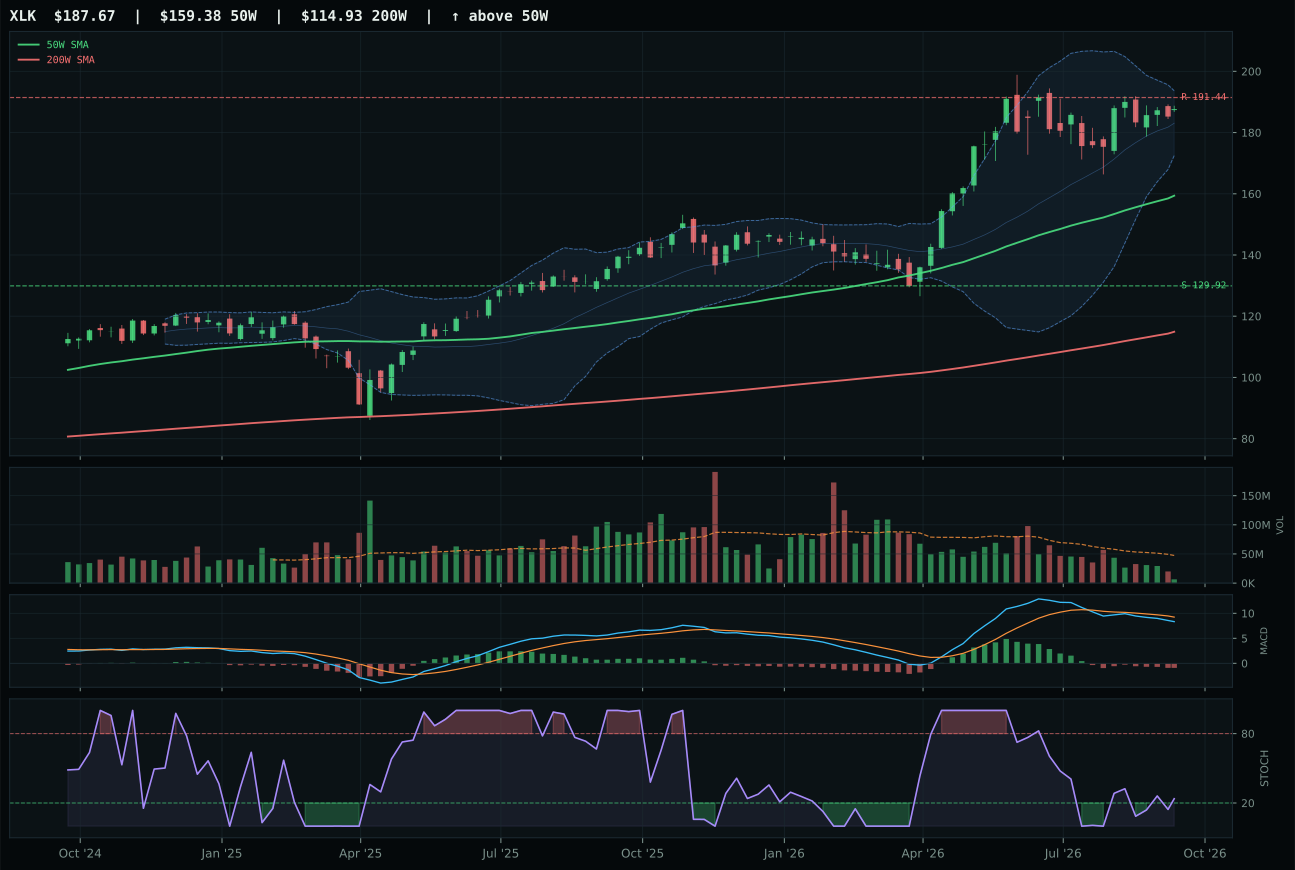
XLK has a vertical extension profile with -4.3% 13-week relative strength versus SPY.
A failed hold above support would weaken the setup.
Actionable but governed by invalidation levels.
IGV wins the Technology category because it sits just 5.6% above its 50-week moving average with a bullish MACD that is beginning to flatten, positioning it as a measured rebound rather than an exhausted chase. The 11.6% relative strength versus SPY combined with 2.3% outperformance versus its category peers signals genuine accumulation, not panic buying or capitulation. CIBR lost this matchup by extending 21.2% above its 50W—more than three times IGV's distance—while its MACD deteriorated into bearish/weakening territory and its stochastic RSI rolled into oversold compression, marking it as stretched and vulnerable. The structural cleanness gap matters: IGV's neutral structure at 70.1/100 versus CIBR's vertical extension at fractured levels tells the allocator that IGV is being accumulated by disciplined capital, not short-covering.
Technology earns 5% allocation as a tier-2 holding despite its final score of 24.6, which ranked below the two top-2 categories. The allocation percentage of 5% reflects the overlay structure: in a stagflation regime with active liquidity and credit stress, growth-oriented technology faces structural headwinds that suppress its competitive rank. Liquidity stress alone dragged the category macro fit down 10 points, and the broad market bear descriptor added another -8 points to category-level reasoning. IGV's technical evidence of 74.8/100 would normally merit consideration, but the 33.0/100 macro/narrative fit reveals the real constraint—stagflation systematically penalizes duration-sensitive software and cloud services when both liquidity and credit are tightening. The allocation holds this position because IGV's setup is cleaner and its momentum turn is real, but without a shift in either liquidity conditions or growth expectations, this remains a defensive residual rather than a core conviction.
Biotech & Genomics — IBB
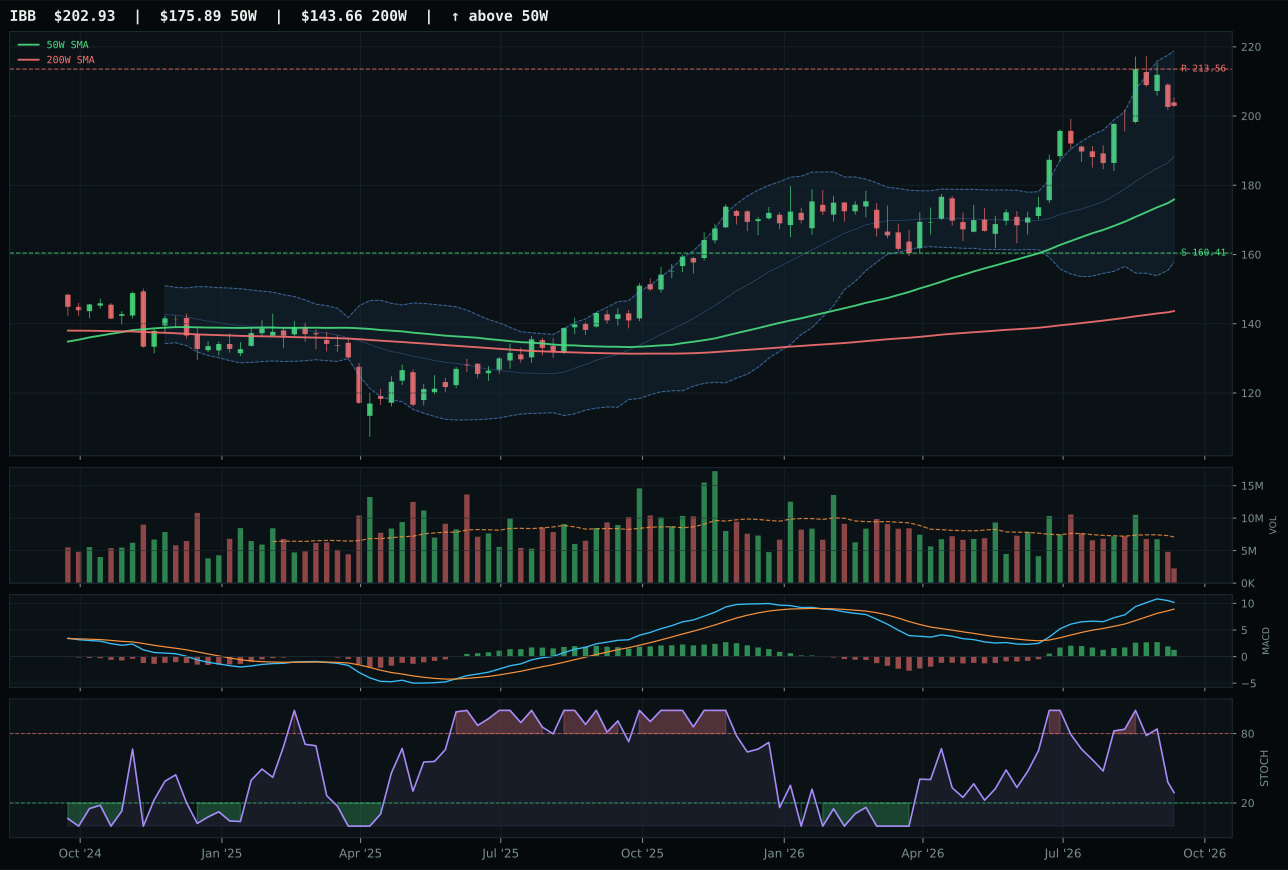
IBB has a vertical extension profile with 14.5% 13-week relative strength versus SPY.
A failed hold above support would weaken the setup.
Actionable but governed by invalidation levels.
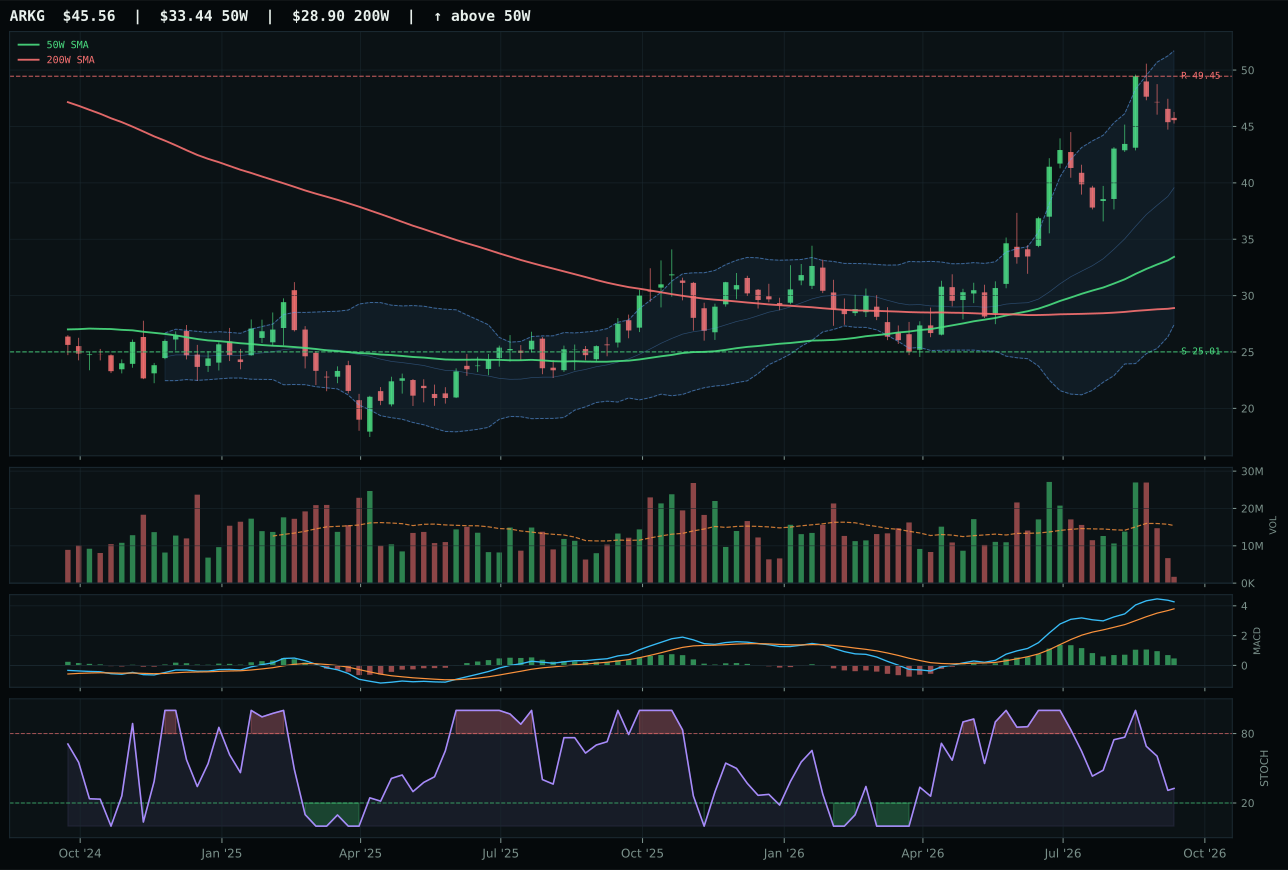
ARKG has a vertical extension profile with 21.3% 13-week relative strength versus SPY.
A failed hold above support would weaken the setup.
Actionable but governed by invalidation levels.
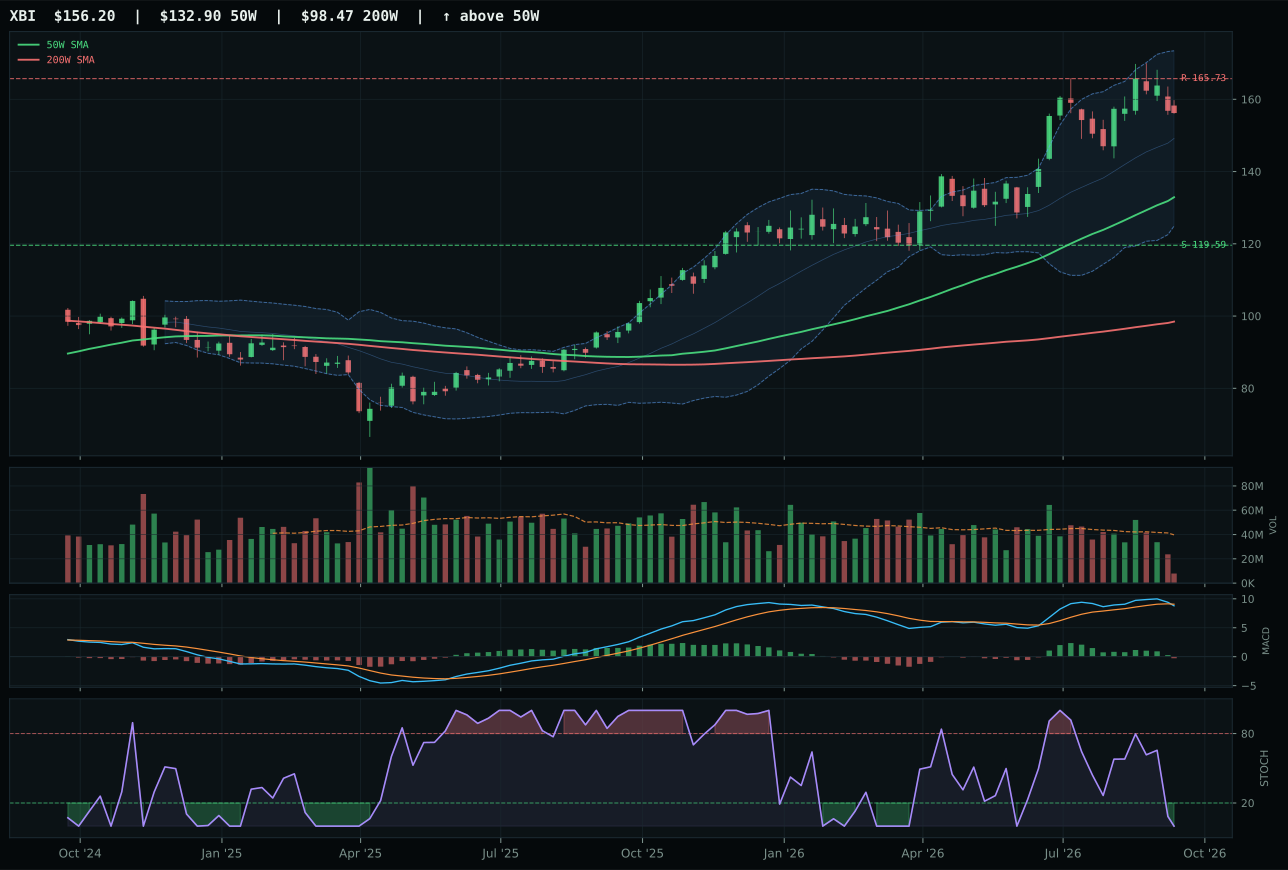
XBI has a vertical extension profile with 8.7% 13-week relative strength versus SPY.
A failed hold above support would weaken the setup.
Actionable but governed by invalidation levels.
IBB wins Biotech & Genomics but the category receives 0% allocation because the final score of 17.6 ranks it 9th or 10th among all ten categories. IBB scores above ARKG because its timing of 48.0/100 edges ARKG's identical 48.0, and more critically because IBB's extension of 15.4% above the 50W is less extreme than ARKG's 36.3% extension—a meaningful structural difference in risk asymmetry. IBB's structure of 69.3/100 reflects better cleanliness than ARKG's 65.9, and although both show bullish-but-flattening MACD with falling stochastic RSI, IBB's perfect trend score (100/100) on its price position above both the 50W and 200W demonstrates it has not yet been broken. ARKG's superior momentum confirmation (100/100 vs 82.9/100) and 13-week return of 23.6% cannot overcome the timing and entry-risk penalties from being stretched too far, too fast.
Biotech & Genomics receives 0% allocation because its final category score of 17.6 ranks it among the two lowest categories this week, with zero portfolio weight justified by adverse macro conditions. The category macro fit is deeply negative at 10.0/100: stagflation hurts biotech (-10), liquidity stress is active (-9), credit stress is active (-8), risk-appetite-broken is active (-7), and broad market bear is active (-6), totaling -40 points of combined macro drag. Biotech is a quintessentially high-beta, low-yield, growth-dependent sector that suffers when liquidity tightens and credit spreads widen; in stagflation specifically, the combination of rising discount rates and falling growth expectations creates a double negative. IBB's technical evidence of 63.5/100 (supported by the perfect trend score and 14.5% SPY-relative return) cannot overcome the 32.0/100 macro/narrative fit when those are weighted 62/38. This category would require either a reversal in liquidity stress or a visible pivot in risk appetite before any allocation would be justified. The current setup is essentially a technical confirmation without regime support—textbook unallocated territory.
AI — AIQ
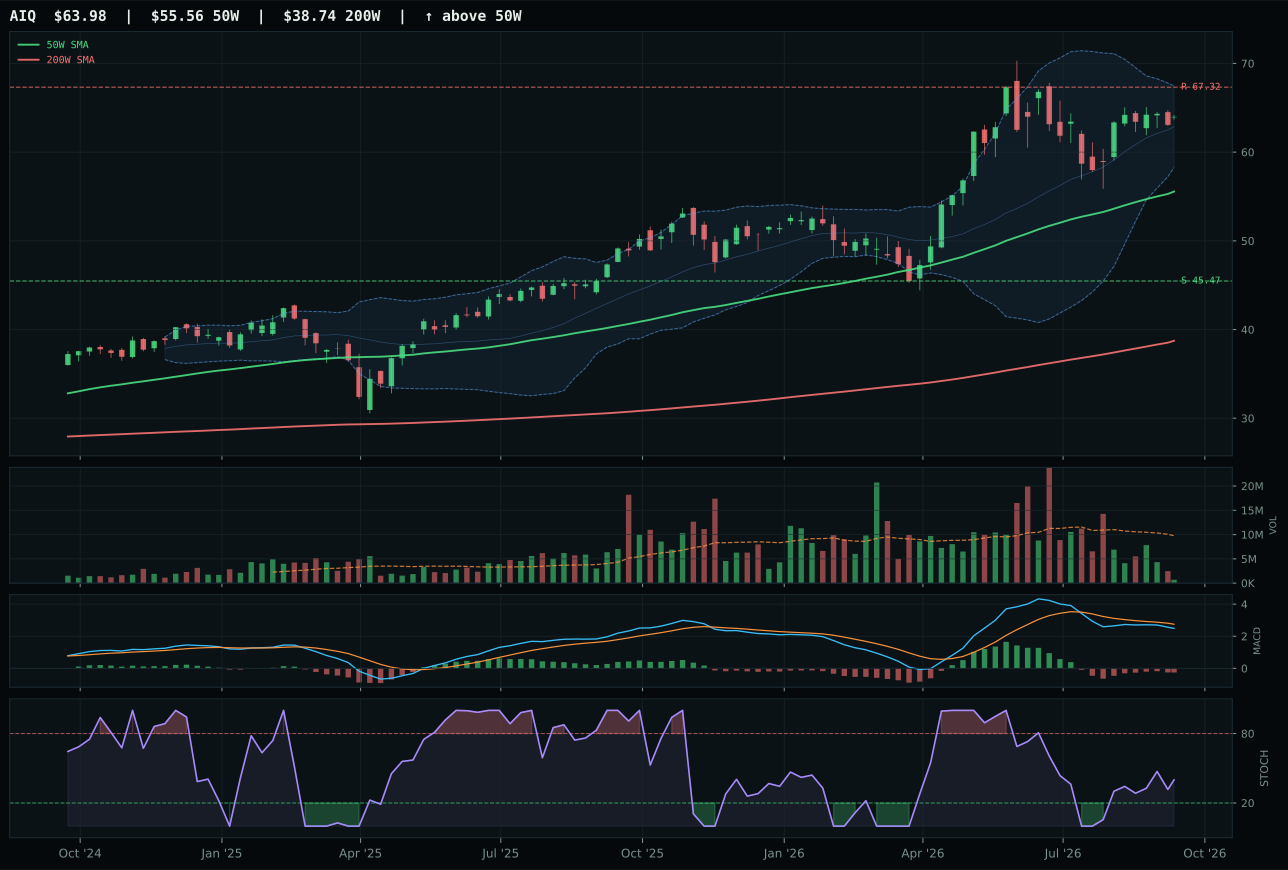
AIQ has a vertical extension profile with -6.6% 13-week relative strength versus SPY.
A failed hold above support would weaken the setup.
Actionable but governed by invalidation levels.
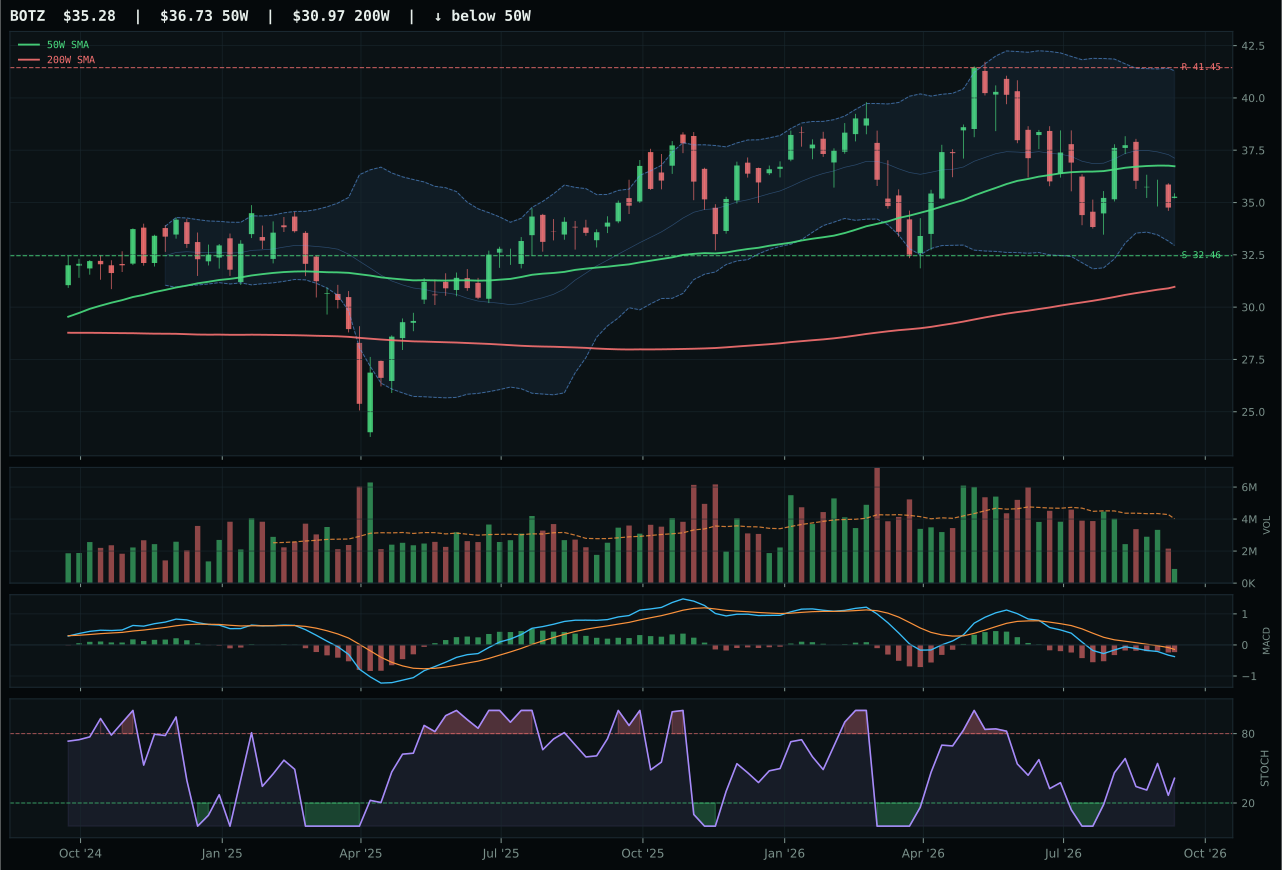
BOTZ has a neutral structure profile with -10.4% 13-week relative strength versus SPY.
A failed hold above support would weaken the setup.
Actionable but governed by invalidation levels.
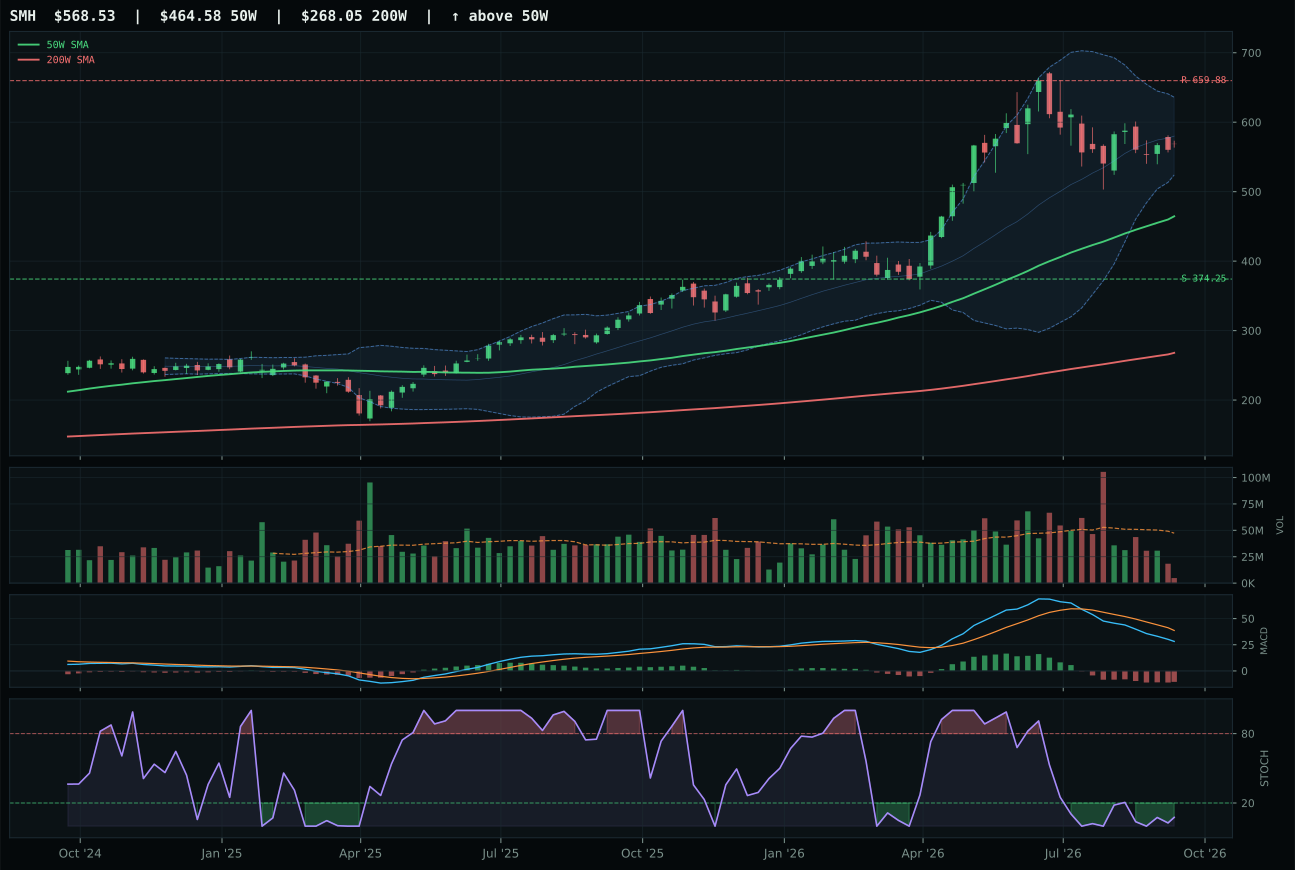
SMH has a vertical extension profile with -16.2% 13-week relative strength versus SPY.
A failed hold above support would weaken the setup.
Actionable but governed by invalidation levels.
AIQ wins the AI category despite a category-final score of just 13.9, which leaves this allocation at zero. AIQ scores above BOTZ because its structure at 71.0/100 edges BOTZ's 68.4, and its category-relative strength of 3.8% beats BOTZ's 0.0%, even though both are technically weak. The 13-week return of -4.2% with -6.6% SPY-relative underperformance confirms that AI software has rolled over into downtrend territory, but AIQ's MACD is bearish but improving—suggesting early reversal intention rather than continued deterioration. BOTZ fell further behind because its trend score of only 42/100 reflects a chart still caught between support at 32.46 and resistance at 41.45 with no directional clarity, while its -10.4% SPY-relative performance marks it as a sector laggard that has lost buyer support entirely.
AI receives 0% allocation this week because its final score of 13.9 ranks it 9th or 10th among the ten categories under evaluation. Stagflation Risk actively suppresses AI because it combines growth-sensitivity with liquidity-stress sensitivity, creating a double negative. Liquidity stress is weighted -12 points at the category level, credit stress adds -8, and the broad market bear descriptor contributes -8 more, totaling -28 basis points of macro drag before technical scores are even considered. The 44.0 technical reasoning score for AIQ (the winner) is hobbled by a 34.0/100 macro fit, demonstrating that even the best technical setup in this category cannot overcome the macro regime. AIQ's bullish-but-improving MACD and falling stochastic RSI suggest a potential reversal is forming, but without either a breakdown in stagflation signals or a clear capitulation low, AI remains unallocated. The category would need liquidity stress to reverse or growth expectations to stabilize materially before earning back any portfolio weight.