
2026-09-18
Informational purposes only. The content in this report, including allocations, analysis, and commentary, is provided solely for informational and educational purposes. It does not constitute financial advice, investment advice, trading advice, or any other type of advice. Past performance does not guarantee future results. Always conduct your own research and consult a qualified financial professional before making investment decisions.
This report is within the active 4-week tranche window. Subscribe to see the full allocation, trade instructions, macro checklists, crypto checklist, ETF charts with TA scoring, and category reasoning.
Subscribe — $39/monthWeekly Allocation
| Ticker | Category | Weight | Role |
|---|---|---|---|
| FBTC | 50% | Overlay | |
| MOO | Agriculture & Livestock | 10% | Top-2 (10%) |
| XLE | Traditional Energy | 10% | Top-2 (10%) |
| GDX | Precious Metals | 5% | Tier-2 (5%) |
| COPX | Industrial Metals | 5% | Tier-2 (5%) |
| URA | Nuclear Energy | 5% | Tier-2 (5%) |
| PAVE | Utilities & Infrastructure | 5% | Tier-2 (5%) |
| ROKT | Defense & Aerospace | 5% | Tier-2 (5%) |
| IGV | Technology | 5% | Tier-2 (5%) |
Trade Instructions — Monday Open
Sell the tranche from 2026-08-21 (completing its 4-week hold). Buy the new tranche. Instructions show net portfolio changes — same-asset positions cancel, weight changes show the delta.
Trade instructions are for subscribers only. Subscribe to access →
Current Portfolio After Trade
Combined holdings across all 4 active tranches. Each tranche is 25% of the portfolio.
| Ticker | % of Portfolio | Weight Bar |
|---|---|---|
| FBTC | 50.00% | |
| XLE | 10.00% | |
| MOO | 7.50% | |
| COPX | 5.00% | |
| GDX | 3.75% | |
| IGF | 3.75% | |
| URA | 3.75% | |
| IGV | 3.75% | |
| ARKG | 2.50% | |
| ROKT | 2.50% | |
| VEGI | 2.50% | |
| URNM | 1.25% | |
| GLD | 1.25% | |
| ITA | 1.25% | |
| PAVE | 1.25% |
Macro Regime — Stagflation Risk
Macro Evidence Charts
Market-implied signals behind the macro regime scores. Each ratio compares two assets; the direction and slope of the ratio is what the macro engine reads.
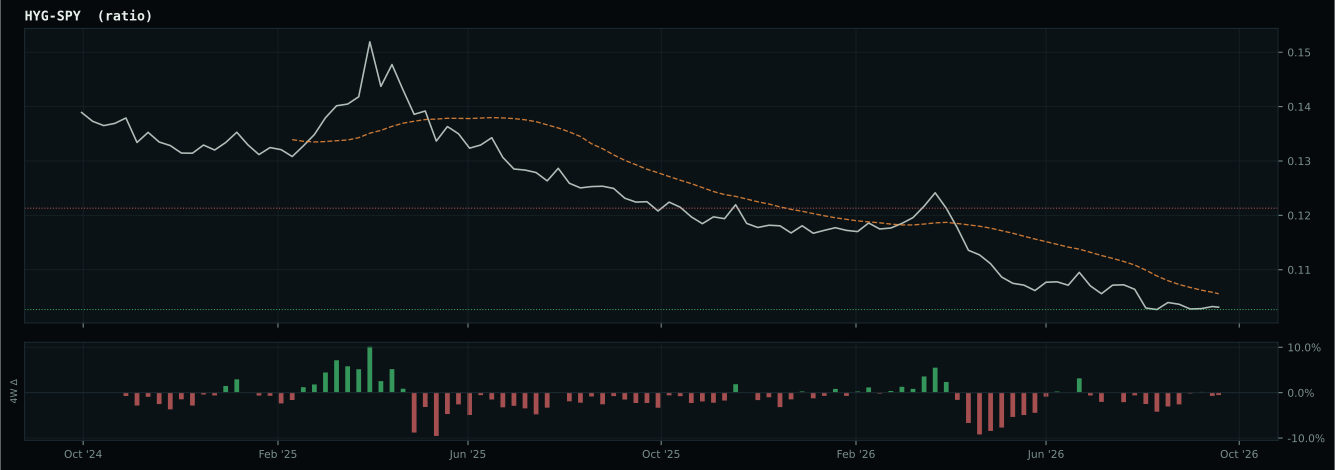
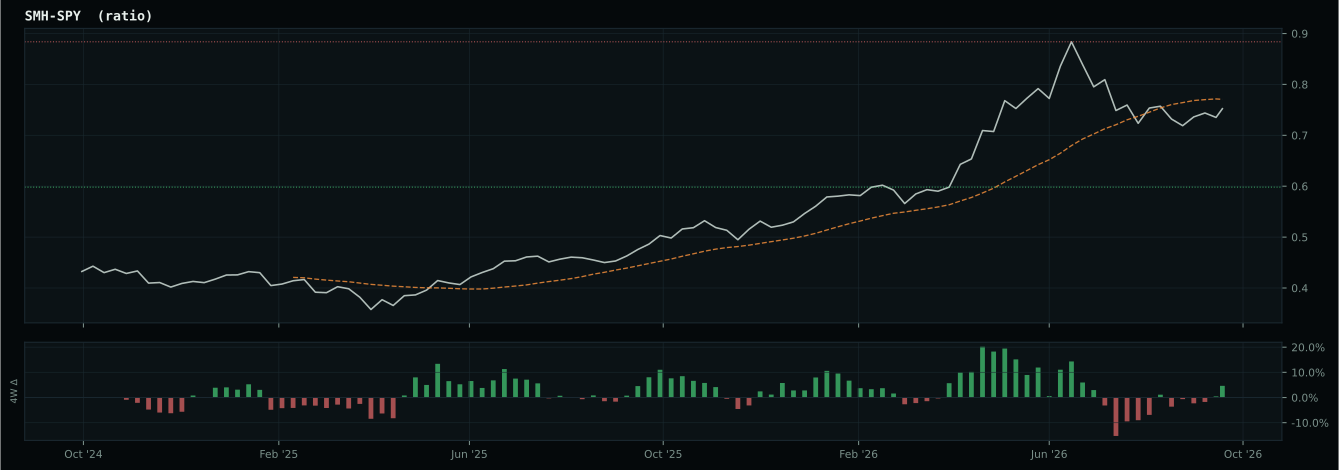
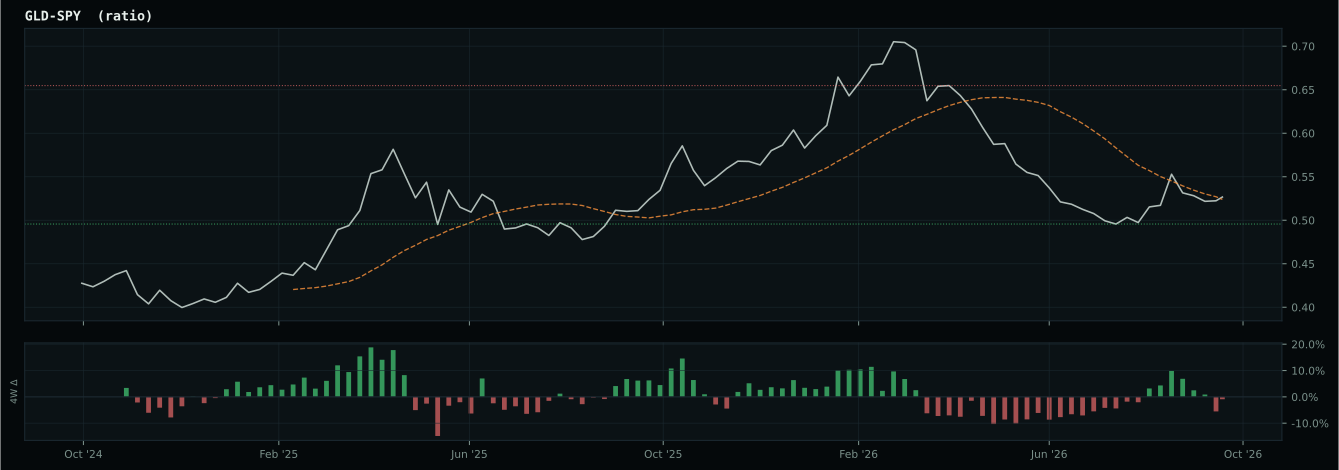
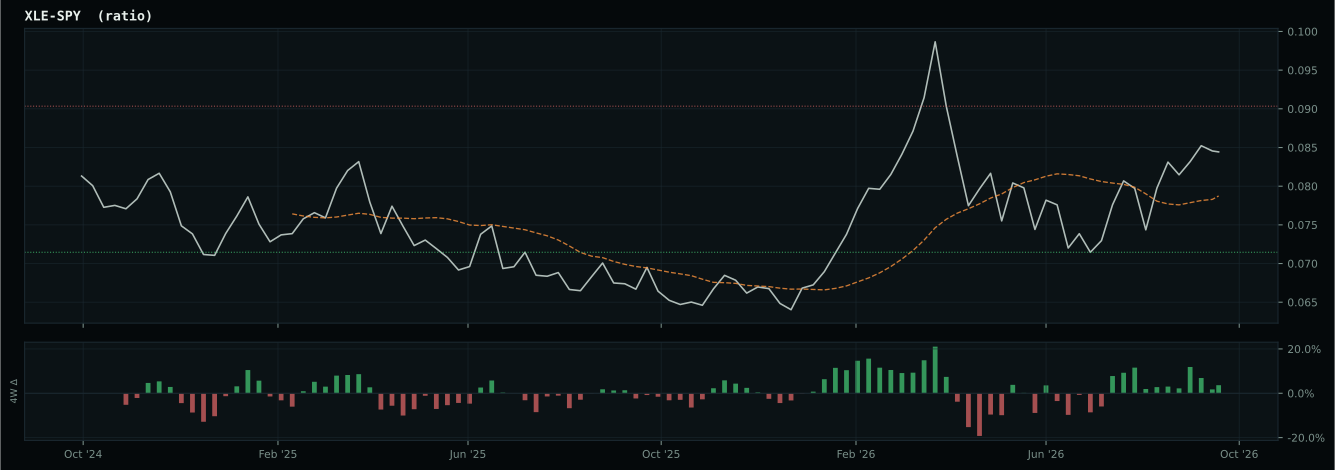
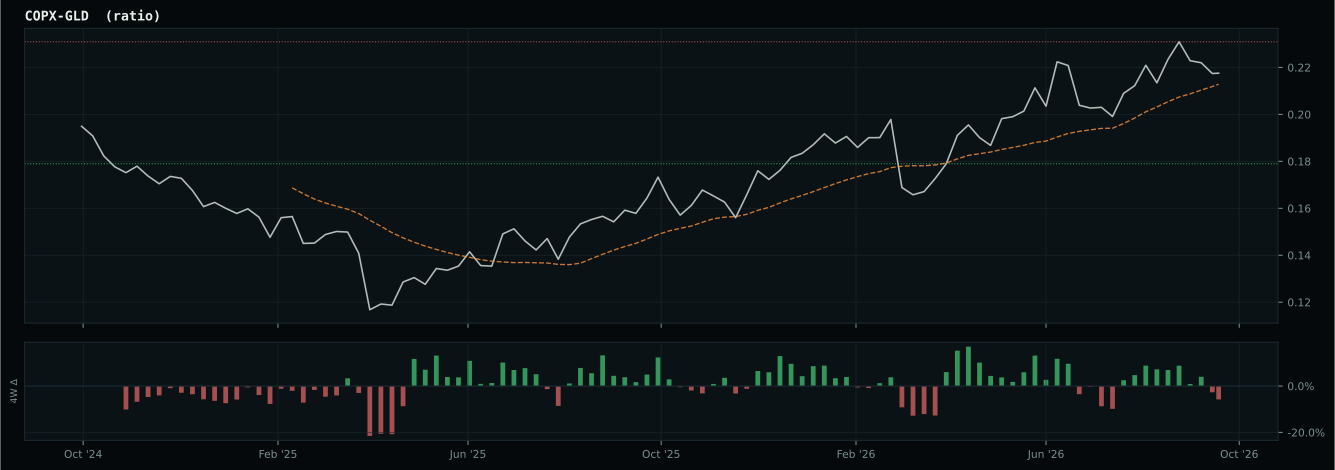
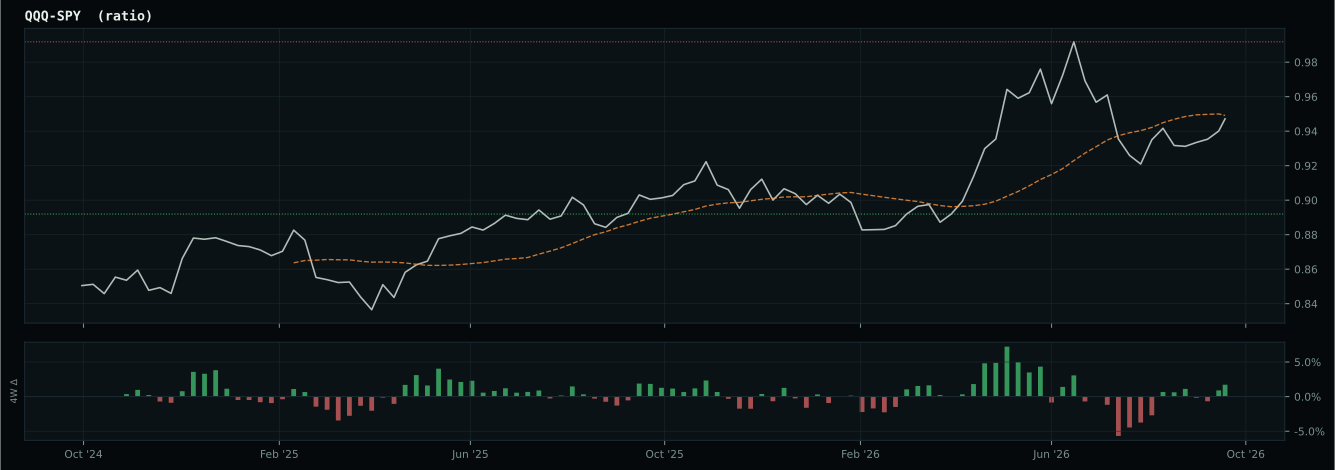
Crypto Regime — ValueBTC
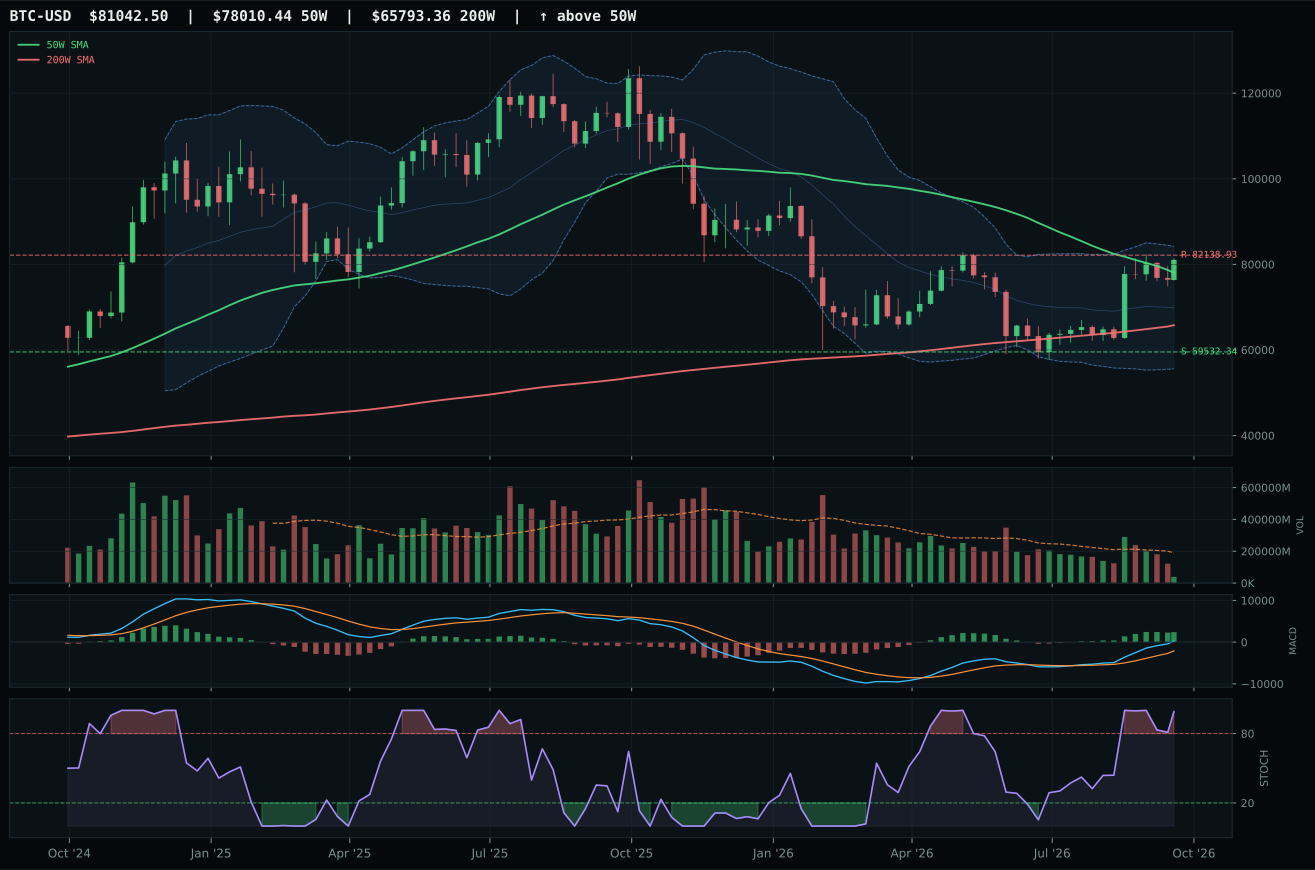
ValueBTC confirmed (timer expiry): 3rd bottom (12-week timer) complete (13 weeks since 2026-06-22 bottom at $59,532). Unconditional entry.
TrendBTC not confirmed
one or more available conditions failed
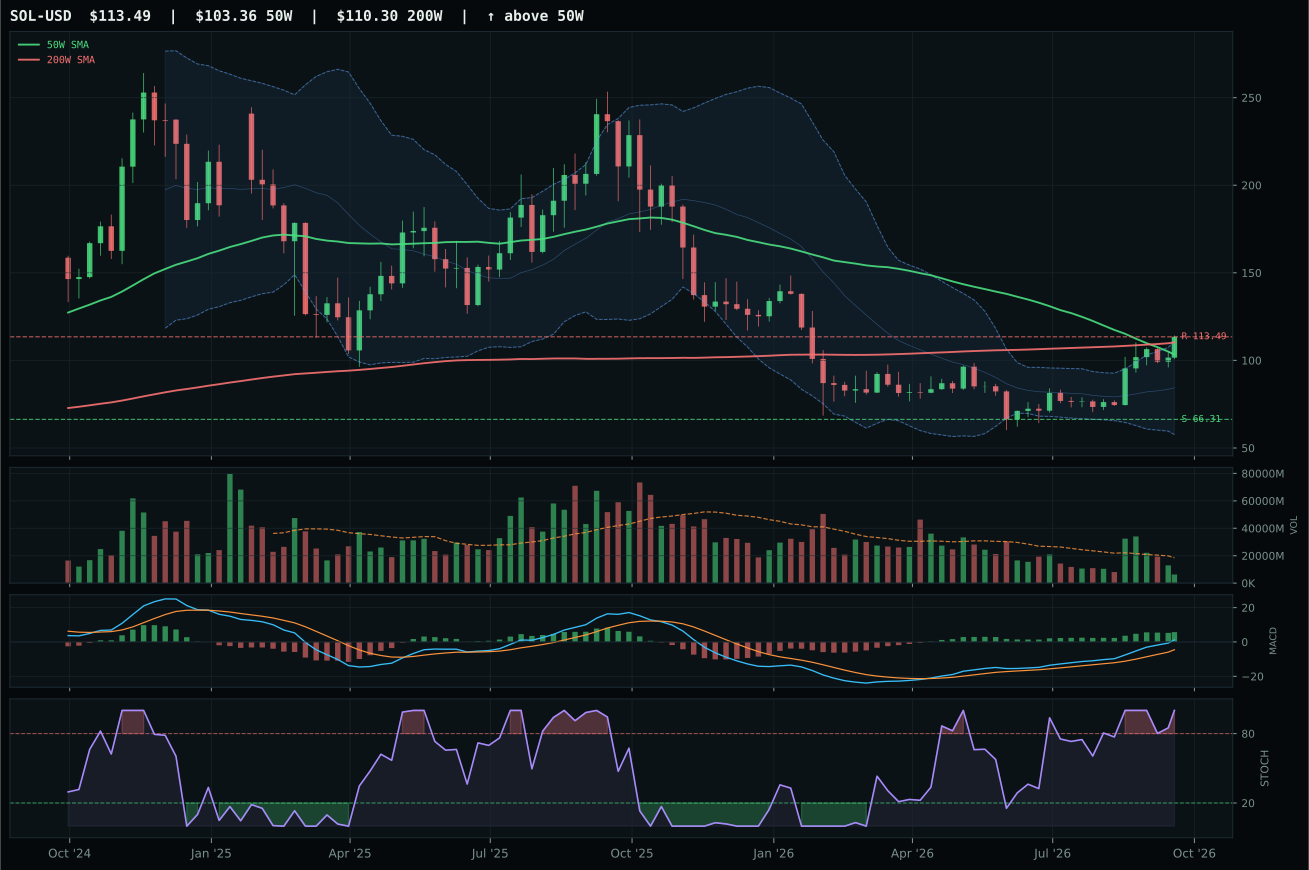
Shifting to Solana expression (FSOL): Two conditions stand between the current FBTC expression and an FSOL expression. ISM Manufacturing PMI (47.9) needs to recover above 50. This index publishes monthly, so the earliest opportunity is the next scheduled release. A reading below 50 signals contraction; a recovery above it would confirm that the manufacturing economy is no longer deteriorating — a prerequisite before committing to the higher-beta altcoin trade. The TOTAL3/BTC 50-week slope (-0.69% per week) needs to turn positive. This measures whether altcoins as a group are gaining ground against Bitcoin on a sustained basis — the signature of early-cycle rotation into higher-beta assets. A positive slope means altcoins have been outperforming BTC consistently enough to shift the moving average upward.
Graduating to TrendBTC: The ValueBTC position matures into a full TrendBTC position when Bitcoin closes above the 50-week SMA ($78,012) while that SMA is flat or rising. BTC is currently -3.8% below the 50W SMA, and the SMA has been declining as the prior cycle's peak prices rotate out of the window. TrendBTC would signal that the new bull trend is structurally confirmed, at which point the full AltSeason conditions become evaluable and Solana exposure becomes available through the normal channel.
Exiting back to NoCrypto: Two consecutive weekly closes below the 200-week SMA ($65,794) and the prior range support level exit the ValueBTC position. Bitcoin is currently 23.3% above the 200W SMA. The two-week requirement prevents a single volatile candle from prematurely ending the position during normal consolidation above support.
Category Rankings
| Rank | Category | Winner | Score | Alloc | 4W Ret | Peers (4W) |
|---|---|---|---|---|---|---|
| 1 | Agriculture & Livestock | MOO | 79.1 | 20% | — | VEGI — · PDBA — |
| 2 | Traditional Energy | XLE | 78.0 | 20% | — | XOP — · FCG — |
| 3 | Precious Metals | GDX | 73.3 | 10% | — | SLV — · GLD — |
| 4 | Industrial Metals | COPX | 44.8 | 10% | — | PICK — · REMX — |
| 5 | Nuclear Energy | URA | 40.5 | 10% | — | URNM — · NLR — |
| 6 | Utilities & Infrastructure | PAVE | 38.5 | 10% | — | IGF — · XLU — |
| 7 | Defense & Aerospace | ROKT | 37.0 | 10% | — | ITA — · XAR — |
| 8 | Technology | IGV | 36.0 | 10% | — | CIBR — · XLK — |
| 9 | AI | AIQ | 27.8 | 0% | — | SMH — · BOTZ — |
| 10 | Biotech & Genomics | IBB | 24.6 | 0% | — | ARKG — · XBI — |
Agriculture & Livestock — MOO
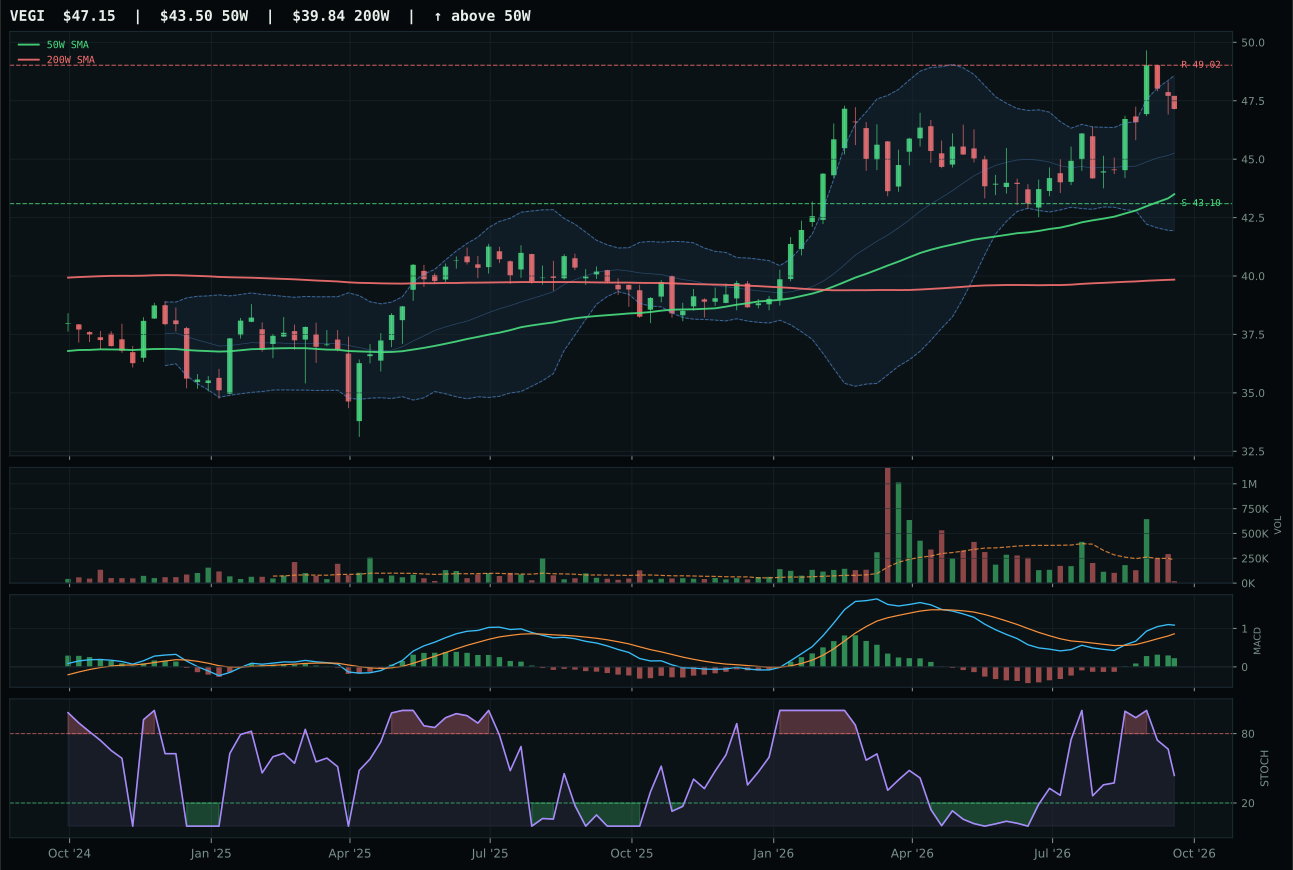
VEGI has a neutral structure profile with 3.4% 13-week relative strength versus SPY.
A failed hold above support would weaken the setup.
Actionable but governed by invalidation levels.
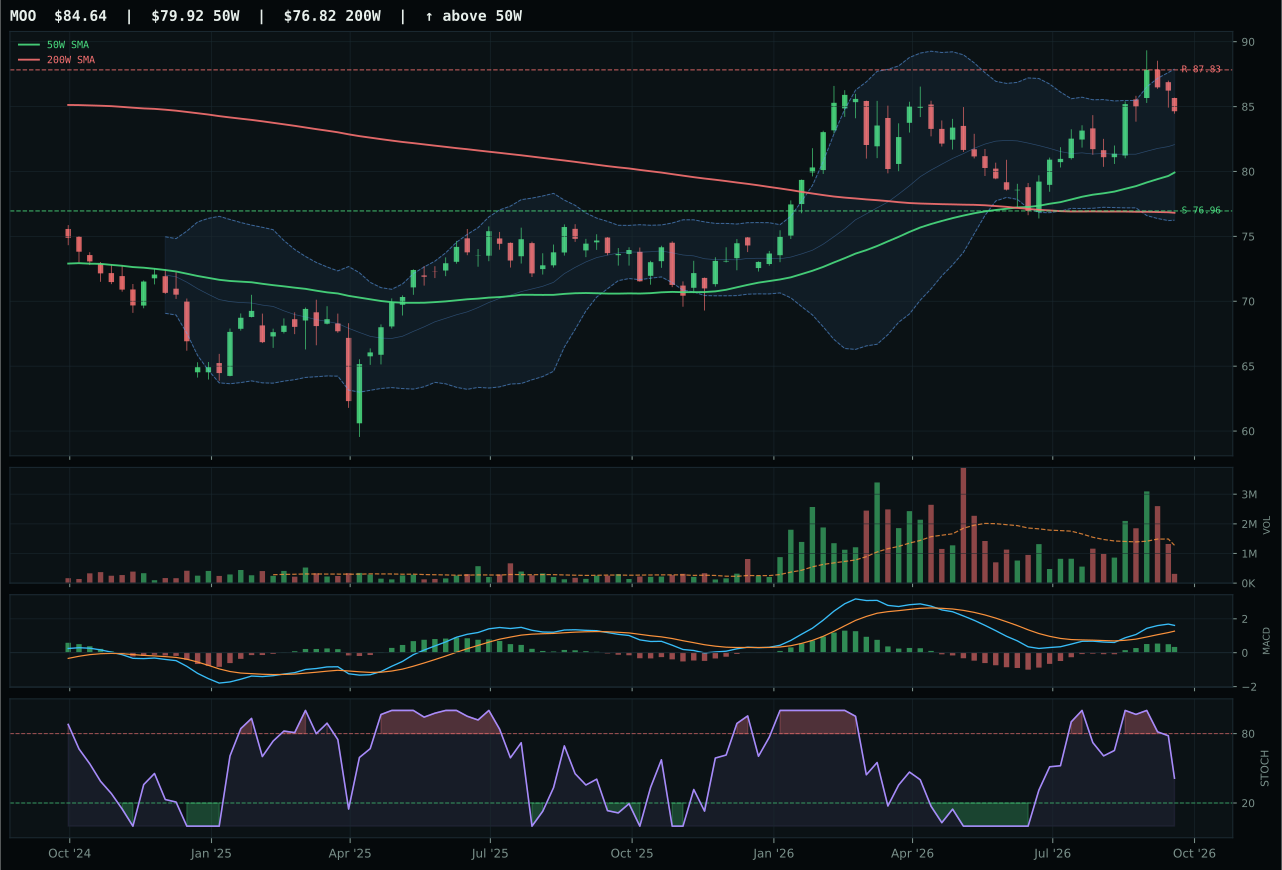
MOO has a neutral structure profile with 2.4% 13-week relative strength versus SPY.
A failed hold above support would weaken the setup.
Actionable but governed by invalidation levels.
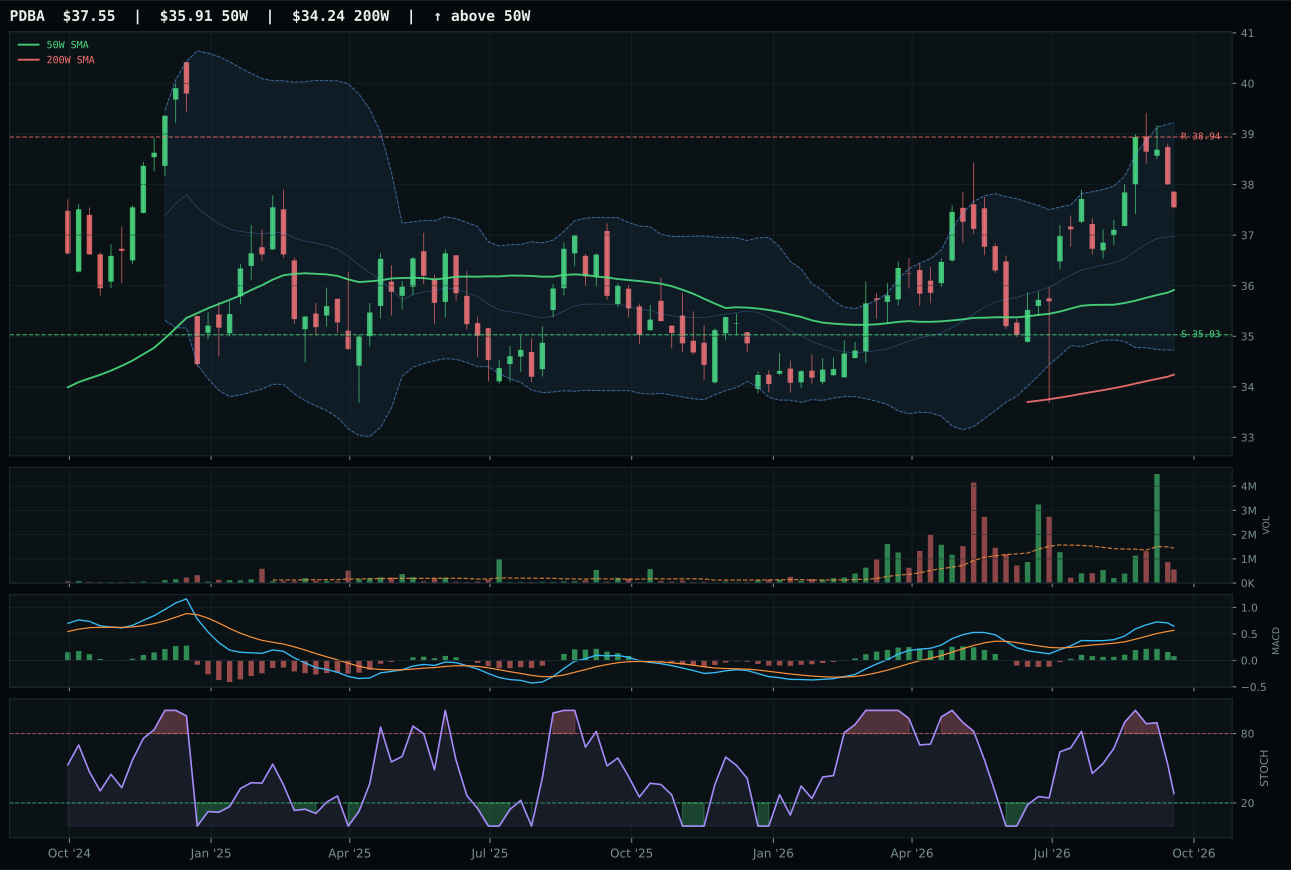
PDBA has a neutral structure profile with 0.6% 13-week relative strength versus SPY.
A failed hold above support would weaken the setup.
Actionable but governed by invalidation levels.
MOO claimed the category leadership despite VEGI posting a superior 78.4/100 in technical evidence because the allocator weights setup cleanliness and macro narrative fit together, and MOO's neutral structure preserved momentum in a more balanced fashion. Both trade with bullish, improving MACD and falling/neutral stochastic RSI, but MOO's cleanliness score of 50.0 versus VEGI's 70.6 proves less consequential than MOO's 2.4% RS versus SPY, which anchors it firmly to broad market sponsorship while VEGI's 3.4% RS risks isolation in a market reversal. The 13W returns are nearly identical (6.8% for MOO versus 7.8% for VEGI), but MOO's macro narrative fit of 67.0/100 is driven by active supply shortage (+8) and inflation pressure (+7), with a -3 growth slowdown penalty that MOO absorbs better than VEGI due to its agribusiness diversification. Risk/reward is identical at 51.5 and 52, and volume participation is thin across both, so the winner was decided by relative strength positioning within the sleeve: MOO is the more liquid expression with broader institutional sponsorship.
Agriculture & Livestock earned 10% as a top-2 overweight category, reflecting a category score of 79.1 that ranks second overall in the portfolio. The macro fit of 93.0/100 is extraordinary—stagflation (+10), supply shortage (+13), inflation pressure (+10), real asset sponsorship (+8), and commodity breadth positive (+5) all align to make real agricultural assets the beneficiary of current regime volatility. MOO's trend score of 93.5 confirms price leadership, and the combination of 6.8% 13W return with only 5.9% distance from the 50W suggests measured accumulation in an orderly uptrend rather than speculative extension. The tension is manageable: volume at 0.24x the 20W average is thin, but that is endemic to this category and does not invalidate the macro case. Agriculture at 10% allocation reflects the portfolio's conviction that food inflation and supply constraints in stagflation create a genuine long-term tailwind; it is the only category besides energy to earn true overweight treatment, signaling the allocator's defense-through-real-assets philosophy.
Traditional Energy — XLE
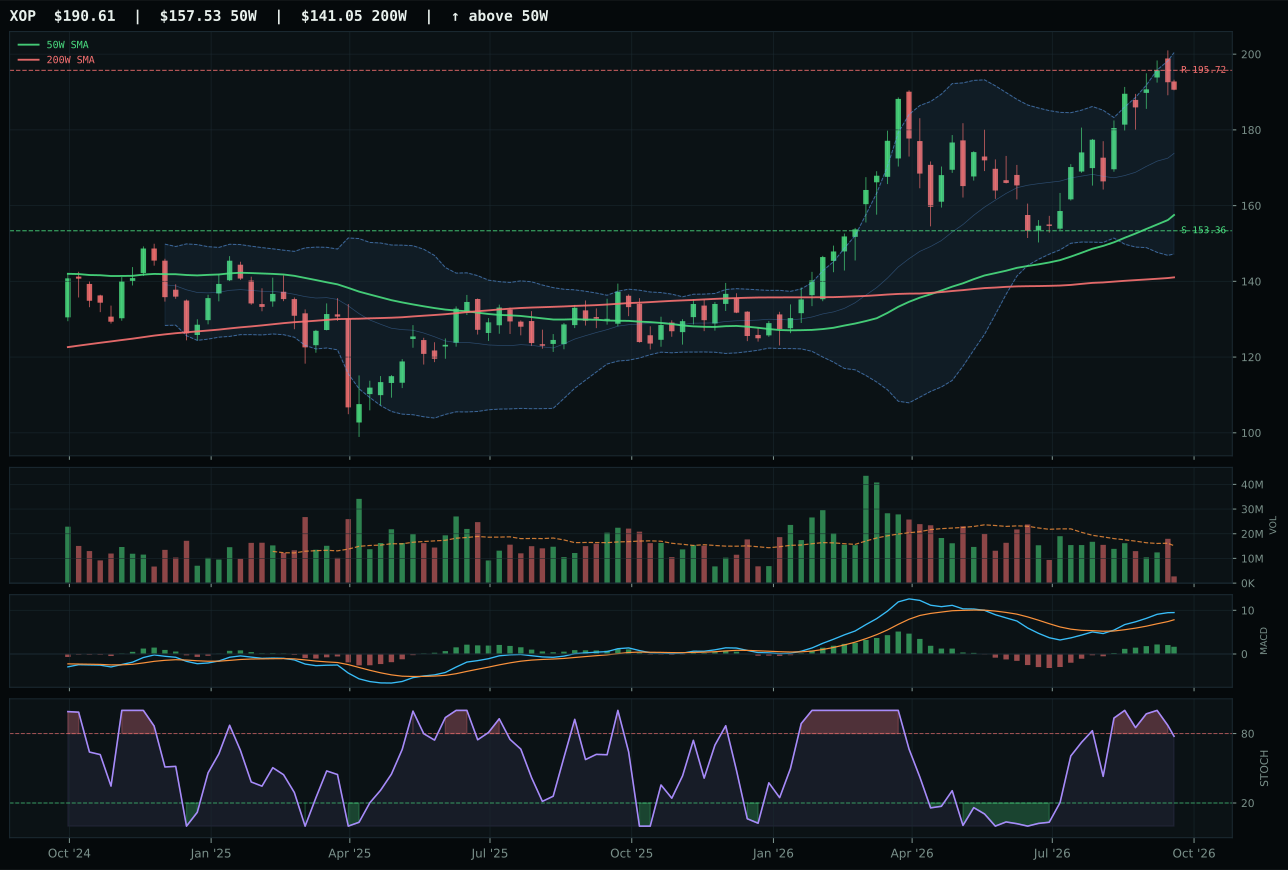
XOP has a vertical extension profile with 18.7% 13-week relative strength versus SPY.
A failed hold above support would weaken the setup.
Actionable but governed by invalidation levels.
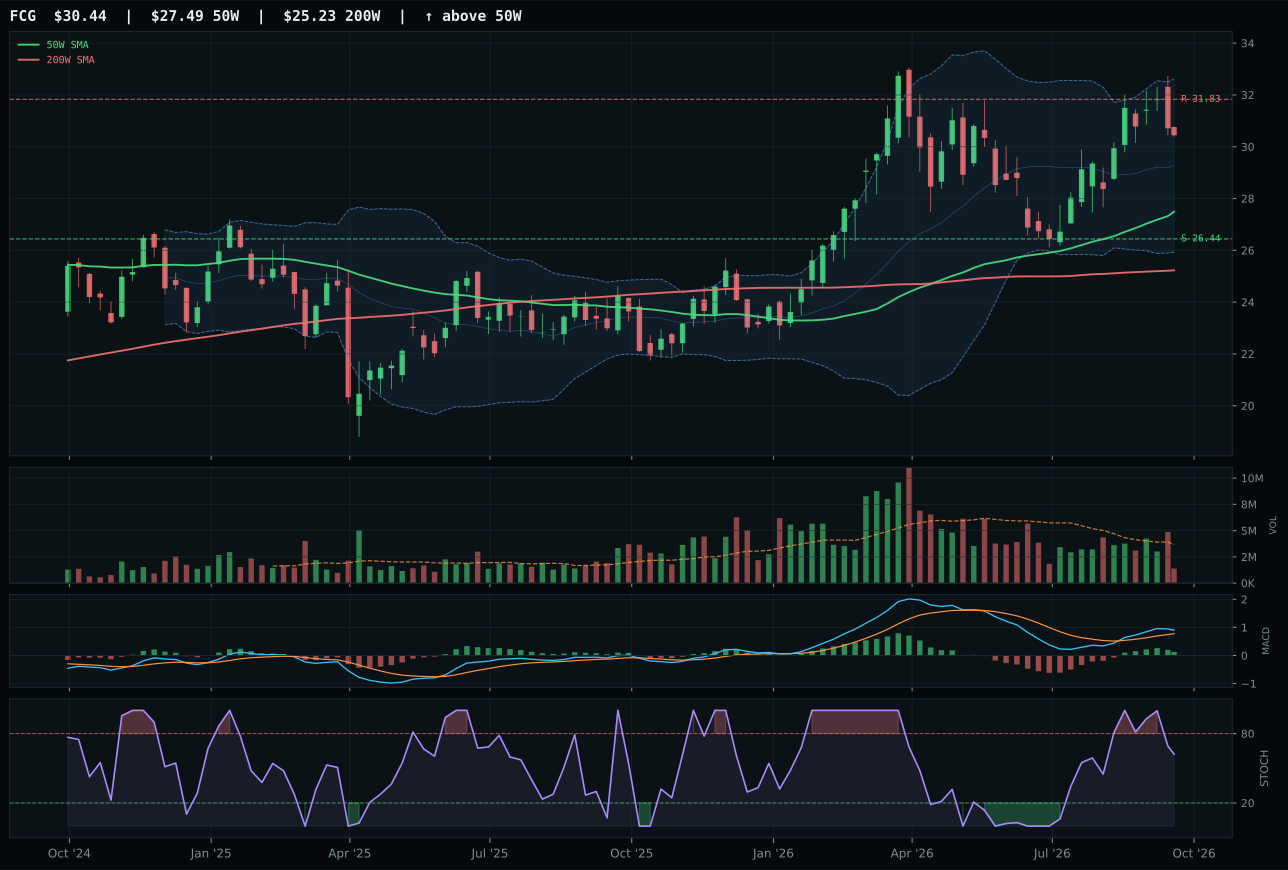
FCG has a neutral structure profile with 9.4% 13-week relative strength versus SPY.
A failed hold above support would weaken the setup.
Actionable but governed by invalidation levels.
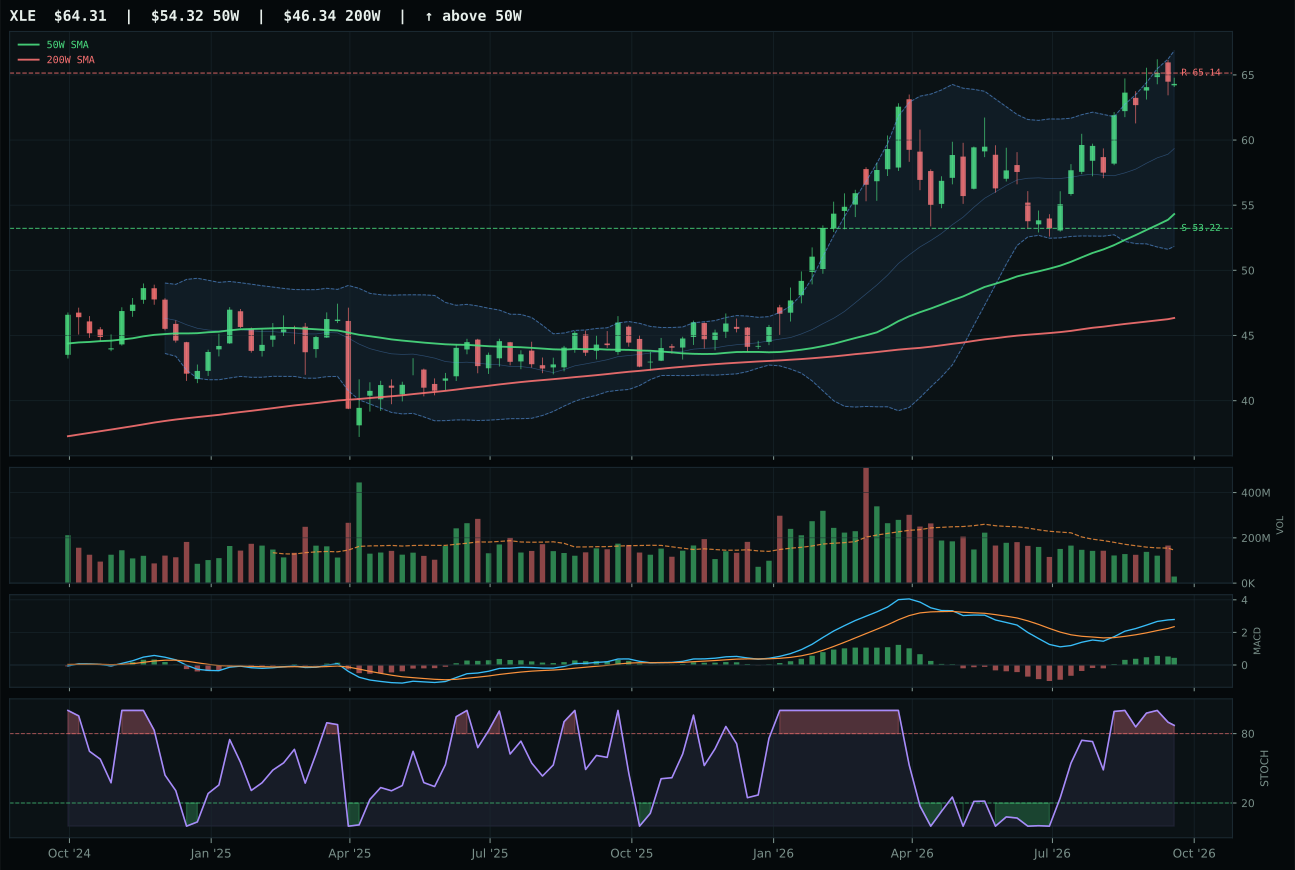
XLE has a vertical extension profile with 15.0% 13-week relative strength versus SPY.
A failed hold above support would weaken the setup.
Actionable but governed by invalidation levels.
XLE captured the top-2 overweight slot despite XOP's superior momentum and technical evidence because XLE's macro fit of 81.0/100 combined with defensive integrated energy cash-flow positioning proved more relevant than XOP's speculative exploration upside. XLE is extended at 18.4% from the 50W, which normally disqualifies a setup, but in a stagflation regime with energy scarcity active, an extended leader with improving MACD and overbought-rolling-over stochastic is precisely the pattern that persistent capital accumulation creates: late buyers are not capitulating; they are accepting higher entry costs because supply certainty is worth paying for. XOP's 18.7% RS versus SPY and 23.2% 13W return are superior raw metrics, but they also signal volatility and speculative froth—exploration beta thrives in growth, not stagflation. The category reasoner selected XLE as representative because energy scarcity (+14), inflation pressure (+10), and supply shortage (+7) all support integrated major oil company cash generation, not the leverage of exploration wildcats.
Traditional Energy earned 10% as a co-equal top-2 overweight alongside Agriculture, reflecting a category score of 78.0 that trails Agriculture's 79.1 by just 1.1 points. The macro fit of 88.0/100 is exceptional—stagflation helps energy (+10), energy scarcity is active (+16), inflation pressure is active (+10), supply shortage is active (+9)—making this the second-strongest macro fit in the entire portfolio after agriculture. XLE's trend score of 100.0 and momentum confirmation of 96.6 confirm that price leadership is genuine, even if timing is compromised by the 18.4% extension. The key allocation insight is that energy at 10% is not a speculative bet; it is structural defense in stagflation, where oil prices support both inflation hedging and portfolio returns as central banks struggle. The tension is entry risk: XLE is extended, stochastic is rolling over, and downside risk to support is 20.8%, meaning new buyers accepting current prices could face a 15-20% correction if demand falters or Saudi production surges. Energy earned top-2 because macro regime alignment is more valuable than perfect timing in a transitional macro environment; the position will rotate toward XOP or trading tactics only if stagflation intensity changes.
Precious Metals — GDX
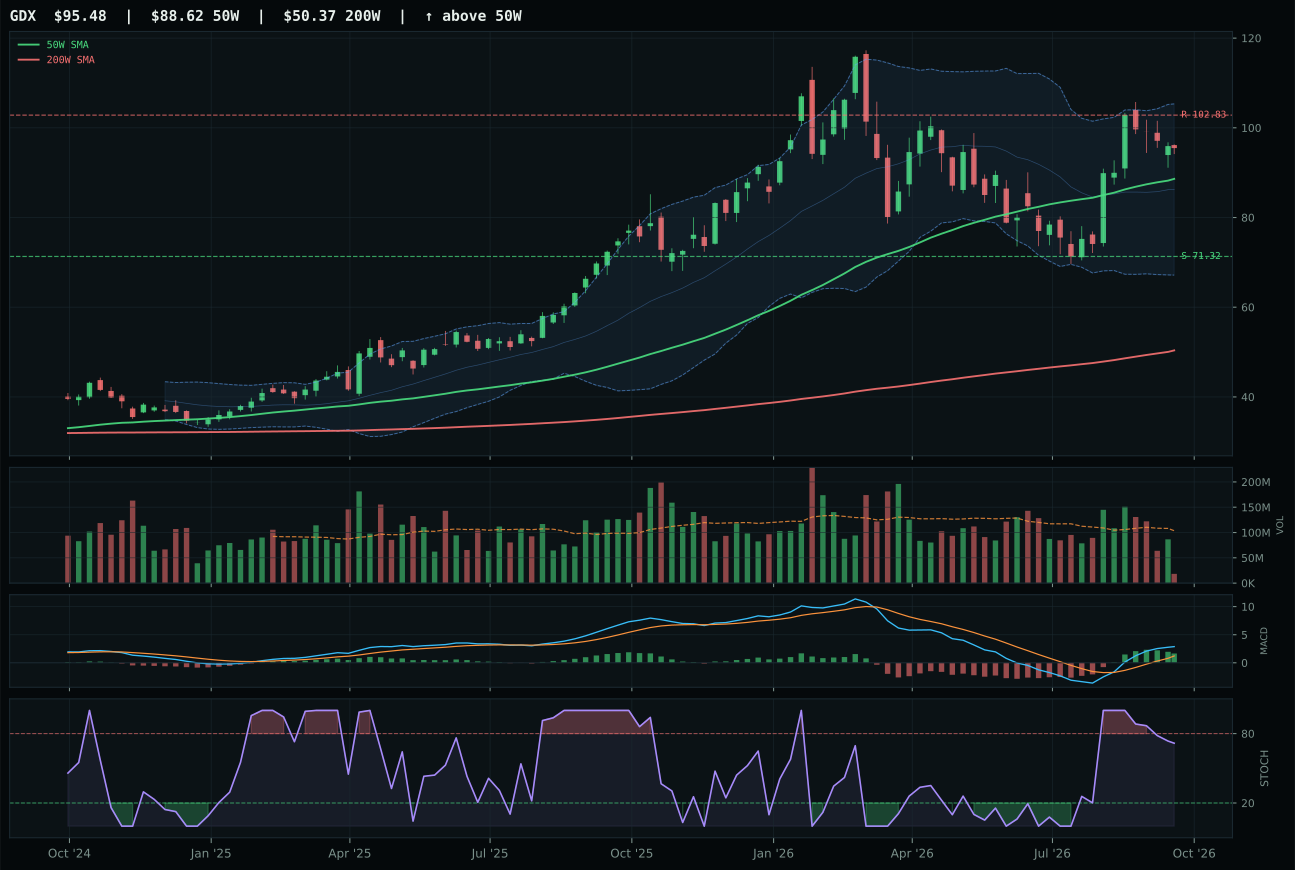
GDX has a neutral structure profile with 19.5% 13-week relative strength versus SPY.
A failed hold above support would weaken the setup.
Actionable but governed by invalidation levels.
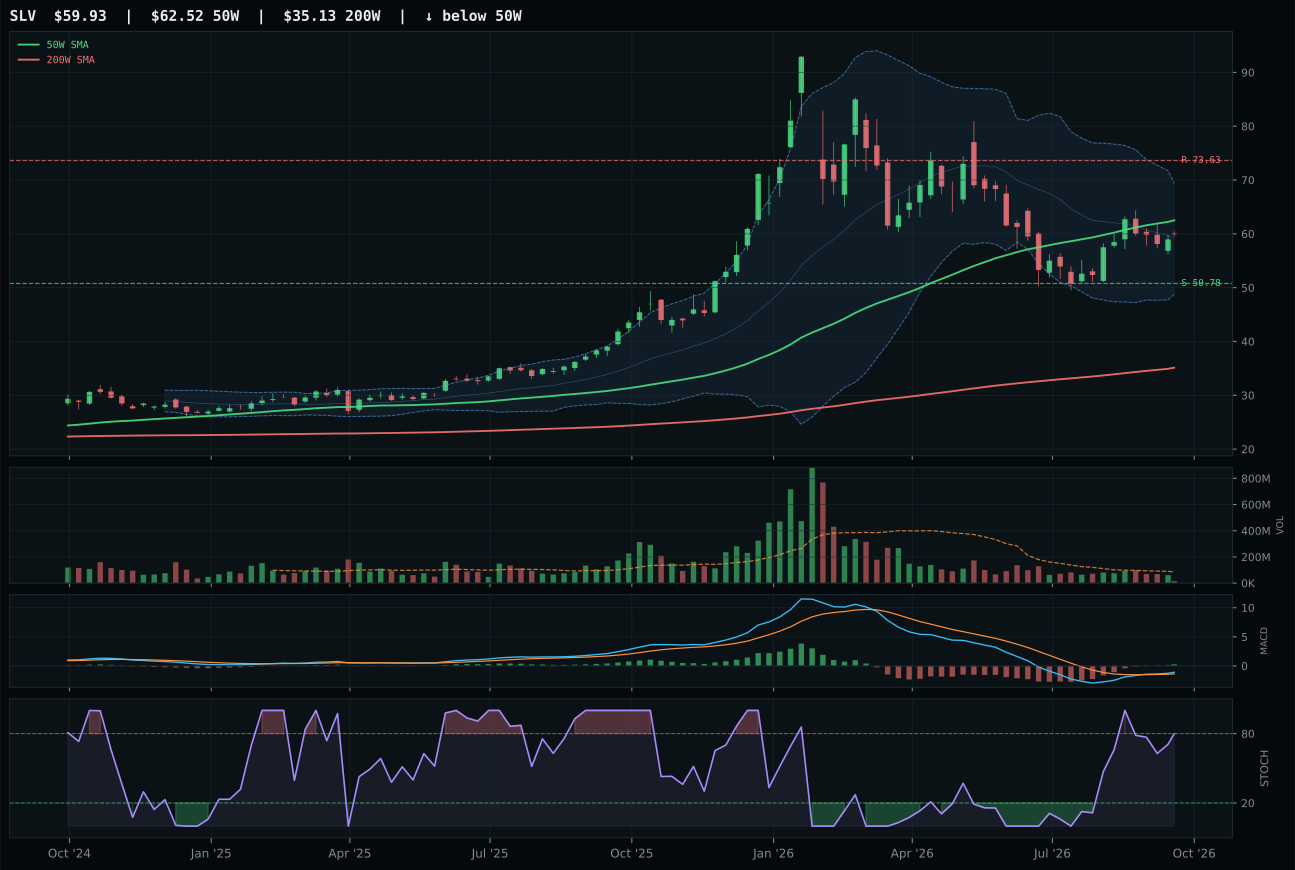
SLV has a neutral structure profile with 8.0% 13-week relative strength versus SPY.
A failed hold above support would weaken the setup.
Actionable but governed by invalidation levels.
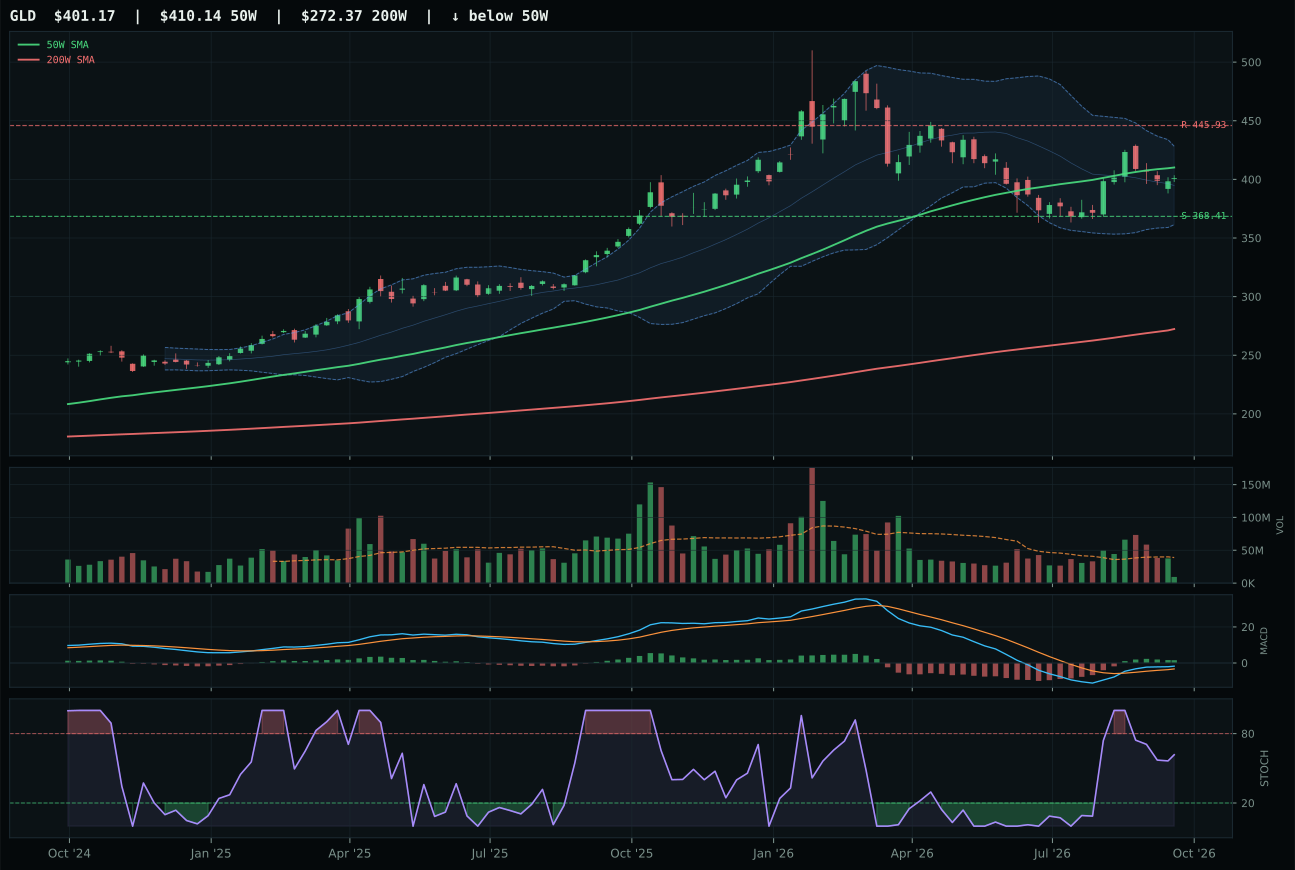
GLD has a compression near 50W profile with 2.9% 13-week relative strength versus SPY.
A failed hold above support would weaken the setup.
Actionable but governed by invalidation levels.
GDX seized the category by delivering a rare perfect momentum confirmation score of 100.0/100, driven by a 24.0% 13W return and 19.5% RS versus SPY that no other precious metal expression can match. Price is appropriately 7.7% from the 50W in a neutral structure, but the chart sits in the middle Fibonacci zone at 0.382, which is the decision point where gold miners transition from mean-reversion plays to trend followers—GDX is anchored in that sweet spot. SLV's technical evidence of 85.5/100 appears superior, and it does carry improving MACD and better macro fit at 65.0 versus GDX's 51.0, but the category-relative strength differential is the killer: GDX shows 11.5% category RS while SLV is at 0.0%, revealing that capital is flowing into leveraged mining beta, not silver's hybrid monetary and industrial profile. MACD confirmation is the tiebreaker: GDX's bullish-but-flattening pattern is appropriate for a continuation trade, while SLV's bullish-and-improving setup suggests exhaustion accumulation rather than leadership.
Precious Metals earned 5% in tier-3, a respectable allocation that reflects the category's 73.3 final score and 74.0/100 macro fit in a stagflation regime. Monetary hedge bid is active (+14) and stagflation helps this exposure (+10), creating a tailwind that other defensive categories lack. GDX's 100.0 momentum score and 83.5 in volume-price confirmation are genuine strengths, but the category's rank of 5 among 10 reflects a hard truth: gold and silver are stagflation insurance, not growth, and the portfolio has already committed 10% each to the genuine growth real assets (agriculture and energy). At tier-3, GDX sits where it belongs—a tactical hedge that benefits from credit stress and inflation concerns without cannibalizing capital from the more structurally bullish agricultural and energy exposures. For metals to earn promotion, either credit stress would need to catastrophically activate (widening credit spreads, financial institution stress) or agricultural weakness would need to appear, allowing the portfolio to rebalance toward monetary assets; neither scenario is currently signaling.
Industrial Metals — COPX
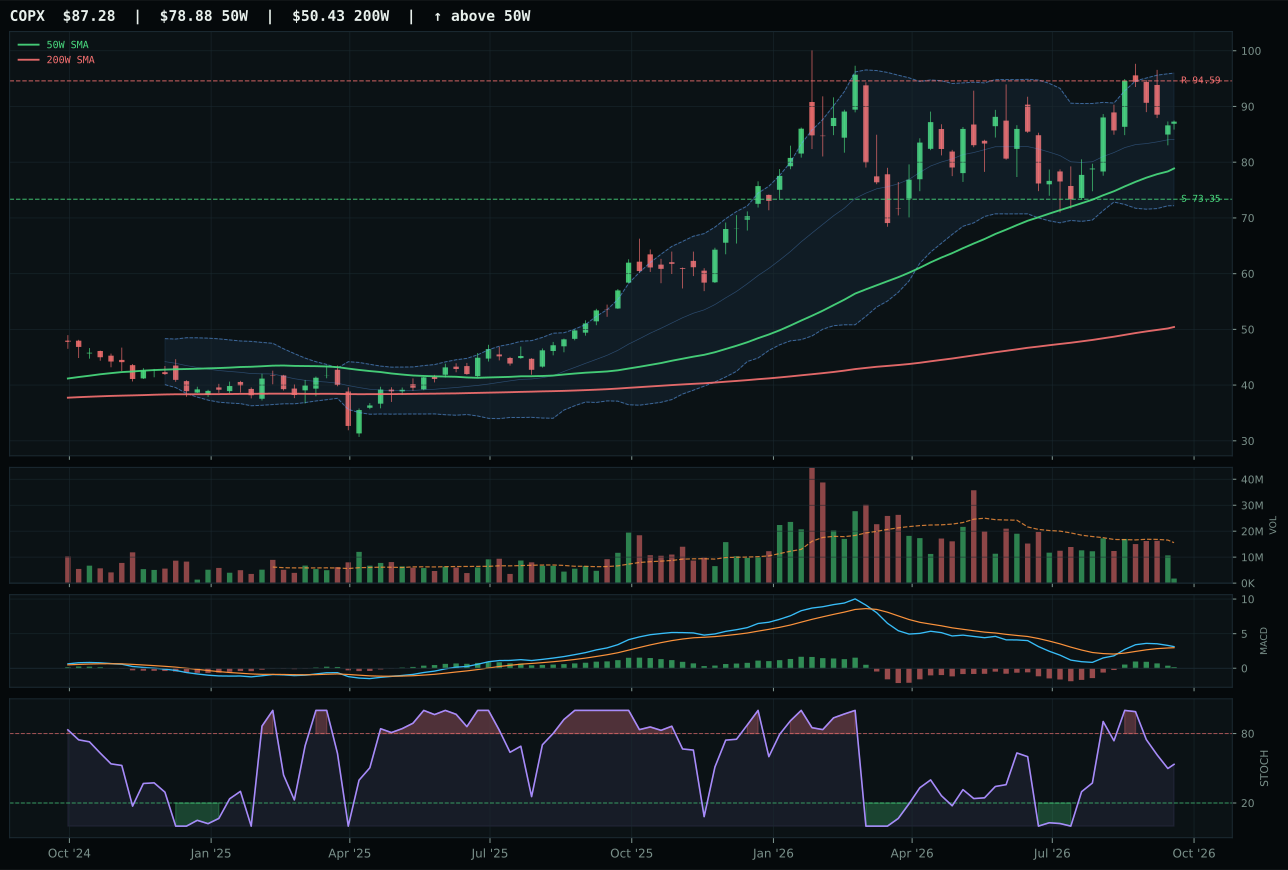
COPX has a neutral structure profile with 10.1% 13-week relative strength versus SPY.
A failed hold above support would weaken the setup.
Actionable but governed by invalidation levels.
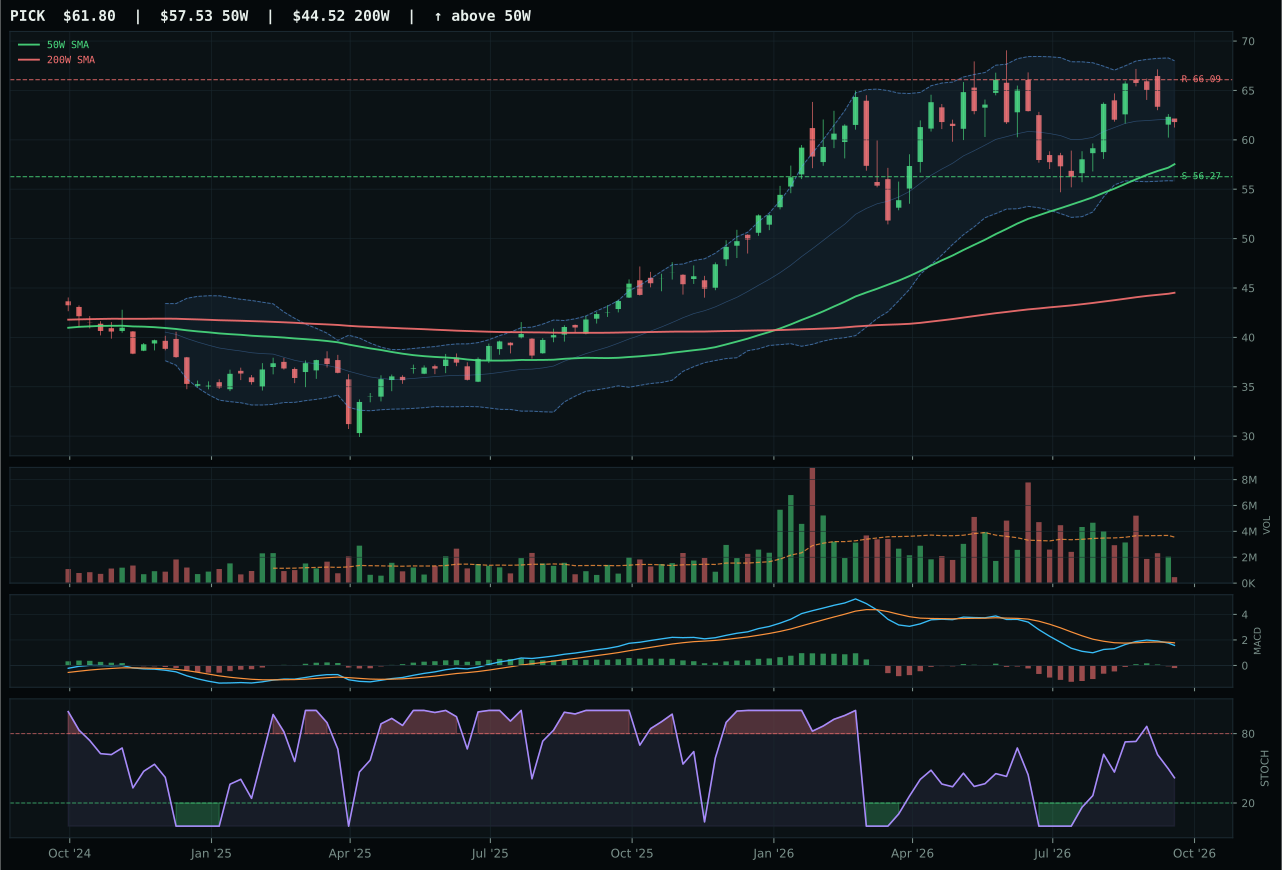
PICK has a neutral structure profile with 2.1% 13-week relative strength versus SPY.
A failed hold above support would weaken the setup.
Actionable but governed by invalidation levels.
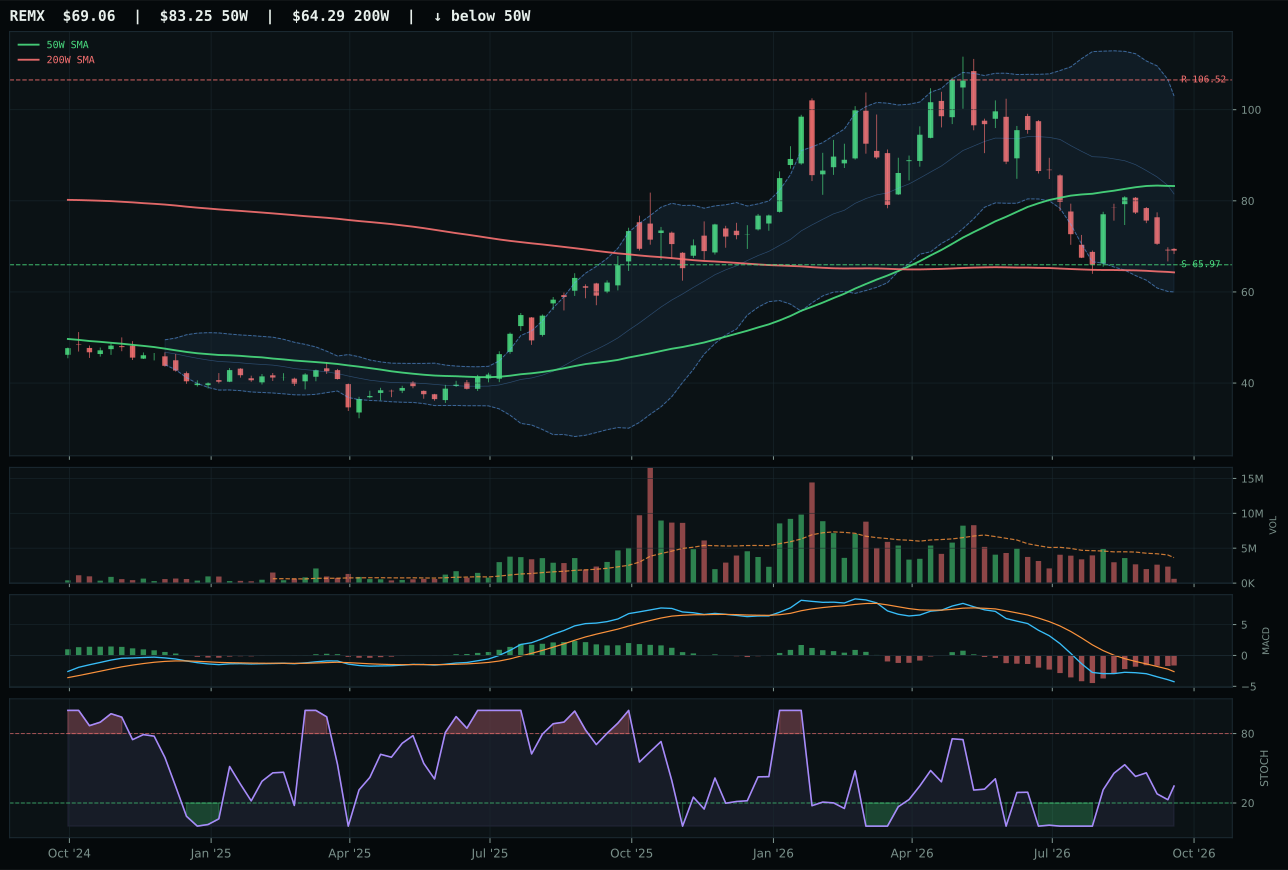
REMX has a pullback into support profile with -24.7% 13-week relative strength versus SPY.
A failed hold above support would weaken the setup.
Actionable but governed by invalidation levels.
COPX dominated the industrial metals category with a pristine 100.0/100 trend score and 80.6/100 momentum confirmation that PICK simply could not compete with on multiple dimensions. COPX's 10.1% RS versus SPY and 14.6% 13W return reflect genuine copper and scarcity beta in a supply-constrained world, while PICK's 2.1% RS versus SPY and 6.6% 13W return signal a mining index without top-tier conviction. The macro narrative favors COPX as well: metals scarcity is active (+12) and directly benefits copper's industrial use case, whereas PICK's broader mining basket dilutes that signal. Timing is nearly identical (both 70.0), but MACD confirmation diverges sharply—COPX's bullish-but-flattening is appropriate for continuation accumulation, while PICK's bearish/weakening setup suggests the diversified mining index is rolling over. Category-relative strength of 7.9% for COPX versus 0.0% for PICK is the final validation that if any industrial metals expression is being accumulated, it is the copper-focused concentrated bet.
Industrial Metals earned 5% allocation in tier-3, with a final category score of 44.8 that ranks it below the top-2 and agricultural overweights but above the excluded categories. The macro fit of 63.0/100 is respectable—metals scarcity is active (+14), commodity breadth is positive (+10), real asset sponsorship is active (+6)—but it is offset by growth slowdown (-10) and credit stress (-7), creating a net-neutral regime where industrial metals are a secondary real-asset hedge rather than a primary allocation. COPX's technical evidence of 76.5/100 is strong, but the category's overall positioning reflects pragmatism: copper and industrial metals benefit from supply shock narratives, but they are economically sensitive and deteriorate quickly if credit stress accelerates or growth falls below expectations. At 5%, the portfolio holds industrial metals as a tactical trade (COPX's momentum is genuine), not a long-term stagflation core position. For promotion to 10%, copper would need to prove macroeconomic resilience alongside supply constraints—a bullish demand signal that is currently absent in a growth slowdown.
Nuclear Energy — URA
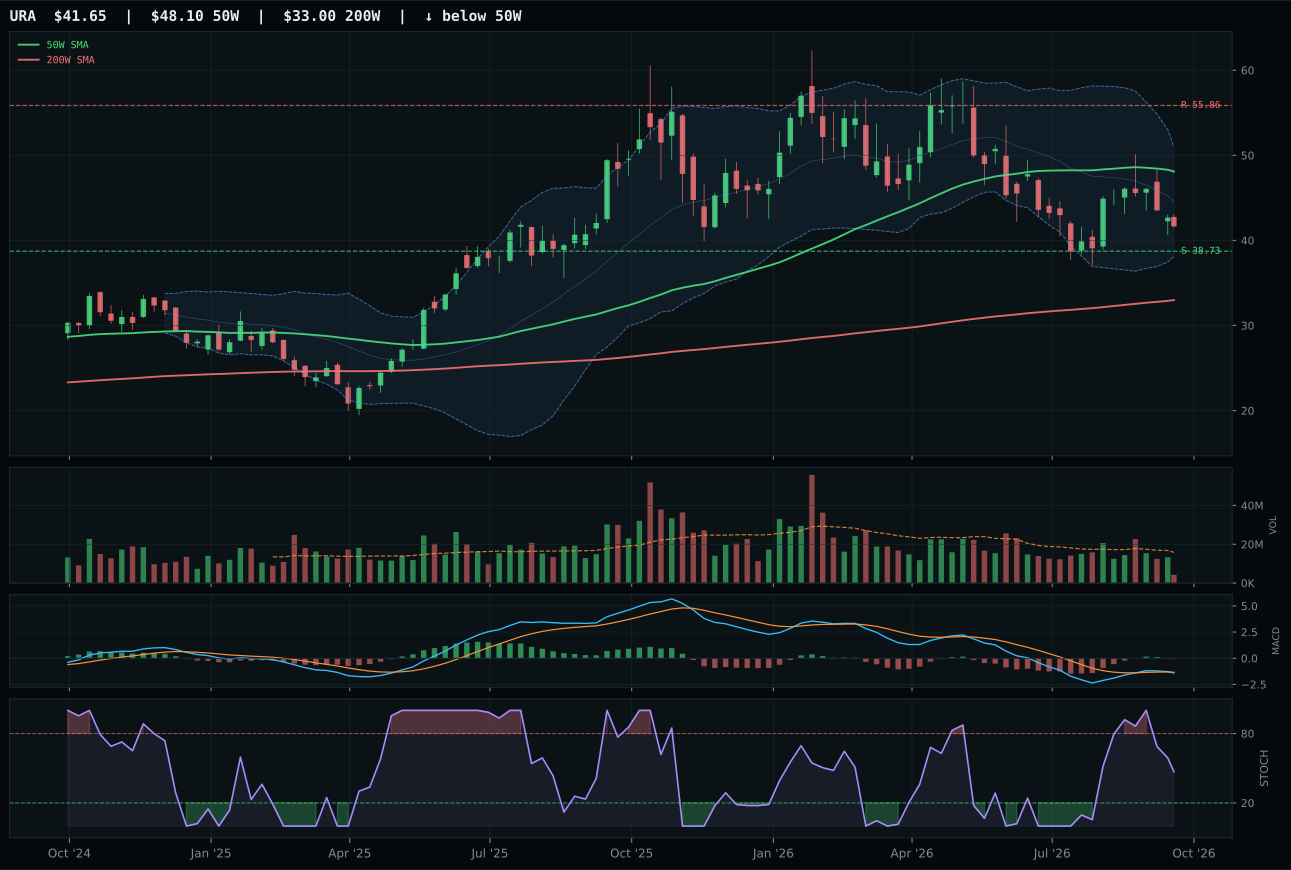
URA has a neutral structure profile with -8.9% 13-week relative strength versus SPY.
A failed hold above support would weaken the setup.
Actionable but governed by invalidation levels.
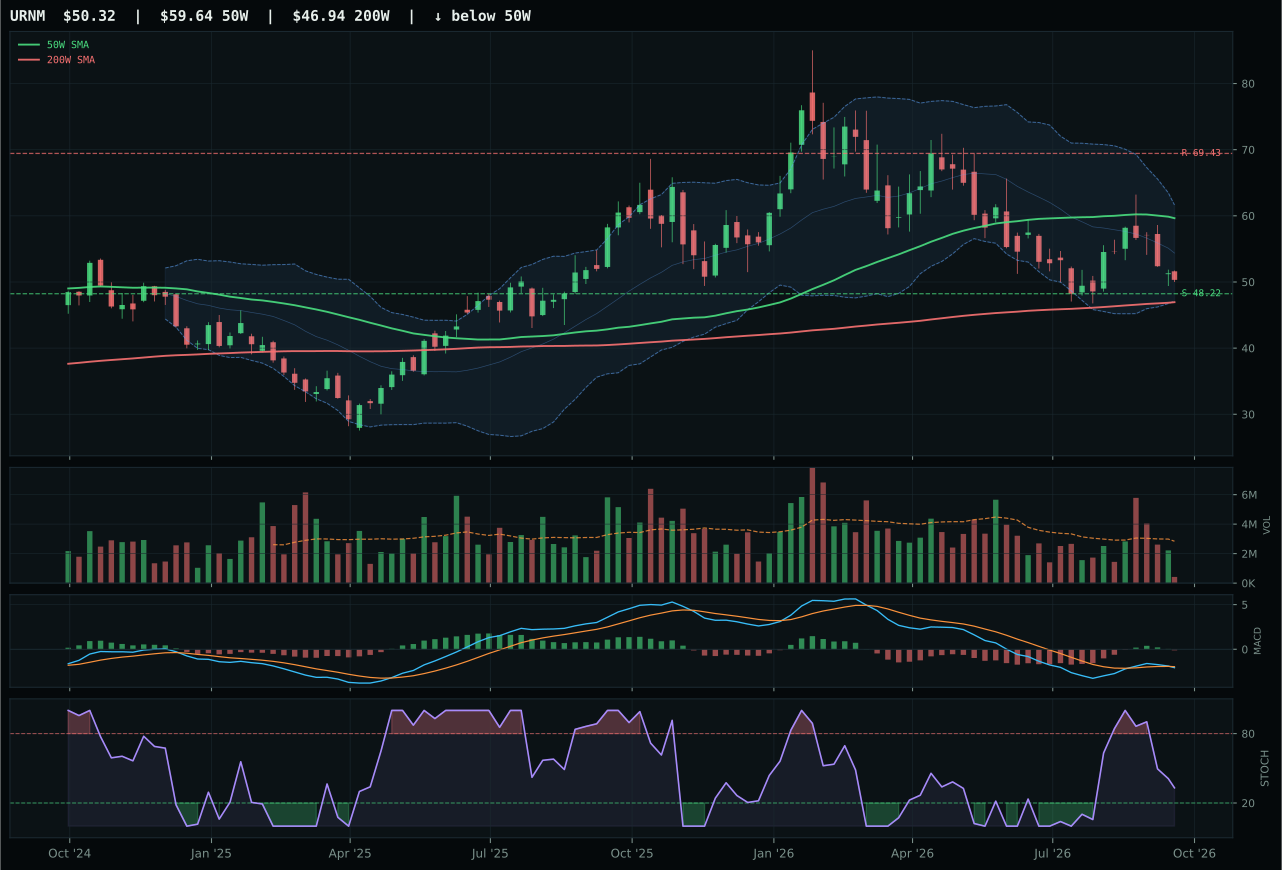
URNM has a pullback into support profile with -9.6% 13-week relative strength versus SPY.
A failed hold above support would weaken the setup.
Actionable but governed by invalidation levels.
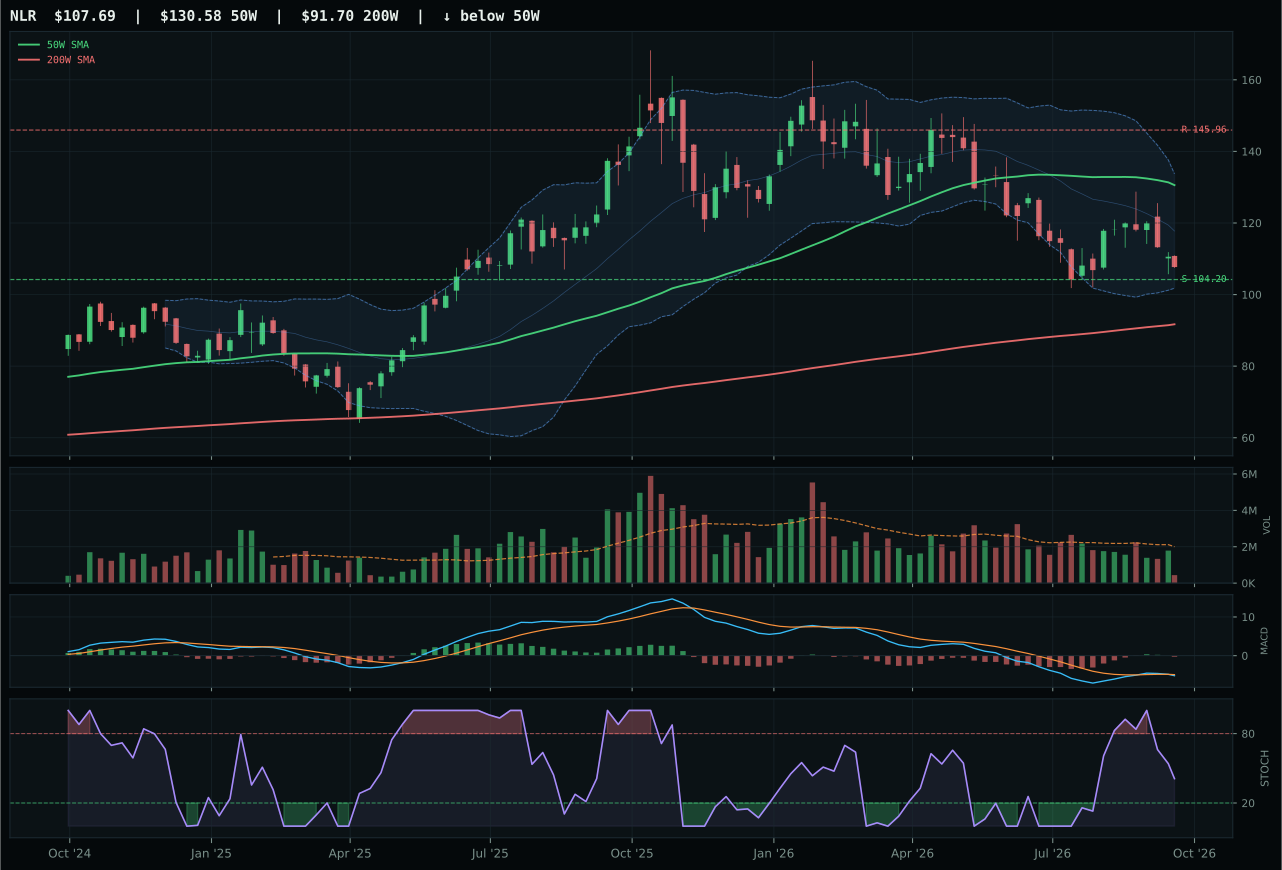
NLR has a pullback into support profile with -11.9% 13-week relative strength versus SPY.
A failed hold above support would weaken the setup.
Actionable but governed by invalidation levels.
URA won a competitive category not on strength but on relative resilience: both URA and URNM are oversold, both carry zero momentum confirmation, and both sit below the 50W, but URA's 0.7% category-relative strength squeaked past URNM's 0.0%, indicating that if uranium money is moving at all, it favors the broader ETF expression. Price sits at -13.4% from the 50W, genuinely beaten down, and stochastic RSI has fallen to 0.47 (near but not yet deep oversold), while MACD remains bearish/weakening—this is a setup that needs to stabilize, not reverse. URA's timing score of 50.0 matches URNM's at 60, but URA's risk/reward of 75.0 versus URNM's implied advantage is negated by URNM's inferior structure score and the fact that its pullback-into-support setup (versus URA's neutral) offers false confidence in a category with virtually no volume or sponsorship.
Nuclear Energy earned 5% allocation in tier-3, a holding position justified by 40.5 in final score and 72.0/100 in macro fit that reflects energy scarcity (+9), real asset sponsorship (+7), and inflation pressure (+3), offset by credit stress (-5). The nuclear category ranks below industrial metals and far below energy because it is a secondary beneficiary of energy scarcity narratives—it lacks the immediacy of oil supply shocks or uranium mining scarcity stories that would earn tier-2 status. URA's technical evidence of only 24.2/100 is the honest assessment: the category is broken, price is deeply depressed, and no institutional accumulation is occurring. What keeps it at 5% instead of 0% is macro optionality: if energy scarcity intensifies and stagflation forces governments toward nuclear baseload as an alternative to high natural gas prices, URA and URNM will re-rate from depressed levels. Until then, the position is a hedge that costs little (5% capital) and provides asymmetric upside if the regime shifts. For promotion, nuclear would require evidence of utility purchasing, government policy acceleration, or supply shortage narratives; currently, it is management of unproven upside rather than active conviction.
Utilities & Infrastructure — PAVE
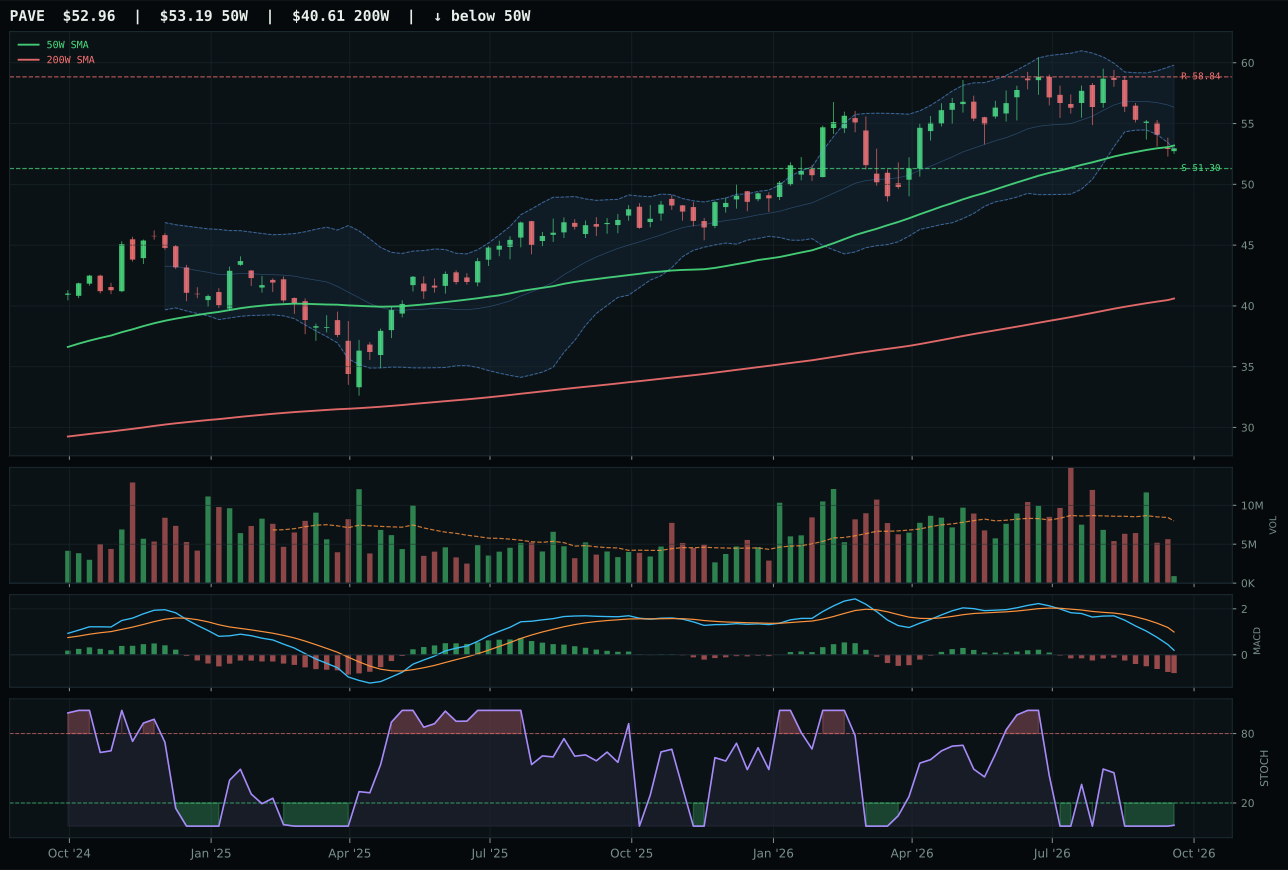
PAVE has a pullback into support profile with -14.5% 13-week relative strength versus SPY.
A failed hold above support would weaken the setup.
Actionable but governed by invalidation levels.
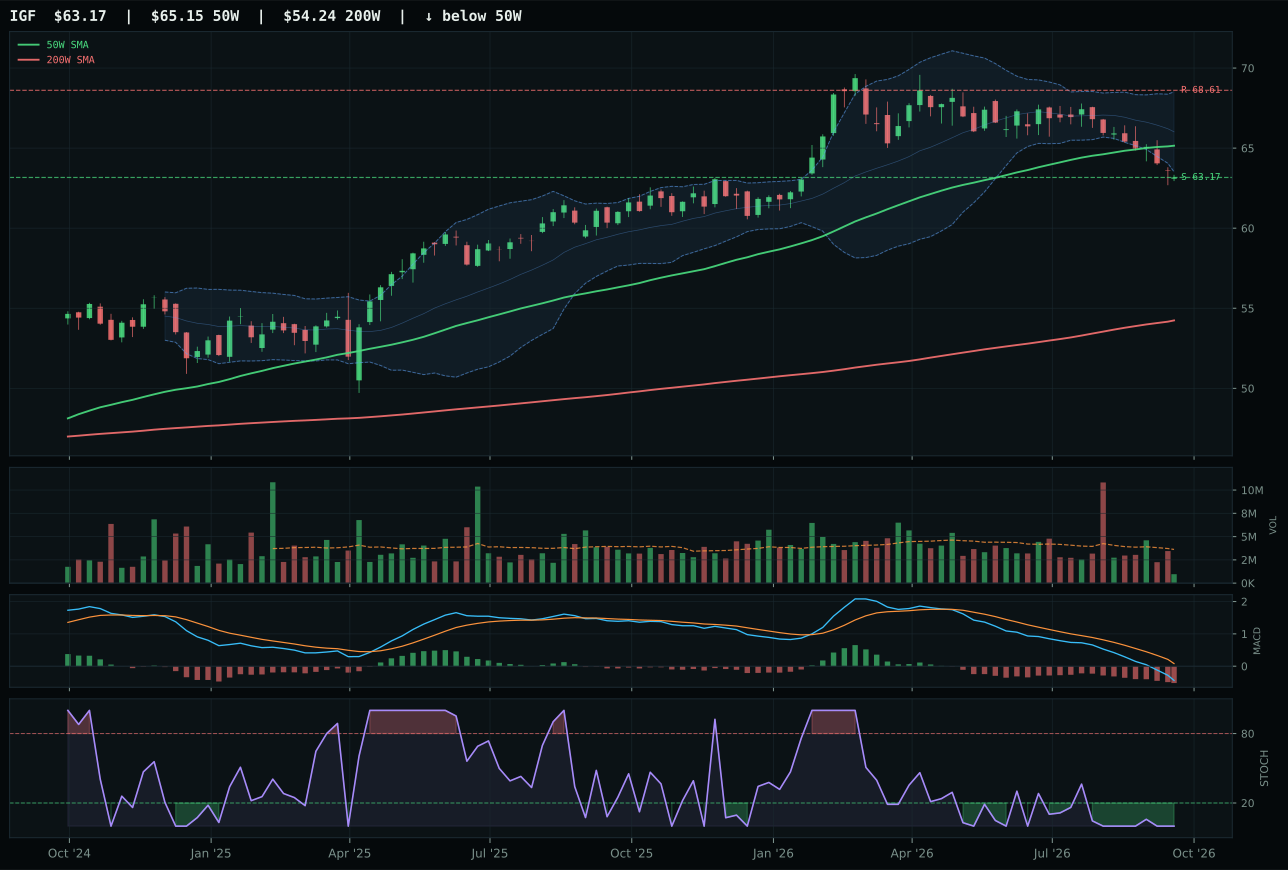
IGF has a pullback into support profile with -10.8% 13-week relative strength versus SPY.
A failed hold above support would weaken the setup.
Actionable but governed by invalidation levels.
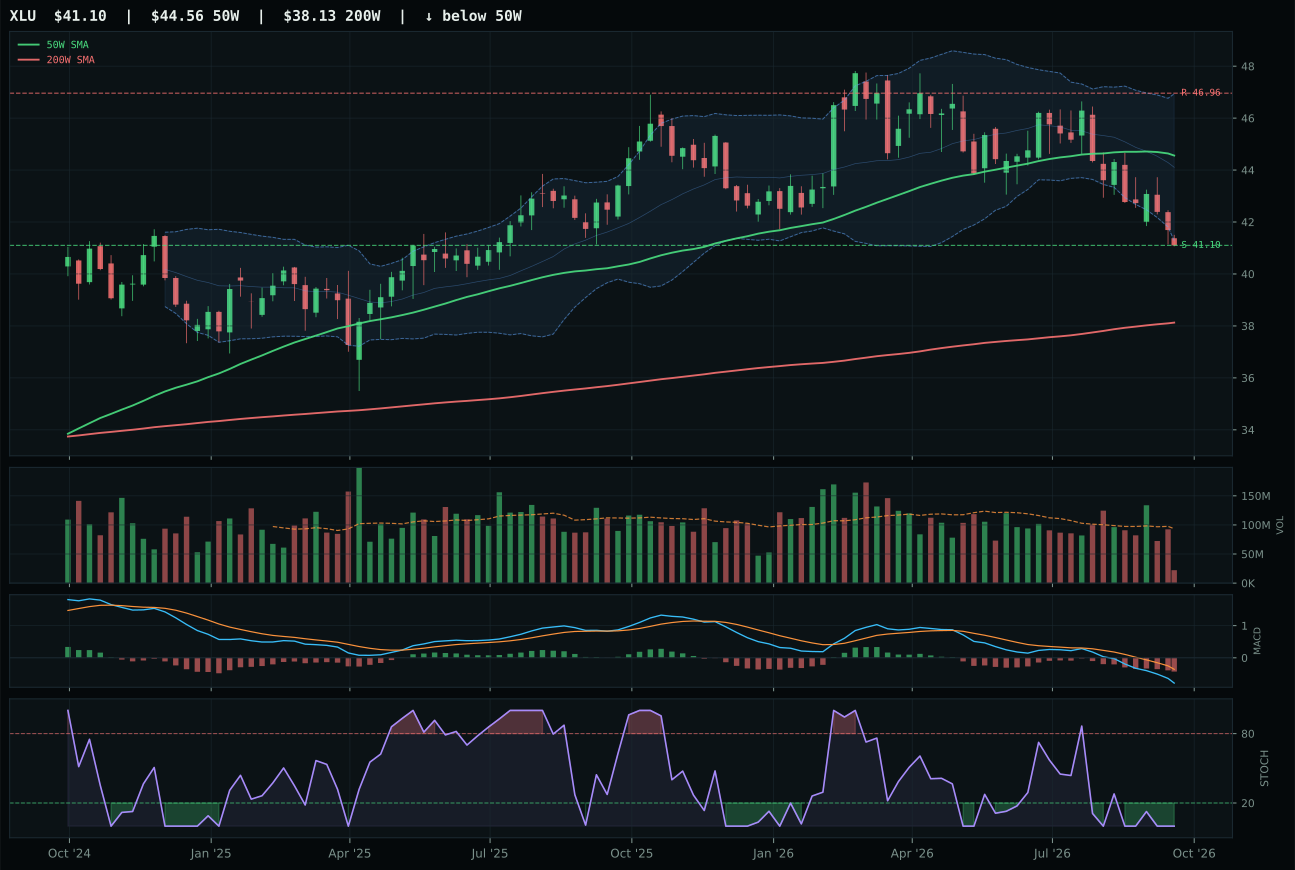
XLU has a pullback into support profile with -15.5% 13-week relative strength versus SPY.
A failed hold above support would weaken the setup.
Actionable but governed by invalidation levels.
PAVE captured a marginal category by posting a perfect 100.0/100 timing score that IGF could not match, despite both sitting in pullback-into-support setups with oversold MACD and stochastic RSI. The critical difference is stochastic RSI confirmation: PAVE is at oversold turn-up (0.01), the earliest mechanical reversal signal, while IGF is merely oversold at an unspecified higher level—PAVE is closer to the actual bounce. Price proximity to support is nearly identical for both names, but PAVE's distance to 50W of -0.4% (essentially at the moving average) versus IGF's pullback deeper into a technical retracement gives PAVE the cleaner re-entry zone. Risk/reward diverges sharply: PAVE offers 98.0/100 with only 3.2% downside to support, while IGF shows 70.8 with deeper decay risk. Both carry zero momentum confirmation and identical 0.0% category-relative strength, confirming that infrastructure and utilities capital is dormant in stagflation.
Utilities & Infrastructure earned 5% in tier-3, the minimum position justified by 38.5 final score and 54.0/100 macro fit that contains offsetting signals: commodity breadth is positive (+4) but credit stress (-5) and growth slowdown (-4) are negative for regulated utilities. PAVE's pullback-into-support setup and perfect timing score suggest tactical value, but the category's allocation reflects realistic assessment that infrastructure is a growth-dependent sector poorly suited to stagflation. Utilities typically benefit from 'bond replacement' demand when growth dies, but stagflation's combination of inflation pressure and credit stress negates that benefit by raising discount rates and capping rate-base returns. At 5%, the position is a hedge to deflation or a sharp growth deceleration, not an active conviction. PAVE would need to prove volume accumulation at support (near 51.30) to justify hold; a break below support converts this from a pullback trade into a breakdown, warranting exit and reallocation to higher-conviction categories. For utilities to earn 10%, either credit stress would need to reverse or the macro regime would need to shift toward pure growth slowdown without inflation—neither scenario is currently developing.
Defense & Aerospace — ROKT
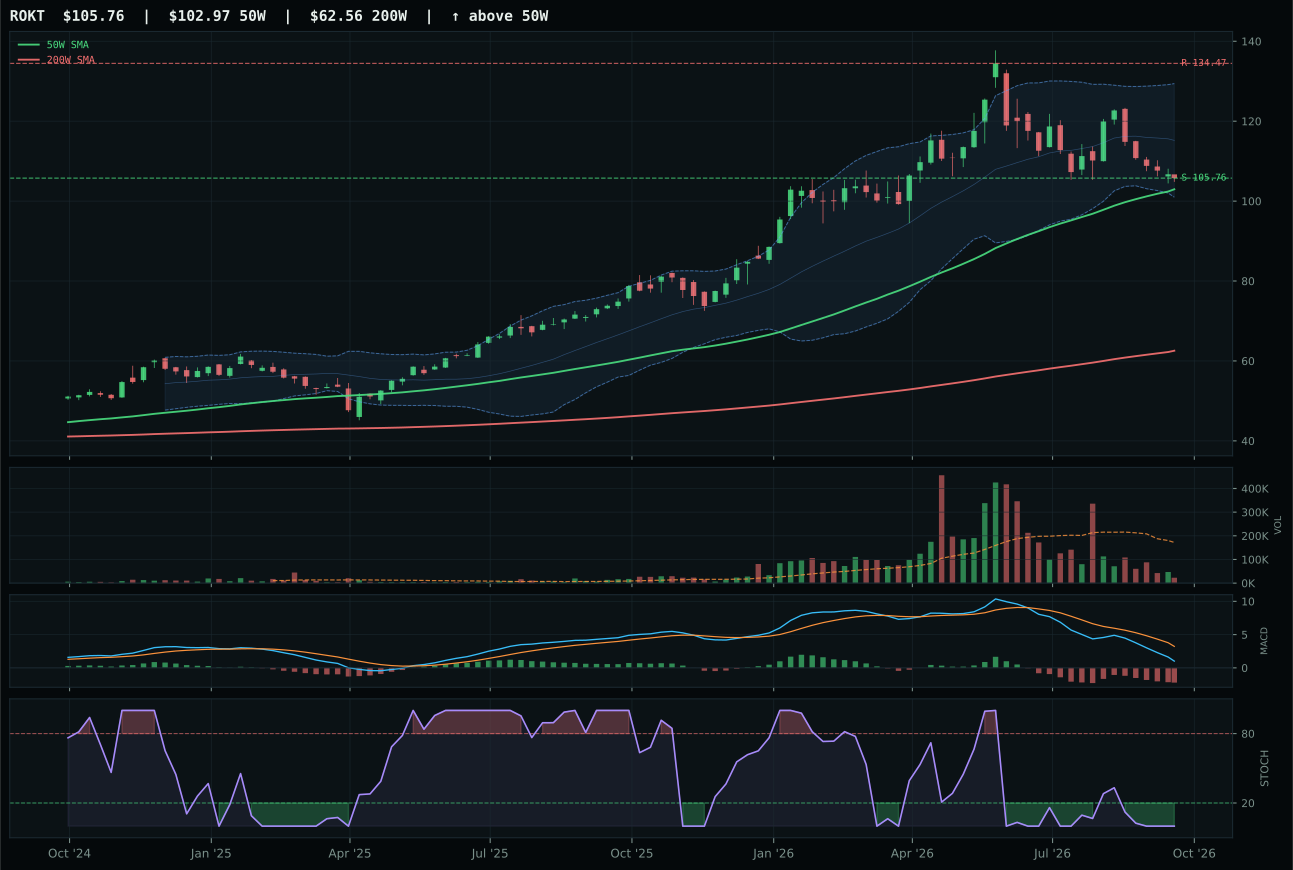
ROKT has a pullback into support profile with -10.6% 13-week relative strength versus SPY.
A failed hold above support would weaken the setup.
Actionable but governed by invalidation levels.
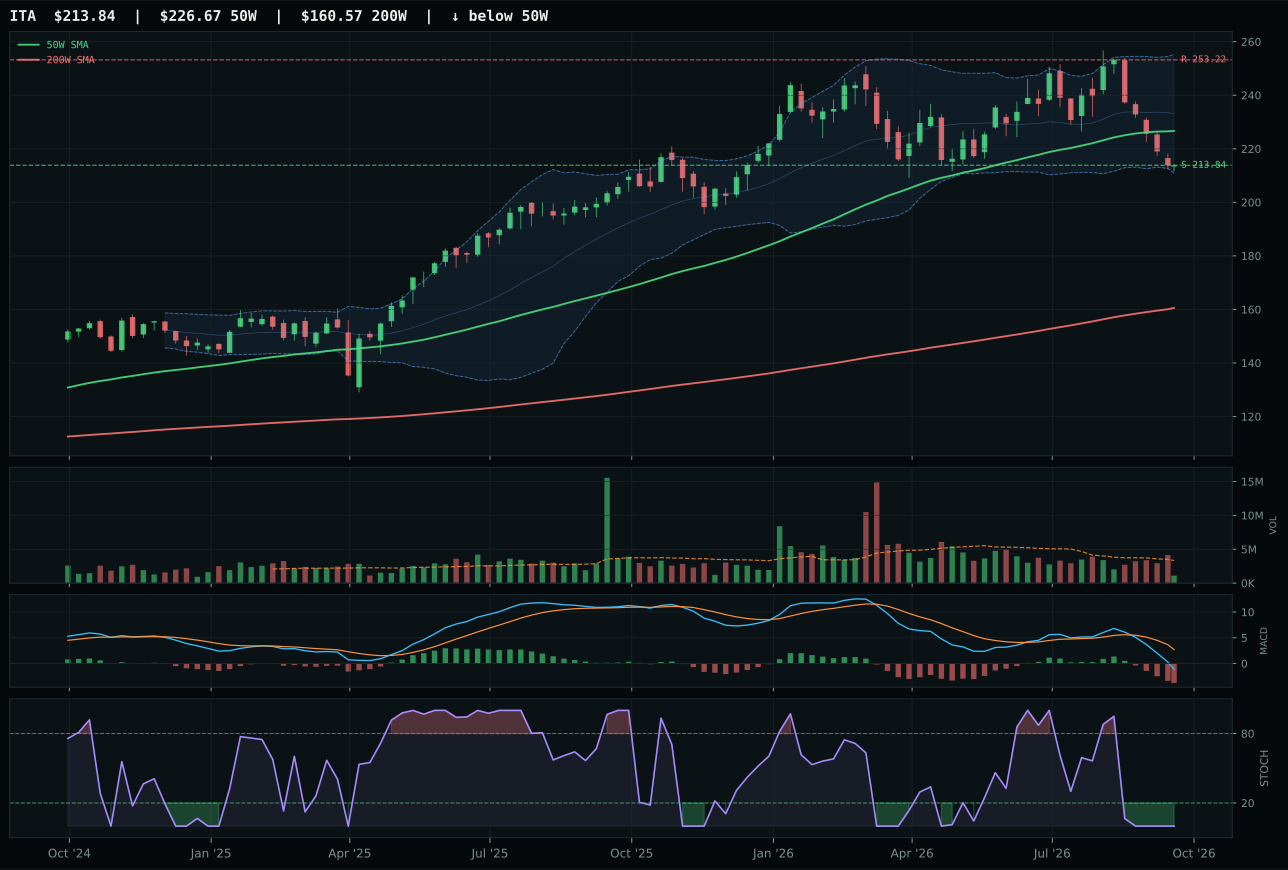
ITA has a pullback into support profile with -14.2% 13-week relative strength versus SPY.
A failed hold above support would weaken the setup.
Actionable but governed by invalidation levels.
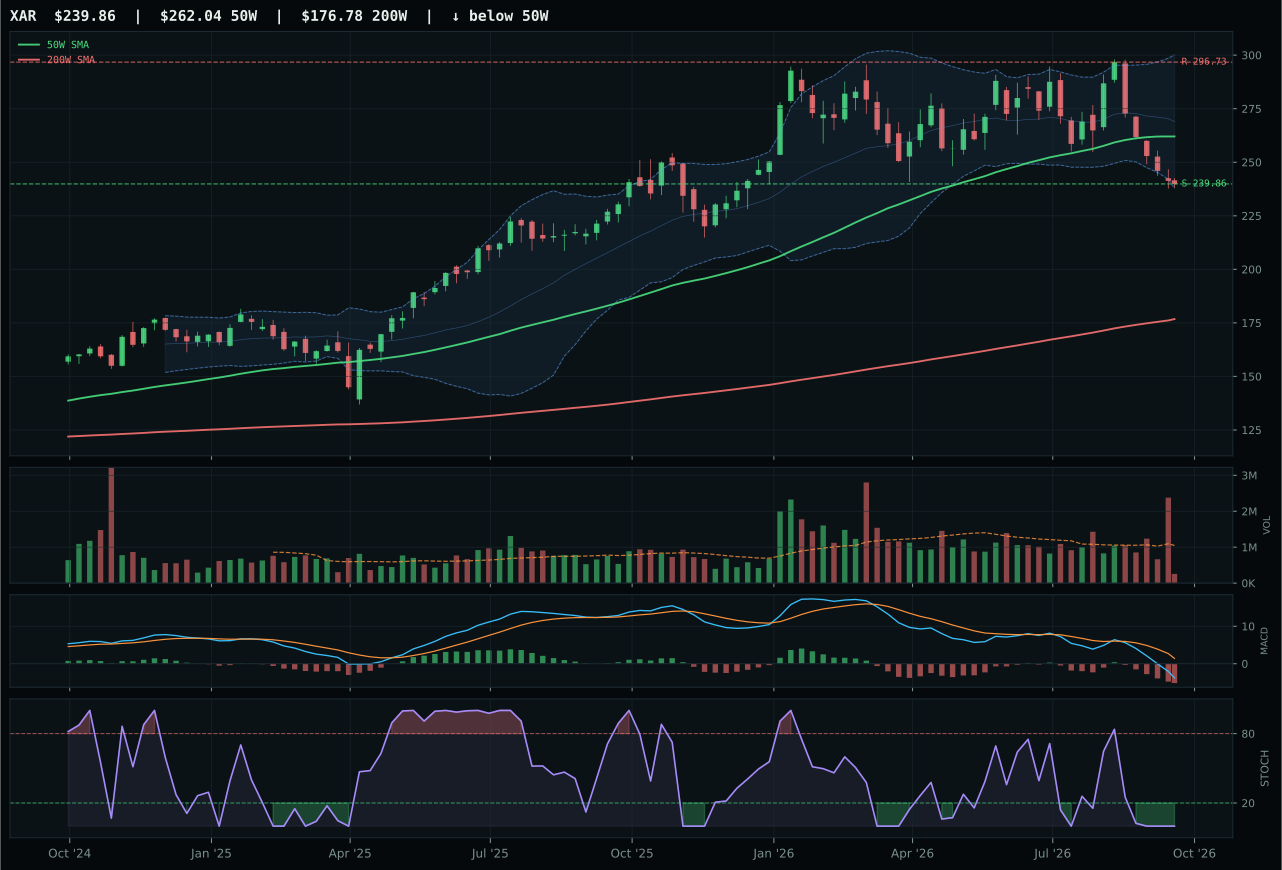
XAR has a pullback into support profile with -17.0% 13-week relative strength versus SPY.
A failed hold above support would weaken the setup.
Actionable but governed by invalidation levels.
ROKT won decisively by delivering the only perfect timing score in the category at 100.0/100, a direct result of its proximity to support and oversold setup that IGV and XAR cannot replicate. Price is just 2.7% from the 50W, stochastic RSI has collapsed to 0.00 (true oversold), and MACD is bearish/weakening—the mechanical reversal setup is unambiguous. Risk/reward scored 98.0 because upside to resistance is constrained at -21.4%, but downside to support is at worst 0.0%, which transforms this from a bet on continued weakness into a defined re-entry zone. ROKT's category-relative strength of 3.6% outpaced ITA's 0.0%, confirming that if aerospace capital is rotating, it favors the space/growth narrative over defense prime durability. The cost is momentum: ROKT carries 4.8/100 because 13W and 4W returns are both negative, but in a pullback-into-support setup, negative recent returns are a feature, not a bug—they attracted the oversold trigger.
Defense & Aerospace claimed 5% as a tier-3 contributor, ranked below the two overweight categories but supported by a strong 61.0/100 macro fit that stagflation and credit stress paradoxically assist. Geopolitical stability uncertainty and military procurement durability lift this category's macro score, and the active descriptors show stagflation (+6) and credit stress (+2) as net positive factors rather than headwinds. ROKT's final technical evidence of 37.3/100 is weak, but the timing perfection and macro environment combine to push the category score to 37.0, which is respectable for a defensive trade. The real reason for the 5% slot is portfolio balance: with FBTC at 50% and energy/agriculture dominating the growth sleeve, a small hedge to aerospace upside (if military spending cycles accelerate in a stagflation scenario) adds diversification without betting the portfolio. ROKT would earn promotion only if price cleared resistance at 134.47 with volume confirmation, proving the pullback was institutional accumulation rather than a fade.
Technology — IGV
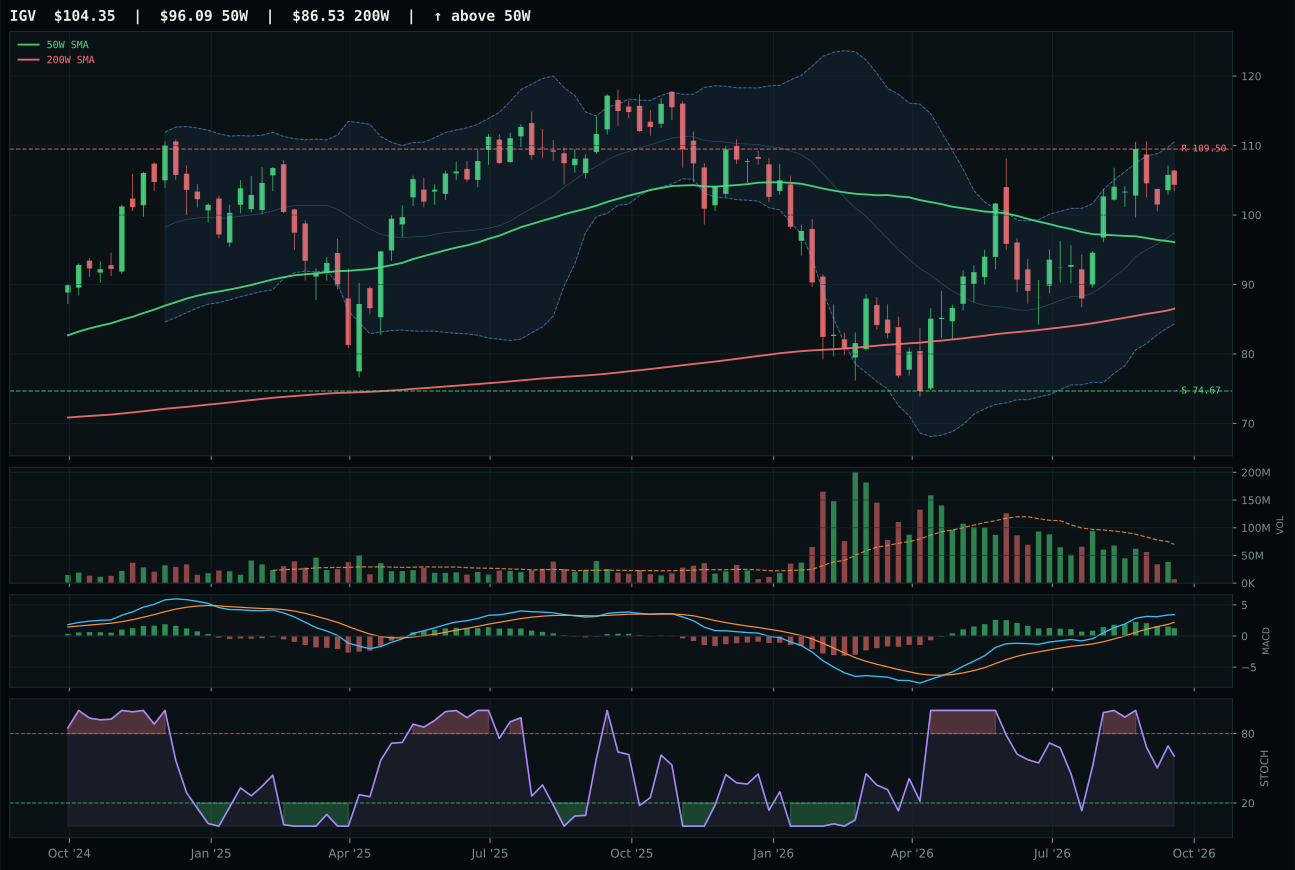
IGV has a neutral structure profile with 13.8% 13-week relative strength versus SPY.
A failed hold above support would weaken the setup.
Actionable but governed by invalidation levels.
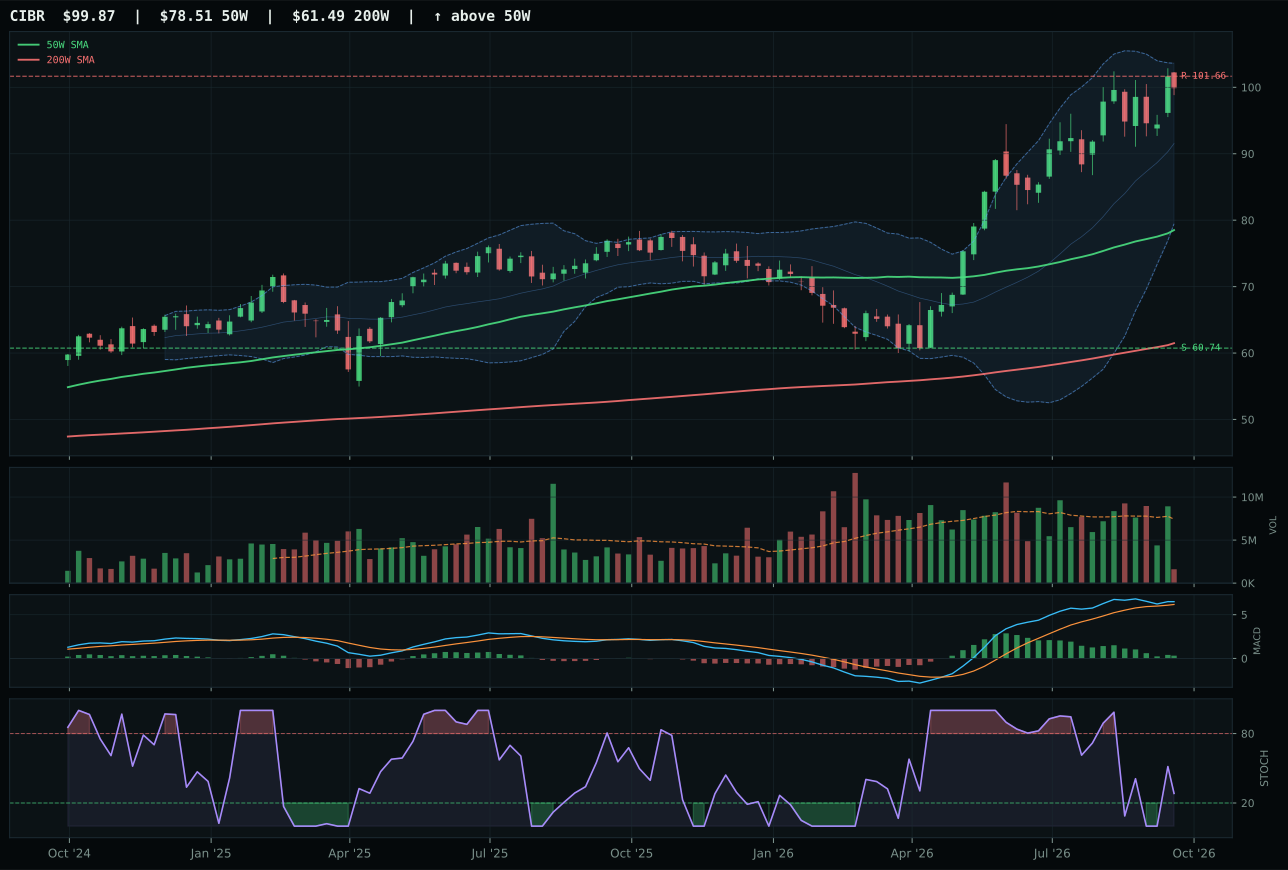
CIBR has a vertical extension profile with 12.5% 13-week relative strength versus SPY.
A failed hold above support would weaken the setup.
Actionable but governed by invalidation levels.
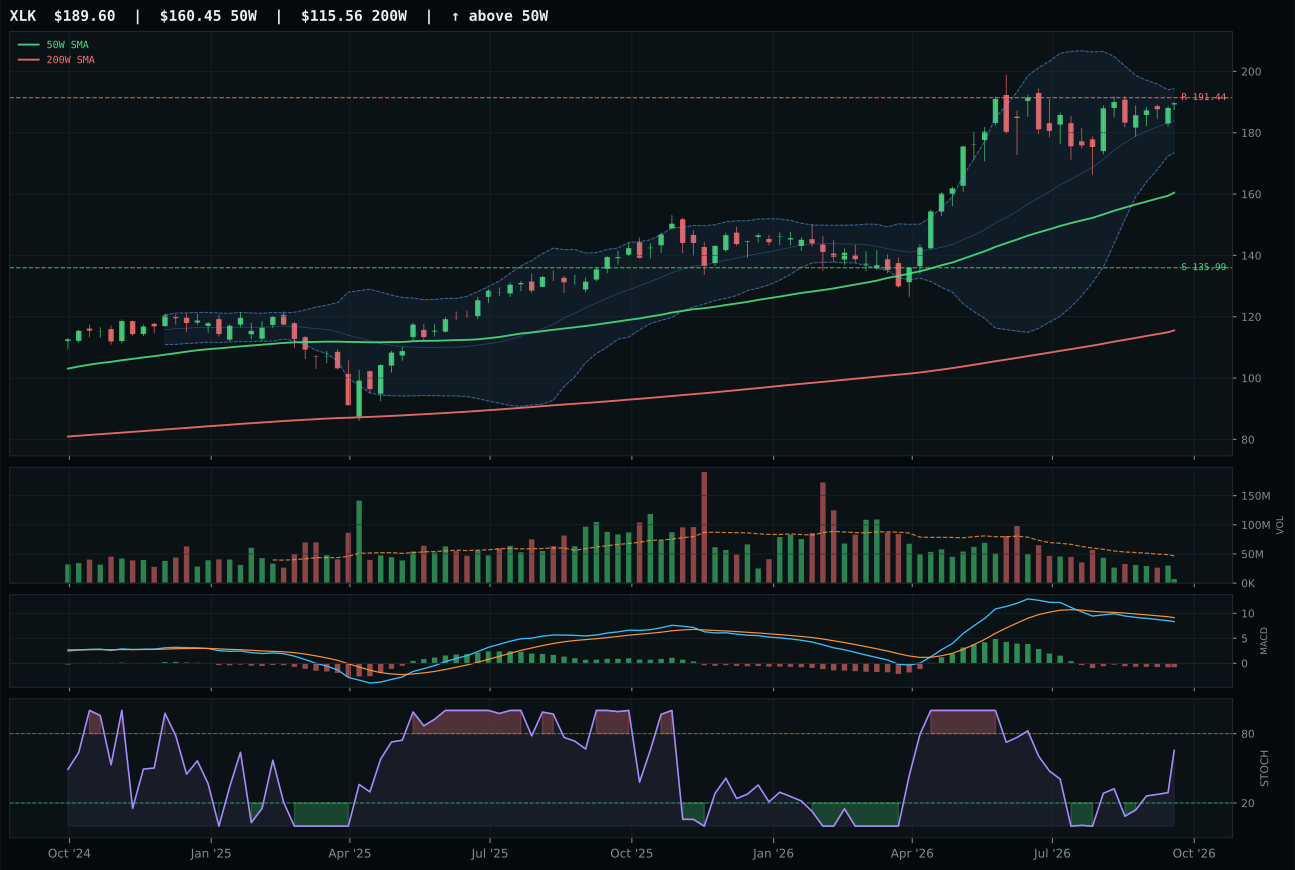
XLK has a vertical extension profile with 0.2% 13-week relative strength versus SPY.
A failed hold above support would weaken the setup.
Actionable but governed by invalidation levels.
IGV captured the category by combining a clean neutral structure with superior timing mechanics that CIBR simply could not match. Price sits 8.6% above the 50W—close enough to suggest accumulation rather than extended euphoria—while CIBR has stretched to 27.2%, forcing new money into a depleted risk/reward zone of -4.7% upside to resistance. The deciding factor was timing: IGV's MACD remains bullish despite flattening, and stochastic RSI is falling into neutral territory at 0.61, suggesting a pullback that resets rather than confirms exhaustion. CIBR's stochastic has risen into mid-zone, indicating it has already absorbed the snap-back and has less oxygen left. Category-relative strength of 1.3% for IGV versus 0.0% for CIBR signals selective accumulation into the winner, not broad-based leadership. Both face credit stress headwinds in stagflation, but IGV's composite trend score of 96 versus CIBR's 100 that delivers only 48 in timing reveals the gap: trend alone does not trade without setup quality.
Technology earned 5% as a tier-2 contributor in a stagflation regime where growth equities face structural headwinds. The category's final score of 36.0 reflects a macro fit of only 32.0/100, driven by active credit stress, growth slowdown, and inflation pressure—all three reducing the appeal of duration-sensitive enterprise software and cybersecurity. What keeps it in the portfolio at all is IGV's relative strength versus SPY at 13.8% and a 13W return of 18.3%, proving that even in a hostile macro environment, price leadership can be accumulated. The tension is real: momentum is real, but the setup is neutral rather than coiled, and volume participation at 0.10x the 20W average means every new buyer faces thinner liquidity on the way down. Technology would need a shift away from credit stress activation or a clean compression-breakout setup with volume confirmation to earn promotion to top-2; today it sits at tier-2 because two stronger category scores (Agriculture at 79.1 and Energy at 78.0) command the limited overweight capacity.
AI — AIQ
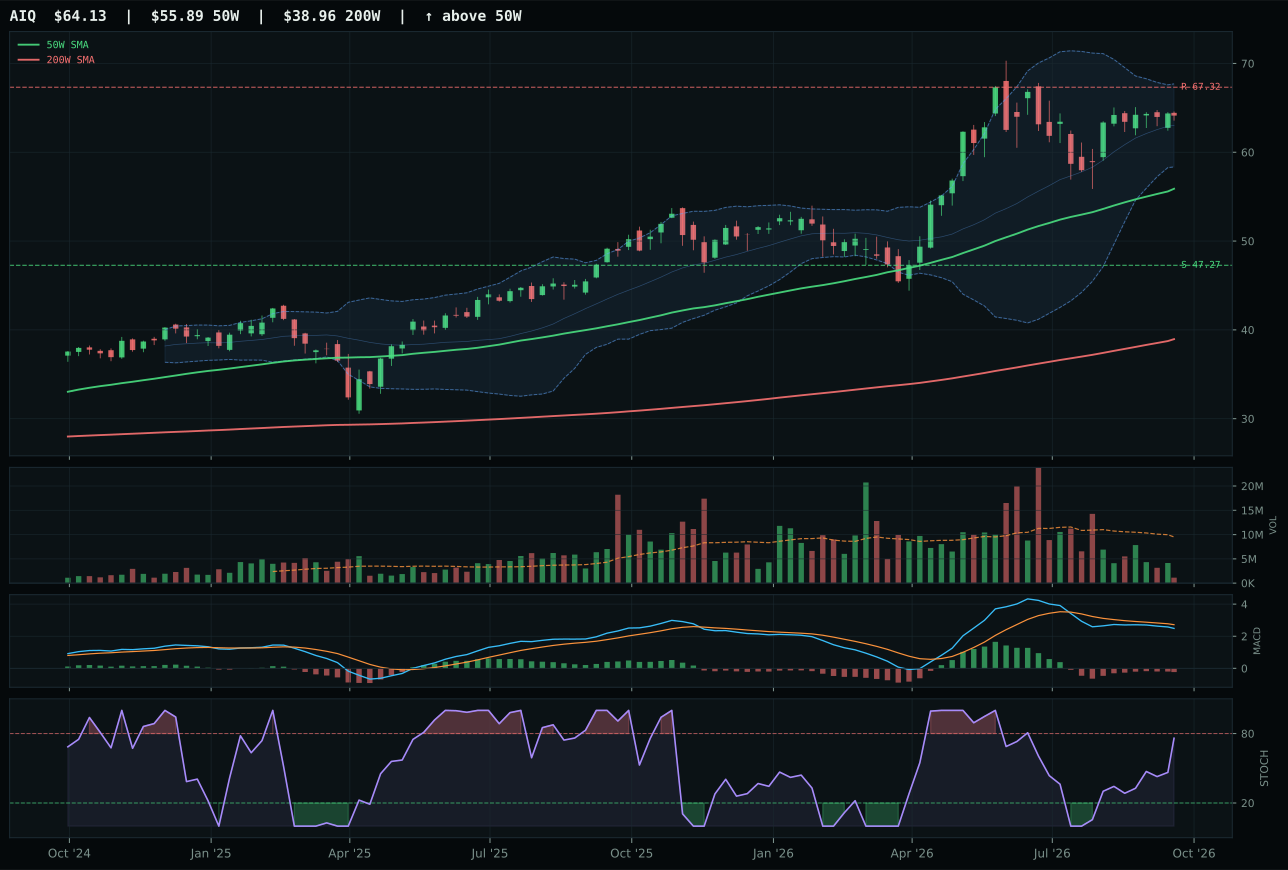
AIQ has a neutral structure profile with -2.9% 13-week relative strength versus SPY.
A failed hold above support would weaken the setup.
Actionable but governed by invalidation levels.
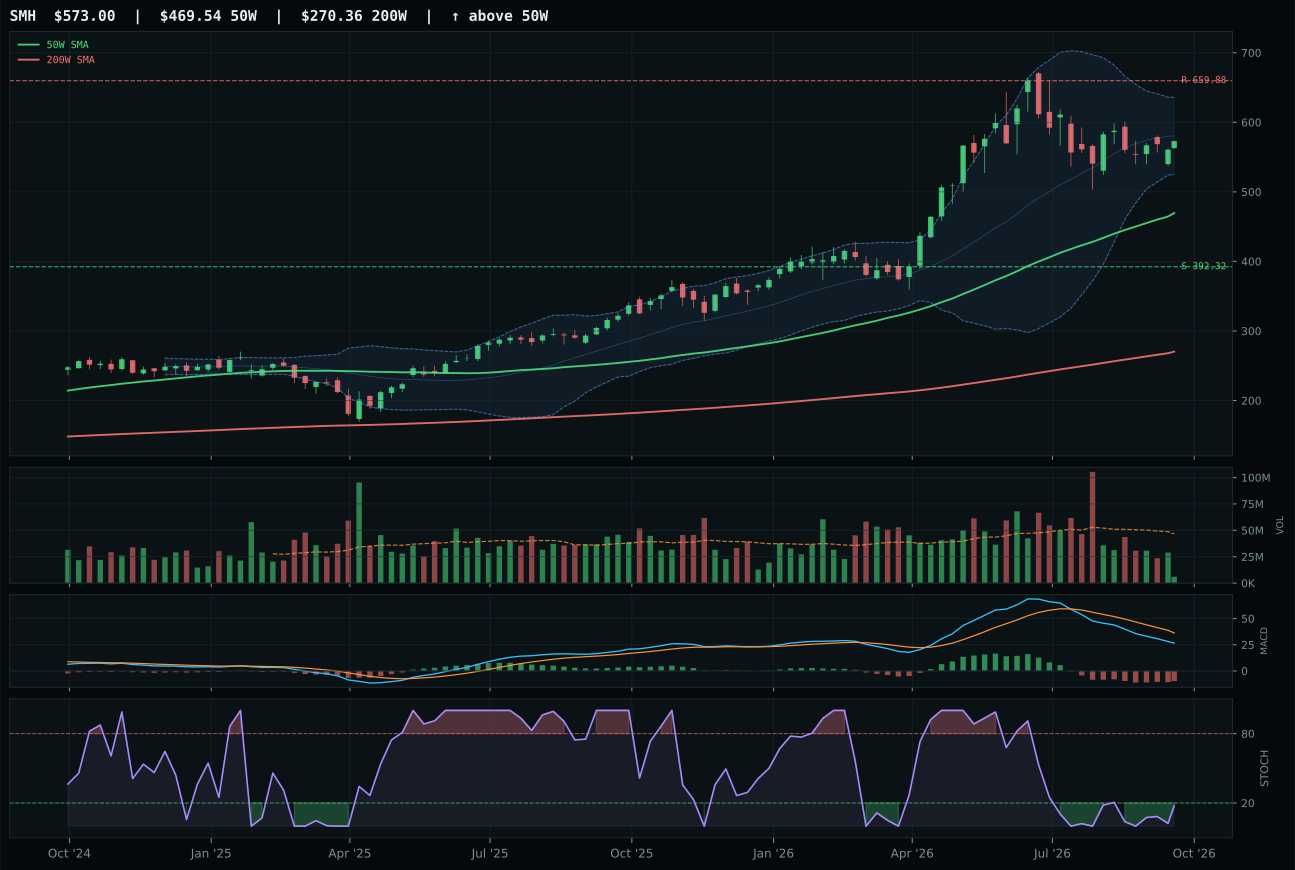
SMH has a vertical extension profile with -10.8% 13-week relative strength versus SPY.
A failed hold above support would weaken the setup.
Actionable but governed by invalidation levels.
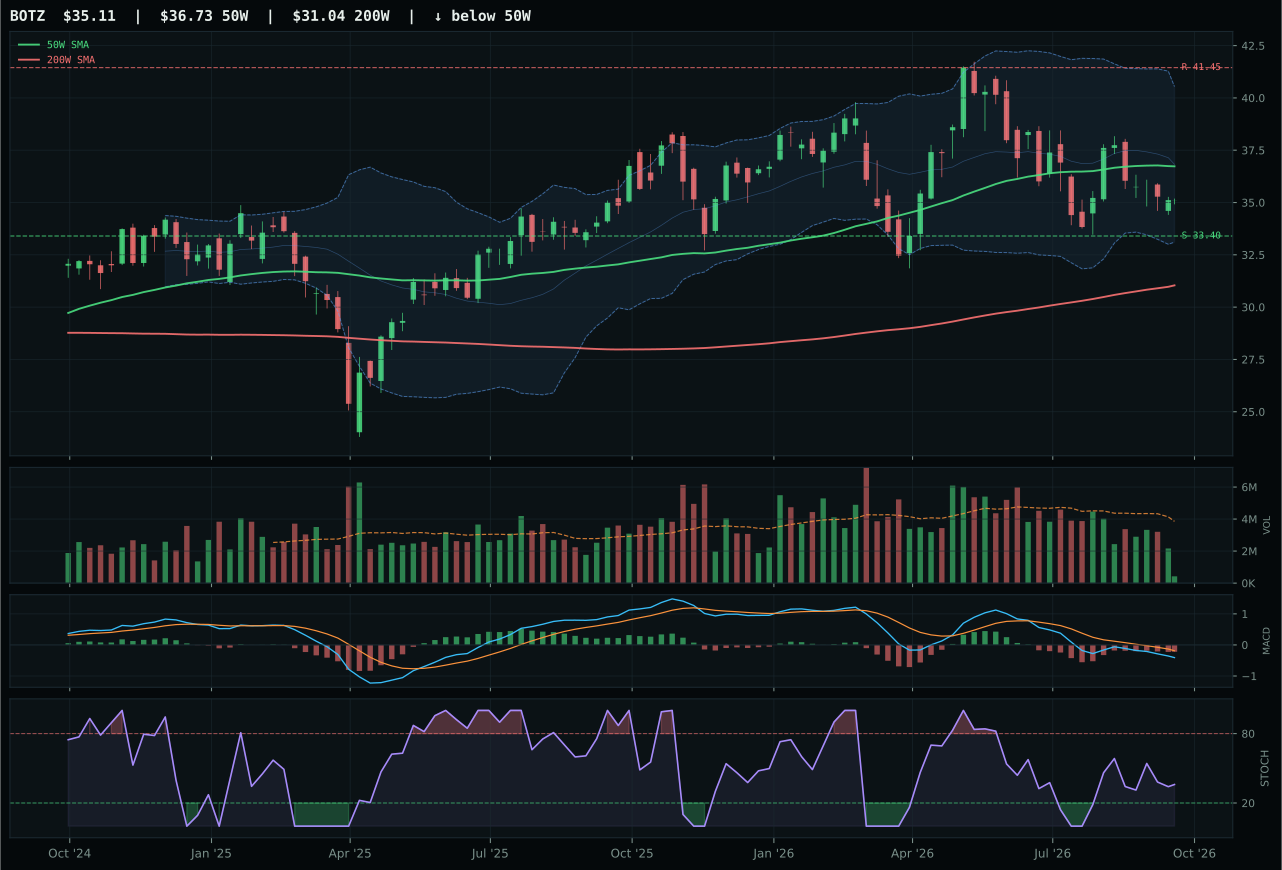
BOTZ has a neutral structure profile with -7.0% 13-week relative strength versus SPY.
A failed hold above support would weaken the setup.
Actionable but governed by invalidation levels.
AIQ prevailed by posting 78.0 in timing—a full 11 points ahead of runner-up SMH—despite carrying the weakest momentum score in the category at 33.2/100. Price sits 14.7% from the 50W, neutral structure, and crucially MACD is bearish/weakening while stochastic RSI is rising mid-zone, not yet overbought, which means the setup offers a defined and realistic pullback target rather than a trap. SMH's 22.0% distance from the 50W combined with oversold-turn-up stochastic creates a false signal risk: the indicator is rising but price is extended, a classic divergence warning. AIQ's category-relative strength of 4.1% versus SMH's -3.8% shows that if any AI expression is being accumulated on weakness, it is the software-application play, not the semiconductor compute bet. 13W returns of 1.6% for AIQ versus -6.3% for SMH confirm that AIQ has stabilized while SMH remains in drawdown, a critical tell in momentum selection.
AI receives 0% allocation this week, excluded entirely from the 10-category framework. The category's final score of 27.8 ranks it in the bottom tier due to stagflation risk delivering an -8 penalty and credit stress adding another -8, leaving it with no macro tailwinds whatsoever. AIQ's technical evidence of 48.1/100, while higher than its peers, cannot overcome a category-level macro fit of only 34.0/100—stagflation is the worst environment for growth and computing capex narratives, and the system has correctly identified that allocation capital is scarce and should not chase speculative AI alpha when real assets (agriculture, energy, metals) are structurally bid. For AI to earn even a 5% tier-3 slot, credit stress would need to reverse and growth-slowdown fears would need to ease; neither is in sight. At a 27.8 final score, it trails all nine other categories and signals that the positioning should remain zero until macro regime confirmation appears.
Biotech & Genomics — IBB
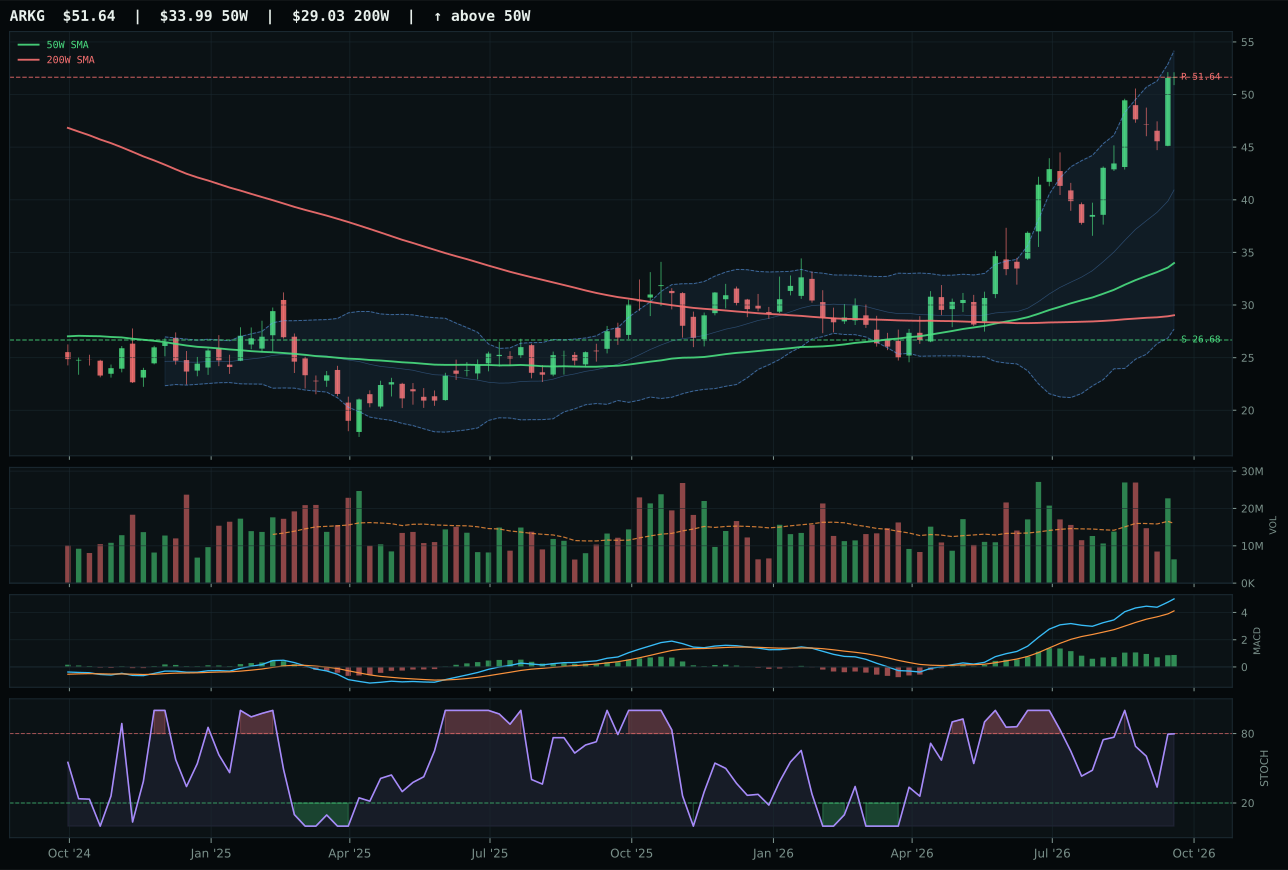
ARKG has a vertical extension profile with 20.2% 13-week relative strength versus SPY.
A failed hold above support would weaken the setup.
Actionable but governed by invalidation levels.
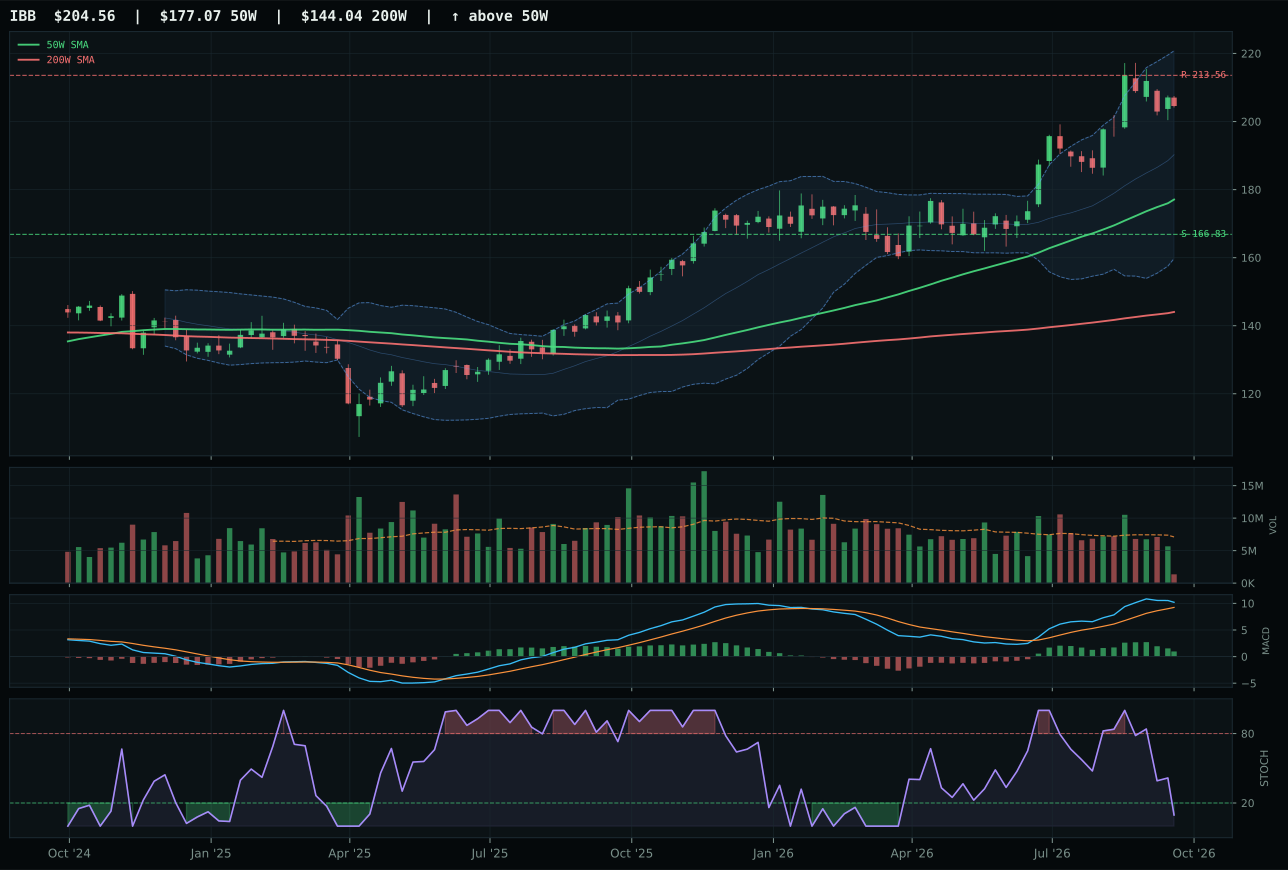
IBB has a vertical extension profile with 4.7% 13-week relative strength versus SPY.
A failed hold above support would weaken the setup.
Actionable but governed by invalidation levels.
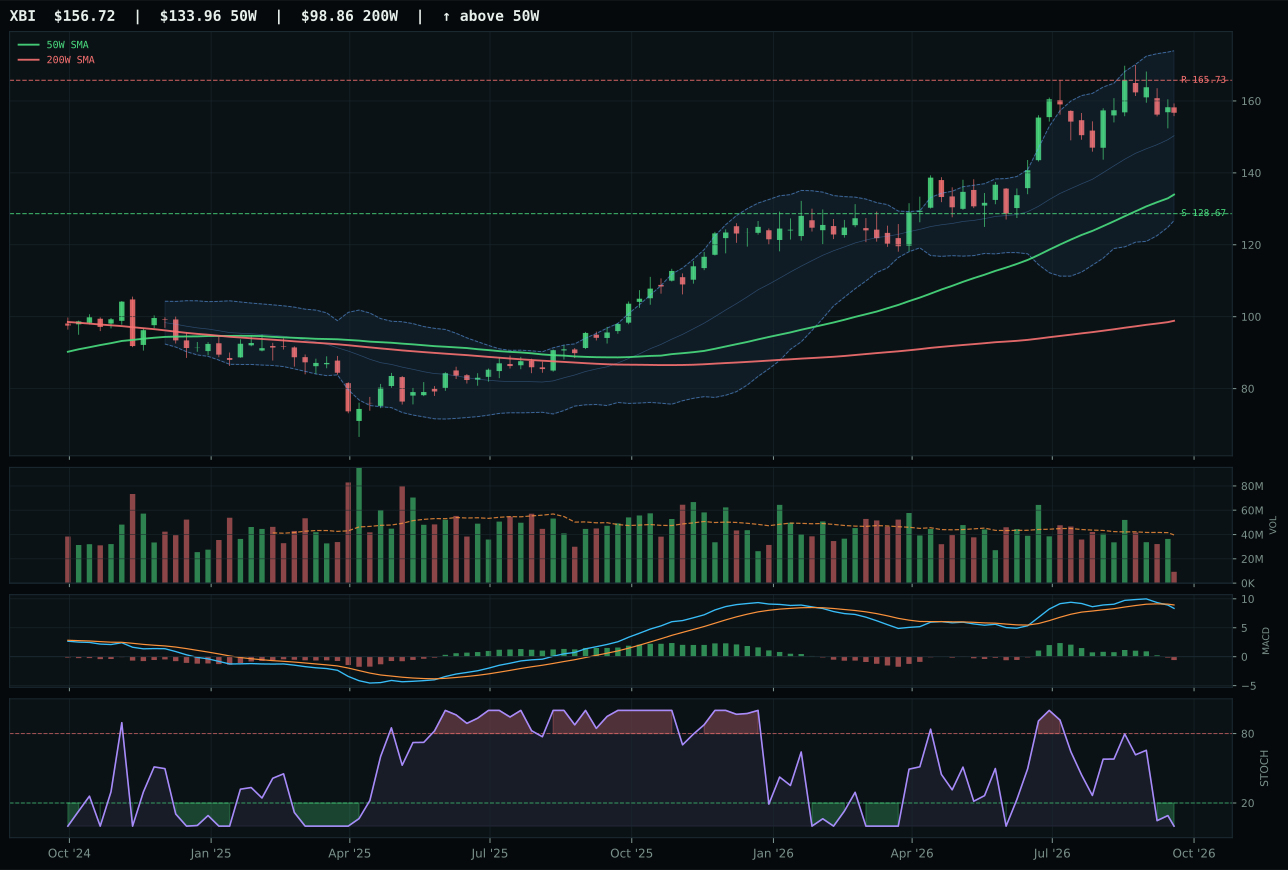
XBI has a vertical extension profile with -3.6% 13-week relative strength versus SPY.
A failed hold above support would weaken the setup.
Actionable but governed by invalidation levels.
IBB defeated ARKG by delivering superior risk/reward (48.4 versus 38.5) and cleaner structure (66.8 versus 66.3) in a category plagued by macro headwinds that make entry risk the dominant concern. Both are extended from the 50W, but IBB at 15.5% is measurably closer than ARKG's 51.9% stretch, and that distance matters when stochastic RSI has rolled into oversold territory for both names. IBB's commercial-stage biotech focus and lower clinical-stage exposure translate to a composition that can maintain trend even as growth fears mount, whereas ARKG's genomic disruption beta is a recession hedge that requires stable credit and growth forecasts—precisely what stagflation is destroying. Momentum confirmation is superior for ARKG at 100.0 versus IBB's 64.5, but momentum alone cannot justify entry into an extended vertical extension when the macro regime is actively penalizing growth and clinical-stage risk. Category-relative strength is identical at 0.0%, confirming that the market views both expressions as correlated toxic assets in stagflation.
Biotech & Genomics receives 0% allocation this week, ranked in the bottom tier with a final score of 24.6 that reflects catastrophic macro fit of 32.0/100. Stagflation hurts this exposure (-10) and credit stress is active (-8), creating a toxic combination for a sector dependent on equity financing, long cash burn cycles, and animal-spirit growth narratives. IBB's 100.0 trend score and 58.2/100 technical evidence cannot overcome the fact that biotech and genomics are duration-heavy assets that deteriorate during rate-shock scenarios and credit-risk activation. The portfolio has explicitly chosen to avoid clinical-stage and early-stage capital deployment in favor of real assets (agriculture, energy, metals) that benefit from stagflation. Biotech would need either a Fed pivot toward easing or a dramatic de-acceleration of inflation pressure to earn even tier-3 status; neither is available. This is a clean exclusion, not a tactical miss—the system has correctly identified that biotech carries the worst macro fit in the portfolio and allocated zero capital, preserving dry powder for opportunities that align with the current regime.