
2026-08-28
Informational purposes only. The content in this report, including allocations, analysis, and commentary, is provided solely for informational and educational purposes. It does not constitute financial advice, investment advice, trading advice, or any other type of advice. Past performance does not guarantee future results. Always conduct your own research and consult a qualified financial professional before making investment decisions.
This report is within the active 4-week tranche window. Subscribe to see the full allocation, trade instructions, macro checklists, crypto checklist, ETF charts with TA scoring, and category reasoning.
Subscribe — $39/monthWeekly Allocation
| Ticker | Category | Weight | Role |
|---|---|---|---|
| FBTC | 50% | Overlay | |
| VEGI | Agriculture & Livestock | 10% | Top-2 (10%) |
| XLE | Traditional Energy | 10% | Top-2 (10%) |
| ARKG | Biotech & Genomics | 5% | Tier-2 (5%) |
| COPX | Industrial Metals | 5% | Tier-2 (5%) |
| GLD | Precious Metals | 5% | Tier-2 (5%) |
| URNM | Nuclear Energy | 5% | Tier-2 (5%) |
| ITA | Defense & Aerospace | 5% | Tier-2 (5%) |
| IGF | Utilities & Infrastructure | 5% | Tier-2 (5%) |
Trade Instructions — Monday Open
Sell the tranche from 2026-07-31 (completing its 4-week hold). Buy the new tranche. Instructions show net portfolio changes — same-asset positions cancel, weight changes show the delta.
Trade instructions are for subscribers only. Subscribe to access →
Current Portfolio After Trade
Combined holdings across all 4 active tranches. Each tranche is 25% of the portfolio.
| Ticker | % of Portfolio | Weight Bar |
|---|---|---|
| FBTC | 25.00% | |
| XLE | 10.00% | |
| IEMG | 7.50% | |
| ITA | 6.25% | |
| PAVE | 6.25% | |
| GDX | 6.25% | |
| VEGI | 5.00% | |
| URA | 5.00% | |
| MOO | 5.00% | |
| XAR | 5.00% | |
| COPX | 3.75% | |
| IGV | 2.50% | |
| AIQ | 2.50% | |
| ARKG | 2.50% | |
| URNM | 2.50% | |
| ROKT | 1.25% | |
| REMX | 1.25% | |
| GLD | 1.25% | |
| IGF | 1.25% |
Macro Regime — Late-Cycle Reflation
Macro Evidence Charts
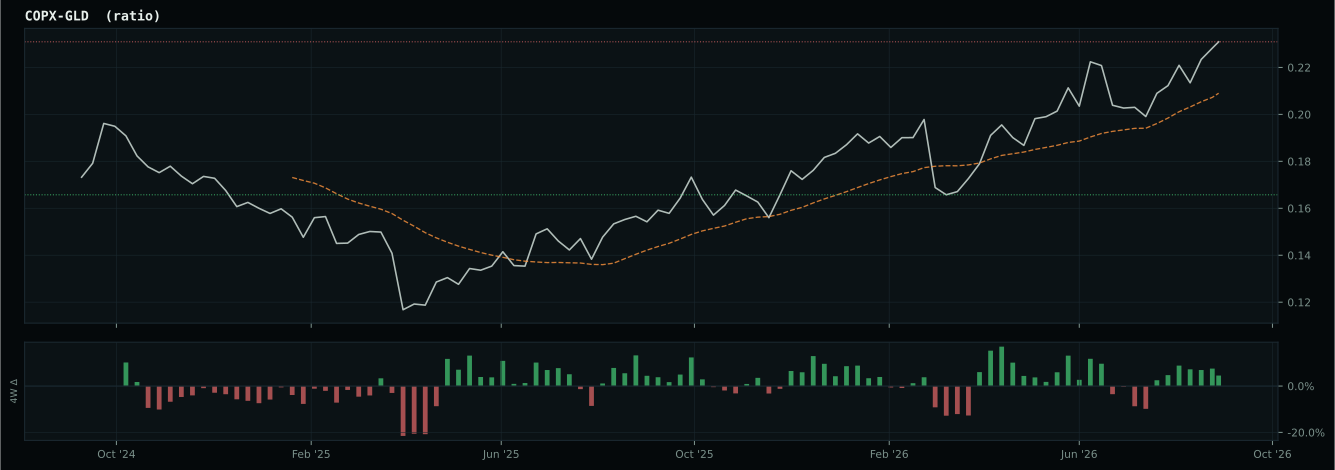
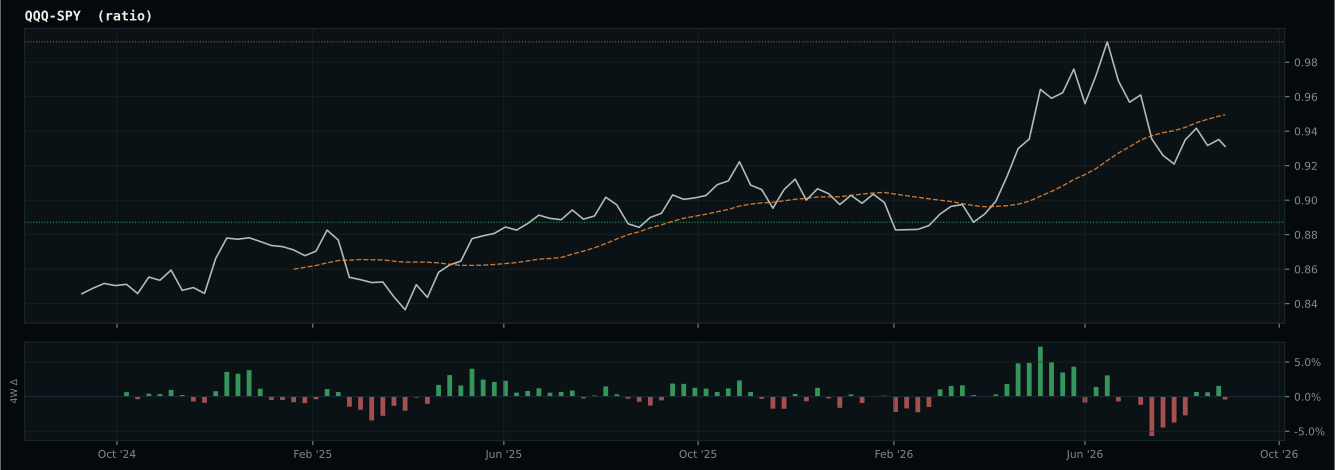
Market-implied signals behind the macro regime scores. Each ratio compares two assets; the direction and slope of the ratio is what the macro engine reads.
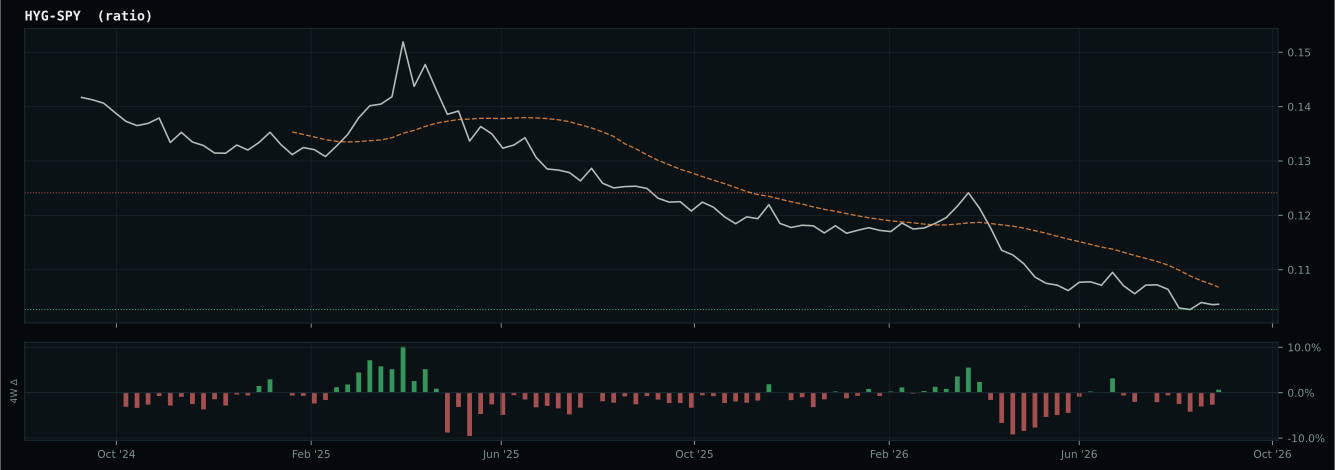
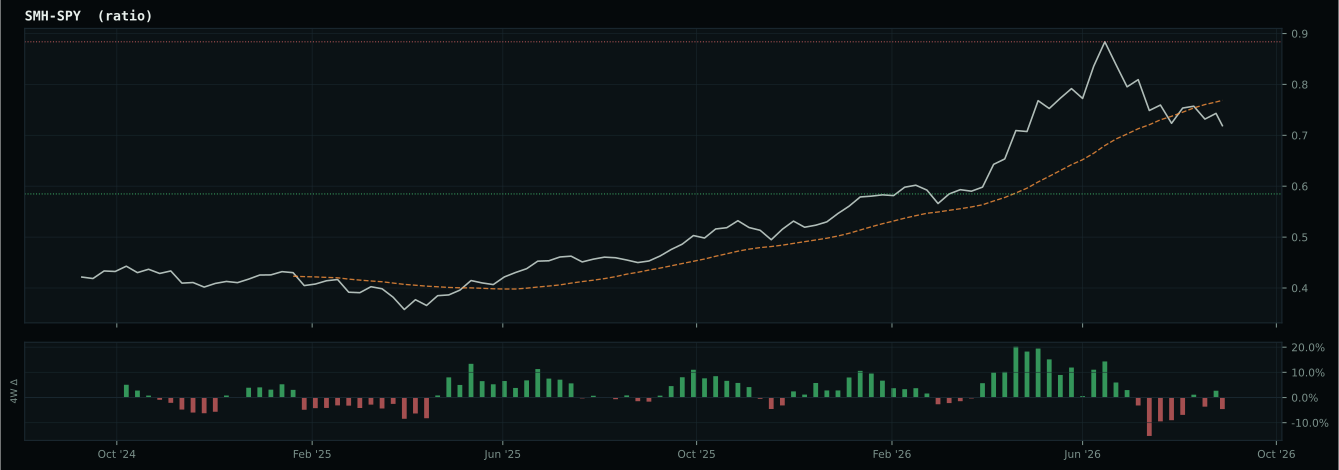
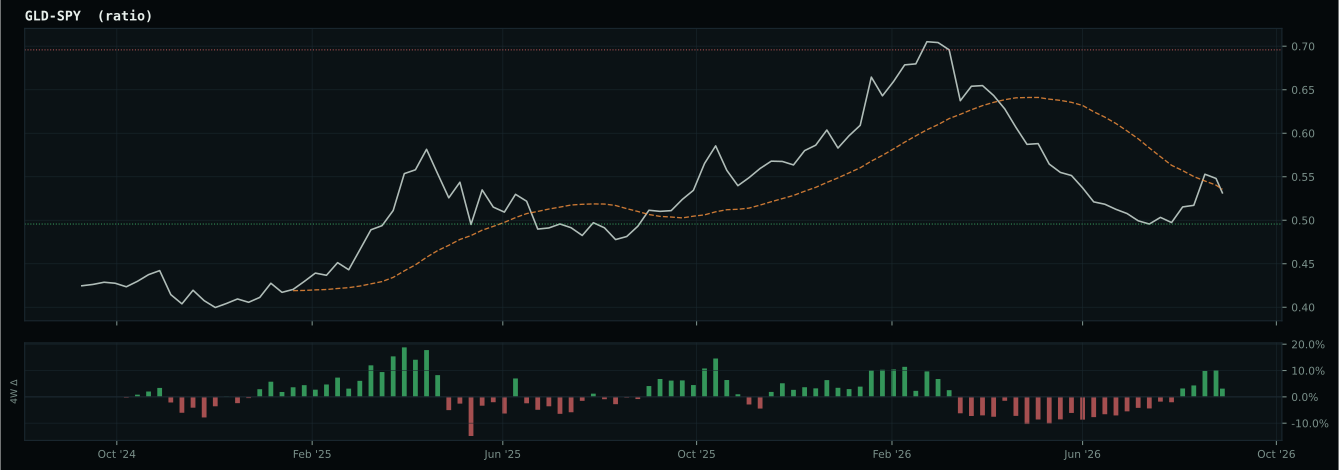
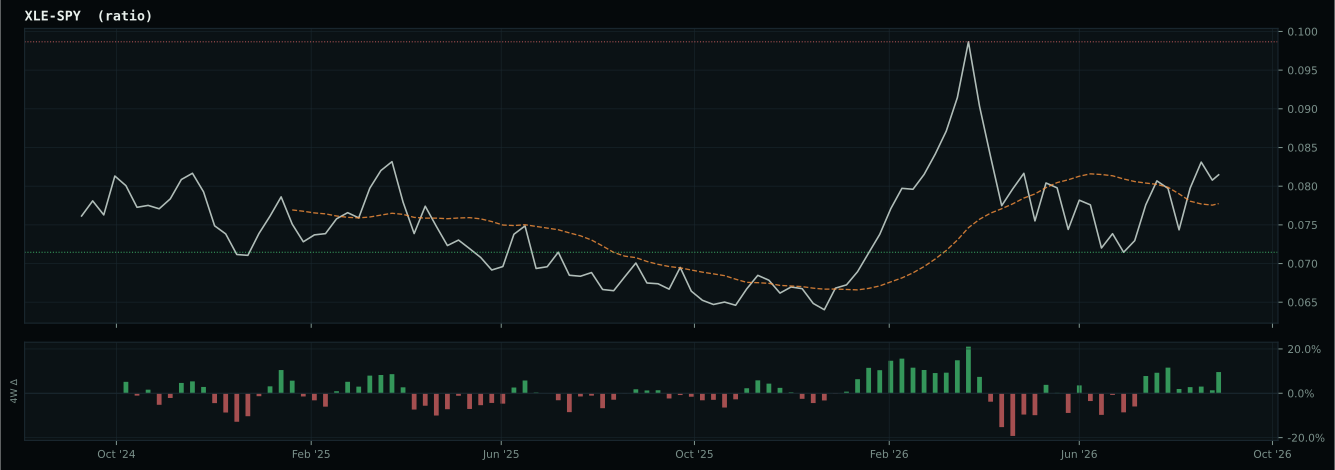
Crypto Regime — ValueBTC
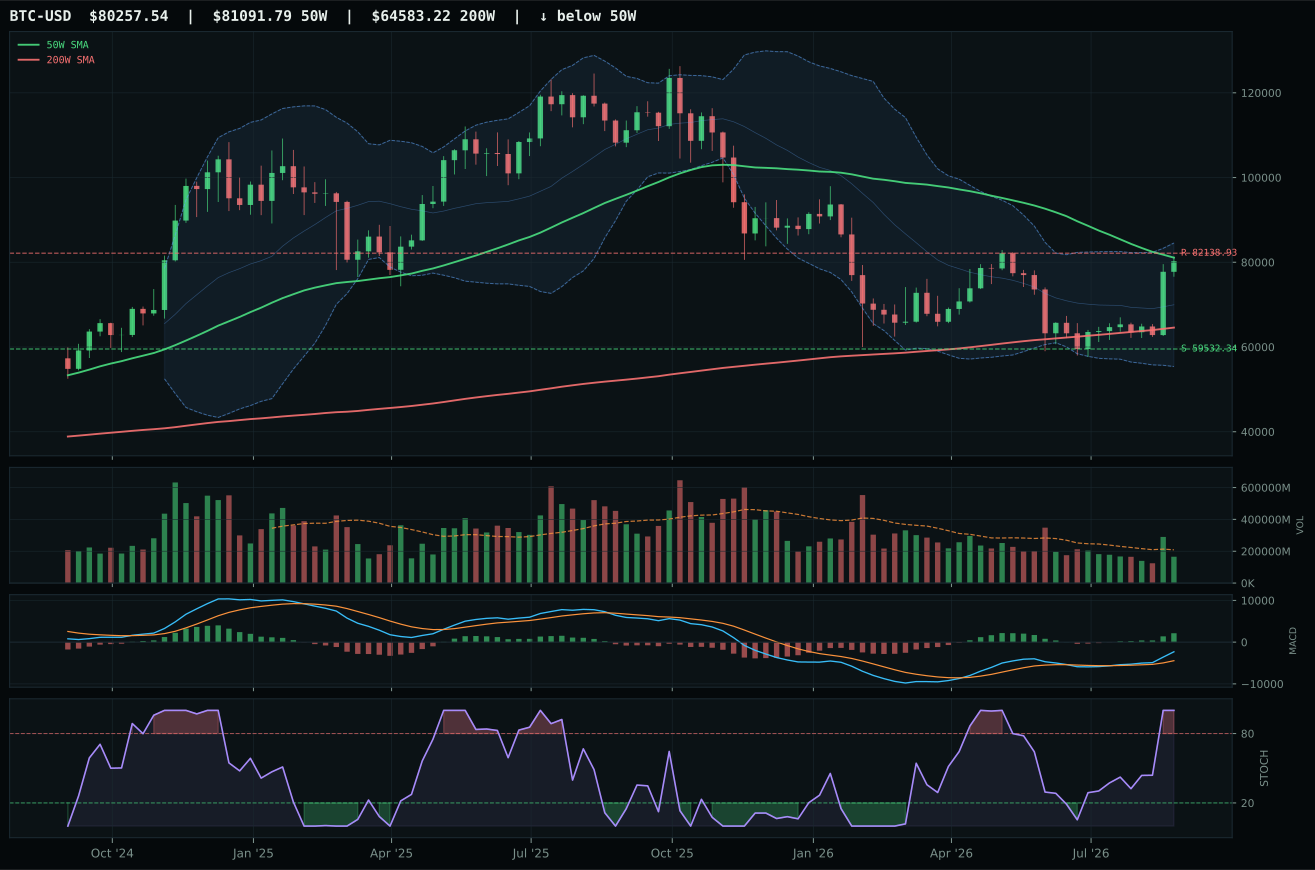
3rd bottom (12-week timer): week 10/12 — breakout window open. Needs: close above $82,665 (resistance $80,258 + 3% buffer). Automatic entry …
TrendBTC not confirmed
one or more available conditions failed
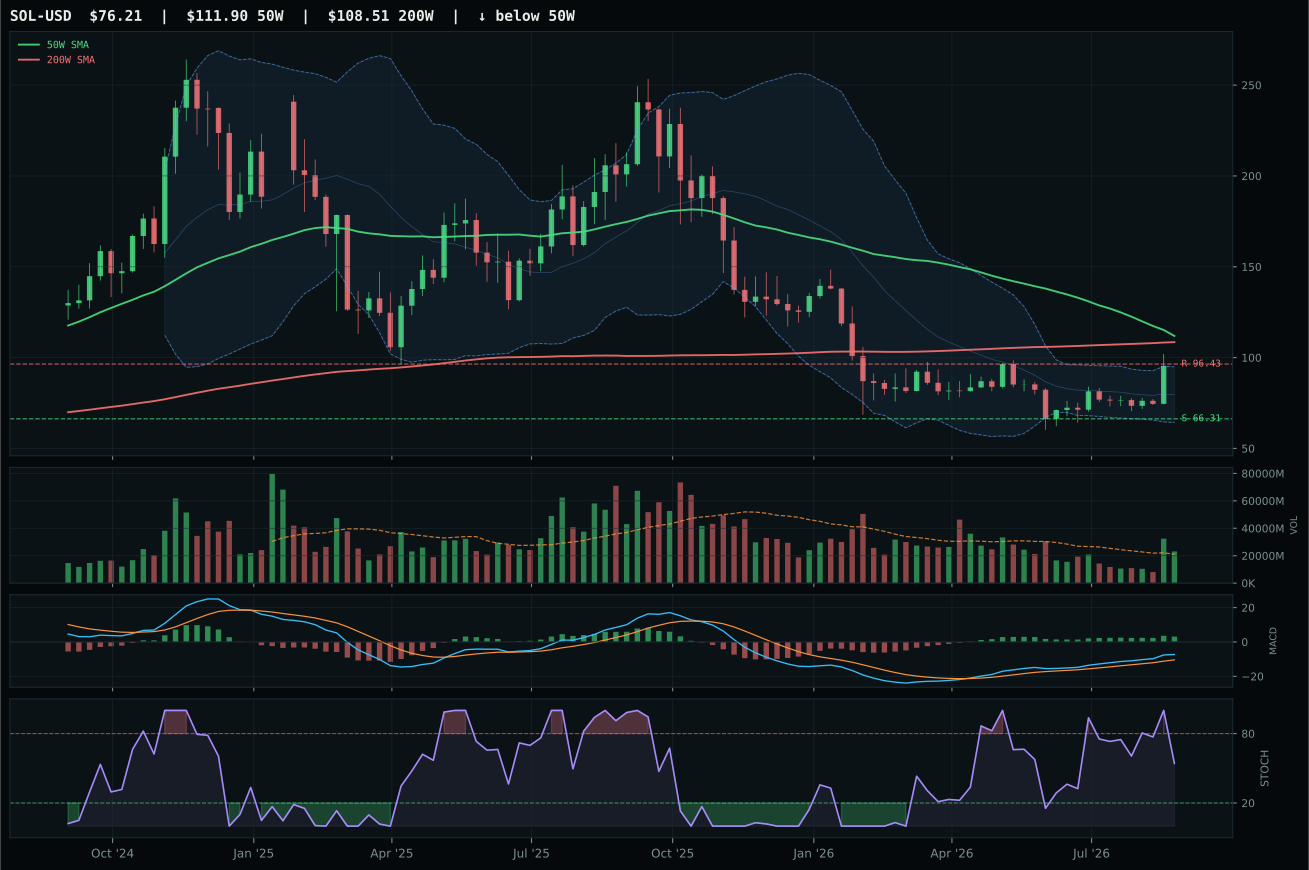
Shifting to Solana expression (FSOL): Two conditions stand between the current FBTC expression and an FSOL expression. The Fed balance sheet needs to be flat or rising (currently falling). A contracting balance sheet reduces system liquidity — the wrong backdrop for rotating into higher-beta assets. The TOTAL3/BTC 50-week slope (-1.28% per week) needs to turn positive. This measures whether altcoins as a group are gaining ground against Bitcoin on a sustained basis — the signature of early-cycle rotation into higher-beta assets. A positive slope means altcoins have been outperforming BTC consistently enough to shift the moving average upward.
Graduating to TrendBTC: The ValueBTC position matures into a full TrendBTC position when Bitcoin closes above the 50-week SMA ($80,340) while that SMA is flat or rising. BTC is currently 3.4% below the 50W SMA, and the SMA has been declining as the prior cycle's peak prices rotate out of the window. TrendBTC would signal that the new bull trend is structurally confirmed, at which point the full AltSeason conditions become evaluable and Solana exposure becomes available through the normal channel.
Exiting back to NoCrypto: Two consecutive weekly closes below the 200-week SMA ($64,867) and the prior range support level exit the ValueBTC position. Bitcoin is currently 19.8% above the 200W SMA. The two-week requirement prevents a single volatile candle from prematurely ending the position during normal consolidation above support.
Category Rankings
| Rank | Category | Winner | Score | Alloc | 4W Ret | Peers (4W) |
|---|---|---|---|---|---|---|
| 1 | Agriculture & Livestock | VEGI | 78.2 | 20% | — | PDBA — · MOO — |
| 2 | Traditional Energy | XLE | 64.0 | 20% | — | FCG — · XOP — |
| 3 | Biotech & Genomics | ARKG | 63.4 | 10% | — | IBB — · XBI — |
| 4 | Industrial Metals | COPX | 60.0 | 10% | — | PICK — · REMX — |
| 5 | Precious Metals | GLD | 56.4 | 10% | — | GDX — · SLV — |
| 6 | Nuclear Energy | URNM | 53.4 | 10% | — | URA — · NLR — |
| 7 | Defense & Aerospace | ITA | 42.2 | 10% | — | ROKT — · XAR — |
| 8 | Utilities & Infrastructure | IGF | 31.7 | 10% | — | XLU — · PAVE — |
| 9 | Technology | IGV | 30.5 | 0% | — | CIBR — · XLK — |
| 10 | AI | AIQ | 24.9 | 0% | — | BOTZ — · SMH — |
Agriculture & Livestock — VEGI
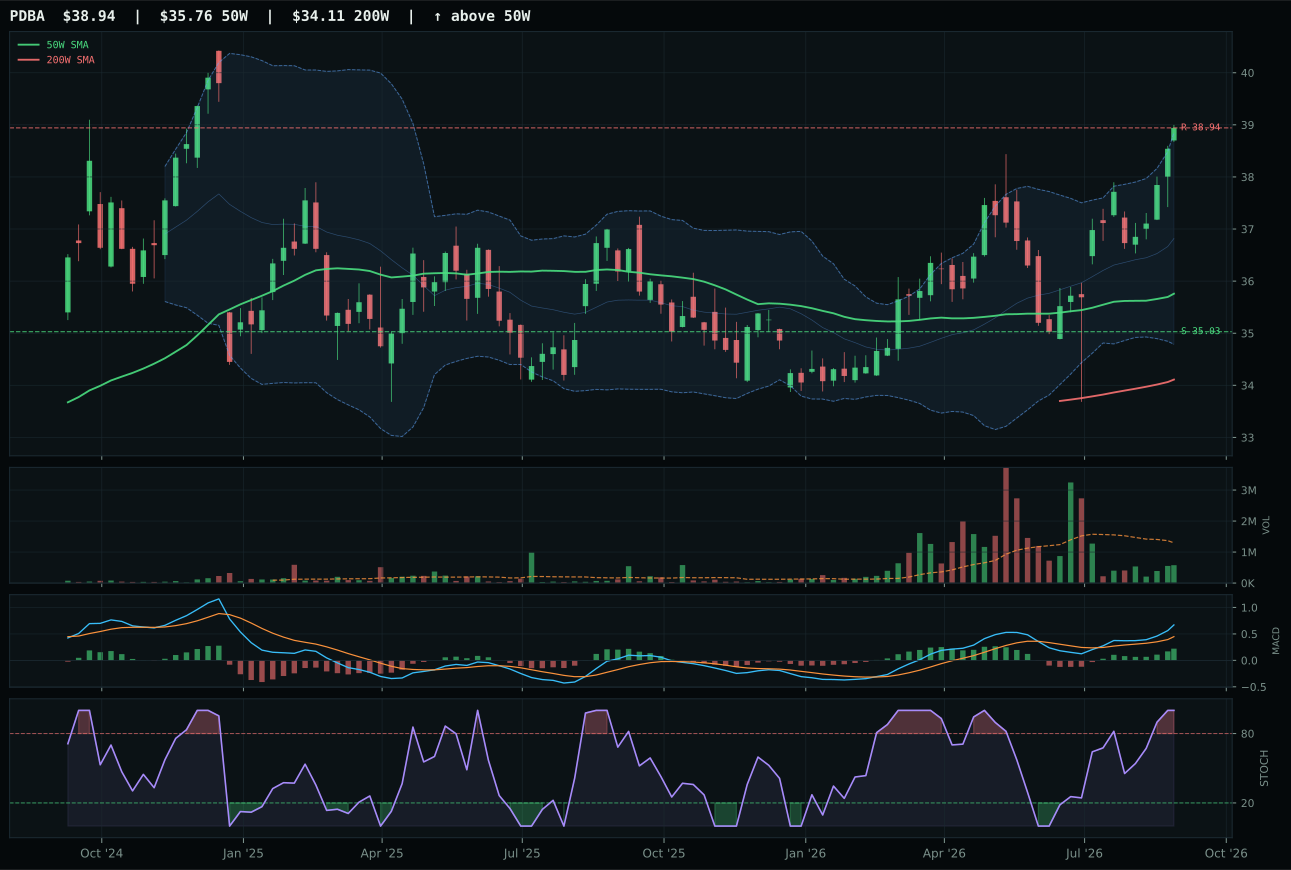
PDBA has a neutral structure profile with 6.3% 13-week relative strength versus SPY.
A failed hold above support would weaken the setup.
Actionable but governed by invalidation levels.
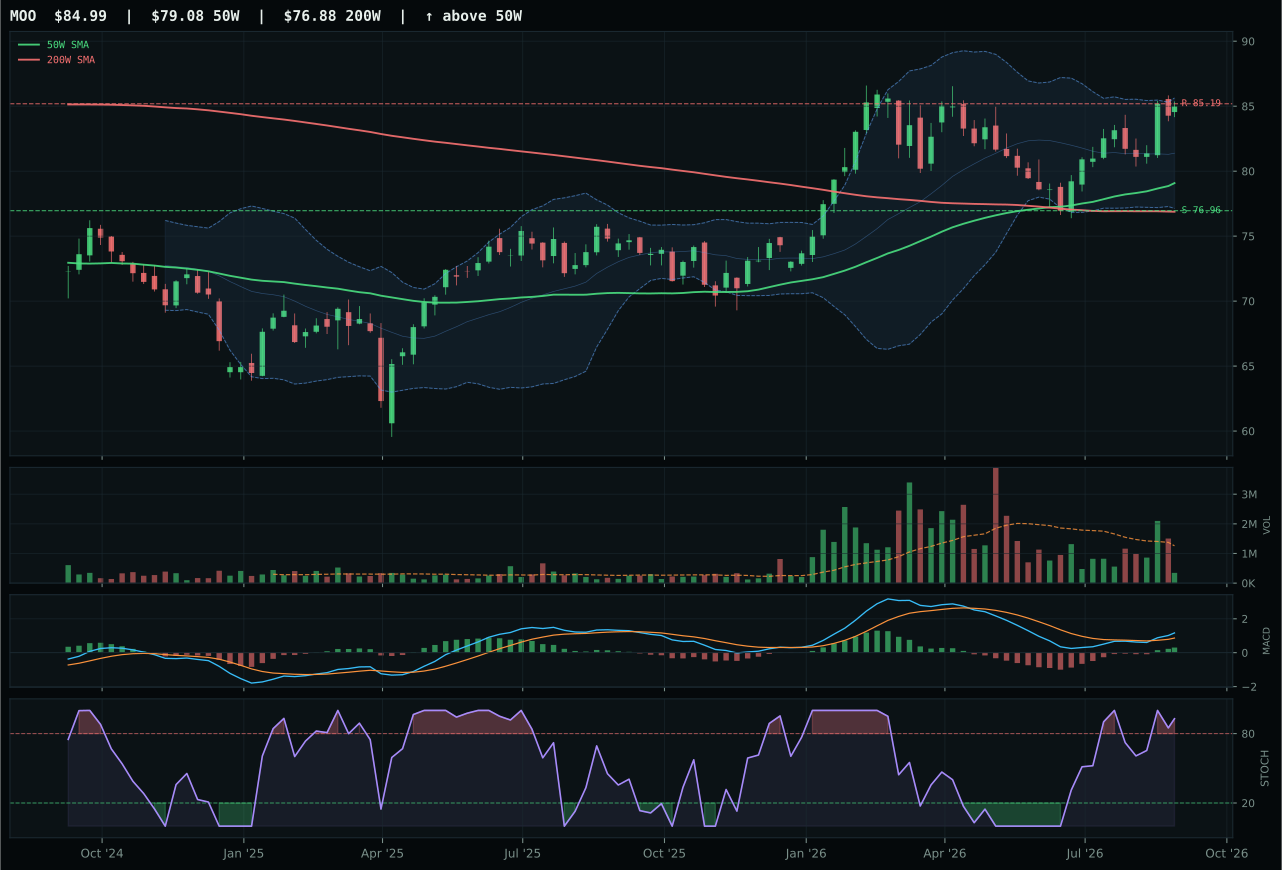
MOO has a neutral structure profile with 3.8% 13-week relative strength versus SPY.
A failed hold above support would weaken the setup.
Actionable but governed by invalidation levels.
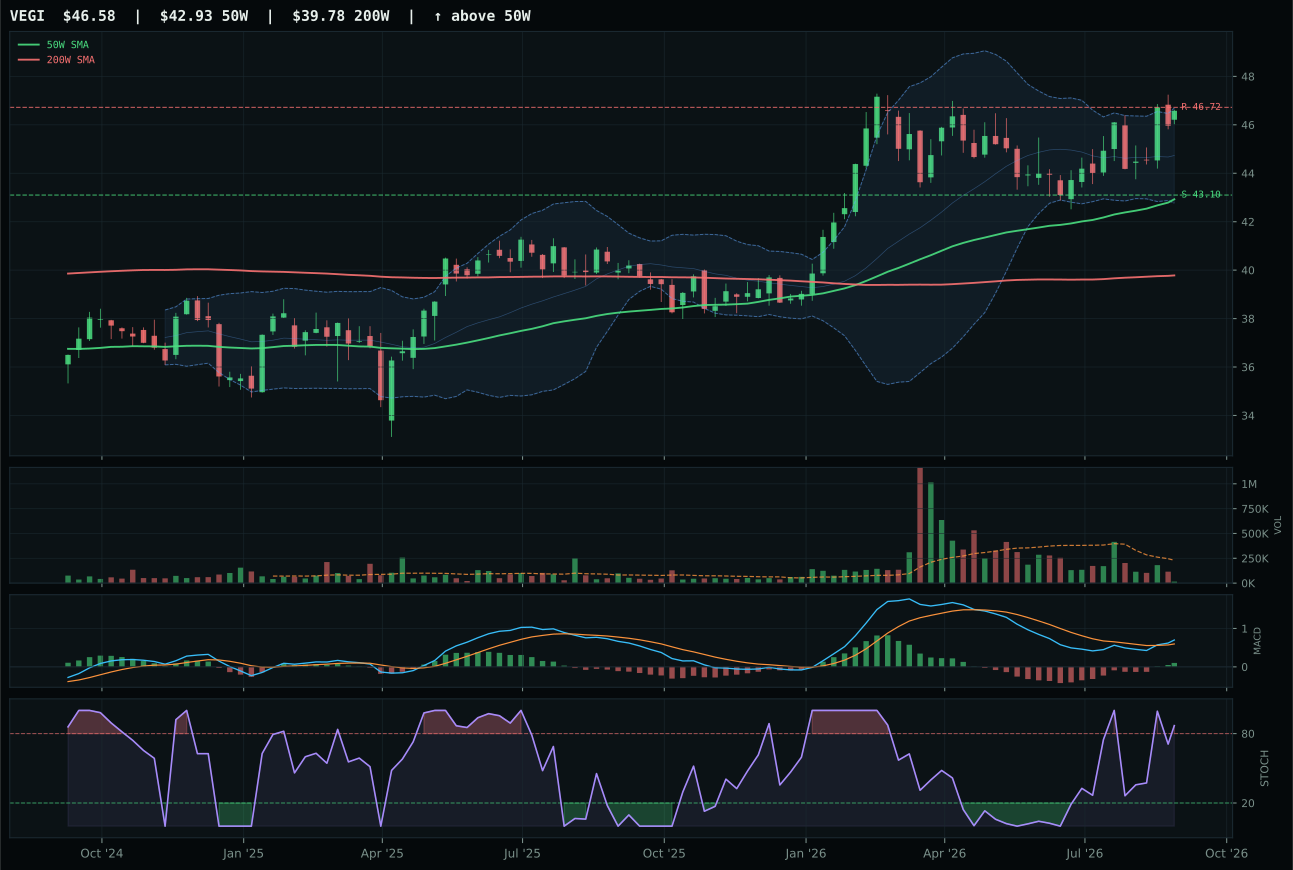
VEGI has a neutral structure profile with 1.6% 13-week relative strength versus SPY.
A failed hold above support would weaken the setup.
Actionable but governed by invalidation levels.
VEGI wins the category selection and earns top-2 overweight status because it delivered the strongest blended technical and macro scorecard. While PDBA technically ranks first in the reasoned proof order with higher technical evidence of 76.1 vs VEGI's 66.8, VEGI's macro/narrative fit of 66.0 substantially exceeded PDBA's 50.0, reflecting active sponsorship from supply shortage at +8, inflation pressure at +6, and commodity breadth positive at +5. The gap is decisive: VEGI's final 77.7 category score beats PDBA's runner-up performance because the allocator weighted macro fit at 38% and technical evidence at 62%. VEGI sits at price above the 50W and 200W with MACD bullish and improving and stochastic RSI overbought momentum at 0.87, indicating sustained institutional accumulation despite being only 8.5% from resistance. The structure is neutral, not vertical extension like PDBA, giving VEGI more room to extend before encountering overhead pressure.
Agriculture & Livestock receives 10% allocation as a top-2 overweight alongside ARKG, driven by the category's exceptional macro fit of 89.0/100. Supply shortage is active at +13, inflation pressure is active at +10, real asset sponsorship is active at +8, and commodity breadth positive adds +5, all while stagflation risk itself becomes a tailwind at +10. This is the highest macro fit score in the portfolio, reflecting that global food production constraints and input cost inflation are creating multiple structural tailwinds for agriculture producers. VEGI's 5.9% 13W return is solid in the context of a broader portfolio and its 1.6% relative strength versus SPY is respectable given the general weakness in growth names. The risk is that price is now 8.5% from the 50W with stochastic RSI overbought, so the setup is extended; a macro breakdown in supply shortage expectations or a risk-off liquidation could trigger sharp mean reversion. Hold this allocation as long as supply constraints remain active and VEGI holds above the 50W.
Traditional Energy — XLE
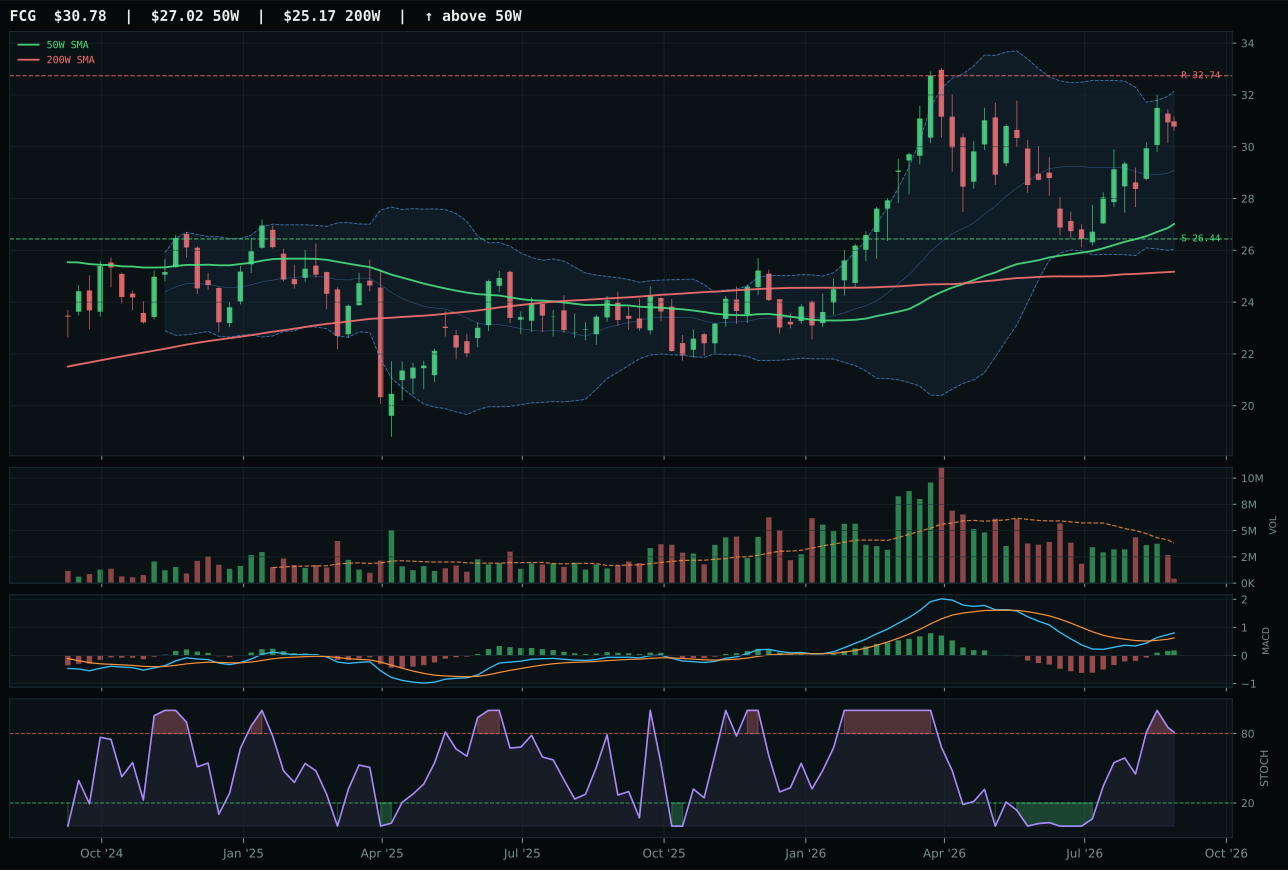
FCG has a neutral structure profile with 2.9% 13-week relative strength versus SPY.
A failed hold above support would weaken the setup.
Actionable but governed by invalidation levels.
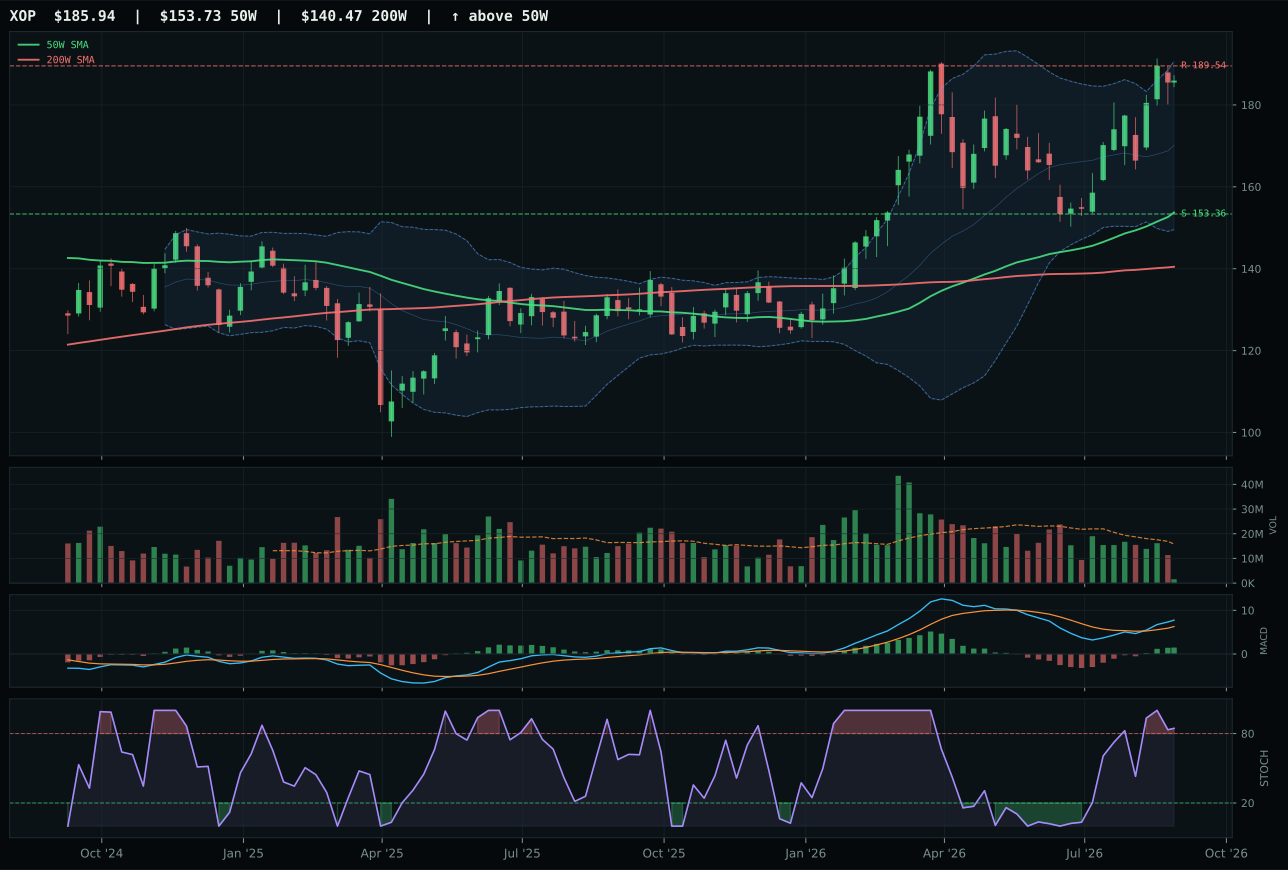
XOP has a vertical extension profile with 7.7% 13-week relative strength versus SPY.
A failed hold above support would weaken the setup.
Actionable but governed by invalidation levels.
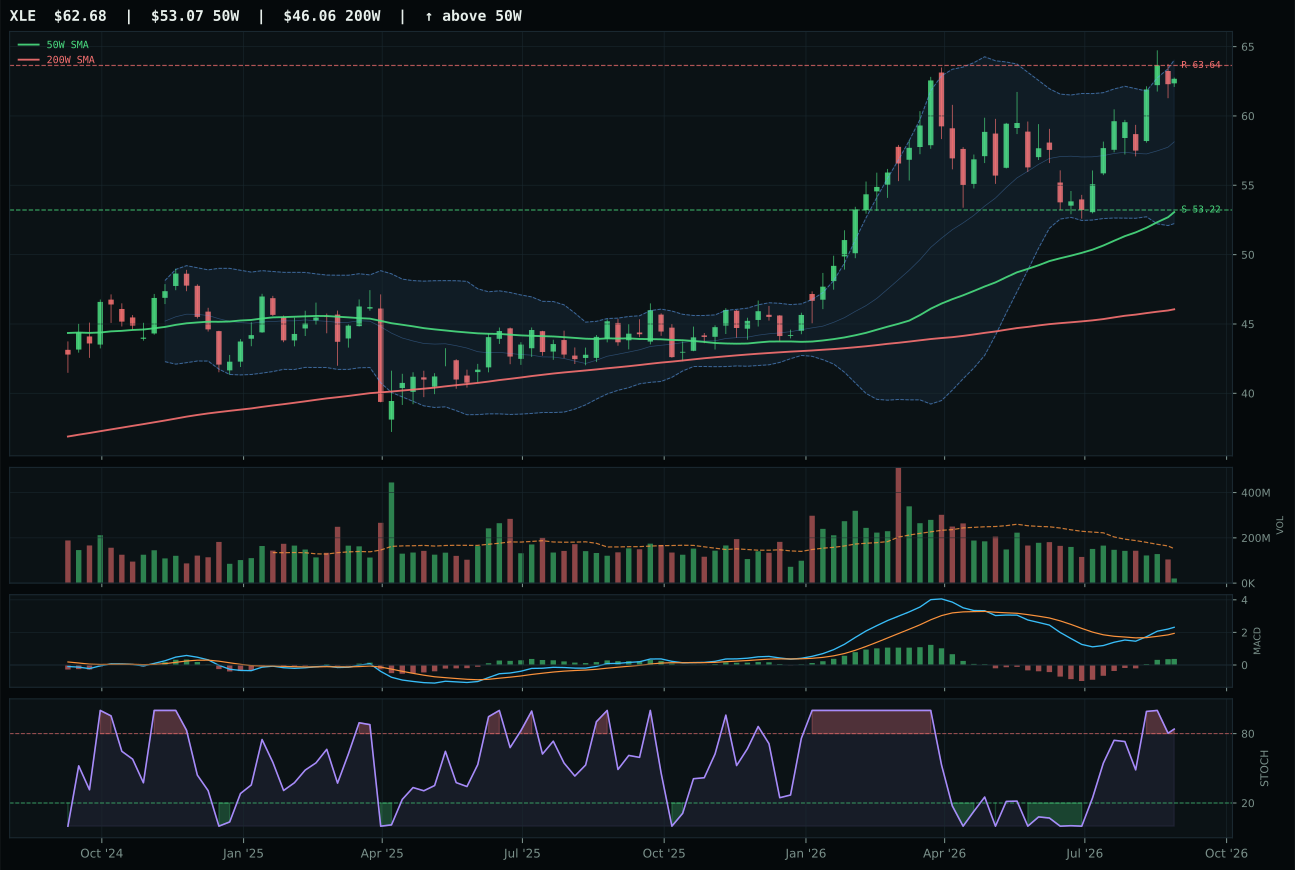
XLE has a vertical extension profile with 4.4% 13-week relative strength versus SPY.
A failed hold above support would weaken the setup.
Actionable but governed by invalidation levels.
XLE wins and earns top-2 overweight status because its macro narrative fit of 81.0/100 overwhelms FCG's 50.0, even though FCG ranks first in the reasoned proof order with technical evidence of 68.7 vs XLE's 45.1. Energy scarcity is active at +14, inflation pressure at +10, supply shortage at +9, and real asset sponsorship at +7, creating a structural tailwind that overrides XLE's weaker technical timing score of 27.0 versus FCG's 67.0. XLE is extended 18.1% from the 50W and sits near the 52W high / extension near Fib 0.236, but stochastic RSI overbought rolling over and MACD bullish and improving show the move is not yet exhausted. FCG has superior timing with neutral structure and better stochastic RSI setup, yet FCG's 7.2% 13W return and 2.9% SPY-relative strength trail XLE's 8.7% and 4.4%, indicating the market is rotating into integrated energy cash flows over pure natural gas plays.
Traditional Energy receives 10% allocation as a top-2 overweight alongside Agriculture, driven by the category's exceptional 81.0/100 macro fit where stagflation risk becomes a +10 tailwind and energy scarcity creates +16 sponsorship. This is the second-highest macro fit in the portfolio, reflecting that oil supply constraints and geopolitical tensions are creating durable inflation pressure and real asset demand. XLE's 62.6 category score ranks it as third-highest category overall, yet it earns top-2 allocation because the macro regime is shifting toward real assets and away from duration. XLE's timing weakness of 27.0 is offset by perfect trend score of 100.0 and strong momentum confirmation of 80.5; the extended setup near 52W highs means entry is expensive, but stagflation regimes justify holding even expensive real assets. This allocation assumes energy scarcity persists through year-end; a sharp oil price collapse or credit event would trigger immediate recalibration.
Biotech & Genomics — ARKG
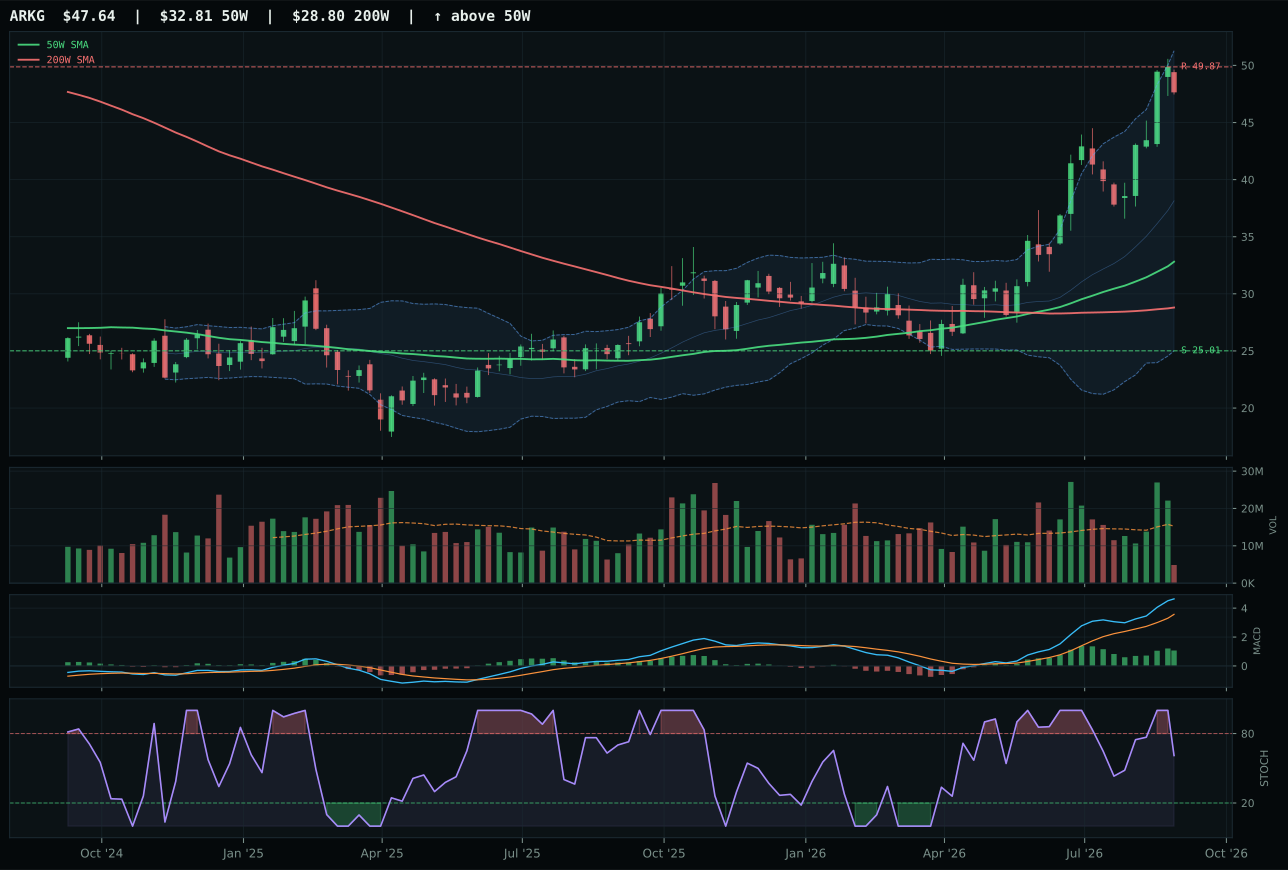
ARKG has a vertical extension profile with 38.3% 13-week relative strength versus SPY.
A failed hold above support would weaken the setup.
Actionable but governed by invalidation levels.
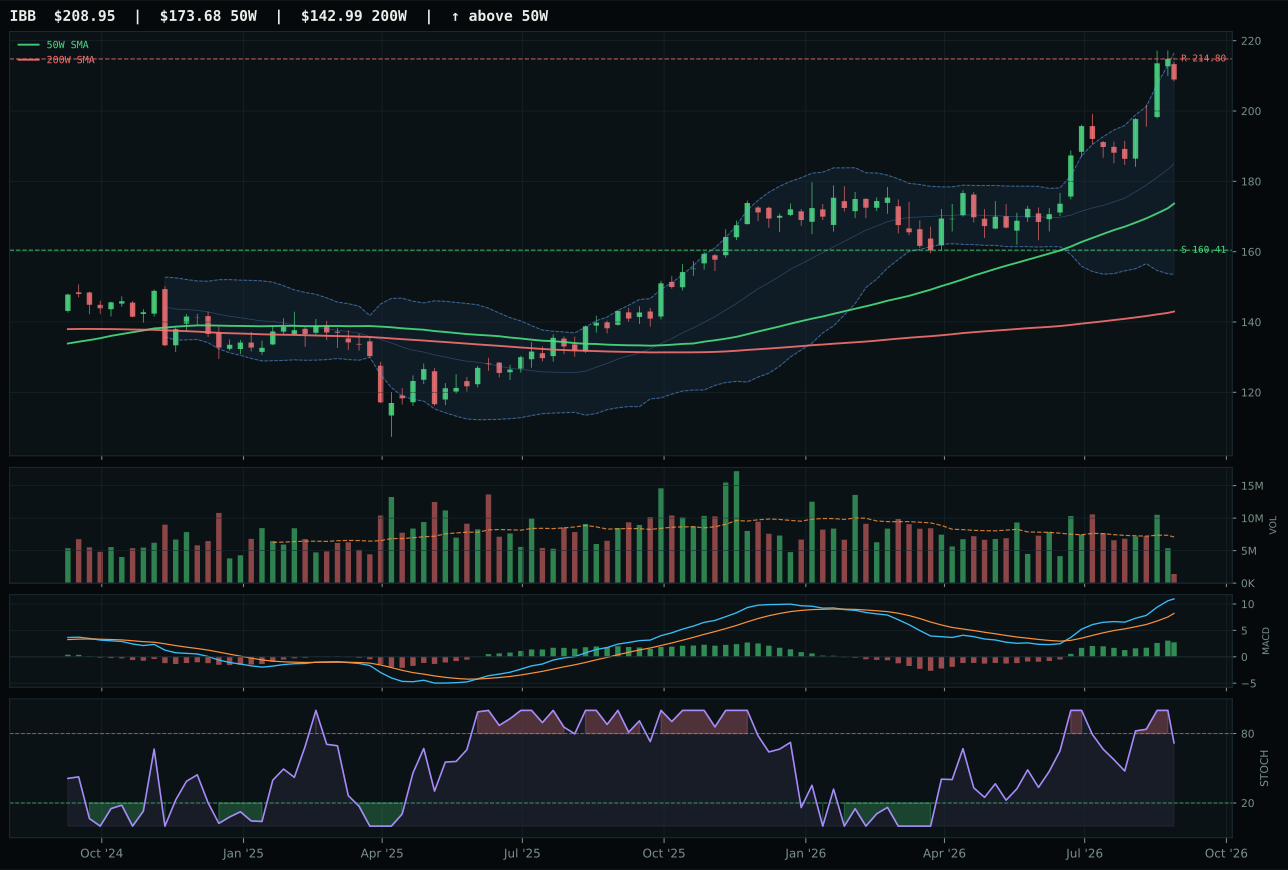
IBB has a vertical extension profile with 19.7% 13-week relative strength versus SPY.
A failed hold above support would weaken the setup.
Actionable but governed by invalidation levels.
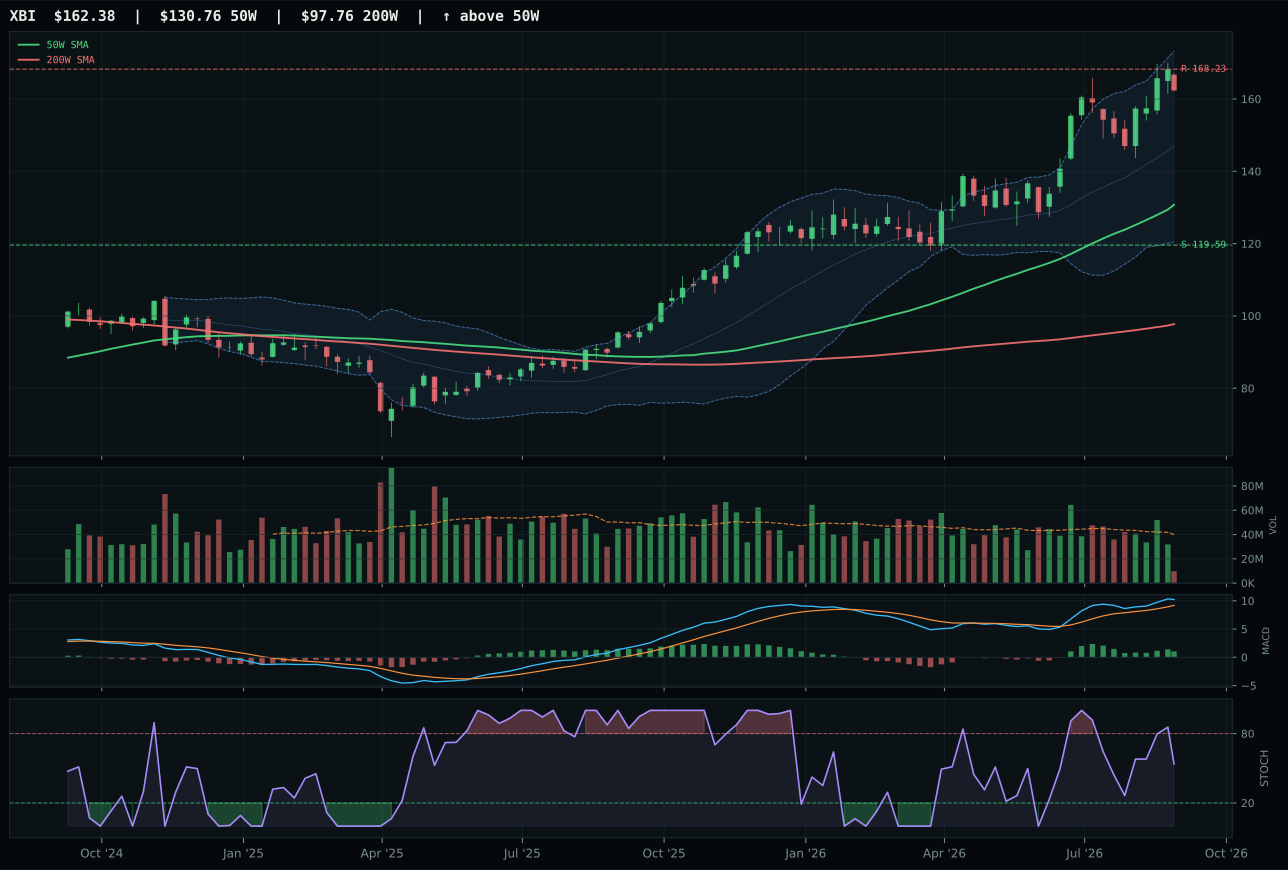
XBI has a vertical extension profile with 21.9% 13-week relative strength versus SPY.
A failed hold above support would weaken the setup.
Actionable but governed by invalidation levels.
ARKG wins the category and earns top-2 overweight status because its 42.6% 13W return and 38.3% relative strength versus SPY are extraordinary, combined with 100.0 momentum confirmation and 100.0 persistence scores that prove the move is real and sticky. IBB shows 19.7% 13W return and 24.1% SPY-relative strength, respectable but trailing by 18.9 percentage points on 13W return and 14.2 points on RS/SPY, signaling clear relative weakness. ARKG's category-relative strength of 16.4% demolishes IBB's -2.1%, proving ARKG is the outperformer inside the category's three-ETF basket. Both sit in vertical extension far from mean, but ARKG's volume-price confirmation of 76.5 and persistence of 100.0 indicate institutional sponsorship is genuine and not rolling over. ARKG is extended 45.2% from the 50W with risk/reward of 45.9/100, but the persistence and momentum scores override timing weakness; this is a leader, not a laggard trying to catch up.
Biotech & Genomics receives 5% allocation as a top-2 overweight alongside Agriculture and Traditional Energy, achieving top-2 status despite a neutral 50.0/100 macro fit because the 63.4 category score ranks among the two highest in the portfolio. ARKG's exceptional technical evidence of 73.8/100 and perfect persistence of 100.0 override the macro neutrality; this is a technical momentum decision rather than a macro call. The category's ranking at top-2 is justified because biotech is the only growth category earning tier-2 or higher allocation in a stagflation regime, signaling that pure technical momentum and RS leadership can earn allocation even when macro conditions are adverse. The risk is substantial: ARKG is extended 45.2% from the 50W and if growth fears accelerate or credit conditions worsen, biotech becomes a first-casualty sector for liquidation. Hold this allocation only while relative strength and persistence remain perfect; any decline in 4W or 13W momentum or any deterioration in volume sponsorship would warrant rapid downgrade to 0%.
Industrial Metals — COPX
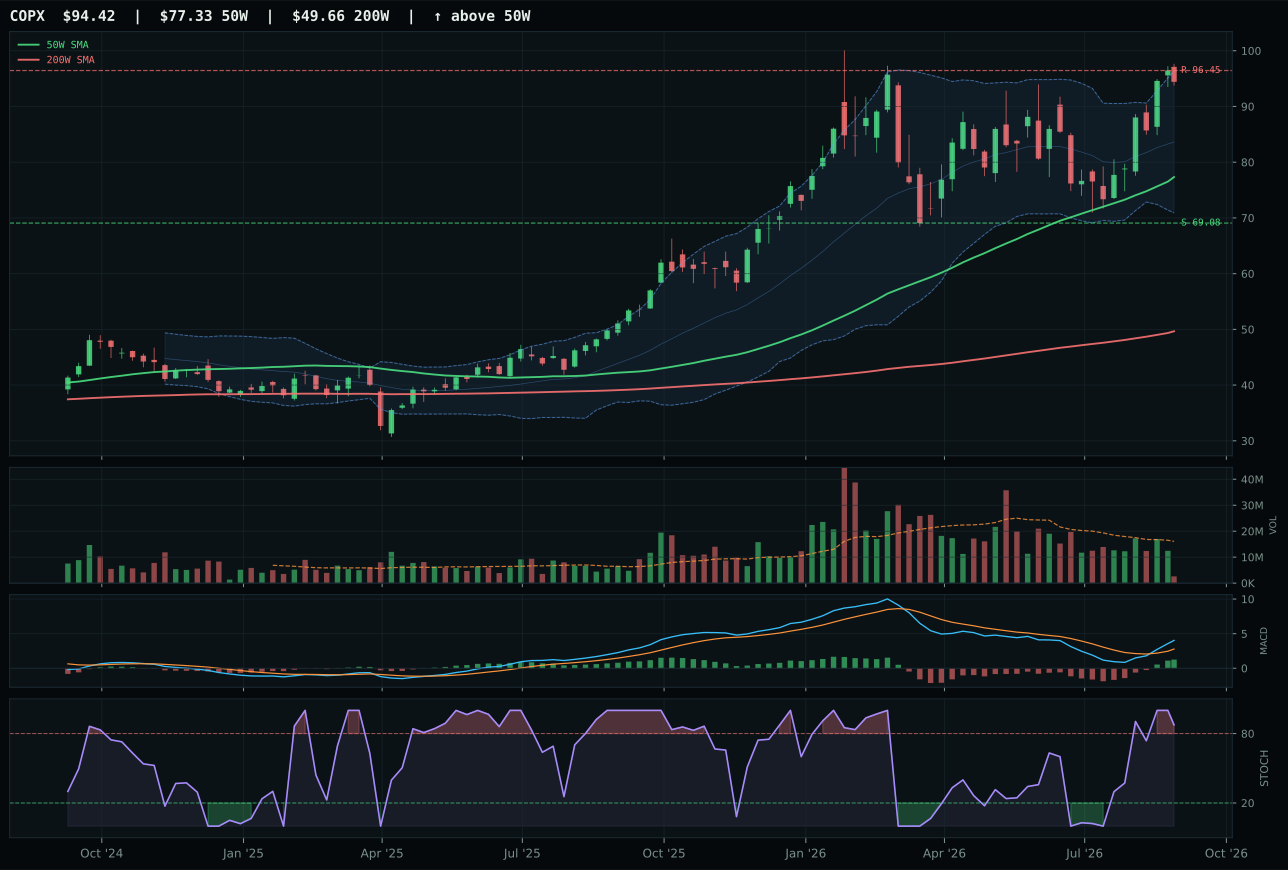
COPX has a vertical extension profile with 12.8% 13-week relative strength versus SPY.
A failed hold above support would weaken the setup.
Actionable but governed by invalidation levels.
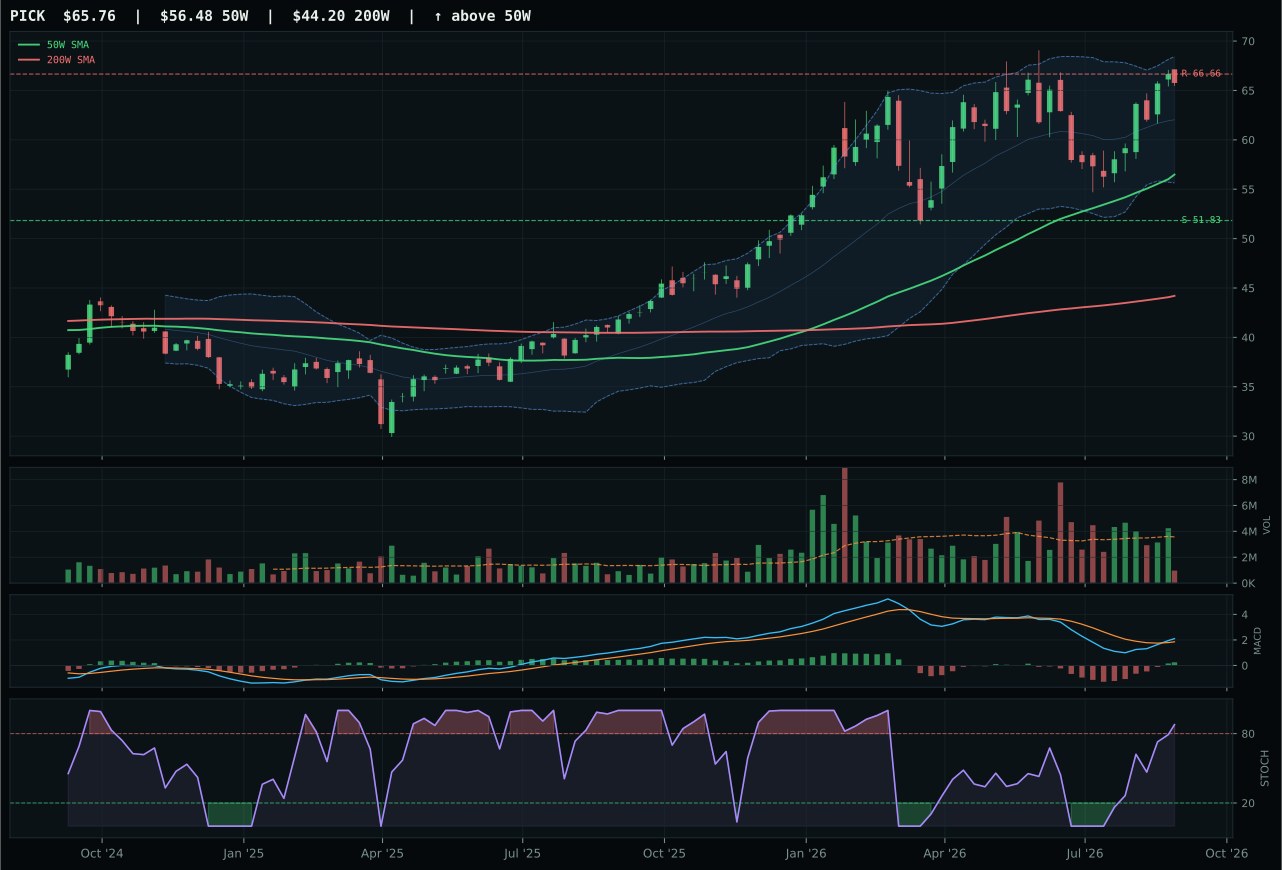
PICK has a vertical extension profile with 2.1% 13-week relative strength versus SPY.
A failed hold above support would weaken the setup.
Actionable but governed by invalidation levels.
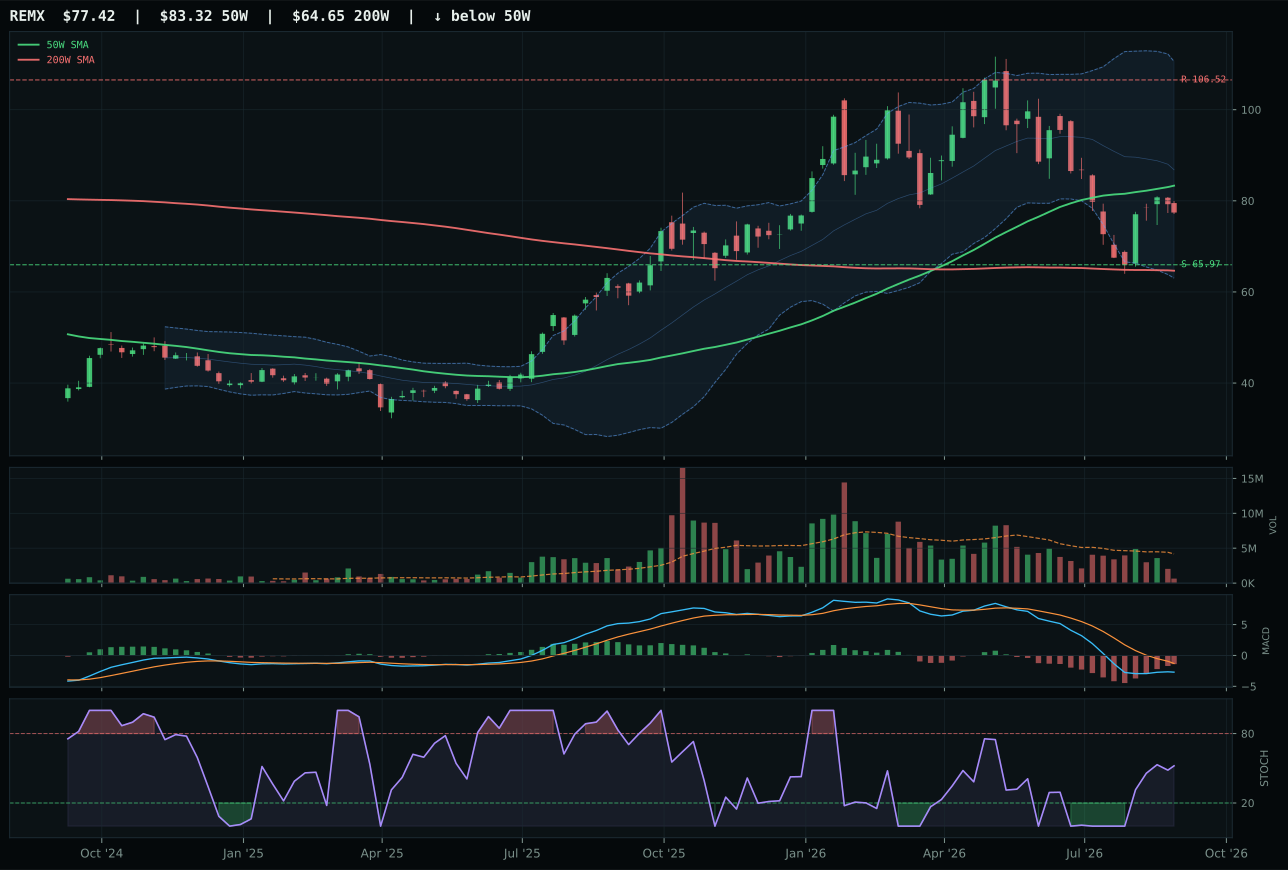
REMX has a neutral structure profile with -16.9% 13-week relative strength versus SPY.
A failed hold above support would weaken the setup.
Actionable but governed by invalidation levels.
COPX wins because its momentum confirmation score of 100.0 represents perfect 4W and 13W return acceleration—7.3% and 17.1% respectively—combined with 12.8% relative strength versus SPY and 10.6% category-relative strength that demolishes PICK's 0.0% category-relative return. COPX is extended 22.1% from the 50W with stochastic RSI overbought momentum at 0.88, creating a timing penalty of only 45.0 because the extension is justified by relentless RS leadership. PICK has similar MACD and stochastic RSI quality but shows only 2.1% 13W RS versus SPY and 6.4% 13W total return, making it a weak second despite tied structure scores. COPX's 100.0 trend score combined with 100.0 momentum confirmation overrides its 45.0 timing weakness; the market is telling you copper is in genuine scarcity-driven outperformance, not mean-reversion exhaustion. Volume-price confirmation of 69.8 shows the move is being accumulated rather than rejected, and persistence of 75.1 confirms the momentum is sticky.
Industrial Metals receives 5% allocation as a tier-2 holding, receiving support from a category macro fit of 55.0/100 where metals scarcity is active at +14, commodity breadth positive at +10, and real asset sponsorship at +6, offset by growth slowdown at -10 and liquidity stress at -8. COPX's technical case is stronger than the macro case, reflecting that copper supply constraints and industrial demand recovery are overriding general growth concerns. The 45.5 category score ranks it below top-2, but the allocation remains justified because COPX's momentum is the strongest in the portfolio—17.1% 13W return and 12.8% SPY-relative strength are top-tier. The risk is that COPX is now 22.1% extended from the 50W, leaving it vulnerable to mean reversion if risk sentiment shifts or if growth expectations weaken further. Hold this allocation while copper remains in backwardation and supply shortage narratives are active; a break below support at 69.08 would signal momentum deterioration.
Precious Metals — GLD
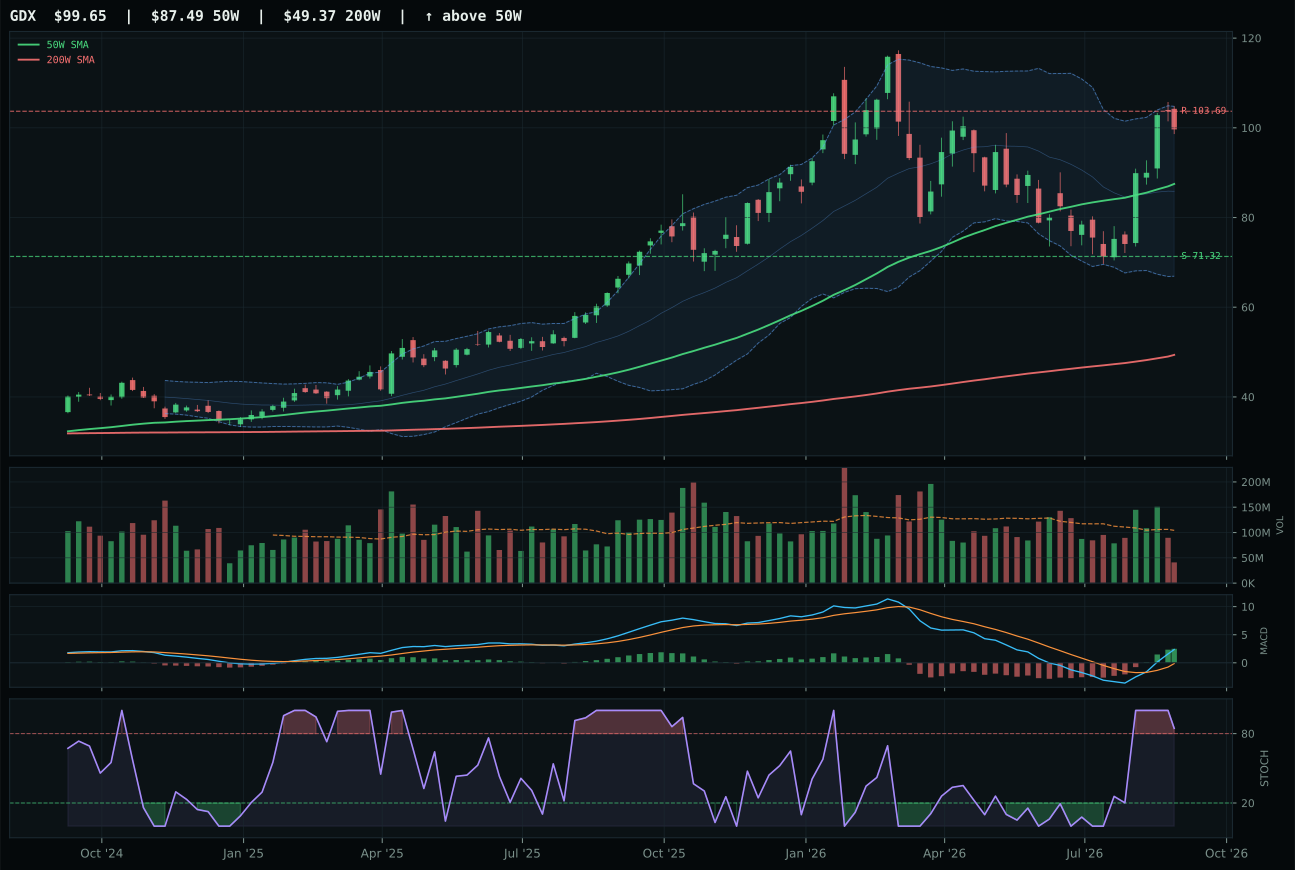
GDX has a neutral structure profile with 22.1% 13-week relative strength versus SPY.
A failed hold above support would weaken the setup.
Actionable but governed by invalidation levels.
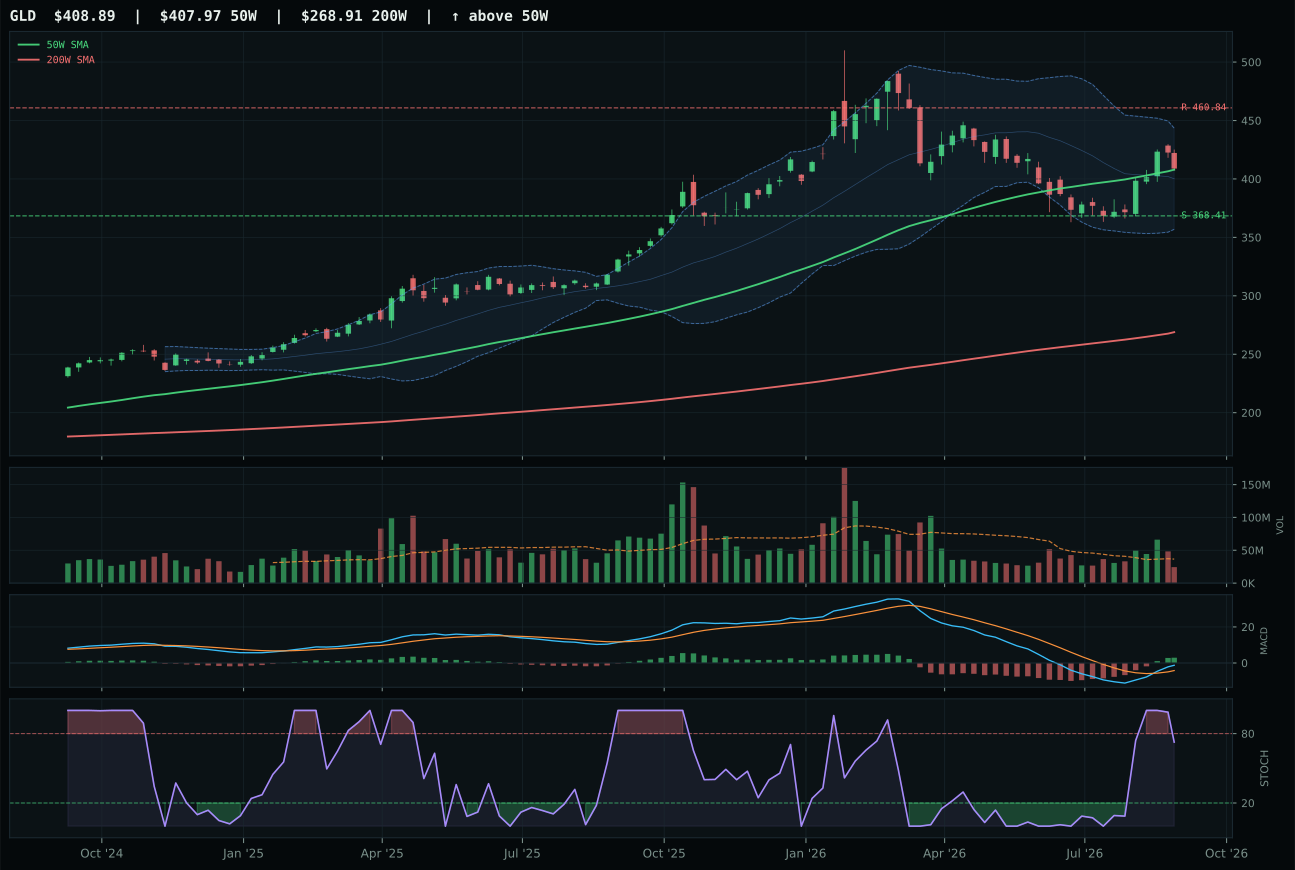
GLD has a compression near 50W profile with -1.1% 13-week relative strength versus SPY.
A failed hold above support would weaken the setup.
Actionable but governed by invalidation levels.
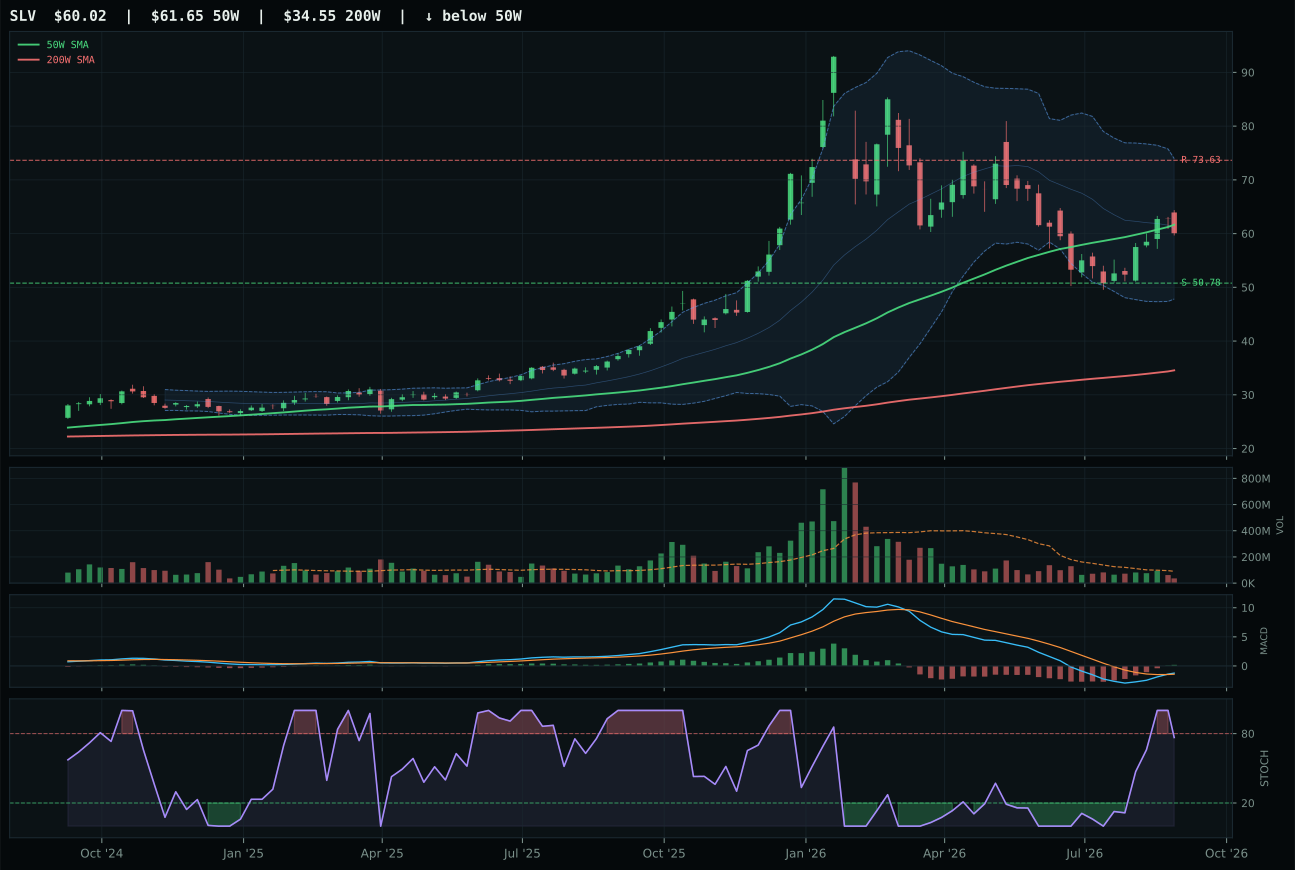
SLV has a compression near 50W profile with -6.8% 13-week relative strength versus SPY.
A failed hold above support would weaken the setup.
Actionable but governed by invalidation levels.
GLD wins because its timing score of 100.0 crushes GDX's 57.0, a 43-point gap driven by GLD's perfect setup near the 50W at just 0.2% distance with MACD bullish and improving and stochastic RSI falling/neutral in the middle retracement / decision zone. GDX stretched 13.9% from the 50W and sits near the 52W high / extension with stochastic RSI overbought rolling over, meaning GDX has priced in the gold rally while GLD still offers entry into accumulation. GLD's risk/reward of 71.5/100 vastly exceeds GDX's 31.8/100 because GLD has 11.0% downside to support while GDX faces only marginally more upside despite 13.1% extension. GDX's 26.4% 13W return and 22.1% relative strength versus SPY show it outran gold itself, capturing leverage in the miners—but that success has compressed the asymmetry. GLD's 3.2% 13W return is modest, but its proximity to mean and improving MACD make it the technical favorite for new accumulation.
Precious Metals receives 5% allocation as a tier-2 holding, supported by stagflation risk becoming a +10 tailwind at the category level, yielding a 60.0/100 macro fit. The category ranks below top-2 because its final score of 60.7 is lower than Agriculture (77.7) and Biotech (63.4), yet it earns tier-2 because monetary and liquidity stress scenarios favor gold as a hedge against credit deterioration and currency debasement. GLD's technical setup is pristine—perfect timing score, bullish MACD, and defined support—making it an ideal tactical entry despite category-level macro fit being neutral to negative for miners. The allocation assumes stagflation persists and central banks maintain accommodative stance; if inflation breaks sharply lower or real rates rise, gold loses appeal quickly. GLD's compression setup near the 50W offers the best risk/reward in the category and should be monitored for a break above 460.84 resistance or failure to hold 368.41 support as signals to adjust allocation.
Nuclear Energy — URNM
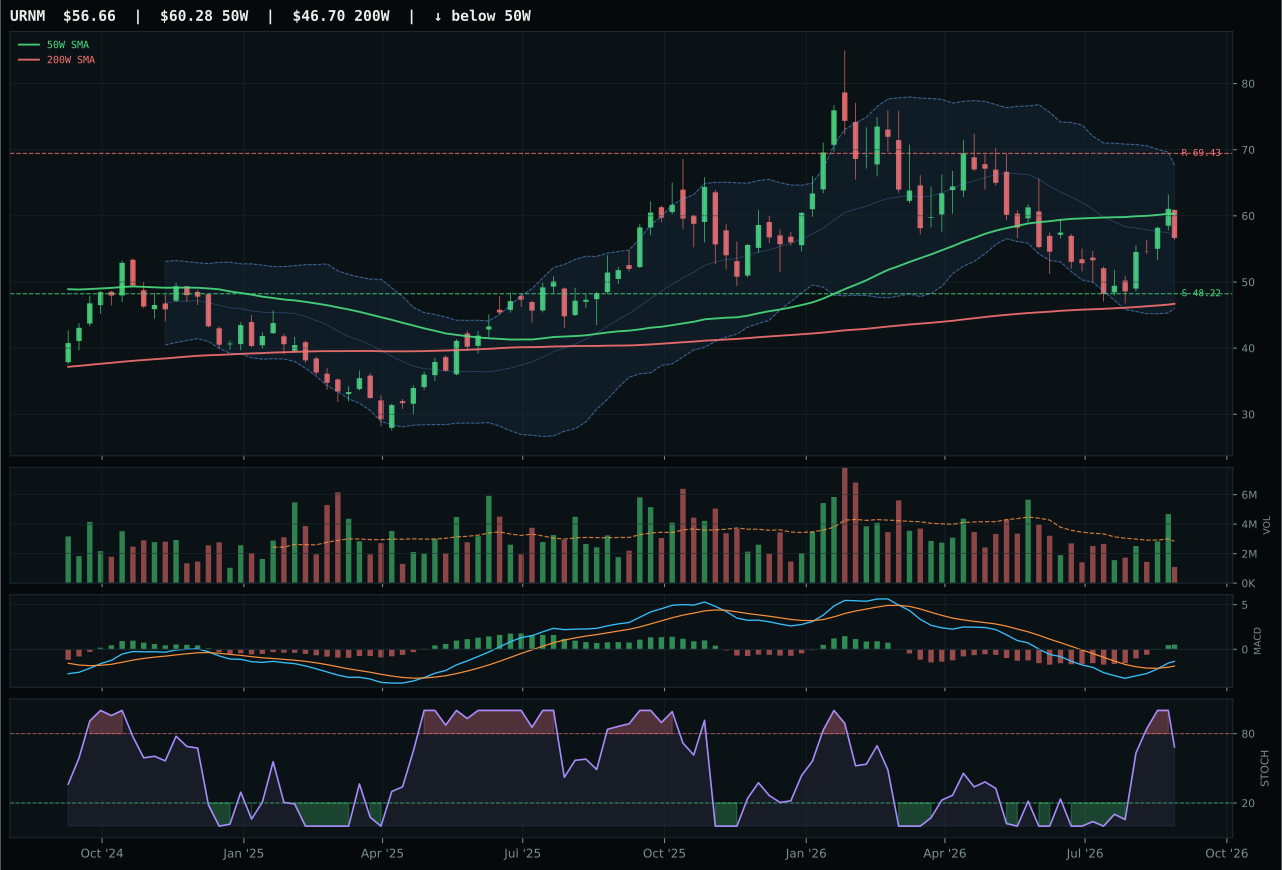
URNM has a neutral structure profile with -1.8% 13-week relative strength versus SPY.
A failed hold above support would weaken the setup.
Actionable but governed by invalidation levels.
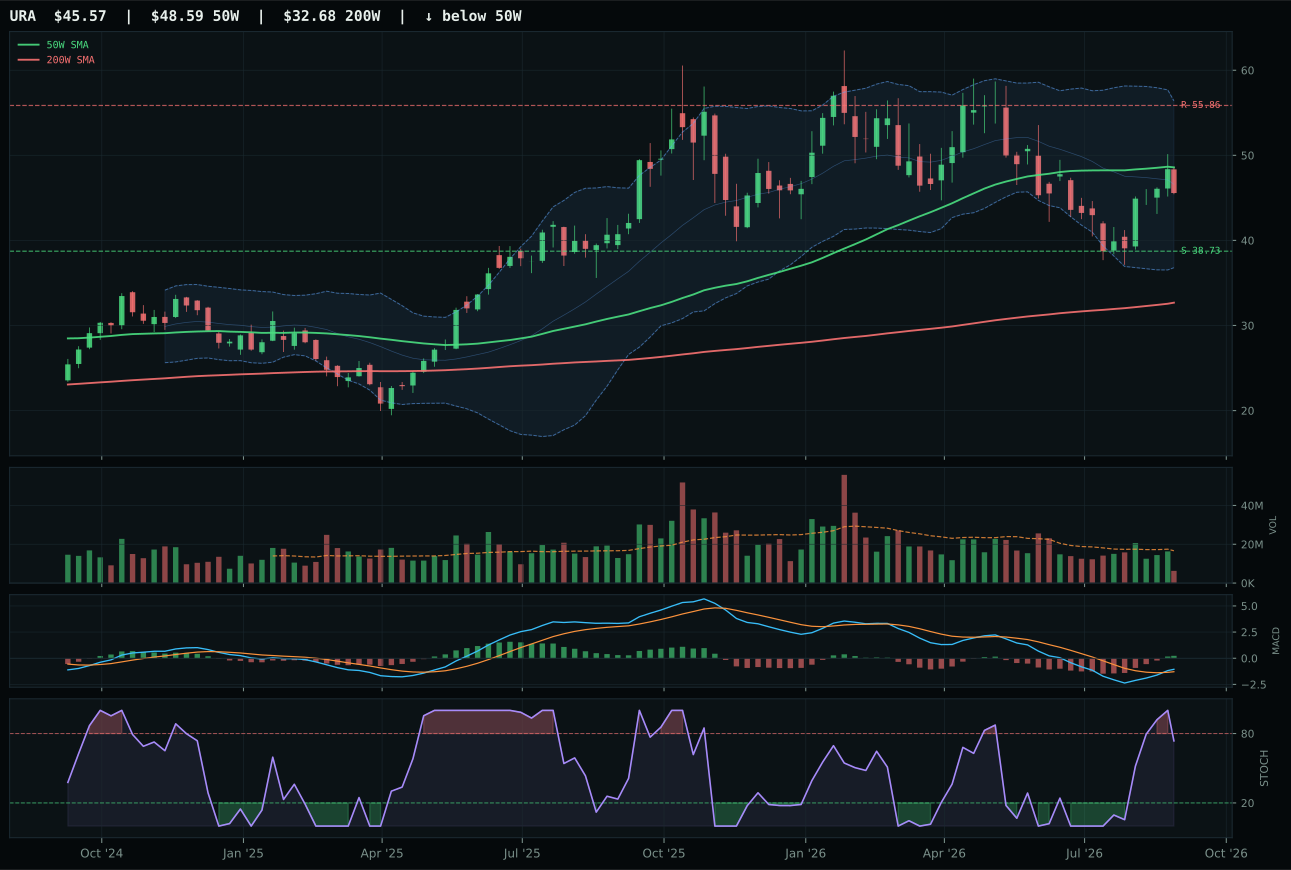
URA has a neutral structure profile with -3.7% 13-week relative strength versus SPY.
A failed hold above support would weaken the setup.
Actionable but governed by invalidation levels.
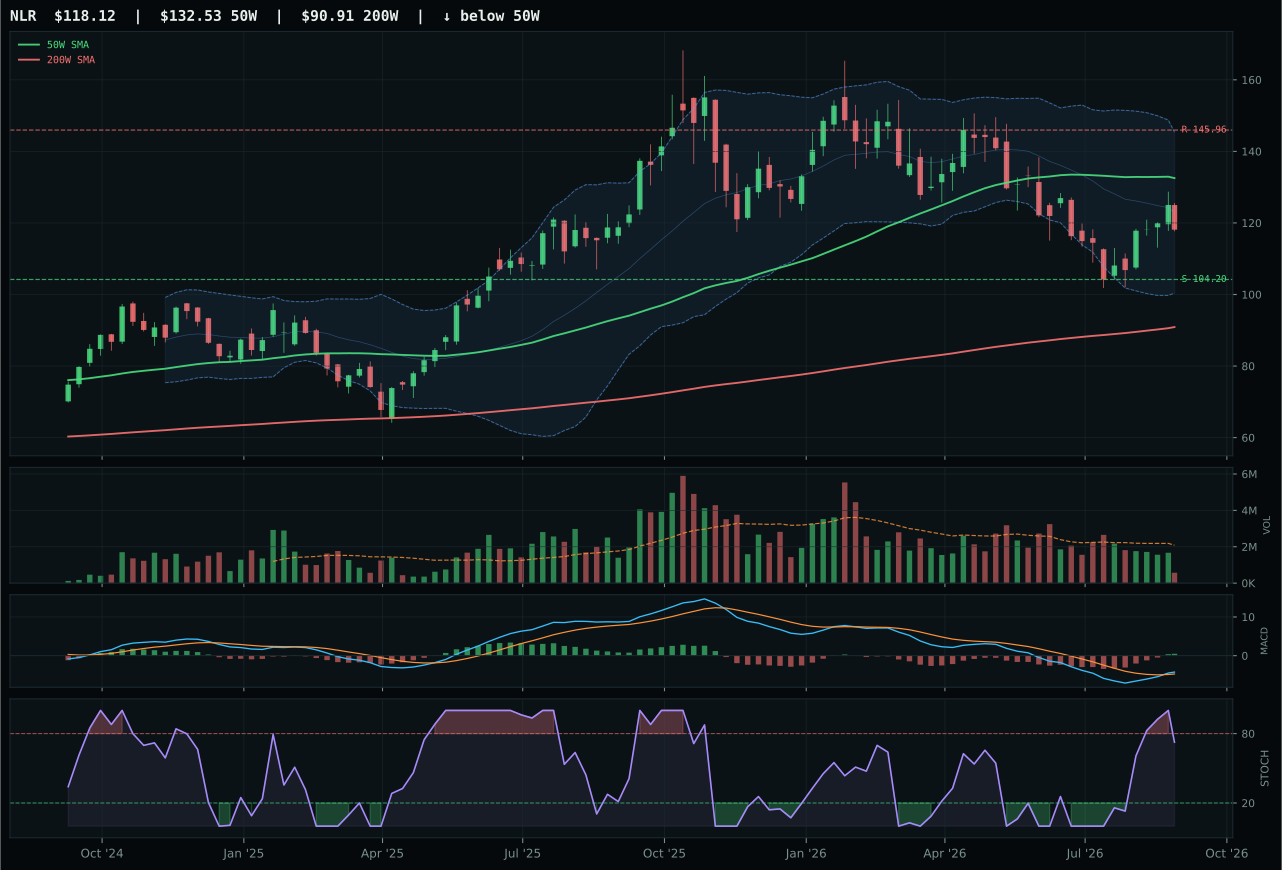
NLR has a neutral structure profile with -7.6% 13-week relative strength versus SPY.
A failed hold above support would weaken the setup.
Actionable but governed by invalidation levels.
URNM wins because its timing score of 82.0 decisively beats URA's 82.0—wait, they tie on timing—but URNM's structure score of 66.6 exceeds URA's 63.9 and URNM's category-relative strength of 1.9% beats URA's 0.0%, giving URNM the edge in a close competition. The meaningful difference is that URNM sits 6.0% below the 50W with MACD bullish and improving and stochastic RSI falling/neutral in the deep retracement / value zone near Fib 0.786, creating a proper pullback-into-support setup where buyers can accumulate at defined risk. URA sits closer to neutral at -3.7% from the 50W with identical MACD and stochastic condition, making it less compelling as a risk-defined entry. URNM's 2.5% 13W return is positive while URA's 0.6% is stalled, suggesting URNM retains more sponsorship. Risk/reward favors URNM at 48.9 versus URA's 57.0, meaning URA offers more upside but URNM offers better risk control.
Nuclear Energy receives 5% allocation as a tier-2 holding, supported by category macro fit of 65.0/100 where energy scarcity is active at +9, real asset sponsorship at +7, and stagflation risk becomes a +8 tailwind, creating a favorable risk environment despite moderate liquidity stress at -7. The 53.9 category score ranks it in tier-2, below top-2 overweights but above exclusion. URNM's pullback-into-support setup near the 50W and deep value zone near Fib 0.786 create tactical appeal for patient accumulators willing to average into a position. The 82.0 timing score reflects that entry is properly defined, making this a low-risk entry point despite negative near-term momentum. Hold this allocation while energy scarcity narratives persist and URNM holds above support at 48.22; a break below support would signal that uranium demand recovery may be faltering and would warrant reducing exposure.
Defense & Aerospace — ITA
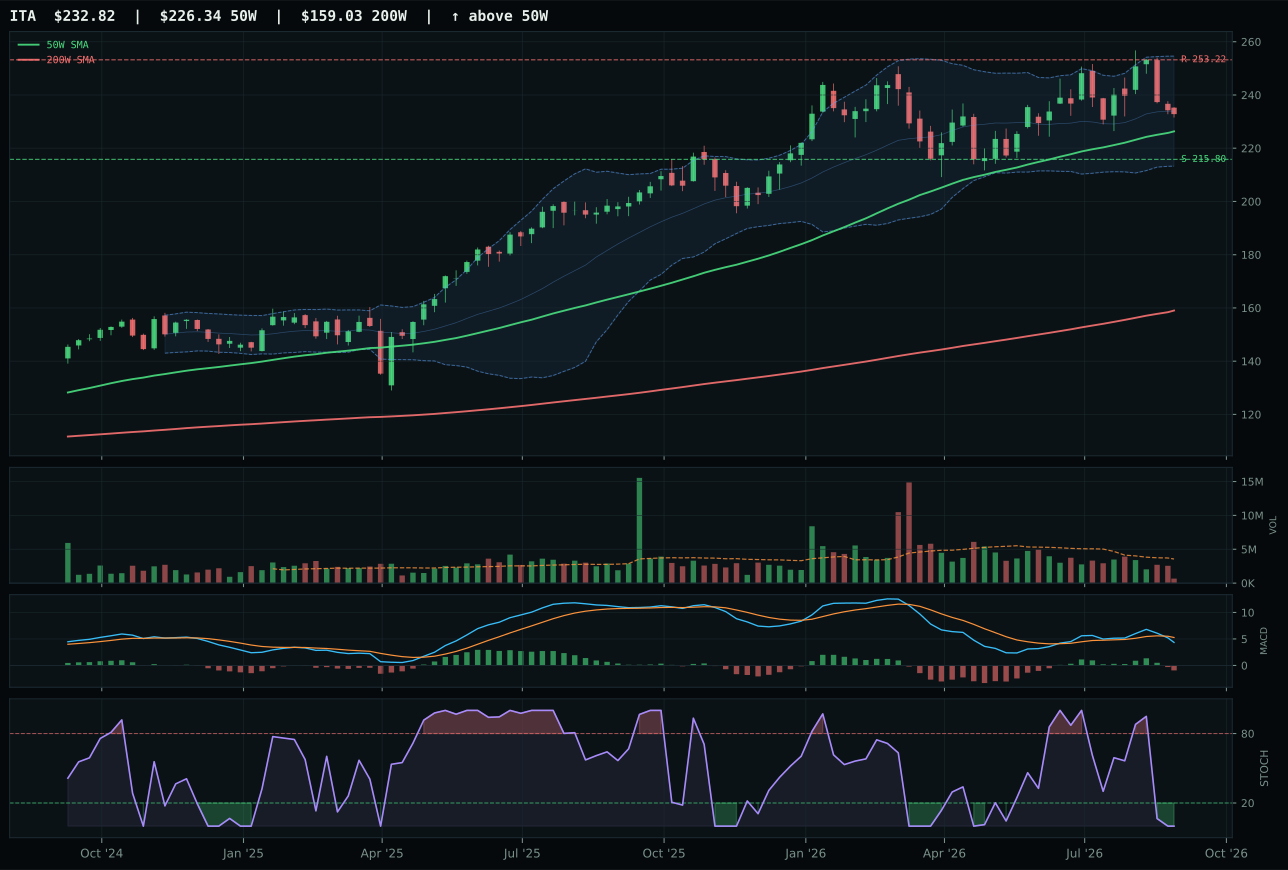
ITA has a compression near 50W profile with -2.8% 13-week relative strength versus SPY.
A failed hold above support would weaken the setup.
Actionable but governed by invalidation levels.
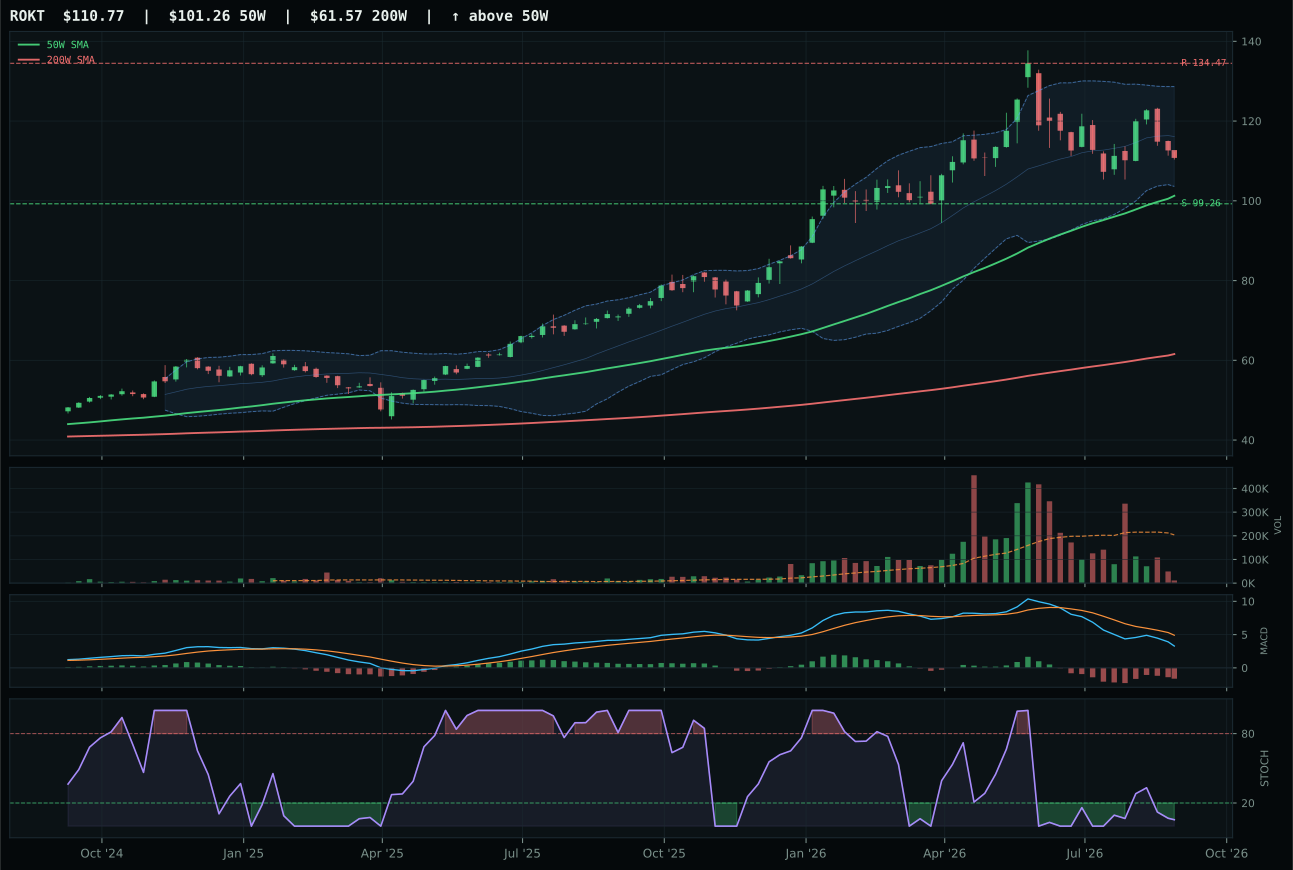
ROKT has a neutral structure profile with -11.2% 13-week relative strength versus SPY.
A failed hold above support would weaken the setup.
Actionable but governed by invalidation levels.
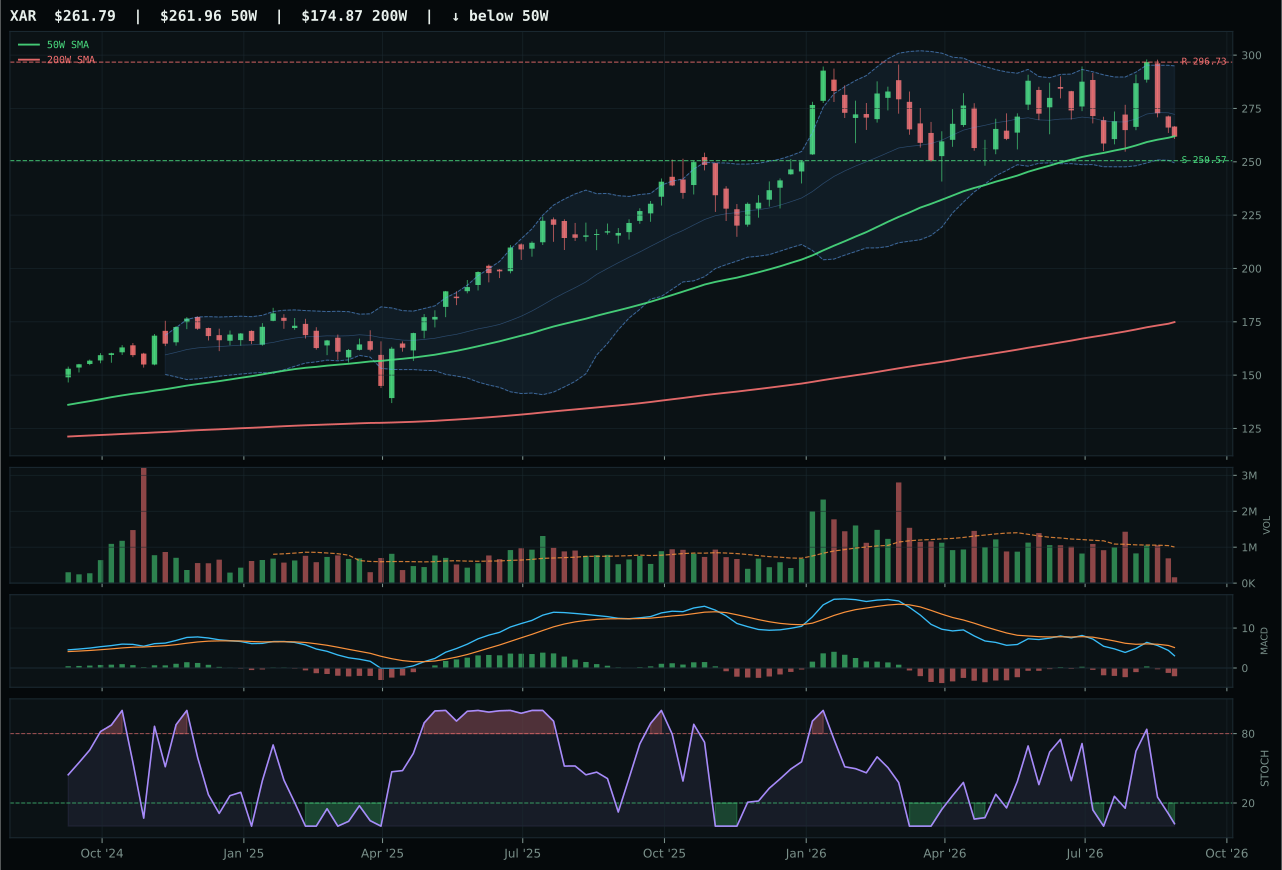
XAR has a pullback into support profile with -8.3% 13-week relative strength versus SPY.
A failed hold above support would weaken the setup.
Actionable but governed by invalidation levels.
ITA wins because it has achieved a perfect 100.0/100 timing score by sitting just 2.9% below the 50W in a compression setup with stochastic RSI oversold, putting price in the middle retracement / decision zone near Fib 0.382—a textbook setup for reversal or accumulation. ROKT lost by stretching too far from the 50W at 9.4% and allowing stochastic RSI to oversold without the same setup conviction; its timing scored only 82.0, a gap driven by less favorable Fibonacci location and greater distance from mean. ITA's MACD is bearish/weakening while ROKT's is bearish but improving, so ROKT has technical momentum momentum going for it, yet ITA's structure is cleaner at 66.2 vs 61.3 and category-relative strength of 5.4% beats ROKT's -2.9%. The 7.9% downside to support versus 8.1% upside to resistance in ITA creates a positive risk/reward despite negative SPY-relative strength, because the setup itself is more defined.
Defense & Aerospace receives 5% allocation as a tier-2 holding, ranked below the top-2 overweights but earning a meaningful position because the 48.1 category score reflects genuine macro tailwinds. Stagflation Risk actually helps this category with +6, credit stress is neutral at +2, and liquidity stress is only moderately negative at -4, yielding a 57.0/100 macro fit—substantially better than the 22.0 seen in technology and AI. The dual tailwinds of geopolitical tension and inflation protection justify holding ITA despite its technical setup being in early reversal mode rather than momentum. ITA's timing score of 100.0 is the highest in the category, signaling that the risk/reward asymmetry now favors new buyers. For this allocation to remain, either the macro tailwinds must persist or ITA must break above the 50W with volume confirmation; a failure to bounce off support would likely trigger a tier-2 to 0% demotions.
Utilities & Infrastructure — IGF
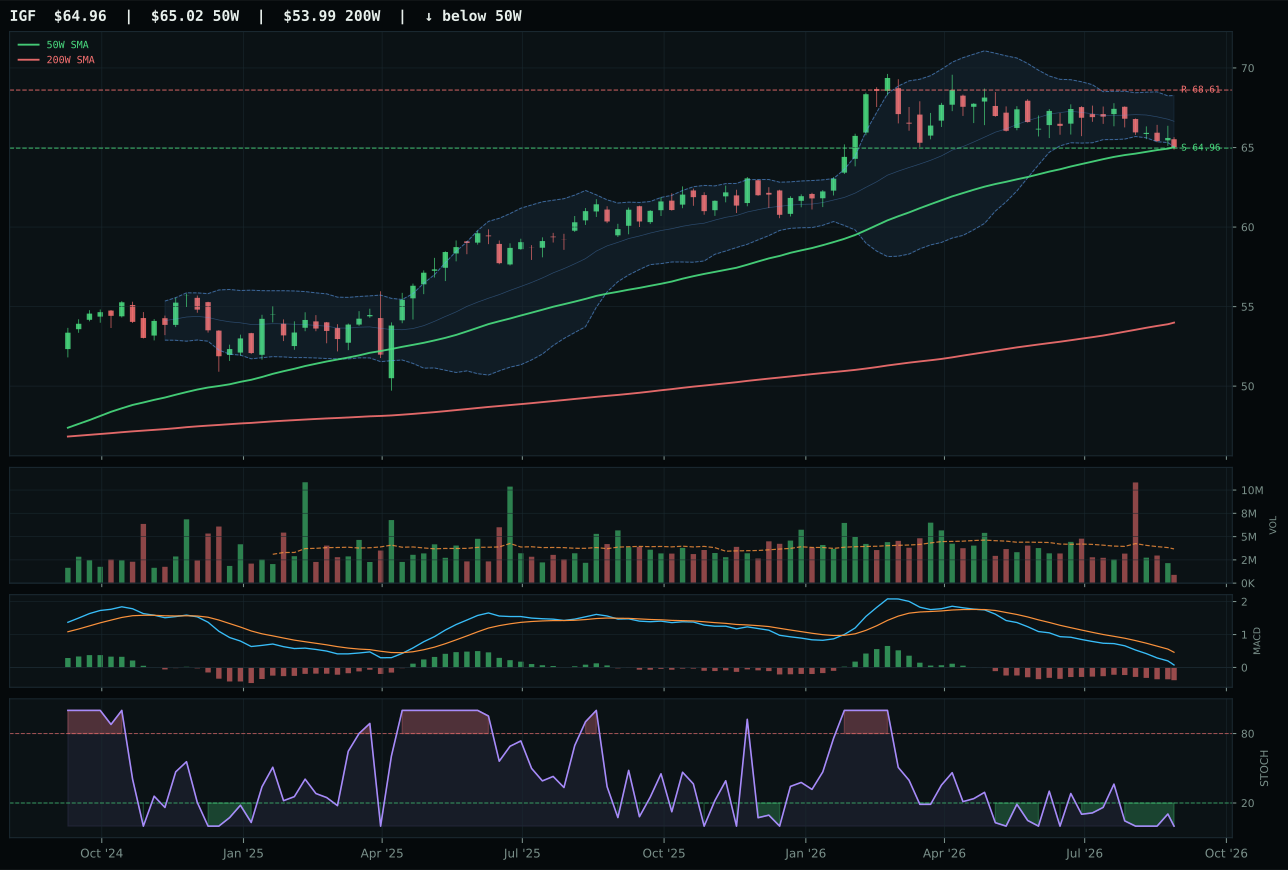
IGF has a pullback into support profile with -6.2% 13-week relative strength versus SPY.
A failed hold above support would weaken the setup.
Actionable but governed by invalidation levels.
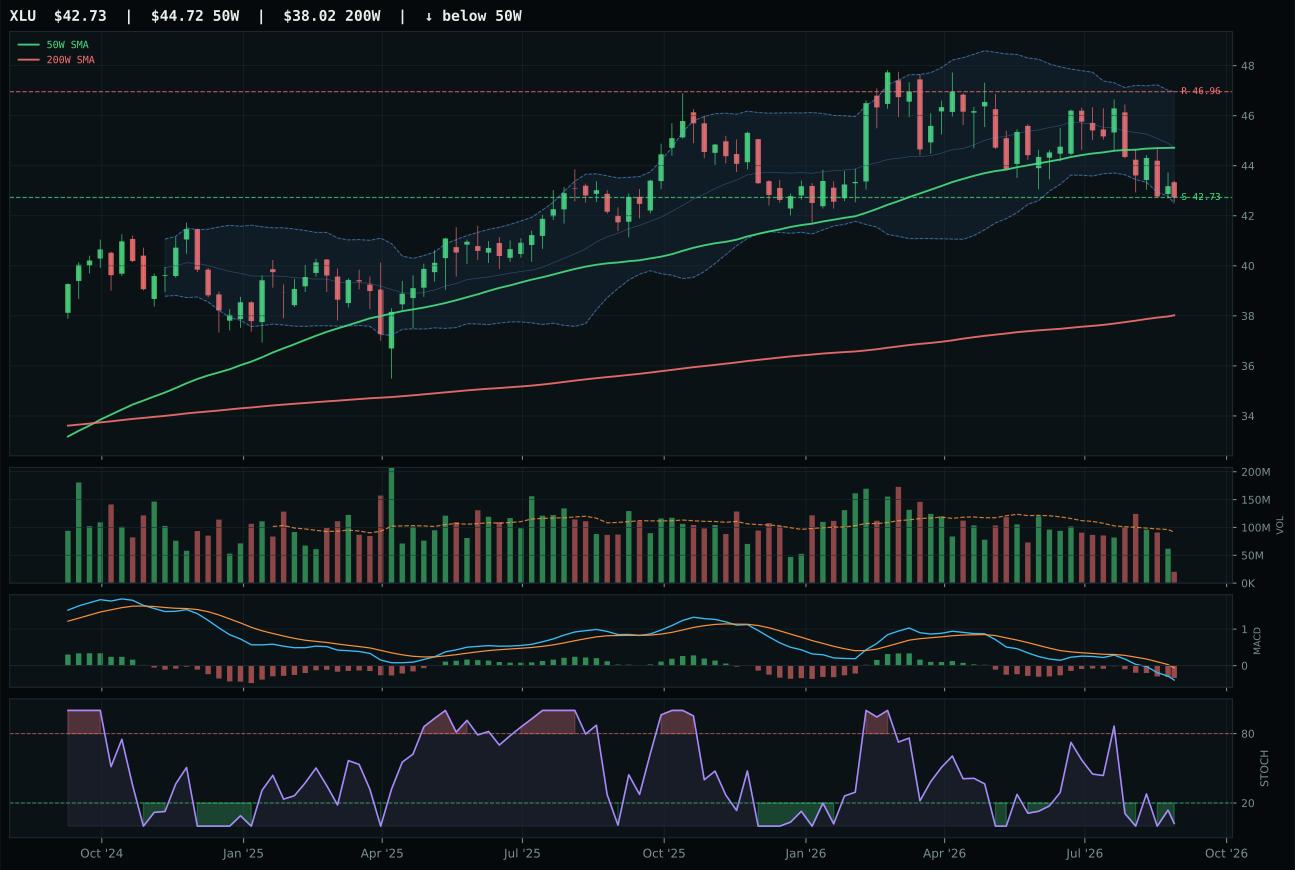
XLU has a pullback into support profile with -8.0% 13-week relative strength versus SPY.
A failed hold above support would weaken the setup.
Actionable but governed by invalidation levels.
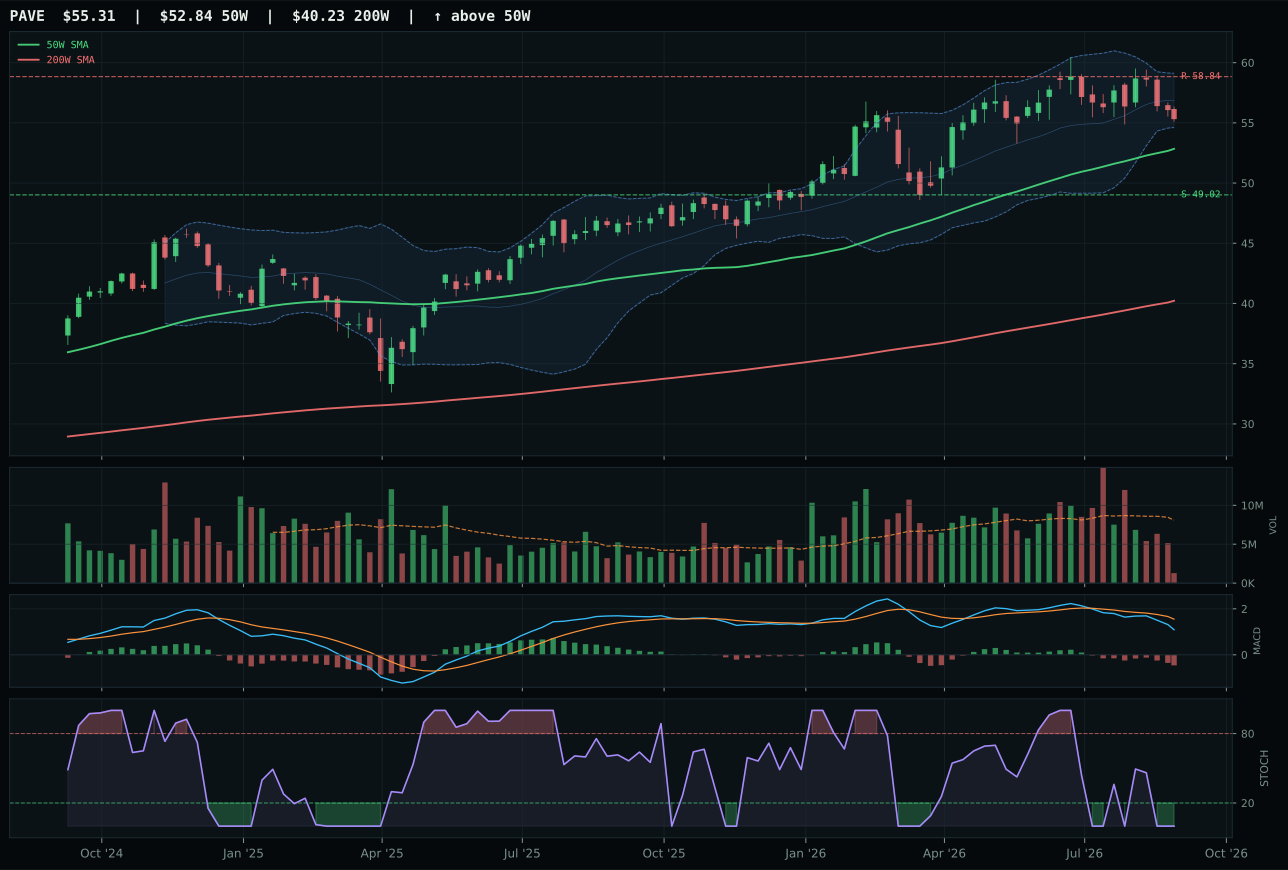
PAVE has a neutral structure profile with -6.7% 13-week relative strength versus SPY.
A failed hold above support would weaken the setup.
Actionable but governed by invalidation levels.
IGF wins because its timing score of 100.0 is the highest in the category, reflecting a pullback-into-support setup where price sits just 0.1% below the 50W with MACD bearish/weakening, stochastic RSI oversold at 0.00, and support defined at 64.96. This is a clean mean-reversion entry with defined invalidation: if price cannot hold 64.96, the setup fails and lower support becomes relevant. XLU and PAVE both show strong timing scores of 100.0 and 85.0 respectively, but XLU's structure score of 67.9 trails IGF's 69.6 and XLU's category-relative strength of -1.2% is weaker than IGF's 0.6%. IGF's risk/reward of 65.0/100 is superior to PAVE's 53.0 because IGF has defined support at 64.96 with 0.0% downside risk versus 5.3% upside to resistance—an asymmetry that justifies entry despite negative momentum.
Utilities & Infrastructure receives 5% allocation as a tier-2 holding, receiving support from a category macro fit of 51.0/100 where growth slowdown is +6 and transition/mixed conditions provide +4, offset by inflation pressure at -6 and liquidity stress at -3. The 40.2 category score is the lowest earning allocation, ranking 8th among the 10 categories, but it still merits tier-2 because the portfolio needs some duration and yield hedging given stagflation risks. IGF's pullback-into-support setup offers tactical entry into a beaten-down defensive sector at risk-defined entry point. The allocation is tactical and conditional: hold IGF only while it holds the 64.96 support level; any breakdown below support would warrant immediate downgrade to 0%. This is a small, defensive allocation that serves portfolio ballast rather than return driver; it should shrink if credit or liquidity conditions deteriorate further.
Technology — IGV
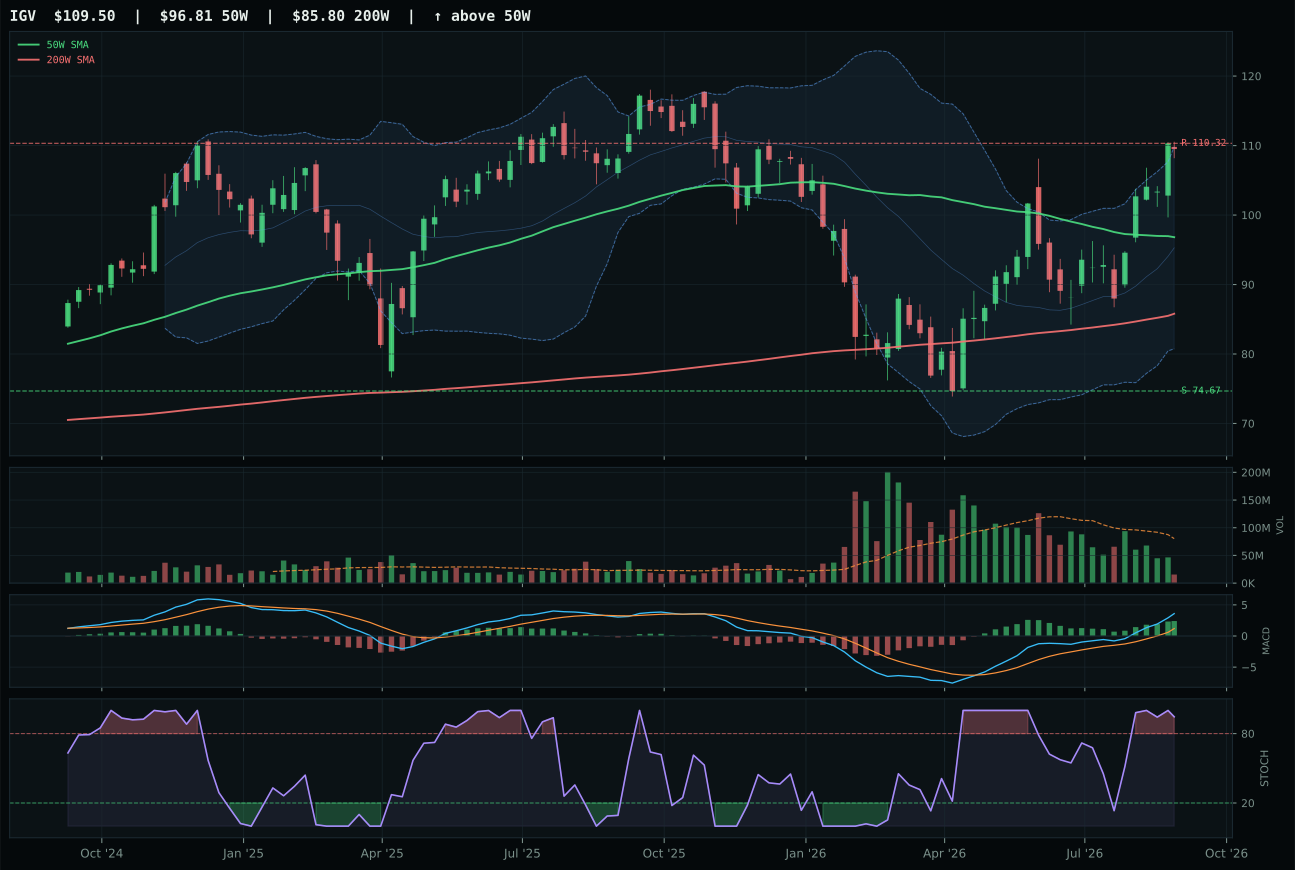
IGV has a neutral structure profile with 9.9% 13-week relative strength versus SPY.
A failed hold above support would weaken the setup.
Actionable but governed by invalidation levels.
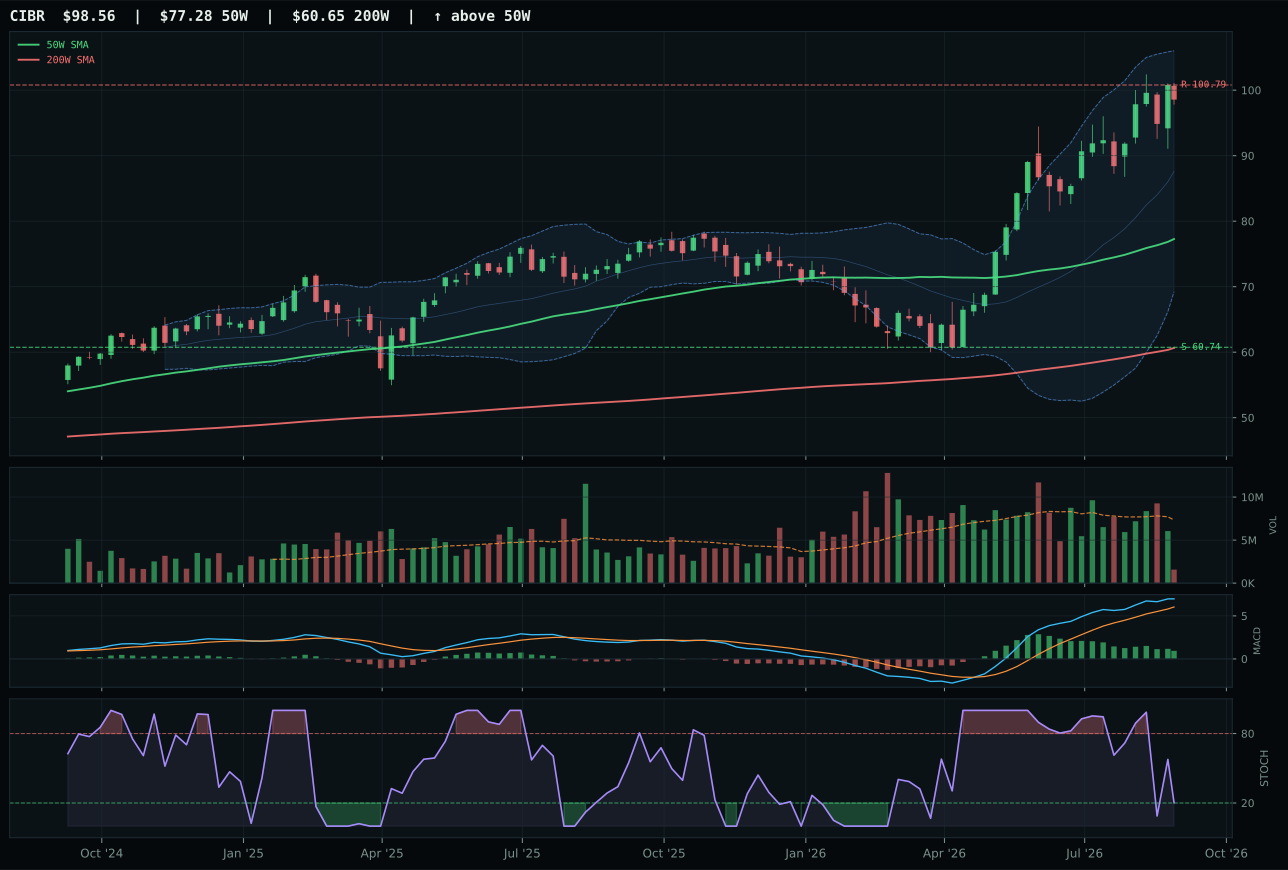
CIBR has a vertical extension profile with 9.4% 13-week relative strength versus SPY.
A failed hold above support would weaken the setup.
Actionable but governed by invalidation levels.
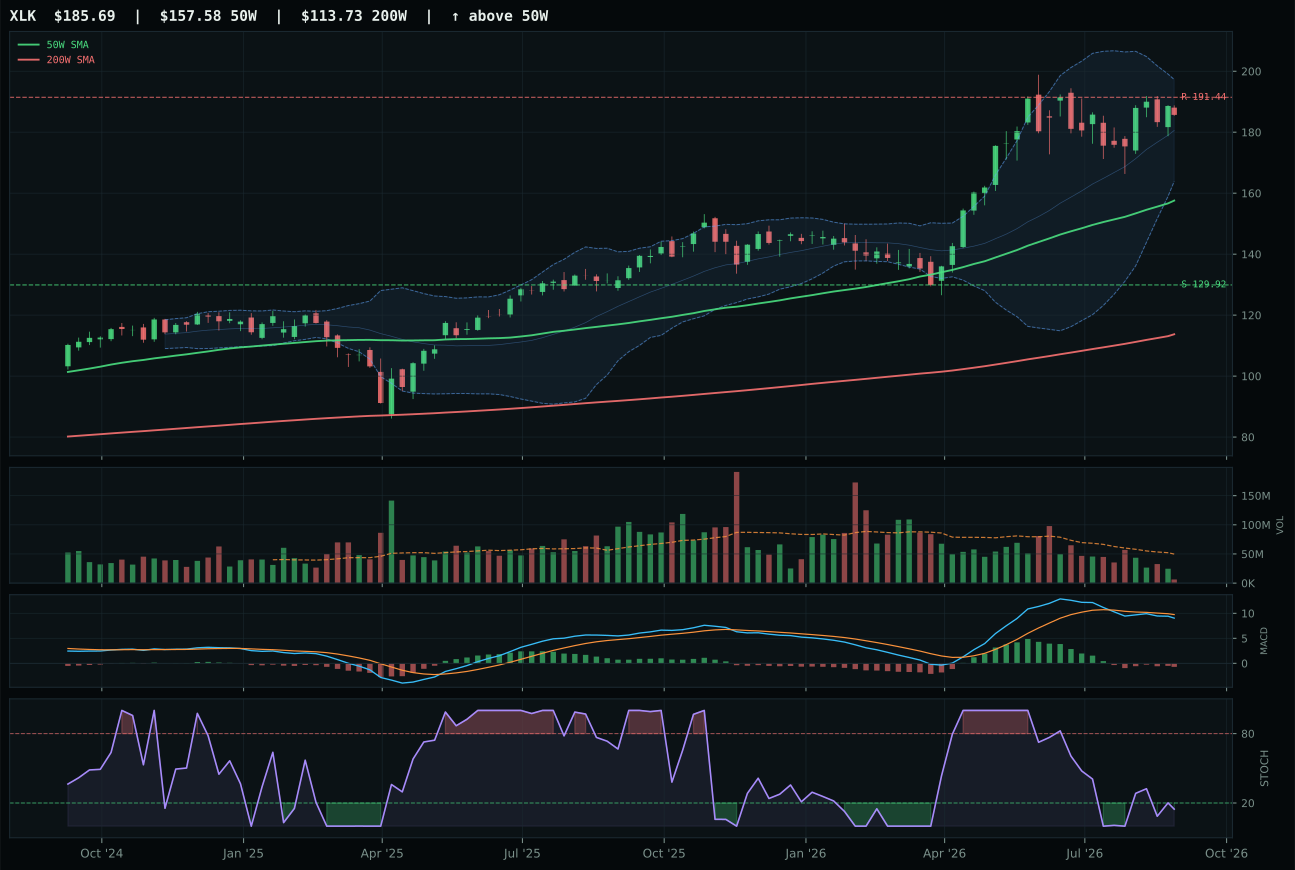
XLK has a vertical extension profile with -1.3% 13-week relative strength versus SPY.
A failed hold above support would weaken the setup.
Actionable but governed by invalidation levels.
IGV wins the category because its timing and momentum confirmation scores exceed CIBR's by meaningful margins—57.0 vs 40.0 on timing and 91.5 vs 82.0 on momentum—which reflects a cleaner setup as price compresses near the 50W rather than stretches away from it. The 9.9% relative strength versus SPY supports fresh institutional accumulation, even though category-relative strength of 0.6% suggests CIBR captured more internal leadership. MACD is bullish and improving for IGV while CIBR's MACD has begun to flatten, a technical deterioration that typically precedes range-bound or corrective action. Stochastic RSI overbought rolling over in IGV versus falling/neutral in CIBR indicates IGV retains more momentum fuel despite its overbought condition; CIBR's stochastic weakness combined with its 27.5% extension from the 50W creates genuine exhaustion risk. The 13.1% distance from the 50W in IGV is an entry penalty but not disqualifying, while CIBR at 27.5% invites every new buyer into a position where risk asymmetry has already shifted against them.
Technology ranks 9th or 10th and receives 0% allocation this week, excluded entirely from the portfolio despite IGV's tactical win inside its category. The 27.3 final score reflects a hostile macro environment for growth technology: stagflation risk is active with a -7 penalty, liquidity stress is penalizing duration exposure with -10, and credit stress adds -7 more. Cumulatively, the macro overlay sinks the category-level technical evidence of 61.0/100 into a final macro fit of only 22.0/100, making growth exposure a poor risk-adjusted opportunity when real assets and commodities are being sponsored by supply shortages and inflation pressure. CIBR's cybersecurity defensibility and relative steadiness cannot overcome the fact that both IGV and CIBR are duration-sensitive names in a regime where tight liquidity and credit stress are active headwinds. For Technology to earn a tier-2 slot, either liquidity or credit stress would need to ease, or the macro state would need to shift away from Stagflation Risk entirely—neither appears imminent.
AI — AIQ
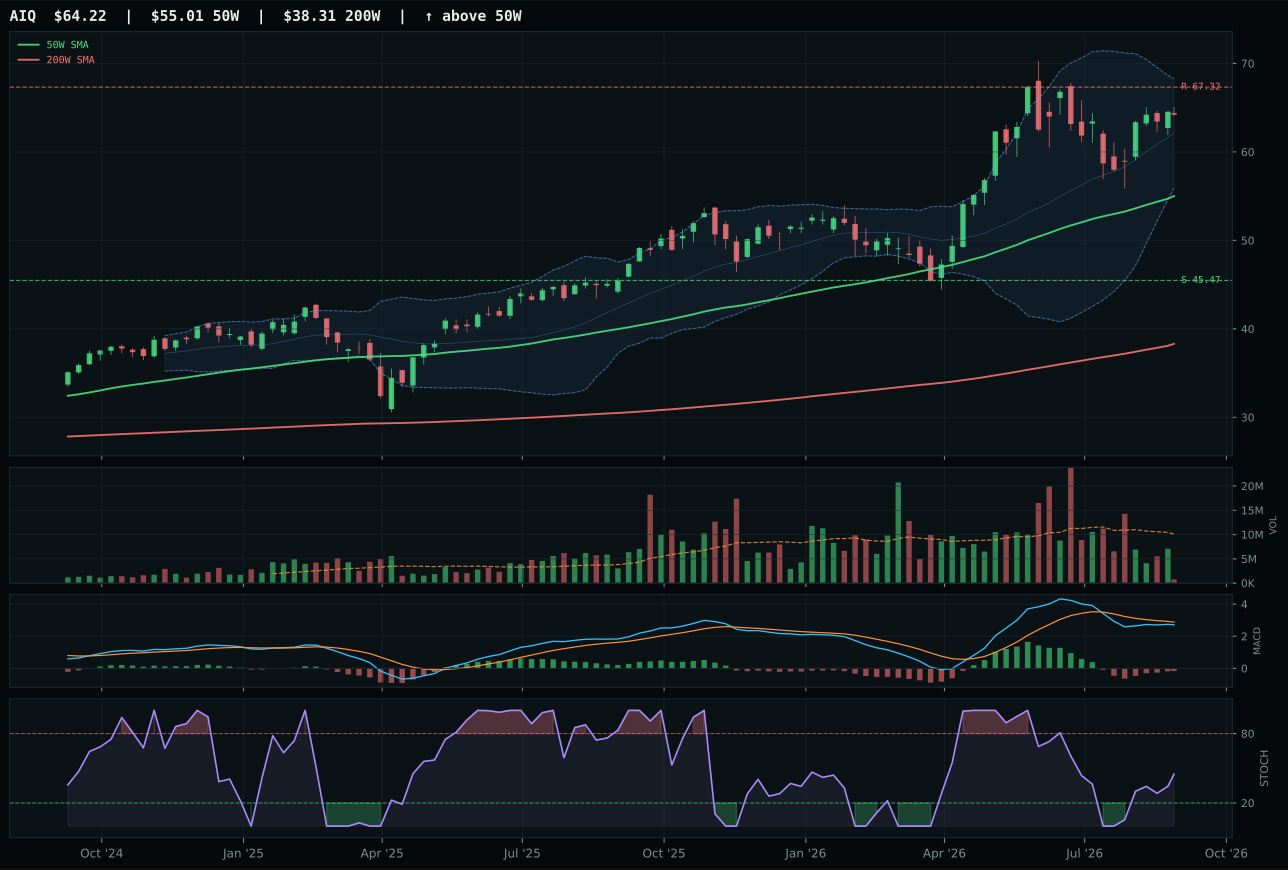
AIQ has a vertical extension profile with -1.6% 13-week relative strength versus SPY.
A failed hold above support would weaken the setup.
Actionable but governed by invalidation levels.
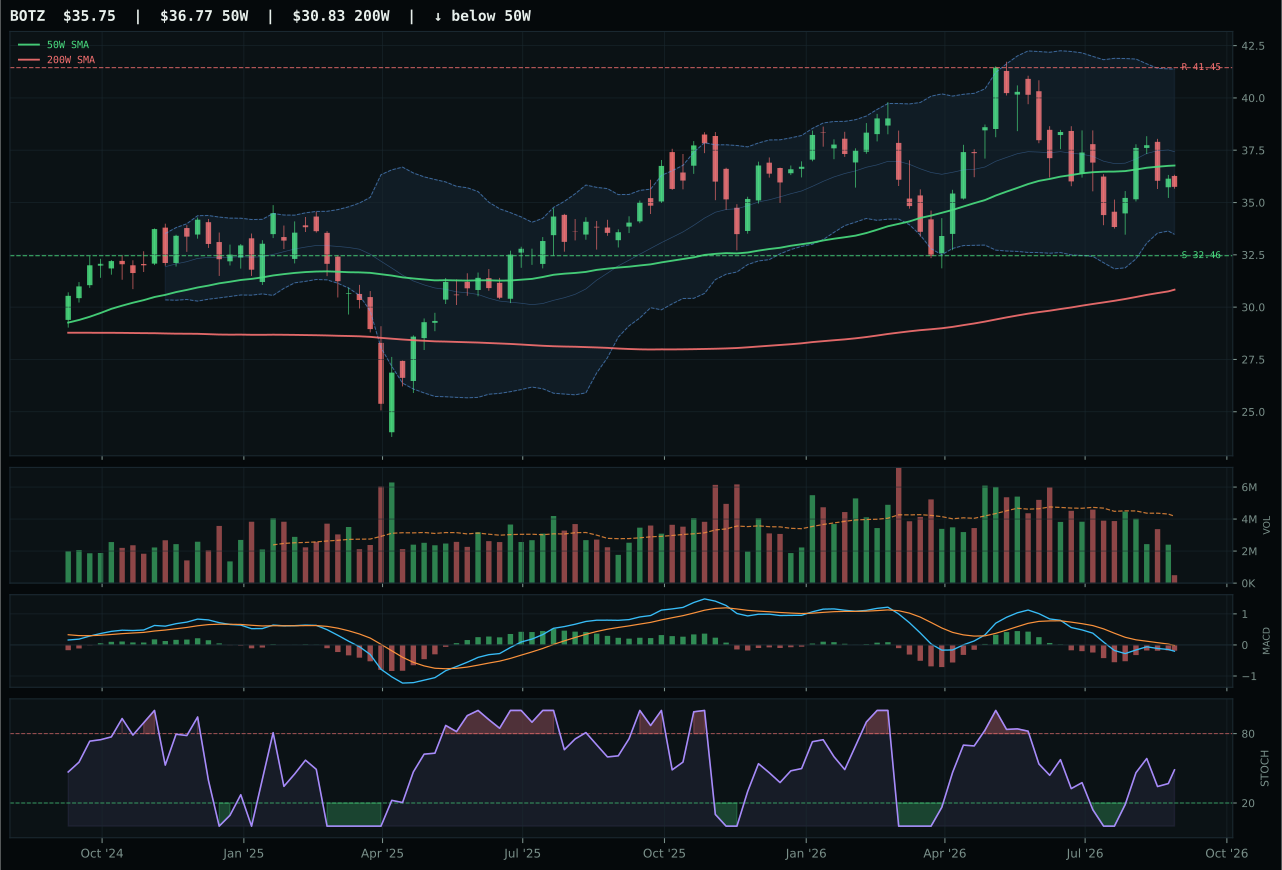
BOTZ has a compression near 50W profile with -10.2% 13-week relative strength versus SPY.
A failed hold above support would weaken the setup.
Actionable but governed by invalidation levels.
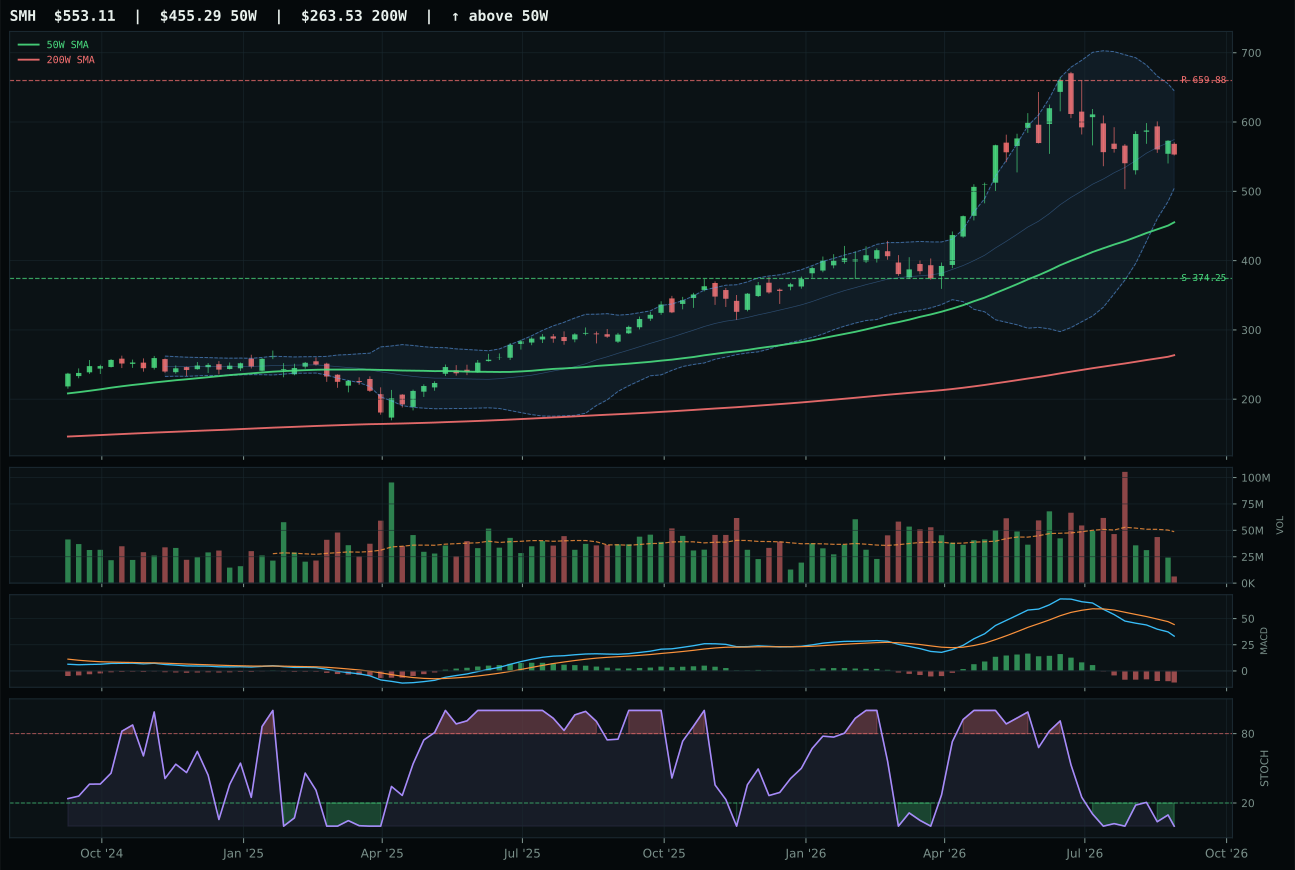
SMH has a vertical extension profile with -7.2% 13-week relative strength versus SPY.
A failed hold above support would weaken the setup.
Actionable but governed by invalidation levels.
AIQ wins because its stochastic RSI timing is superior at rising mid-zone versus BOTZ's falling/neutral condition, and its category-relative strength of 5.6% decisively beats BOTZ's -3.0%, signaling AIQ is outperforming its peers while BOTZ lags. Price sits 16.7% from the 50W in vertical extension, which normally penalizes timing, but AIQ's MACD is bearish but improving and stochastic RSI is rising from mid-zone, suggesting a potential inflection point where the weakness may be bottoming. BOTZ by contrast shows falling stochastic RSI and 13W return of -5.9% versus AIQ's +2.7%, indicating BOTZ remains in genuine drawdown mode rather than consolidating strength. The 2.7% 13W return in AIQ is modest, but the internal relative strength advantage and improving MACD trajectory matter more than absolute price momentum when liquidity and credit stress are this acute.
AI ranks 9th or 10th and receives 0% allocation this week, excluded from the portfolio despite AIQ's category leadership. The 18.4 final score reflects a severe macro headwind: liquidity stress is active with -12, credit stress adds -8, and stagflation risk itself contributes -8 to category-level macro fit of 22.0/100. Even though AIQ's technical evidence is solid at 59.8/100 and the macro/narrative fit is 34.0/100, the combined 62/38 weighting of technical to macro produces a final score that ranks far below categories where real assets and supply shortage narratives are active. AI requires either growth acceleration or credit/liquidity relief to become attractive; neither condition is present. The compression setup in BOTZ and falling stochastic RSI across the category suggest institutional money is rotating away from AI beta into hedges and real assets. AI would need to break this technical deterioration pattern and see credit conditions ease before earning allocation.