
2026-08-21
Informational purposes only. The content in this report, including allocations, analysis, and commentary, is provided solely for informational and educational purposes. It does not constitute financial advice, investment advice, trading advice, or any other type of advice. Past performance does not guarantee future results. Always conduct your own research and consult a qualified financial professional before making investment decisions.
Weekly Allocation
| Ticker | Category | Weight | Role |
|---|---|---|---|
| FBTC | 50% | Overlay | |
| MOO | Agriculture & Livestock | 10% | Top-2 (10%) |
| XLE | Traditional Energy | 10% | Top-2 (10%) |
| ARKG | Biotech & Genomics | 5% | Tier-2 (5%) |
| GDX | Precious Metals | 5% | Tier-2 (5%) |
| URNM | Nuclear Energy | 5% | Tier-2 (5%) |
| ROKT | Defense & Aerospace | 5% | Tier-2 (5%) |
| PAVE | Utilities & Infrastructure | 5% | Tier-2 (5%) |
| REMX | Industrial Metals | 5% | Tier-2 (5%) |
Trade Instructions — Monday Open
Sell the tranche from 2026-07-24 (completing its 4-week hold). Buy the new tranche. Instructions show net portfolio changes — same-asset positions cancel, weight changes show the delta.
| Action | Ticker | Instruction |
|---|---|---|
| SELL | WEAT | Sell entire WEAT position (5.00% of portfolio) |
| SELL | XLE | Sell 11% of XLE position (reduce 22.50% → 20.00%) |
| SELL | XLU | Sell entire XLU position (2.50% of portfolio) |
| SELL | CIBR | Sell 67% of CIBR position (reduce 3.75% → 1.25%) |
| SELL | ITA | Sell 29% of ITA position (reduce 8.75% → 6.25%) |
| SELL | BOTZ | Sell entire BOTZ position (2.50% of portfolio) |
| SELL | COPX | Sell 40% of COPX position (reduce 6.25% → 3.75%) |
| SELL | GLD | Sell 67% of GLD position (reduce 3.75% → 1.25%) |
| BUY | PAVE | Buy PAVE — 5.56% of freed cash (adds 1.25% to portfolio) |
| BUY | GDX | Buy GDX — 5.56% of freed cash (adds 1.25% to portfolio) |
| BUY | MOO | Buy MOO — 11.11% of freed cash (adds 2.50% to portfolio) |
| BUY | FBTC | Buy FBTC — 55.56% of freed cash (adds 12.50% to portfolio) |
| BUY | ARKG | Buy ARKG — 5.56% of freed cash (adds 1.25% to portfolio) |
| BUY | URNM | Buy URNM — 5.56% of freed cash (adds 1.25% to portfolio) |
| BUY | ROKT | Buy ROKT — 5.56% of freed cash (adds 1.25% to portfolio) |
| BUY | REMX | Buy REMX — 5.56% of freed cash (adds 1.25% to portfolio) |
Current Portfolio After Trade
Combined holdings across all 4 active tranches. Each tranche is 25% of the portfolio.
| Ticker | % of Portfolio | Weight Bar |
|---|---|---|
| XLE | 20.00% | |
| FBTC | 12.50% | |
| IEMG | 7.50% | |
| ITA | 6.25% | |
| PAVE | 6.25% | |
| GDX | 6.25% | |
| VEGI | 5.00% | |
| URA | 5.00% | |
| MOO | 5.00% | |
| XAR | 5.00% | |
| COPX | 3.75% | |
| XOP | 2.50% | |
| IGV | 2.50% | |
| AIQ | 2.50% | |
| CIBR | 1.25% | |
| GLD | 1.25% | |
| IGF | 1.25% | |
| NLR | 1.25% | |
| ARKG | 1.25% | |
| URNM | 1.25% | |
| ROKT | 1.25% | |
| REMX | 1.25% |
Macro Regime — Stagflation Risk
Macro Evidence Charts
Market-implied signals behind the macro regime scores. Each ratio compares two assets; the direction and slope of the ratio is what the macro engine reads.
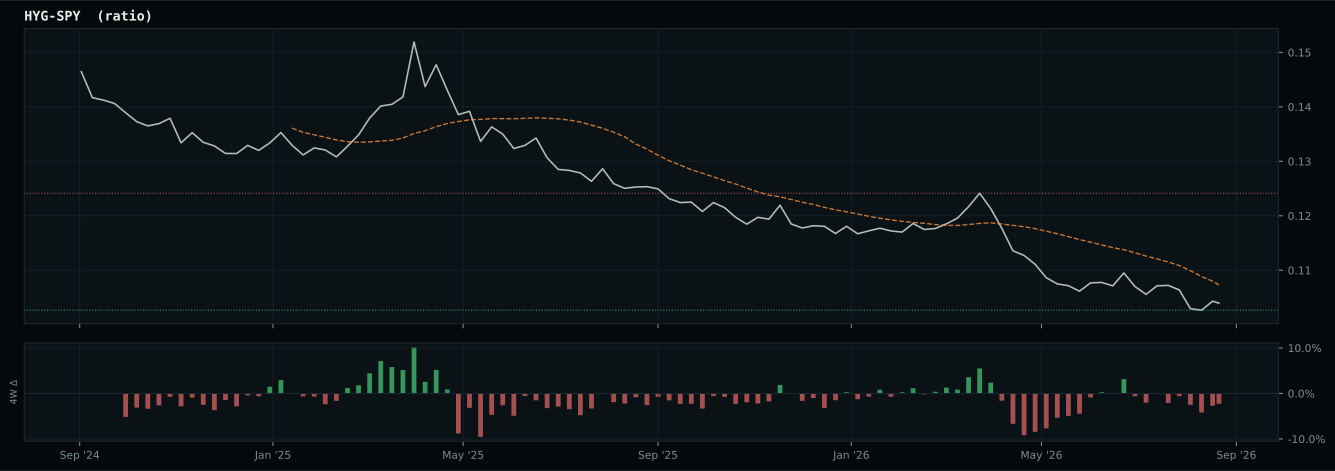
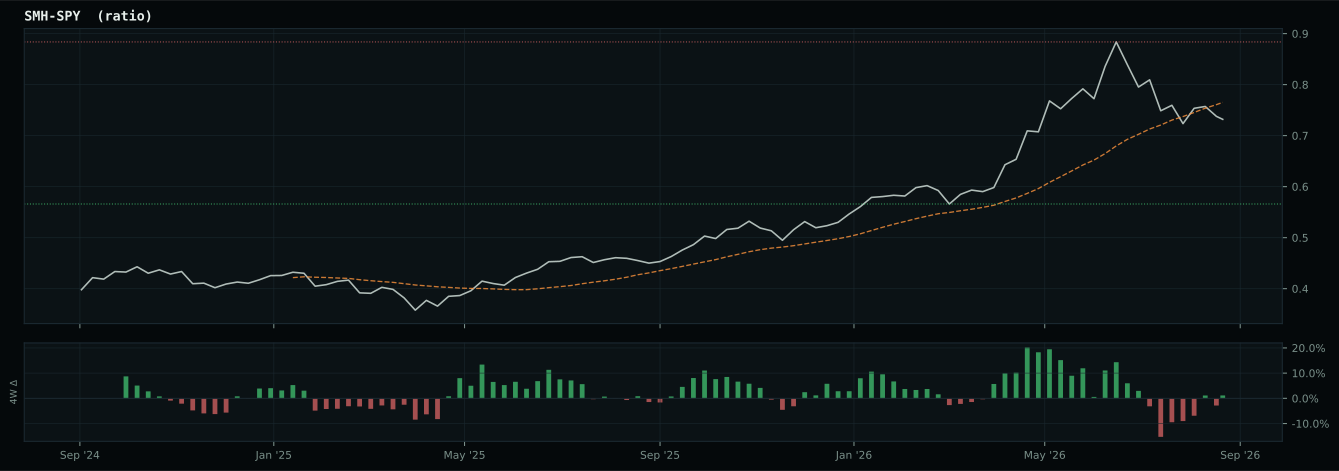
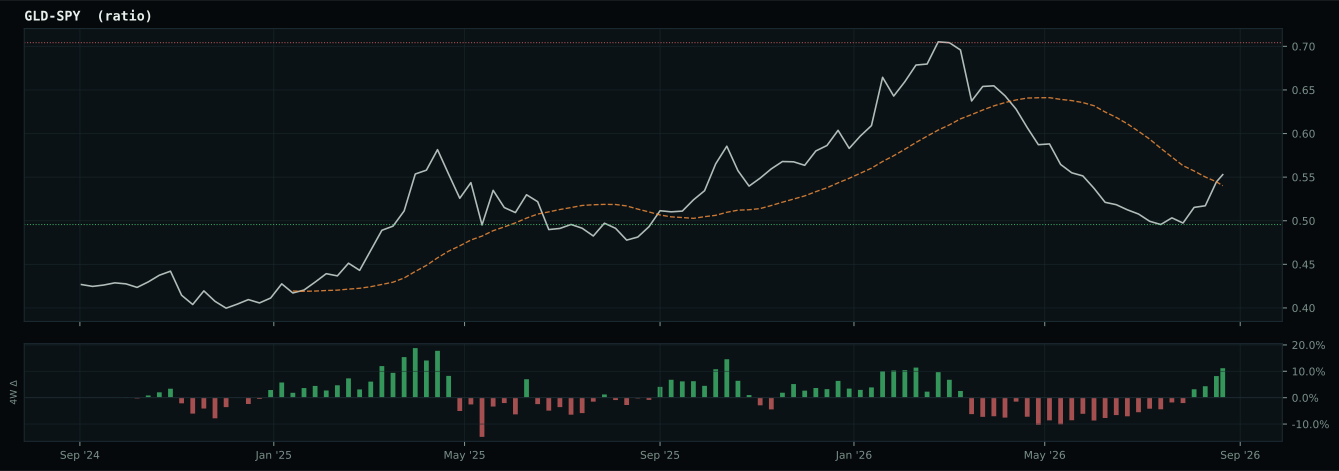
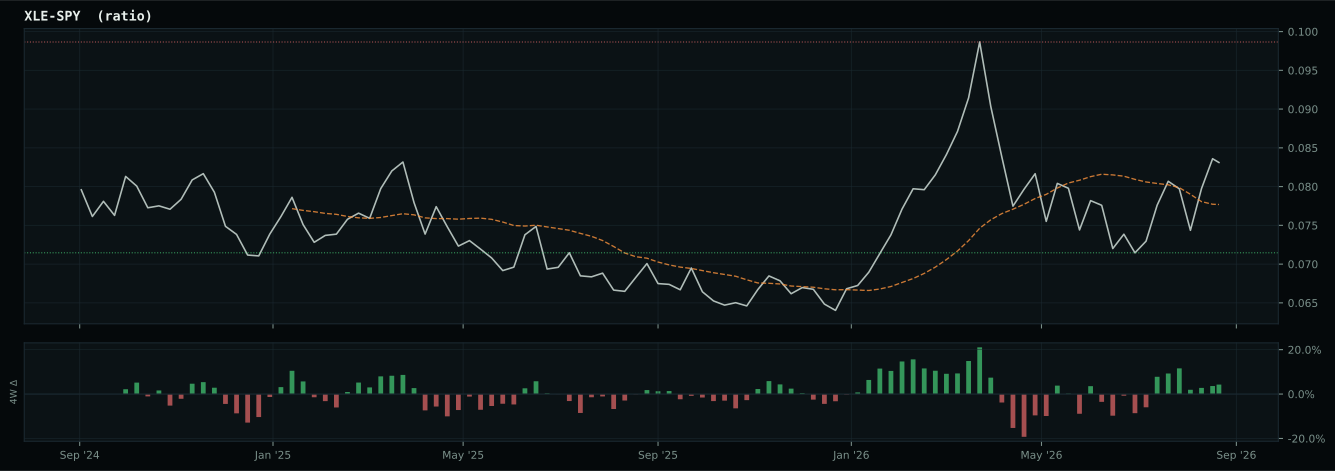
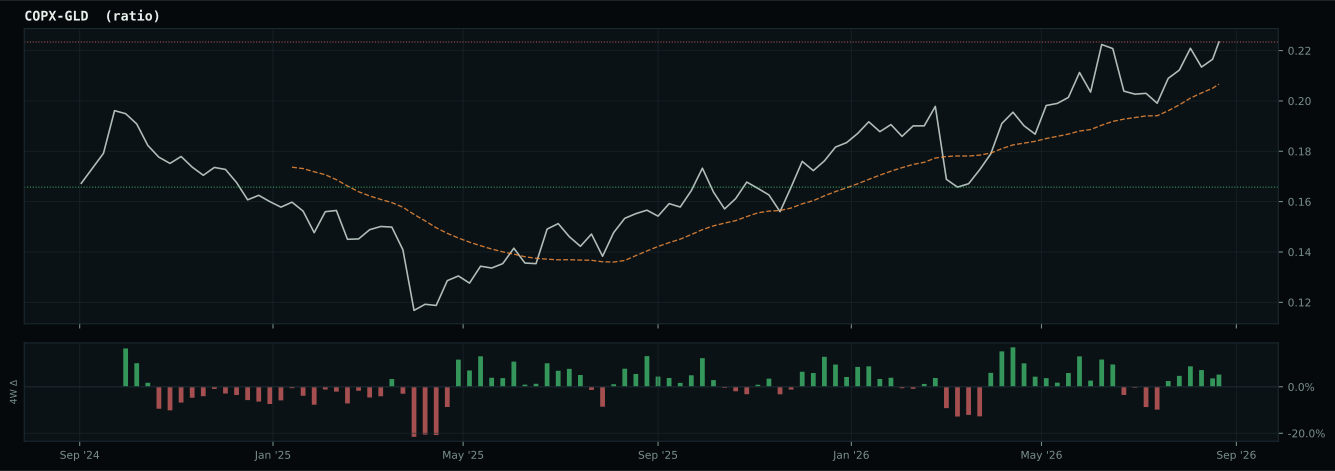
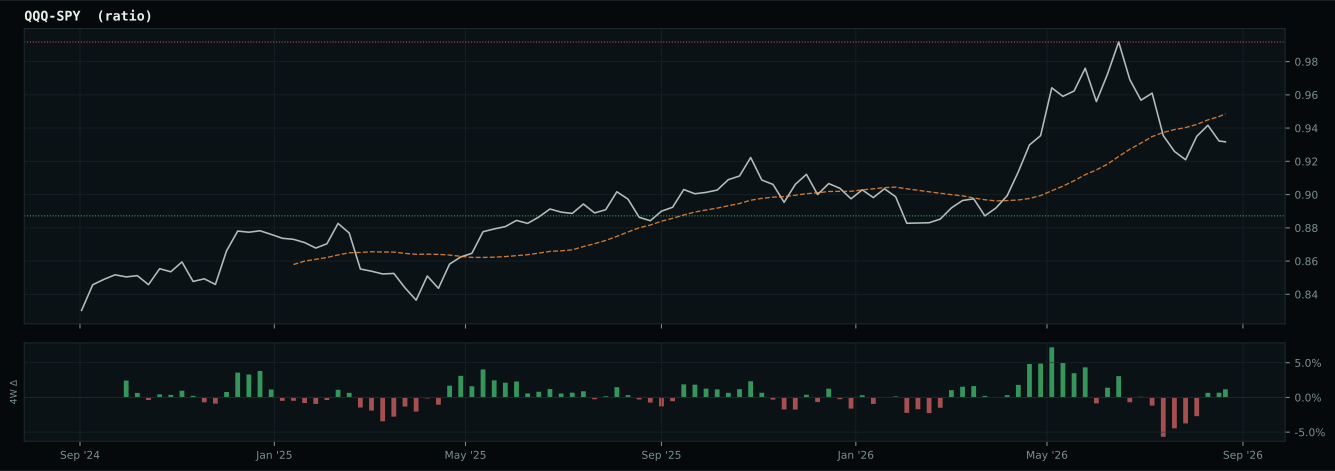
Crypto Regime — ValueBTC
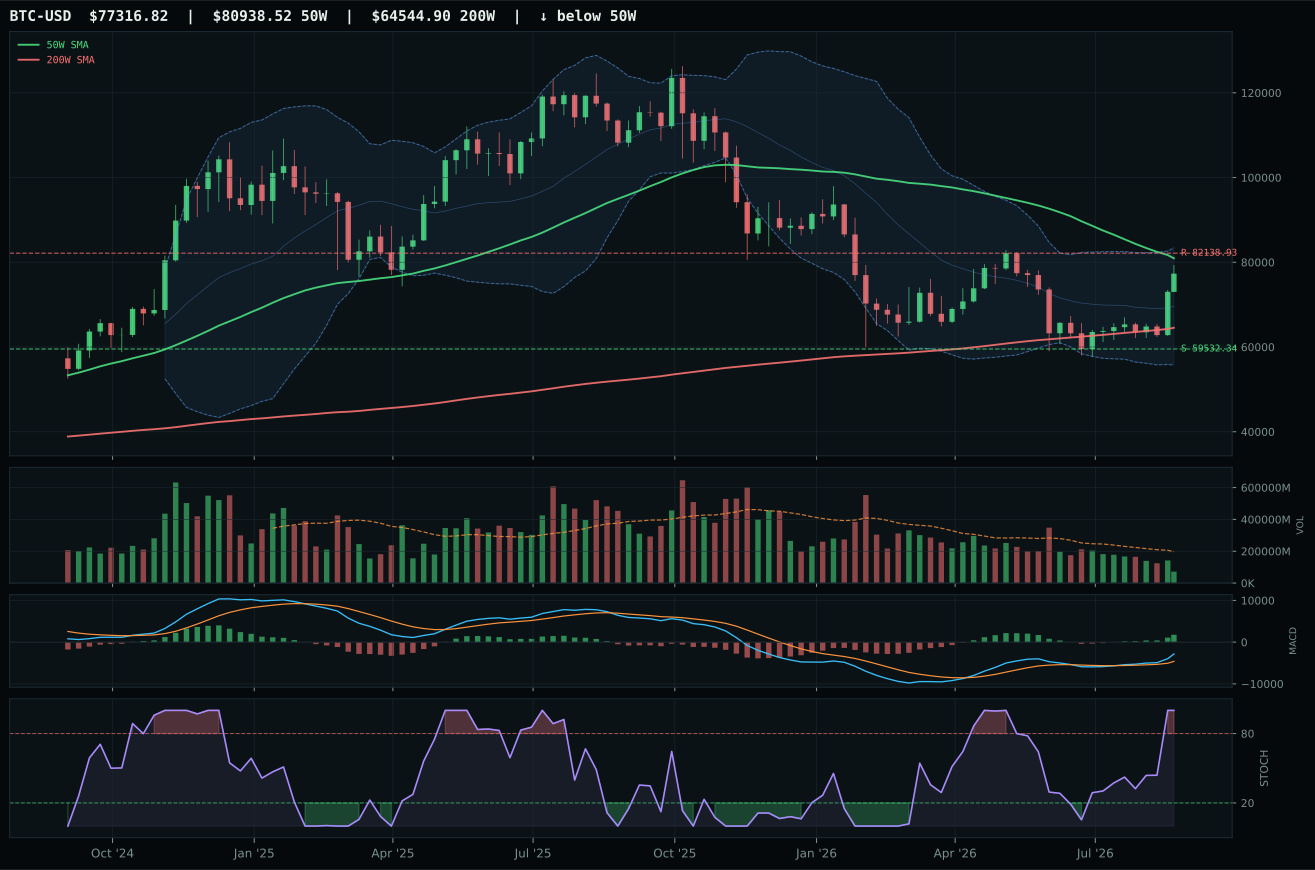
ValueBTC confirmed (breakout, week 9/12 of 3rd bottom (12-week timer)): BTC closed above range resistance $73,033 + 3% buffer.
TrendBTC not confirmed
one or more available conditions failed
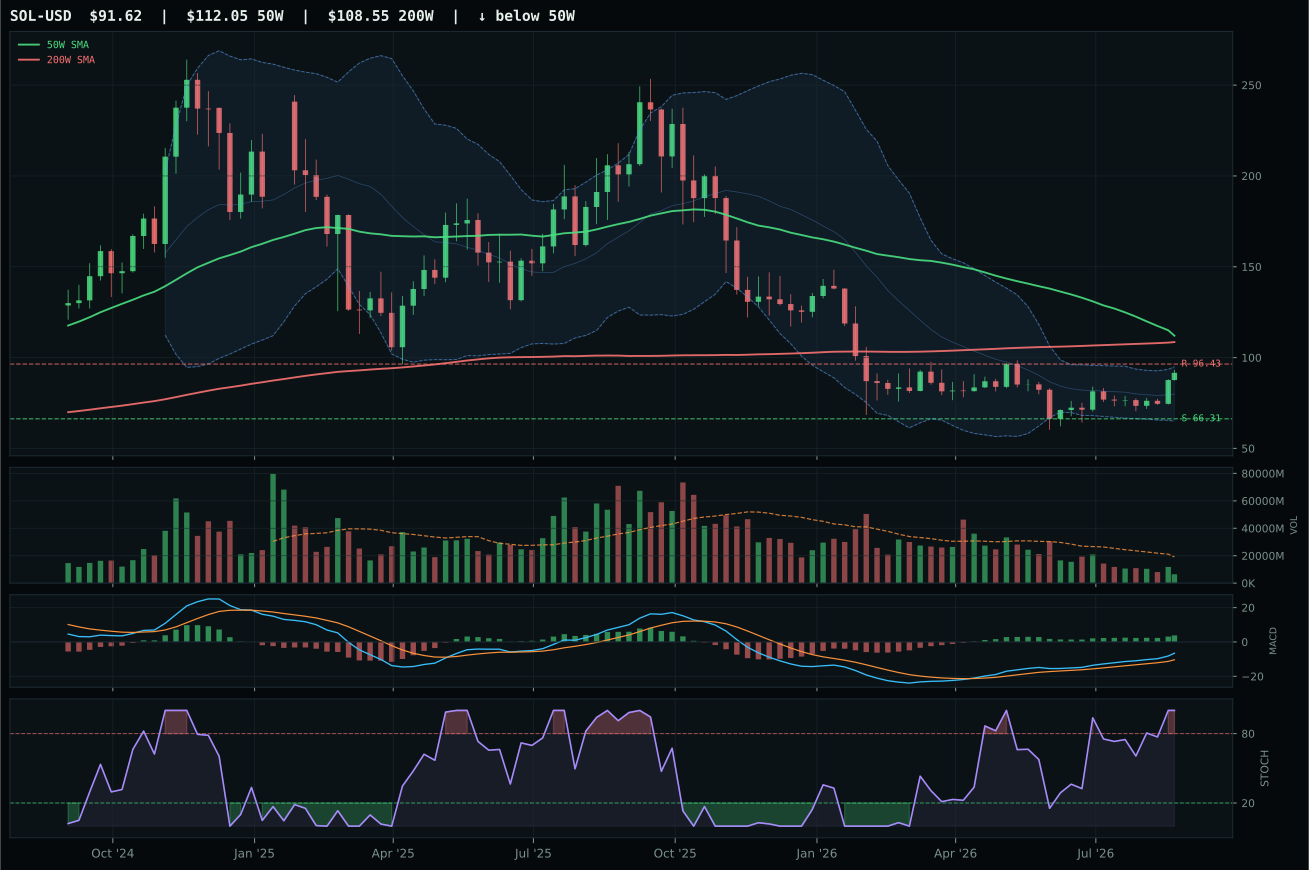
Shifting to Solana expression (FSOL): Two conditions stand between the current FBTC expression and an FSOL expression. ISM Manufacturing PMI (47.9) needs to recover above 50. This index publishes monthly, so the earliest opportunity is the next scheduled release. A reading below 50 signals contraction; a recovery above it would confirm that the manufacturing economy is no longer deteriorating — a prerequisite before committing to the higher-beta altcoin trade. The Fed balance sheet needs to be flat or rising (currently falling). A contracting balance sheet reduces system liquidity — the wrong backdrop for rotating into higher-beta assets. The TOTAL3/BTC 50-week slope (-1.20% per week) needs to turn positive. This measures whether altcoins as a group are gaining ground against Bitcoin on a sustained basis — the signature of early-cycle rotation into higher-beta assets. A positive slope means altcoins have been outperforming BTC consistently enough to shift the moving average upward.
Graduating to TrendBTC: The ValueBTC position matures into a full TrendBTC position when Bitcoin closes above the 50-week SMA ($80,963) while that SMA is flat or rising. BTC is currently 3.1% below the 50W SMA, and the SMA has been declining as the prior cycle's peak prices rotate out of the window. TrendBTC would signal that the new bull trend is structurally confirmed, at which point the full AltSeason conditions become evaluable and Solana exposure becomes available through the normal channel.
Exiting back to NoCrypto: Two consecutive weekly closes below the 200-week SMA ($64,551) and the prior range support level exit the ValueBTC position. Bitcoin is currently 21.7% above the 200W SMA. The two-week requirement prevents a single volatile candle from prematurely ending the position during normal consolidation above support.
Category Rankings
| Rank | Category | Winner | Score | Alloc | 4W Ret | Peers (4W) |
|---|---|---|---|---|---|---|
| 1 | Agriculture & Livestock | MOO | 78.6 | 20% | — | VEGI — · PDBA — |
| 2 | Traditional Energy | XLE | 72.8 | 20% | — | XOP — · FCG — |
| 3 | Biotech & Genomics | ARKG | 61.8 | 10% | — | IBB — · XBI — |
| 4 | Precious Metals | GDX | 61.0 | 10% | — | GLD — · SLV — |
| 5 | Nuclear Energy | URNM | 49.2 | 10% | — | URA — · NLR — |
| 6 | Defense & Aerospace | ROKT | 46.4 | 10% | — | XAR — · ITA — |
| 7 | Utilities & Infrastructure | PAVE | 45.2 | 10% | — | IGF — · XLU — |
| 8 | Industrial Metals | REMX | 42.3 | 10% | — | COPX — · PICK — |
| 9 | Technology | IGV | 27.3 | 0% | — | CIBR — · XLK — |
| 10 | AI | AIQ | 13.9 | 0% | — | BOTZ — · SMH — |
Agriculture & Livestock — MOO
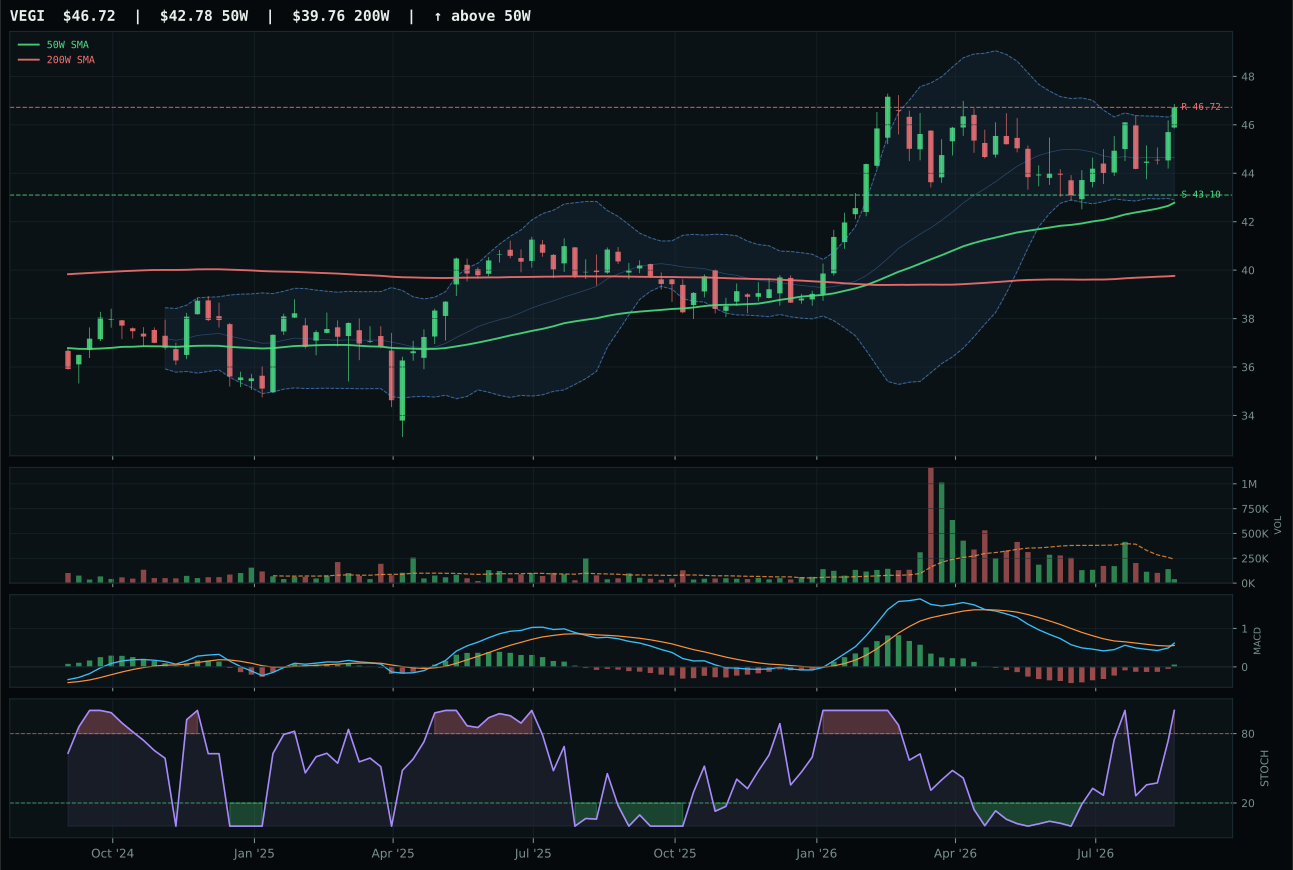
VEGI has a neutral structure profile with 5.1% 13-week relative strength versus SPY.
A failed hold above support would weaken the setup.
Actionable but governed by invalidation levels.
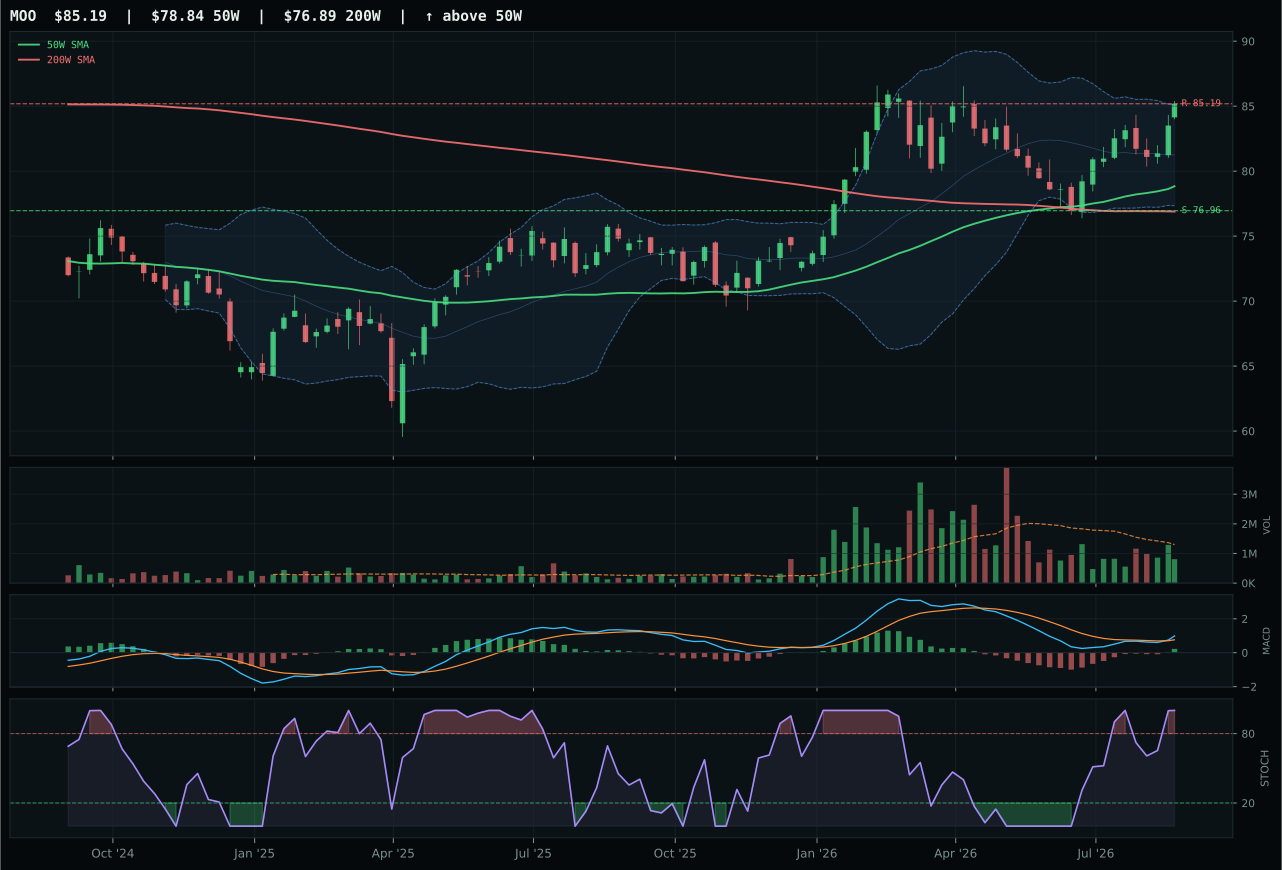
MOO has a neutral structure profile with 6.0% 13-week relative strength versus SPY.
A failed hold above support would weaken the setup.
Actionable but governed by invalidation levels.
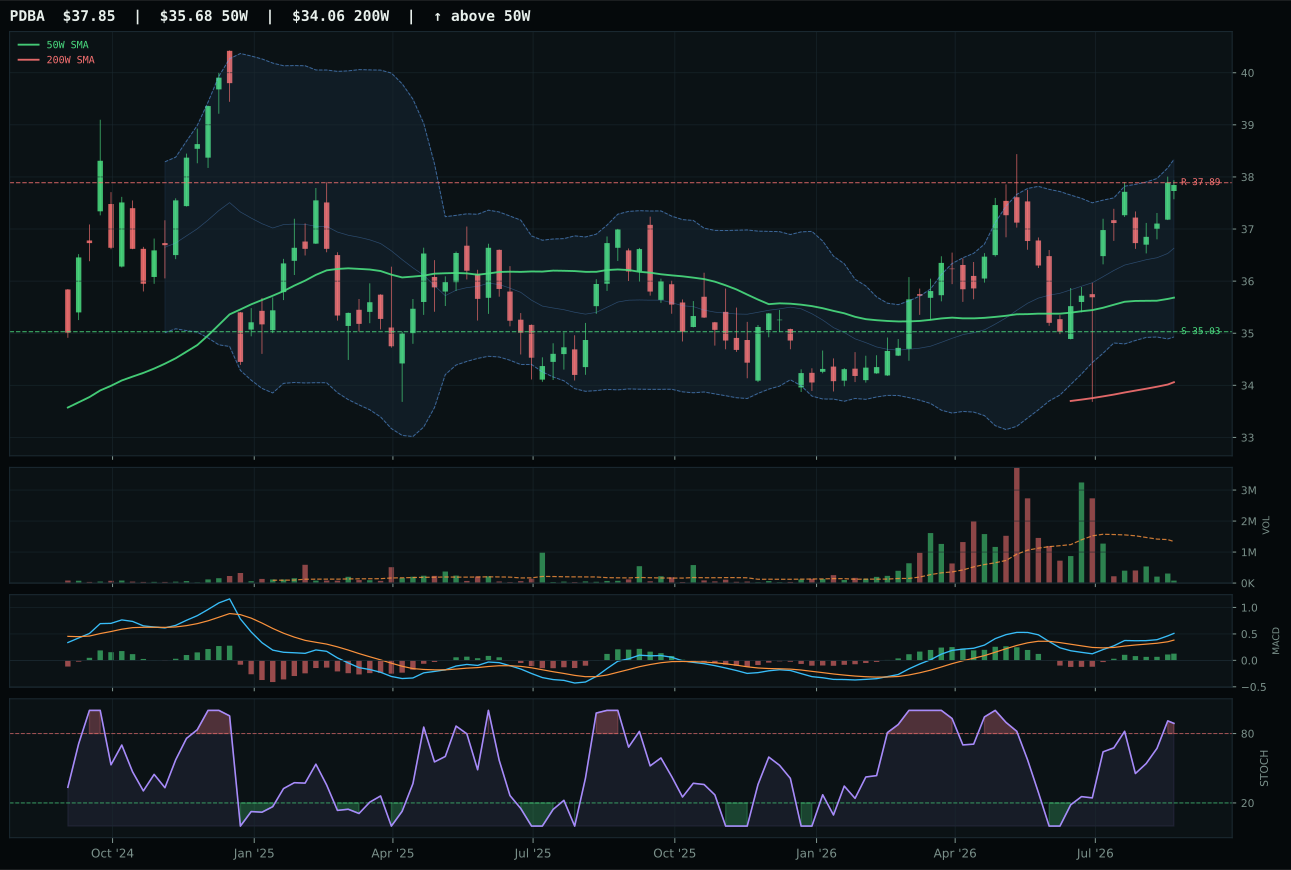
PDBA has a neutral structure profile with 3.0% 13-week relative strength versus SPY.
A failed hold above support would weaken the setup.
Actionable but governed by invalidation levels.
MOO wins Agriculture decisively despite VEGI posting a higher composite score of 82 versus MOO's 79—a rare case where technical edge overrides raw component rankings. MOO's category-relative strength of 0.9% beats VEGI's 0.0% by exactly the margin needed to clinch in a tightly bunched basket where MOO, PDBA, and VEGI are separated by just 0.5 points in the 3/2/1 weighted calculation. Both names show neutral structure, bullish and improving MACD, and overbought momentum at stochastic RSI 1.00, but MOO's structure cleanliness at 66.7 (versus VEGI's 75.9, paradoxically lower) combined with its category leadership consensus tipped the allocation decision. MOO is 8.1% above the 50W with compression ratio of 87.2, indicating a clean consolidation zone before the move higher. Volume participation at 0.62x remains thin, but that is typical for agricultural commodities and does not negate the institutional sponsorship evident in the 7.2% 13W return and 6.0% SPY relative strength.
Agriculture & Livestock earned 10% as a top-2 overweight because its 79.0 category score and 90.0 macro fit score reflect the strongest macro tailwind in the entire portfolio this week. Late-cycle reflation benefits this exposure directly (+8), and the active descriptor checklist shows supply shortage at maximum strength (+13), inflation pressure at +10, and real asset sponsorship at +8. The category's three-ETF basket is remarkably tight—MOO 74.7, PDBA 74.6, VEGI 74.2—indicating consensus across agricultural expressions rather than concentration risk. MOO's selection as representative hinges on its marginally superior category-relative strength and cleaner entry setup, but all three names are being driven by identical macro forces: persistent supply constraints and price pressure. This allocation is high-confidence because the macro regime is not temporary; supply shortage and inflation pressure are structural, not cyclical. MOO's 10.7% downside to support and 0.0% upside to resistance signal that the move is nearly complete at current price, making this an allocation to be taken now rather than chased further higher.
Traditional Energy — XLE
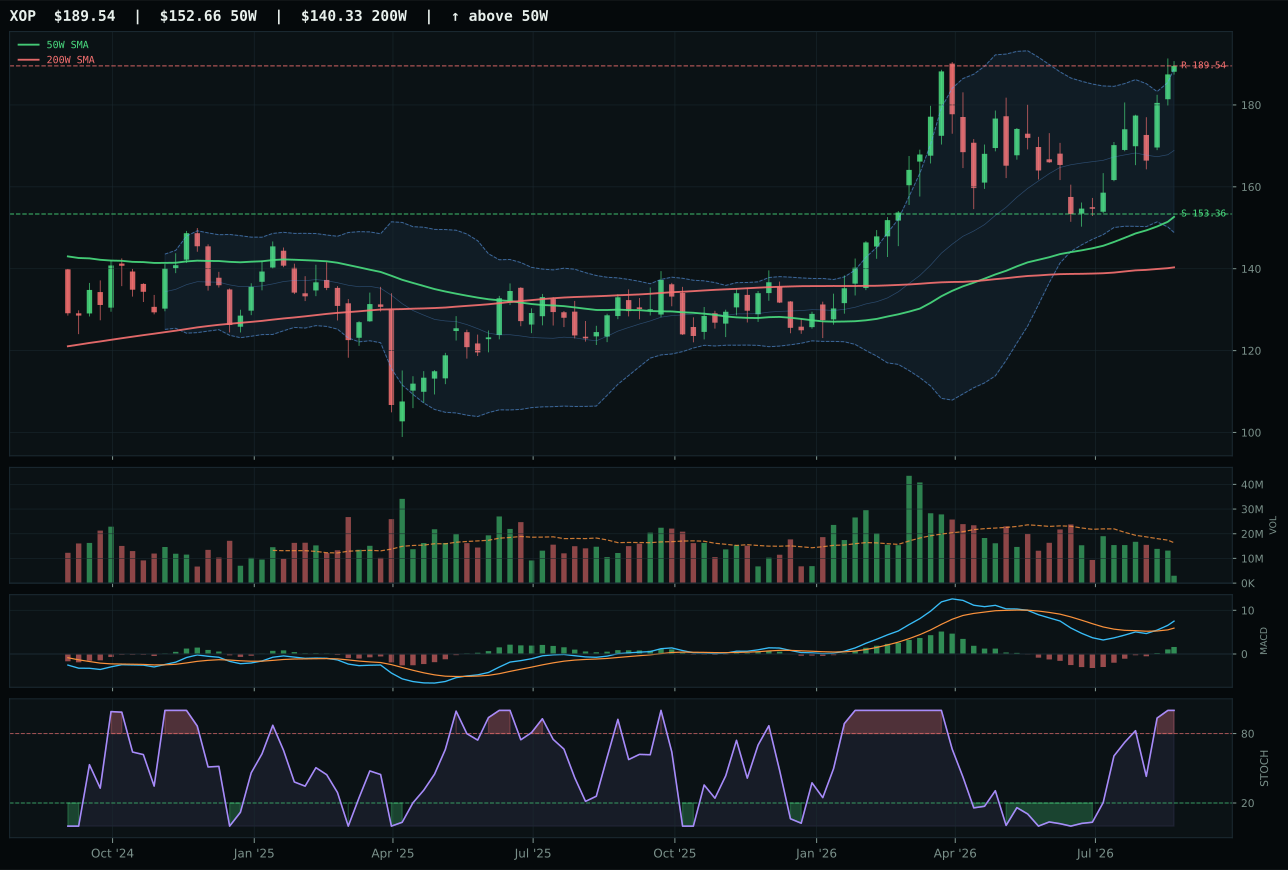
XOP has a vertical extension profile with 14.4% 13-week relative strength versus SPY.
A failed hold above support would weaken the setup.
Actionable but governed by invalidation levels.
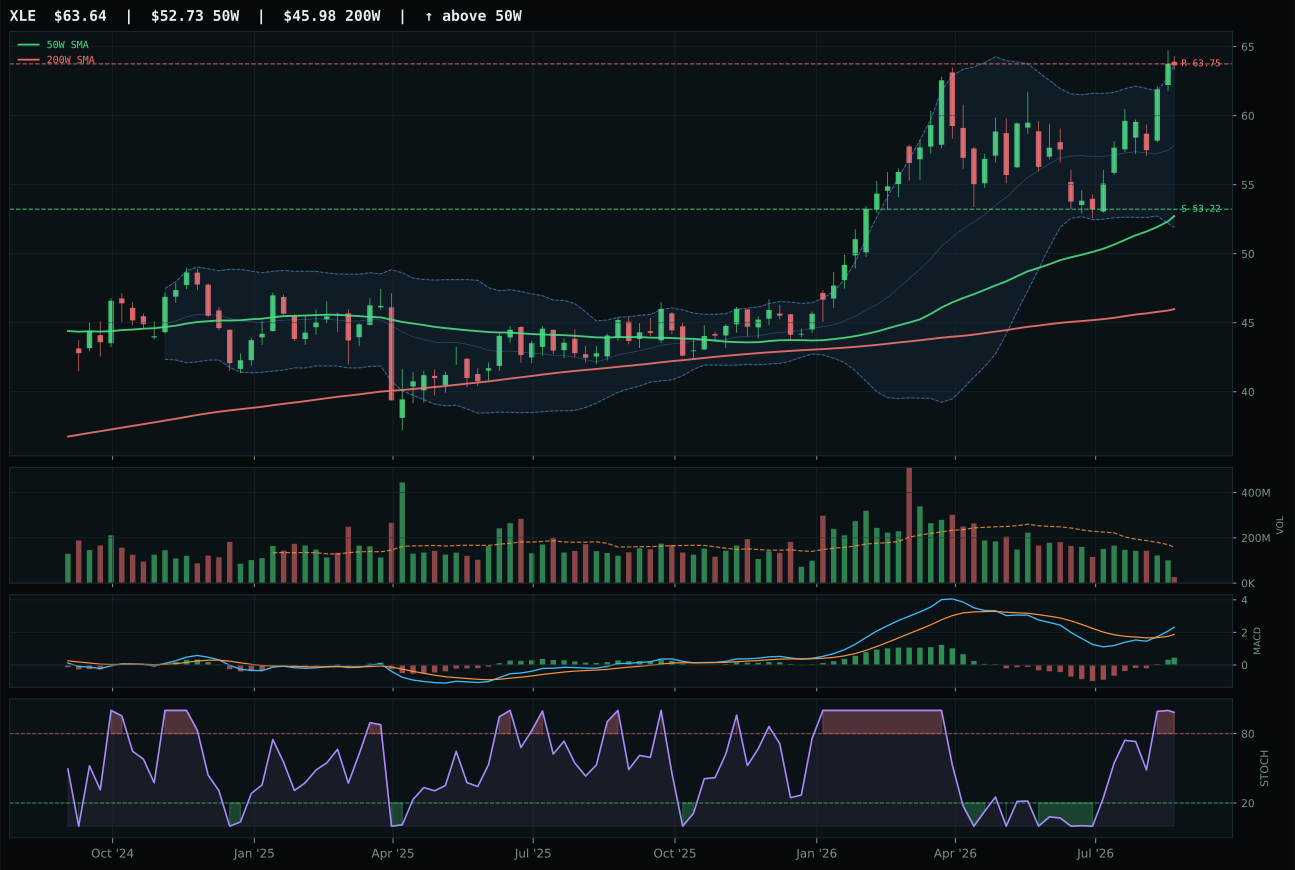
XLE has a vertical extension profile with 11.8% 13-week relative strength versus SPY.
A failed hold above support would weaken the setup.
Actionable but governed by invalidation levels.
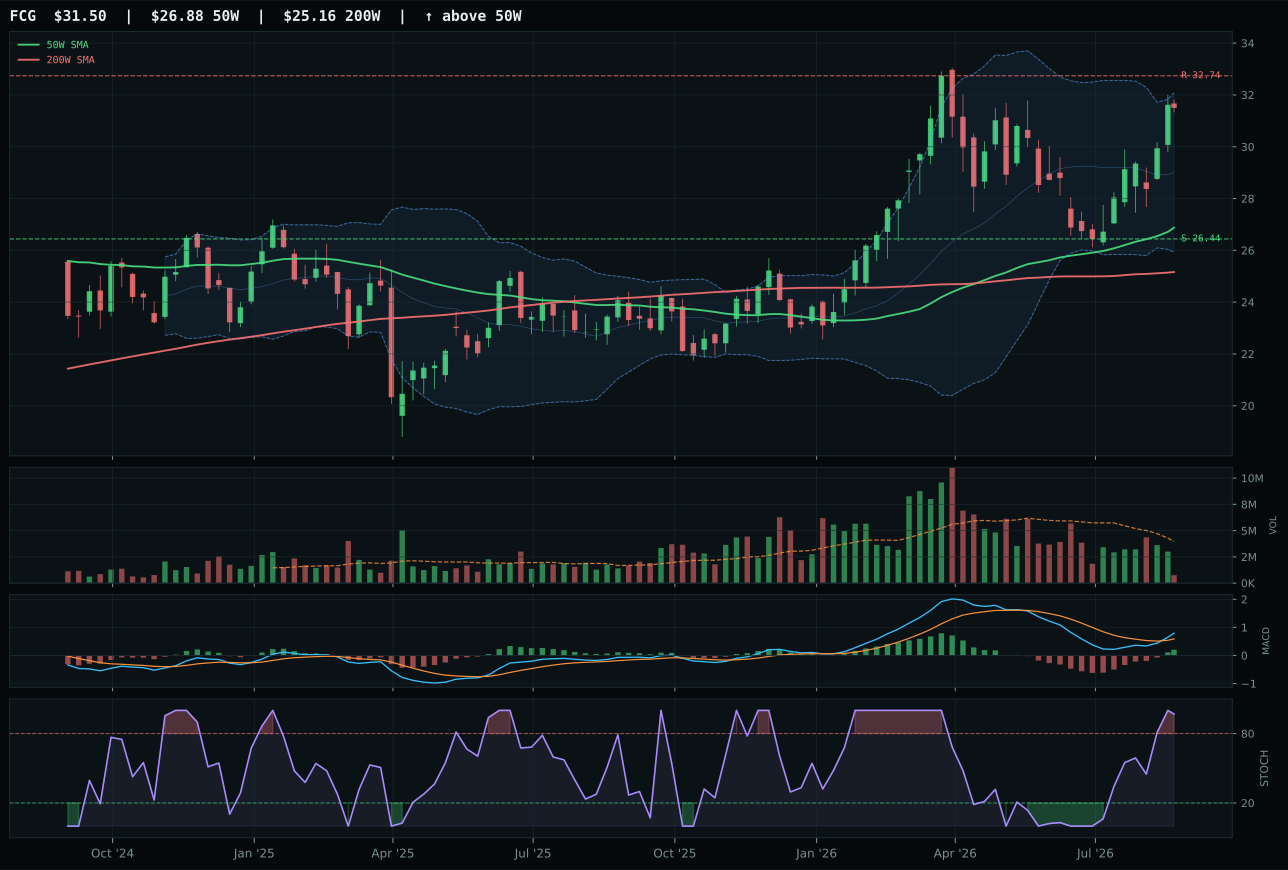
FCG has a vertical extension profile with 9.2% 13-week relative strength versus SPY.
A failed hold above support would weaken the setup.
Actionable but governed by invalidation levels.
XLE edges out XOP by 1.6 points in the closest category battle of the week, both trading as identical vertical extensions 20.7% and extended with perfect momentum (100.0) and matching overbought stochastic RSI. XLE's trend score of 100.0 matches XOP's trend of 100.0, structure at 69.4 barely edges XOP at 69.4, and both timing scores sit at 37.0—yet XLE won. The deciding factor is a 24.1-point advantage in macro narrative fit: XLE scores 86.0 versus XOP's 55.0, reflecting that integrated energy cash-flow defense receives more portfolio-level support than exploration beta in this macro regime. XLE's SPY relative strength of 11.8% is modestly lower than XOP's 14.4%, but the macro weighted voting system favors the defensive integrated structure. Both show perfect momentum confirmation (100.0) and identical volume participation at 0.17x and 0.66x averages. The technical setup is virtually interchangeable; the macro regime chose XLE's stability thesis over XOP's upside leverage.
Traditional Energy earned 10% as a top-2 overweight on a 77.1 category score backed by a 90.0 macro fit that rivals Agriculture's strength. Energy scarcity is active at +16, late-cycle reflation supports this exposure at +12, inflation pressure contributes +10, supply shortage adds +9, and real asset sponsorship provides +7—a cumulative +54 points of pure macro tailwind. XLE's 61.3 technical evidence score combined with 86.0 macro narrative fit creates a compelling total that justifies top-2 allocation. The risk is entry timing: XLE sits 20.7% extended from the 50W with a 37.0 timing score and only -0.2% upside to resistance, parameters that indicate the near-term move is exhausted. This allocation is not a chase; it is a recognition that late-cycle reflation with active energy scarcity, supply shortage, and inflation pressure creates structural demand that will persist even if price consolidates here. Capital allocation at 20% reflects conviction in the macro setup and understanding that extended entry into a multi-month winner is acceptable when the driver—energy scarcity—is not going to resolve quickly.
Biotech & Genomics — ARKG
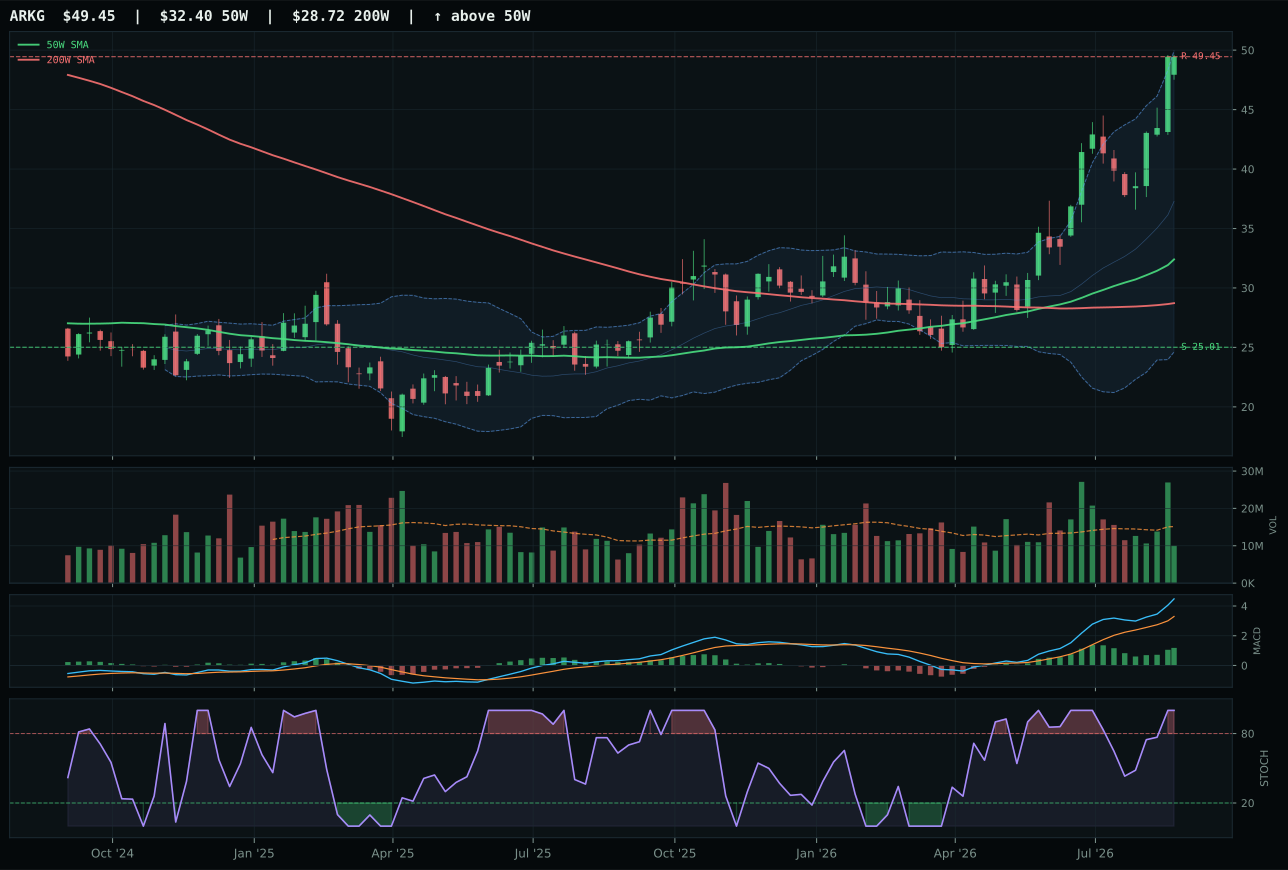
ARKG has a vertical extension profile with 41.5% 13-week relative strength versus SPY.
A failed hold above support would weaken the setup.
Actionable but governed by invalidation levels.
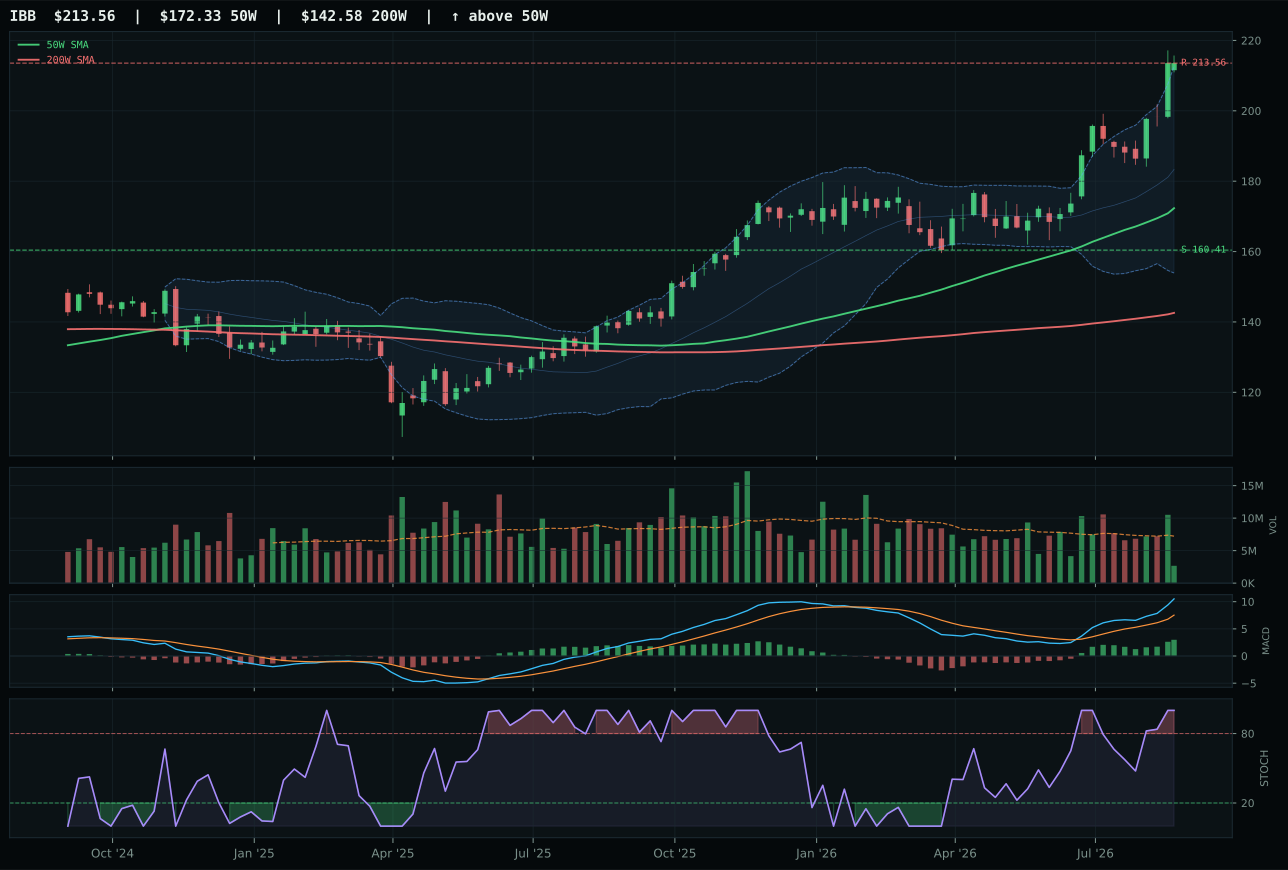
IBB has a vertical extension profile with 22.8% 13-week relative strength versus SPY.
A failed hold above support would weaken the setup.
Actionable but governed by invalidation levels.
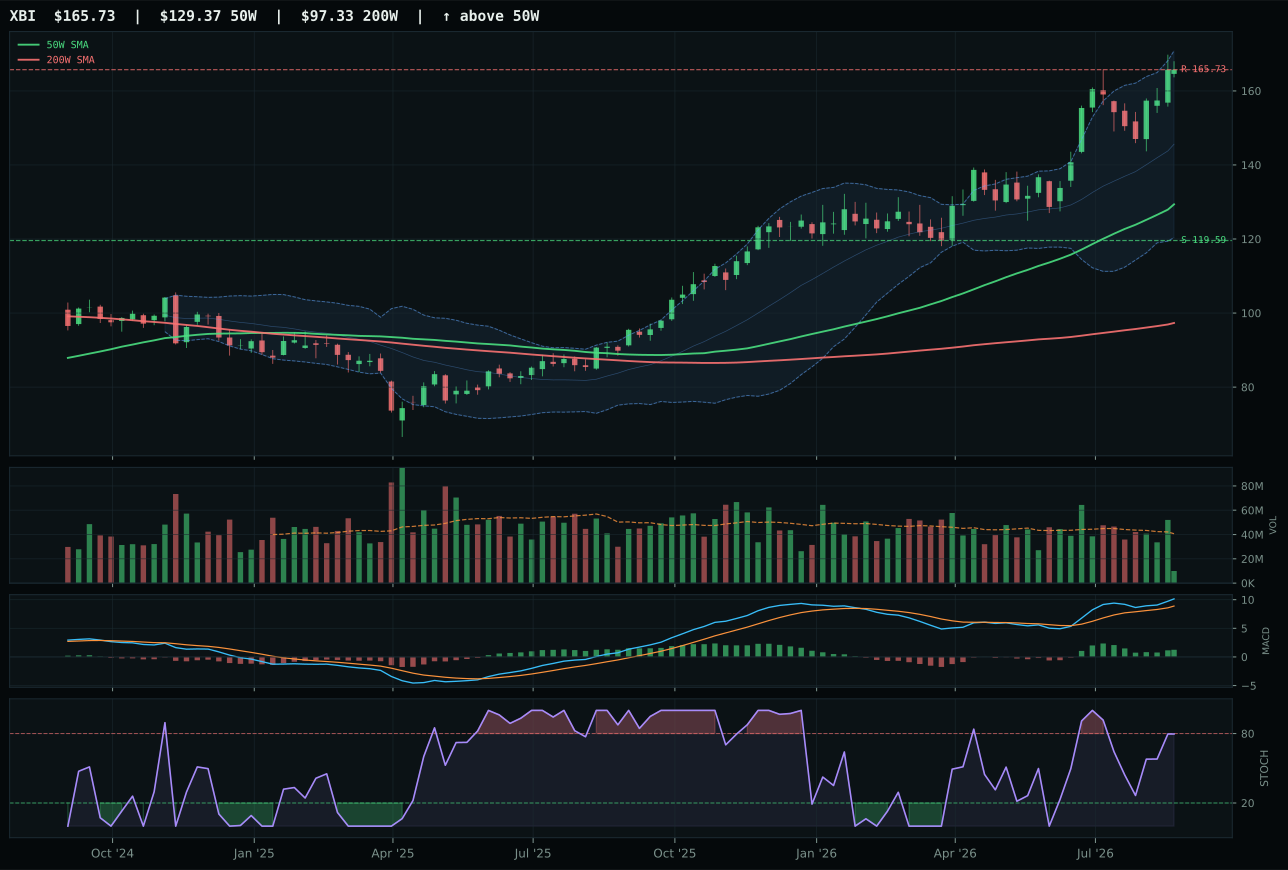
XBI has a vertical extension profile with 20.0% 13-week relative strength versus SPY.
A failed hold above support would weaken the setup.
Actionable but governed by invalidation levels.
Precious Metals — GDX
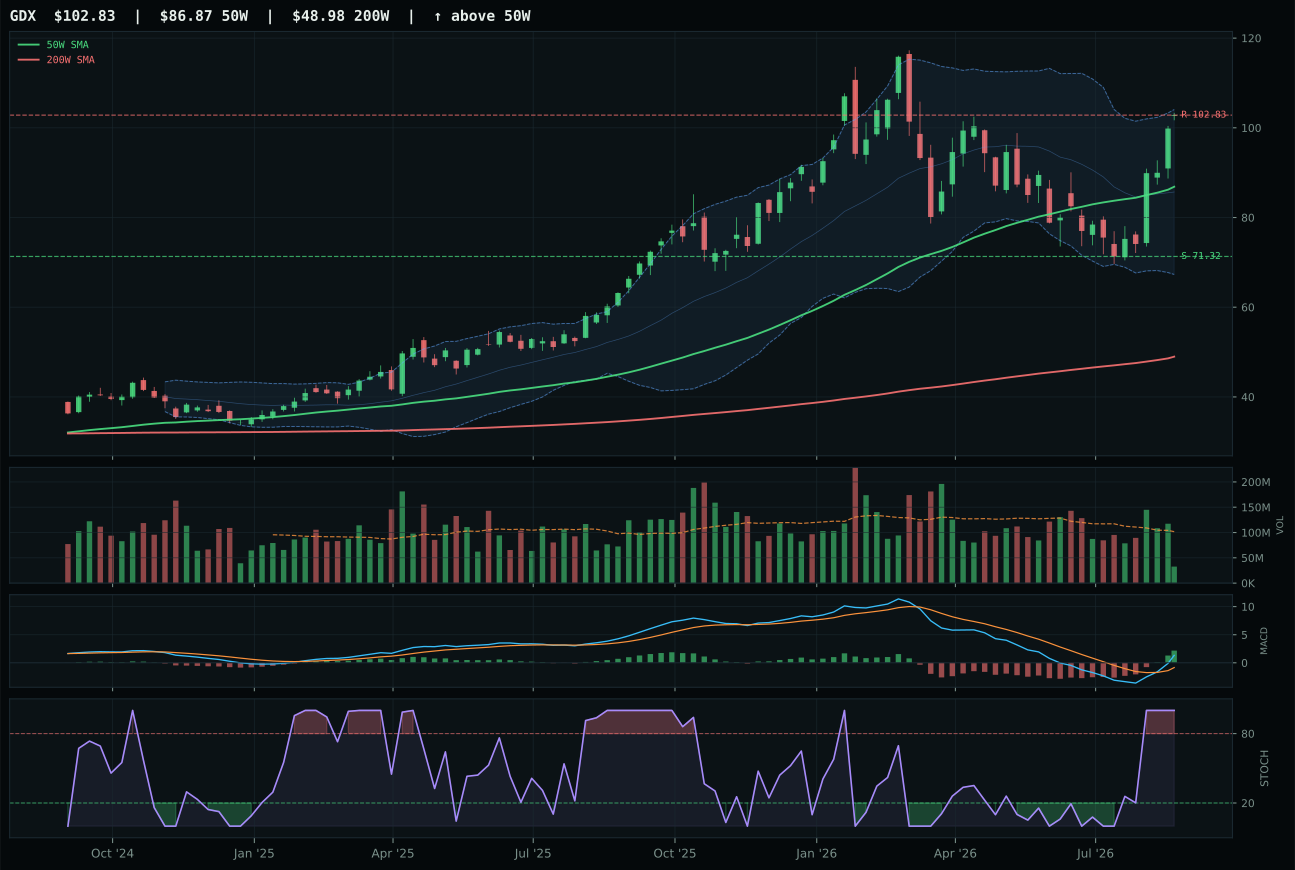
GDX has a vertical extension profile with 13.7% 13-week relative strength versus SPY.
A failed hold above support would weaken the setup.
Actionable but governed by invalidation levels.
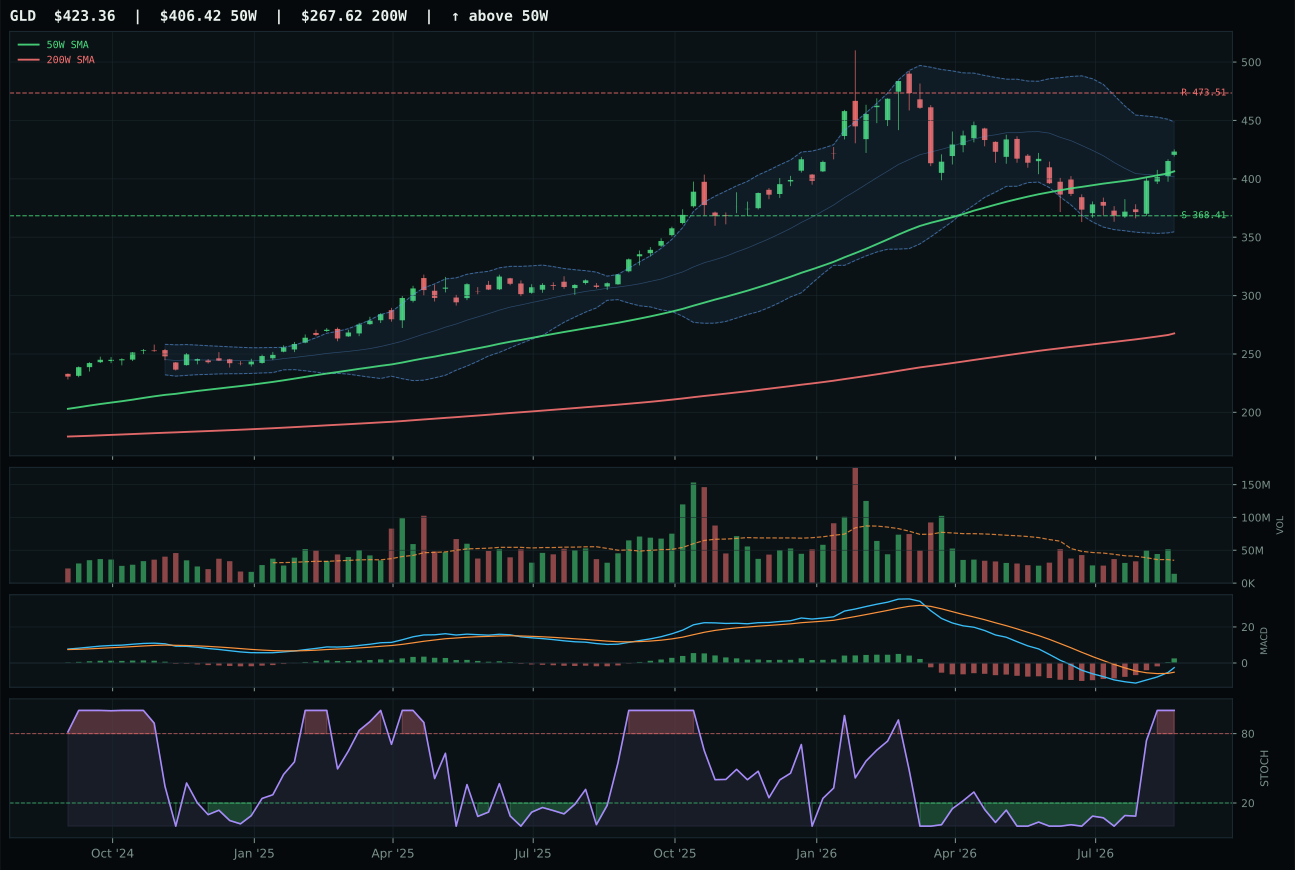
GLD has a neutral structure profile with 0.3% 13-week relative strength versus SPY.
A failed hold above support would weaken the setup.
Actionable but governed by invalidation levels.
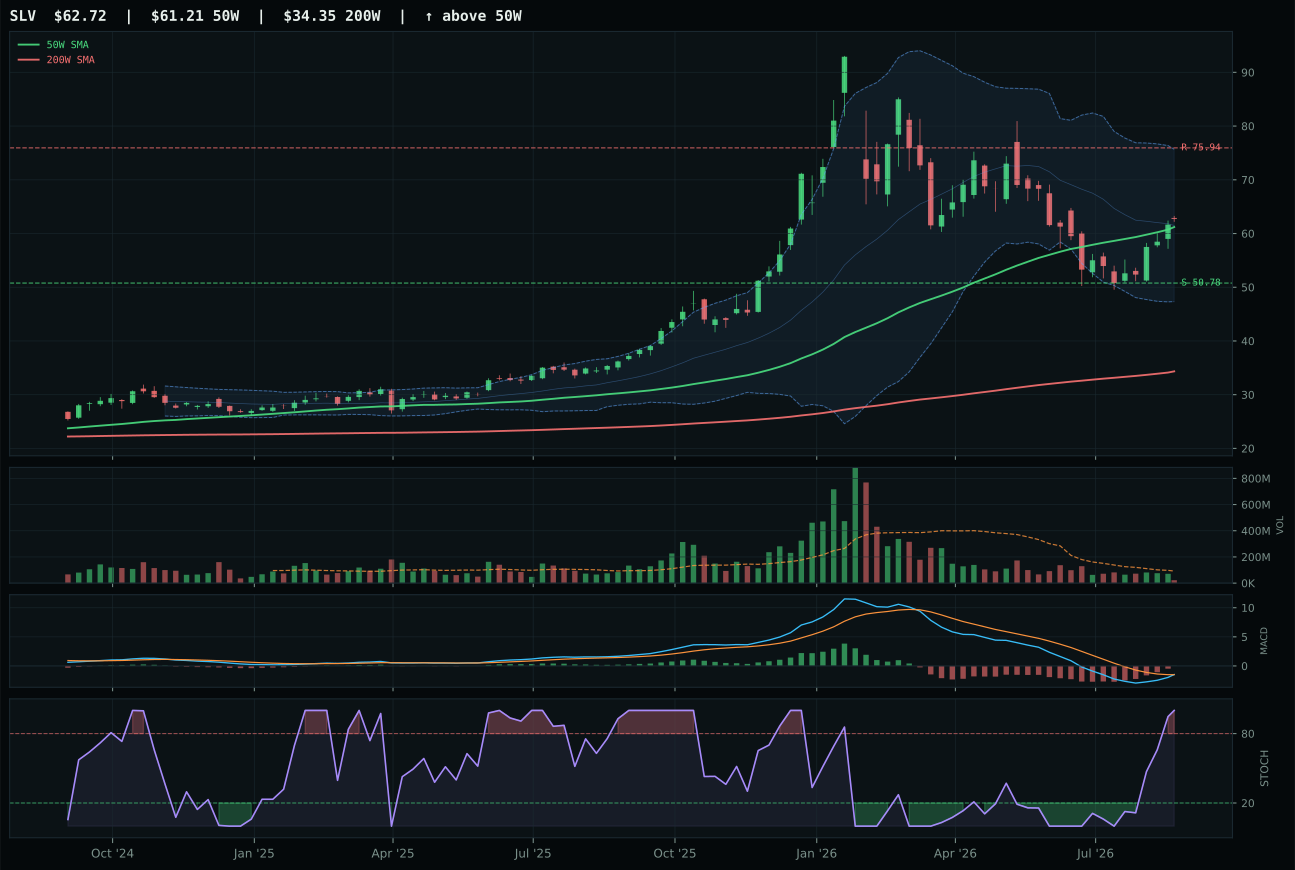
SLV has a compression near 50W profile with -9.4% 13-week relative strength versus SPY.
A failed hold above support would weaken the setup.
Actionable but governed by invalidation levels.
GDX wins Precious Metals by 12.2 points over GLD despite GLD's superior technical composite of 85 versus GDX's 73, because GDX's category-relative strength of 13.4% obliterates GLD's 0.0% in a head-to-head basket test. GDX is extended 18.4% above the 50W with perfect trend confirmation (100.0) and perfect momentum confirmation (100.0), but the 45.0 timing score reflects real entry risk from the elevation. GLD is only 2.6% extended with neutral structure and matching bullish confirmation, creating the inferior setup despite stronger absolute technicals. The deciding factor is buyer behavior: GDX's 13.7% SPY relative strength and 4W return of 38.8% show that capital is rotating into gold miners as leveraged monetary exposure, not into the bullion proxy. GLD's 0.3% SPY relative strength and 1.5% 13W return reveal passive tracking rather than active accumulation. Both sit at overbought stochastic RSI 1.00, but only GDX shows the volume-price confirmation (70.8) to validate the move as structural rather than tactical.
Precious Metals earned 5% as tier-2 allocation despite GDX's strong momentum because the category's 56.7 score and 50.0 macro fit reflect neutral to negative macro environment. No descriptor strongly favors or penalizes precious metals in a late-cycle reflation regime; liquidity stress and credit stress are present but do not create the urgent demand for monetary hedges that would justify a top-2 overweight. GDX's momentum (100.0) is offset by its extended entry at 18.4% above the 50W and its low timing score of 45.0—parameters that suggest late-stage participation rather than early accumulation. The allocation is tactical, held because gold miners are behaving well technically and offer real leverage to a potential liquidity event, but the macro regime does not yet justify overweighting. If credit stress or liquidity stress flags intensify in coming weeks, GDX becomes a top-2 candidate immediately. For now, 10% represents recognition of the setup's quality while respecting the constraints of a reflation regime where inflation is being managed, not in crisis.
Nuclear Energy — URNM
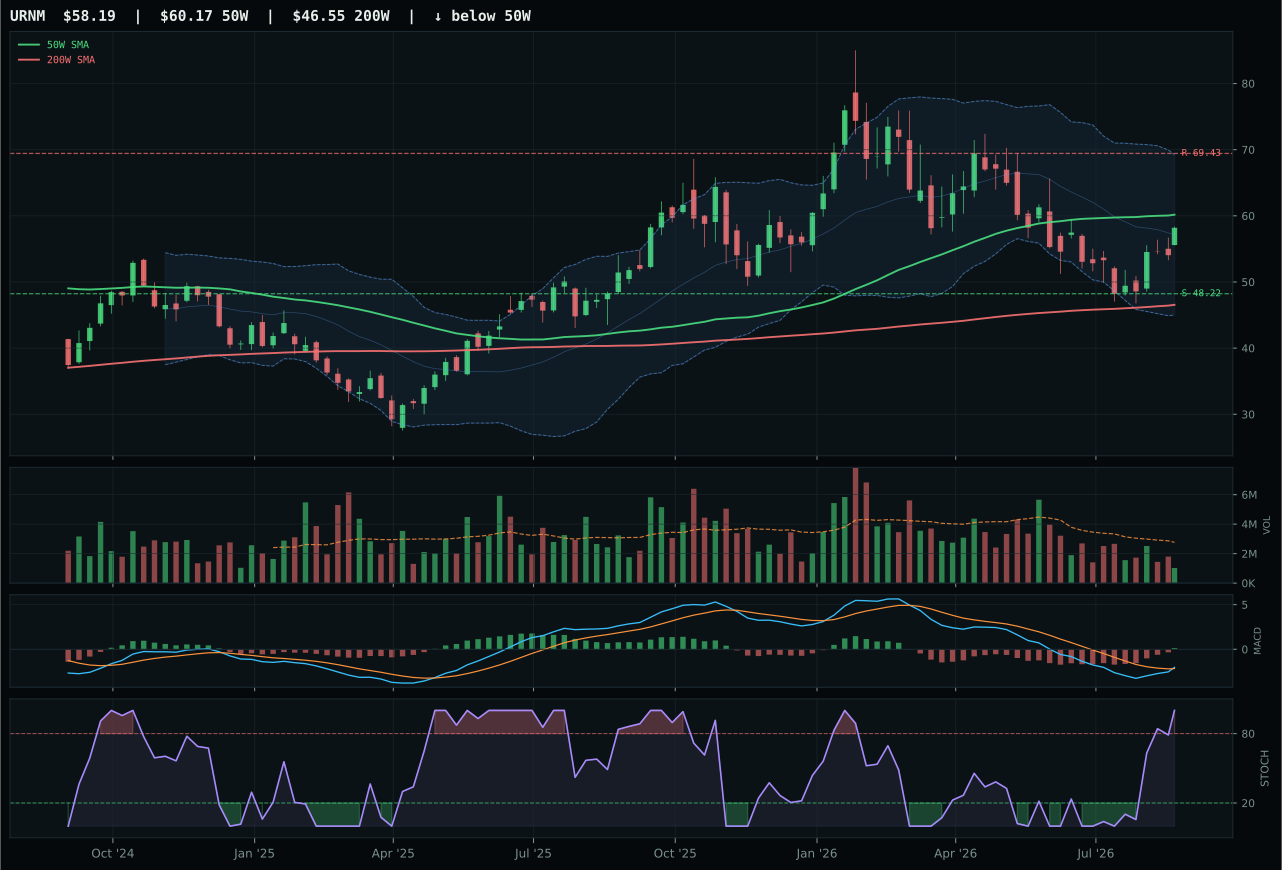
URNM has a neutral structure profile with -6.3% 13-week relative strength versus SPY.
A failed hold above support would weaken the setup.
Actionable but governed by invalidation levels.
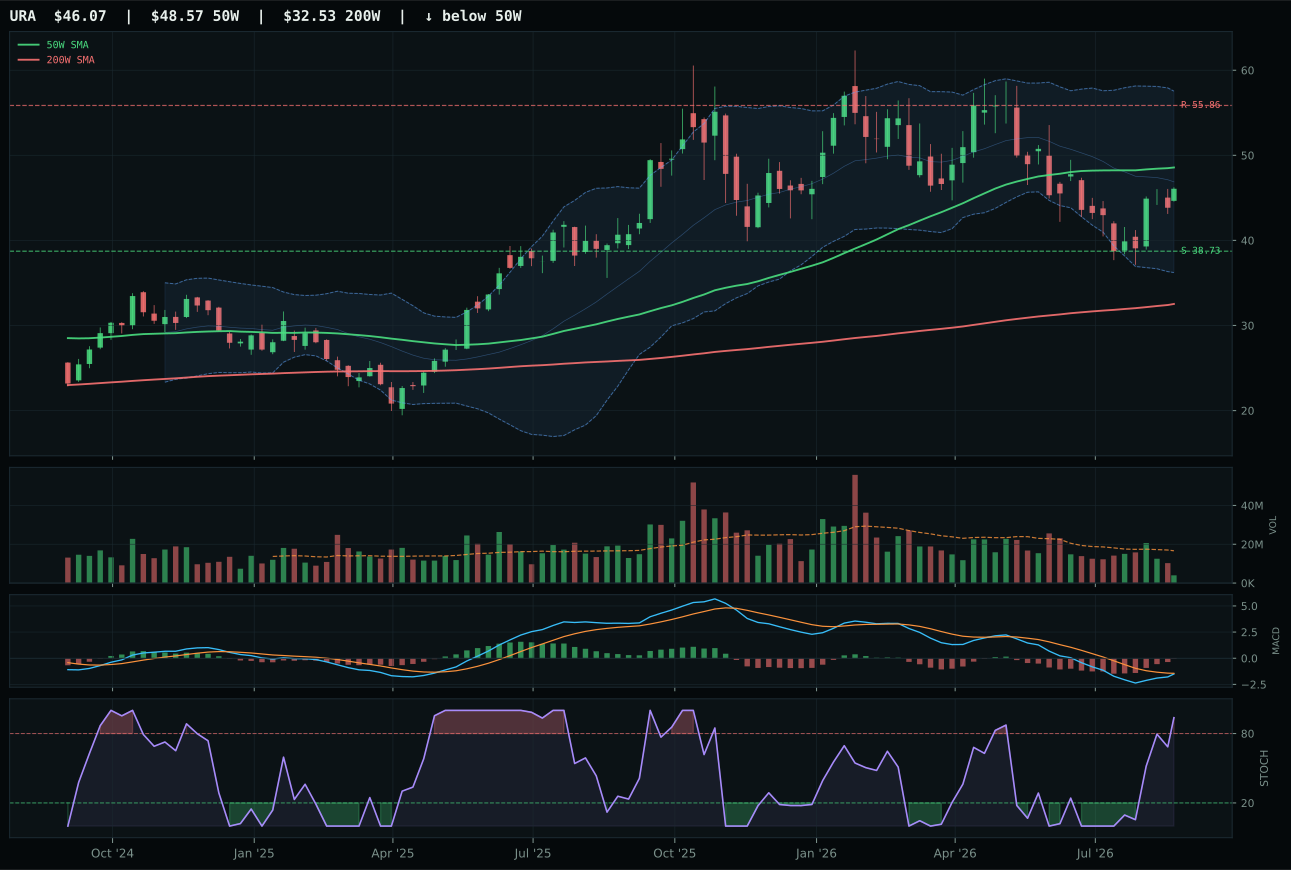
URA has a neutral structure profile with -10.5% 13-week relative strength versus SPY.
A failed hold above support would weaken the setup.
Actionable but governed by invalidation levels.
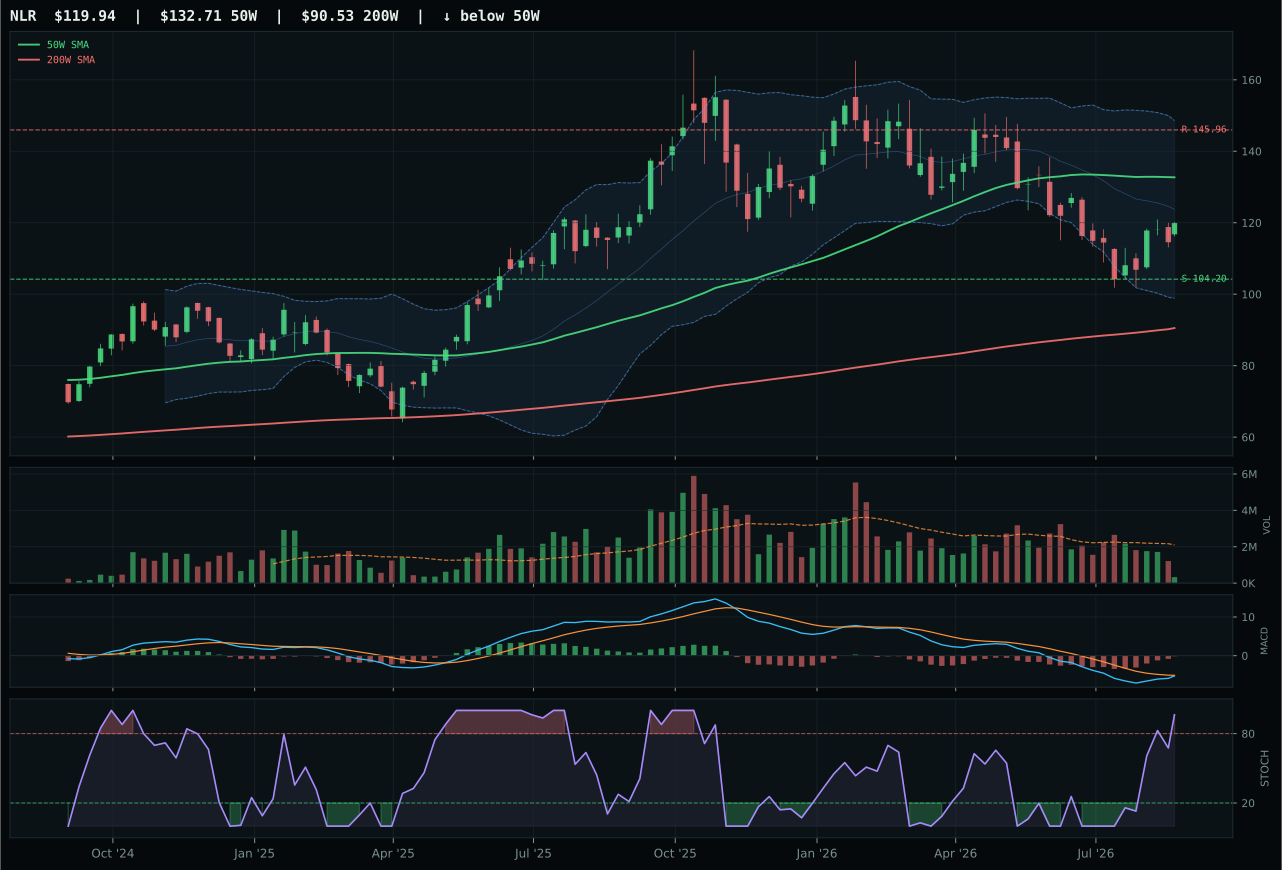
NLR has a neutral structure profile with -11.2% 13-week relative strength versus SPY.
A failed hold above support would weaken the setup.
Actionable but governed by invalidation levels.
URNM wins a weak Nuclear Energy category by 9.4 points over URA because timing quality overrides trend weakness. URNM is below the 50W at -3.3%, creating a pullback-into-support setup with a timing score of 97.0 versus URA's 82.0—a 15-point differential in entry quality. URNM's MACD is bullish and improving while URA's is merely bearish but improving, a meaningful distinction when both stochastic RSI readings show overbought momentum at 1.00. URNM's structure score of 64.9 matches URA's 64.6, and both sit in neutral structures, but URNM's Fibonacci location at 0.618 (deep retracement/value zone) is superior to URA's identical zone because the proximity to the 50W creates lower-risk entry mechanics. URNM's 4W return of 19.8% confirms fresh momentum despite the 13W return of -5.0%, indicating that this is a genuine coil setup breaking higher, not a dead cat bounce. Volume participation at 0.37x average remains thin, but the category-relative strength advantage of 4.2% versus 0.0% shows buyer consensus favoring URNM.
Nuclear Energy earned 5% as tier-2 allocation on a 45.9 category score that reflects a tight macro fit of 60.0 in a reflation environment. Energy scarcity is active at +9, late-cycle reflation supports this exposure at +7, real asset sponsorship provides +7, and inflation pressure contributes +3, but liquidity stress and credit stress offset some gains at -7. URNM's 63.8 technical evidence score is robust for a tier-2 category, and the timing setup at 97.0 is exceptionally clean—a pullback into support just above the 200W is textbook position setup. The -6.3% SPY relative strength and -5.0% 13W return reveal that nuclear has lagged the market, creating the risk that this is a trap move rather than the start of a sustained rally. However, the macro case is legitimate: energy scarcity and real asset sponsorship are structural, and URNM's pullback creates a lower-risk entry than the extended commodity leaders. To upgrade to 20%, Nuclear would need to see either energy scarcity intensify further or URNM break above the 52W high on volume expansion. For now, 10% represents conviction in the setup with appropriate caution about category leadership.
Defense & Aerospace — ROKT
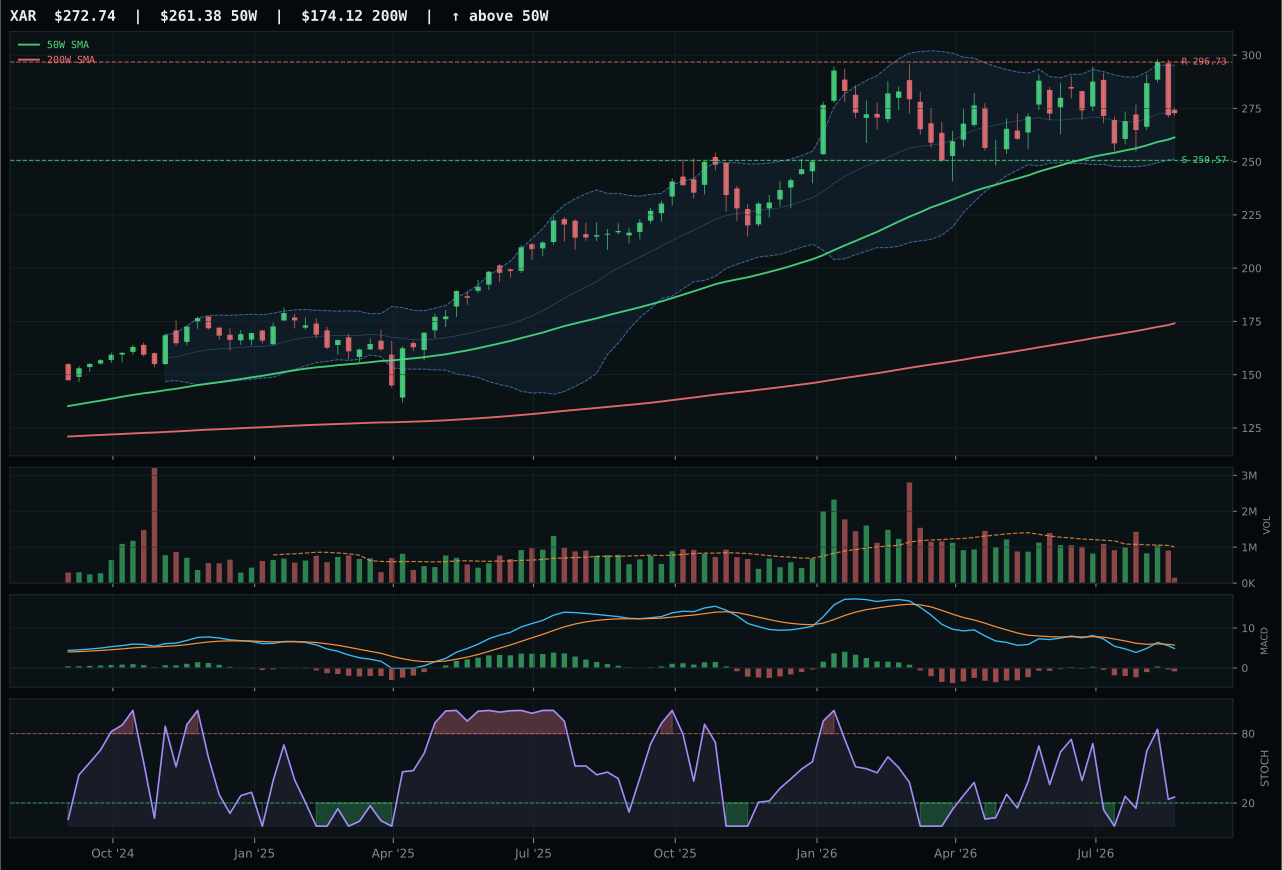
XAR has a neutral structure profile with -6.5% 13-week relative strength versus SPY.
A failed hold above support would weaken the setup.
Actionable but governed by invalidation levels.
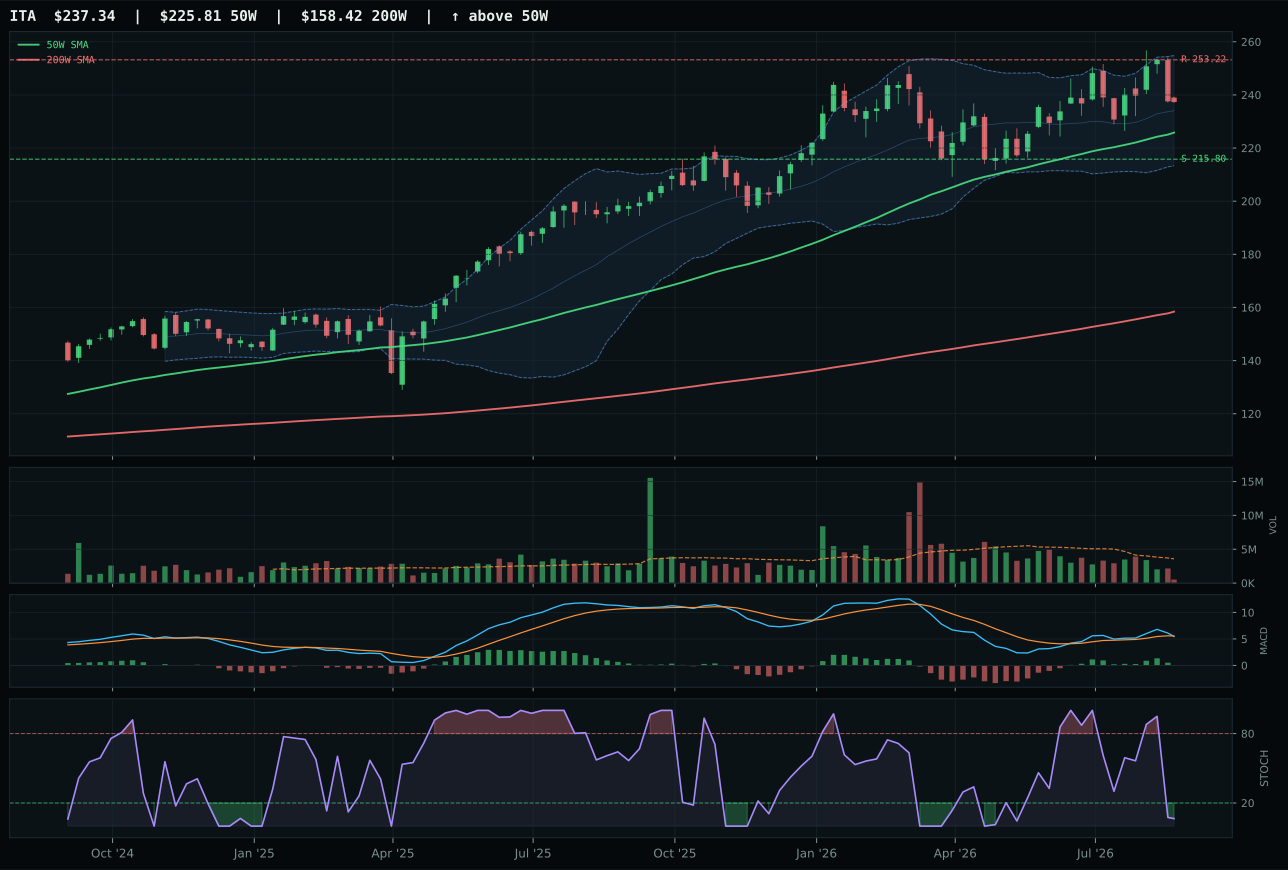
ITA has a neutral structure profile with -0.4% 13-week relative strength versus SPY.
A failed hold above support would weaken the setup.
Actionable but governed by invalidation levels.
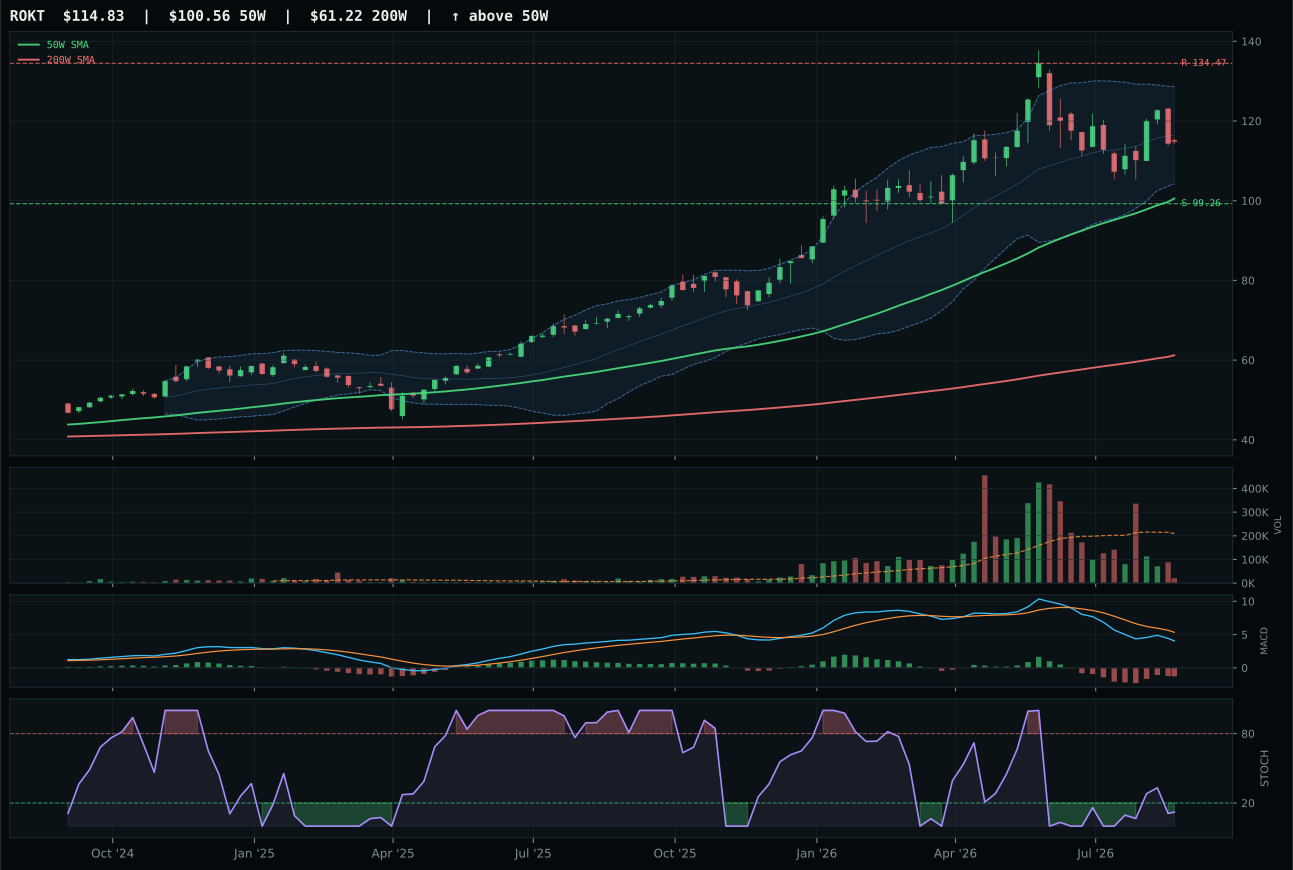
ROKT has a neutral structure profile with -15.8% 13-week relative strength versus SPY.
A failed hold above support would weaken the setup.
Actionable but governed by invalidation levels.
XAR edges out ITA by 4.2 points on a superior timing setup despite both sitting in neutral structure with weak momentum confirmation. The decisive difference is XAR's timing score of 90.0 versus ITA's 70.0, driven by XAR being just 4.3% below the 50W (a near-perfect entry point) with MACD bearish but improving and stochastic RSI at 0.25 in the falling/neutral zone. ITA is further stretched at an undefined distance but shows stochastic RSI oversold and MACD that is bearish and weakening, not improving. Risk/reward tilts toward XAR at 61.5 versus 56.3, reflecting XAR's tighter entry. The -6.5% SPY relative strength and -5.3% 13W return are concerning for both, but XAR's neutral structure and clean timing setup make it the less risky tactical hold. Volume at 0.15x average is thin, confirming that defense exposure is not receiving fresh capital inflows despite the category's macro tailwinds.
Defense & Aerospace earned 5% as tier-2 despite a solid 40.4 category score because two higher-ranked categories claimed the top-2 allocation slots. The macro fit for this category is actually strong at 61.0, supported by late-cycle reflation (+6), a broad market bear signal (+6), and credit stress that is present but offset by the defensive nature of the exposure. XAR's technical evidence scores 58.2, making the total composite competitive, but the category's own relative weakness—negative SPY and category-relative strength—prevents it from breaking into the overweight tier. The position merits holding because late-cycle regimes typically rotate into stability plays like defense, and XAR's pullback into support creates a lower-risk entry point than either of the two overweight names currently offer. To upgrade to 20%, Defense would need to see either meaningful positive relative strength develop or the broad market bear signal to reverse. For now, 10% represents conviction in the macro setup offset by recognition that buyer interest remains tepid.
Utilities & Infrastructure — PAVE
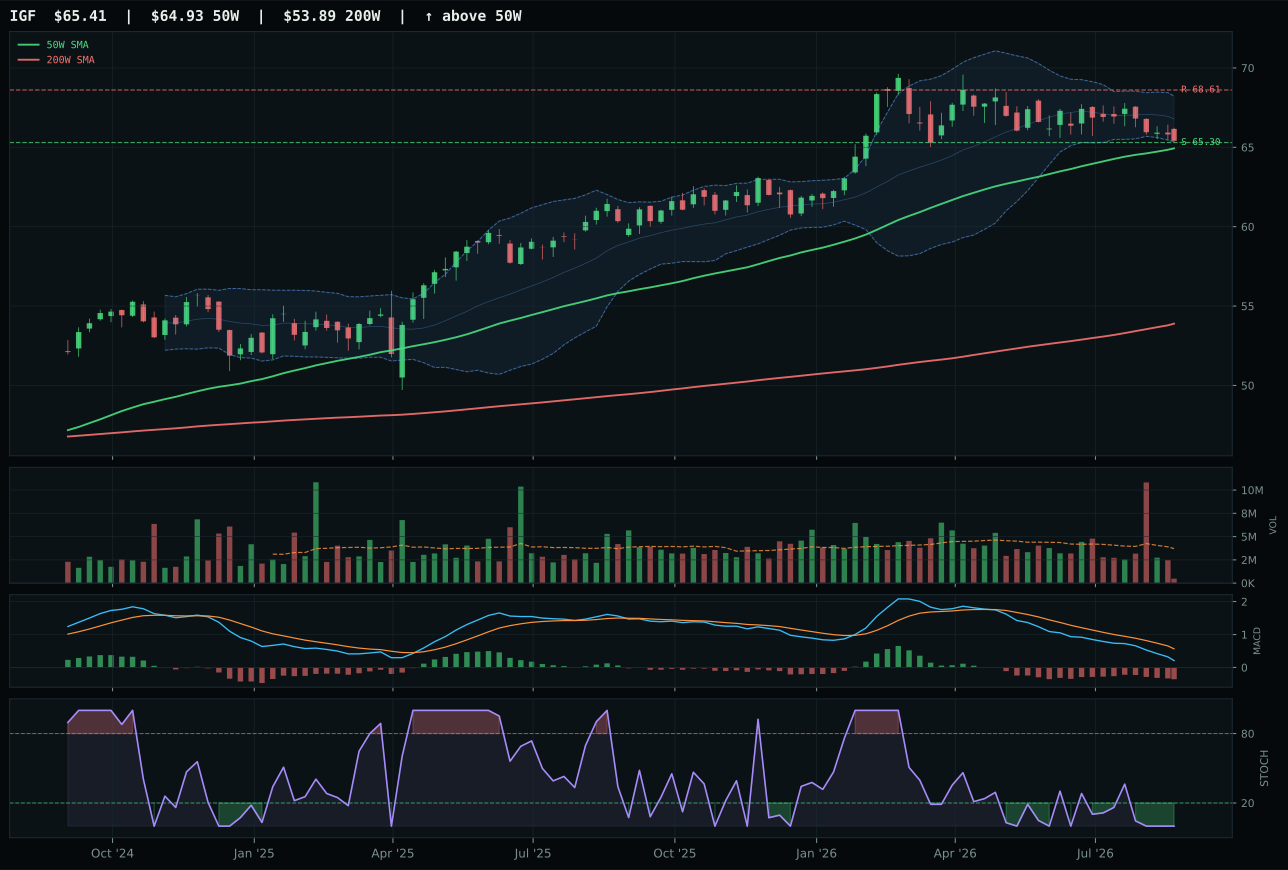
IGF has a pullback into support profile with -3.0% 13-week relative strength versus SPY.
A failed hold above support would weaken the setup.
Actionable but governed by invalidation levels.
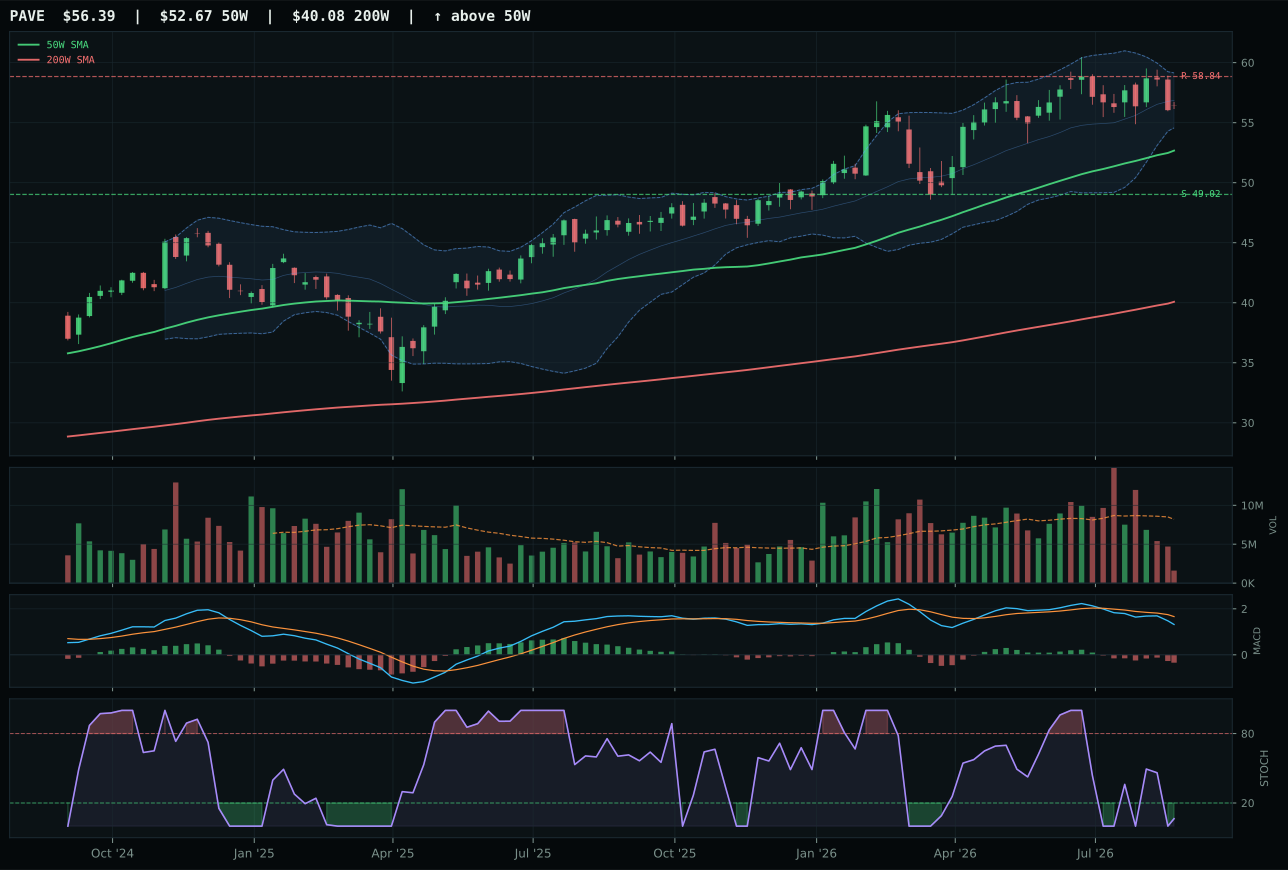
PAVE has a neutral structure profile with -1.1% 13-week relative strength versus SPY.
A failed hold above support would weaken the setup.
Actionable but governed by invalidation levels.
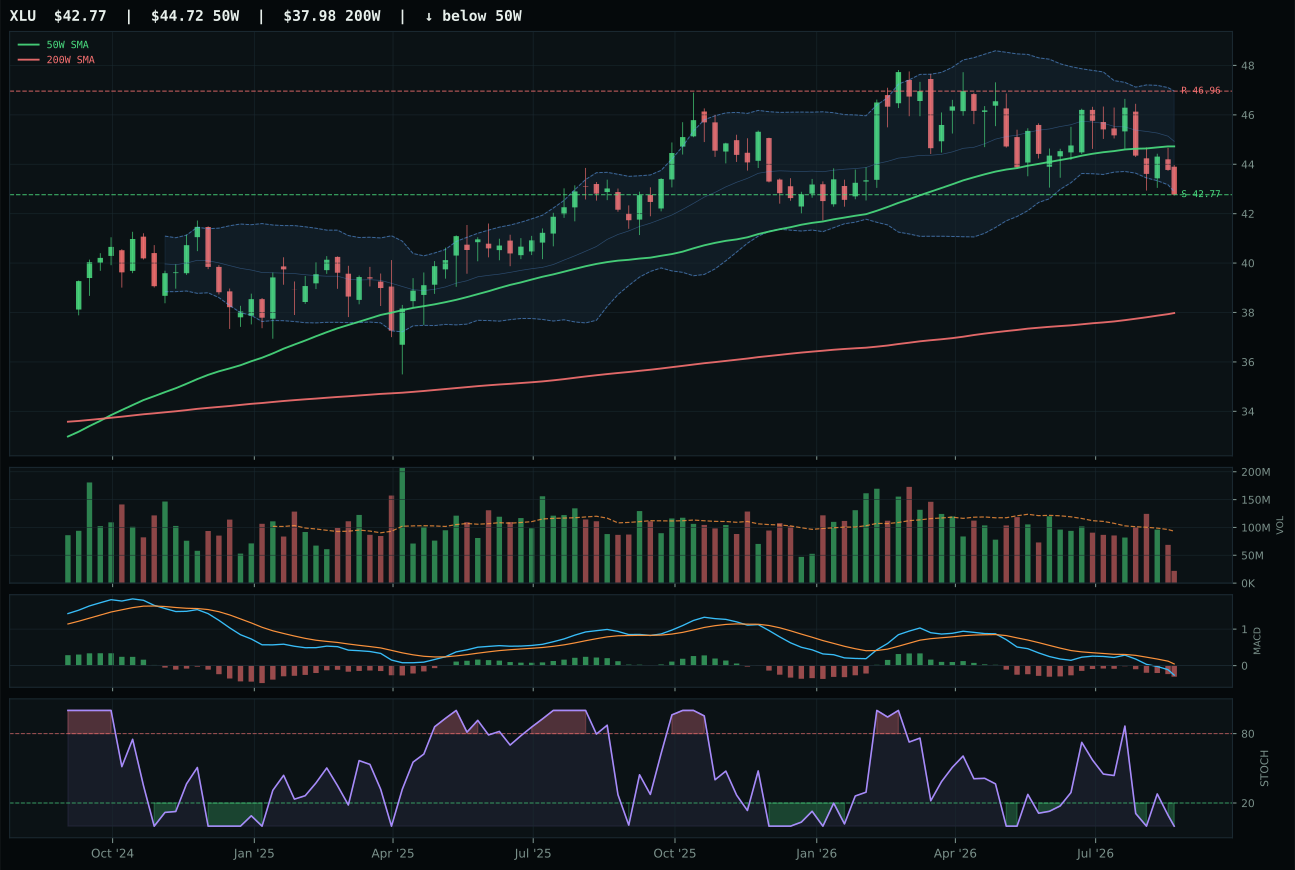
XLU has a pullback into support profile with -4.9% 13-week relative strength versus SPY.
A failed hold above support would weaken the setup.
Actionable but governed by invalidation levels.
PAVE edges out IGF by 1.9 points despite IGF's superior composite technical score of 77 versus PAVE's 64, because PAVE's category-relative strength of 1.9% defeats IGF's 0.0% in a basket where all three names are struggling. PAVE sits 7.1% above the 50W with trend score of 80.4 and timing at 70.0, whereas IGF's pullback-into-support setup creates a timing score of 100.0 but comes with an inferior trend score of 77.0. Both show MACD bearish/weakening and stochastic RSI oversold at 0.06, indicating neither name is generating fresh momentum—this is purely a technical mean reversion trade on weak momentum. PAVE's structure at 69.7 matches IGF's 69.6, but PAVE's neutral structure is cleaner than IGF's pullback-into-support because the latter requires a successful bounce confirmation that has not yet arrived. Risk/reward at 50.0 for PAVE versus IGF's exceptional 98.0 shows that IGF offers more downside protection, but in a category receiving 0% macro tailwind, timing quality matters more than risk geometry. PAVE's 0.1% 13W return and -1.1% SPY relative strength mirror the category dysfunction.
Utilities & Infrastructure earned 5% as tier-2 allocation despite a weak 36.4 category score and 49.0 macro fit because the portfolio's structure required six tier-2 slots. The macro regime provides modest tailwinds from growth expansion at +7 and commodity breadth positive at +4, but inflation pressure penalizes this exposure at -6, and liquidity stress at -3 creates conflicting signals. PAVE's 42.0 technical evidence score is the weakest of any tier-2 name, reflecting 32.3 momentum confirmation (near zero momentum participation), 42.6 volume-price confirmation, and 44.1 persistence. This is a placeholder allocation, not a conviction trade. The category merits holding for one reason only: late-cycle reflation sometimes produces a rotation into stable cash-flow generators like infrastructure once growth acceleration fears emerge, and PAVE's timing setup (70.0) is clean enough to catch that rotation if it begins. To upgrade to 20%, Utilities would need to show positive SPY relative strength develop and at least one name break above recent consolidation on volume expansion. For now, 10% represents portfolio completion rather than tactical alpha generation.
Industrial Metals — REMX
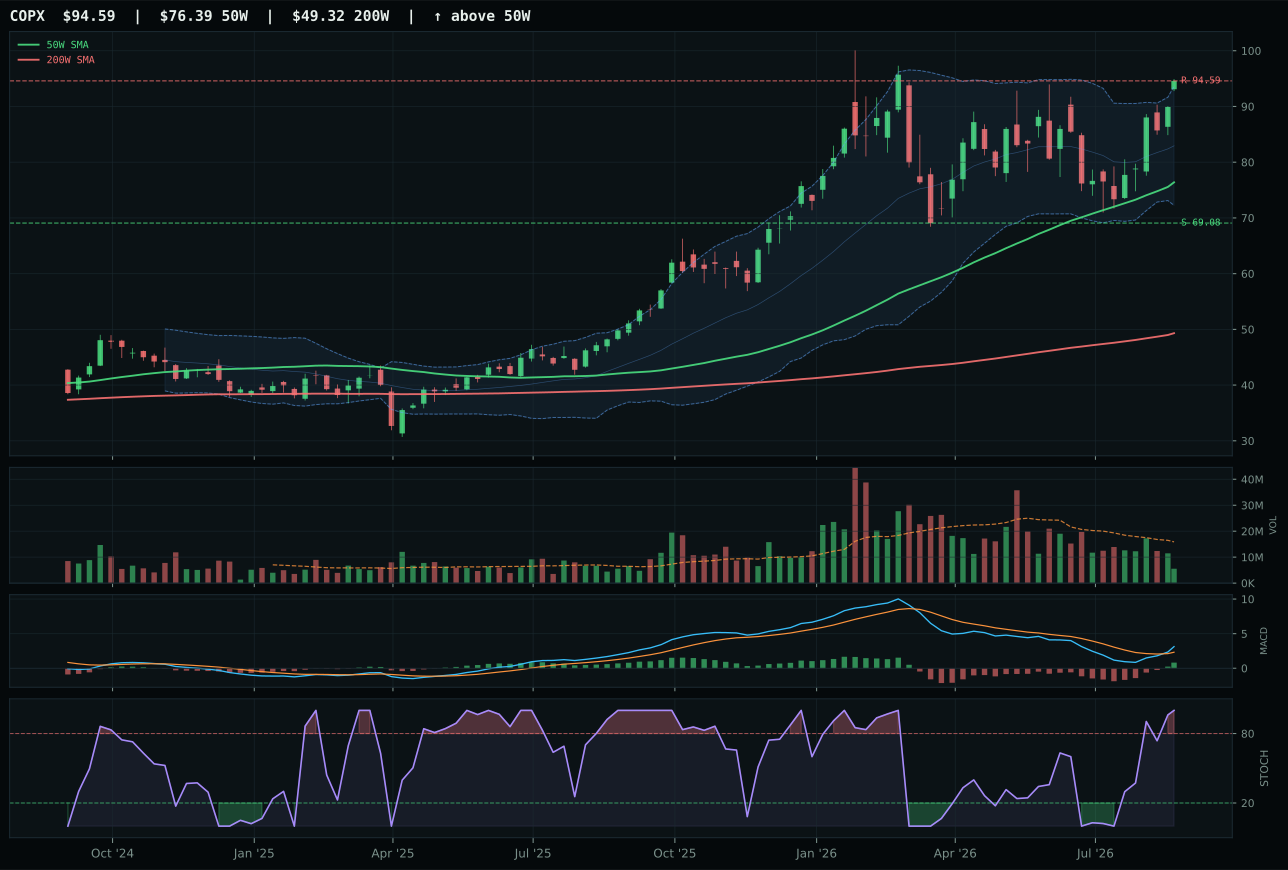
COPX has a vertical extension profile with 6.1% 13-week relative strength versus SPY.
A failed hold above support would weaken the setup.
Actionable but governed by invalidation levels.
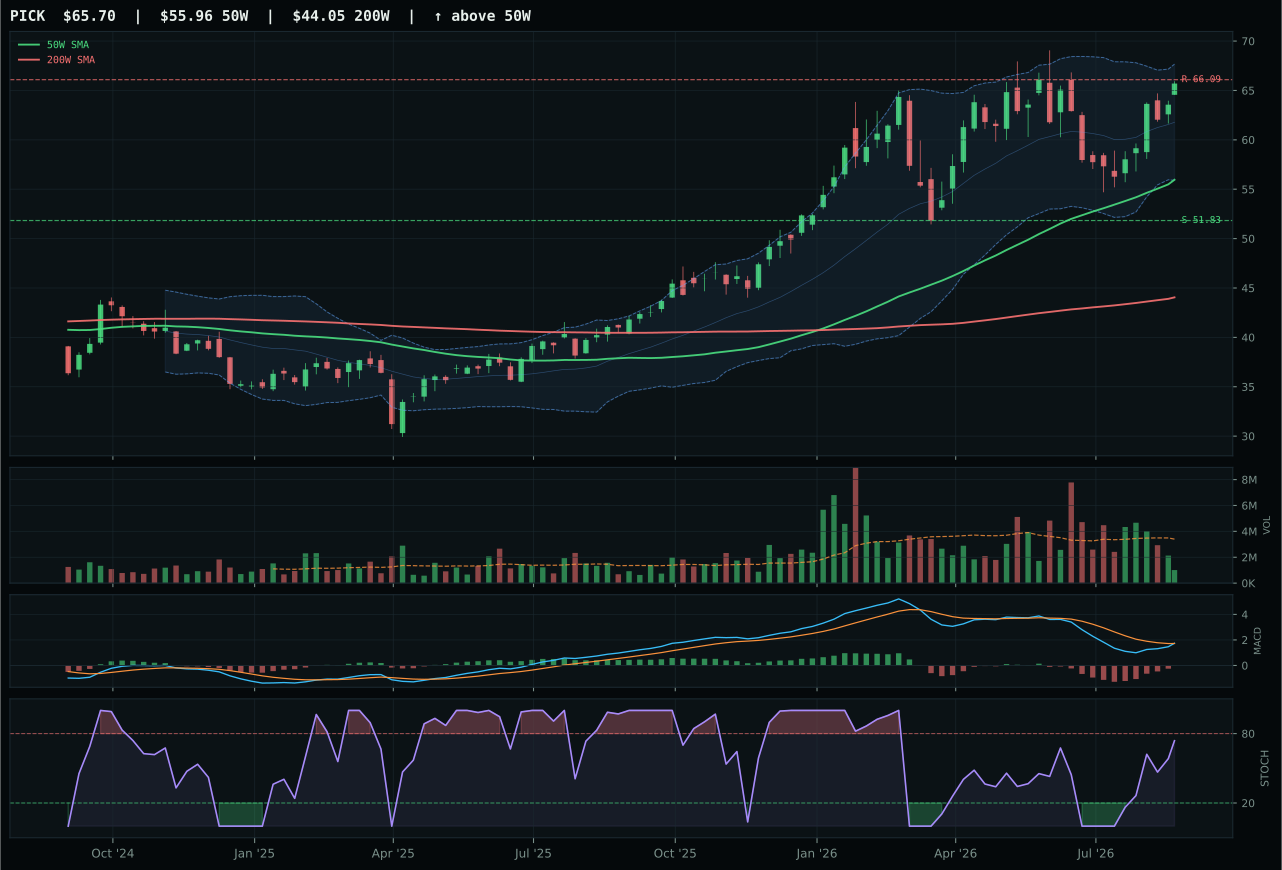
PICK has a vertical extension profile with -1.8% 13-week relative strength versus SPY.
A failed hold above support would weaken the setup.
Actionable but governed by invalidation levels.
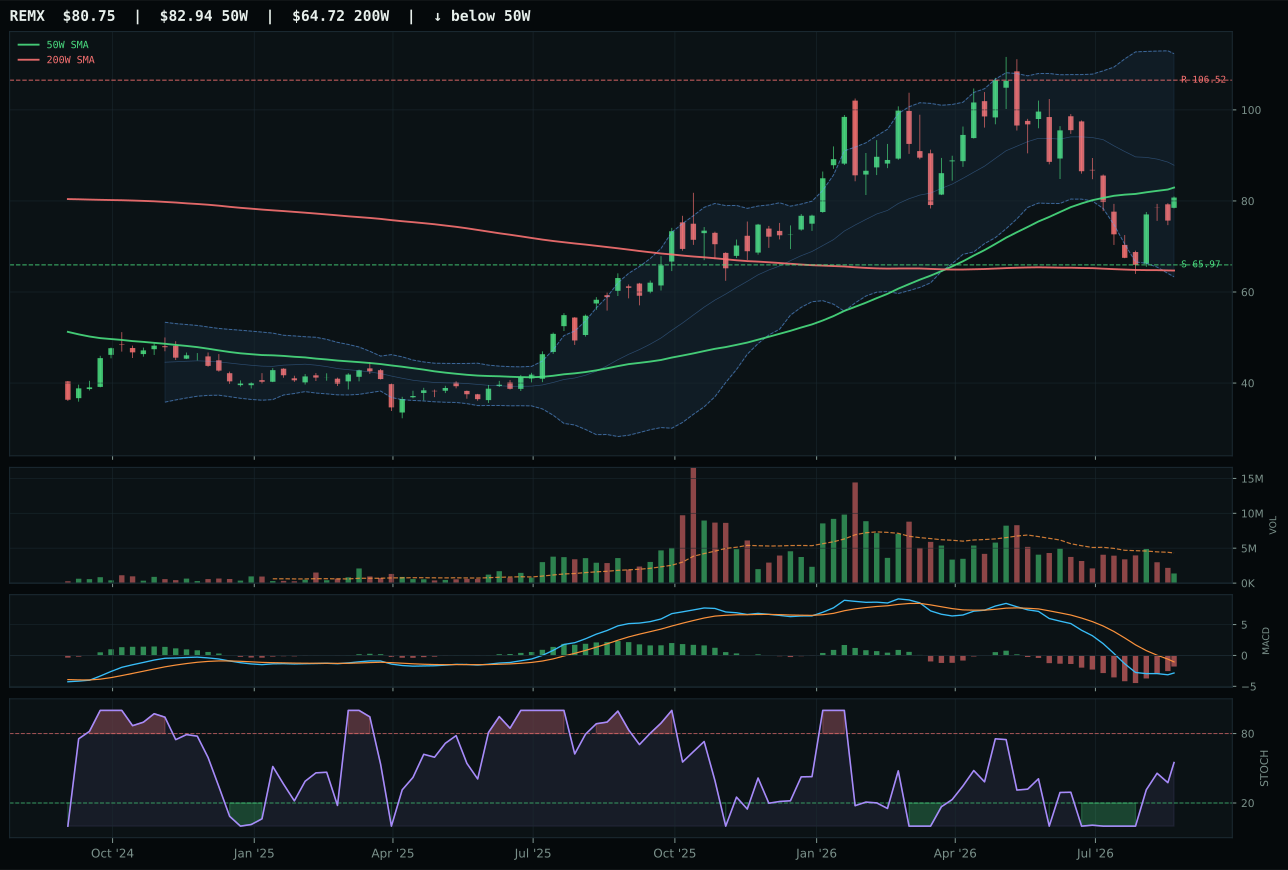
REMX has a compression near 50W profile with -20.2% 13-week relative strength versus SPY.
A failed hold above support would weaken the setup.
Actionable but governed by invalidation levels.
COPX defeats PICK by 6.0 points in a category where both are extended and both show bullish MACD with overbought momentum. COPX's 7.3% 13W return and 6.1% SPY relative strength are beaten by PICK's more neutral -0.6% and -1.8% respectively, but COPX's category-relative strength of 7.9% versus PICK's 0.0% is the tiebreaker in a basket where momentum and structure are nearly identical. COPX is 23.8% above the 50W versus PICK at a similar extension, but COPX's trend score of 100.0 and structure at 68.1 slightly edge PICK's 97.0 and 67.9. The real decision is relative strength: COPX shows active buyer consensus around copper scarcity thesis while PICK represents diversified mining that has lost momentum. COPX's 4W return of 19.9% reflects fresh capital arriving this month, whereas PICK's momentum deteriorated to 73 from what was likely higher levels weeks ago. Volume participation is thin in both (0.35x and 0.52x respectively), but COPX's velocity advantage is decisive.
Industrial Metals earned 5% as tier-2 allocation on the strength of an 83.0 category-level macro fit score that ranks in the top echelon across the portfolio. Metals scarcity is active at +14, late-cycle reflation supports this exposure directly at +10, commodity breadth positive adds +10, growth expansion contributes +8, and real asset sponsorship provides +6—a combined +48 points of macro tailwind that nearly equals the category score itself. COPX's 58.3 final score is supported by a 64.2 technical evidence score and 70.0 macro narrative fit. The extended entry price at 23.8% above the 50W and weak timing score of 45.0 prevent this from earning a top-2 overweight, but the macro case is nearly as strong as Agriculture. The allocation decision reflects a timing constraint rather than a conviction doubt: COPX is setting up for a potential pullback into support (69.08), and if capital rotates before that consolidation, a better entry will emerge. For now, 10% holds conviction in the scarcity thesis while waiting for technicals to catch up to the macro opportunity.
Technology — IGV
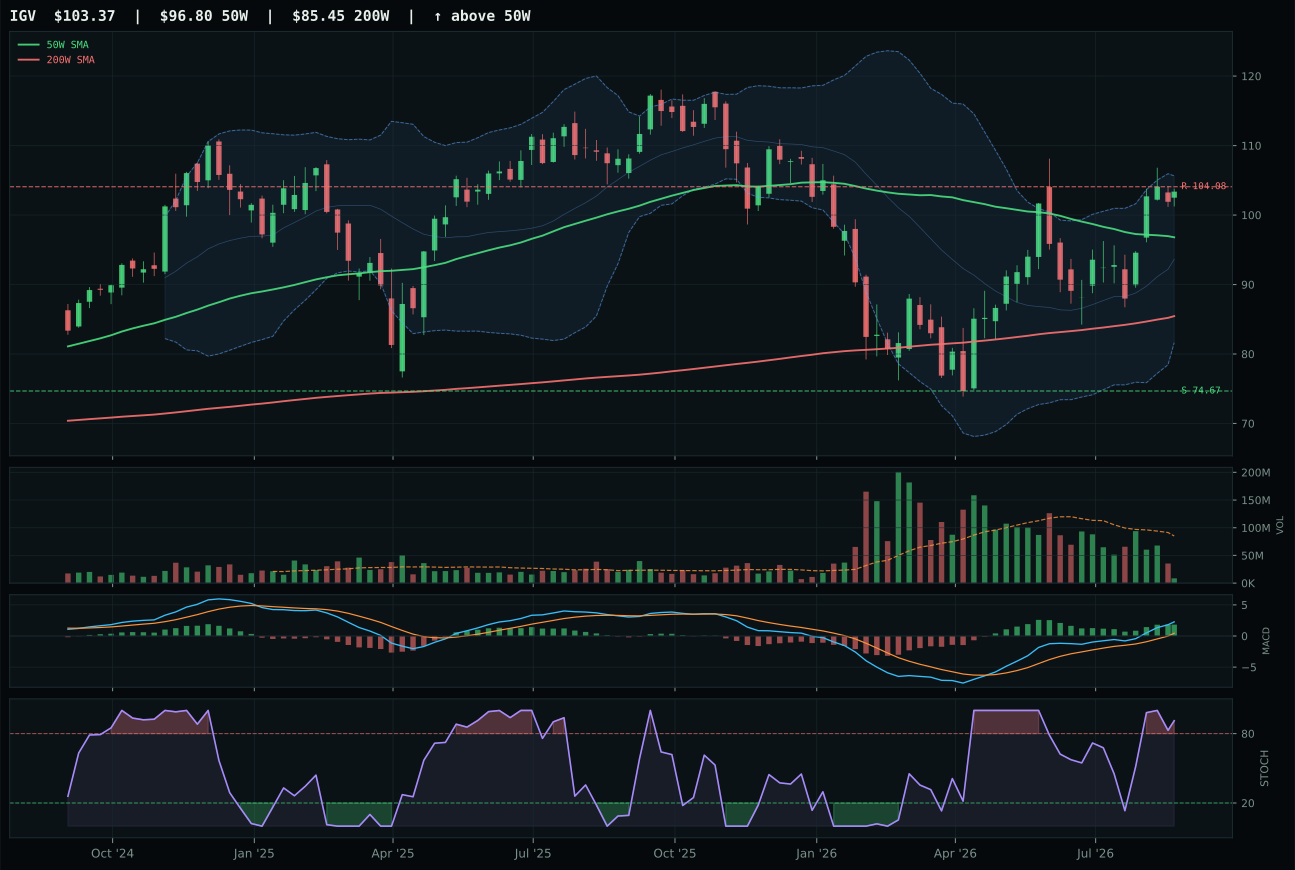
IGV has a neutral structure profile with 0.5% 13-week relative strength versus SPY.
A failed hold above support would weaken the setup.
Actionable but governed by invalidation levels.
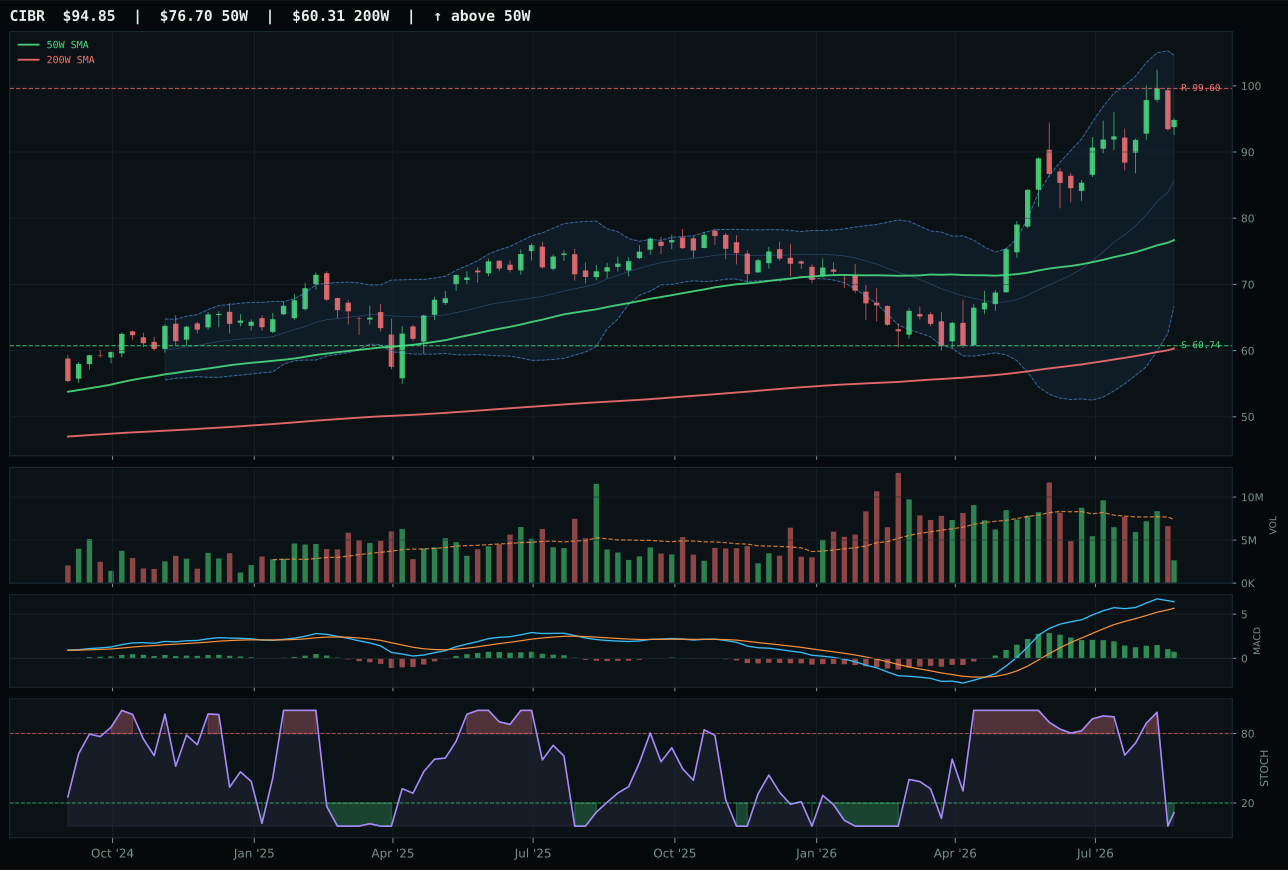
CIBR has a vertical extension profile with 5.3% 13-week relative strength versus SPY.
A failed hold above support would weaken the setup.
Actionable but governed by invalidation levels.
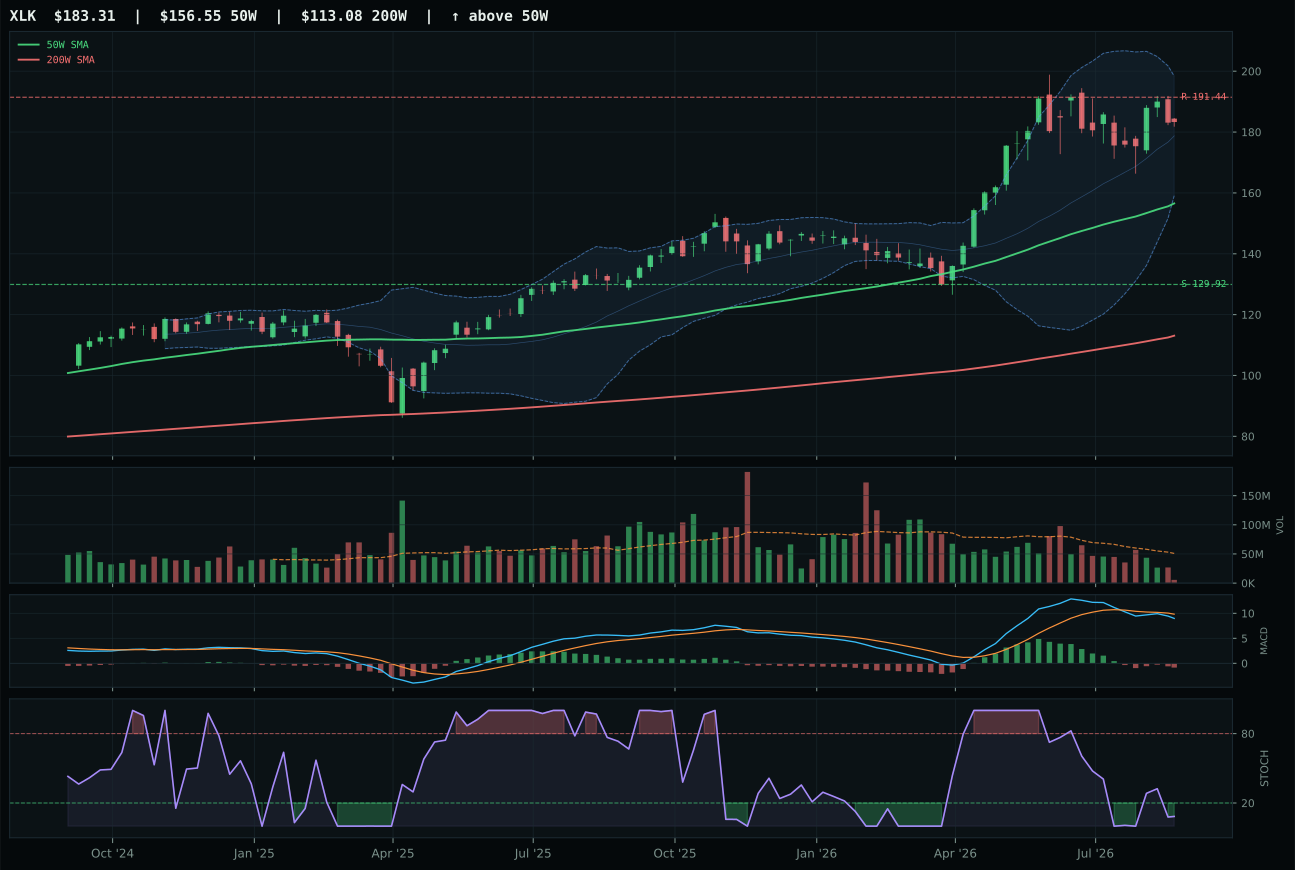
XLK has a vertical extension profile with -5.3% 13-week relative strength versus SPY.
A failed hold above support would weaken the setup.
Actionable but governed by invalidation levels.
IGV clinches the category despite a marginal 1.1-point gap over CIBR because its timing setup is materially cleaner. The issue is not momentum—CIBR's 13W return of 6.5% and 5.3% SPY relative strength both outpace IGV's 1.7% and 0.5%—but rather the quality of confirmation. IGV's MACD is bullish and improving while CIBR's has begun to flatten, and IGV sits only 6.8% from the 50W versus CIBR's stretched 23.7%, meaning new capital entering CIBR is absorbing real extension risk. Price structure is neutral in both cases, but IGV's proximity to its moving average combined with improving MACD slope gives it the tighter, lower-risk entry despite being further behind in absolute gains. Volume remains thin across the category at 0.10x and 0.64x the 20W average respectively, confirming no institutional sponsorship is backing either name yet.
Technology earned 5% as a tier-2 position in a late-cycle reflation regime that actively penalizes duration-sensitive growth. The category's 30.6 final score ranked it outside the top two because liquidity stress and credit stress together subtracted 17 points from macro fit, while inflation pressure added another -4. IGV's 0.5% relative strength to SPY and category-relative strength of 0.0% offer no tailwind; the setup is technically sound but macro headwinds are material. To earn a top-2 allocation, Technology would need either a sharp reversal in credit conditions—specifically a meaningful decline in active credit stress flags—or a demonstrable shift in buyer behavior toward the duration exposure. Right now the category is held for its technical setup alone, not because the macro regime supports it. The allocation remains defensive positioning rather than conviction.
AI — AIQ
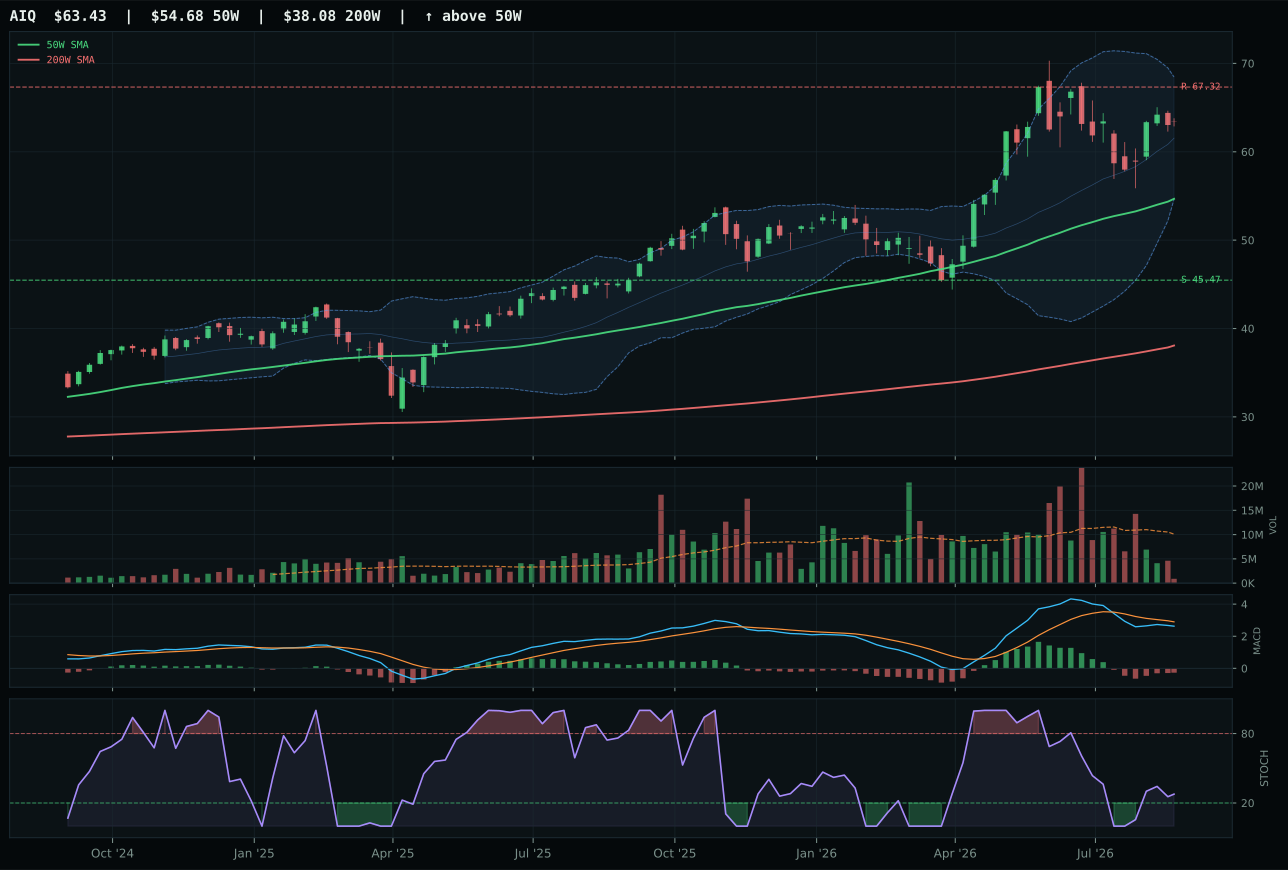
AIQ has a vertical extension profile with -7.0% 13-week relative strength versus SPY.
A failed hold above support would weaken the setup.
Actionable but governed by invalidation levels.
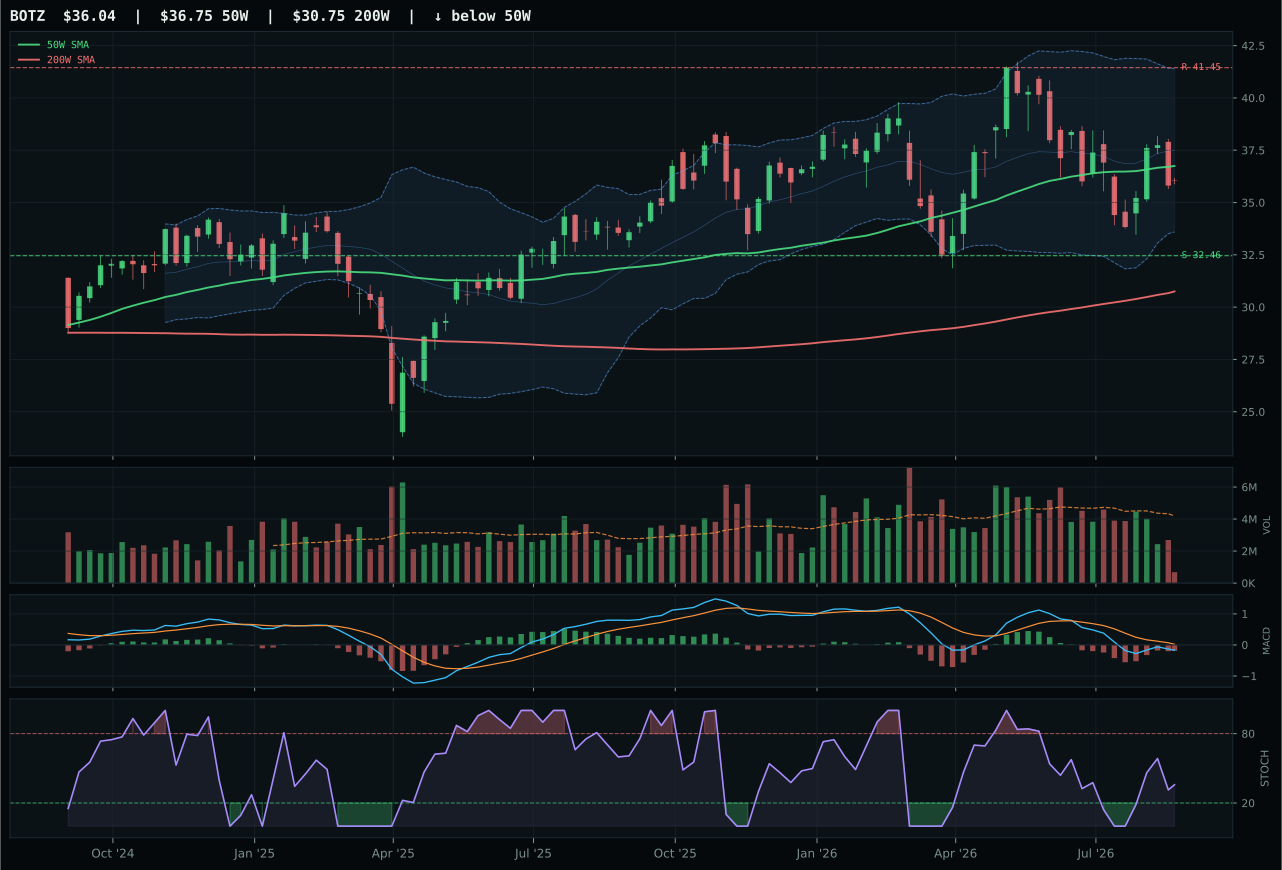
BOTZ has a compression near 50W profile with -11.5% 13-week relative strength versus SPY.
A failed hold above support would weaken the setup.
Actionable but governed by invalidation levels.
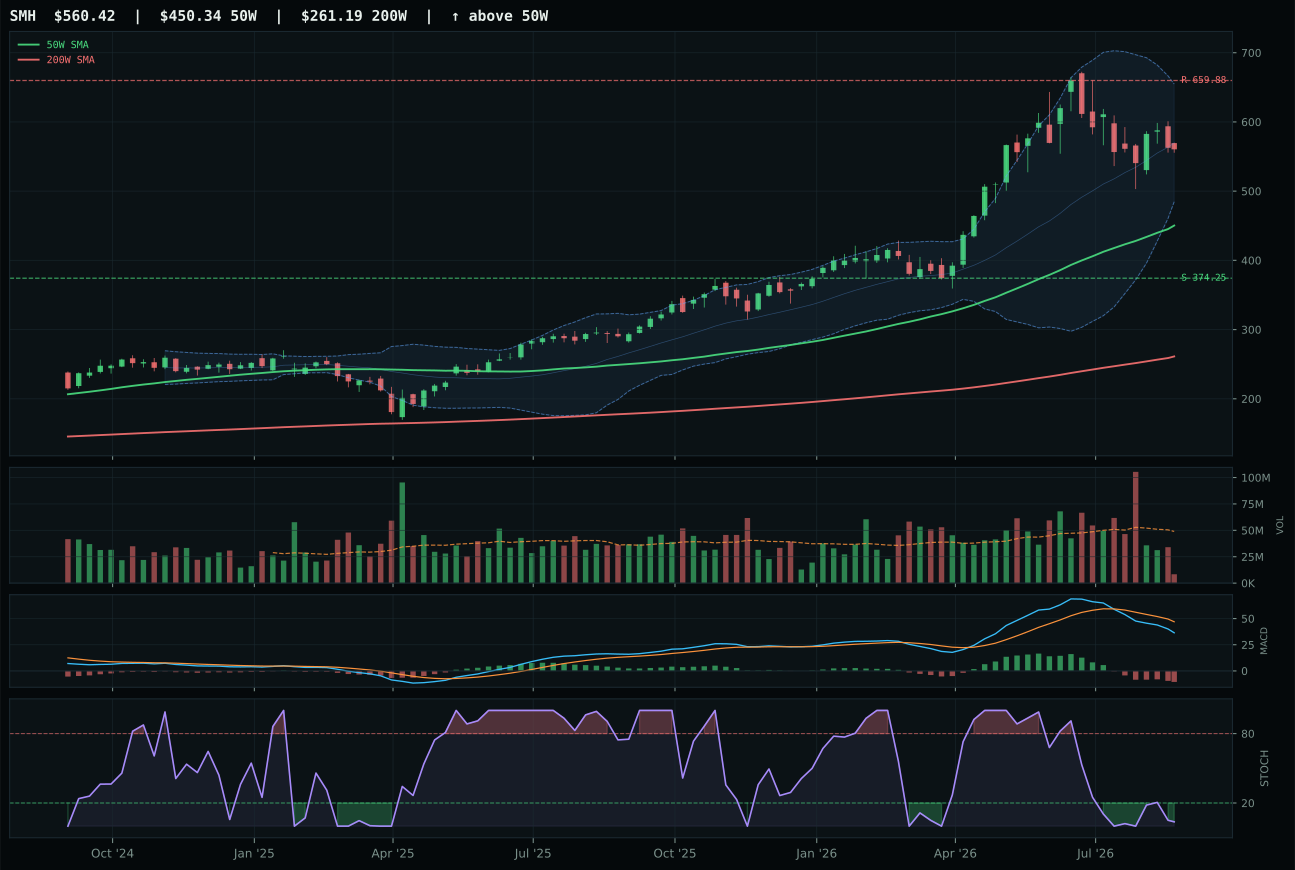
SMH has a vertical extension profile with -7.7% 13-week relative strength versus SPY.
A failed hold above support would weaken the setup.
Actionable but governed by invalidation levels.
AIQ wins the AI category by 2.4 points over BOTZ despite both being extended and both trading with bearish MACD structures. The deciding factor is AIQ's superior category-relative strength: 0.7% versus BOTZ's -3.8%, a 4.5-point advantage that reflects which names are actually receiving incremental demand within the basket. AIQ is 16.0% above the 50W with a bearish but improving MACD and stochastic RSI falling into neutral territory at 0.28, creating a setup where any momentum comes from short-term oversold relief rather than fresh sponsorship. BOTZ sits in compression near the 50W, which should be more favorable for a base, but its -11.5% SPY relative strength and deteriorating category relative strength reveal that even the tighter setup cannot overcome its fundamental lack of buyer interest. Neither name has earned real accumulation—volume in both sits at 0.09x and 0.28x average respectively—but AIQ's intra-category edge is decisive.
AI is ranked 9th or 10th this week and receives 0% allocation because the category's 20.0 final score reflects deep macro and technical dysfunction. The active macro descriptor checklist penalizes growth exposure with liquidity stress (-12), credit stress (-8), and a broad market bear signal (-8), totaling -28 points of drag while growth expansion only adds back 5. AIQ's trend score of 82.5 cannot overcome this headwind. The category failed a hard eligibility test: extended price action (AIQ at 16% above the 50W, BOTZ in compression), thin volume, and MACD weakness across the board all point to institutional participation drying up precisely when the macro regime is least accommodating to risk. For AI to earn reallocation, three things must shift: (1) active liquidity stress must flip to neutral or positive, (2) the broad market bear signal must reverse, and (3) at least one of the three names must show volume participation rising back above 0.40x average with MACD bullish confirmation. None of those changes occurred this week.