
2026-08-14
Informational purposes only. The content in this report, including allocations, analysis, and commentary, is provided solely for informational and educational purposes. It does not constitute financial advice, investment advice, trading advice, or any other type of advice. Past performance does not guarantee future results. Always conduct your own research and consult a qualified financial professional before making investment decisions.
Weekly Allocation
| Ticker | Category | Weight | Role |
|---|---|---|---|
| XLE | Traditional Energy | 20% | Top-2 (20%) |
| XAR | Defense & Aerospace | 20% | Top-2 (20%) |
| VEGI | Agriculture & Livestock | 10% | Tier-2 (10%) |
| URA | Nuclear Energy | 10% | Tier-2 (10%) |
| IEMG | Emerging Markets | 10% | Tier-2 (10%) |
| COPX | Industrial Metals | 10% | Tier-2 (10%) |
| GDX | Precious Metals | 10% | Tier-2 (10%) |
| PAVE | Utilities & Infrastructure | 10% | Tier-2 (10%) |
Trade Instructions — Monday Open
Sell the tranche from 2026-07-17 (completing its 4-week hold). Buy the new tranche. Instructions show net portfolio changes — same-asset positions cancel, weight changes show the delta.
| Action | Ticker | Instruction |
|---|---|---|
| SELL | WEAT | Sell 50% of WEAT position (reduce 10.00% → 5.00%) |
| SELL | CIBR | Sell 40% of CIBR position (reduce 6.25% → 3.75%) |
| SELL | XLU | Sell 50% of XLU position (reduce 5.00% → 2.50%) |
| SELL | AIQ | Sell 50% of AIQ position (reduce 5.00% → 2.50%) |
| SELL | ITA | Sell 22% of ITA position (reduce 11.25% → 8.75%) |
| SELL | URNM | Sell entire URNM position (2.50% of portfolio) |
| BUY | VEGI | Buy VEGI — 14.29% of freed cash (adds 2.50% to portfolio) |
| BUY | IEMG | Buy IEMG — 14.29% of freed cash (adds 2.50% to portfolio) |
| BUY | PAVE | Buy PAVE — 14.29% of freed cash (adds 2.50% to portfolio) |
| BUY | GDX | Buy GDX — 14.29% of freed cash (adds 2.50% to portfolio) |
| BUY | URA | Buy URA — 14.29% of freed cash (adds 2.50% to portfolio) |
| BUY | XAR | Buy XAR — 28.57% of freed cash (adds 5.00% to portfolio) |
Current Portfolio After Trade
Combined holdings across all 4 active tranches. Each tranche is 25% of the portfolio.
| Ticker | % of Portfolio | Weight Bar |
|---|---|---|
| XLE | 22.50% | |
| ITA | 8.75% | |
| IEMG | 7.50% | |
| COPX | 6.25% | |
| WEAT | 5.00% | |
| VEGI | 5.00% | |
| PAVE | 5.00% | |
| GDX | 5.00% | |
| URA | 5.00% | |
| XAR | 5.00% | |
| GLD | 3.75% | |
| CIBR | 3.75% | |
| XLU | 2.50% | |
| AIQ | 2.50% | |
| BOTZ | 2.50% | |
| XOP | 2.50% | |
| IGV | 2.50% | |
| MOO | 2.50% | |
| IGF | 1.25% | |
| NLR | 1.25% |
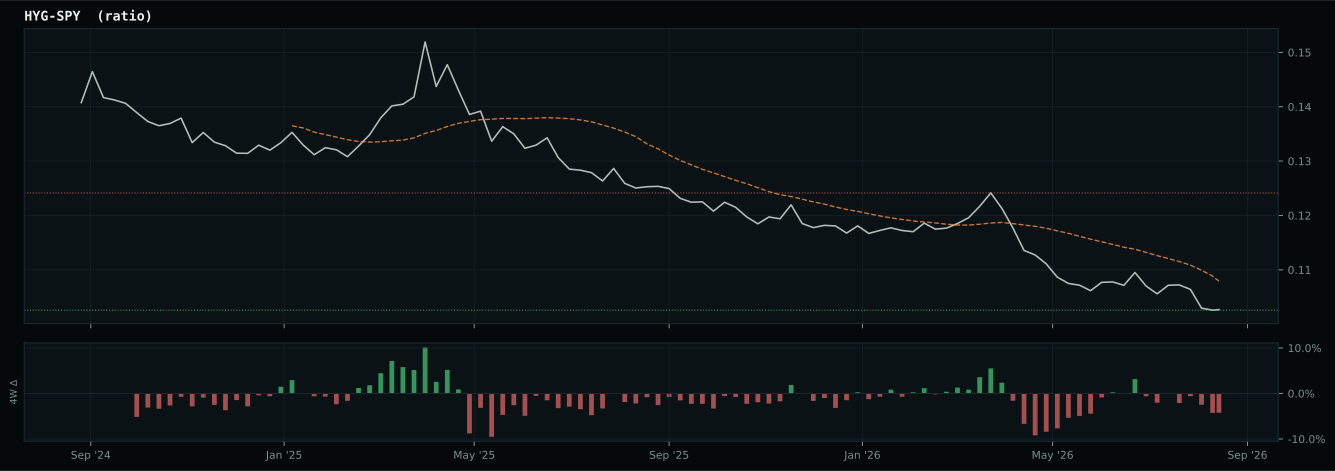
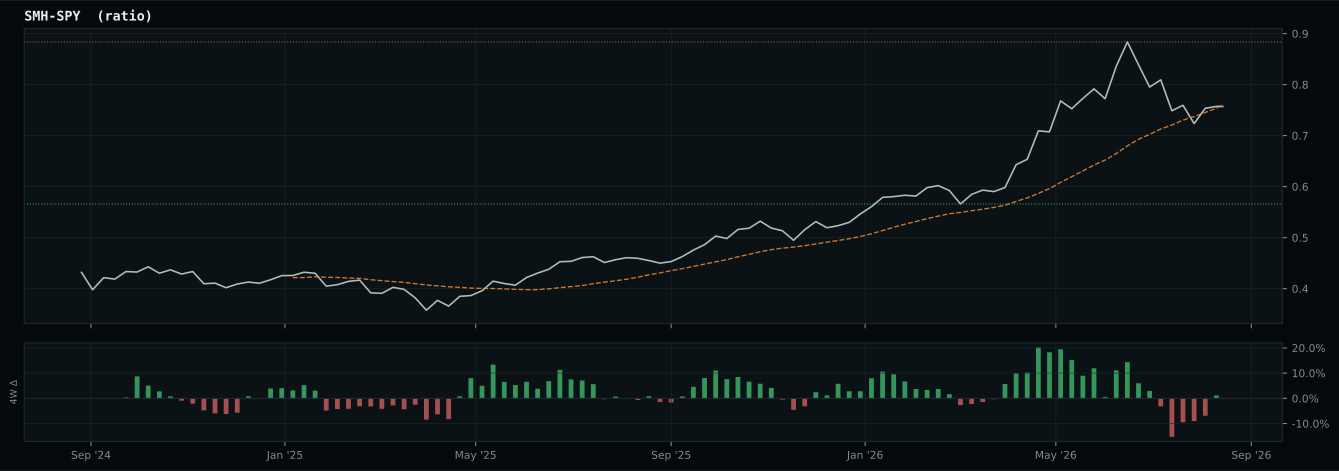
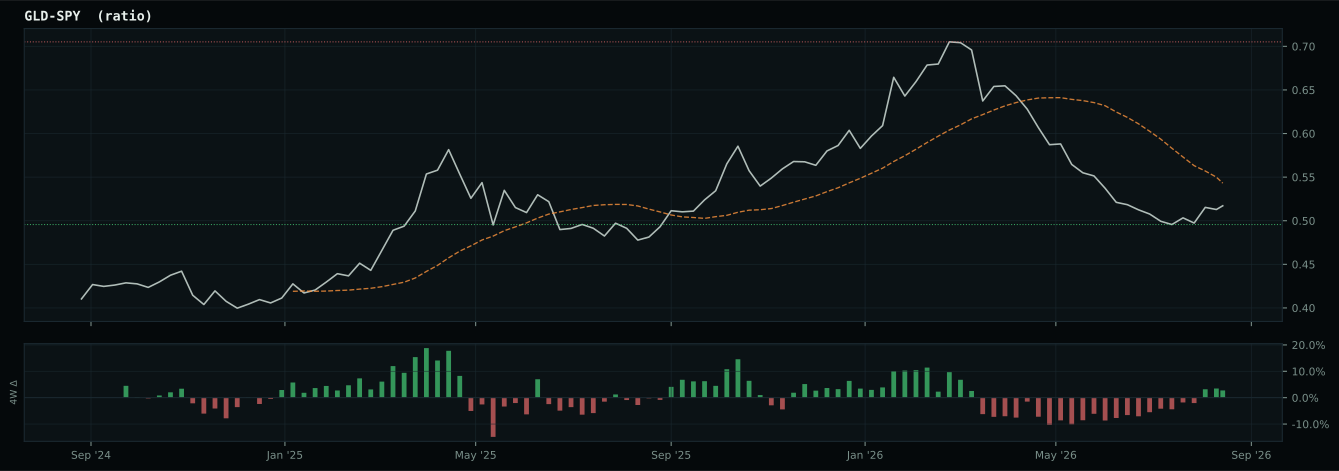
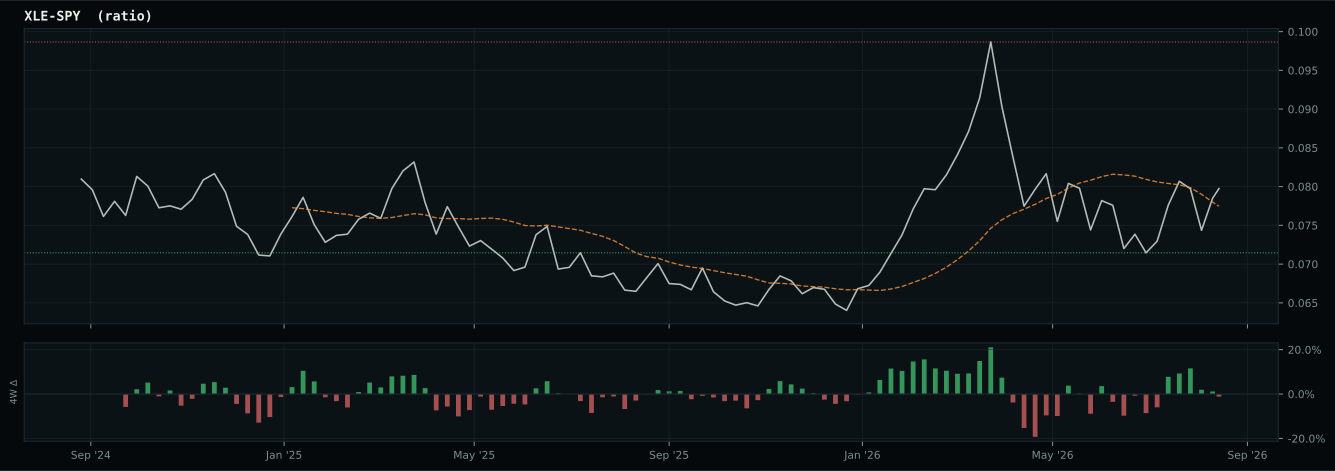
Macro Regime — Stagflation Risk
Macro Evidence Charts
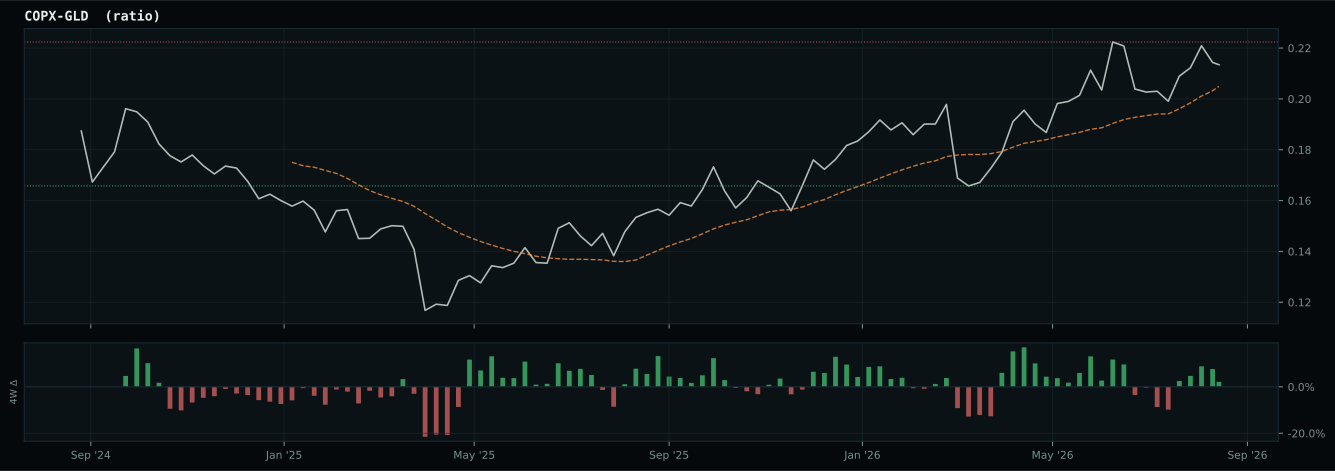
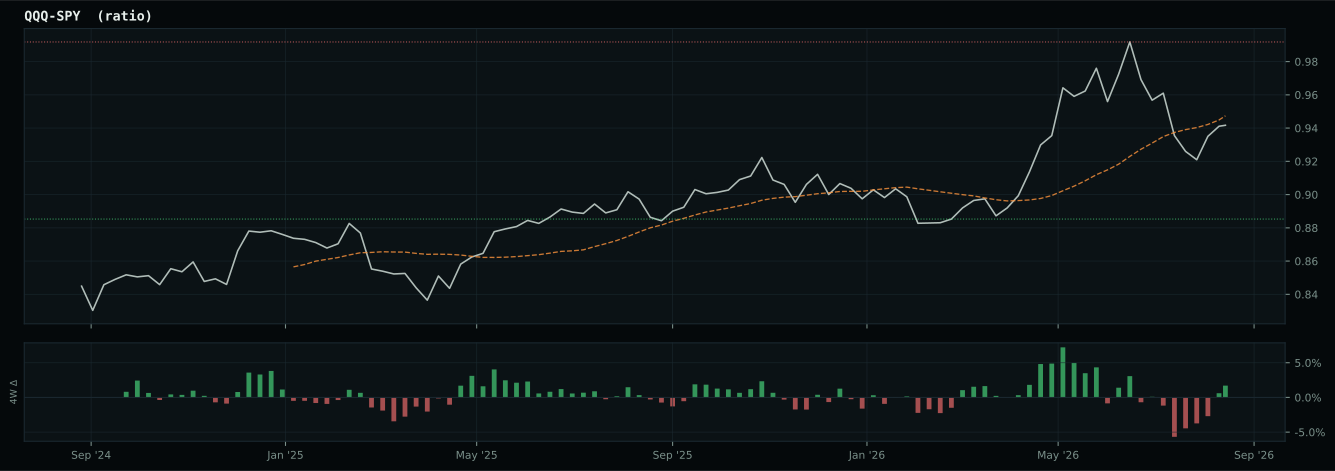
Market-implied signals behind the macro regime scores. Each ratio compares two assets; the direction and slope of the ratio is what the macro engine reads.
Crypto Regime — NoCrypto
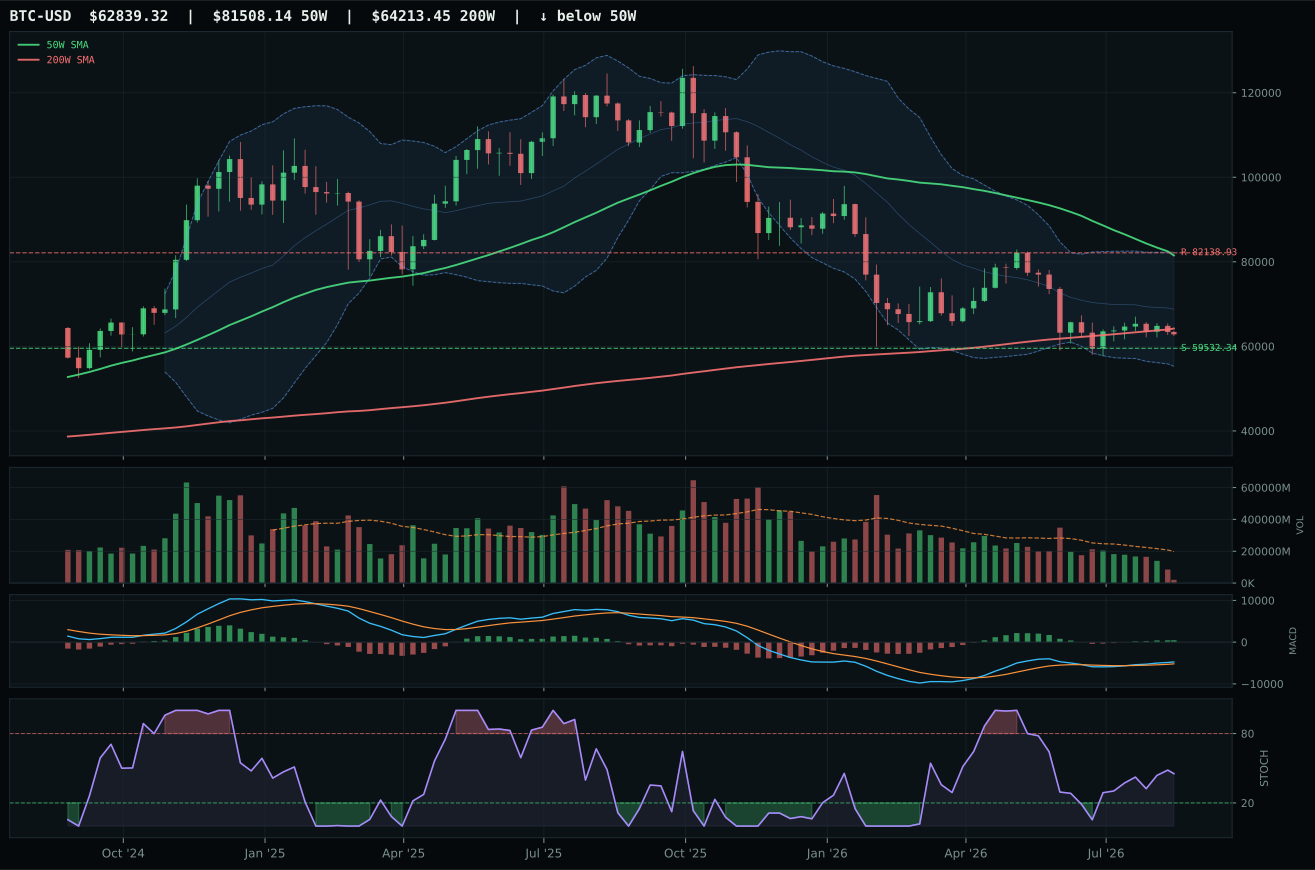
post-touch range has not been tested enough: support tests 1/2, resistance tests 3/2
TrendBTC not confirmed
one or more available conditions failed
Entering ValueBTC via a breakout: If BTC instead rallies directly through the top of its accumulation range, the model can also trigger ValueBTC on a decisive weekly close above $84,603 — the range resistance of $82,139 plus a 3% confirmation buffer. At the current price of $62,819, that is a 34.7% move. This path requires above-average weekly volume on the breakout week to confirm genuine conviction rather than a thin-market squeeze.
Entering ValueBTC via a retest of the lows: A pullback that brings BTC back to the support area around $59,532 would register a second test of the range floor. After that second touch, the breakout threshold above $84,603 becomes the standard-path entry, and the 50-week SMA reclaim is no longer required once the range is proven. This path offers a lower average entry price across tranches for portfolios willing to wait.
Entering TrendBTC directly: Bitcoin can bypass ValueBTC entirely if it reclaims the 50-week SMA ($82,463) and holds above it for two consecutive weekly closes while the SMA itself is flat or rising. Given that the SMA has been declining for months and currently sits well above the market, this path is not available in the near term without an extraordinary rally.
Category Rankings
| Rank | Category | Winner | Score | Alloc | 4W Ret | Peers (4W) |
|---|---|---|---|---|---|---|
| 1 | Traditional Energy | XLE | 71.8 | 20% | — | XOP — · FCG — |
| 2 | Defense & Aerospace | XAR | 60.6 | 20% | — | ITA — · ROKT — |
| 3 | Agriculture & Livestock | VEGI | 56.2 | 10% | — | PDBA — · MOO — |
| 4 | Nuclear Energy | URA | 48.2 | 10% | — | URNM — · NLR — |
| 5 | Emerging Markets | IEMG | 48.1 | 10% | — | INDA — · ILF — |
| 6 | Industrial Metals | COPX | 47.1 | 10% | — | PICK — · REMX — |
| 7 | Precious Metals | GDX | 46.1 | 10% | — | GLD — · SLV — |
| 8 | Utilities & Infrastructure | PAVE | 45.9 | 10% | — | IGF — · XLU — |
| 9 | AI | AIQ | 43.0 | 0% | — | BOTZ — · SMH — |
| 10 | Technology | IGV | 42.6 | 0% | — | CIBR — · XLK — |
Traditional Energy — XLE
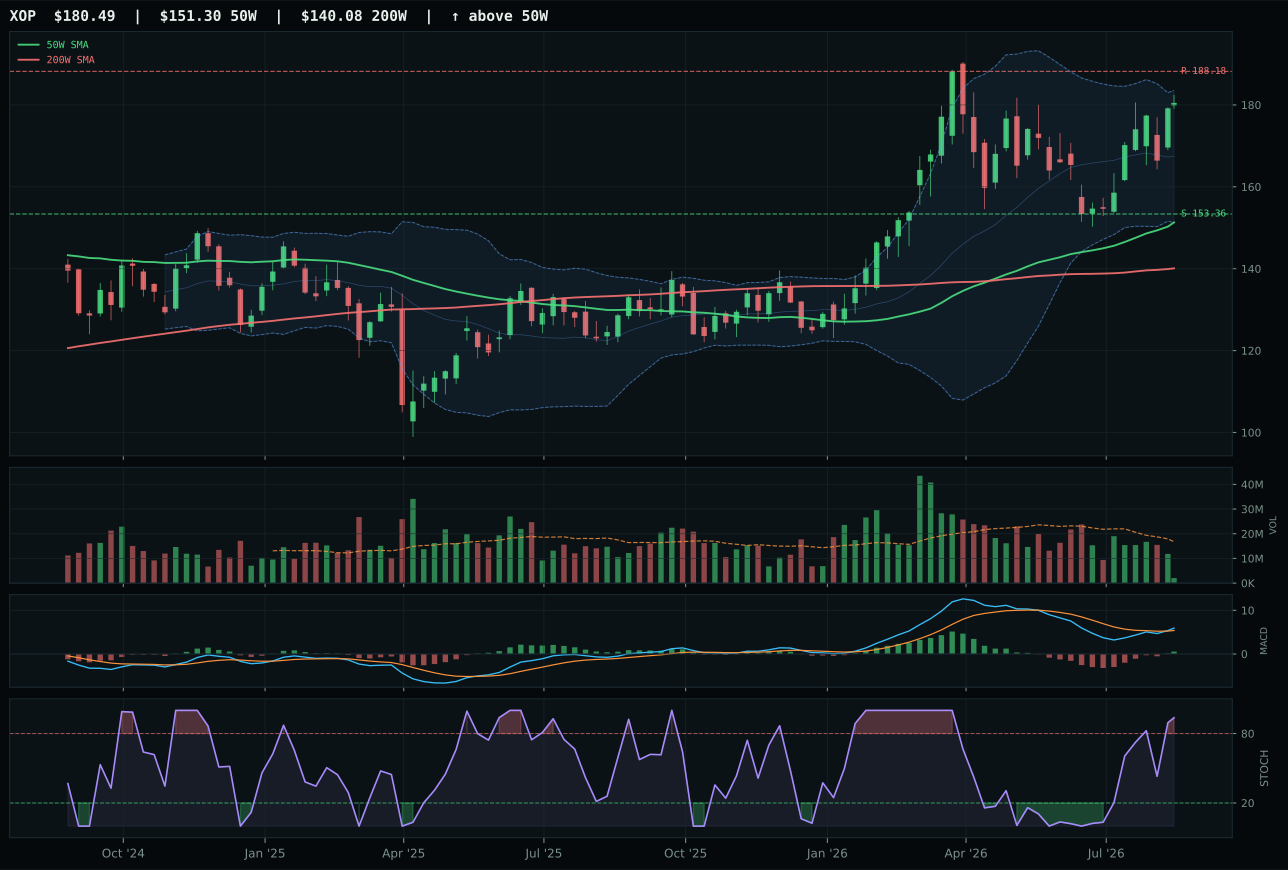
XOP has a vertical extension profile with 0.8% 13-week relative strength versus SPY.
A failed hold above support would weaken the setup.
Actionable but governed by invalidation levels.
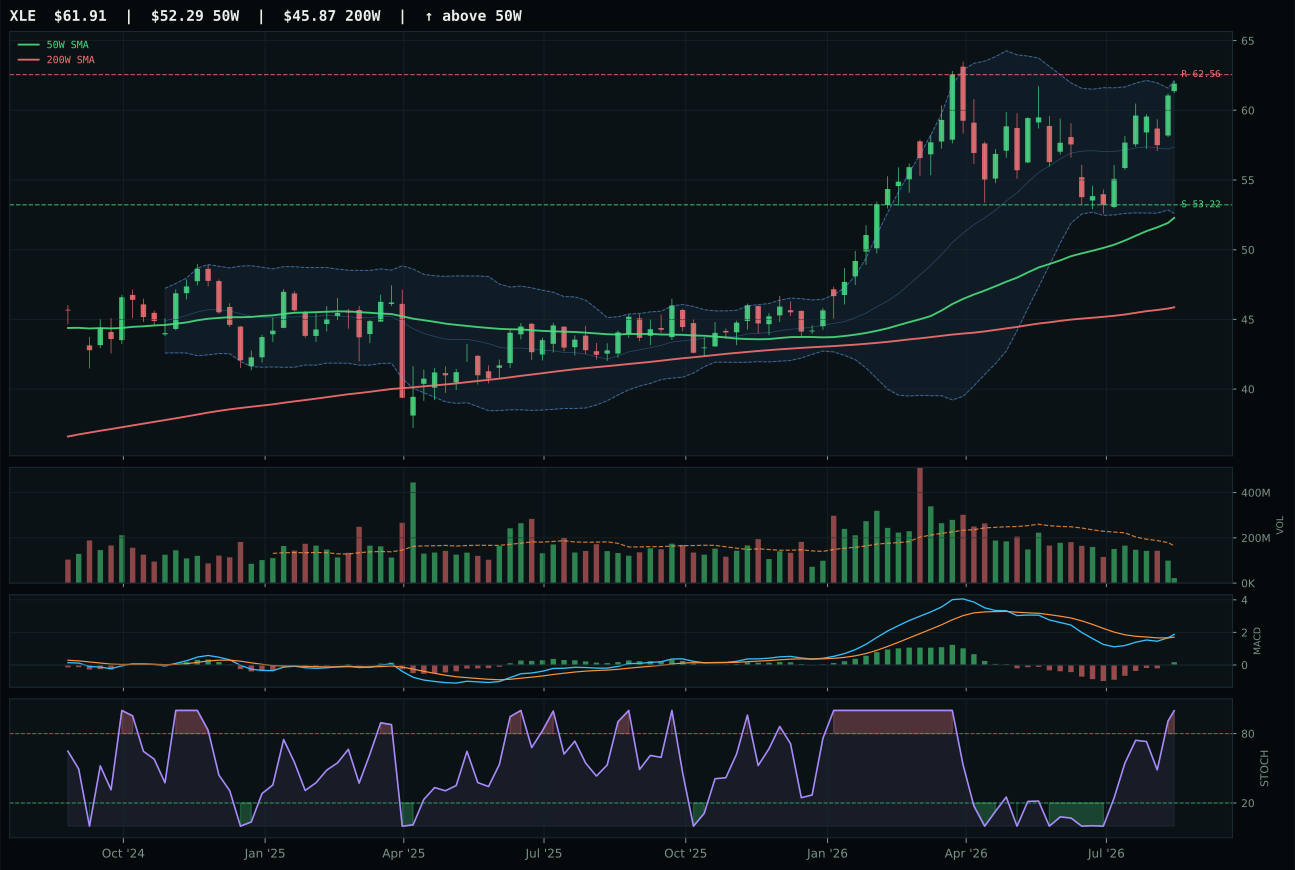
XLE has a vertical extension profile with -0.0% 13-week relative strength versus SPY.
A failed hold above support would weaken the setup.
Actionable but governed by invalidation levels.
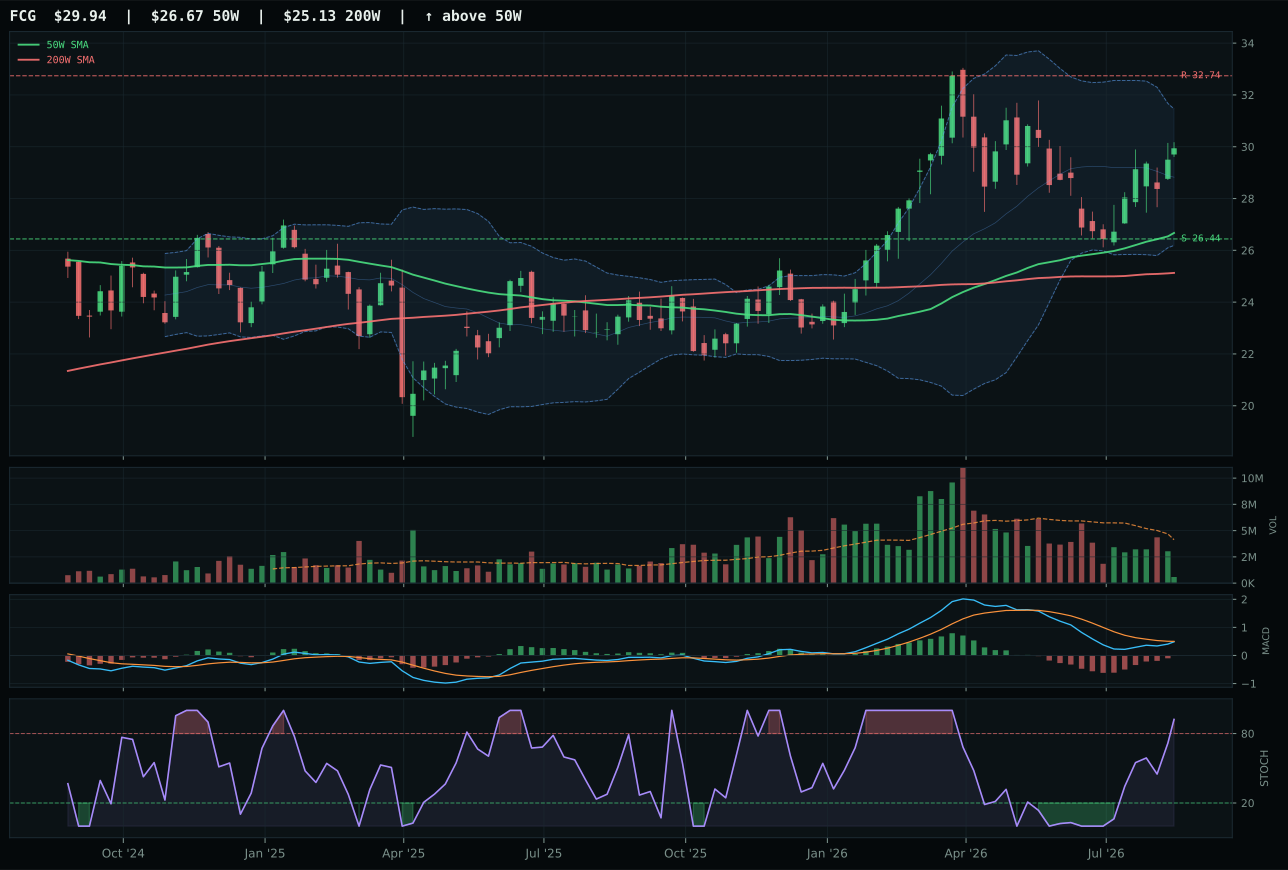
FCG has a neutral structure profile with -5.4% 13-week relative strength versus SPY.
A failed hold above support would weaken the setup.
Actionable but governed by invalidation levels.
XLE captures the top-2 allocation and ranks highest overall with a final score of 71.8 because it combines flawless trend evidence (100.0) with exceptional macro sponsorship and acceptable entry timing despite 18.4% extension above the 50W. The chart is extended and approaching resistance at 62.56, yet MACD is bullish and improving, stochastic RSI is overbought at 1.00, and the 4.1% 13W return with 0.0% RS versus SPY proves that energy is the category being rotated into across the entire allocation universe, not a narrow momentum chase. Timing score of only 37.0 reflects that extended entry, but momentum confirmation of 67.5 and volume-price confirmation of 56.5 prove accumulation is occurring despite the stretched technical position. XOP lost to XLE despite slightly better technical evidence (65.5 vs 62.3) because XLE's macro fit of 81.0 dominates XOP's 51.0: energy scarcity active at +14, inflation pressure at +10, supply shortage at +7, and real asset sponsorship at +5 create a macro tailwind that XLE's integrated cash-flow defense profile captures more completely than XOP's exploration beta exposure.
Traditional Energy earned 20% allocation as a co-equal top-2 category with a final score of 71.8, the highest in the portfolio. The category macro fit of 88.0 is exceptional—Stagflation Risk helps this exposure (+10), energy scarcity is active (+16), inflation pressure is active (+10), supply shortage is active (+9), and real asset sponsorship is active (+7), totaling +62 in directional support. The 3/2/1 weighted basket score of 66.9 reflects XLE's leadership at 69.1 technical evidence, XOP's close proximity at 67.2, and FCG's 59.5 providing depth. Even though XLE's timing score is depressed to 37.0 due to extension, the category reasoner applies macro overrides and technical persistence checks: volume-price confirmation at 56.5 and persistence at 64.3 prove the move is being accumulated rather than distributed, and the macro regime is sufficiently favorable that entry risk is subordinate to allocation risk (missing the move). XLE and XAR together represent 40% of the portfolio because both benefit directly from stagflation (Defense via geopolitical spending, Energy via commodity scarcity and inflation pass-through), and neither is experiencing deteriorating MACD or volume-price rejection at scale.
Defense & Aerospace — XAR
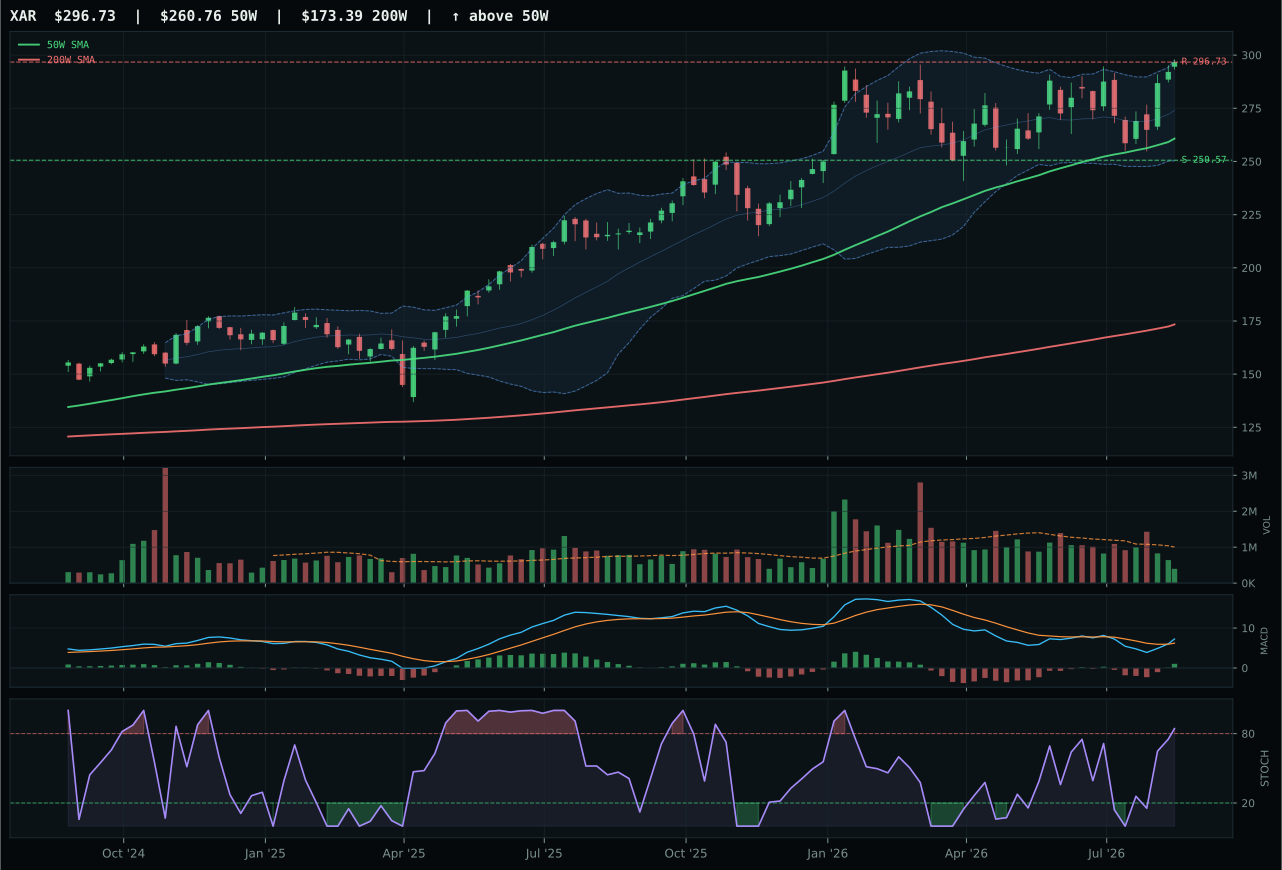
XAR has a neutral structure profile with 5.3% 13-week relative strength versus SPY.
A failed hold above support would weaken the setup.
Actionable but governed by invalidation levels.
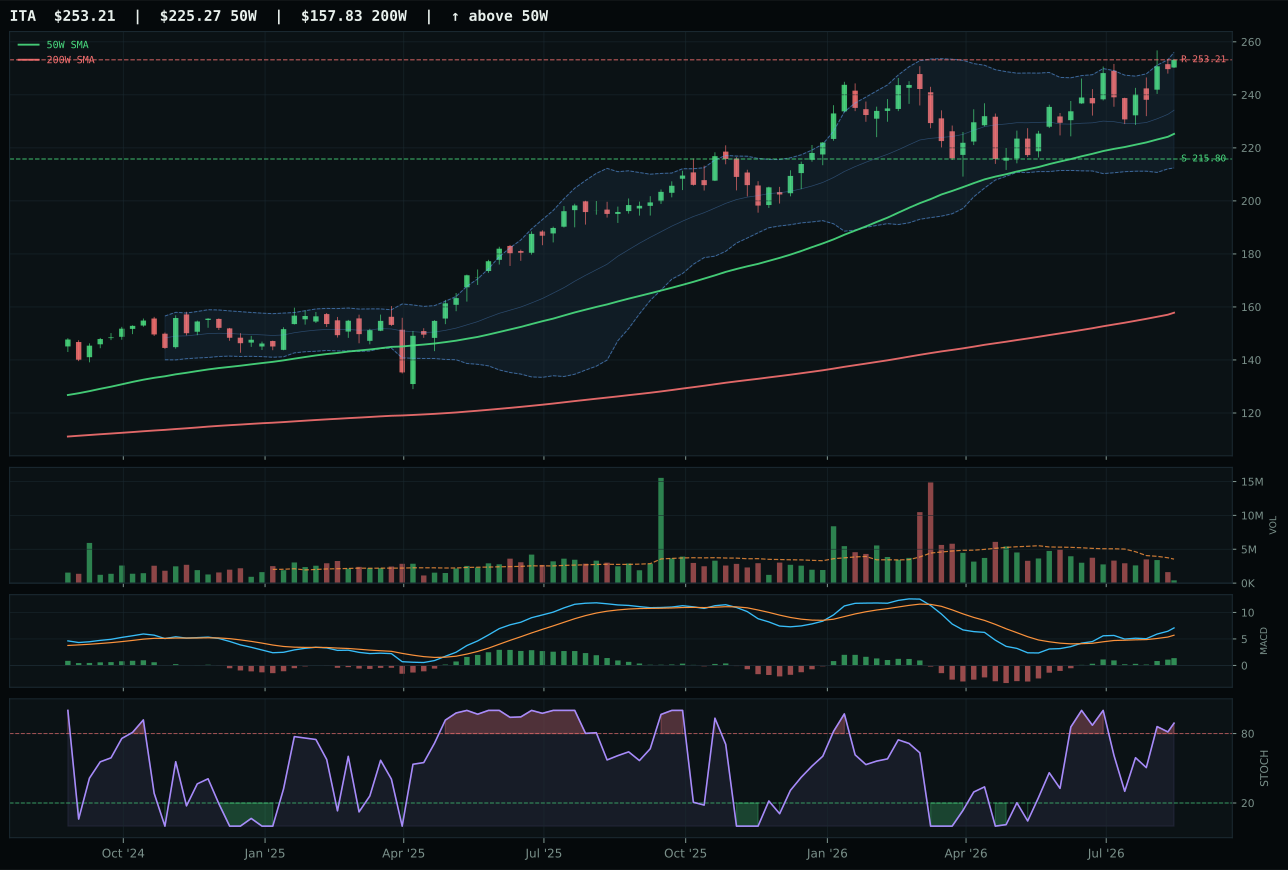
ITA has a neutral structure profile with 8.2% 13-week relative strength versus SPY.
A failed hold above support would weaken the setup.
Actionable but governed by invalidation levels.
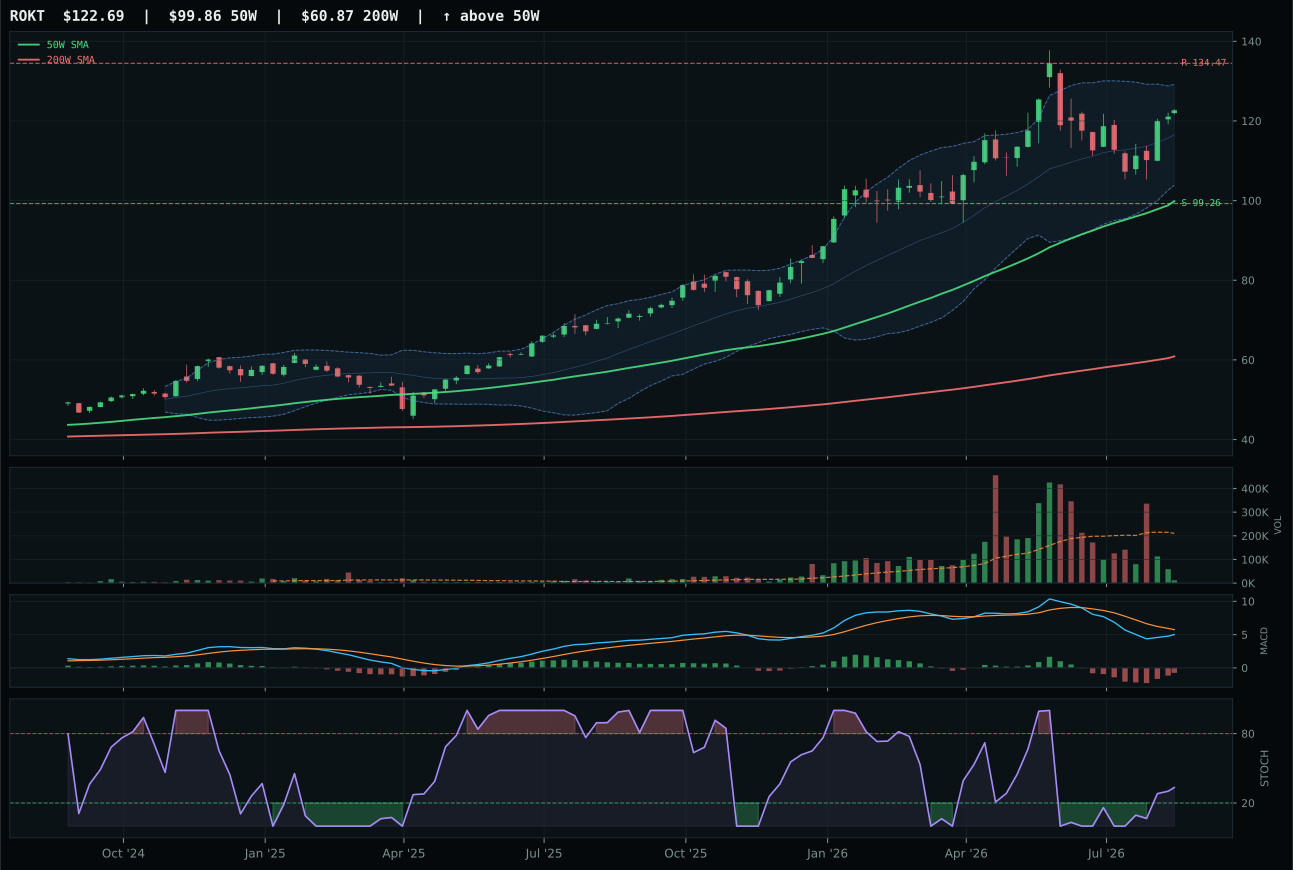
ROKT has a vertical extension profile with -6.3% 13-week relative strength versus SPY.
A failed hold above support would weaken the setup.
Actionable but governed by invalidation levels.
XAR wins the category and earns a 20% top-2 allocation because it delivers the purest blend of technical confirmation and macro sponsorship in a stagflationary environment. Price sits 13.8% above the 50W with a 0.6% positive slope, trend score of 100.0, and MACD bullish and improving with stochastic RSI overbought at 0.84—a textbook momentum setup with trend validation. The 9.4% 13W return and 5.3% RS versus SPY demonstrate that defense names are genuinely being re-allocated into, not just meandering higher on tape. The gap to ITA is razor-thin at just 1.0 points (61.6 vs 60.6), but XAR's structural cleanliness at 58.3 versus ITA's 69.2 actually favors ITA, yet the category reasoner selected XAR as the representative because structure encompasses more than pure cleanliness—it also includes compression, which XAR leads at 71.3 versus ITA's score, and the combination of neutral structure with defined support at 250.57 and resistance at 296.73 creates a tighter invalidation setup. Volume participation is thin across both names, but the distinction is negligible.
Defense & Aerospace earned 20% allocation as a top-2 category and ranks highest or tied-highest among all 10 categories with a final score of 60.6. The category macro fit of 61.0 is the structural advantage: Stagflation Risk actually helps this exposure (+6), Transition/Mixed helps (+3), and credit stress is active but plays a +2 role rather than a negative one, meaning geopolitical spending and capital expenditure by defense contractors are countercyclical to growth slowdown. The 3/2/1 weighted basket starts strong at 63.7 from ITA's technical evidence leading ROKT decisively, and the reasoner validates that the basket holds leadership, volume-price sponsorship, and timing across the full macro regime. XAR's 77.7% technical evidence combined with the category's 61.0% macro fit produces the 60.6 final score that qualifies it for top-2 selection. The portfolio is allocating 20% to Defense & Aerospace not because of purity of trend—both XLE and XAR are extended from their 50W averages—but because defense benefits structurally when investors rotate into real assets, geopolitical risk rises, and growth expectations compress.
Agriculture & Livestock — VEGI
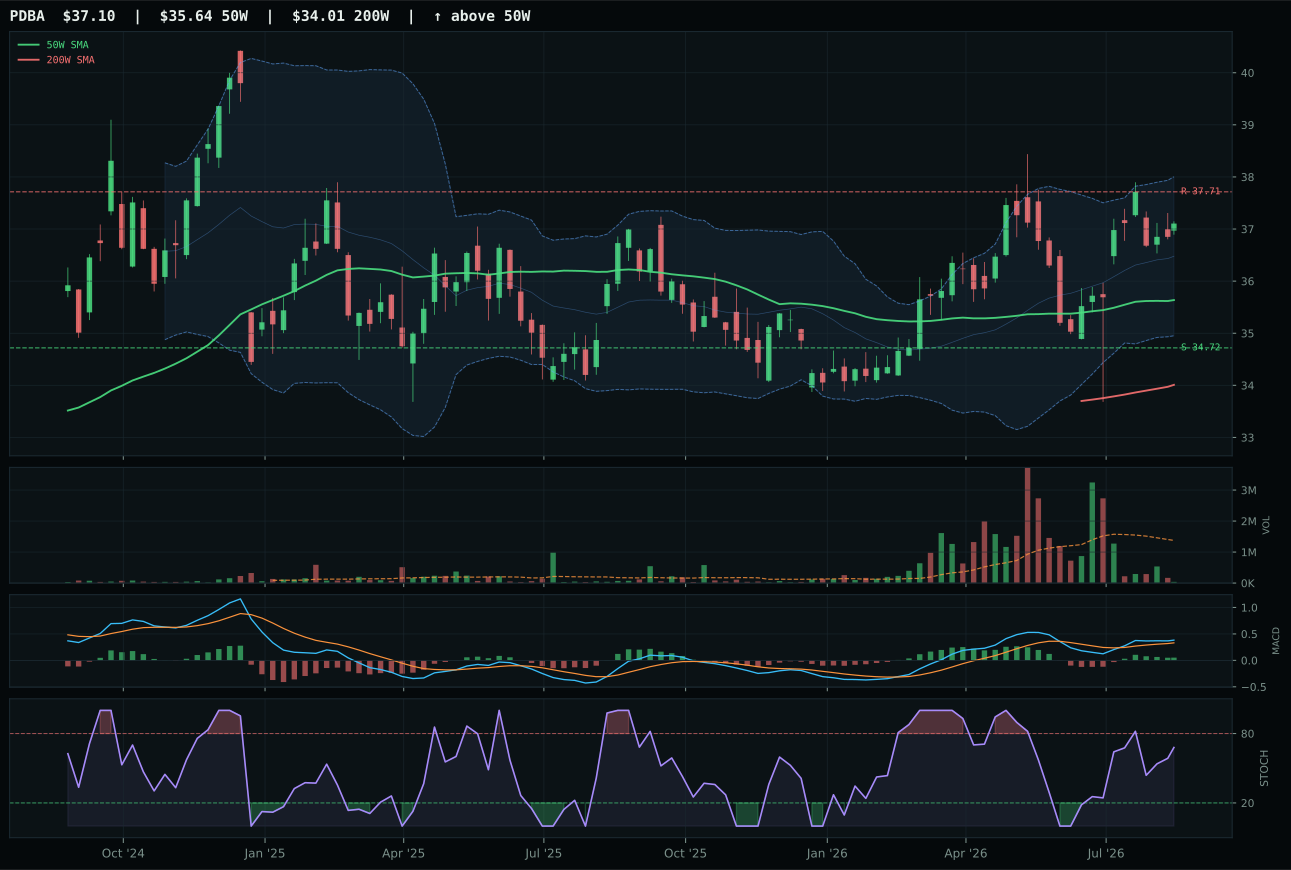
PDBA has a neutral structure profile with -3.2% 13-week relative strength versus SPY.
A failed hold above support would weaken the setup.
Actionable but governed by invalidation levels.
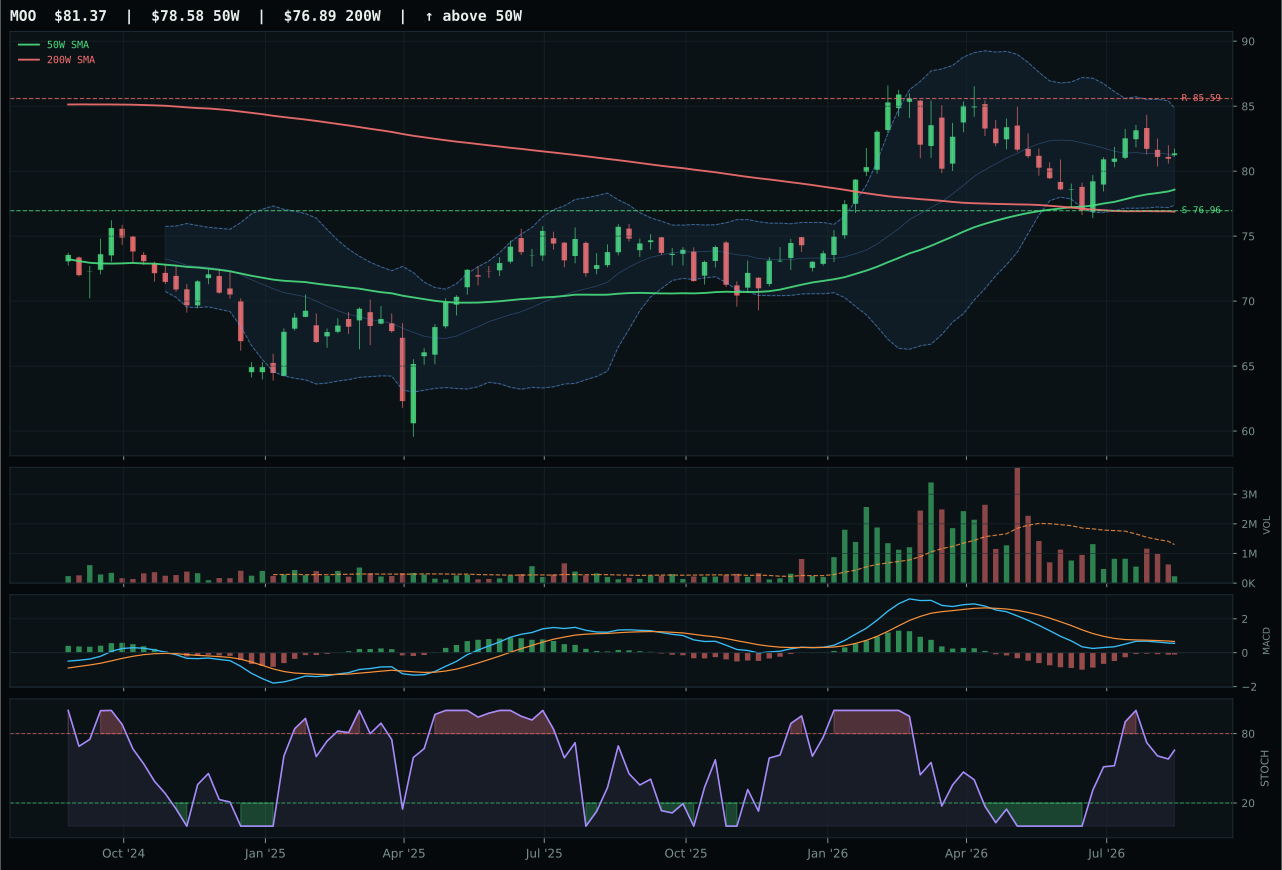
MOO has a neutral structure profile with -2.7% 13-week relative strength versus SPY.
A failed hold above support would weaken the setup.
Actionable but governed by invalidation levels.
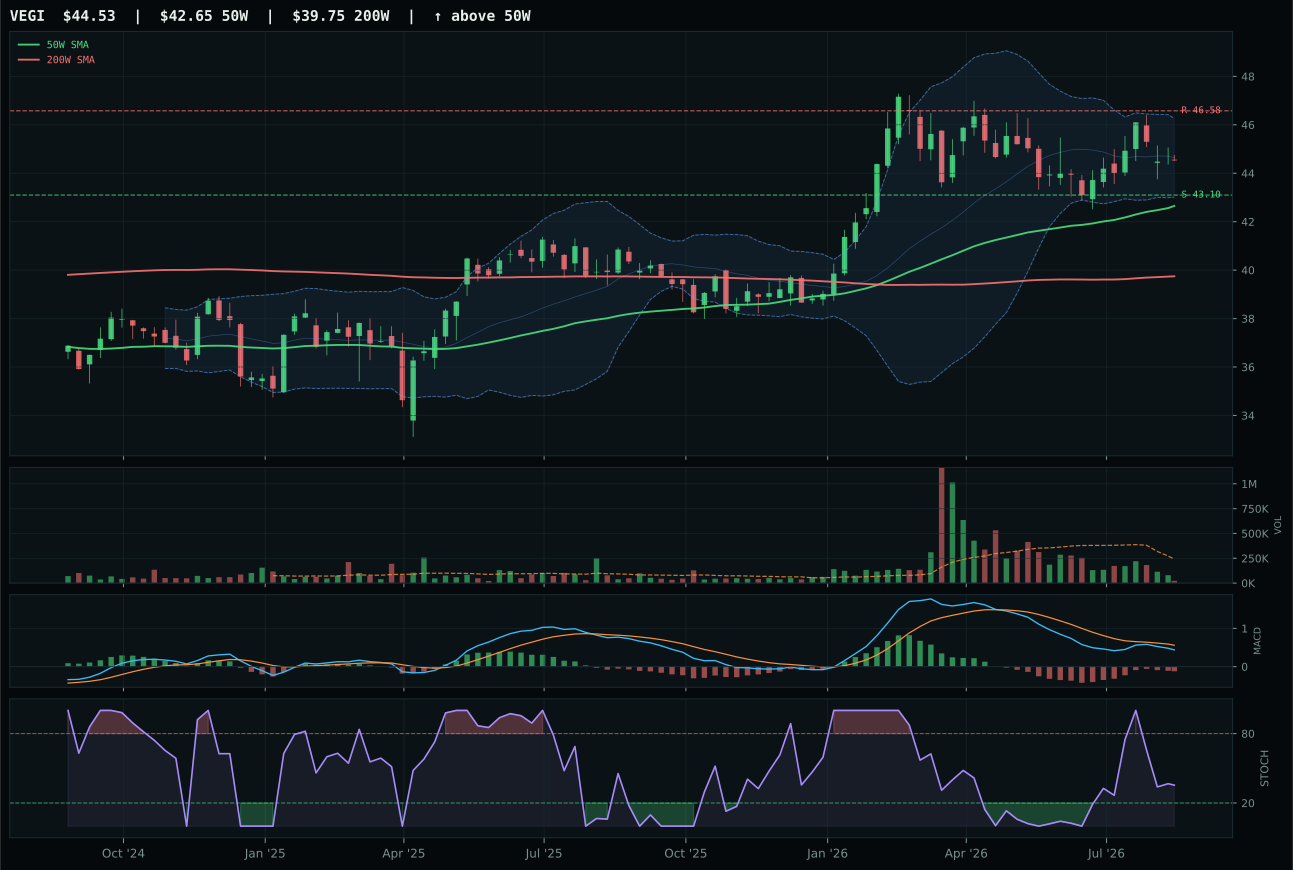
VEGI has a pullback into support profile with -2.5% 13-week relative strength versus SPY.
A failed hold above support would weaken the setup.
Actionable but governed by invalidation levels.
VEGI wins the category by delivering the sharpest setup in a sector defined by macro sponsorship: price has pulled back 4.4% below the 52W high and sits just 4.4% above the 50W, creating a tight invalidation zone at support of 43.10. Timing score reaches 95.0 because MACD is bearish/weakening (not yet bullish), stochastic RSI is falling/neutral at 0.35, and Fib location in the upper retracement zone means downside to support is only 3.3% while upside to resistance is -4.4%—a rare risk-reward skew that favors defensive positioning within a bullish category. The 1.6% 13W return is anemic but category-relative strength of 0.2% is flat, meaning VEGI is not being sold relative to its peers despite broad agriculture weakness. PDBA lost decisively on risk-reward (49.2 vs 68.9) and timing (93.0 vs 95.0); it sits in neutral structure with bullish but flattening MACD, which signals that the momentum impulse is already weakening before VEGI's setup has even been triggered.
Agriculture & Livestock earned 10% allocation in tier-2 and ranks among the middle tiers despite a category macro fit of 93.0—the highest macro score across all categories this week. The contradiction explains itself: supply shortage is active (+13), inflation pressure is active (+10), stagflation itself helps agriculture (+10), and real asset sponsorship is active (+8), totaling +51 in macro support. However, the 3/2/1 weighted basket score begins at only 61.0 because PDBA leads on technical evidence and VEGI ranks second, which means the reasoner applies macro filters and the final category score falls to 56.2 from the starting 61.0. Agriculture does not qualify for top-2 because Energy and Defense score higher on total evidence (71.8 and 60.6 respectively), and even though Agriculture's macro tailwind is exceptional, its technical evidence across the three-ETF basket is weaker—volume-price confirmation and persistence scores are both below 40 for VEGI, the representative. This is a classic tier-2 hold: strong macro narrative but weak technical sponsorship means allocation is justified but size is capped at 10%.
Nuclear Energy — URA
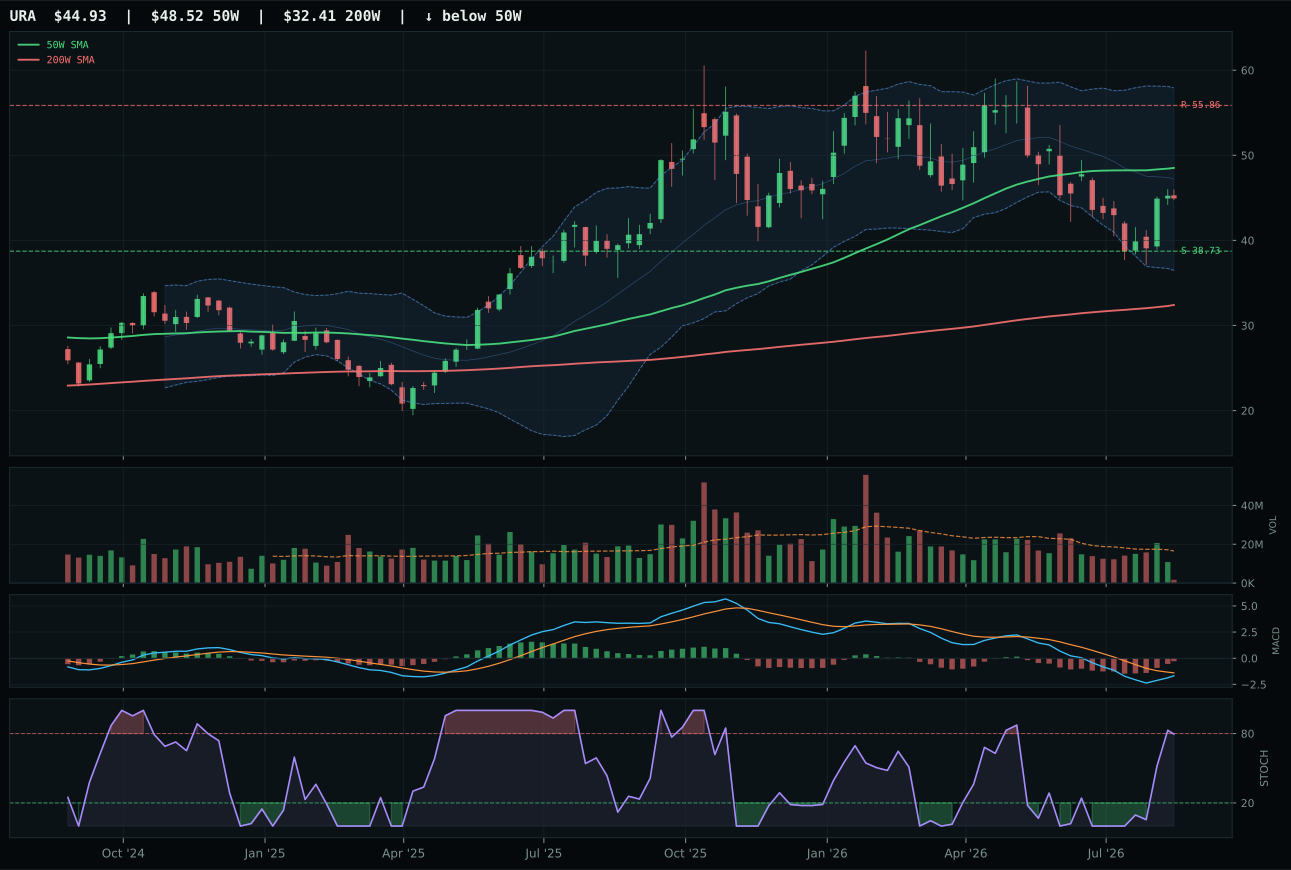
URA has a neutral structure profile with -12.3% 13-week relative strength versus SPY.
A failed hold above support would weaken the setup.
Actionable but governed by invalidation levels.
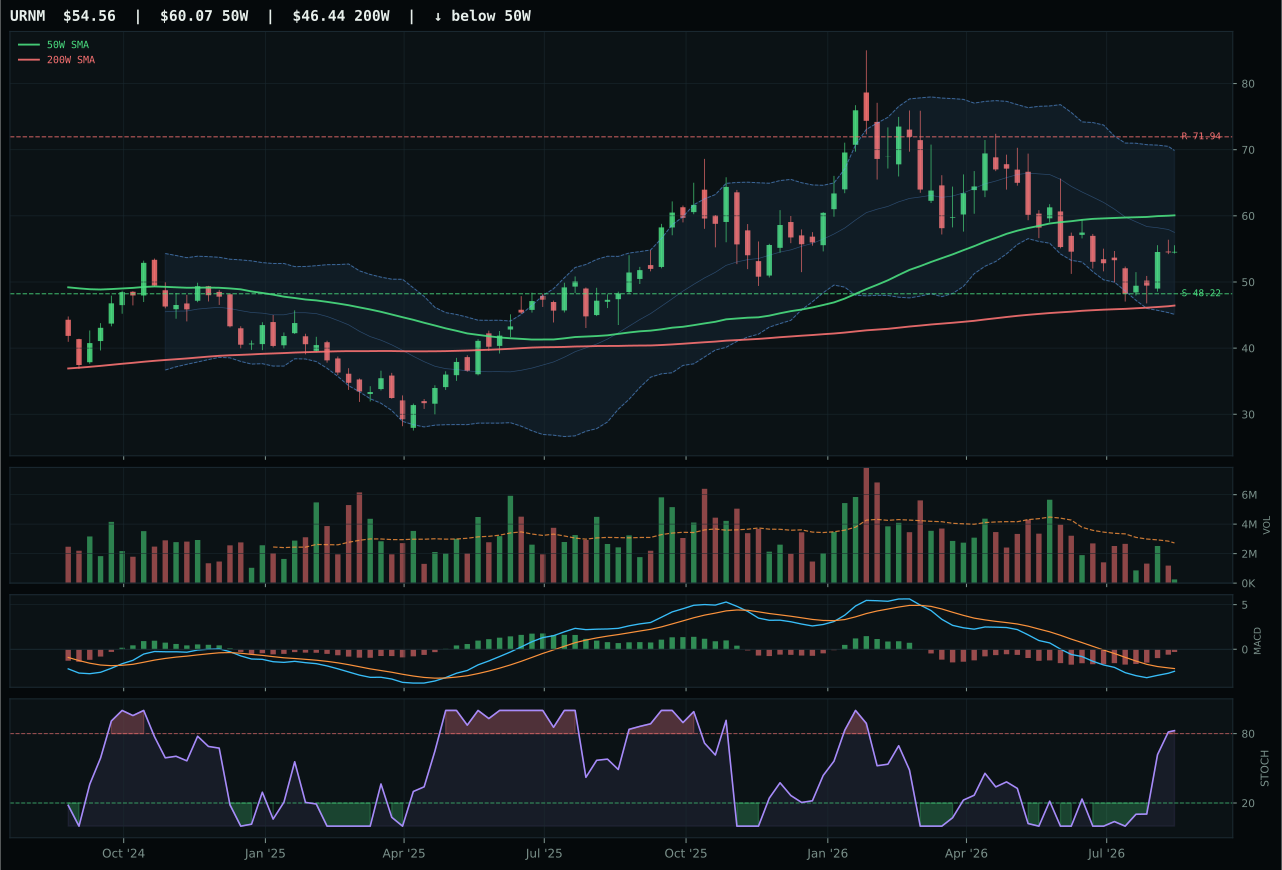
URNM has a neutral structure profile with -10.4% 13-week relative strength versus SPY.
A failed hold above support would weaken the setup.
Actionable but governed by invalidation levels.
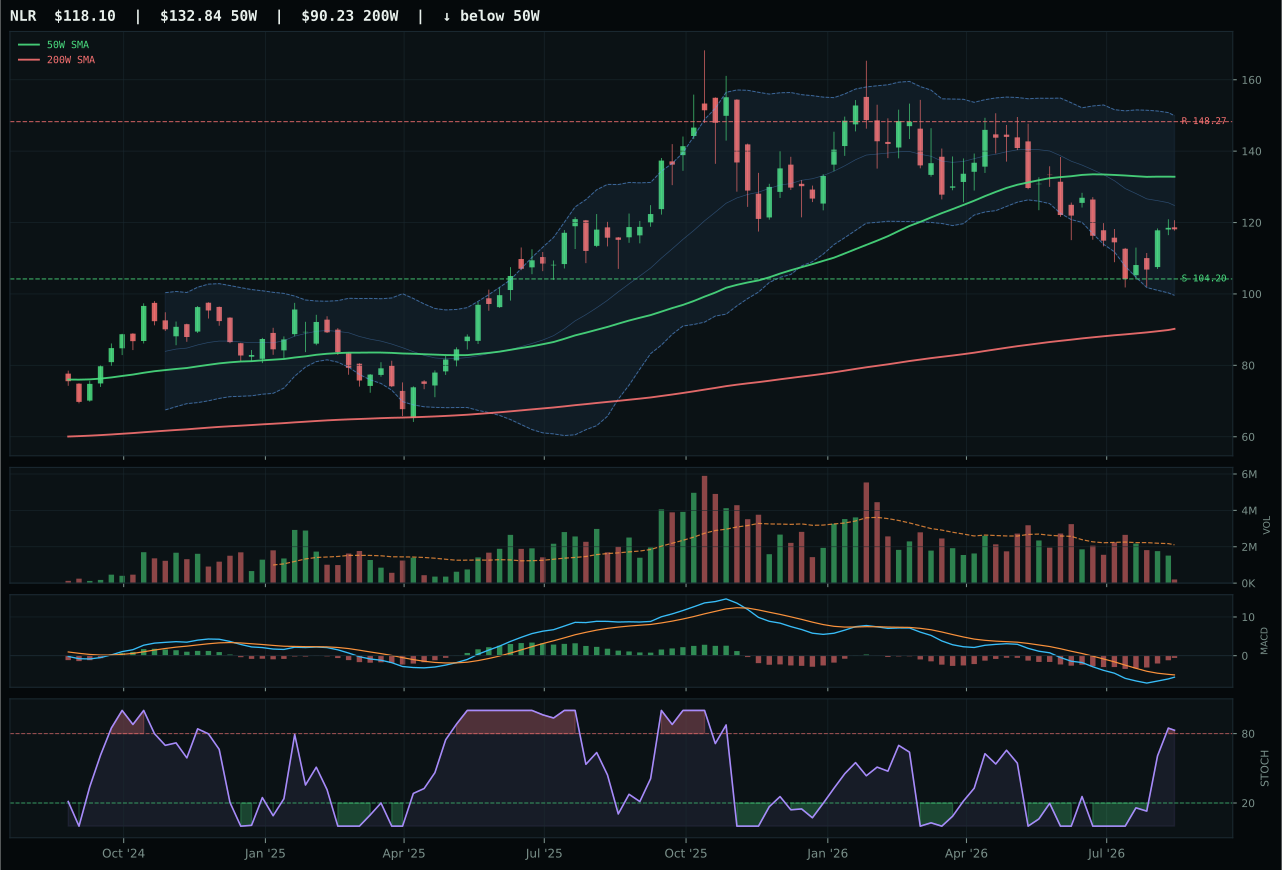
NLR has a neutral structure profile with -13.9% 13-week relative strength versus SPY.
A failed hold above support would weaken the setup.
Actionable but governed by invalidation levels.
URA wins the category despite sitting 7.4% below its 50W, a pullback setup that scores better on timing (90.0) than an overbought extension name would in this macro environment. Price sits at deep retracement near Fib 0.618 at 46.77, MACD is bearish but improving, and stochastic RSI is rising mid-zone at 0.79—a classic recovery setup where the setup is saying 'buyer preparation' rather than 'buyer exhaustion.' The -8.2% 13W return is painful but category-relative strength of 0.0% is neutral, meaning URA is not being rotated out of harder than its peers. URNM lost on timing (75.0 vs 90.0) because its stochastic RSI is overbought at the exact moment when URA is only rising mid-zone; in a stagflationary regime where new money is scarce, being overbought means the move is being exhausted by momentum traders rather than funded by fresh capital. Risk-reward is also more favorable for URA at 52.0 versus URNM's 63, though both names face downside to support around 16–19% if the macro thesis fails.
Nuclear Energy earned 10% allocation in tier-2 and ranks outside the top-2 with a final score of 48.2. The category macro fit of 72.0 is strong because Stagflation Risk helps this exposure (+8), energy scarcity is active (+9), real asset sponsorship is active (+7), and inflation pressure is active (+3), partially offset by credit stress (-5). However, the 3/2/1 weighted basket score of 48.1 is pulled down by URA's technical evidence of only 46.4—price below the 50W at -7.4% signals reset timing but also means trend score is weak at 63.0. URNM's technical evidence is 44.2, which is worse, and NLR is 31.9, so the basket's average is dragged down despite strong macro tailwinds. Nuclear Energy qualifies for tier-2 allocation because the macro narrative is genuine (energy scarcity, real asset sponsorship, stagflation support), but the weak technical persistence scores (39.8 for URA) and negative momentum confirmation (41.3) mean the category is being held as a conviction play on energy scarcity rather than as a momentum opportunity. For Nuclear to move into top-2, URA or URNM would need to shift to bullish MACD confirmation and show volume-price confirmation above 60, neither of which is present yet.
Emerging Markets — IEMG
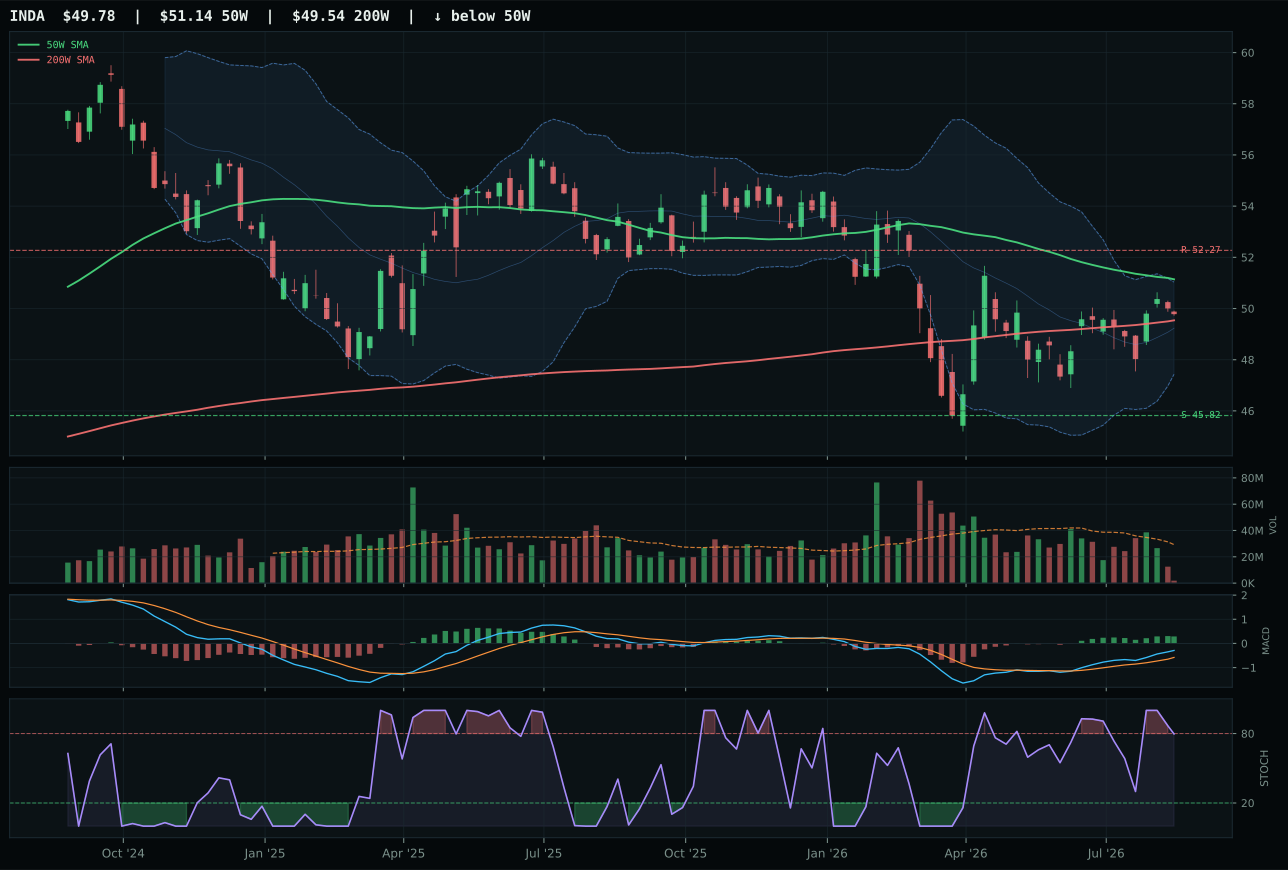
INDA has a compression near 50W profile with -1.2% 13-week relative strength versus SPY.
A failed hold above support would weaken the setup.
Actionable but governed by invalidation levels.
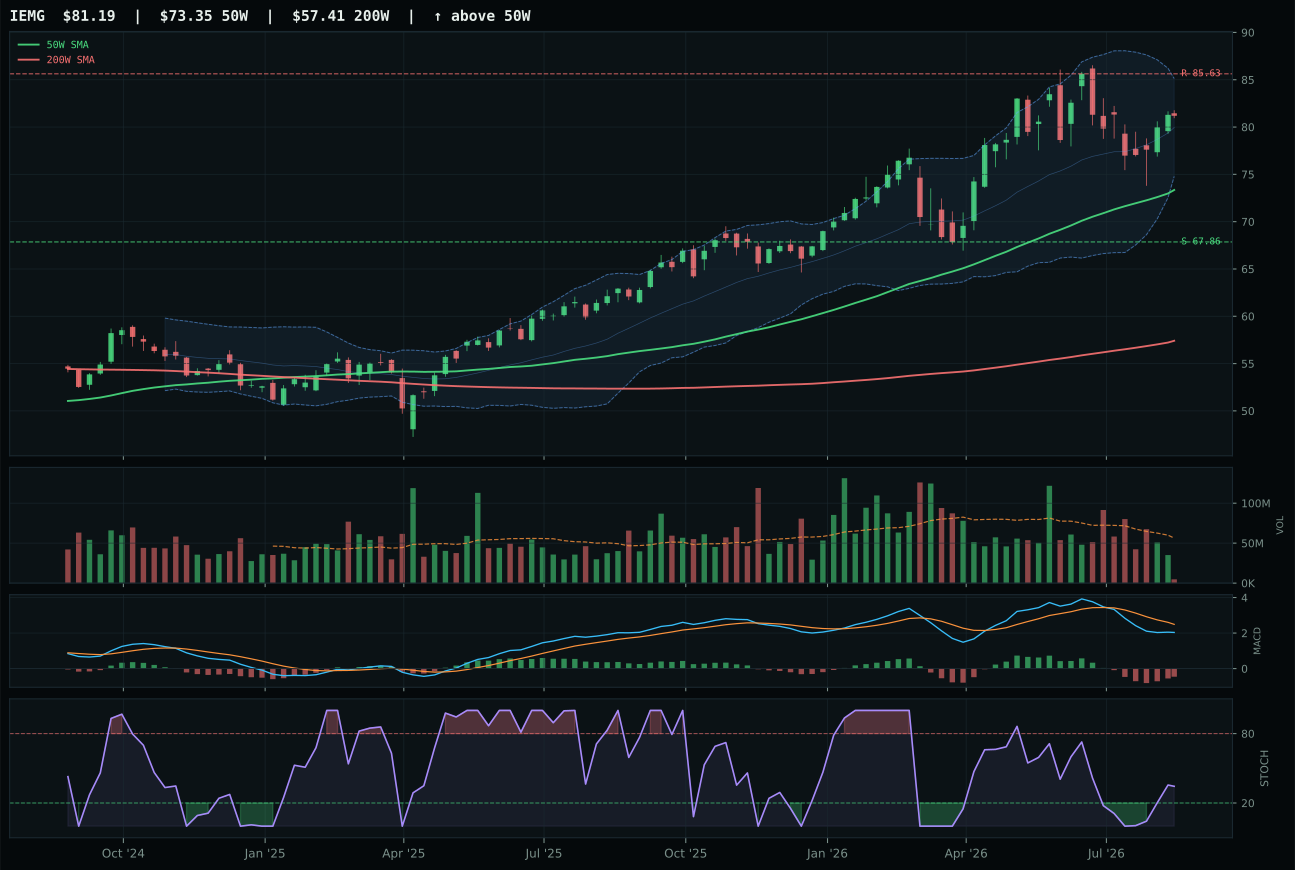
IEMG has a neutral structure profile with -3.3% 13-week relative strength versus SPY.
A failed hold above support would weaken the setup.
Actionable but governed by invalidation levels.
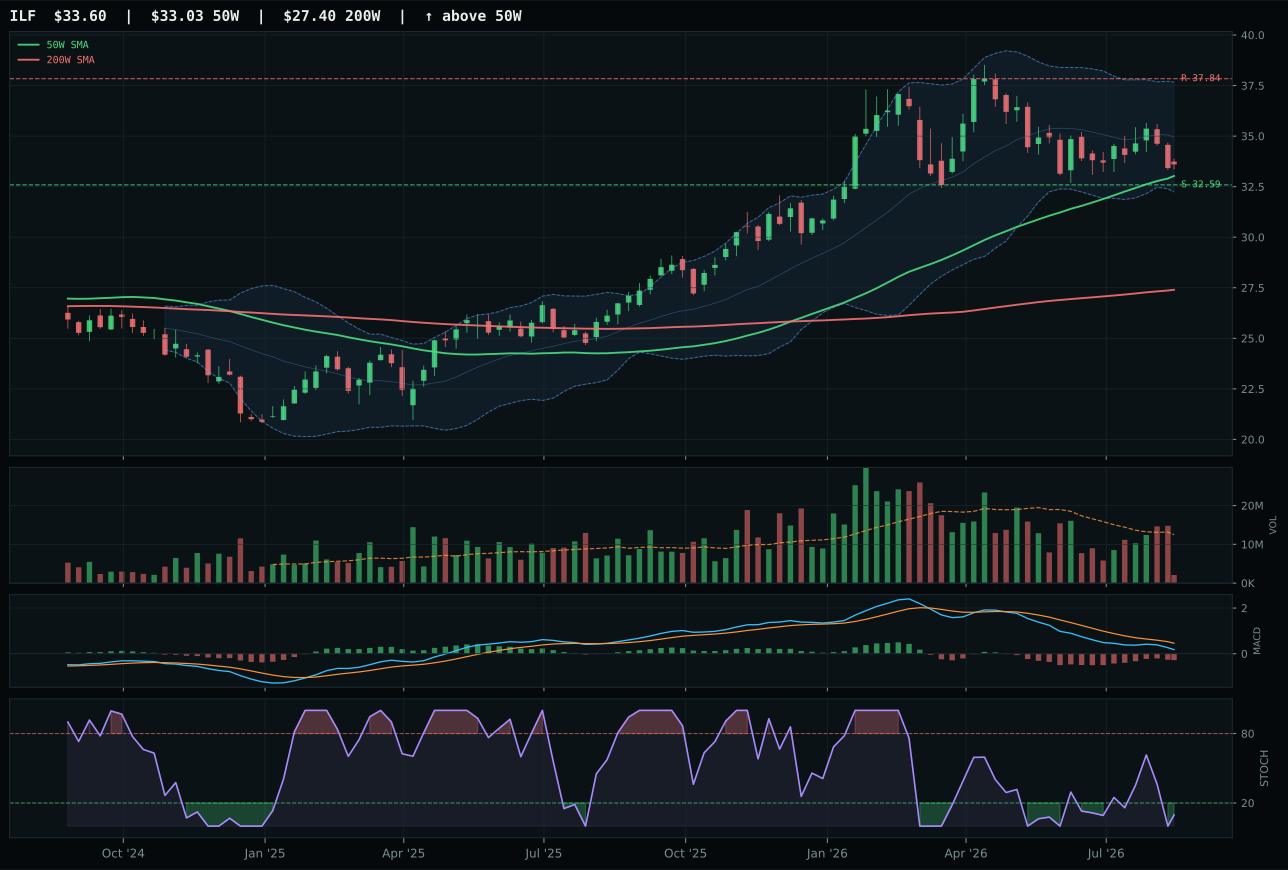
ILF has a pullback into support profile with -7.9% 13-week relative strength versus SPY.
A failed hold above support would weaken the setup.
Actionable but governed by invalidation levels.
IEMG wins the category with a borderline-qualified 48.1 score because it delivers neutral category-relative strength (0.0%) and trend score of 88.0 despite MACD being bearish but improving, whereas INDA's setup is more technically sound (75.4 technical evidence vs 58.0) but its stochastic RSI is falling/neutral rather than rising mid-zone. IEMG sits 10.7% above the 50W with support at 67.86 and resistance at 85.63, creating a defined invalidation zone that appeals to allocators in tight-liquidity environments. The 0.8% 13W return is anemic and the -3.3% RS versus SPY indicates broad EM underperformance, but IEMG's 13W return beats INDA's 2.9% when indexed against SPY weakness—the relative trend is flat to positive. INDA lost decisively on structure cleanliness (69.2 vs 71.2) and on stochastic RSI timing signal (falling/neutral is weaker than rising mid-zone when macro is uncertain), even though INDA's bullish and improving MACD is technically superior to IEMG's bearish but improving MACD.
Emerging Markets earned 10% allocation in tier-2 and ranks outside the top-2 with a final score of 48.1. The category macro fit of 54.0 is mixed: EM liquidity support is active (+14), liquidity expansion is active (+8), but Stagflation Risk hurts this exposure (-8) and credit stress is active (-10), creating a net positive of +4. The 3/2/1 weighted basket score of 64.0 starts strong because INDA leads on technical evidence at 75.4, but the reasoner applies macro regime filters and the final score drops to 48.1—the gap between basket score and final score reflects the portfolio's skepticism about EM durability in a stagflationary environment. IEMG is held in tier-2 primarily for portfolio diversification and because EM liquidity support descriptor is active, but the category is constrained from top-2 allocation because technical persistence is weak (54.1 for IEMG), credit stress creates headwinds, and growth slowdown penalizes developing-market cyclicality. For Emerging Markets to earn higher allocation, either credit stress would need to move from active to inactive, or EM-specific momentum confirmation (like INDA's 2.9% 13W return) would need to broaden across the entire basket instead of being isolated.
Industrial Metals — COPX
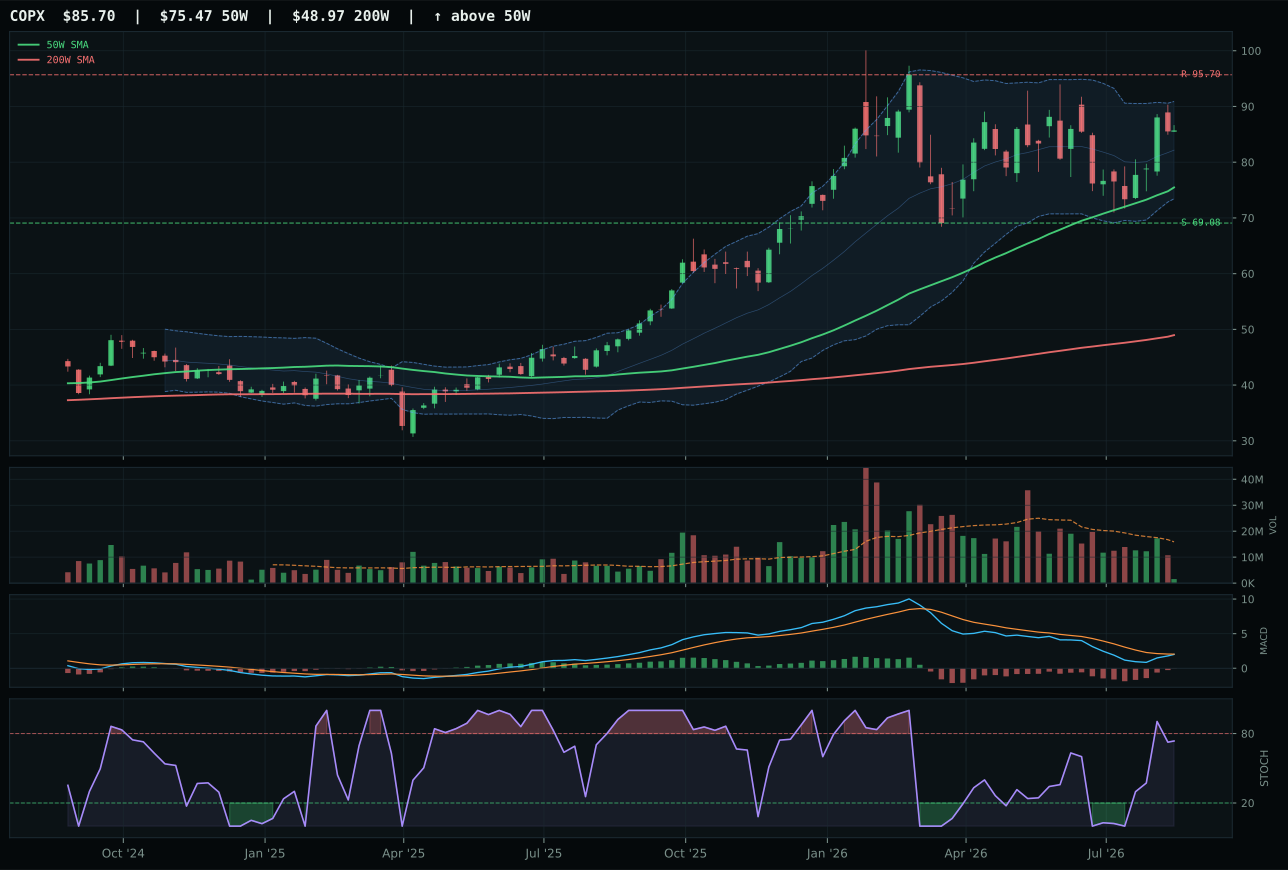
COPX has a neutral structure profile with -1.3% 13-week relative strength versus SPY.
A failed hold above support would weaken the setup.
Actionable but governed by invalidation levels.
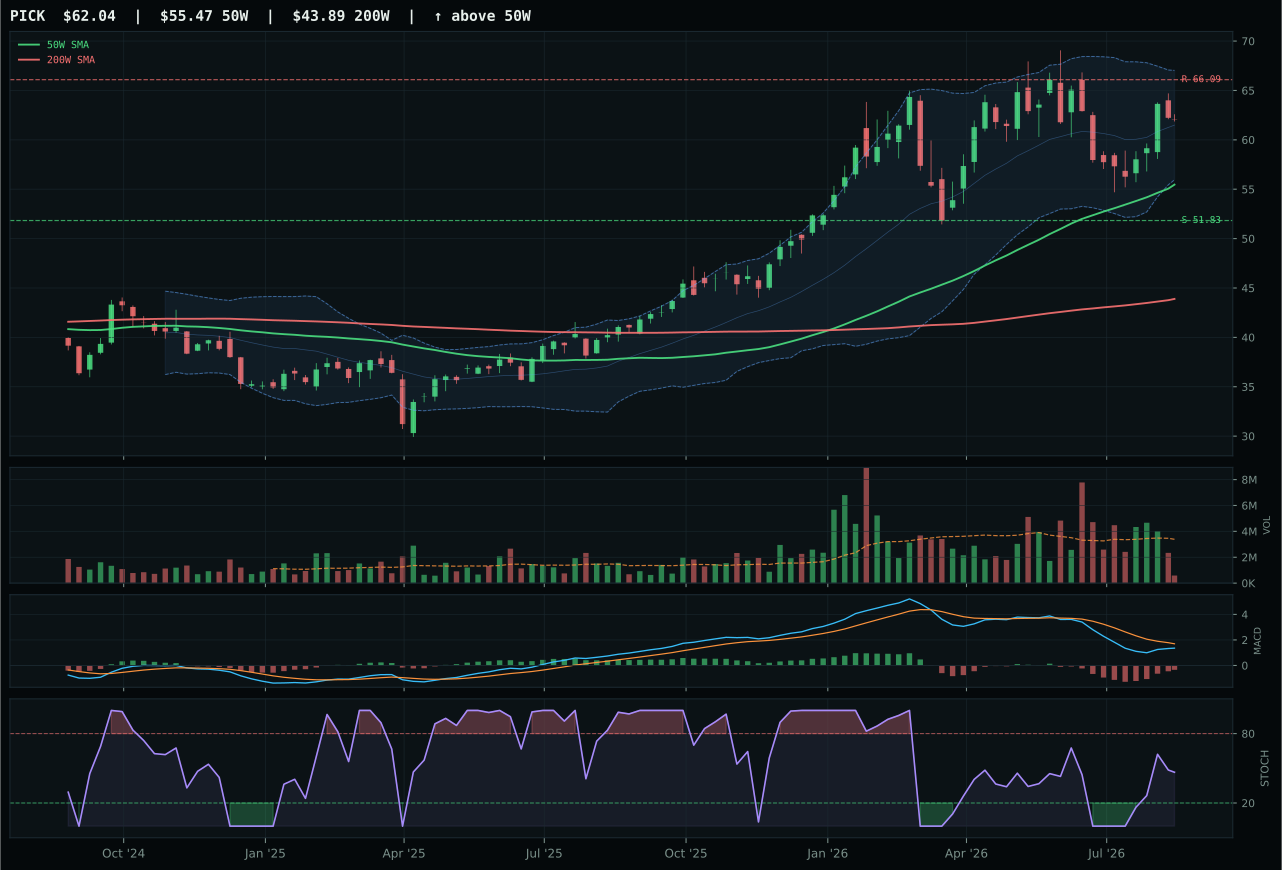
PICK has a neutral structure profile with -6.5% 13-week relative strength versus SPY.
A failed hold above support would weaken the setup.
Actionable but governed by invalidation levels.
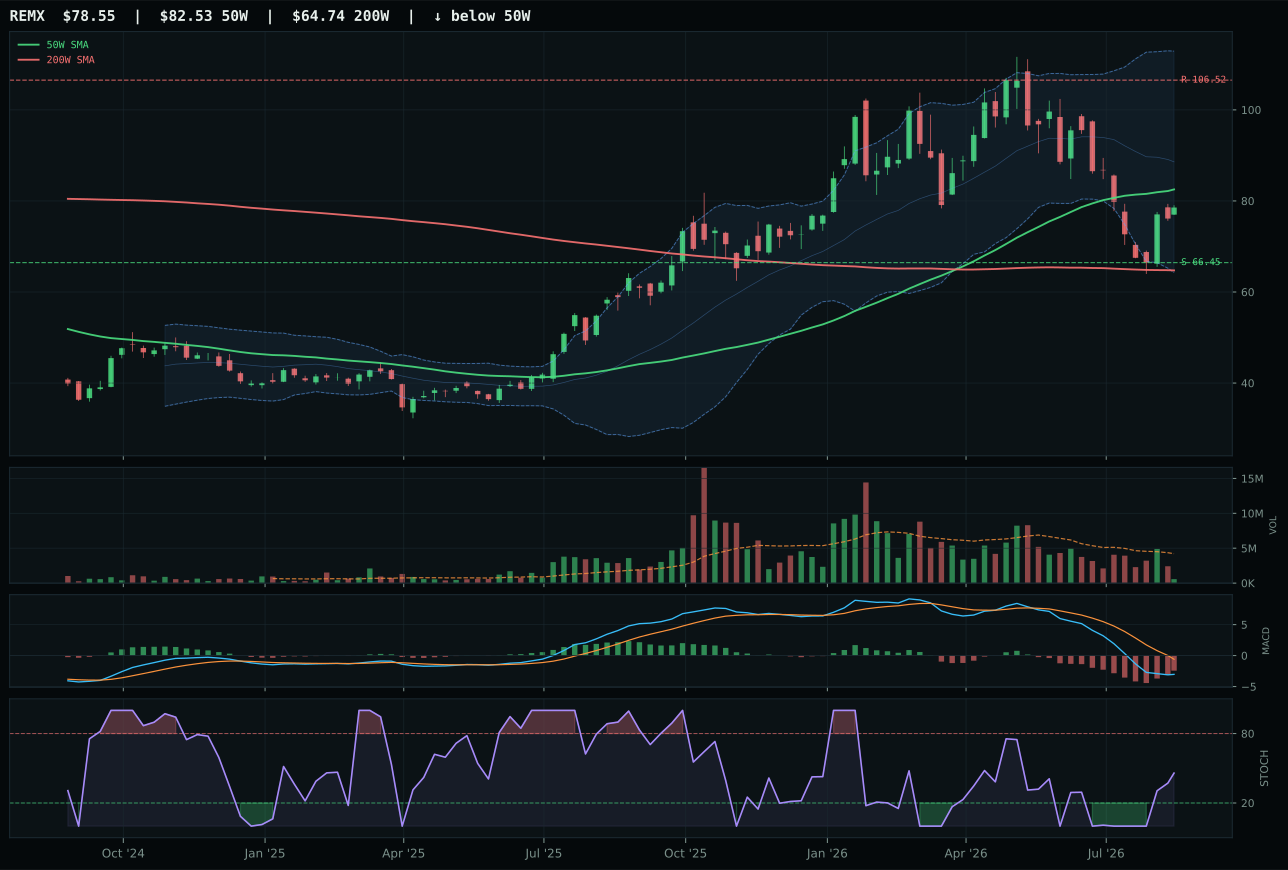
REMX has a neutral structure profile with -23.0% 13-week relative strength versus SPY.
A failed hold above support would weaken the setup.
Actionable but governed by invalidation levels.
COPX wins the category because it sits at 13.5% above the 50W with trend score of 91.0, MACD bearish but improving (not yet bullish like Energy names), stochastic RSI rising mid-zone at 0.74, and category-relative strength of 5.2% that proves copper exposure is being preferred over the mining and diversified metal alternatives. The 2.8% 13W return is weak, but the setup strength lies in timing score of 83.0: distance to the 50W at 13.5% means the entry risk is real, yet MACD improvement and stochastic RSI mid-zone mean the momentum has room to extend without being overbought. Support is defined at 69.08 and resistance at 95.70, creating a 26.2-point range; upside to resistance is -10.4% while downside to support is 24.1%, a favorable asymmetry for a tier-2 hold. PICK lost on structure cleanliness (62.6 vs 65.0) and category-relative strength (0.0% vs 5.2%), which tells the story: diversified miners are being rotated out while copper-specific scarcity plays are being rotated into, driven by industrial demand expectations.
Industrial Metals earned 10% allocation in tier-2 and ranks outside the top-2 with a final score of 47.1. The category macro fit of 63.0 is solid and driven by metals scarcity being active (+14), commodity breadth positive being active (+10), and real asset sponsorship being active (+6), only partially offset by growth slowdown (-10) and credit stress (-7). The 3/2/1 weighted basket starts at 53.6 from COPX leading PICK and REMX, which is a respectable foundation, yet the reasoner applies persistence and volume-price filters and the category score settles at 47.1. Industrial Metals does not break into top-2 allocation because its technical evidence across the basket is weaker than Energy (62.3 for XLE) and Defense (71.2 for XAR)—COPX's momentum confirmation score of 73.7 is solid but PICK's 46 and REMX's 0 pull the category average down. The tier-2 allocation of 10% is justified by the strong macro narrative (supply shortage, real assets, stagflation support) but constrained by weak technical volume sponsorship, particularly in the longer-dated persistence scores which hover around 57 for COPX.
Precious Metals — GDX
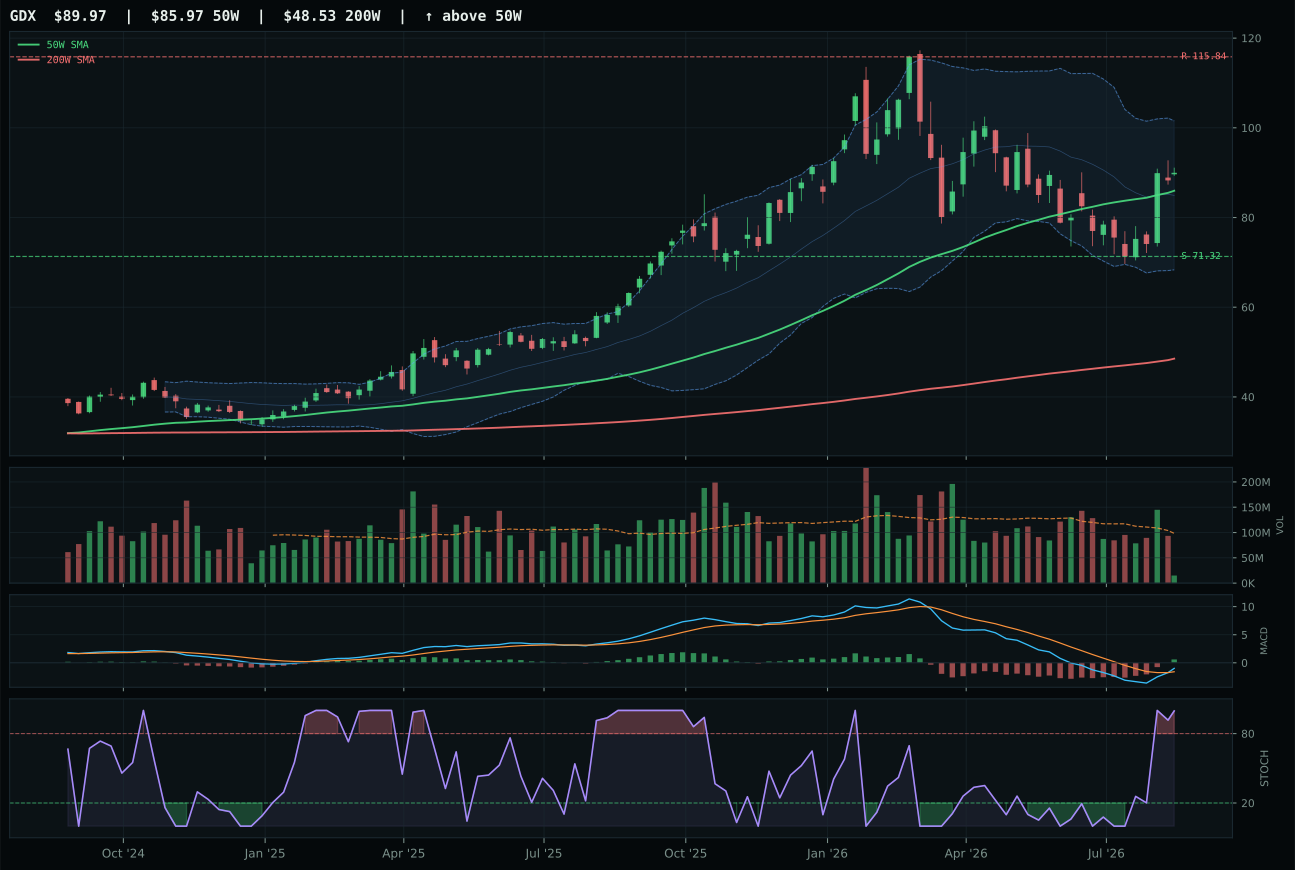
GDX has a neutral structure profile with 1.7% 13-week relative strength versus SPY.
A failed hold above support would weaken the setup.
Actionable but governed by invalidation levels.
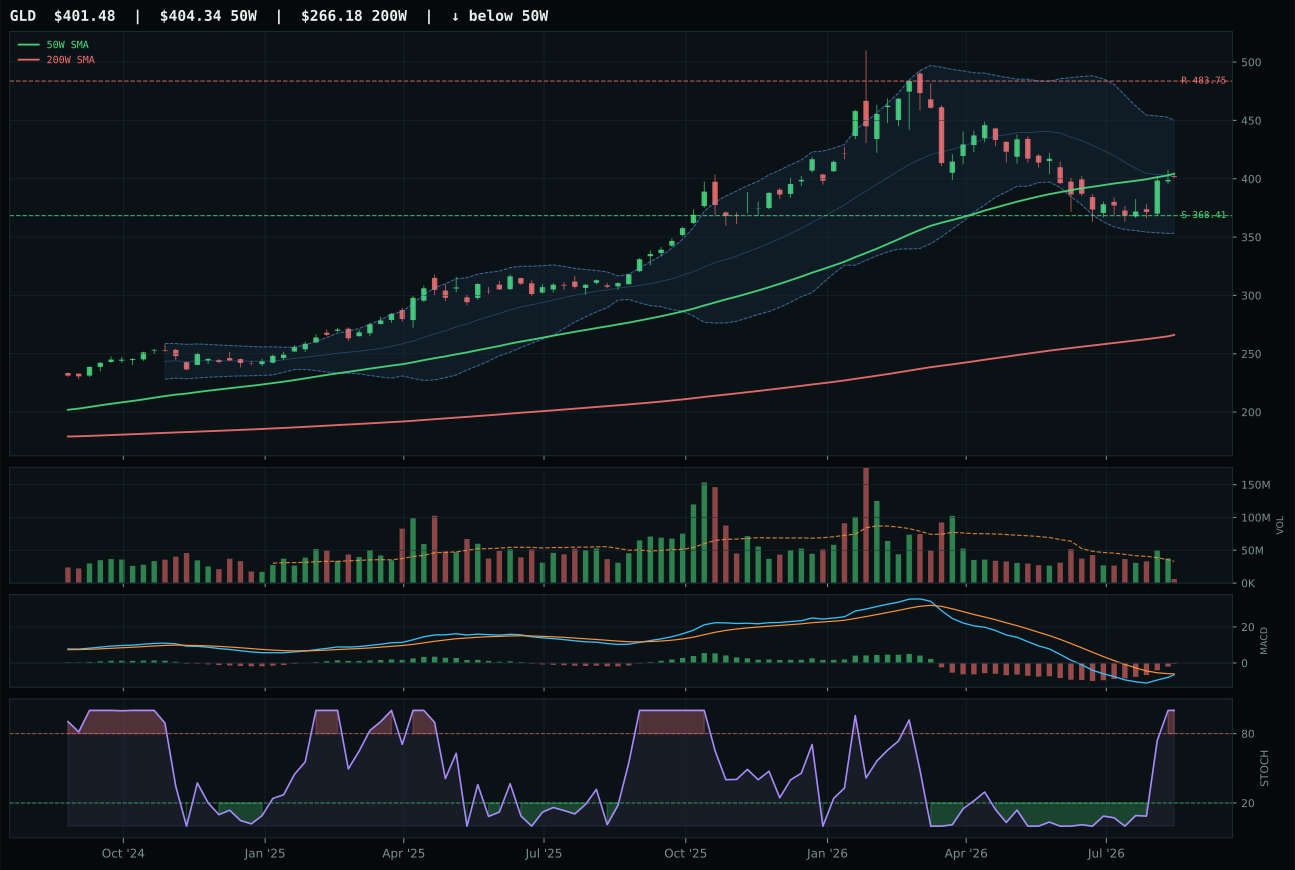
GLD has a compression near 50W profile with -7.1% 13-week relative strength versus SPY.
A failed hold above support would weaken the setup.
Actionable but governed by invalidation levels.
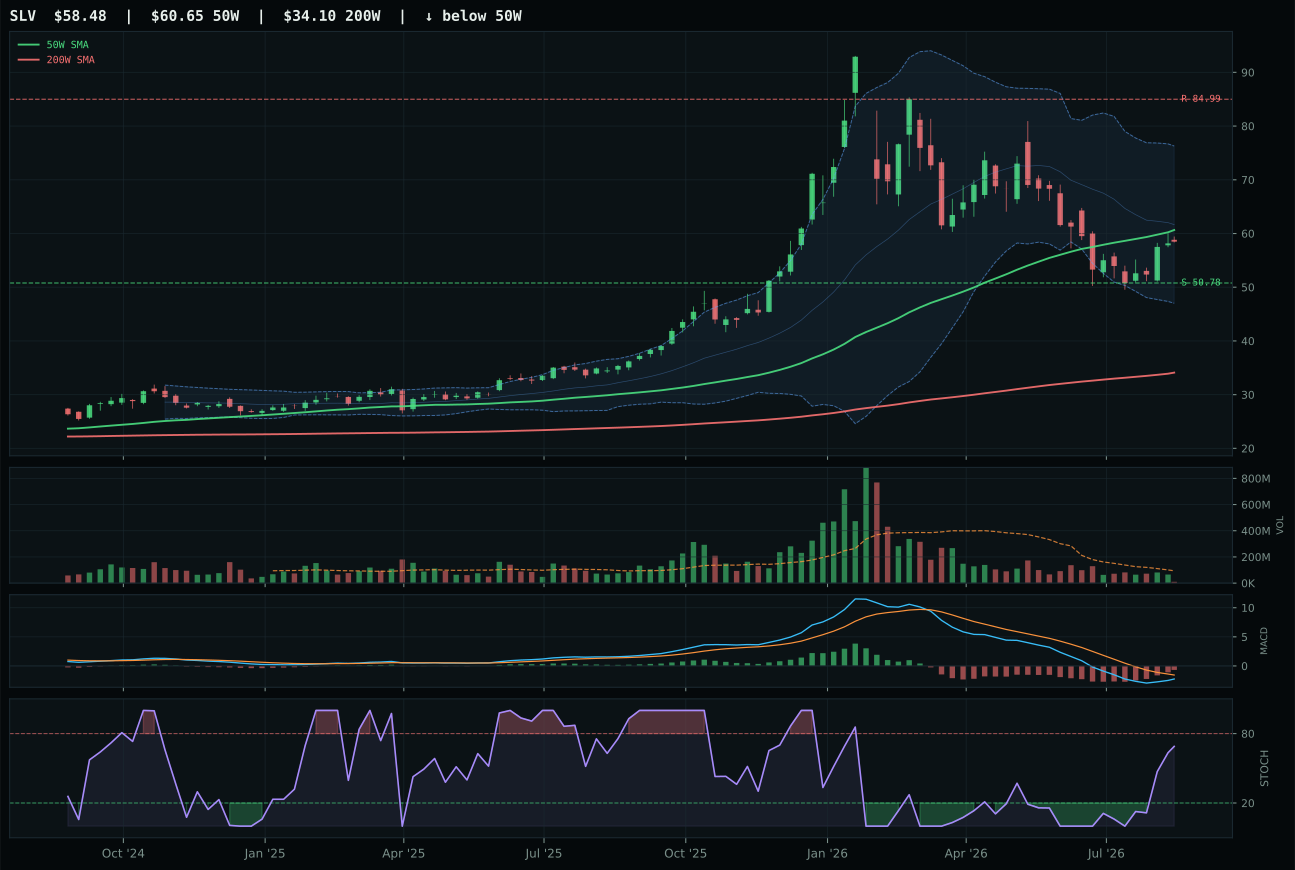
SLV has a neutral structure profile with -18.6% 13-week relative strength versus SPY.
A failed hold above support would weaken the setup.
Actionable but governed by invalidation levels.
GDX wins the category decisively over GLD because its MACD is bullish and improving—the key distinction in a reset environment. GDX sits just 4.6% above the 50W with trend score of 100.0, momentum confirmation at an extreme 100.0 from a 19.6% 4W return and 8.8% category-relative strength, and stochastic RSI overbought at 1.00 confirming climactic momentum. The 5.8% 13W return is modest but GDX leads GLD (−3.0%) by a full 8.8 points on category-relative strength, proving that miners are being allocated into while physical gold is being distributed. GLD's setup is compression near the 50W with bearish but improving MACD and overbought stochastic RSI, which creates an ambiguous setup—the compression could be a pause before a breakout, or a rejection before a breakdown. Volume-price confirmation is 73.6 for GDX and only 45 for GLD, meaning GDX's move has retail and institutional sponsorship while GLD's overbought condition is running on its own momentum without new money entering.
Precious Metals earned 10% allocation in tier-2 and ranks outside the top-2 with a final score of 46.1. The category macro fit of 58.0 is moderately positive because Stagflation Risk helps this exposure (+10) but liquidity expansion is surprisingly negative (-2), and the reasoner weights macro fit at 38% while technical evidence carries 62%. GDX's technical evidence of 77.7 is strong but the category's 3/2/1 weighted basket score of 57.0 reflects the fact that GLD ranks second with only 50.1 technical evidence and SLV is deeply weak at 28.0, pulling the basket average below what a single-ETF category like Energy or Defense can muster. The result is that Precious Metals holds a tier-2 seat purely on macro tailwinds and the fact that GDX itself is a legitimate momentum name; however, the category lacks the technical breadth and volume sponsorship to qualify for top-2. For allocation to increase, GLD would need to shift from bearish to bullish MACD confirmation, creating a two-out-of-three consensus, and/or the macro fit descriptor 'real asset sponsorship' would need to move from neutral to active.
Utilities & Infrastructure — PAVE
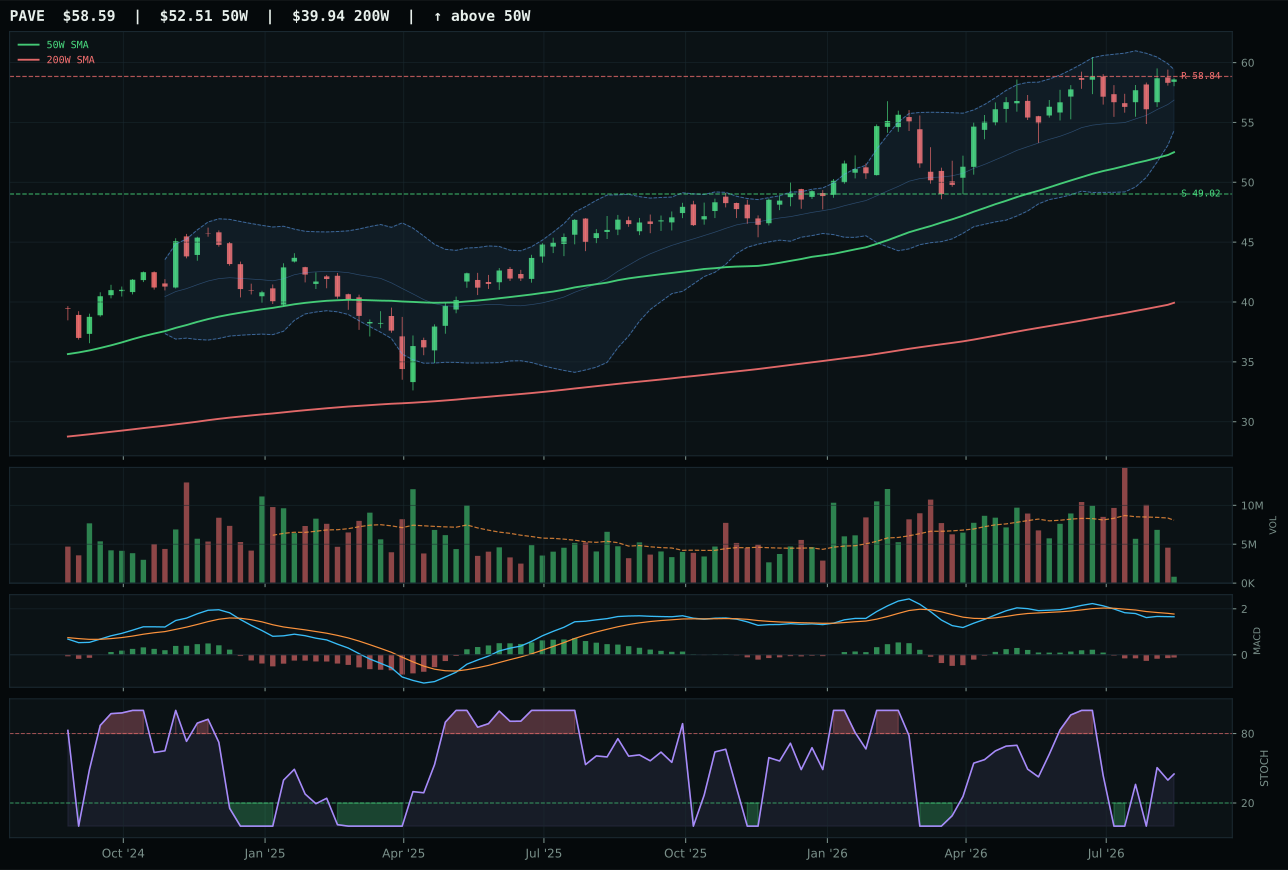
PAVE has a neutral structure profile with 2.5% 13-week relative strength versus SPY.
A failed hold above support would weaken the setup.
Actionable but governed by invalidation levels.
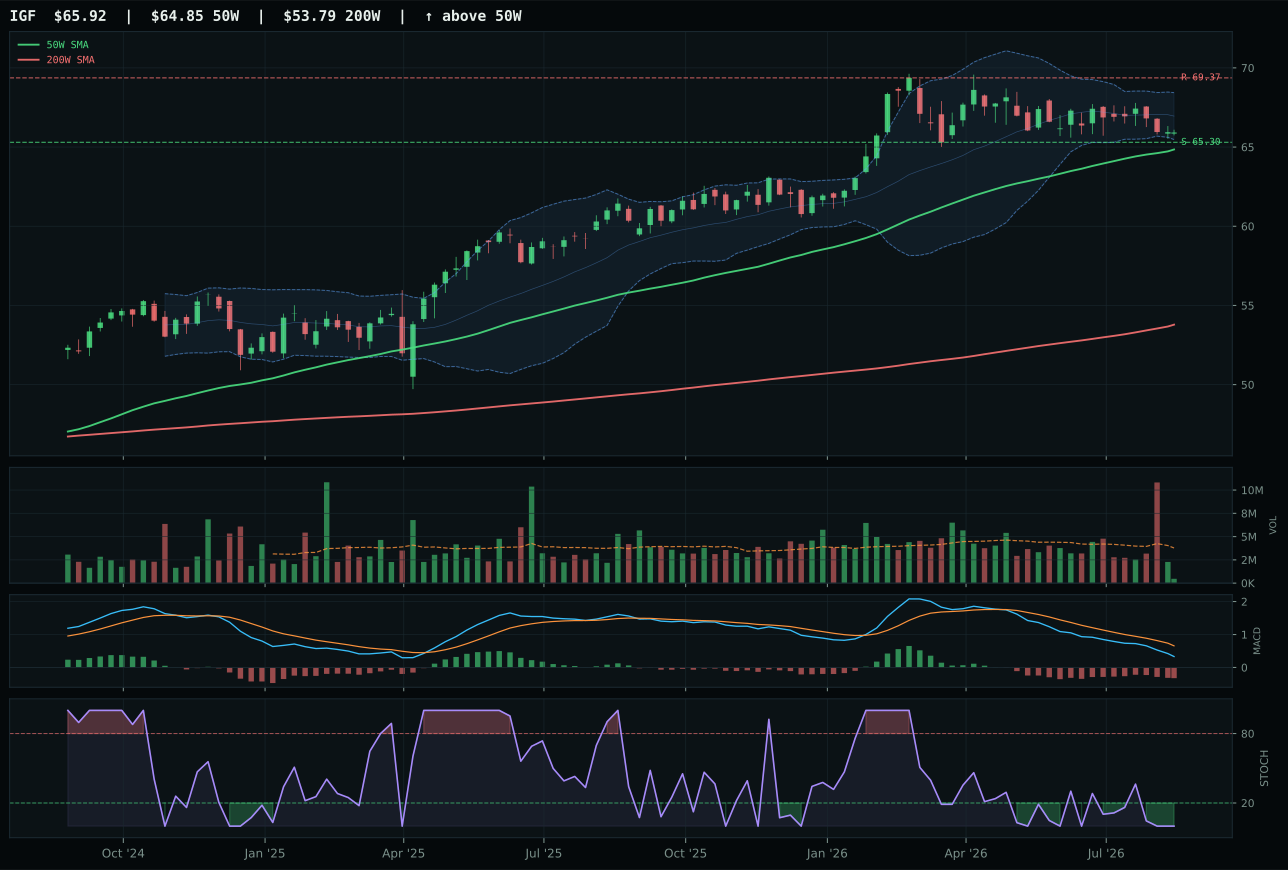
IGF has a pullback into support profile with -6.3% 13-week relative strength versus SPY.
A failed hold above support would weaken the setup.
Actionable but governed by invalidation levels.
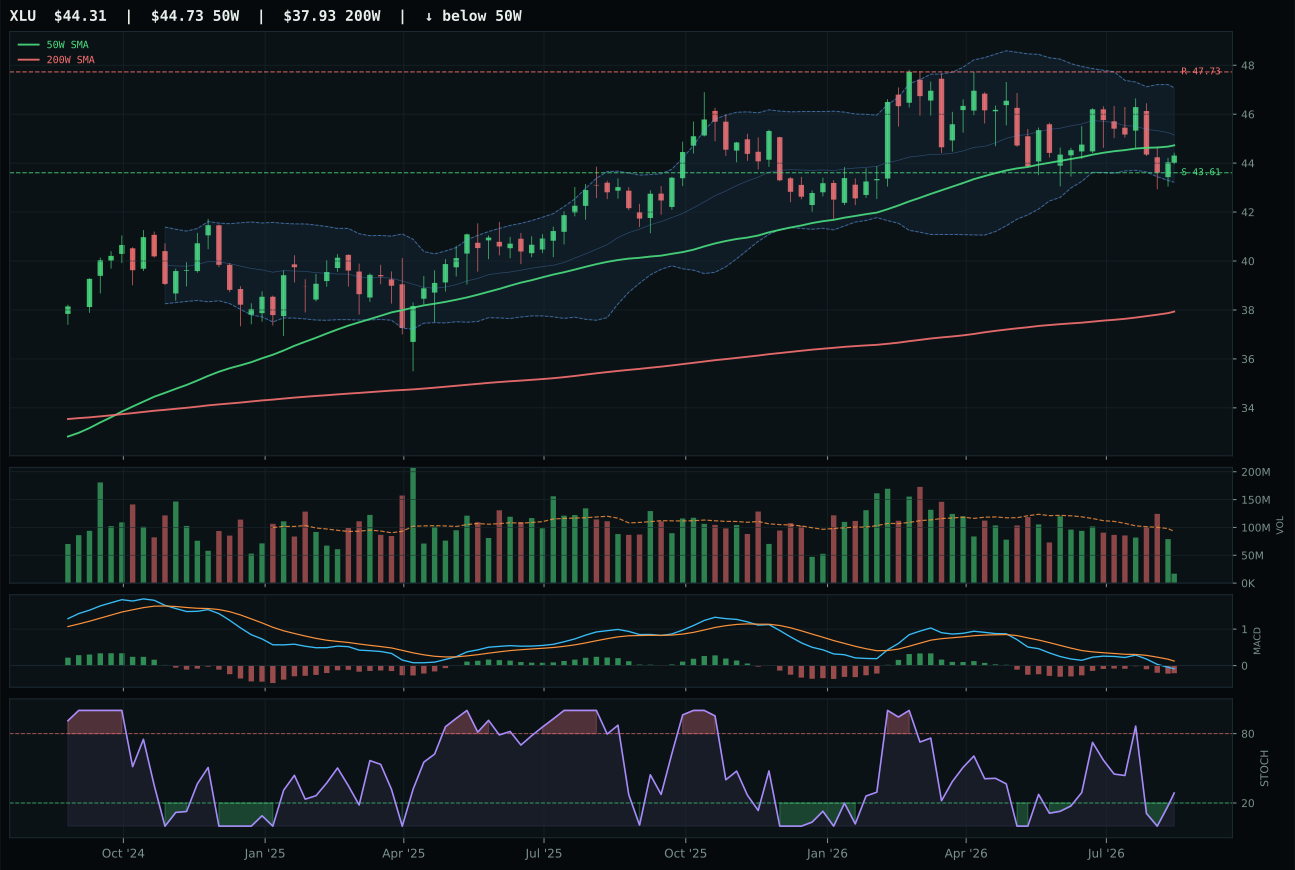
XLU has a pullback into support profile with -6.4% 13-week relative strength versus SPY.
A failed hold above support would weaken the setup.
Actionable but governed by invalidation levels.
PAVE wins the category with a 77.2% technical evidence score because it delivers the cleanest trend setup in a sector defined by macro ambiguity: price sits 11.6% above the 50W with a positive 0.5% slope, trend score of 96.8, support at 49.02 and resistance at 58.84 creating tight risk definition, and category-relative strength of 8.8% proving that domestic infrastructure names are being preferred over global income plays. The 6.6% 13W return and 2.5% RS versus SPY demonstrate real accumulation relative to utility benchmarks. MACD is bearish but improving and stochastic RSI is rising mid-zone, which is the setup profile that works when stagflation creates uncertainty about rate paths—neither pure bull nor pure bear, but positioned for mean reversion. IGF lost on multiple dimensions: structure cleanliness 69.6 vs 72.5, stochastic RSI falling/neutral versus rising mid-zone, and category-relative strength 0.0% vs 8.8%, all signaling that global infrastructure income is being rotated out in favor of domestic capex beta.
Utilities & Infrastructure earned 10% allocation in tier-2 and ranks outside the top-2 with a final score of 45.9. The category macro fit of 54.0 is neutral because Transition/Mixed helps this exposure (+4), growth slowdown is active (+6), but inflation pressure is active (-6), creating a net zero to slightly positive environment. The 3/2/1 weighted basket score of 53.5 is reasonable, but PAVE's technical evidence of 77.2 cannot overcome the category's split macro signal: growth slowdown typically hurts infrastructure income names (lower demand for utilities), while Transition/Mixed slightly helps (infrastructure spending). The reasoner applies persistence and volume-price filters and the category score settles at 45.9. Utilities & Infrastructure is held in tier-2 allocation because domestic infrastructure (PAVE) does show genuine momentum in a stagflationary environment, but the category lacks the macro sponsorship of Energy/Agriculture/Precious Metals or the geopolitical tailwind of Defense to justify top-2 status. For allocation to increase, either growth slowdown would need to invert (unlikely in near term), or real asset sponsorship would need to move from inactive to active, expanding the category's macro fit from 54.0 to a higher threshold that would push the final category score above 50 and into competitive range with tier-2 peers.
AI — AIQ
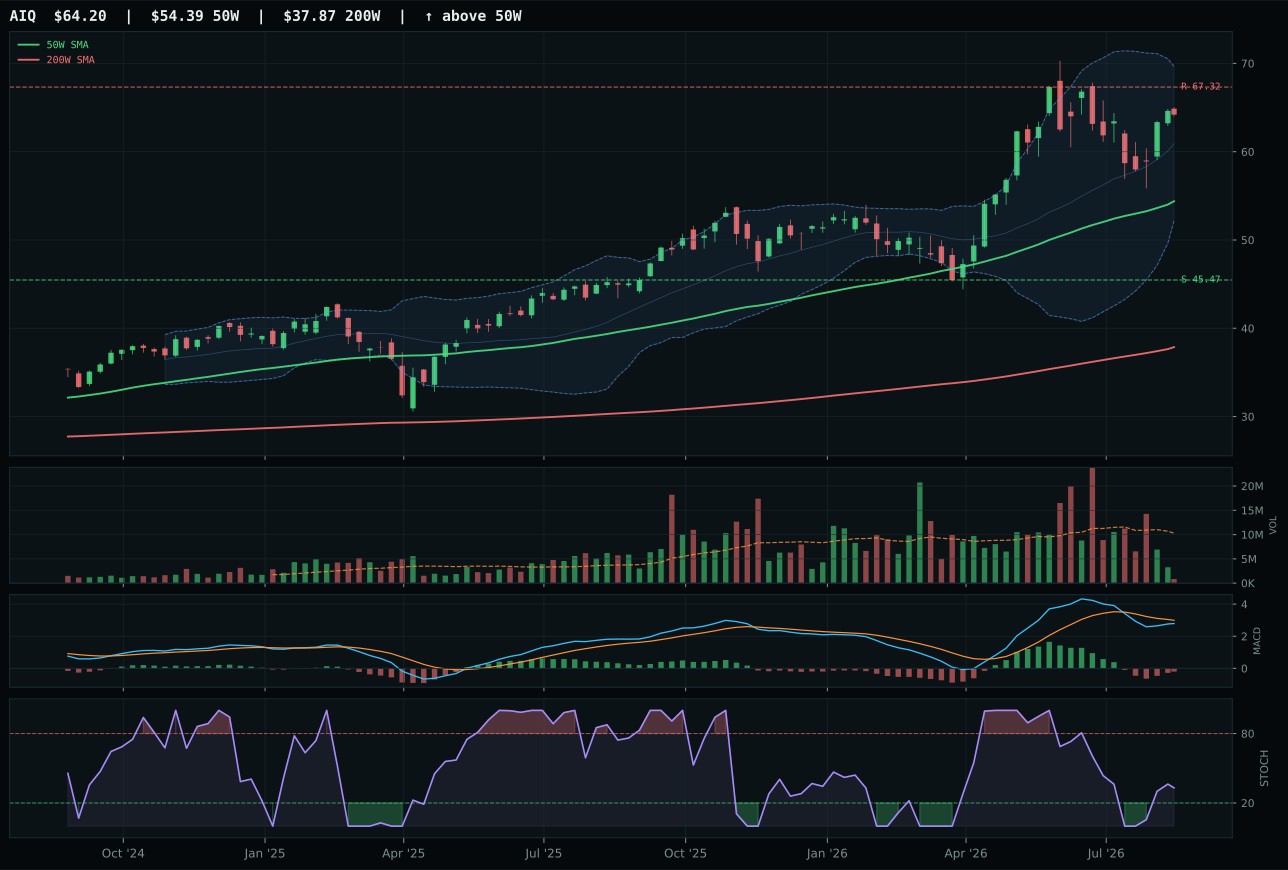
AIQ has a vertical extension profile with -1.9% 13-week relative strength versus SPY.
A failed hold above support would weaken the setup.
Actionable but governed by invalidation levels.
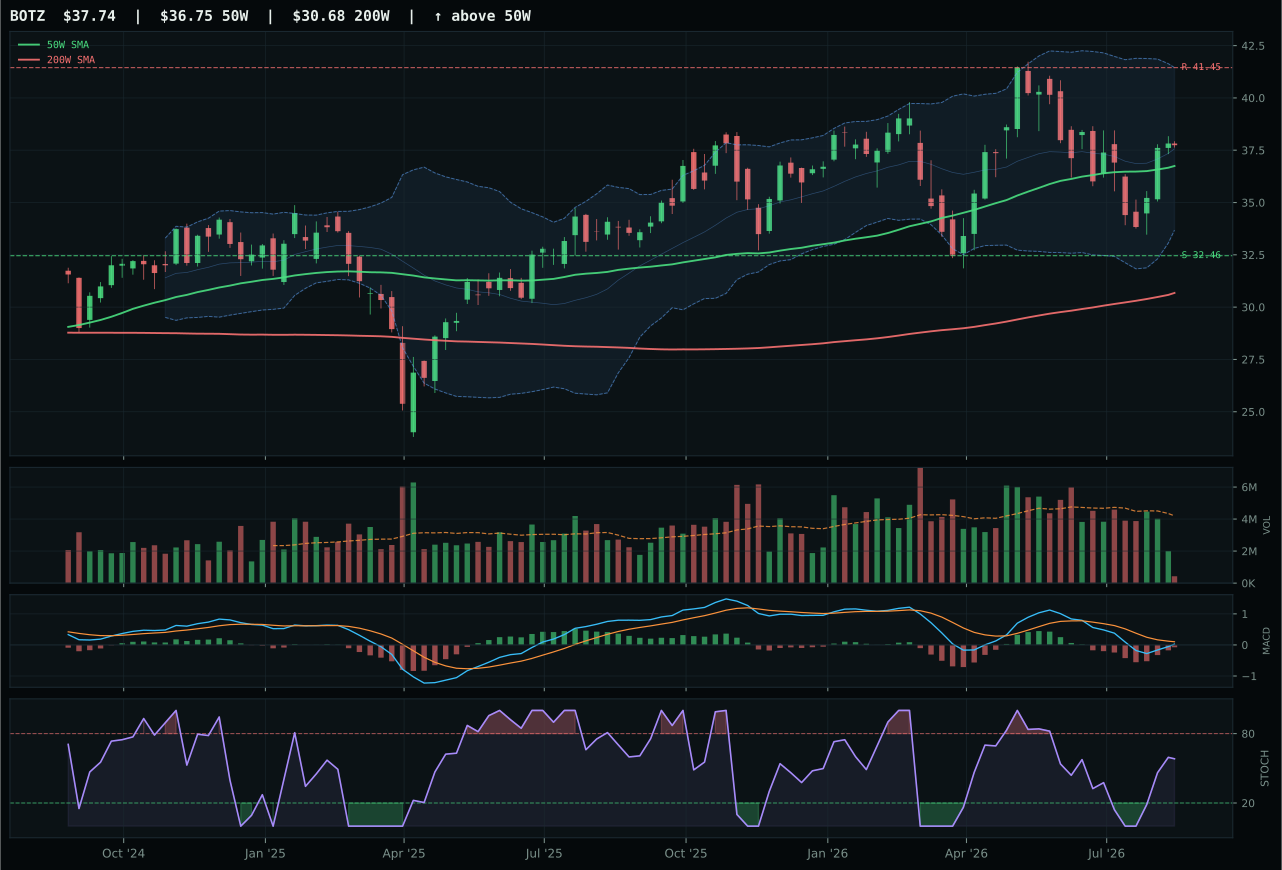
BOTZ has a compression near 50W profile with -10.4% 13-week relative strength versus SPY.
A failed hold above support would weaken the setup.
Actionable but governed by invalidation levels.
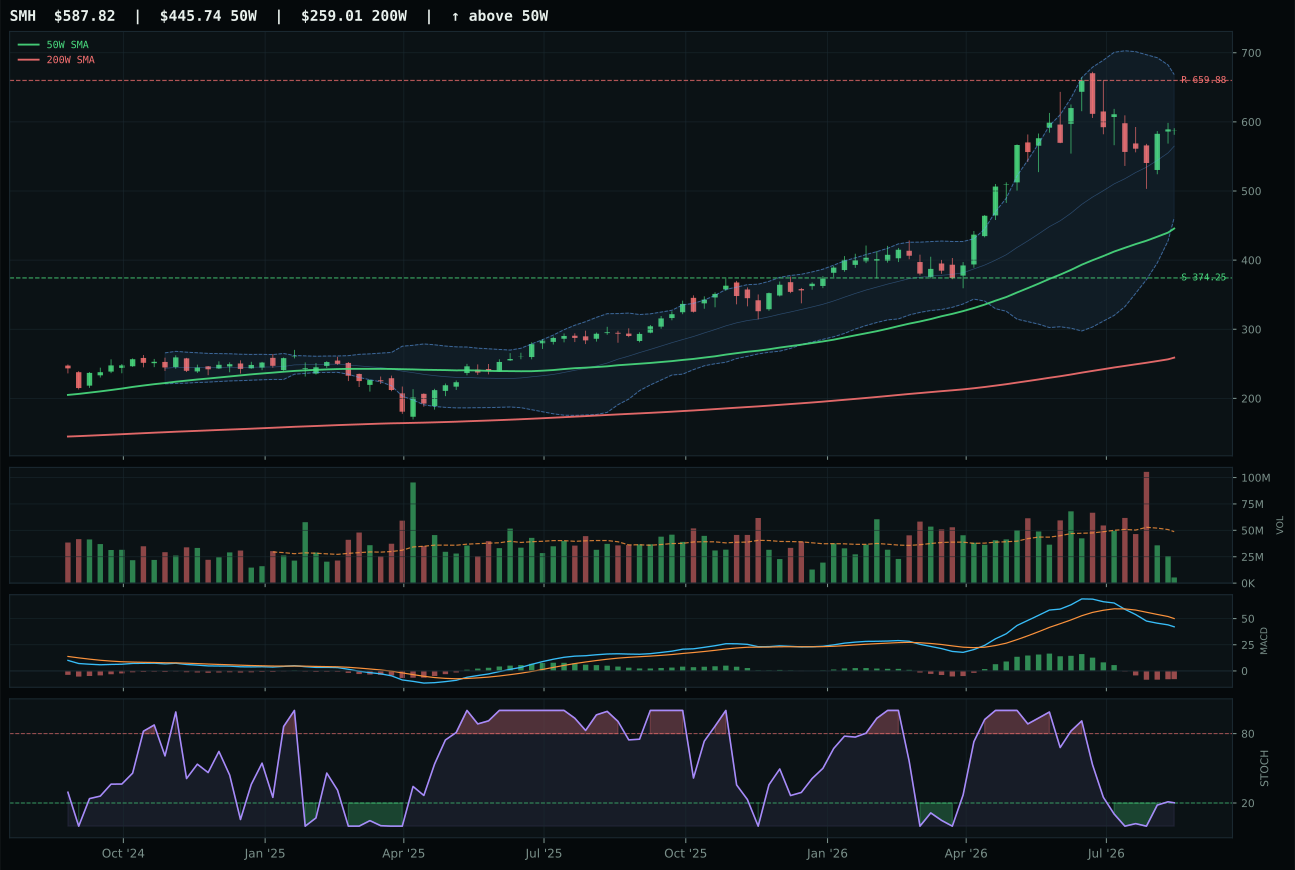
SMH has a vertical extension profile with -2.1% 13-week relative strength versus SPY.
A failed hold above support would weaken the setup.
Actionable but governed by invalidation levels.
AIQ wins on a thin margin because its 18.0% distance from the 50W is penalized harder for entry risk than BOTZ's timing setup, yet AIQ's MACD is bearish but improving (suggesting reset rather than deterioration) and its stochastic RSI sits at 0.33 in the rising mid-zone—a mid-cycle momentum rebound rather than a red-flag extension. The 2.2% 13W return is weak but category-relative strength of 0.2% is neutral, meaning AIQ is merely consolidating rather than being abandoned by its peer group. BOTZ scored higher on structure cleanliness but its category-relative strength is deeply negative at -8.3%, which signals that buyers are rotating away from robotics and physical AI names specifically, even though its 13W return of -6.3% is worse than AIQ's and its -10.4% RS versus SPY tells the story: robotics are being left behind in a stagflationary pivot. Volume-price confirmation is weak across both names at 48.6 and 39 respectively, which is the real macro tell—neither name is being accumulated, both are being distributed in a low-liquidity environment.
AI earned 0% allocation this week and ranks 9th or 10th, reflecting dual headwinds of technical weakness and macro mismatch. The category-level macro fit is 44.0, dragged down by Stagflation Risk itself (-8) and credit stress (-8), partially offset by liquidity expansion (+10). AIQ's technical evidence of 49.4 is borderline but the macro fit of 52.0 does not compensate: growth-sensitive AI themes are casualties of real-rate pressure, and neither portfolio beneficiary (software applications nor physical robotics cyclicality) delivers hard commodity or inflation-hedge sponsorship. The 3/2/1 weighted basket scores only 44.4, and after the reasoner applies leadership, volume-price, persistence, and macro filters, the category score falls to 43.0—lower than both Energy (71.8) and Defense & Aerospace (60.6). For AI to earn allocation in this regime, either MACD persistence would need to shift from bearish to outright bullish across the entire three-ETF basket, or macroeconomic credit-stress and growth-slowdown flags would need to reverse, neither of which is visible in the near term.
Technology — IGV
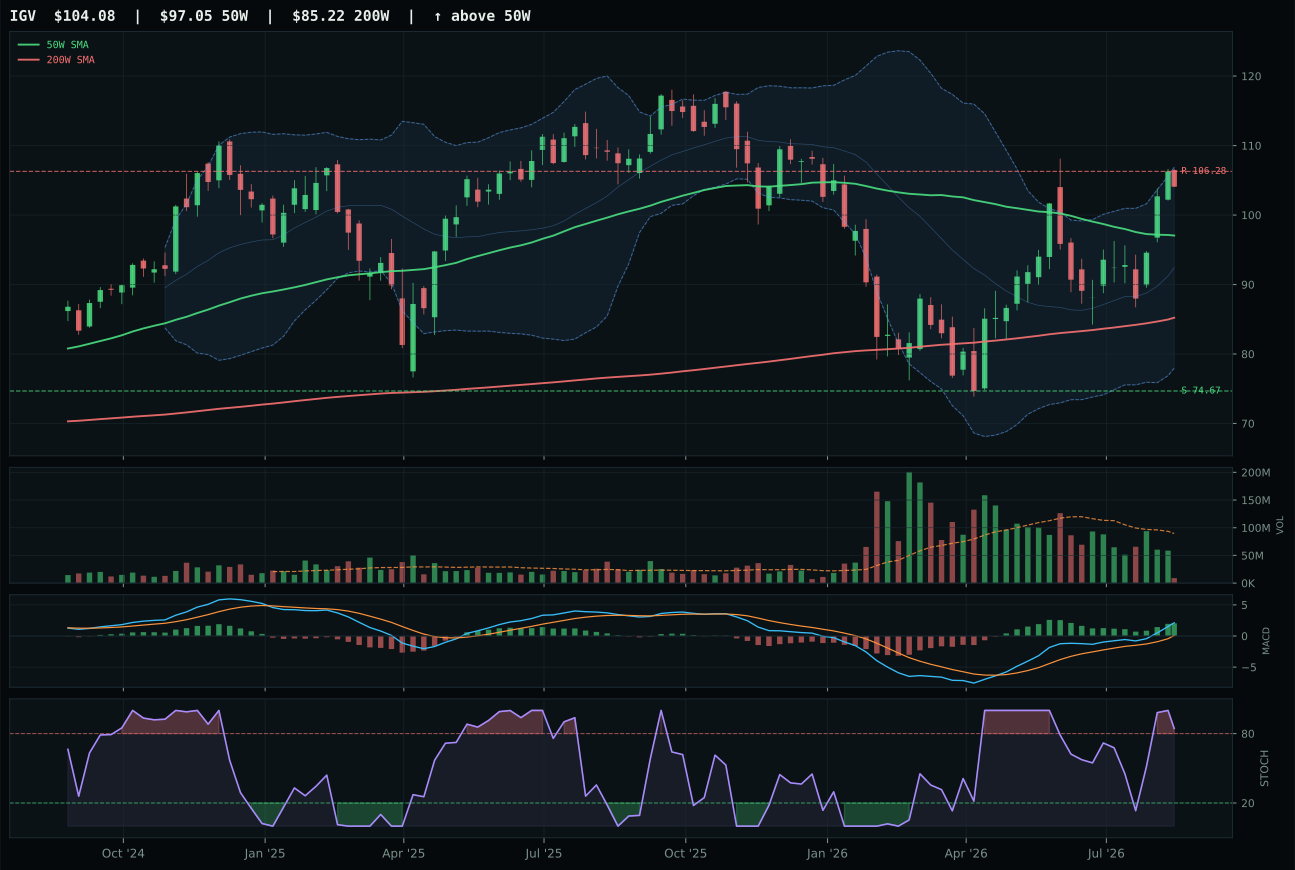
IGV has a neutral structure profile with 6.6% 13-week relative strength versus SPY.
A failed hold above support would weaken the setup.
Actionable but governed by invalidation levels.
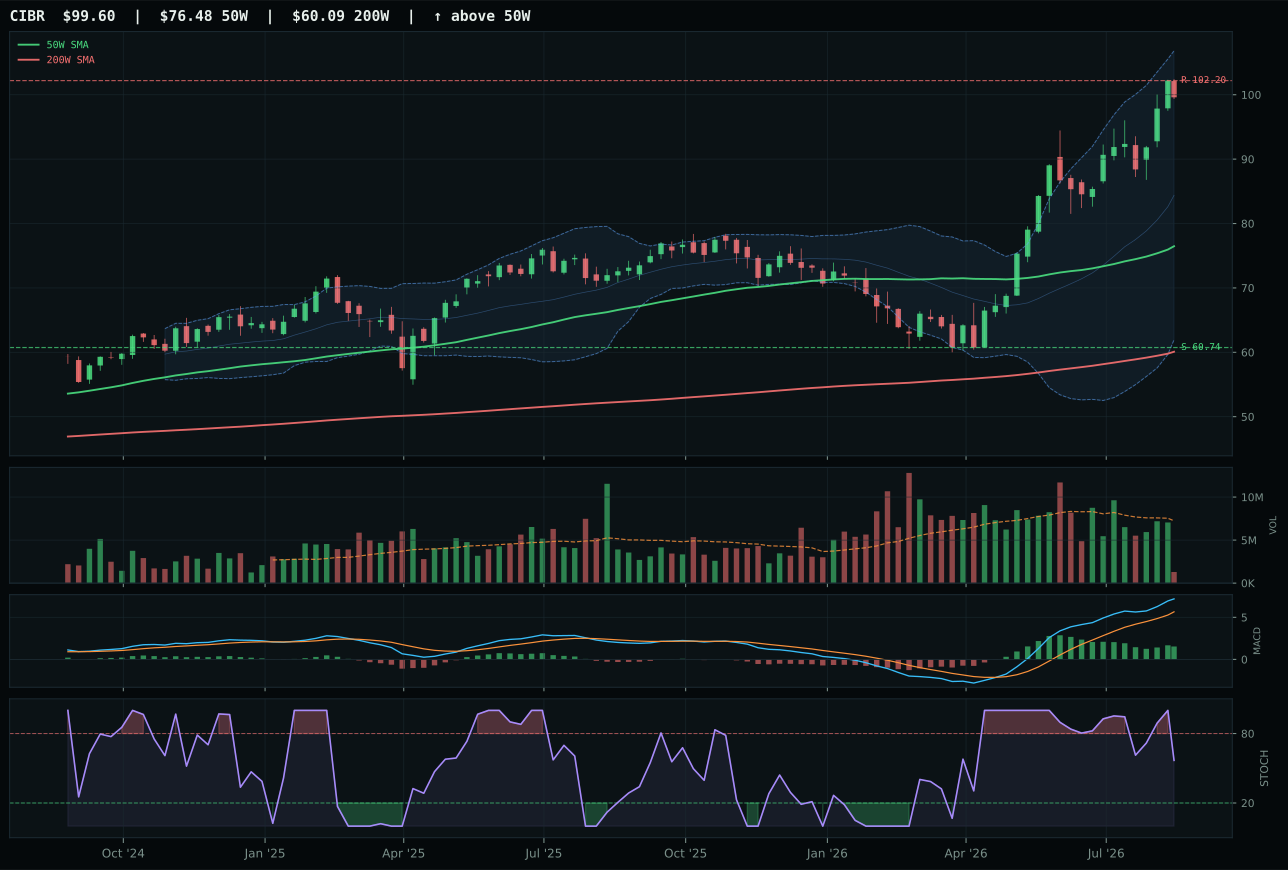
CIBR has a vertical extension profile with 14.1% 13-week relative strength versus SPY.
A failed hold above support would weaken the setup.
Actionable but governed by invalidation levels.
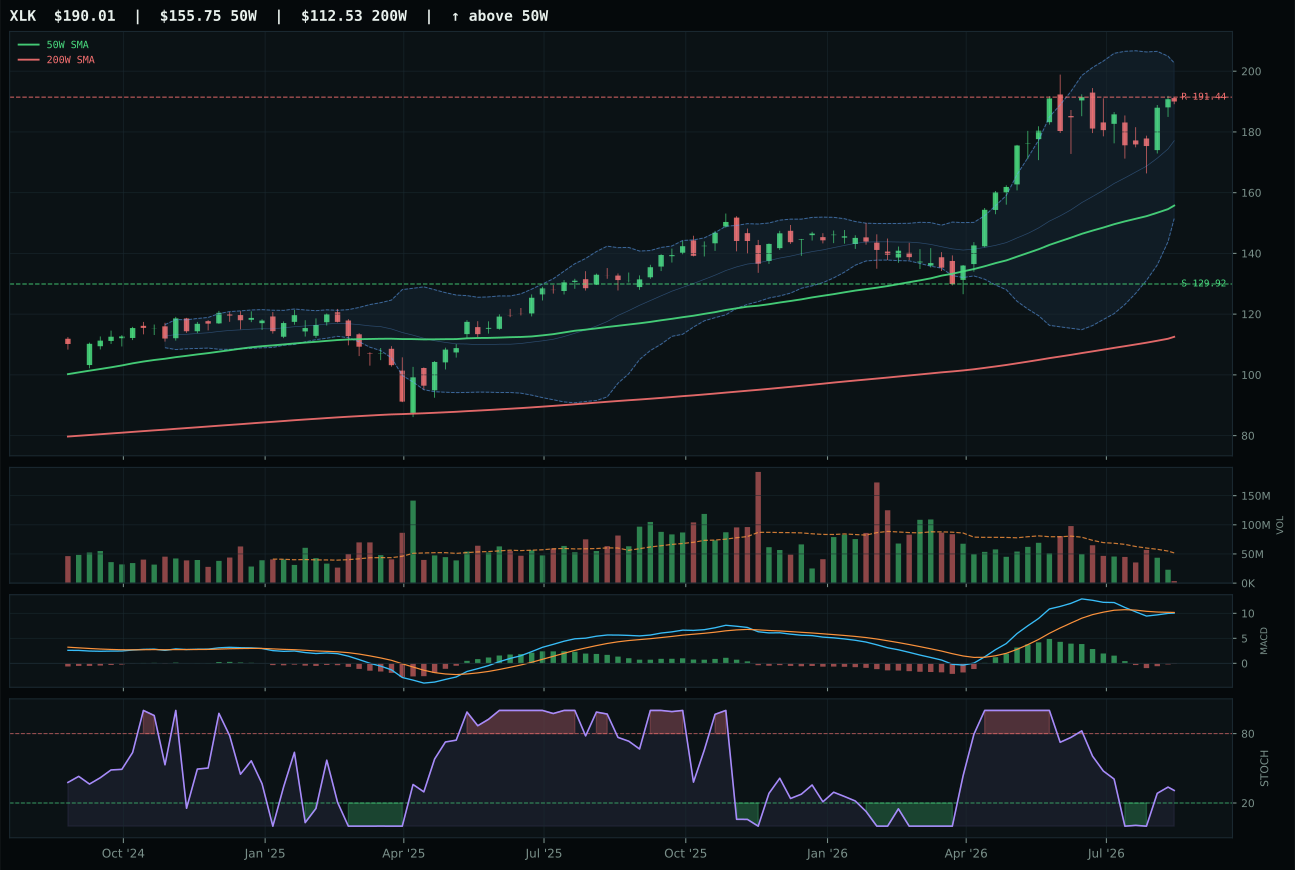
XLK has a vertical extension profile with 1.2% 13-week relative strength versus SPY.
A failed hold above support would weaken the setup.
Actionable but governed by invalidation levels.
IGV captures the category leadership despite neutral structure because its trend evidence is immaculate—price sits cleanly above both the 50W and 200W with a near-flat slope and 6.6% relative strength versus SPY—and timing is anchored by tight distance to the 50W at just 7.2%, MACD bullish and improving, and overbought stochastic RSI confirming climactic participation. The 10.7% 13W return demonstrates real accumulation, not a dead-cat bounce, and volume-price confirmation at 69.7 suggests the move is being sponsored rather than rejected. CIBR lost the matchup decisively on both timing (45.0 vs 75.0) and risk asymmetry: it sits 30.2% extended from its 50W with support at 60.74 and resistance at 102.20, meaning every fresh buyer enters underwater and the risk-reward ratio has deteriorated to 37.7 versus IGV's 46.0. MACD and momentum are both bullish across both names, but CIBR's vertical extension setup violates the core timing principle that extension purchases pay worst when macro is stagflationary and duration is under pressure.
Technology earned 0% allocation this week and ranks 9th or 10th among all categories, which reflects the collision between Stagflation Risk and the category's duration sensitivity. IGV's macro fit registers only 50.0 because liquidity expansion is active (+9) but credit stress is active (-7), and stagflation itself penalizes growth-oriented software and cybersecurity by 7 points at the category level. The category-level macro fit of 41.0 is the real culprit: Stagflation Risk directly hurts technology exposure, and there is no compensating real-asset narrative or inflation-hedge profile to justify capital allocation. Even though IGV's technical evidence (74.0) is solid and better than CIBR's (61.8), the portfolio reasoner weighted technical evidence at only 62% against macro fit at 38%, meaning the stagflationary regime override proved too steep to overcome. Two higher-ranked categories (Energy and Defense & Aerospace) both score above 60 and both benefit from stagflation dynamics, so Technology gets no seat in a portfolio that must choose between real assets and traditional growth exposure during real-rate compression.