
2026-08-07
Informational purposes only. The content in this report, including allocations, analysis, and commentary, is provided solely for informational and educational purposes. It does not constitute financial advice, investment advice, trading advice, or any other type of advice. Past performance does not guarantee future results. Always conduct your own research and consult a qualified financial professional before making investment decisions.
Weekly Allocation
| Ticker | Category | Weight | Role |
|---|---|---|---|
| IEMG | Emerging Markets | 20% | Top-2 (20%) |
| ITA | Defense & Aerospace | 20% | Top-2 (20%) |
| IGV | Technology | 10% | Tier-2 (10%) |
| PAVE | Utilities & Infrastructure | 10% | Tier-2 (10%) |
| GDX | Precious Metals | 10% | Tier-2 (10%) |
| AIQ | AI | 10% | Tier-2 (10%) |
| URA | Nuclear Energy | 10% | Tier-2 (10%) |
| MOO | Agriculture & Livestock | 10% | Tier-2 (10%) |
Trade Instructions — Monday Open
Sell the tranche from 2026-07-10 (completing its 4-week hold). Buy the new tranche. Instructions show net portfolio changes — same-asset positions cancel, weight changes show the delta.
| Action | Ticker | Instruction |
|---|---|---|
| SELL | CIBR | Sell 44% of CIBR position (reduce 11.25% → 6.25%) |
| SELL | BOTZ | Sell 67% of BOTZ position (reduce 7.50% → 2.50%) |
| SELL | XLU | Sell 33% of XLU position (reduce 7.50% → 5.00%) |
| SELL | WEAT | Sell 20% of WEAT position (reduce 12.50% → 10.00%) |
| SELL | COPX | Sell 29% of COPX position (reduce 8.75% → 6.25%) |
| SELL | URNM | Sell 50% of URNM position (reduce 5.00% → 2.50%) |
| SELL | FCG | Sell entire FCG position (2.50% of portfolio) |
| BUY | ITA | Buy ITA — 11.11% of freed cash (adds 2.50% to portfolio) |
| BUY | AIQ | Buy AIQ — 11.11% of freed cash (adds 2.50% to portfolio) |
| BUY | IEMG | Buy IEMG — 22.22% of freed cash (adds 5.00% to portfolio) |
| BUY | IGV | Buy IGV — 11.11% of freed cash (adds 2.50% to portfolio) |
| BUY | PAVE | Buy PAVE — 11.11% of freed cash (adds 2.50% to portfolio) |
| BUY | GDX | Buy GDX — 11.11% of freed cash (adds 2.50% to portfolio) |
| BUY | URA | Buy URA — 11.11% of freed cash (adds 2.50% to portfolio) |
| BUY | MOO | Buy MOO — 11.11% of freed cash (adds 2.50% to portfolio) |
Current Portfolio After Trade
Combined holdings across all 4 active tranches. Each tranche is 25% of the portfolio.
| Ticker | % of Portfolio | Weight Bar |
|---|---|---|
| XLE | 22.50% | |
| ITA | 11.25% | |
| WEAT | 10.00% | |
| CIBR | 6.25% | |
| COPX | 6.25% | |
| XLU | 5.00% | |
| AIQ | 5.00% | |
| IEMG | 5.00% | |
| GLD | 3.75% | |
| BOTZ | 2.50% | |
| URNM | 2.50% | |
| XOP | 2.50% | |
| VEGI | 2.50% | |
| IGV | 2.50% | |
| PAVE | 2.50% | |
| GDX | 2.50% | |
| URA | 2.50% | |
| MOO | 2.50% | |
| IGF | 1.25% | |
| NLR | 1.25% |
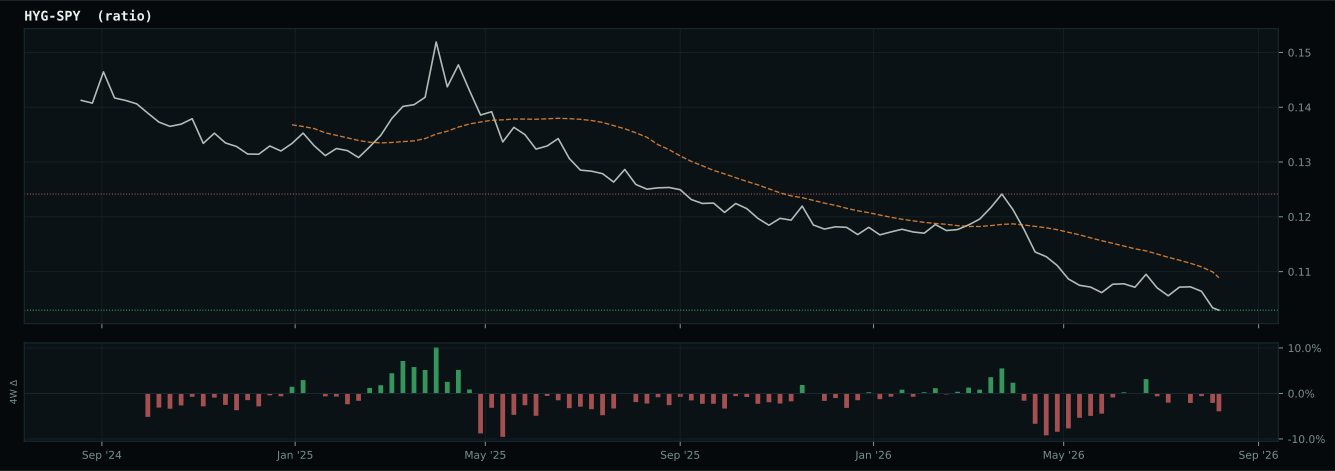
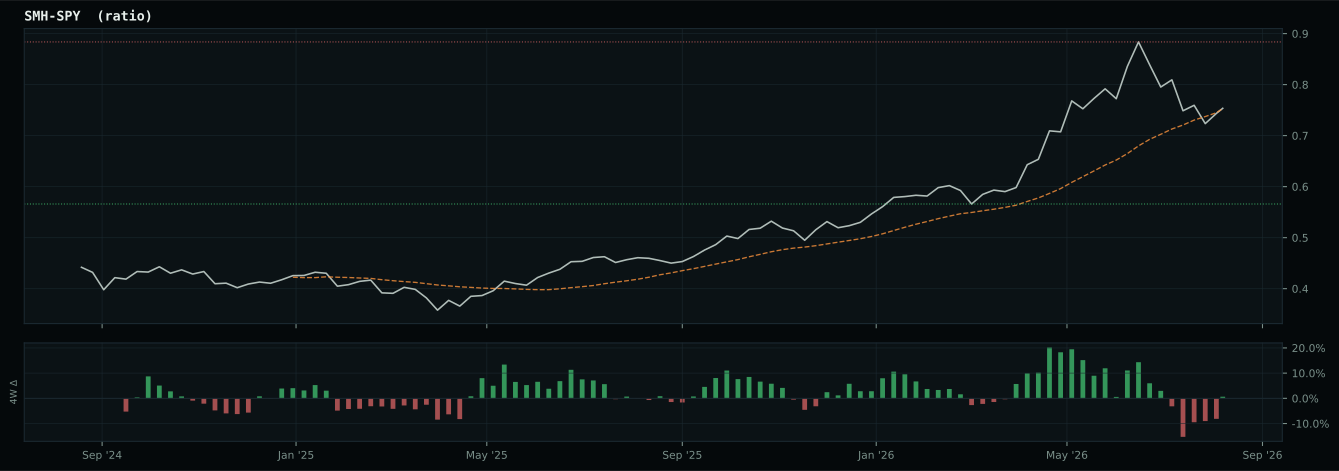
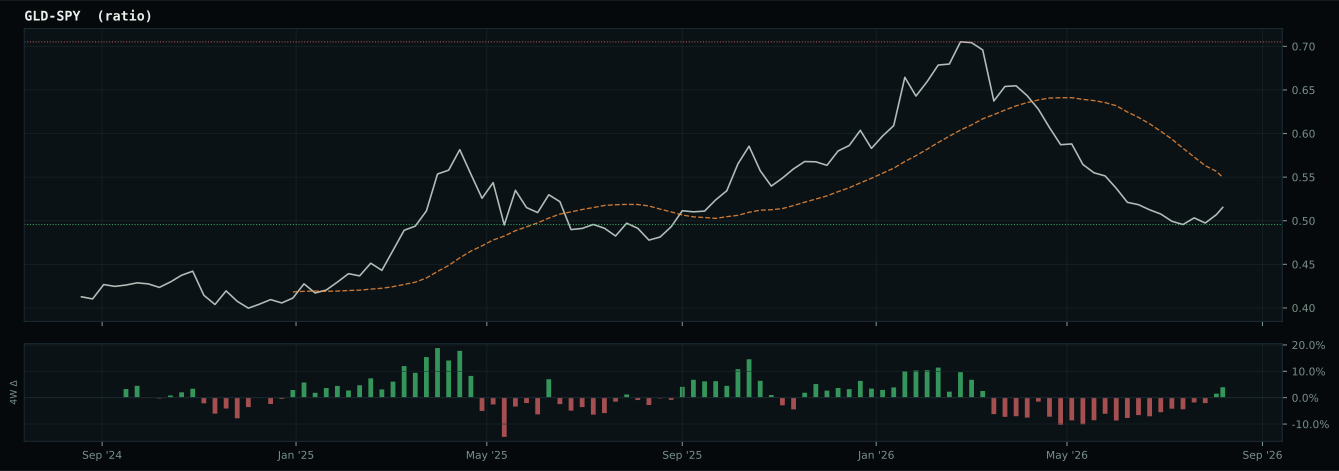
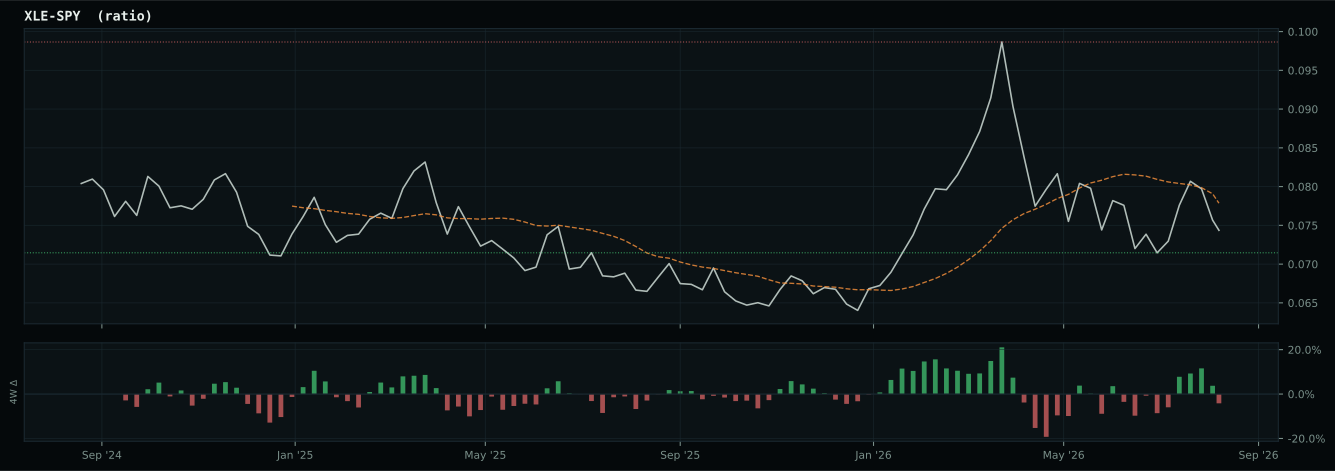
Macro Regime — Slowdown
Macro Evidence Charts
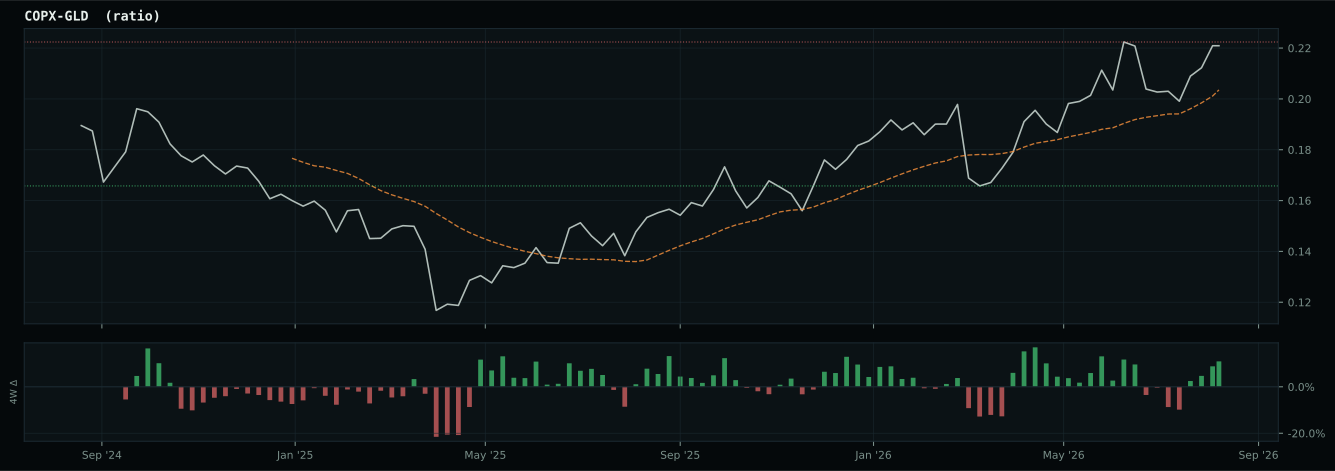
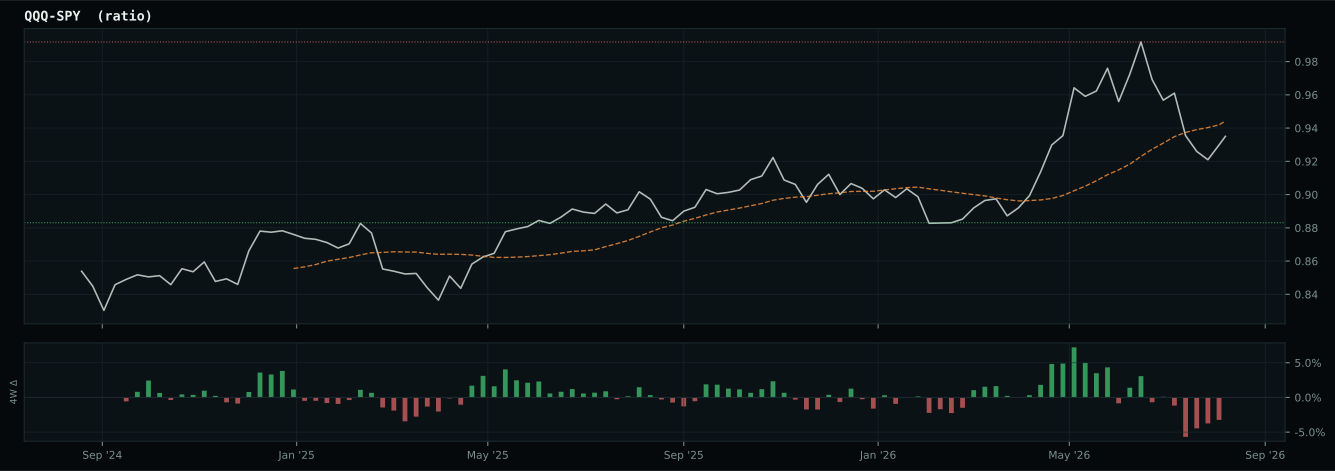
Market-implied signals behind the macro regime scores. Each ratio compares two assets; the direction and slope of the ratio is what the macro engine reads.
Crypto Regime — NoCrypto
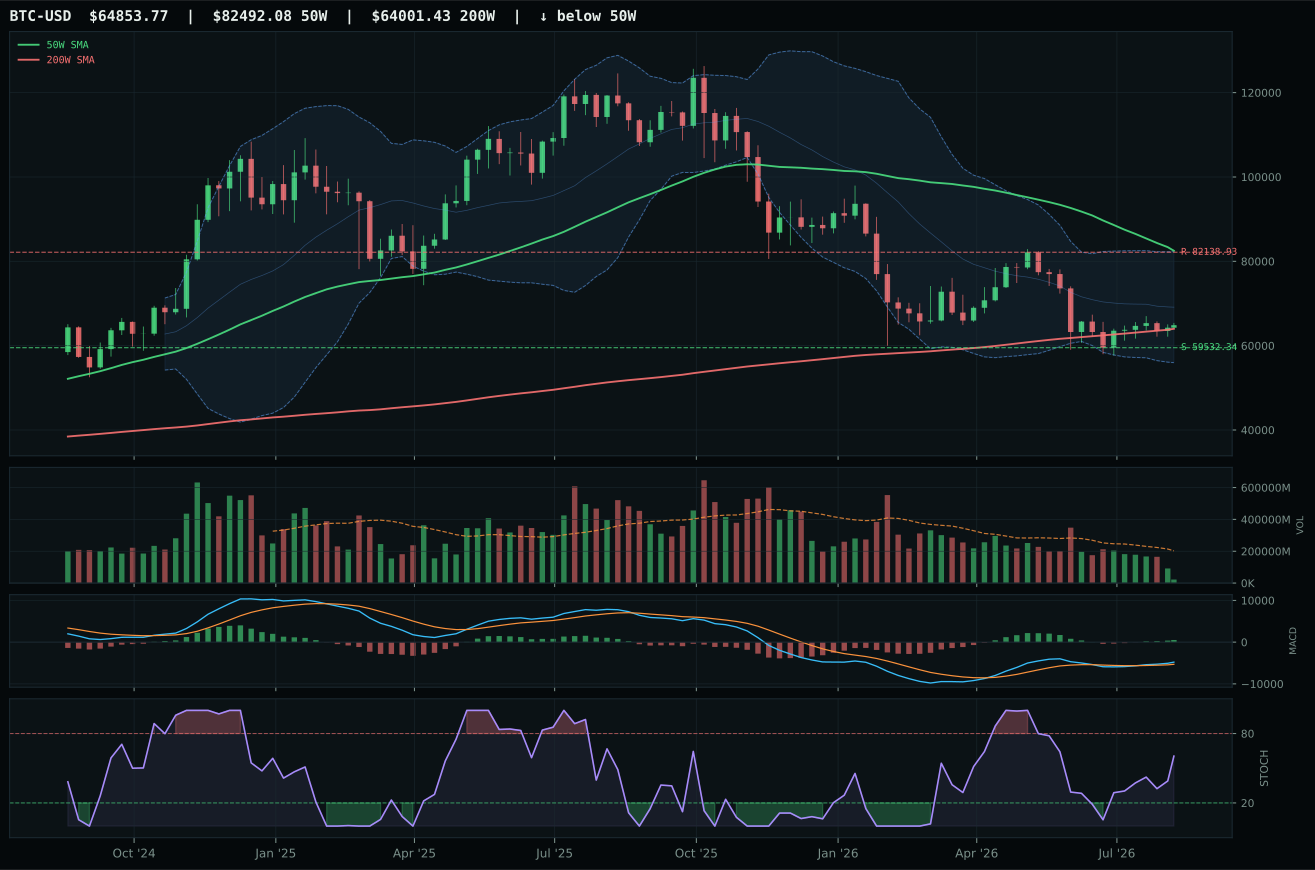
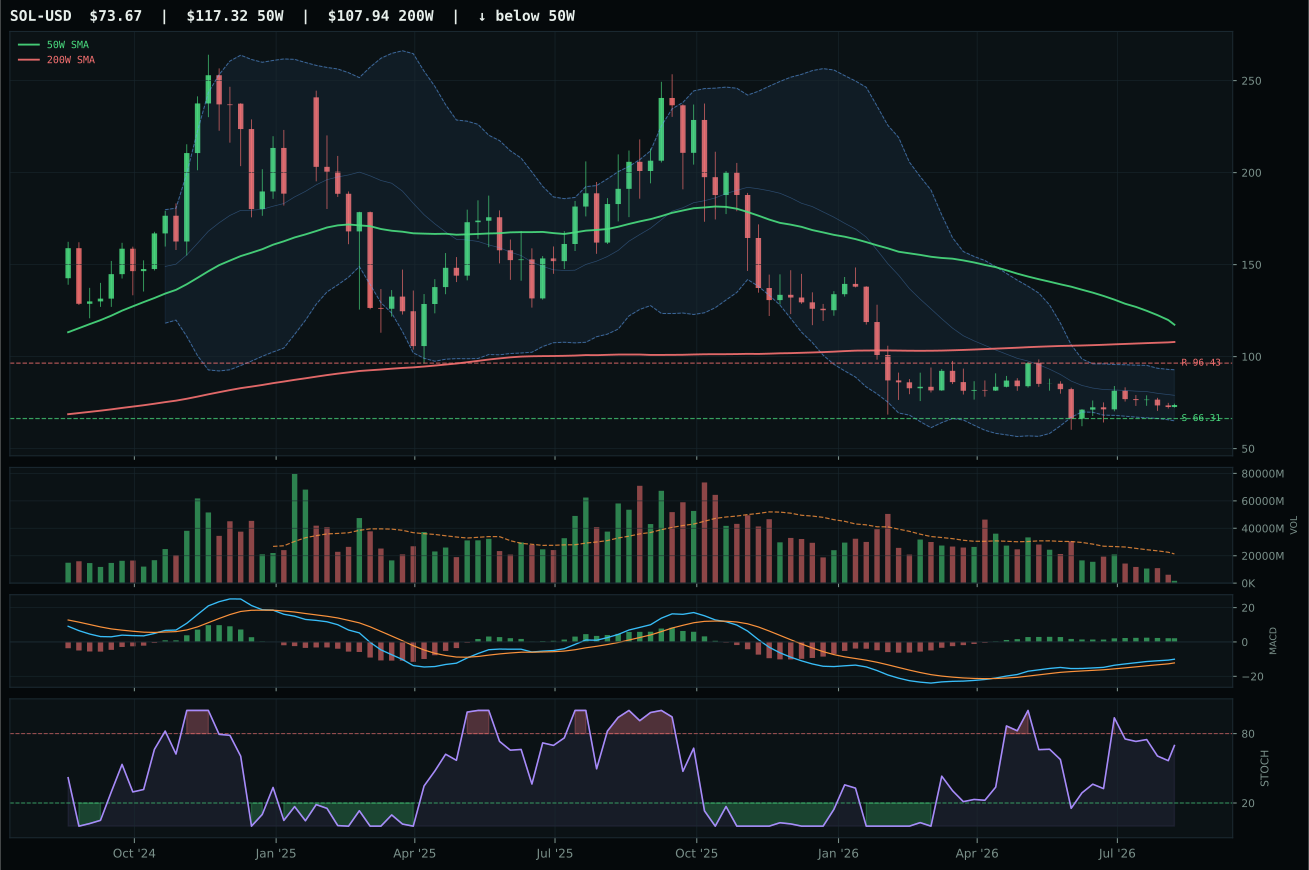
post-touch range has not been tested enough: support tests 1/2, resistance tests 3/2
TrendBTC not confirmed
one or more available conditions failed
Category Rankings
| Rank | Category | Winner | Score | Alloc | 4W Ret | Peers (4W) |
|---|---|---|---|---|---|---|
| 1 | Emerging Markets | IEMG | 60.0 | 20% | — | INDA — · ILF — |
| 2 | Defense & Aerospace | ITA | 58.7 | 20% | — | XAR — · ROKT — |
| 3 | Technology | IGV | 55.1 | 10% | — | CIBR — · XLK — |
| 4 | Utilities & Infrastructure | PAVE | 49.4 | 10% | — | IGF — · XLU — |
| 5 | Precious Metals | GDX | 47.8 | 10% | — | GLD — · SLV — |
| 6 | AI | AIQ | 43.7 | 10% | — | BOTZ — · SMH — |
| 7 | Nuclear Energy | URA | 43.0 | 10% | — | NLR — · URNM — |
| 8 | Agriculture & Livestock | MOO | 39.7 | 10% | — | PDBA — · VEGI — |
| 9 | Industrial Metals | COPX | 37.4 | 0% | — | PICK — · REMX — |
| 10 | Traditional Energy | XLE | 16.9 | 0% | — | XOP — · FCG — |
Emerging Markets — IEMG
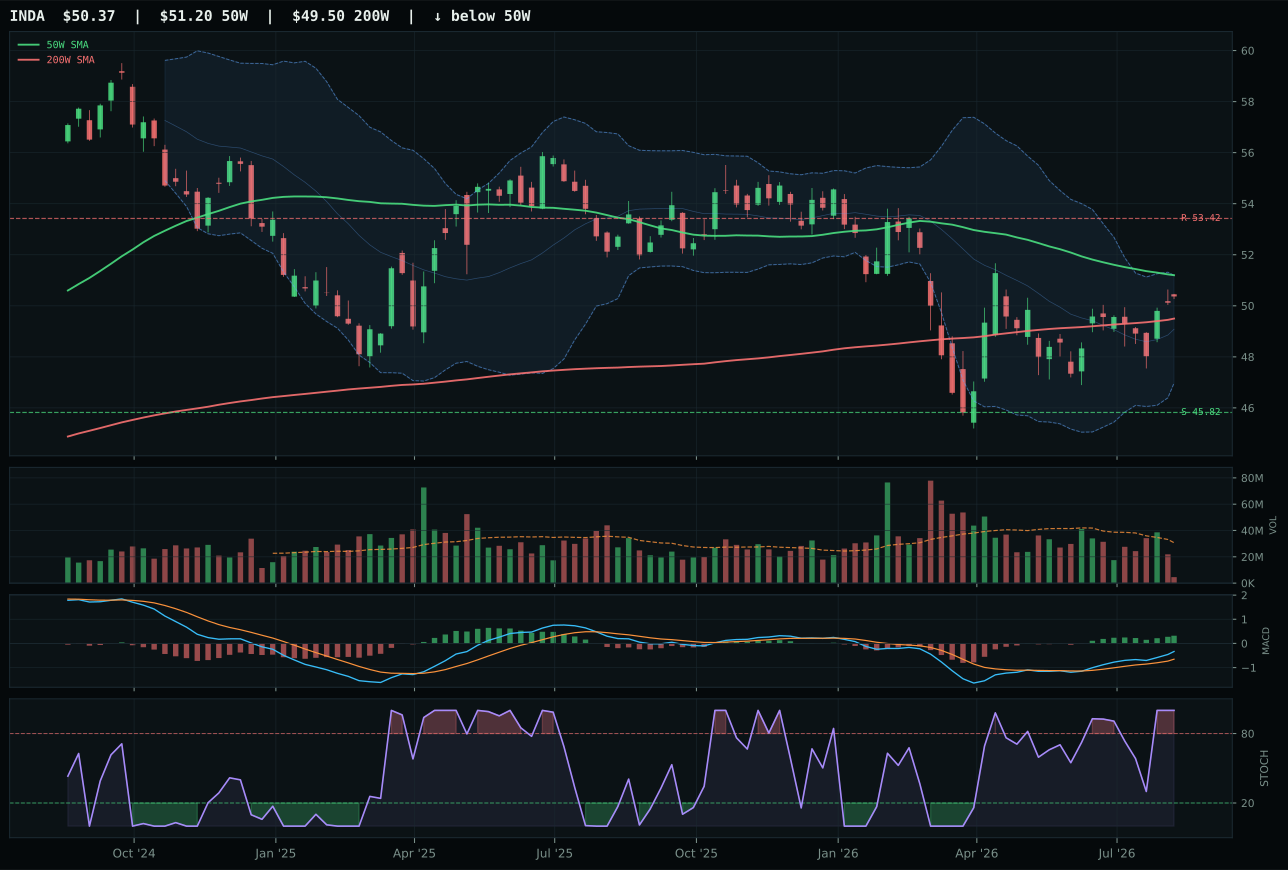
INDA has a compression near 50W profile with 0.3% 13-week relative strength versus SPY.
A failed hold above support would weaken the setup.
Actionable but governed by invalidation levels.
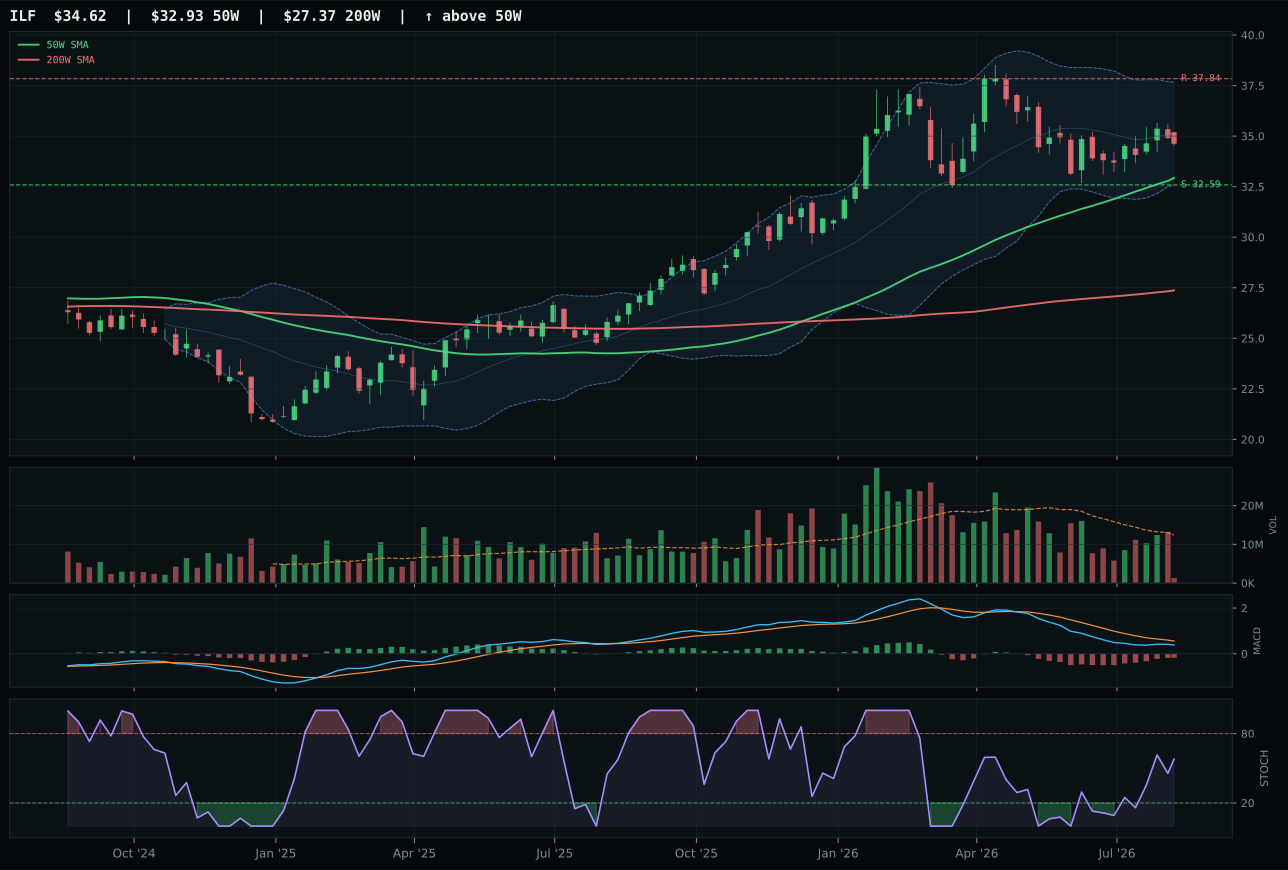
ILF has a neutral structure profile with -4.1% 13-week relative strength versus SPY.
A failed hold above support would weaken the setup.
Actionable but governed by invalidation levels.
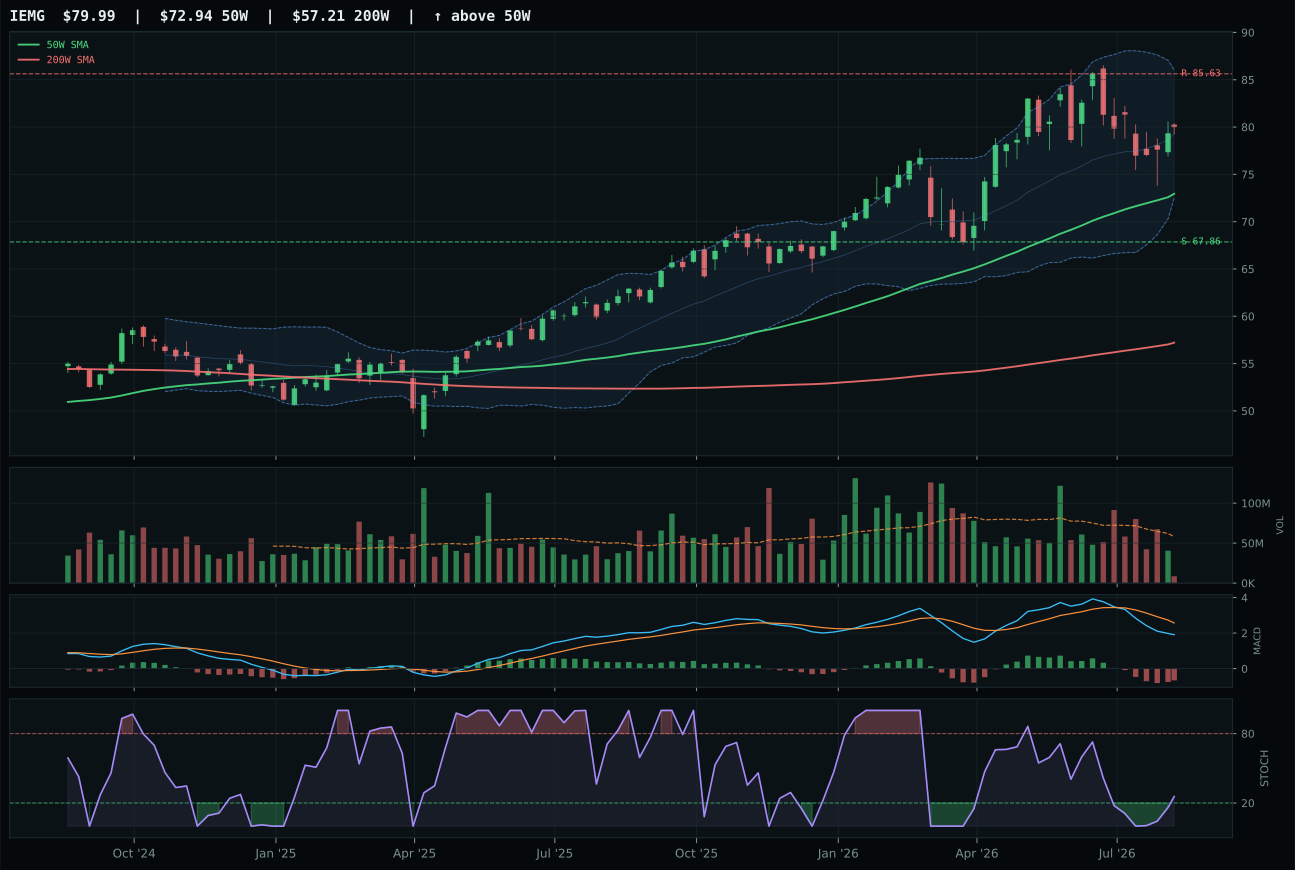
IEMG has a neutral structure profile with -4.0% 13-week relative strength versus SPY.
A failed hold above support would weaken the setup.
Actionable but governed by invalidation levels.
IEMG wins Emerging Markets despite INDA's superior technical composite (78 vs 65) and bullish-and-improving MACD. The decision rests on stochastic RSI timing: INDA sits at overbought momentum 0.88, a crowded entry, while IEMG's rising-mid-zone 0.26 reading offers fresher footing for accumulation. IEMG's neutral structure with clean 73.4 structure score versus INDA's compression-near-50W setup gives broad EM beta better room to run if macro conditions improve. Category-relative strength is flat (0.0%) for IEMG and strong (4.3%) for INDA, but INDA's 13W return of 4.9% is buoyed by India-specific outperformance that may mean-revert; IEMG's 0.6% 13W return reflects true broad-market stagnation that is already priced as reset-ready rather than extended.
Emerging Markets claims the second 20% top-2 overweight on a 60.0 category score and exceptional macro fit of 62.0/100. EM liquidity support (+14), liquidity expansion (+8), and the Slowdown descriptor itself favor EM reallocation when growth expectations weaken in developed markets. Credit stress (-10) remains the counterweight, but at -10 against a +14 EM liquidity tailwind, the net case is bullish. IEMG's 44.7 technical evidence is weak—momentum confirmation only 31.8, MACD bearish-weakening—yet macro strength more than compensates. In slowdown cycles, EM equities often outperform DM once the panic phase settles and investors reach for yield and emerging growth at depressed valuations. The portfolio's twin 20% slots (Defense & EM) create a tactical hedge: EM gains if slowdown proves temporary and EM growth reprices higher; Defense gains if slowdown persists and cyclical capex remains sticky.
Defense & Aerospace — ITA
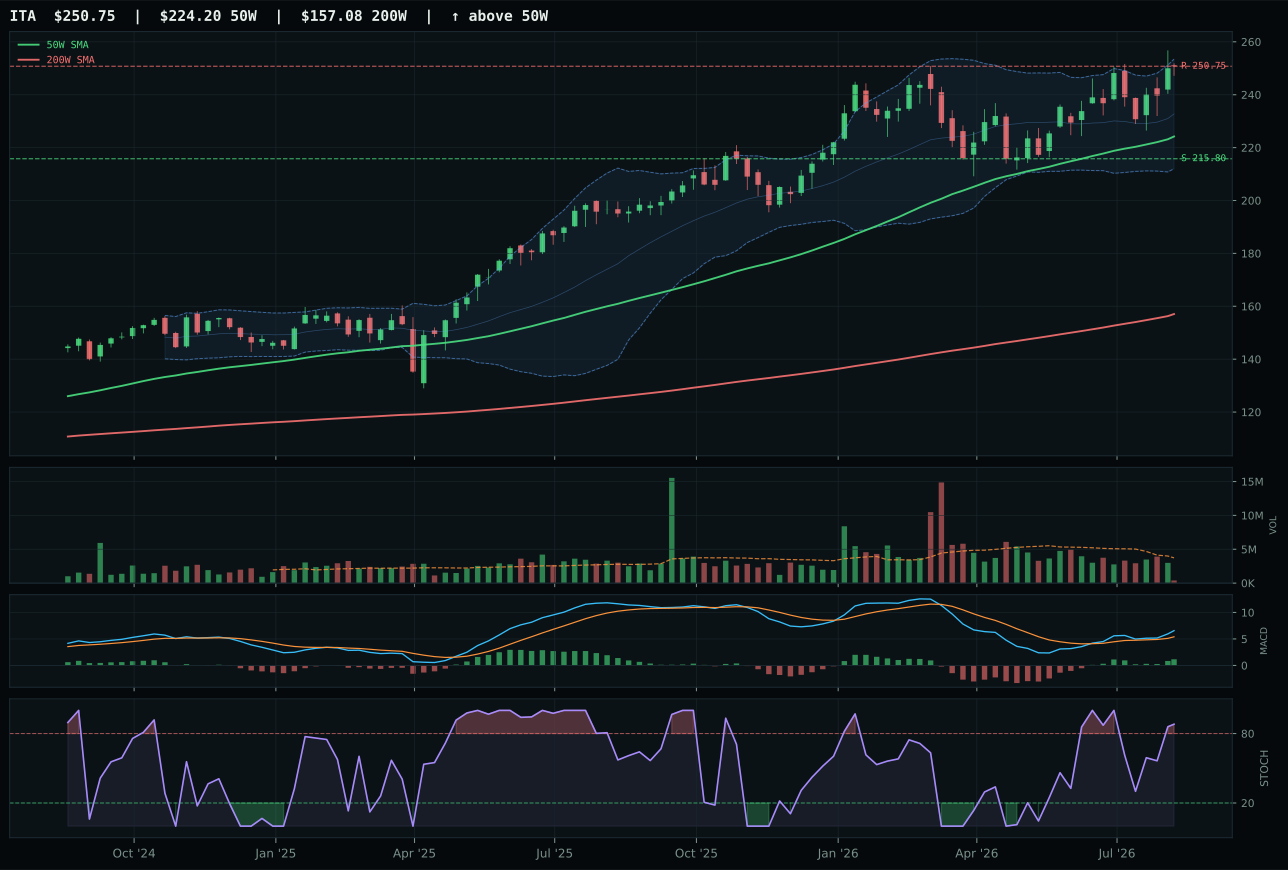
ITA has a neutral structure profile with 10.8% 13-week relative strength versus SPY.
A failed hold above support would weaken the setup.
Actionable but governed by invalidation levels.
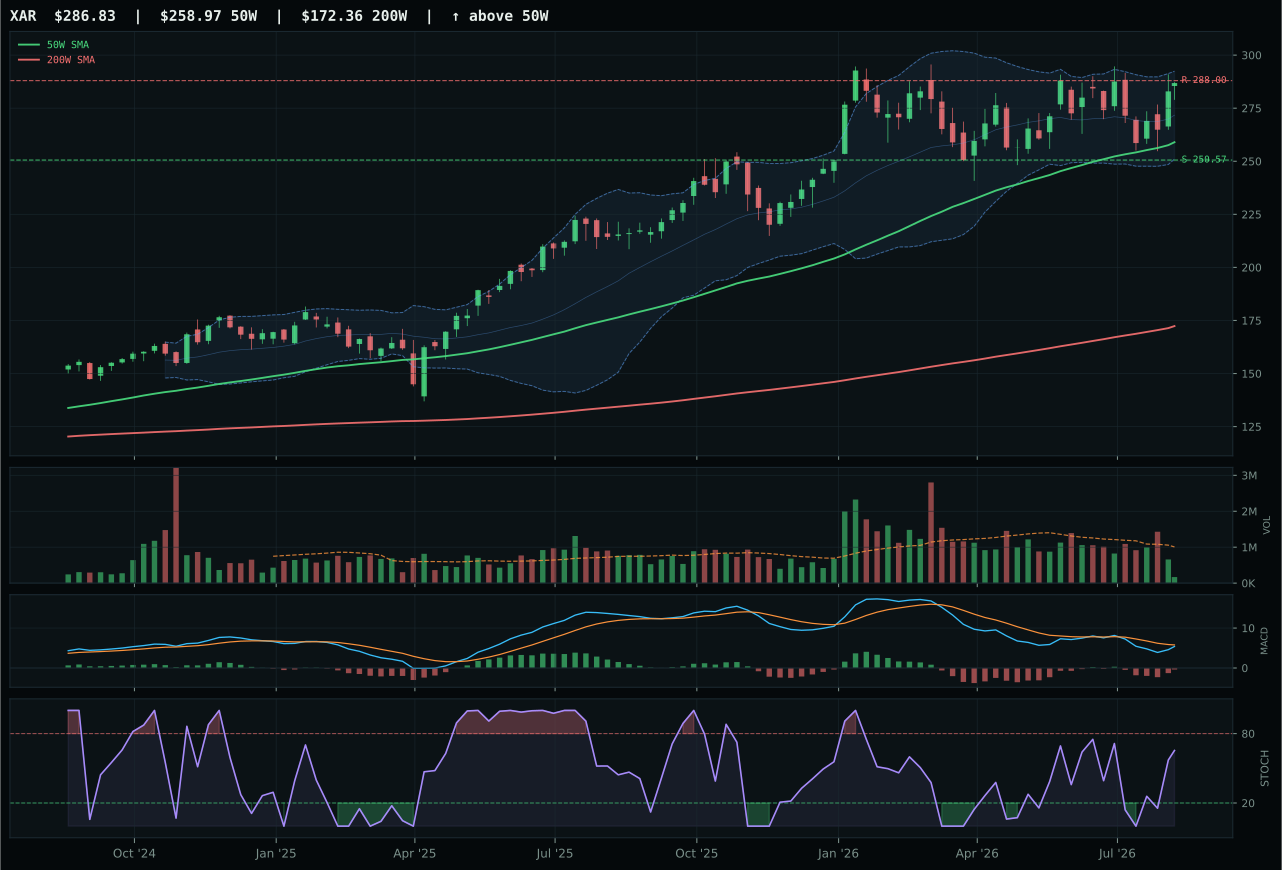
XAR has a neutral structure profile with 5.4% 13-week relative strength versus SPY.
A failed hold above support would weaken the setup.
Actionable but governed by invalidation levels.
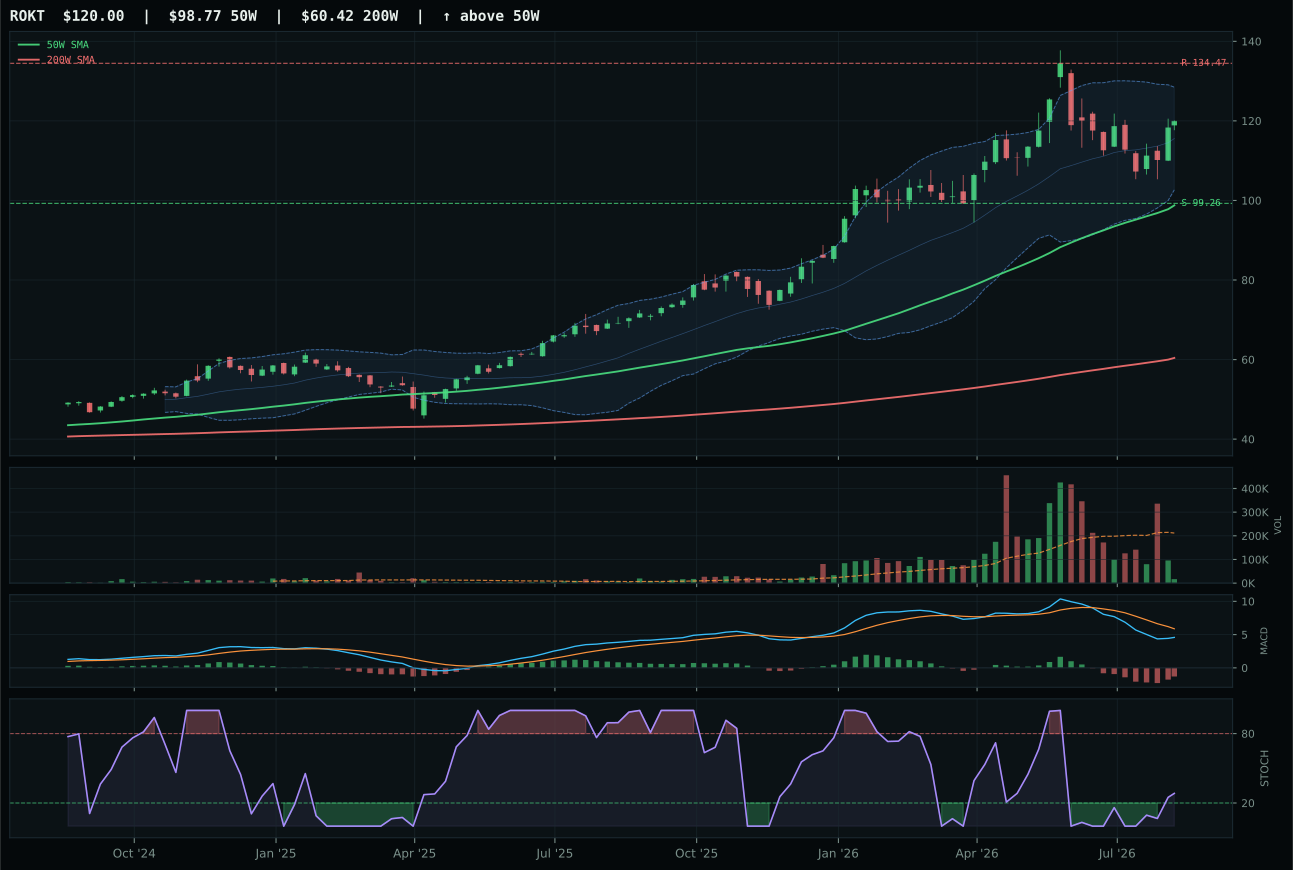
ROKT has a vertical extension profile with -2.5% 13-week relative strength versus SPY.
A failed hold above support would weaken the setup.
Actionable but governed by invalidation levels.
ITA wins Defense & Aerospace with perfect trend confirmation (100/100) backed by genuine relative strength: 10.8% RS versus SPY and 5.4% category-outperformance prove this is not a market-driven bounce. The 11.8% proximity to the 50W is tight, MACD is bullish-and-improving, and stochastic RSI sits at overbought 0.88—a crowded setup but one with multiple confirmation layers. XAR trails on all three counts: bearish-but-improving MACD signals weakening momentum, category-relative strength is flat at 0.0%, and risk/reward tilts far less favorably (37.5 vs 45.9). ITA's 5.4-point margin in the basket speaks to defense primes holding up better in slowdowns than diversified aerospace names, a distinction the market is actively pricing.
Defense & Aerospace earns its 20% top-2 overweight on a 58.7 category score that ranks second only to Emerging Markets. In a Slowdown regime, this category benefits from a unique macro profile: real asset sponsorship (+3) and credit stress (+2 relative to slowdown severity) actually work in its favor, not against it. Non-discretionary capex, government contracts, and geopolitical risk premiums remain sticky regardless of GDP growth, making this a natural Slowdown trade. Technical evidence scores 77.0/100, and the category's momentum confirmation remains at 100.0 on ITA's 15.4% 13W return and 5.4% category RS. The main risk is macro-driven mean reversion if credit stress reverses sharply or if slowdown fears ease; absent that, Defense anchors the portfolio's equity sleeve in a contraction.
Technology — IGV
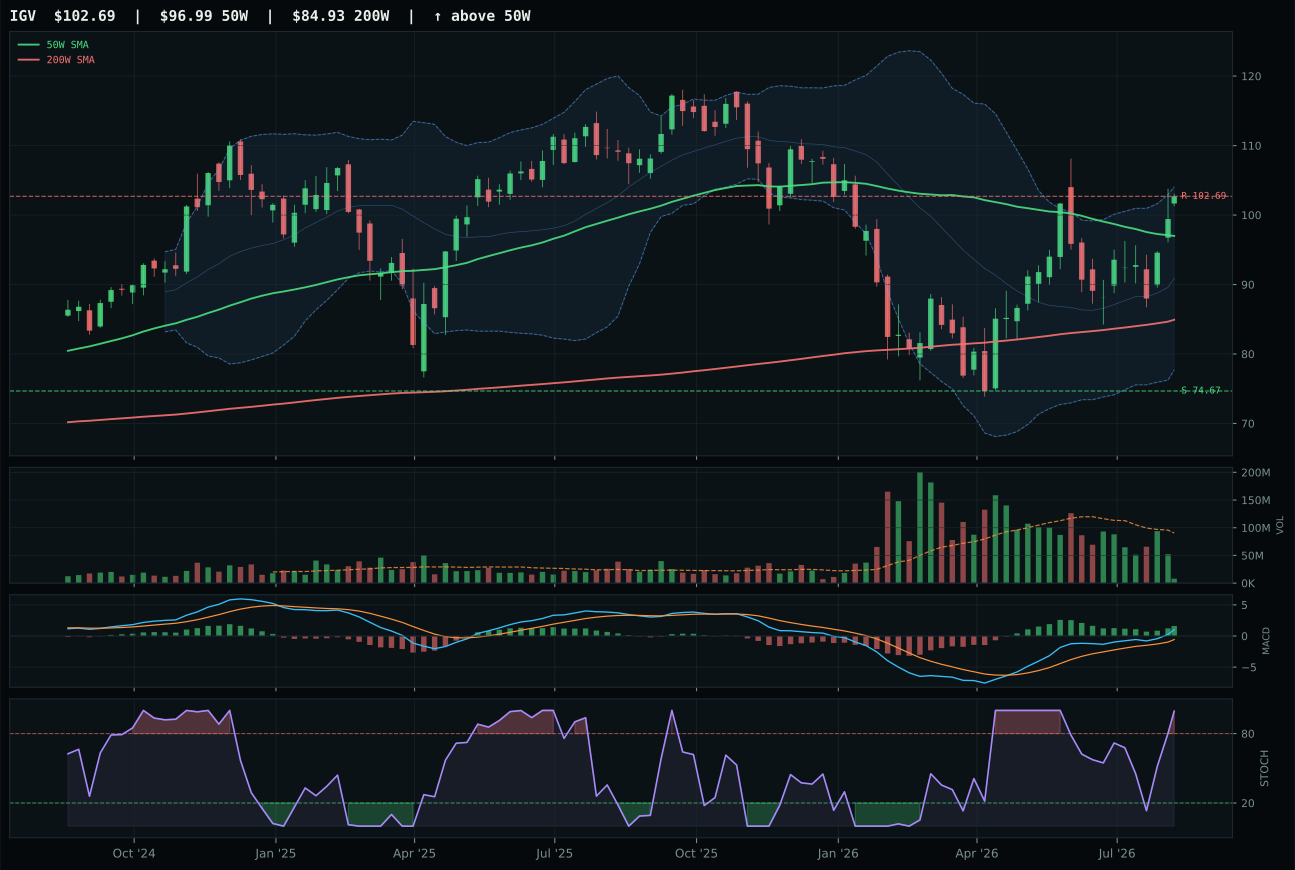
IGV has a neutral structure profile with 7.3% 13-week relative strength versus SPY.
A failed hold above support would weaken the setup.
Actionable but governed by invalidation levels.
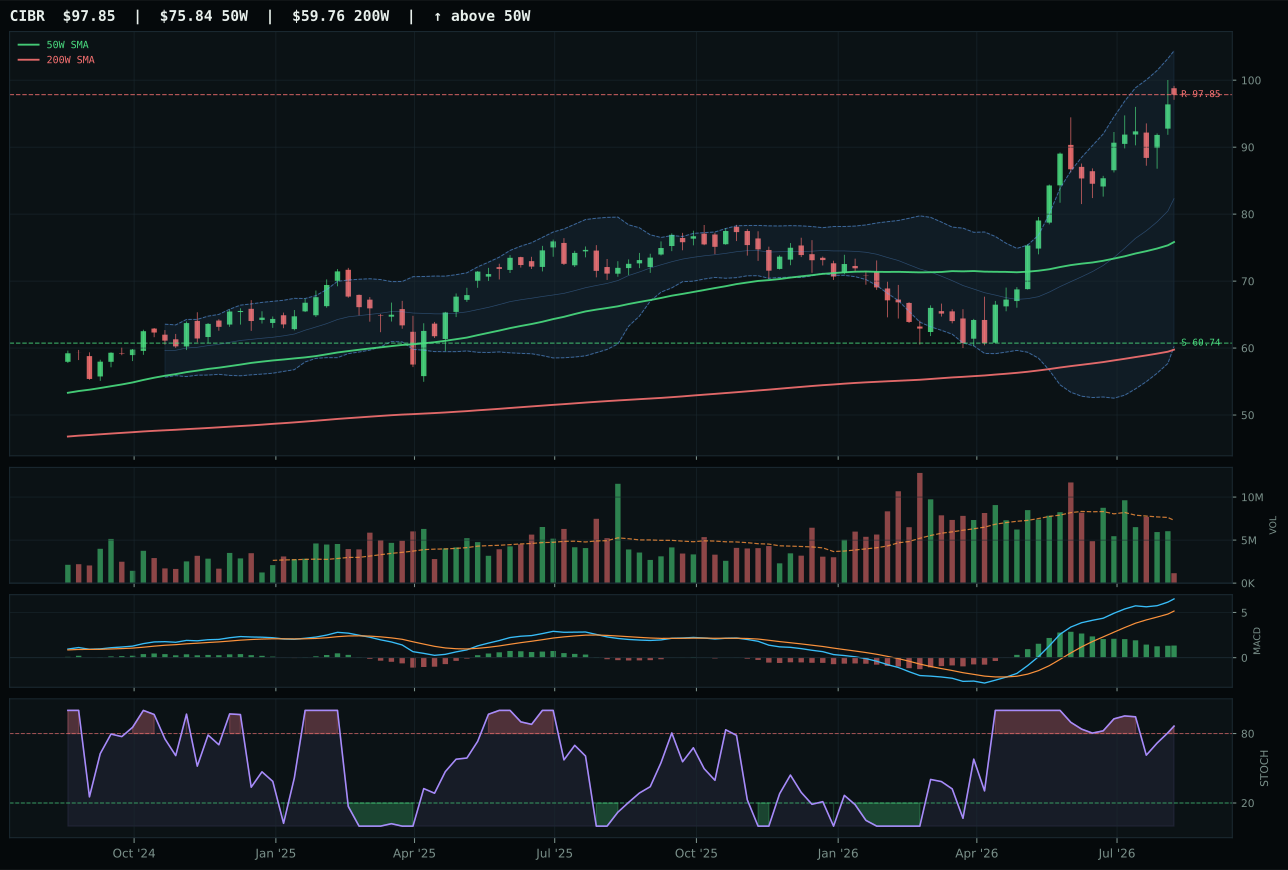
CIBR has a vertical extension profile with 19.2% 13-week relative strength versus SPY.
A failed hold above support would weaken the setup.
Actionable but governed by invalidation levels.
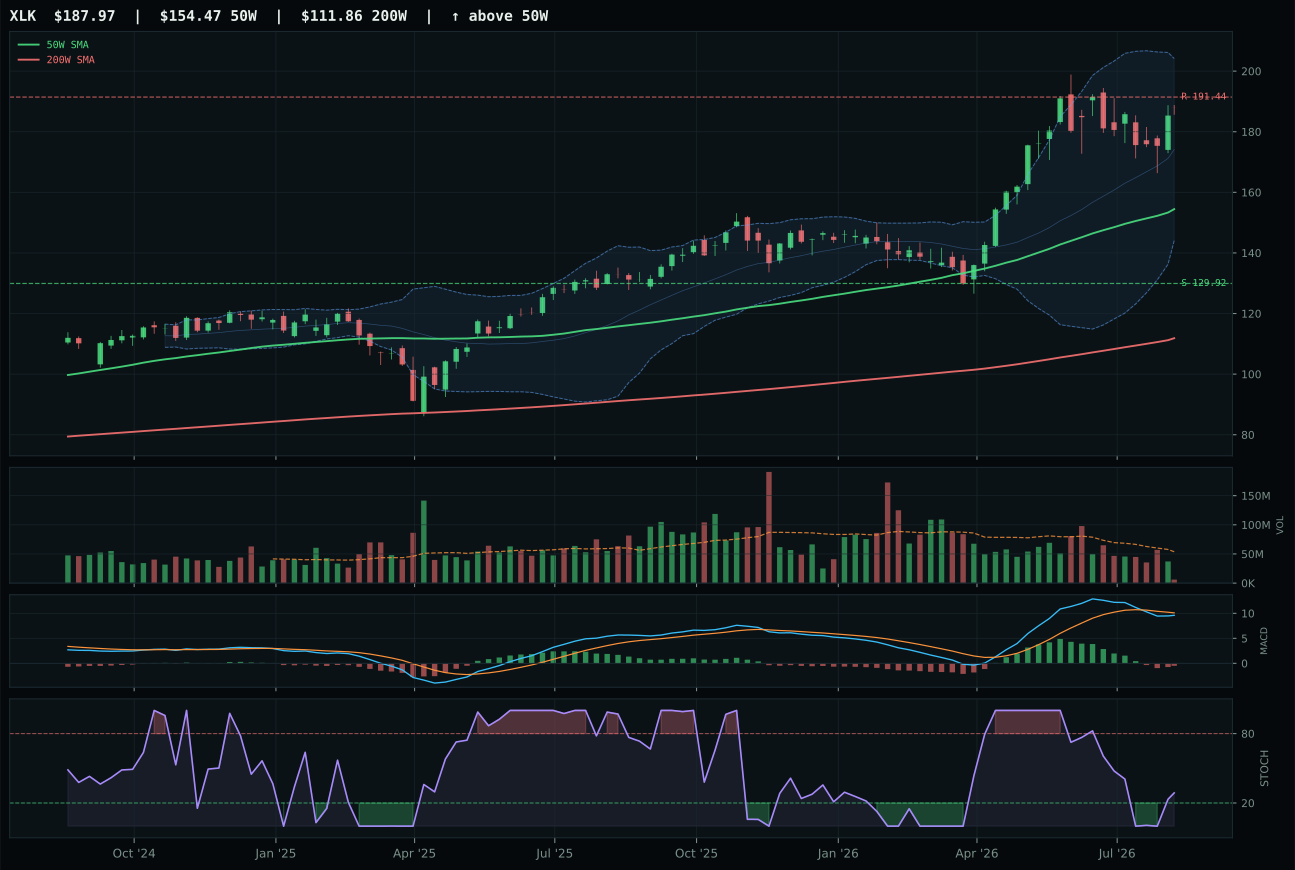
XLK has a vertical extension profile with 2.0% 13-week relative strength versus SPY.
A failed hold above support would weaken the setup.
Actionable but governed by invalidation levels.
IGV wins the category on cleaner timing and better momentum confirmation than CIBR, despite both sitting in overbought territory. The 5.9% proximity to the 50W versus CIBR's 29% extension reveals the asymmetry: IGV is barely stretched while CIBR is vertical and vulnerable to profit-taking. MACD bullish-and-improving versus bullish-but-flattening signals declining sponsorship on CIBR's move, and the stochastic RSI setup is identical in both (overbought), so the real differentiator is price distance and MACD trajectory. IGV's neutral structure with 7.3% RS versus SPY and a 75-point timing score edges CIBR's 32-point timing on pure technical merit, making this a decisive win despite thin participation across both.
Technology lands at 10% allocation as a tier-2 category in a Slowdown regime where growth faces headwinds but selective strength persists. This rank reflects a 55.1 final score that lost ground to Defense & Aerospace (58.7) and Emerging Markets (60.0), both of which offer more durable macro tailwinds. The category itself benefits from liquidity expansion (+9) but suffers from active credit stress (-7), creating a mixed technical backdrop that favors tactical pullbacks over new highs. To earn top-2 status, Technology would need either sharper SPY outperformance or a breakdown in credit spreads that reverses the stress descriptor; without that catalyst, it remains a holding position rather than a core overweight.
Utilities & Infrastructure — PAVE
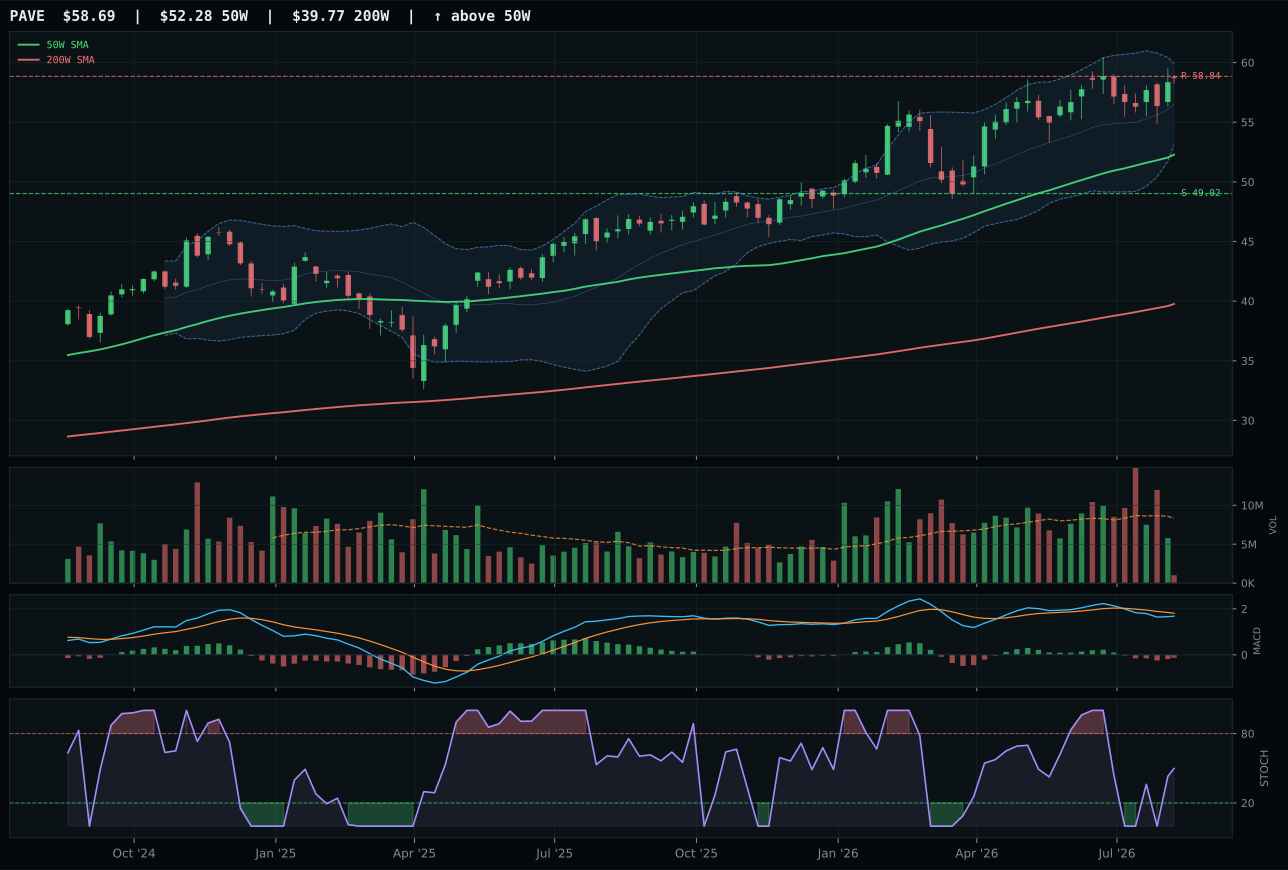
PAVE has a neutral structure profile with 1.3% 13-week relative strength versus SPY.
A failed hold above support would weaken the setup.
Actionable but governed by invalidation levels.
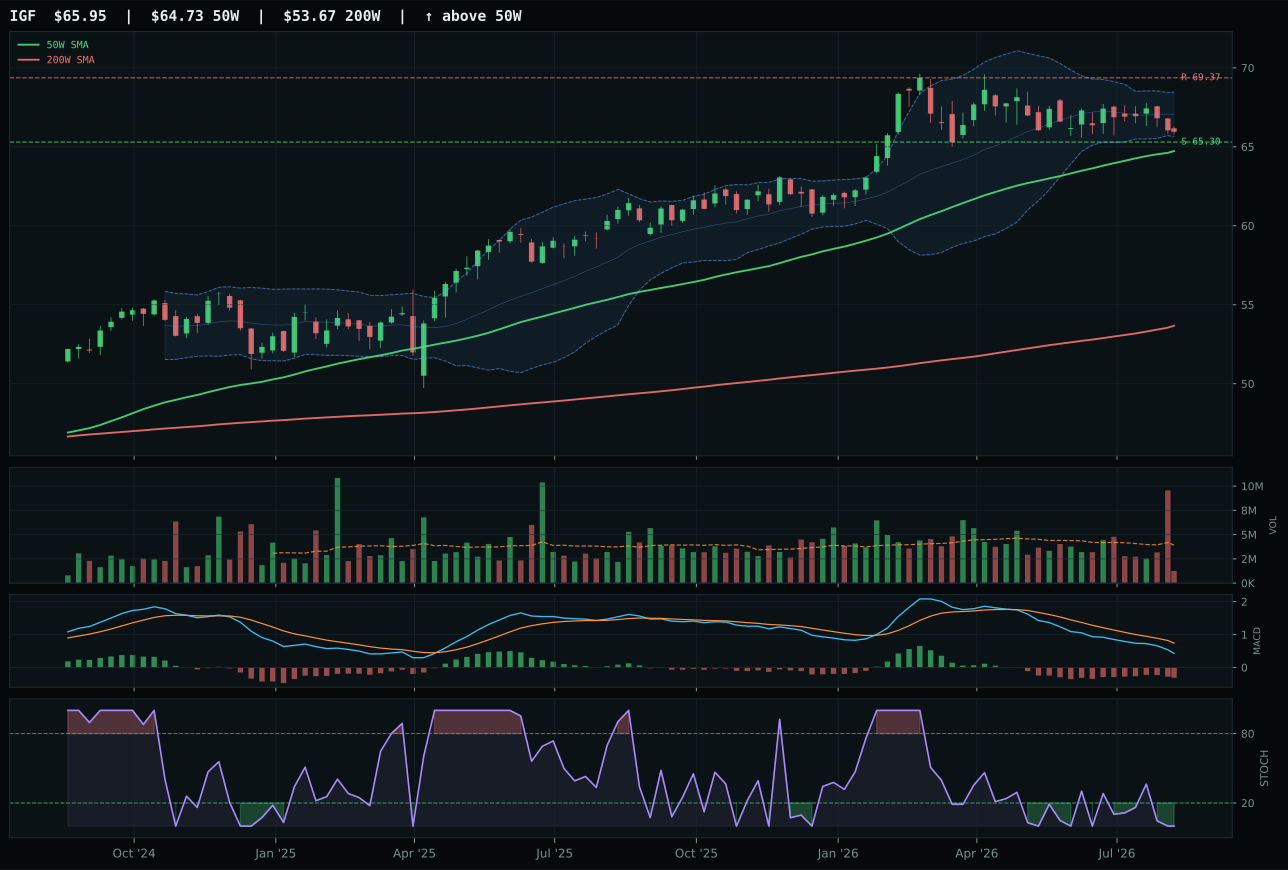
IGF has a pullback into support profile with -4.8% 13-week relative strength versus SPY.
A failed hold above support would weaken the setup.
Actionable but governed by invalidation levels.
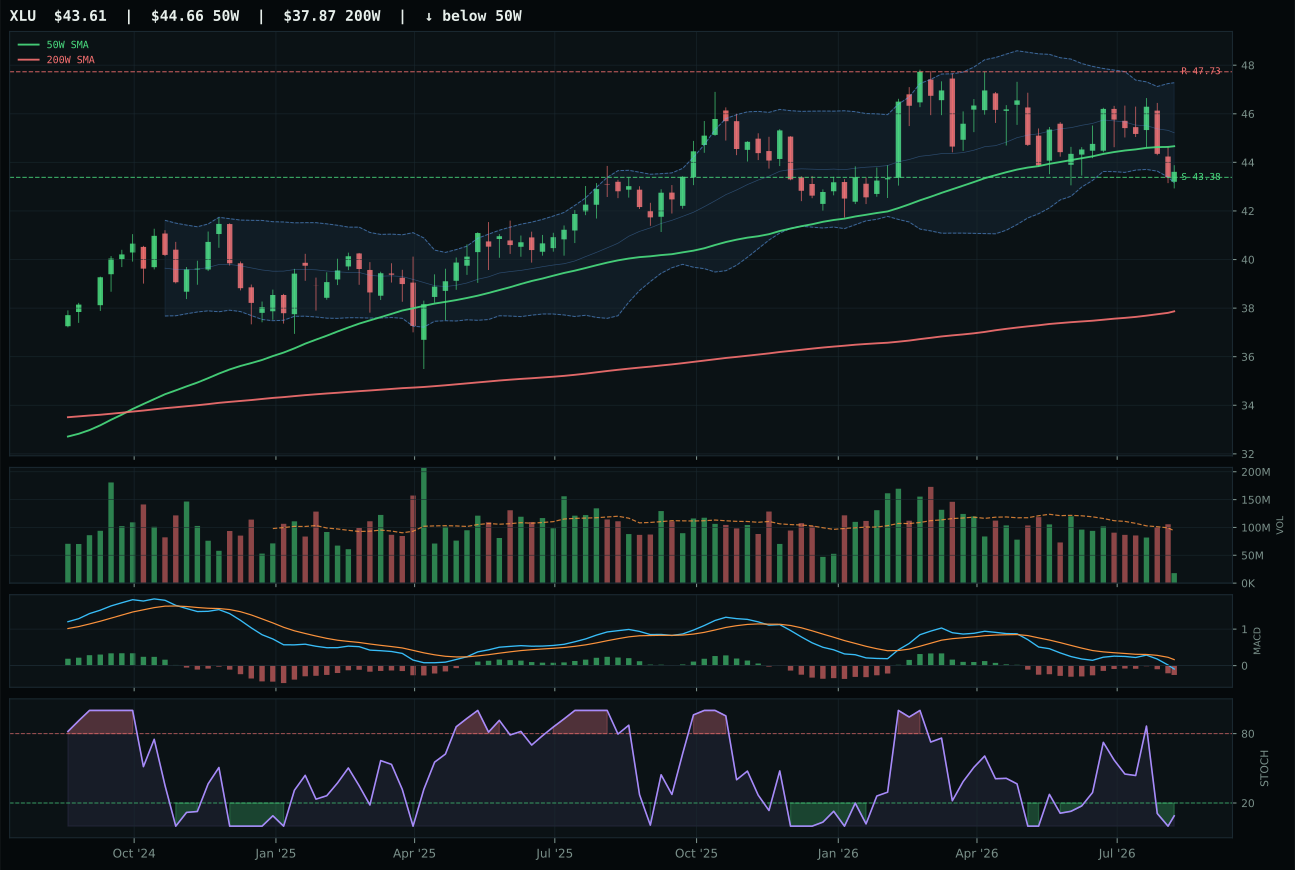
XLU has a pullback into support profile with -5.2% 13-week relative strength versus SPY.
A failed hold above support would weaken the setup.
Actionable but governed by invalidation levels.
PAVE wins Utilities & Infrastructure on cleaner structure (74.9 vs IGF's 69.5), superior stochastic RSI timing (rising-mid-zone 0.50 vs IGF's oversold), and strong category-relative strength (6.1% vs 0.0%), offsetting IGF's bearish-weakening MACD versus PAVE's bearish-but-improving. PAVE's 95.0 trend score and 12.3% proximity to 50W create a setup where infrastructure beta is being accumulated into a mild pullback, not sold into exhaustion like IGF. The 71.3 momentum confirmation on PAVE's 5.9% 13W return and 6.1% category outperformance marks this as the flow-positive expression of the category. IGF offers superior risk/reward (90 vs 45) for purely defensive repositioning, but PAVE captures both tactical entry timing and trend preservation.
Utilities & Infrastructure earns 10% tier-2 allocation in a category where macro support is unusually strong for a Slowdown regime. The Slowdown descriptor itself helps this category (+8), alongside Transition/Mixed (+4) and growth slowdown (+6), creating a unique 68.0/100 macro fit where recession-defensive characteristics outweigh cyclical headwinds. Technical evidence of 67.0/100 on PAVE indicates real accumulation, not just macro refuge-buying. Credit stress (-5) and growth slowdown (-4) represent near-term drags, but government infrastructure spending mandates and utility dividend safety provide structural support independent of economic growth. To earn tier-1 status, Utilities would need either sharper execution in infrastructure bills or visible deterioration in corporate credit that forces retail into the safety of utilities; currently it anchors the portfolio's defensive tilt without commanding top-2 capital allocation.
Precious Metals — GDX
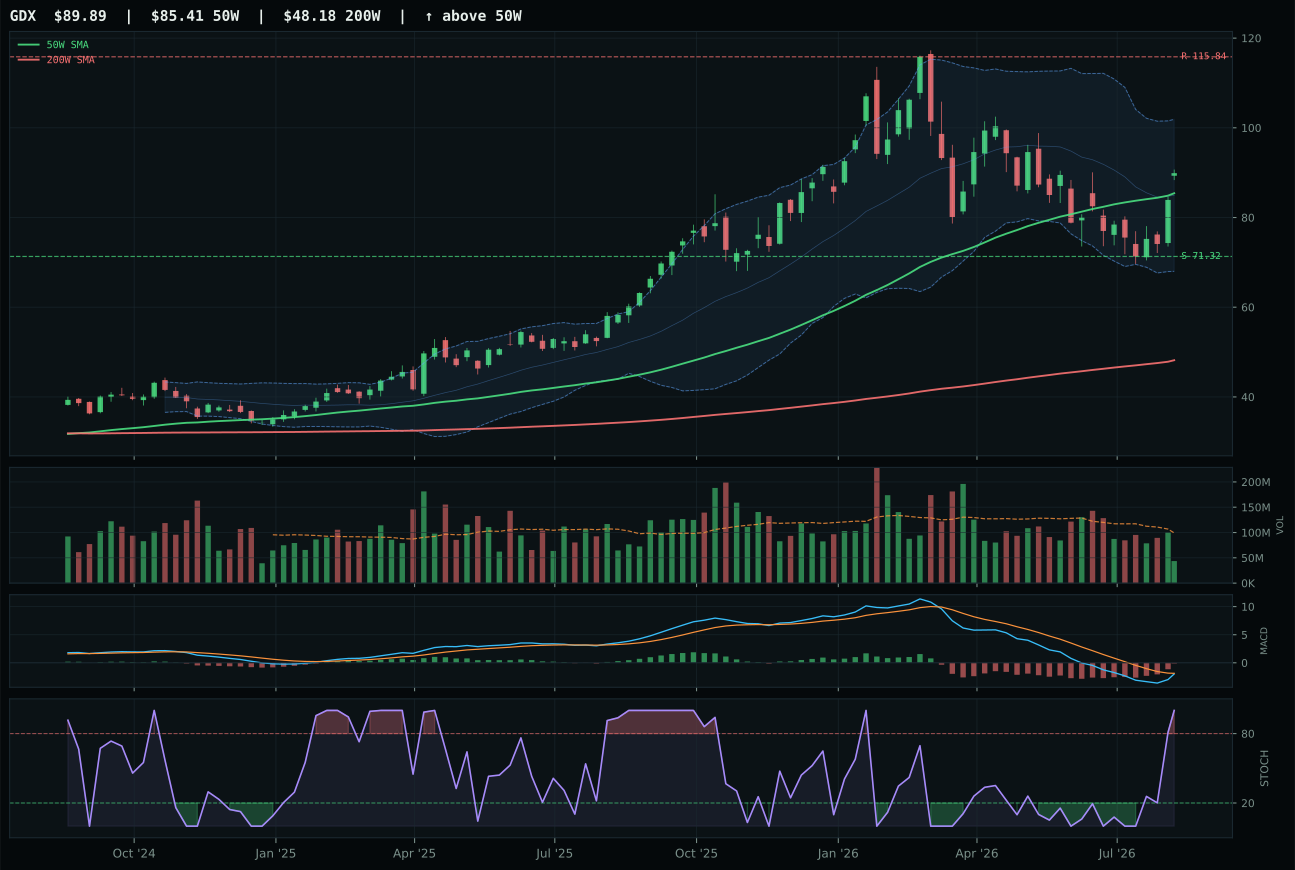
GDX has a neutral structure profile with -1.7% 13-week relative strength versus SPY.
A failed hold above support would weaken the setup.
Actionable but governed by invalidation levels.
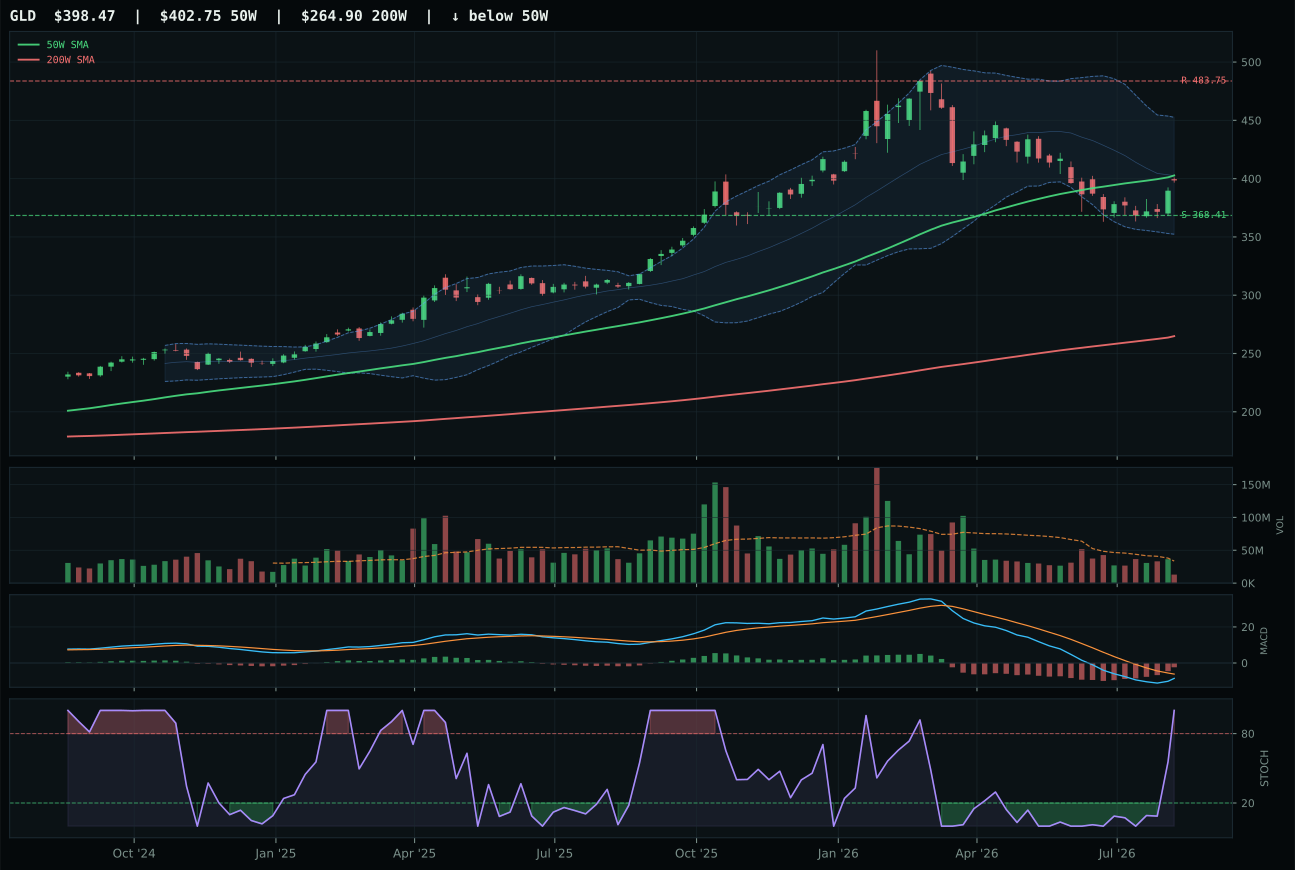
GLD has a compression near 50W profile with -9.1% 13-week relative strength versus SPY.
A failed hold above support would weaken the setup.
Actionable but governed by invalidation levels.
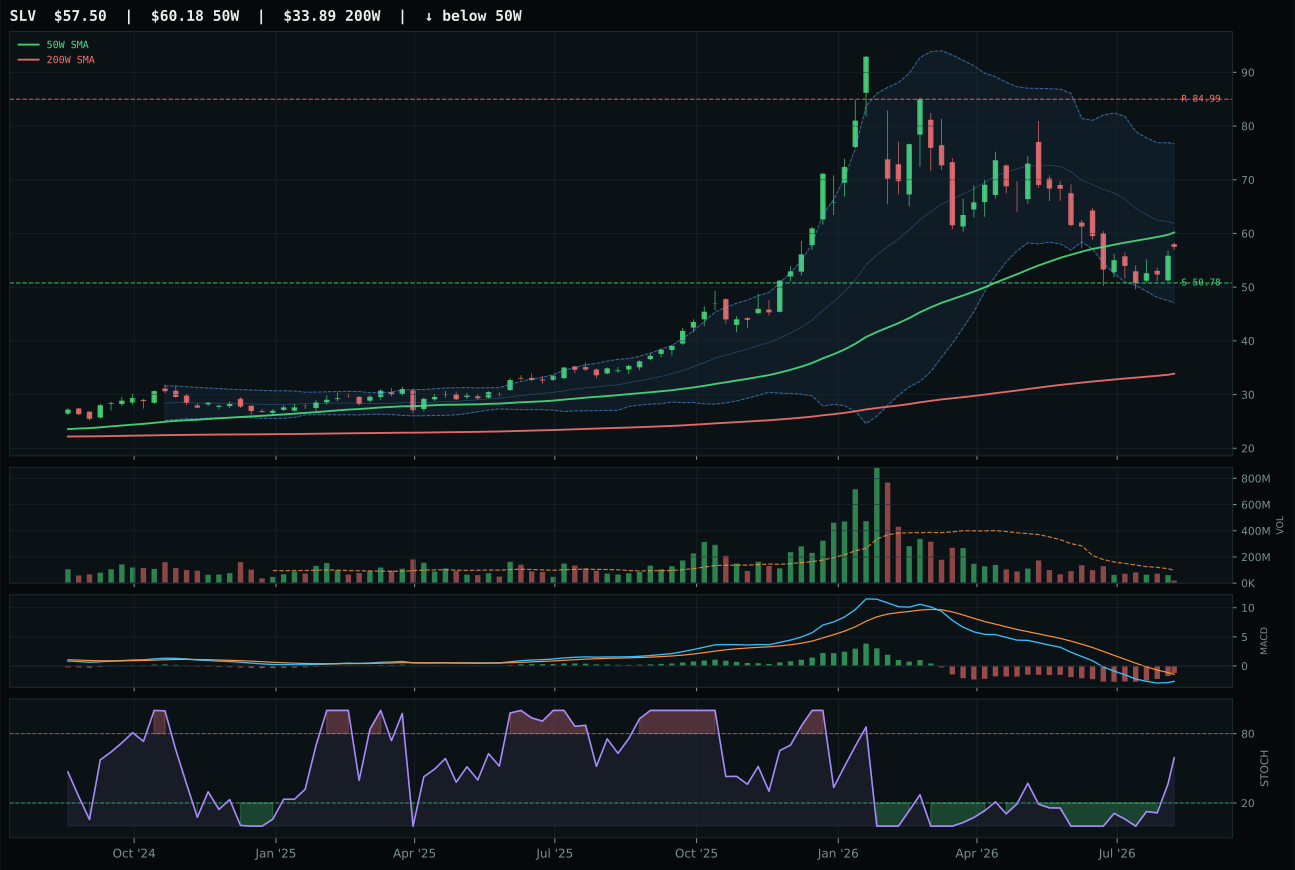
SLV has a neutral structure profile with -21.3% 13-week relative strength versus SPY.
A failed hold above support would weaken the setup.
Actionable but governed by invalidation levels.
GDX wins on category-relative strength (7.4% vs GLD's 0.0%) combined with superior 4W momentum (26.0% vs gold's negative 13W return), despite GLD's slightly cleaner compression setup near the 50W. Both face the same macro backdrop—MACD bearish-but-improving, stochastic RSI overbought—but GDX's miners capture leverage to gold's move while GLD acts as the hedge itself. GDX's neutral structure with 5.2% distance to 50W versus GLD's compression near 50W gives miners a timing edge; the market is rotating into the more volatile expression. Gold's -9.1% SPY RS and -4.5% 13W return represent a broken downtrend within a slowdown refuge, while GDX's positive category spread shows selective institutional rotation into mining equity leverage.
Precious Metals receives 10% tier-2 allocation in a category where macro tailwinds outweigh technical weakness. The Slowdown descriptor actively helps this exposure (+6), and liquidity expansion (-2 penalty vs the +5 GDX-specific tailwind) means central bank accommodation flows offset credit stress concerns. Category score of 47.8 reflects 64.4 technical evidence combined with 48.0 macro fit—the macro side of this trade is the real story, not the setups. Neither GLD nor GDX shows strong accumulation (thin participation at 0.44x for GDX), yet both serve the portfolio's Slowdown hedge function where nominal uncertainty and real-asset demand provide tail-risk insurance. To earn tier-1, Precious Metals would need either visible inflation re-acceleration or a breakdown in real rates that triggers fresh institutional buying; the current role is defensive rotation, not opportunistic accumulation.
AI — AIQ
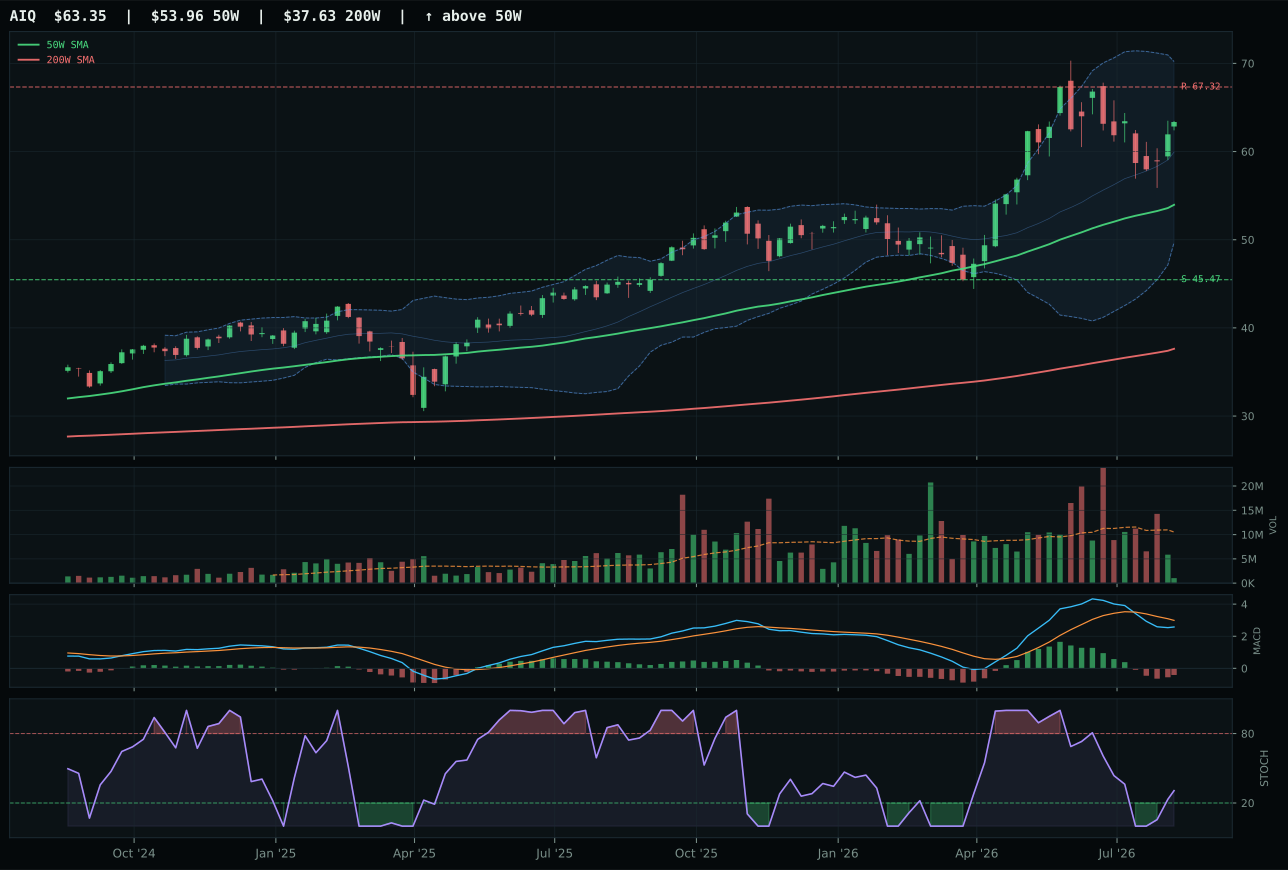
AIQ has a vertical extension profile with -0.8% 13-week relative strength versus SPY.
A failed hold above support would weaken the setup.
Actionable but governed by invalidation levels.
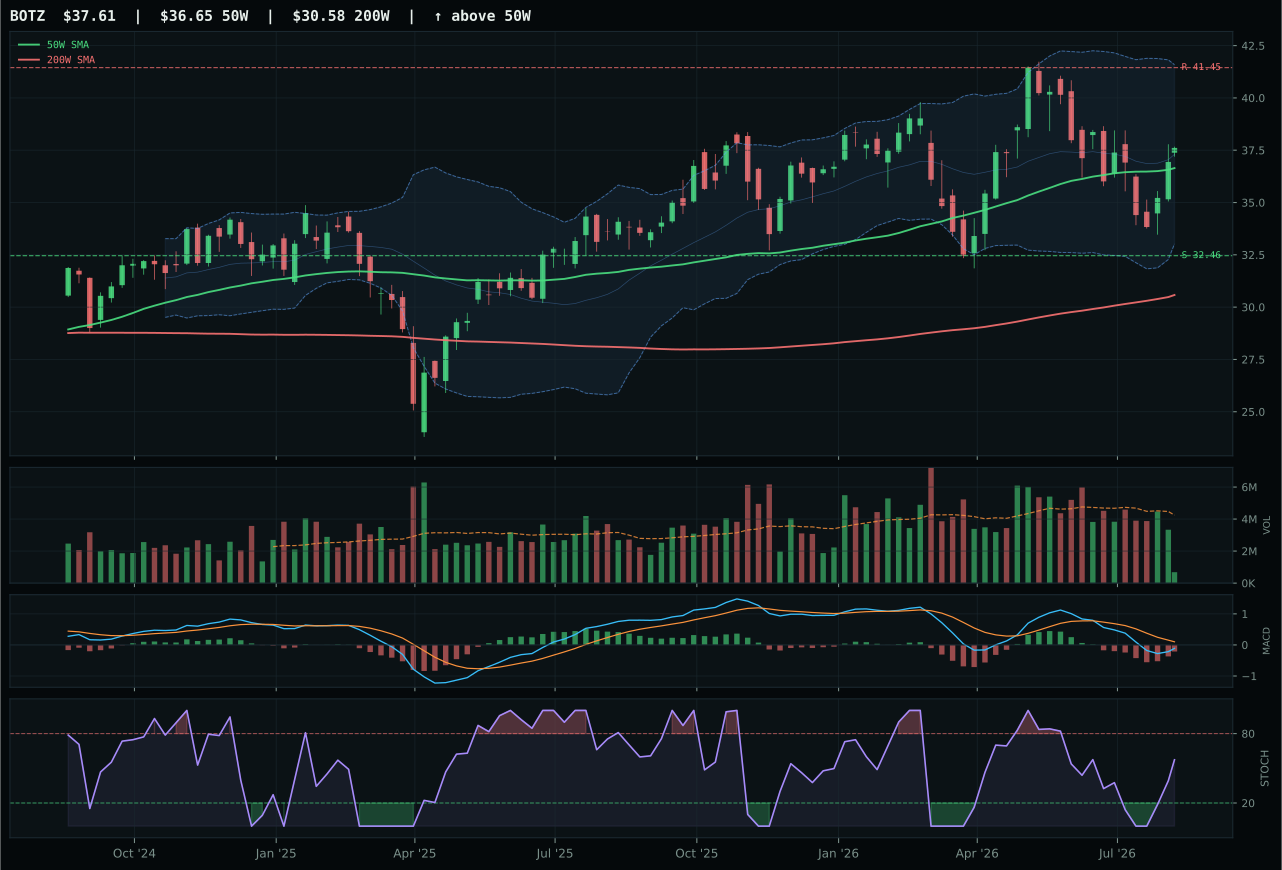
BOTZ has a compression near 50W profile with -11.1% 13-week relative strength versus SPY.
A failed hold above support would weaken the setup.
Actionable but governed by invalidation levels.
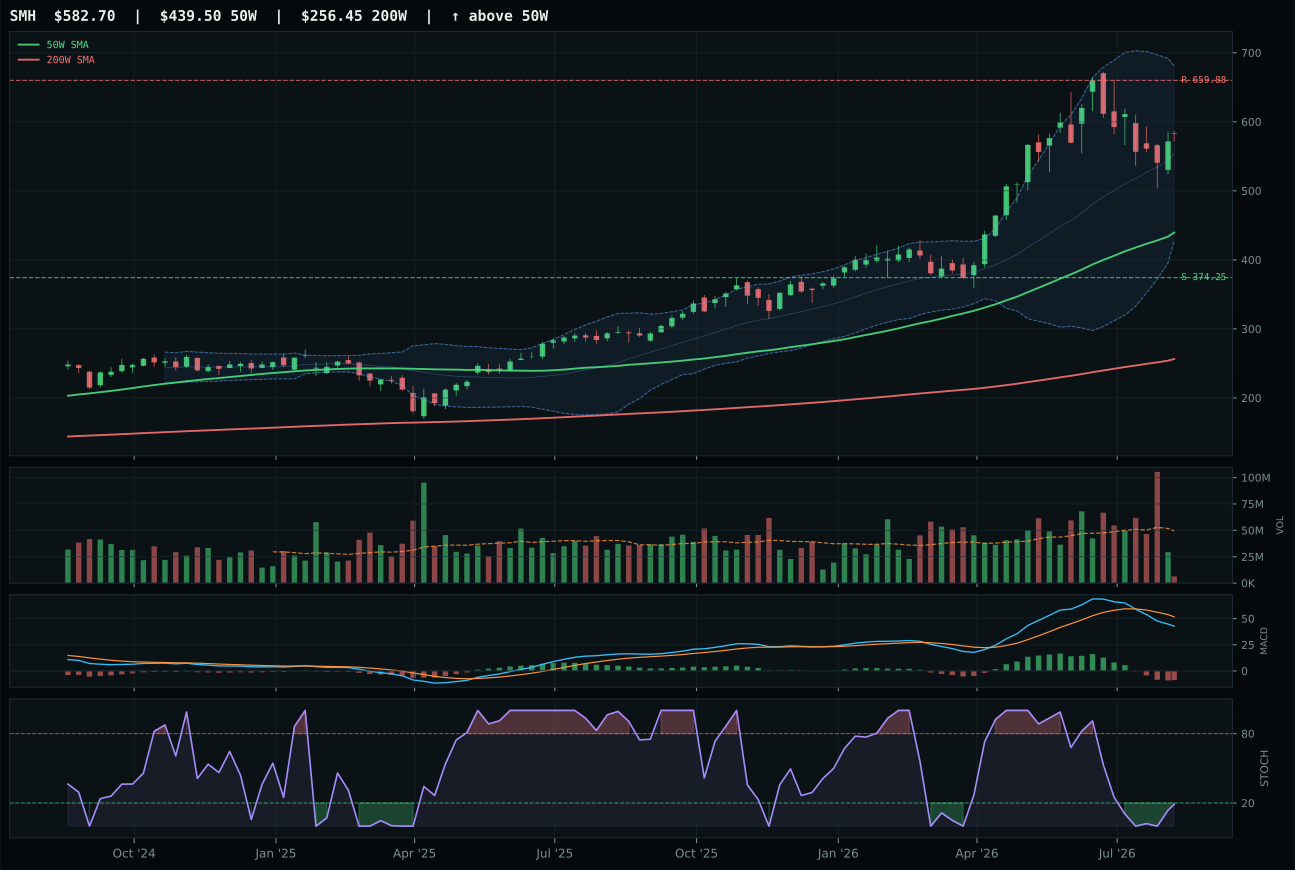
SMH has a vertical extension profile with 0.1% 13-week relative strength versus SPY.
A failed hold above support would weaken the setup.
Actionable but governed by invalidation levels.
AIQ wins a weak category on structure cleanliness and category-relative strength, though calling this a "win" requires context: the entire AI field is extended and losing momentum. AIQ sits 17.4% above the 50W with bearish-weakening MACD, a setup that signals exhaustion rather than accumulation. BOTZ actually scores higher on composite technicals (74 vs 57) and timing (100 vs 56), but carries -10.3% category-relative RS that proves fatal; it is being left behind inside its own basket. SMH rounds out the trio as the momentum-broken third. This is a category where the winner avoided being the worst, not a signal of strength—thin participation across all three, falling 13W returns, and widespread MACD deterioration make AI the tier-2 slot despite its 10% allocation.
AI receives 10% as a tier-2 position in a macro regime actively hostile to high-valuation cyclical growth. The 43.7 category score trails both top-2 overweights and reflects a technical evidence score of only 29.3/100—nearly half the weight of Defense & Aerospace. Liquidity expansion (+10) provides a thin cushion against credit stress (-8) and growth slowdown penalties. The category's macro fit sits at 52.0/100, barely neutral, while every representative ETF sits either below the 50W or deeply extended above it—no clean setup exists. For AI to rejoin tier-1, the market would need to price in a growth acceleration or a major credit relief event; in the current Slowdown, this category remains a barbell of extended names and broken technicals.
Nuclear Energy — URA
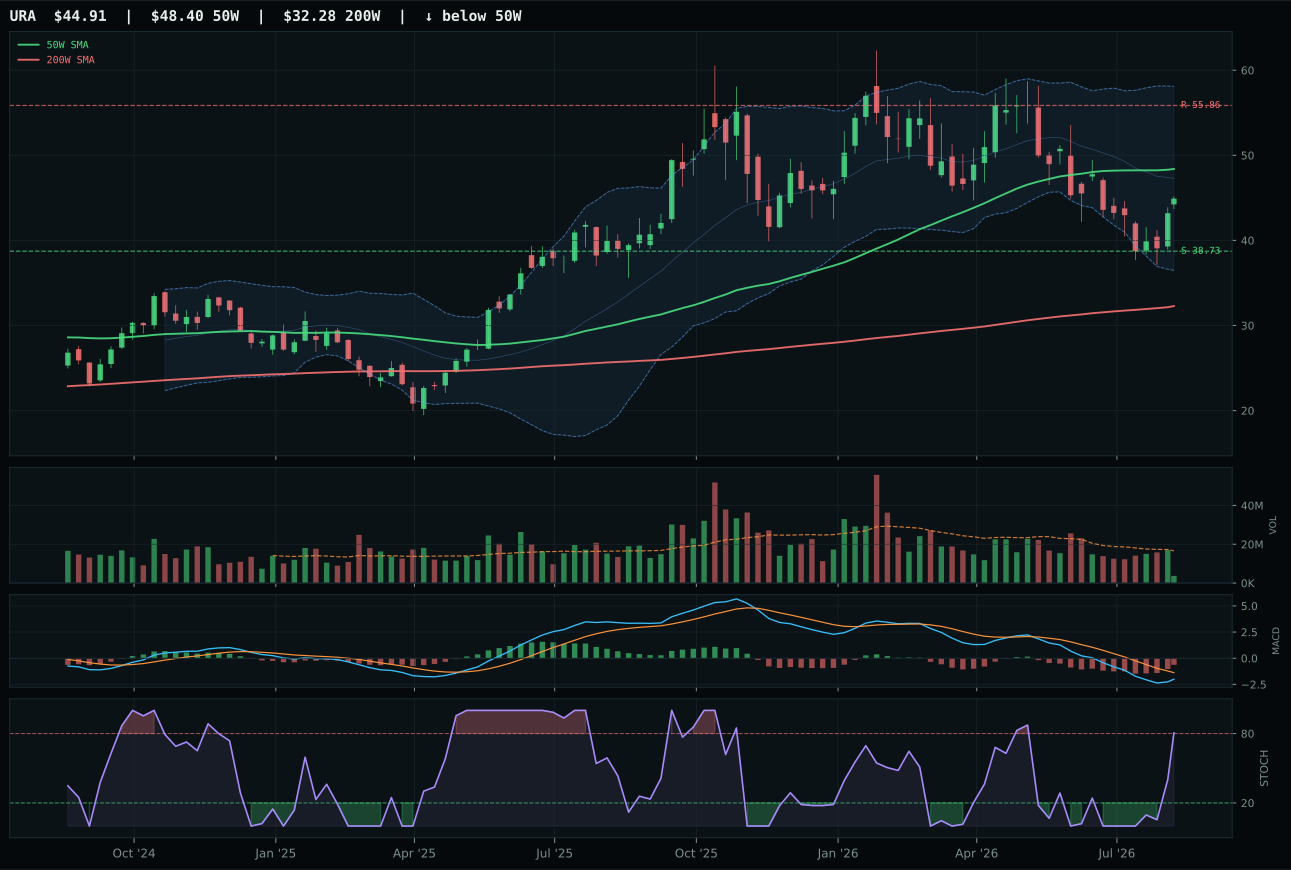
URA has a neutral structure profile with -14.7% 13-week relative strength versus SPY.
A failed hold above support would weaken the setup.
Actionable but governed by invalidation levels.
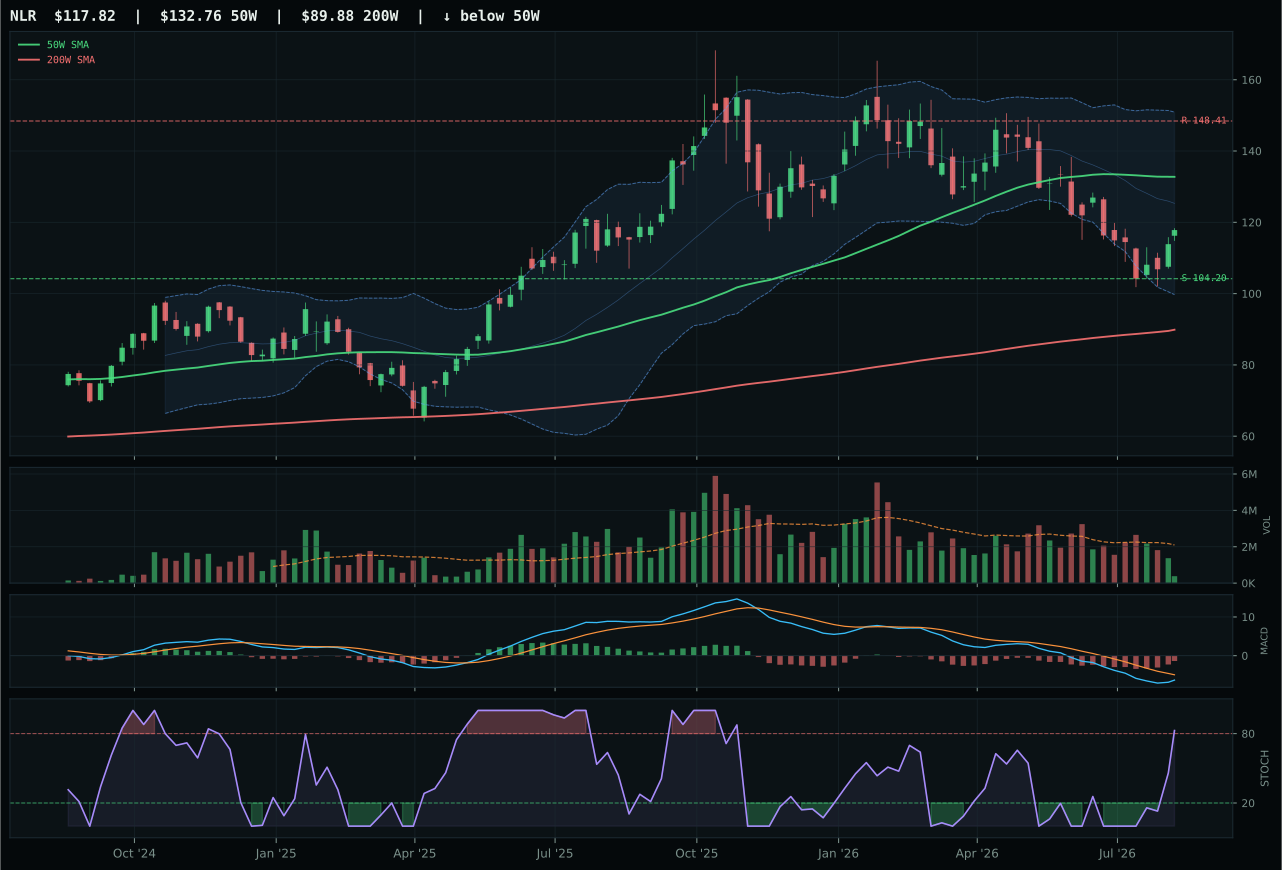
NLR has a neutral structure profile with -13.8% 13-week relative strength versus SPY.
A failed hold above support would weaken the setup.
Actionable but governed by invalidation levels.
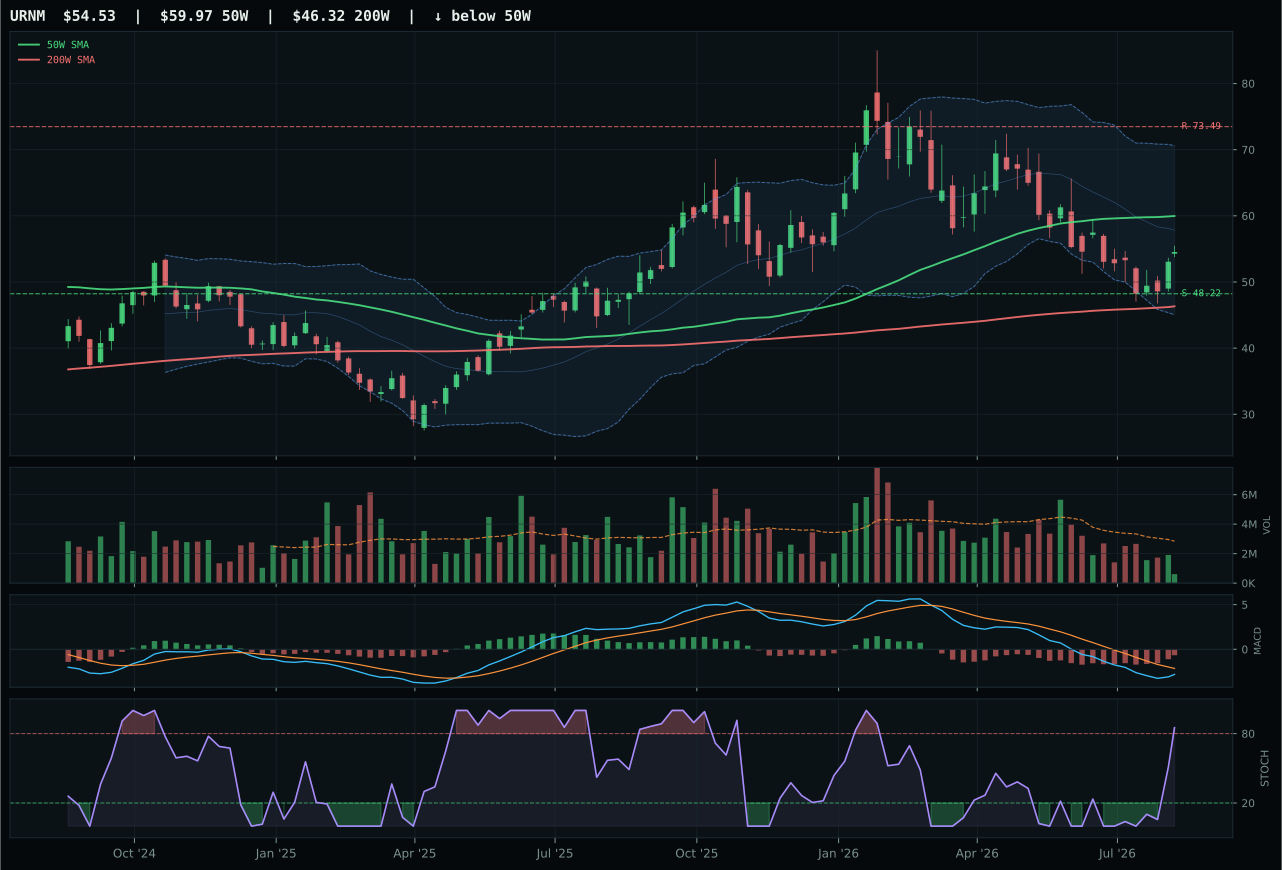
URNM has a neutral structure profile with -14.0% 13-week relative strength versus SPY.
A failed hold above support would weaken the setup.
Actionable but governed by invalidation levels.
URA wins Nuclear Energy despite trading 7.2% below the 50W, a pullback that actually becomes an advantage in a category where all three representatives are correcting. The decision hinges on timing and risk/reward: URA's 82.0 timing score (from deep Fib 0.618 retracement and bearish-but-improving MACD) beats NLR's 62.0, signaling a cleaner reset setup. URA sits at the 0.618 level near support, where mean reversion becomes probable, while NLR remains higher and carries less downside safety. Momentum confirmation is weak across both (40.7 vs 39.0), and 13W returns are negative for all three (-10.1% for URA, -9.1% for NLR), making this a category purely about who offers the best entry into a potential re-accumulation, not who has current flow.
Nuclear Energy earns 10% tier-2 allocation despite a category score of 43.0 and weak technical evidence of only 21.7/100. The portfolio is holding this slot on macro rationale, not price action: real asset sponsorship (+7) and improving energy-transition narratives provide fundamental tailwinds even as near-term technicals deteriorate. Credit stress (-5) represents the current headwind, but the category's structural story—replacement of baseload coal and natural gas in a climate-conscious energy transition—holds across slowdown phases. The macro fit of 50.0/100 reflects neutral descriptor balance; neither strong support nor penalty applies to nuclear directly. To move to tier-1, URA would need to break back above the 50W with volume confirmation and establish a 13W return positive, signaling institutional re-entry; currently it is held as a conviction long-term trade, not a tactical momentum play.
Agriculture & Livestock — MOO
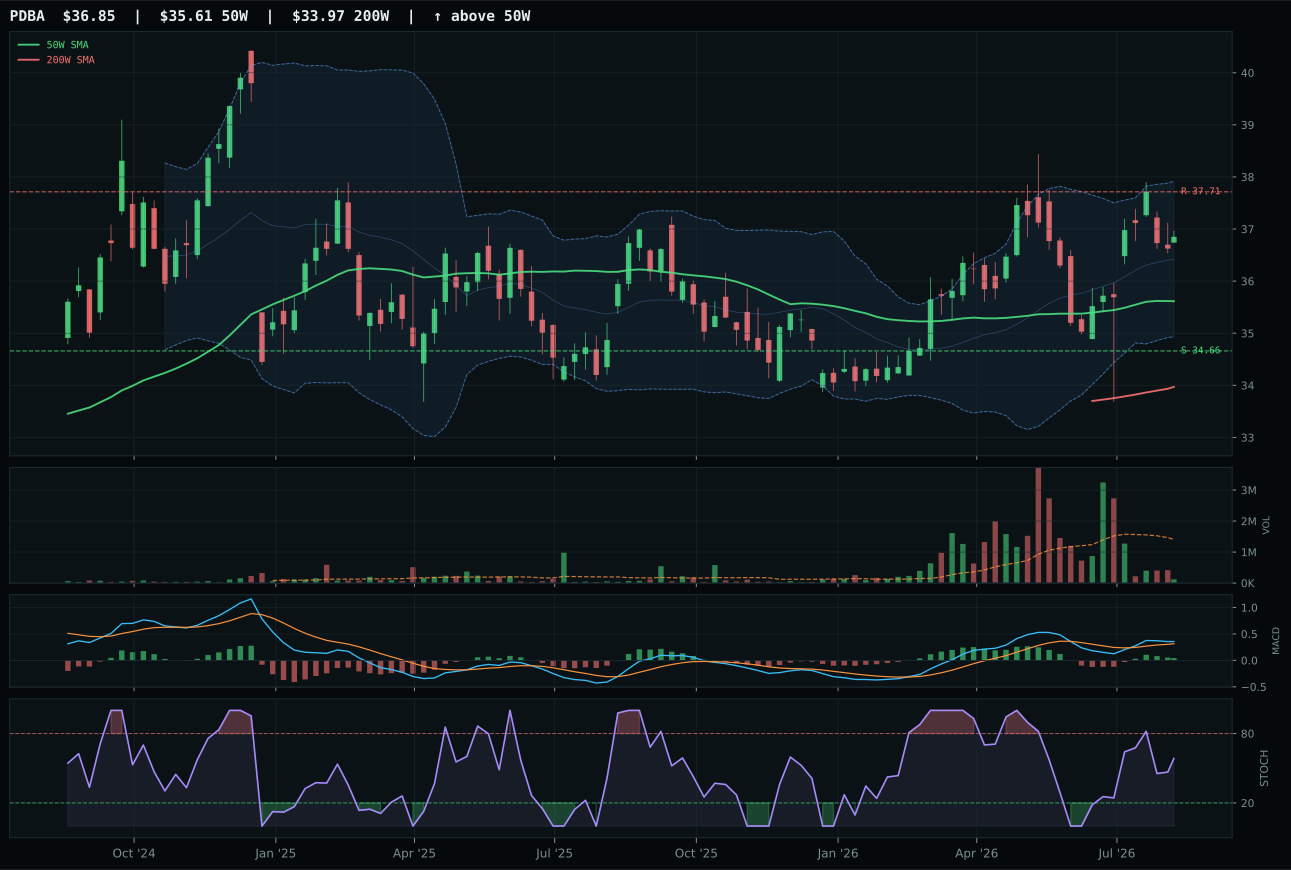
PDBA has a neutral structure profile with -5.3% 13-week relative strength versus SPY.
A failed hold above support would weaken the setup.
Actionable but governed by invalidation levels.
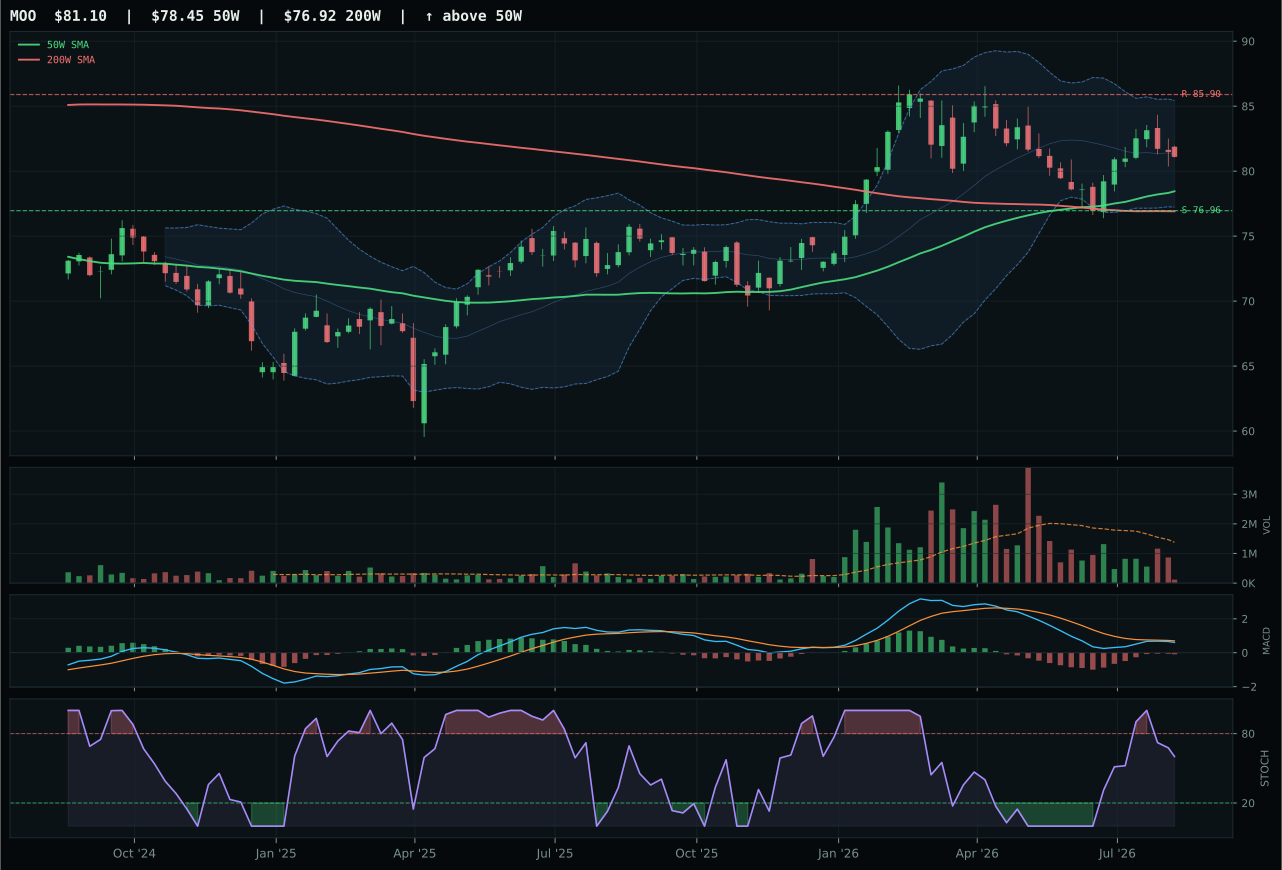
MOO has a neutral structure profile with -4.7% 13-week relative strength versus SPY.
A failed hold above support would weaken the setup.
Actionable but governed by invalidation levels.
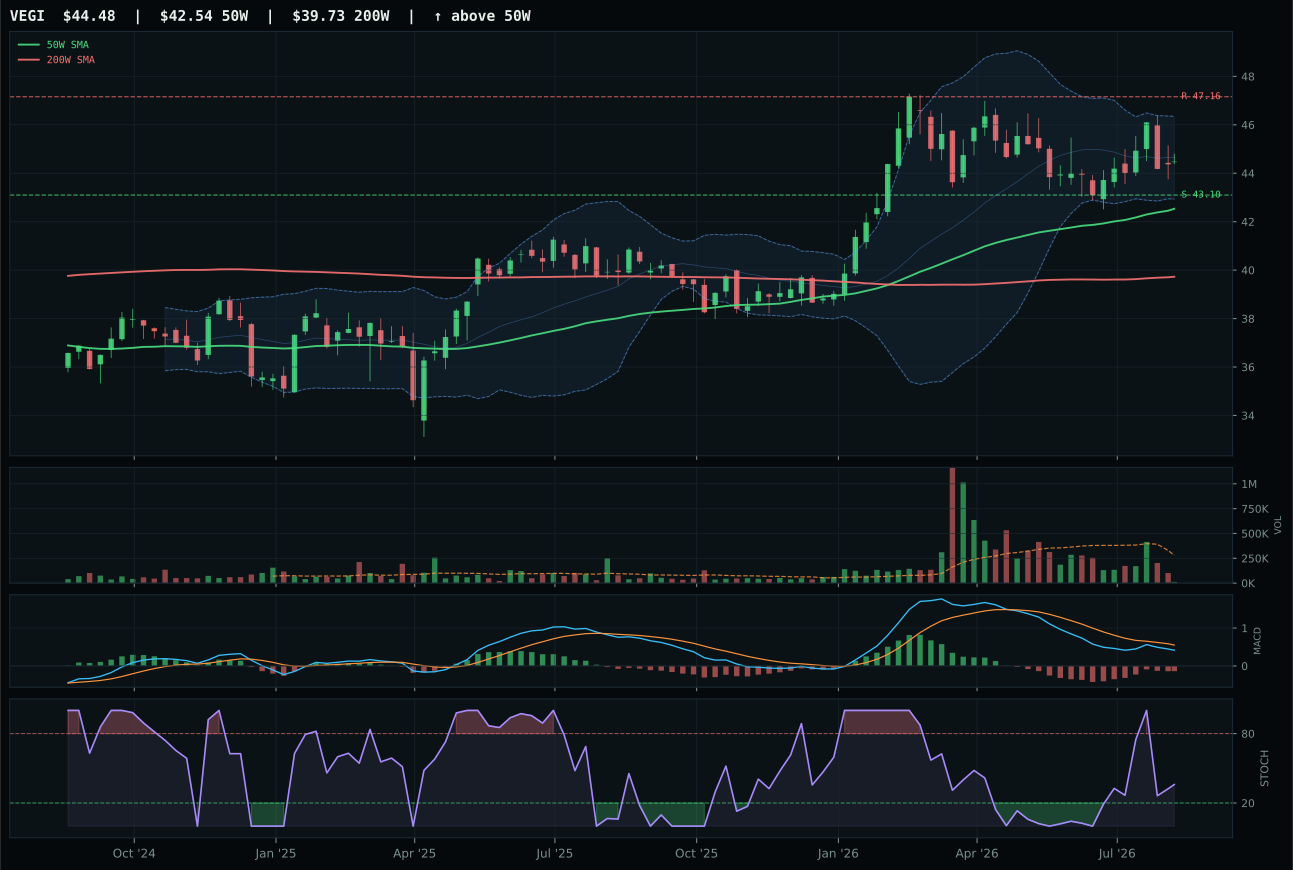
VEGI has a pullback into support profile with -5.8% 13-week relative strength versus SPY.
A failed hold above support would weaken the setup.
Actionable but governed by invalidation levels.
MOO wins narrowly over PDBA on risk/reward grounds despite PDBA's stronger MACD (bullish-improving vs bearish-improving) and superior composite score. The decision turns on MOO's 63.7 risk/reward versus PDBA's 51.5—a 12-point margin that stems from tighter resistance (5.6% upside limit vs PDBA's wider range) and superior downside support (5.4% vs PDBA's greater drawdown risk). Both sit at neutral structure with flat category RS and weak 13W momentum (-0.1% and -0.7%), but MOO's 0.7% category-relative edge gives it the slot. This is a close decision in a category where neither has true momentum; the win goes to the one offering better asymmetric payoff if this turns into a mean-reversion long.
Agriculture lands at 10% tier-2 allocation despite a 39.7 category score that reflects genuine macro headwinds. Growth slowdown active descriptor (-3) collides with the obvious cyclical sensitivity of farm commodities and livestock demand, yet real asset sponsorship (+8) and commodity breadth positive (+5) provide offsetting support in a Slowdown regime. Technical evidence lags at 57.9/100, weak momentum across all three representatives, and the category appears more tactically useful for hedges than core growth. To move into tier-1, Agriculture would need either evidence of demand stabilization (PMI relief) or a major currency devaluation that supports commodity export pricing; currently it occupies the role of a ballast position—held because slowdowns eventually reverse, not because current technicals justify overweight.
Industrial Metals — COPX
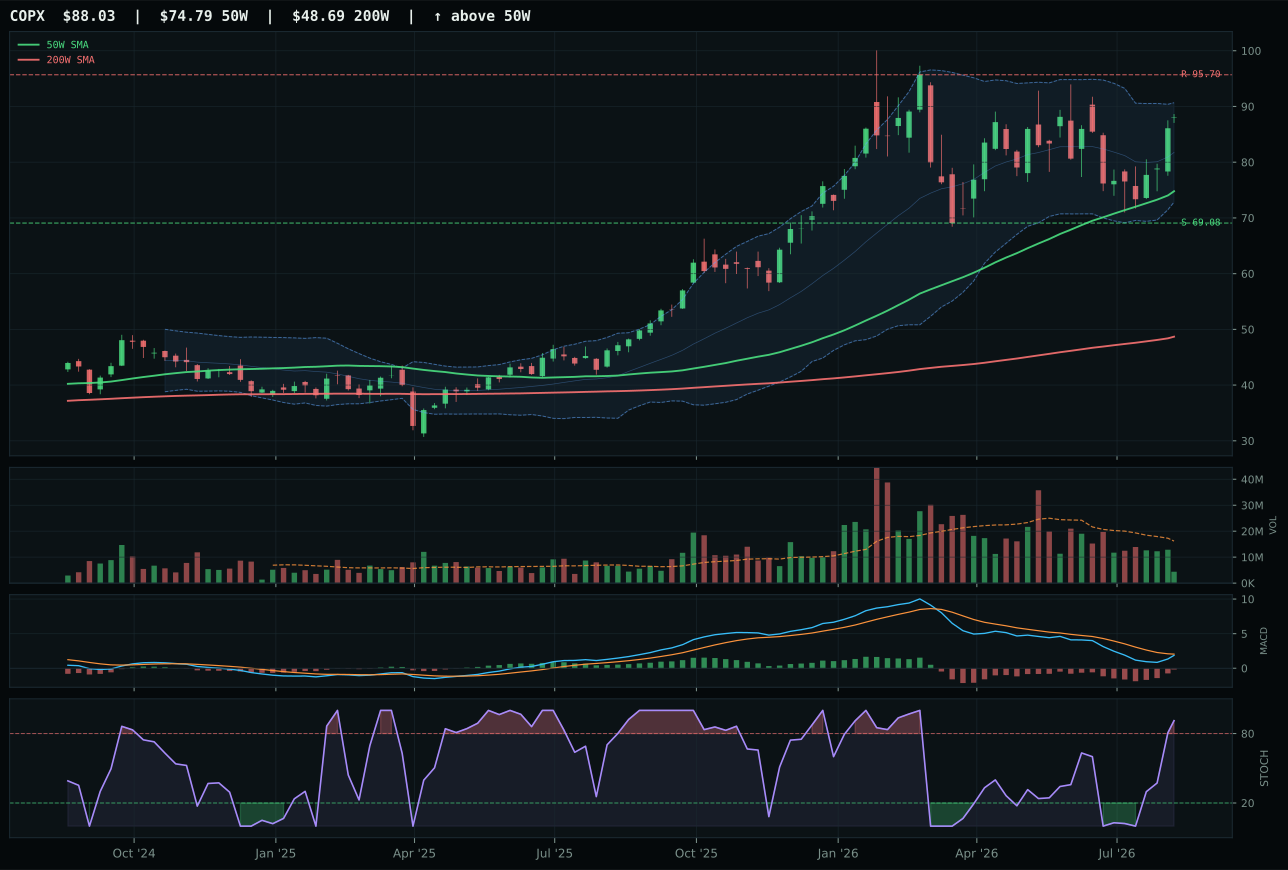
COPX has a vertical extension profile with 1.4% 13-week relative strength versus SPY.
A failed hold above support would weaken the setup.
Actionable but governed by invalidation levels.
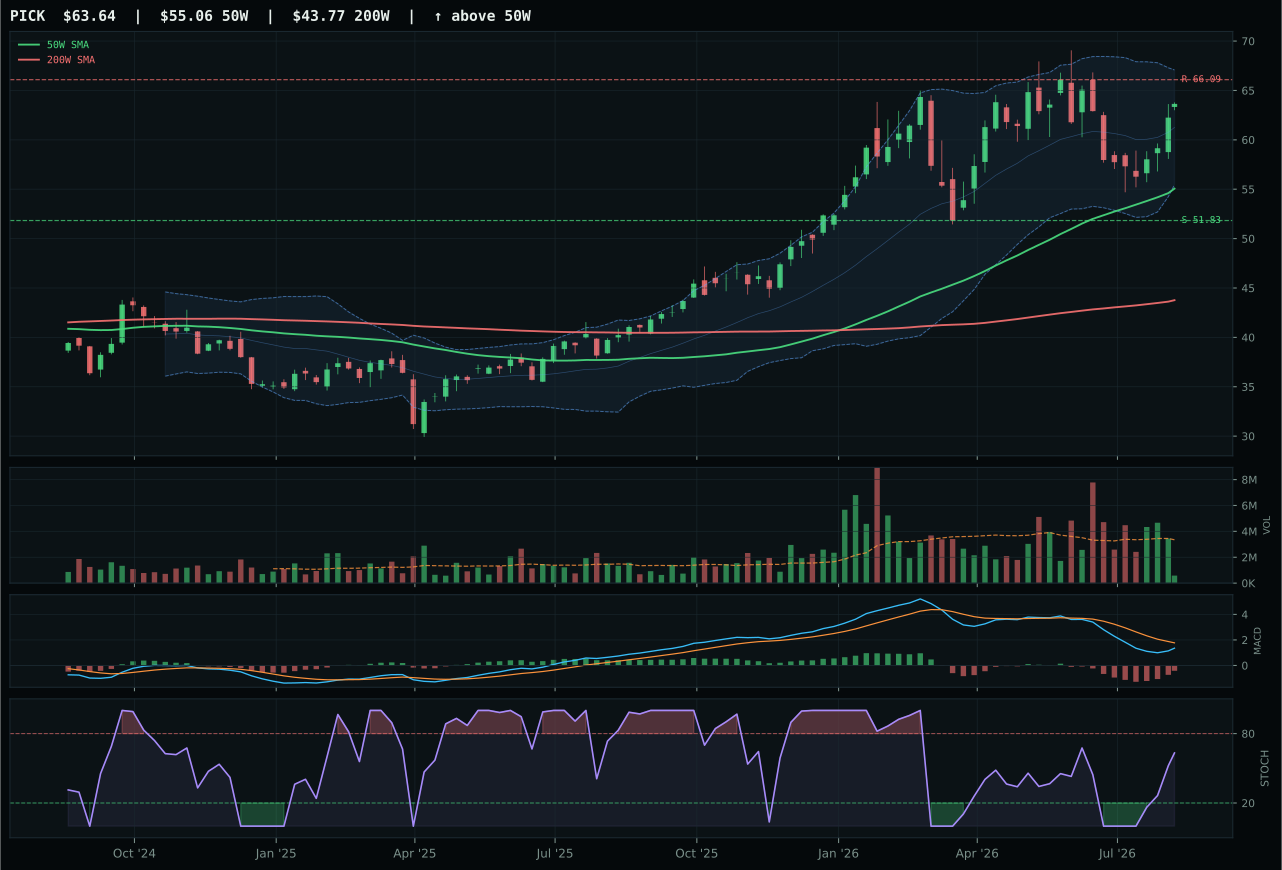
PICK has a vertical extension profile with -3.5% 13-week relative strength versus SPY.
A failed hold above support would weaken the setup.
Actionable but governed by invalidation levels.
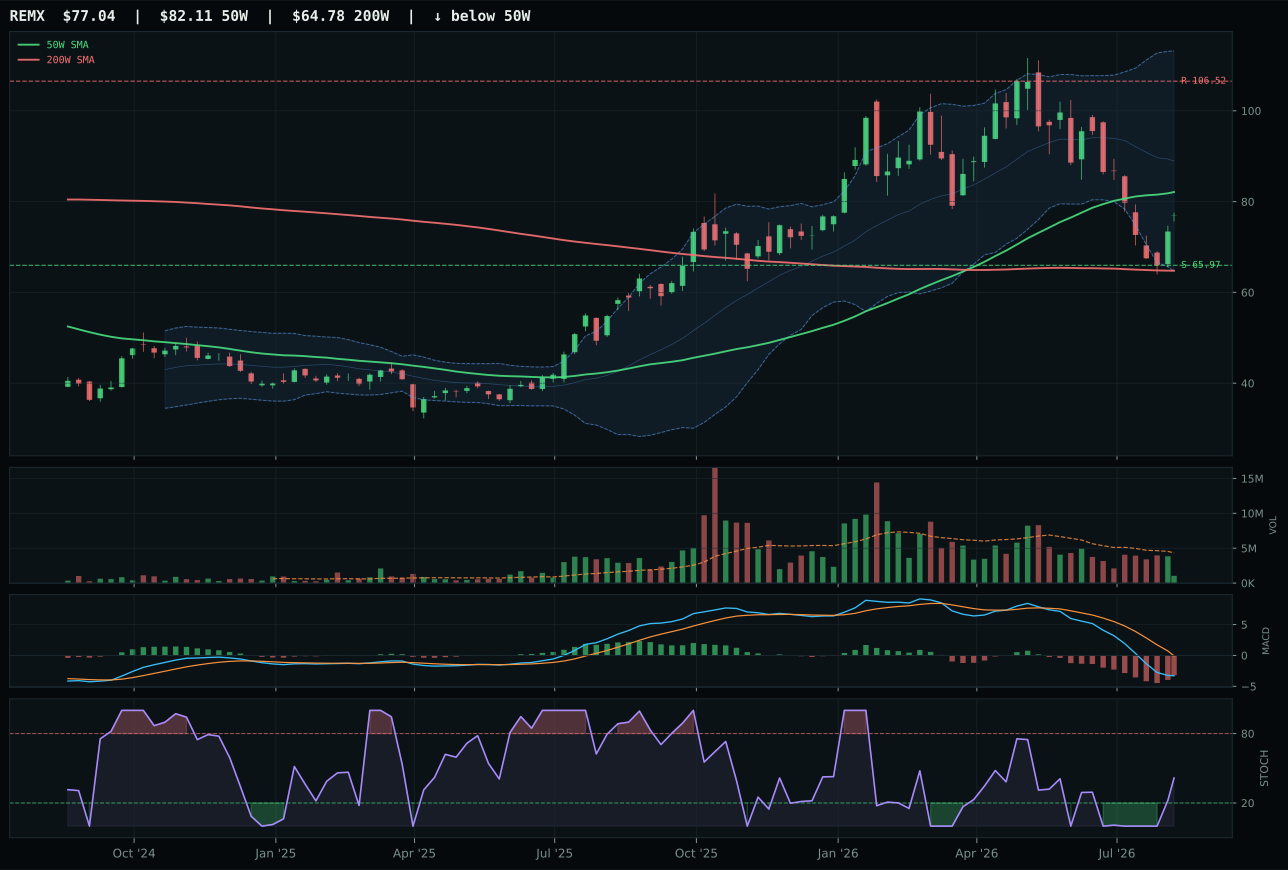
REMX has a neutral structure profile with -24.8% 13-week relative strength versus SPY.
A failed hold above support would weaken the setup.
Actionable but governed by invalidation levels.
COPX wins the Industrial Metals category by narrowly outpacing PICK on category-relative strength (4.8% vs 0.0%), though both suffer from the same structural problem: vertical extension at 17.7% above the 50W with MACD bearish-but-improving and stochastic RSI overbought. COPX's superior 4W momentum (20.0% vs PICK's lower reading) and better positioning within copper scarcity narratives edge the comparison, but this is a tactical differentiation within a category punished by slowdown fears. PICK's rising-mid-zone stochastic versus COPX's overbought momentum suggests PICK may have more runway technically, yet the metals scarcity descriptor (+12 for COPX) and category-relative leadership seal COPX's claim despite higher entry risk.
Industrial Metals earned 0% allocation this week, excluded from the portfolio as category rank fell to 9th or 10th. The 37.4 final score reflects a brutal macro headwind: Slowdown hurts this exposure by -10 points, a penalty that overwhelms the +14 metals scarcity and +10 commodity breadth-positive tailwinds. Technical evidence of 52.1/100 across the representative basket shows decent trend and momentum confirmation, but macro deterioration forces the category to the bench. Credit stress (-5 in the basket) and growth slowdown (-10) directly attack copper and industrial demand forecasts, making this a cyclical beta play at exactly the wrong phase. To earn reinstatement, Industrial Metals would need clear evidence of China stimulus reversal or a hard floor in manufacturing PMI; absent that reversal signal, the category remains out until macro conditions improve.
Traditional Energy — XLE
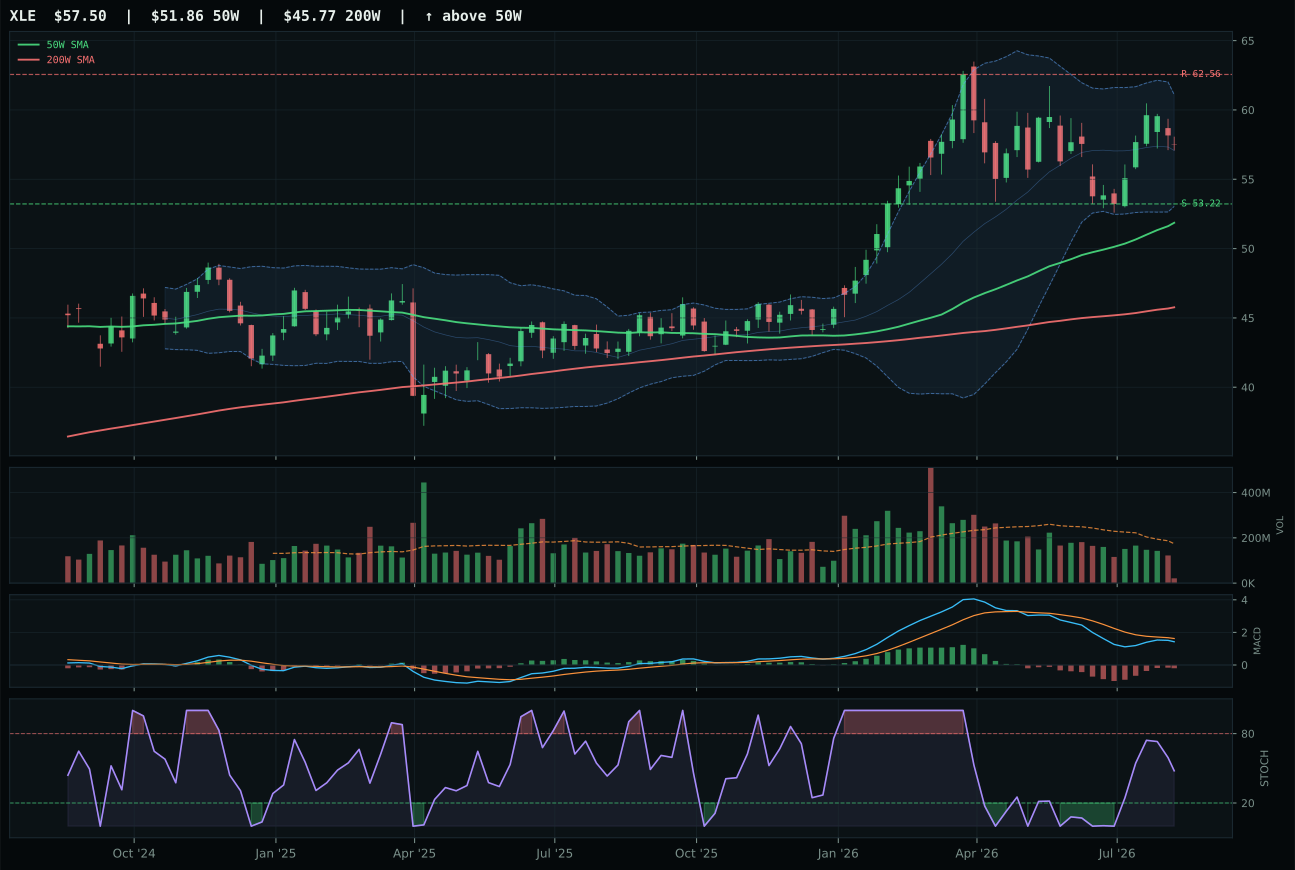
XLE has a neutral structure profile with -7.9% 13-week relative strength versus SPY.
A failed hold above support would weaken the setup.
Actionable but governed by invalidation levels.
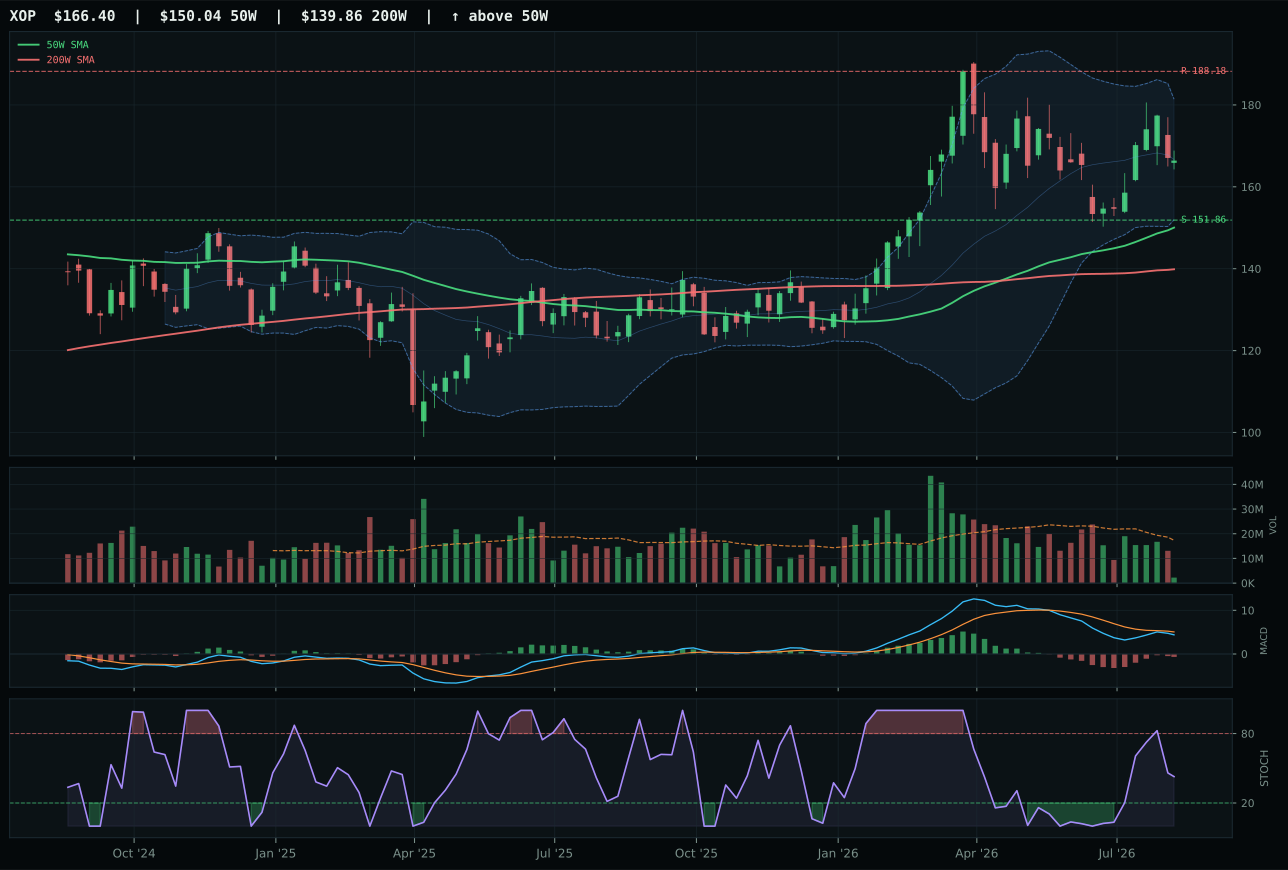
XOP has a neutral structure profile with -9.1% 13-week relative strength versus SPY.
A failed hold above support would weaken the setup.
Actionable but governed by invalidation levels.
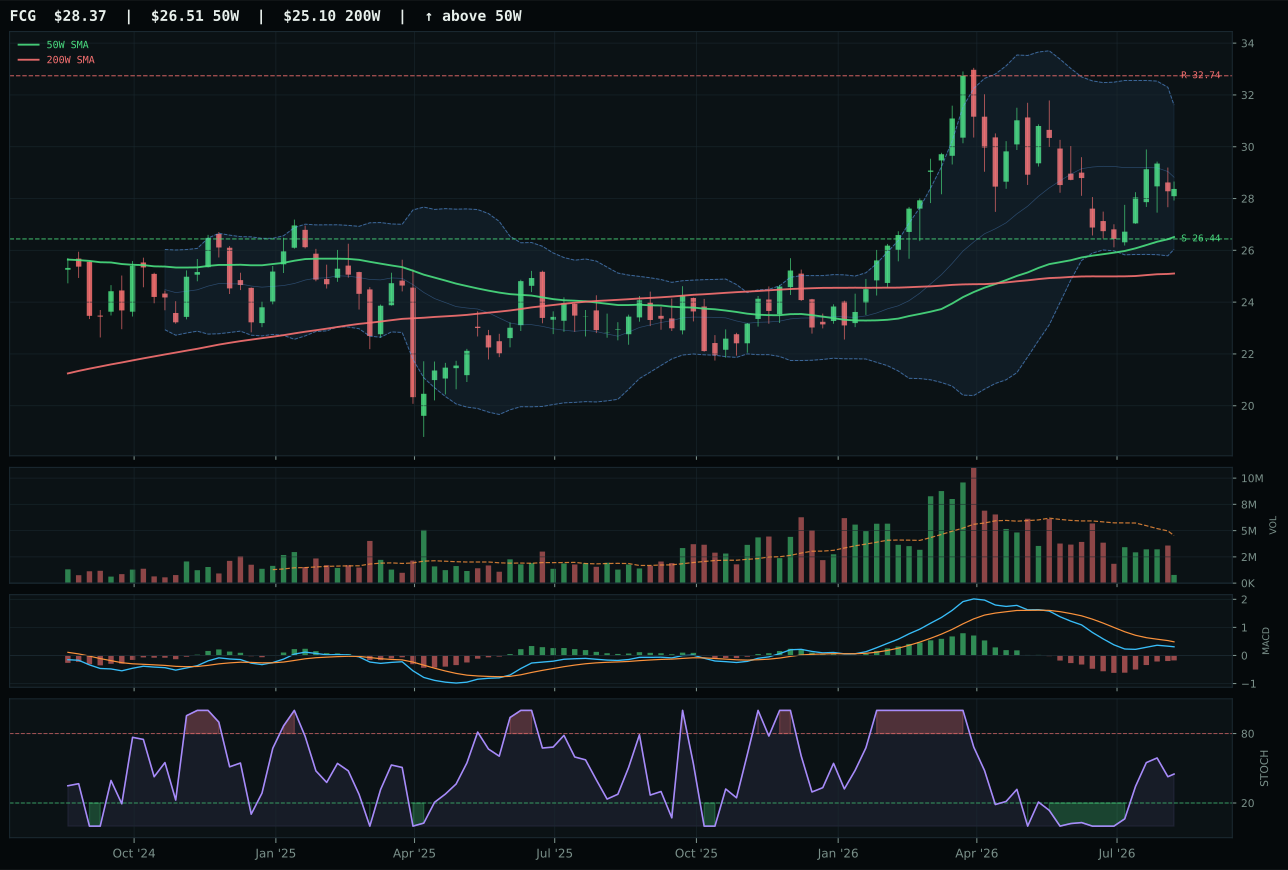
FCG has a neutral structure profile with -12.5% 13-week relative strength versus SPY.
A failed hold above support would weaken the setup.
Actionable but governed by invalidation levels.
XLE wins Traditional Energy on slim margins (0.9 points over XOP) based on category-relative strength of 1.2% versus XOP's 0.0%, though both are deeply underwater with negative RS versus SPY (-7.9% for XLE, -9.1% for XOP). The setup is neutral structure with 10.9% distance to the 50W, bearish-but-improving MACD, and falling/neutral stochastic RSI—a textbook recovery play if energy stabilizes, but no conviction yet. FCG trails with -12.5% SPY RS and a weaker technical composite, making XLE the default choice in a category where all three representatives are de-listed from accumulation and sit in repair mode. Thin participation across the energy complex reflects institutional disinterest as slowdown fears dominate.
Traditional Energy earned 0% allocation this week, ranking outside the portfolio's tier structure. The 16.9 final score is the lowest in the allocation set, driven by a catastrophic macro fit of 35.0/100 where Slowdown penalty (-8) combines with growth slowdown (-7) and credit stress (-7) to overwhelm real asset sponsorship (+7). Technical evidence of 56.4/100 shows XLE can hold the 50W and 200W on a longer timeframe, but current-week momentum is negative across the three-ETF basket. No category-specific macro descriptor supported energy this week, and the combination of cyclical demand destruction (slowdown) plus commodity price weakness left energy entirely out of favor. For Traditional Energy to earn a tier-2 position, the market would need credible demand stabilization, OPEC production leadership validation, or a spike in geopolitical risk that tightens supply; none have materialized, leaving energy on the sidelines until sentiment shifts.