
2026-07-31
Informational purposes only. The content in this report, including allocations, analysis, and commentary, is provided solely for informational and educational purposes. It does not constitute financial advice, investment advice, trading advice, or any other type of advice. Past performance does not guarantee future results. Always conduct your own research and consult a qualified financial professional before making investment decisions.
GLD defensive overlay excluded: price is below its 8W SMA. Cause selector will use cash alternative.
Macro risk engine requires the 50% Defensive overlay for this run; payload selected by cause: Inflation Scarcity.
Weekly Allocation
| Ticker | Category | Weight | Role |
|---|---|---|---|
| XLE | 50% | Overlay | |
| XOP | Traditional Energy | 10% | Top-2 (10%) |
| VEGI | Agriculture & Livestock | 10% | Top-2 (10%) |
| CIBR | Technology | 5% | Tier-2 (5%) |
| IGF | Utilities & Infrastructure | 5% | Tier-2 (5%) |
| COPX | Industrial Metals | 5% | Tier-2 (5%) |
| ITA | Defense & Aerospace | 5% | Tier-2 (5%) |
| GLD | Precious Metals | 5% | Tier-2 (5%) |
| NLR | Nuclear Energy | 5% | Tier-2 (5%) |
Trade Instructions — Monday Open
Sell the tranche from 2026-07-03 (completing its 4-week hold). Buy the new tranche. Instructions show net portfolio changes — same-asset positions cancel, weight changes show the delta.
| Action | Ticker | Instruction |
|---|---|---|
| SELL | CIBR | Sell 25% of CIBR position (reduce 15.00% → 11.25%) |
| SELL | SMH | Sell entire SMH position (5.00% of portfolio) |
| SELL | ITA | Sell 12% of ITA position (reduce 10.00% → 8.75%) |
| SELL | XLU | Sell 25% of XLU position (reduce 10.00% → 7.50%) |
| SELL | COPX | Sell 12% of COPX position (reduce 10.00% → 8.75%) |
| SELL | URNM | Sell 33% of URNM position (reduce 7.50% → 5.00%) |
| SELL | GLD | Sell 25% of GLD position (reduce 5.00% → 3.75%) |
| BUY | XLE | Buy XLE — 71.43% of freed cash (adds 12.50% to portfolio) |
| BUY | XOP | Buy XOP — 14.29% of freed cash (adds 2.50% to portfolio) |
| BUY | IGF | Buy IGF — 7.14% of freed cash (adds 1.25% to portfolio) |
| BUY | NLR | Buy NLR — 7.14% of freed cash (adds 1.25% to portfolio) |
Current Portfolio After Trade
Combined holdings across all 4 active tranches. Each tranche is 25% of the portfolio.
| Ticker | % of Portfolio | Weight Bar |
|---|---|---|
| XLE | 22.50% | |
| WEAT | 12.50% | |
| CIBR | 11.25% | |
| ITA | 8.75% | |
| COPX | 8.75% | |
| XLU | 7.50% | |
| BOTZ | 7.50% | |
| URNM | 5.00% | |
| GLD | 3.75% | |
| FCG | 2.50% | |
| AIQ | 2.50% | |
| XOP | 2.50% | |
| VEGI | 2.50% | |
| IGF | 1.25% | |
| NLR | 1.25% |
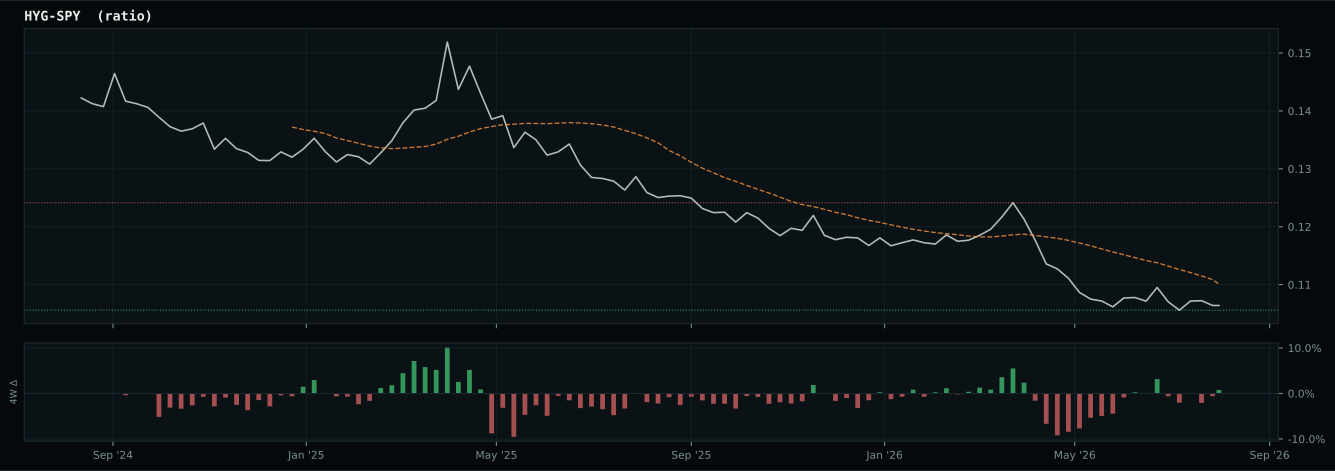
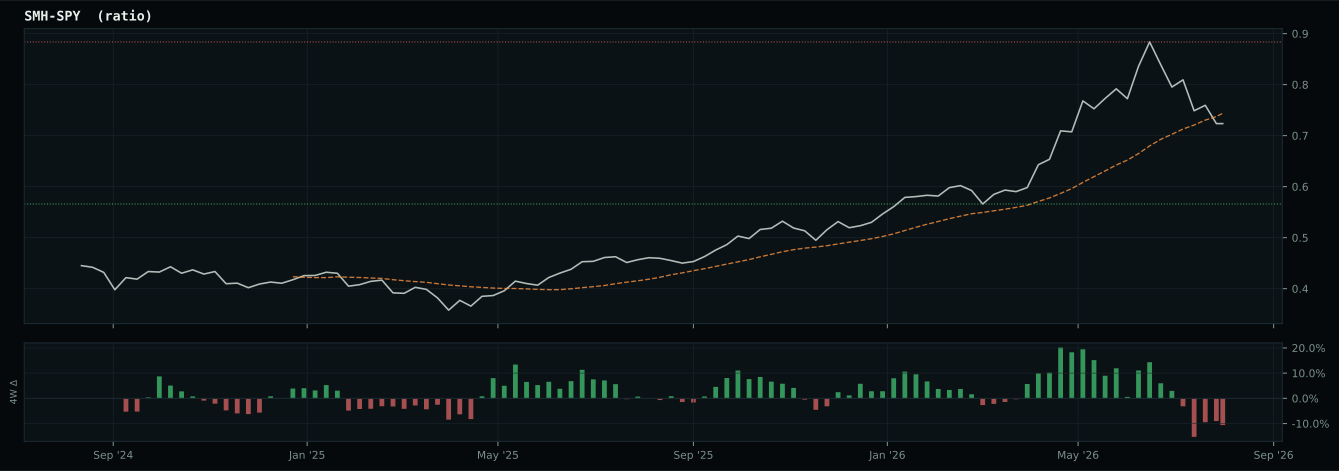
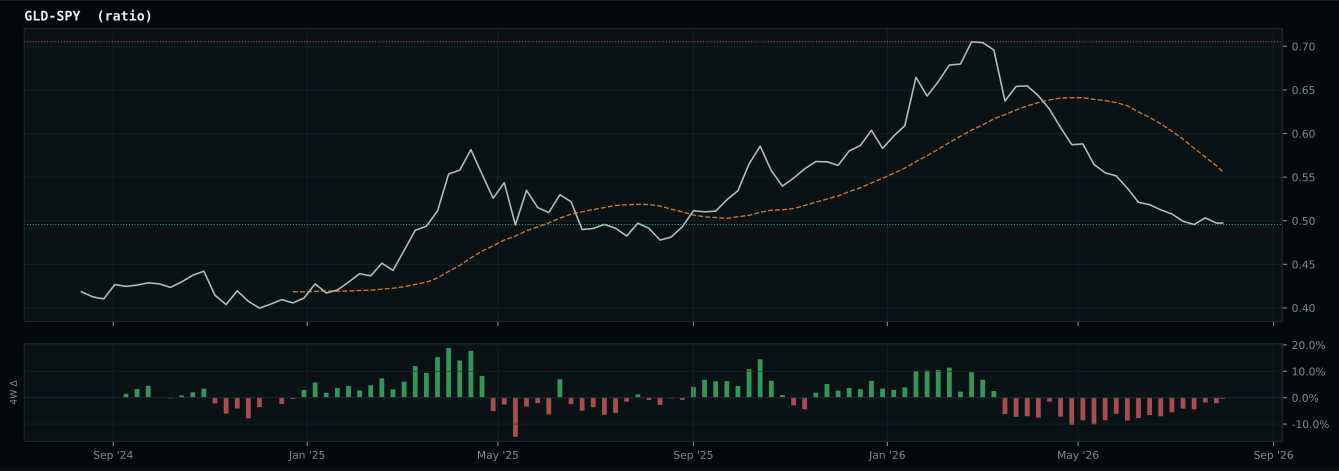
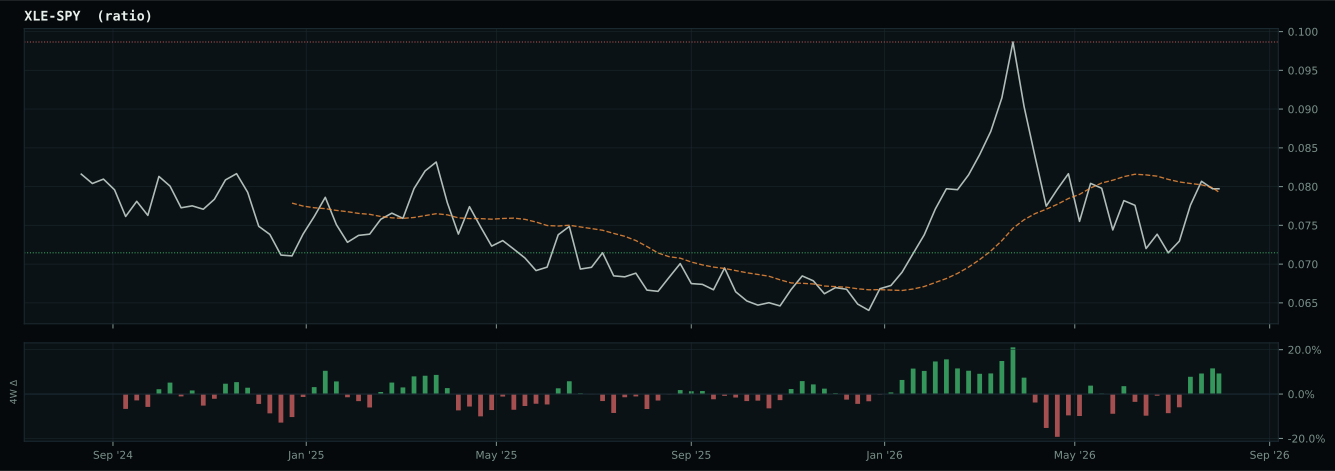
Macro Regime — Stagflation Risk
Macro Evidence Charts
Market-implied signals behind the macro regime scores. Each ratio compares two assets; the direction and slope of the ratio is what the macro engine reads.
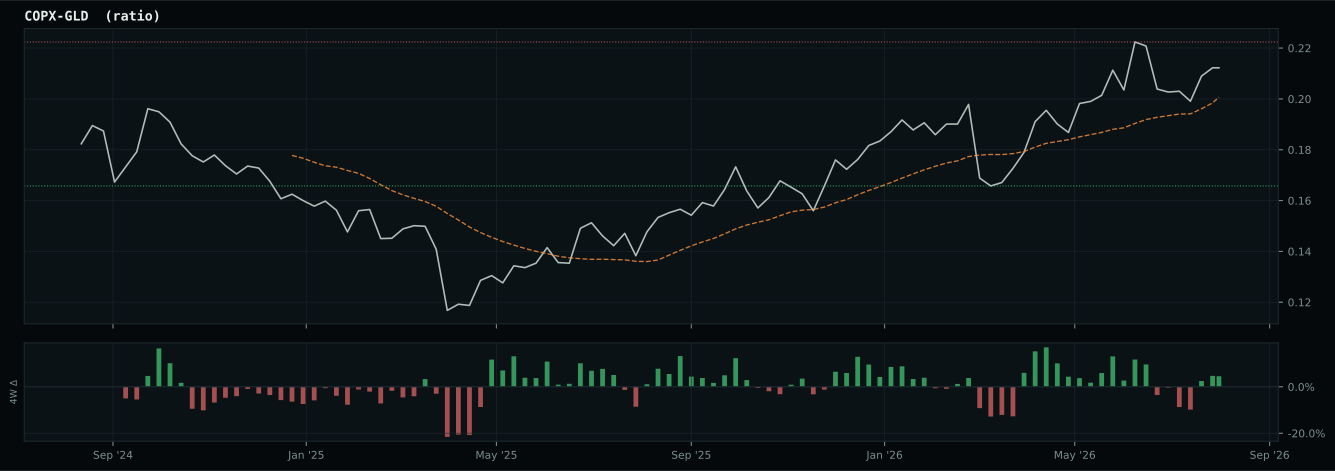
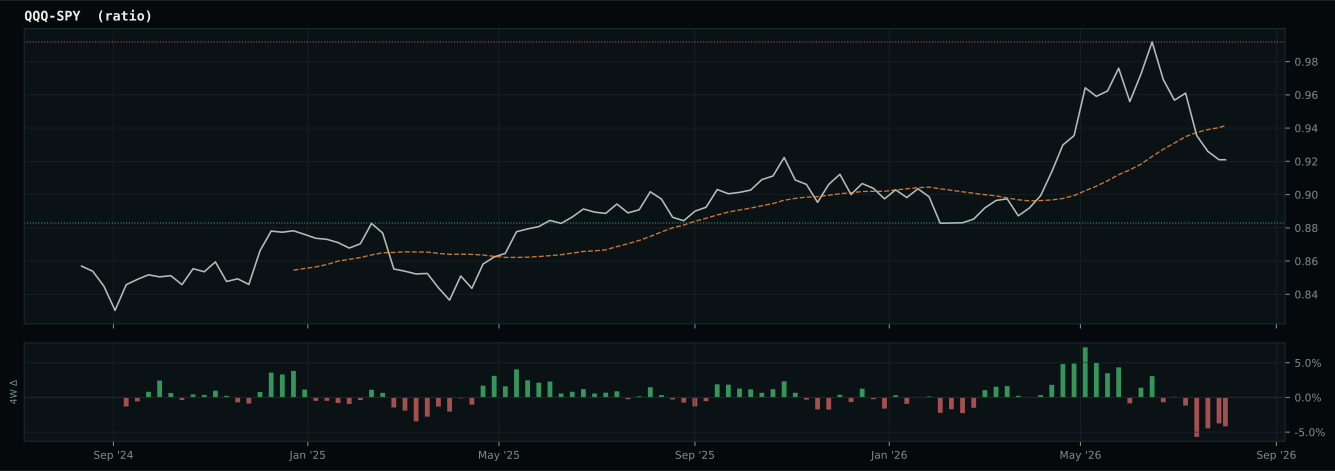
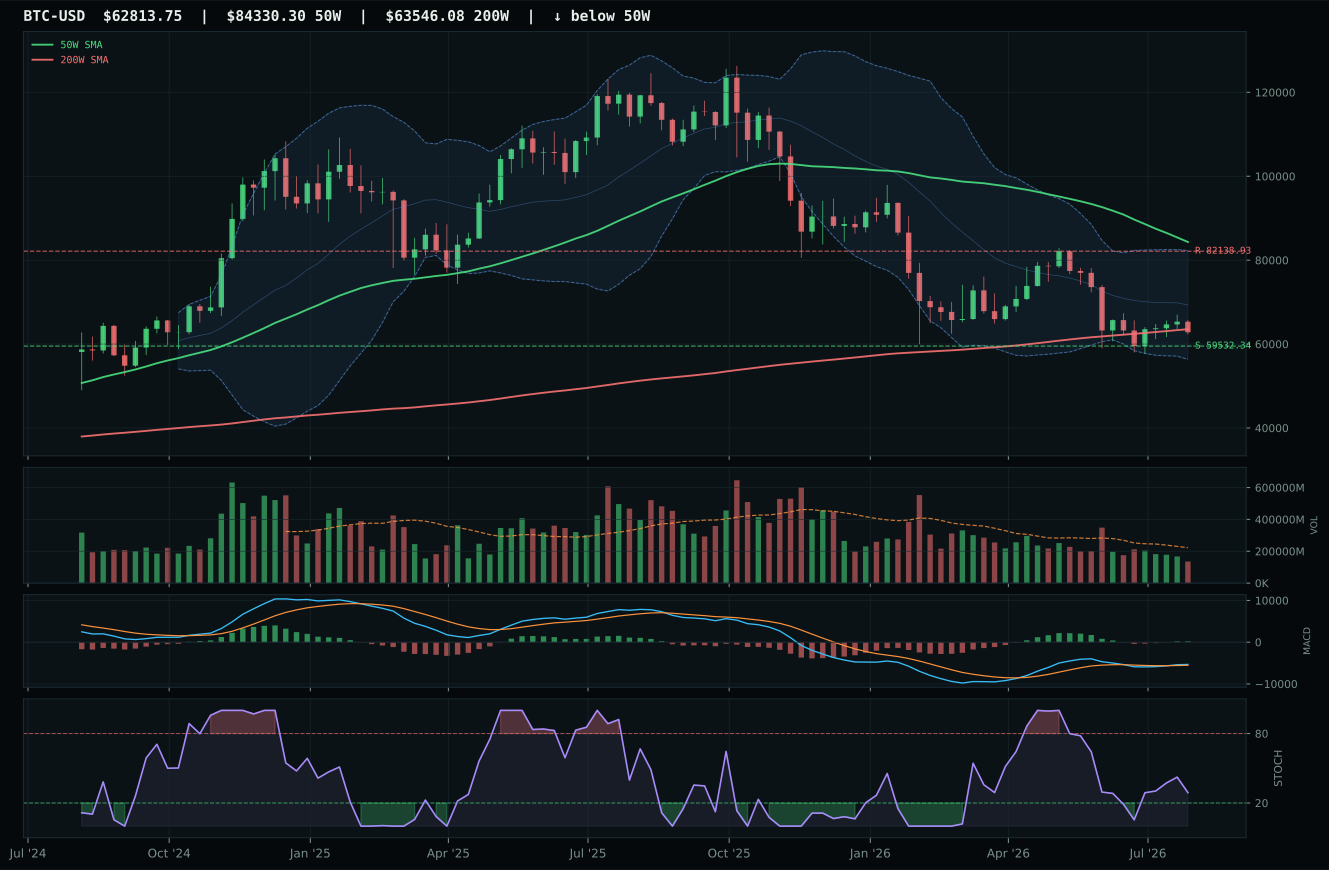
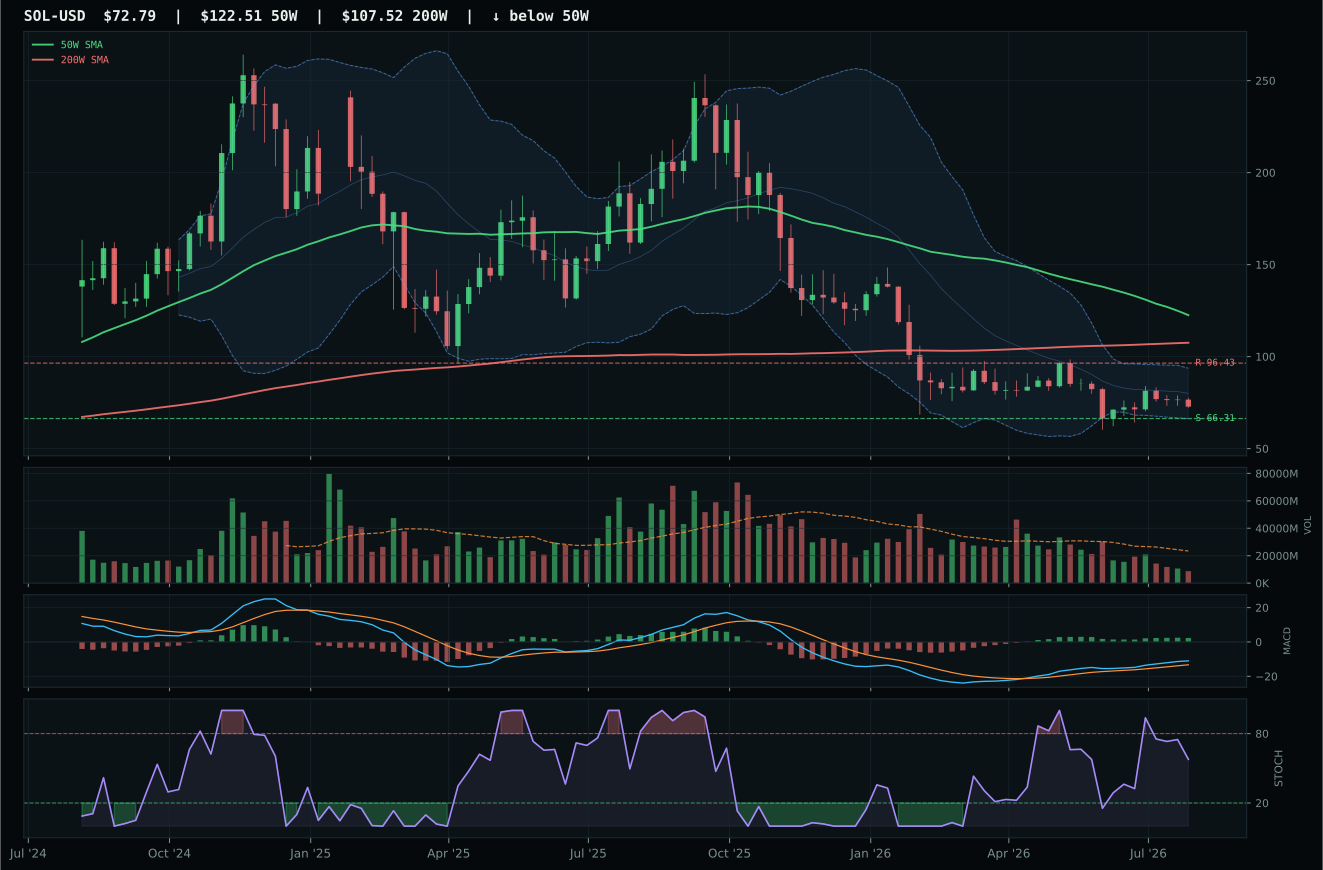
Crypto Regime — NoCrypto
post-touch range has not been tested enough: support tests 1/2, resistance tests 3/2
TrendBTC not confirmed
one or more available conditions failed
Category Rankings
| Rank | Category | Winner | Score | Alloc | 4W Ret | Peers (4W) |
|---|---|---|---|---|---|---|
| 1 | Traditional Energy | XOP | 70.9 | 20% | — | FCG — · XLE — |
| 2 | Agriculture & Livestock | VEGI | 60.2 | 20% | — | WEAT — · MOO — |
| 3 | Technology | CIBR | 53.1 | 10% | — | IGV — · XLK — |
| 4 | Utilities & Infrastructure | IGF | 46.9 | 10% | — | PAVE — · XLU — |
| 5 | Industrial Metals | COPX | 45.6 | 10% | — | PICK — · REMX — |
| 6 | Defense & Aerospace | ITA | 45.4 | 10% | — | XAR — · ROKT — |
| 7 | Precious Metals | GLD | 40.5 | 10% | — | GDX — · SLV — |
| 8 | Nuclear Energy | NLR | 35.6 | 10% | — | URNM — · URA — |
| 9 | Emerging Markets | ILF | 21.6 | 0% | — | INDA — · IEMG — |
| 10 | AI | AIQ | 19.6 | 0% | — | BOTZ — · SMH — |
Agriculture & Livestock — VEGI
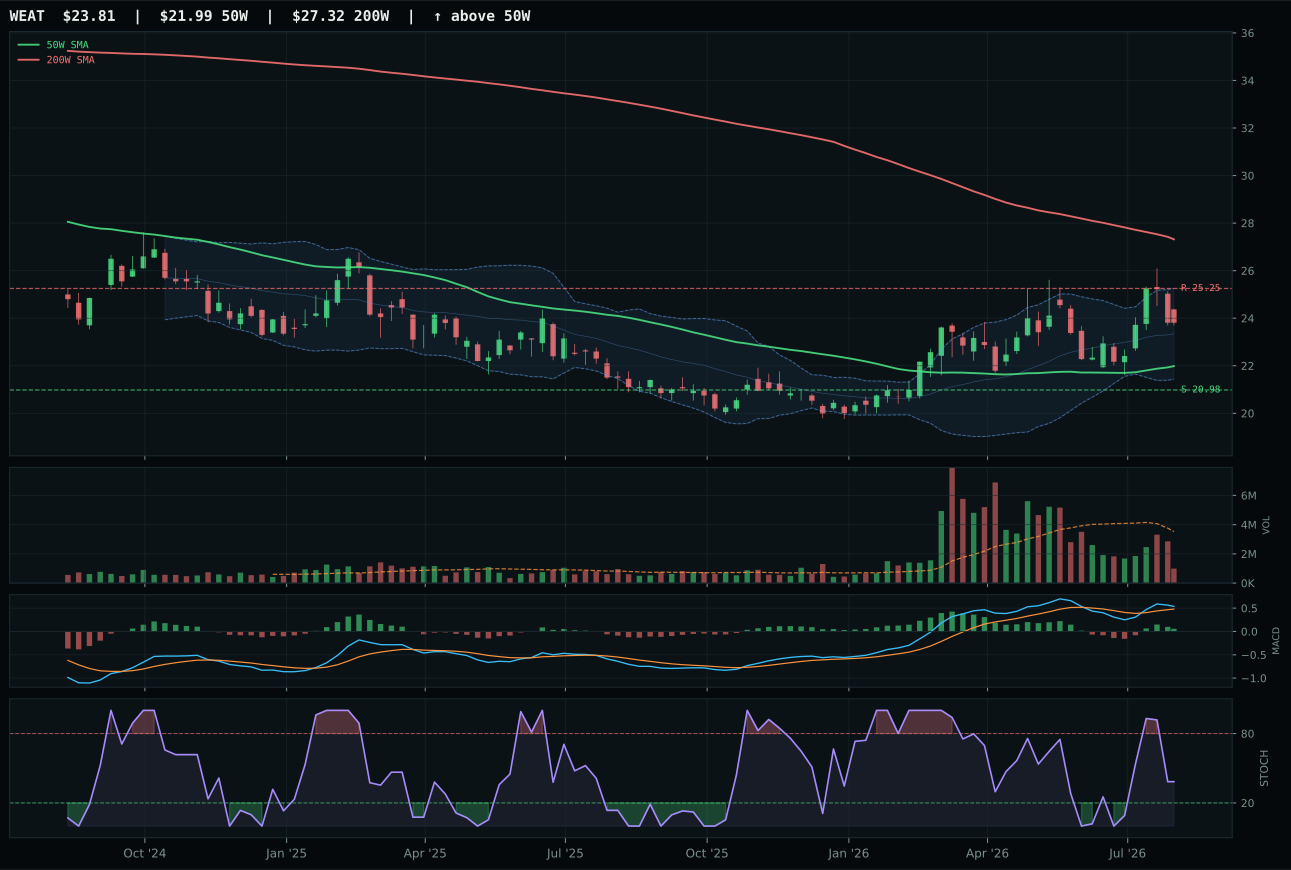
WEAT has a neutral structure profile with -4.5% 13-week relative strength versus SPY.
A failed hold above support would weaken the setup.
Actionable but governed by invalidation levels.
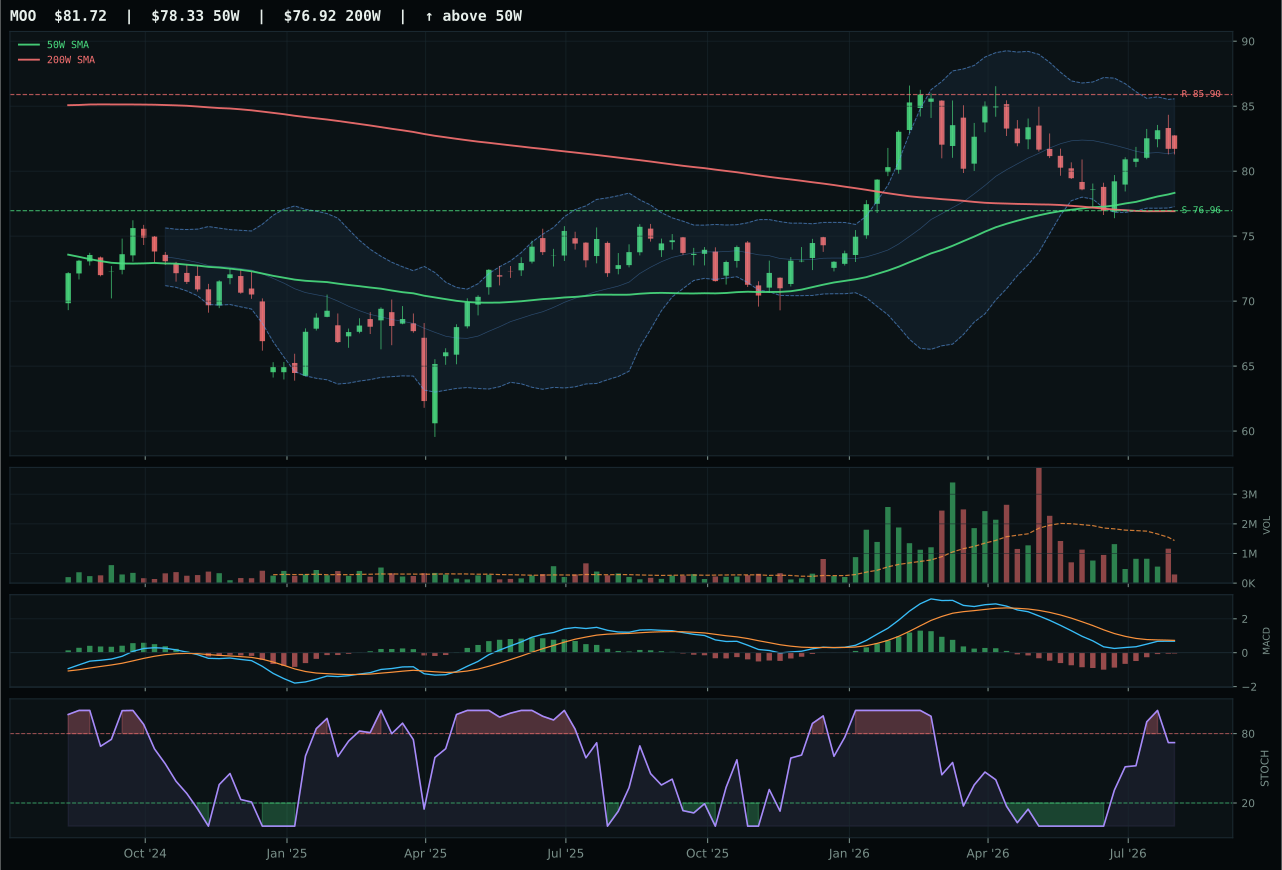
MOO has a neutral structure profile with -5.7% 13-week relative strength versus SPY.
A failed hold above support would weaken the setup.
Actionable but governed by invalidation levels.
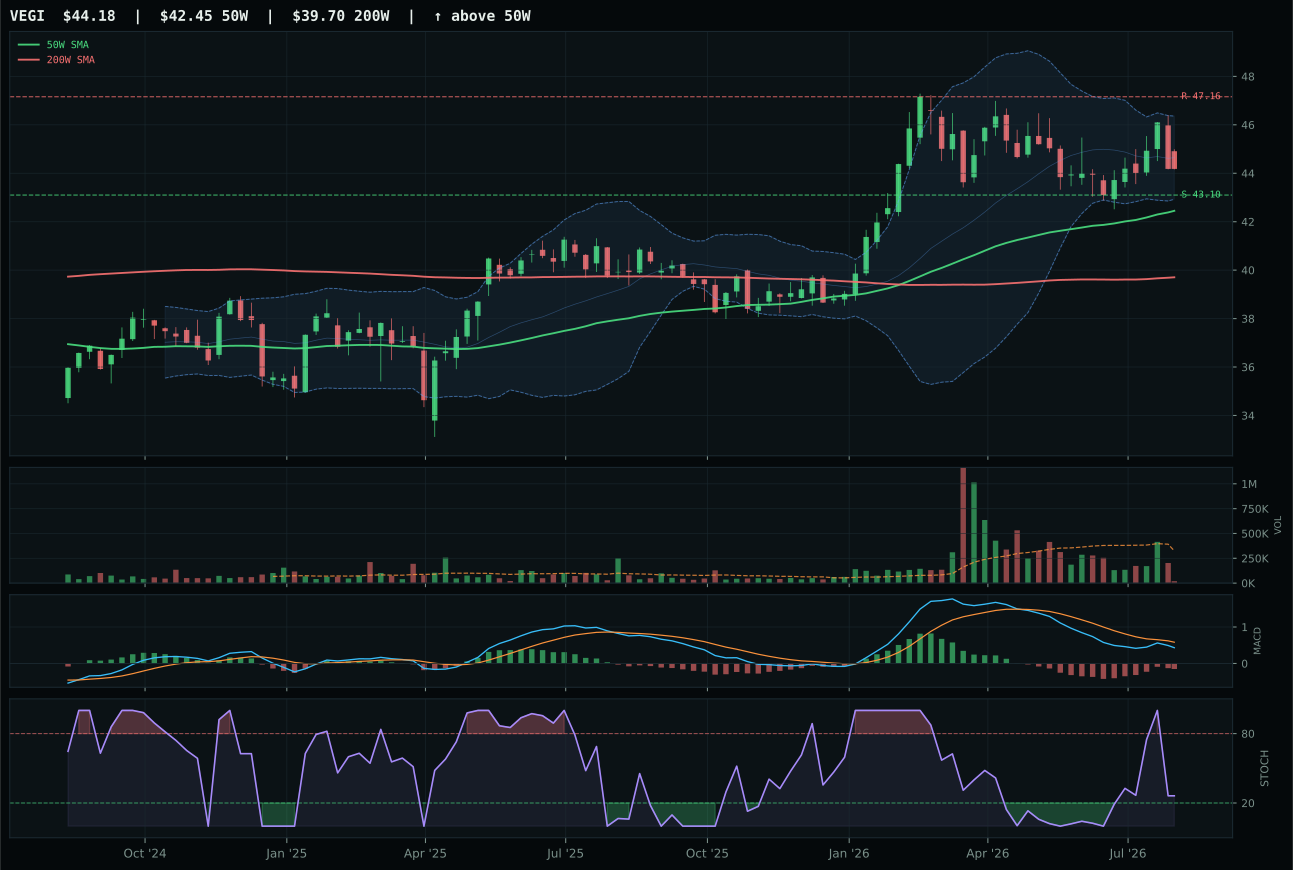
VEGI has a pullback into support profile with -6.6% 13-week relative strength versus SPY.
A failed hold above support would weaken the setup.
Actionable but governed by invalidation levels.
VEGI earns top-2 status because it combines a pullback-into-support structure with exceptional risk/reward (90.0/100) and perfect timing (100.0/100), despite showing zero momentum on the 4W and negative 2.3% on the 13W. The setup is textbook: price above both the 50W and 200W, pulling into 43.10 support with 2.5% downside protection and 6.3% upside to the 47.16 resistance, while stochastic RSI falls/neutral at 0.26 and MACD bearish but improving. This structure signals capitulation sellers meeting value buyers, not a trending rally—exactly the kind of low-beta accumulation that works in transition regimes. WEAT loses because its timing score drops to 75 despite a bullish-improving MACD; WEAT sits in neutral structure at 21.95-25.25 range with timing of only 75 and risk/reward of just 52.6. The 12.1-point category decision gap reflects VEGI's superior Fib geometry (upper retracement / momentum zone at 43.73 vs neutral positioning) and better compression setup that offers defined invalidation.
Agriculture & Livestock receives 10% as a top-2 overweight category because its 63.3 score ranks among the two highest eligible final category scores and because macro fit of 93.0/100 is exceptional. Supply shortage active at +13, inflation pressure at +10, and Stagflation Risk helping by +10 create a perfect storm of tailwinds for agricultural producers—real asset sponsorship at +8 and commodity breadth positive at +5 confirm broad institutional rotation into food security. This category's allocation competes directly with Energy (ranked 72.1) for capital, and the split 10%/10% recognizes that both scarcity themes deserve equal weight in a stagflationary transition. VEGI's -2.3% 13W return and -3.5% SPY RS might appear weak, but they reflect the sector's timing—agricultural commodities front-run energy rallies in real-asset cycles and now sit at the inflection point where supply constraints begin to price. The 0.06x volume participation is the only concern; allocation would expand if volume moved above 0.12x average, confirming that hedge funds are layering in.
Traditional Energy — XOP
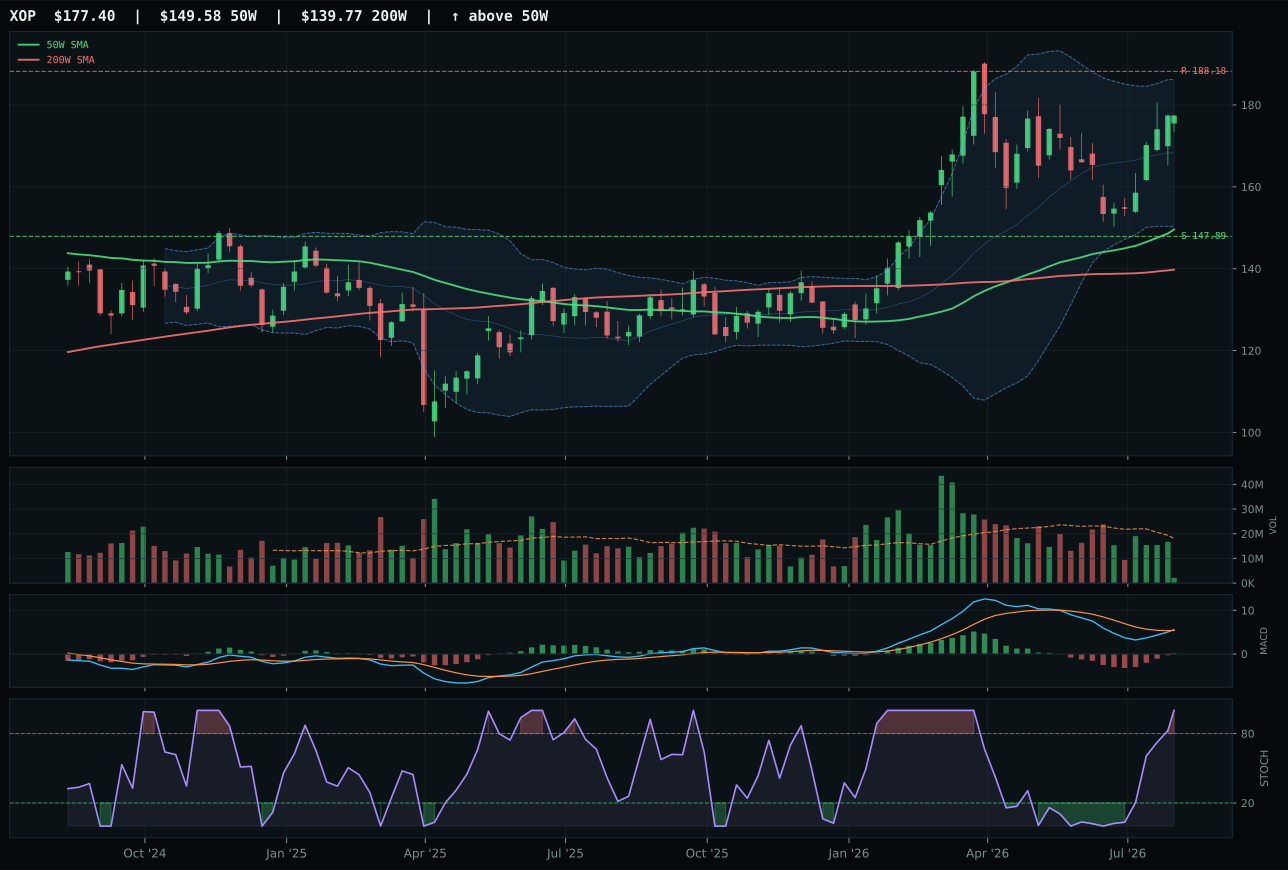
XOP has a vertical extension profile with -3.2% 13-week relative strength versus SPY.
A failed hold above support would weaken the setup.
Actionable but governed by invalidation levels.
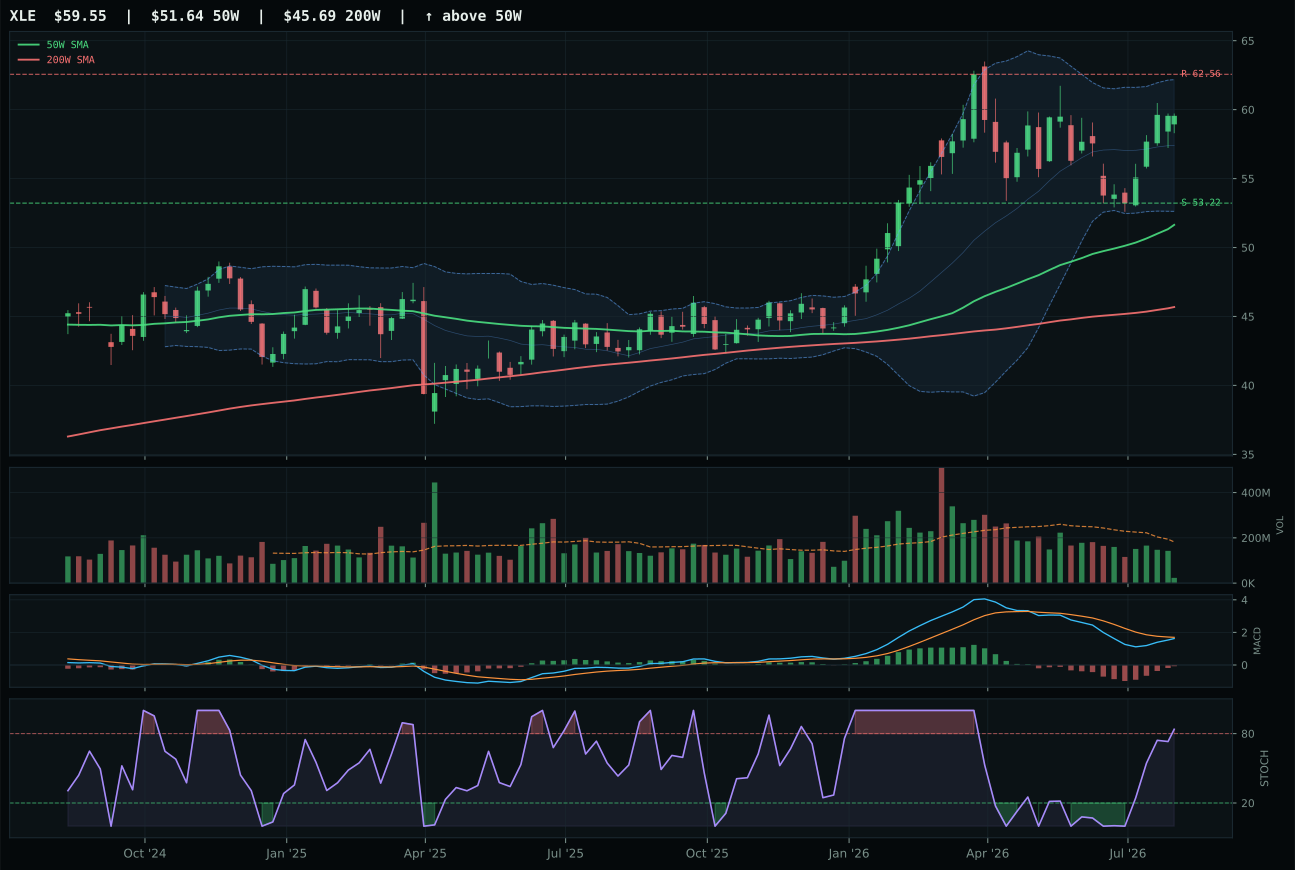
XLE has a vertical extension profile with -2.5% 13-week relative strength versus SPY.
A failed hold above support would weaken the setup.
Actionable but governed by invalidation levels.
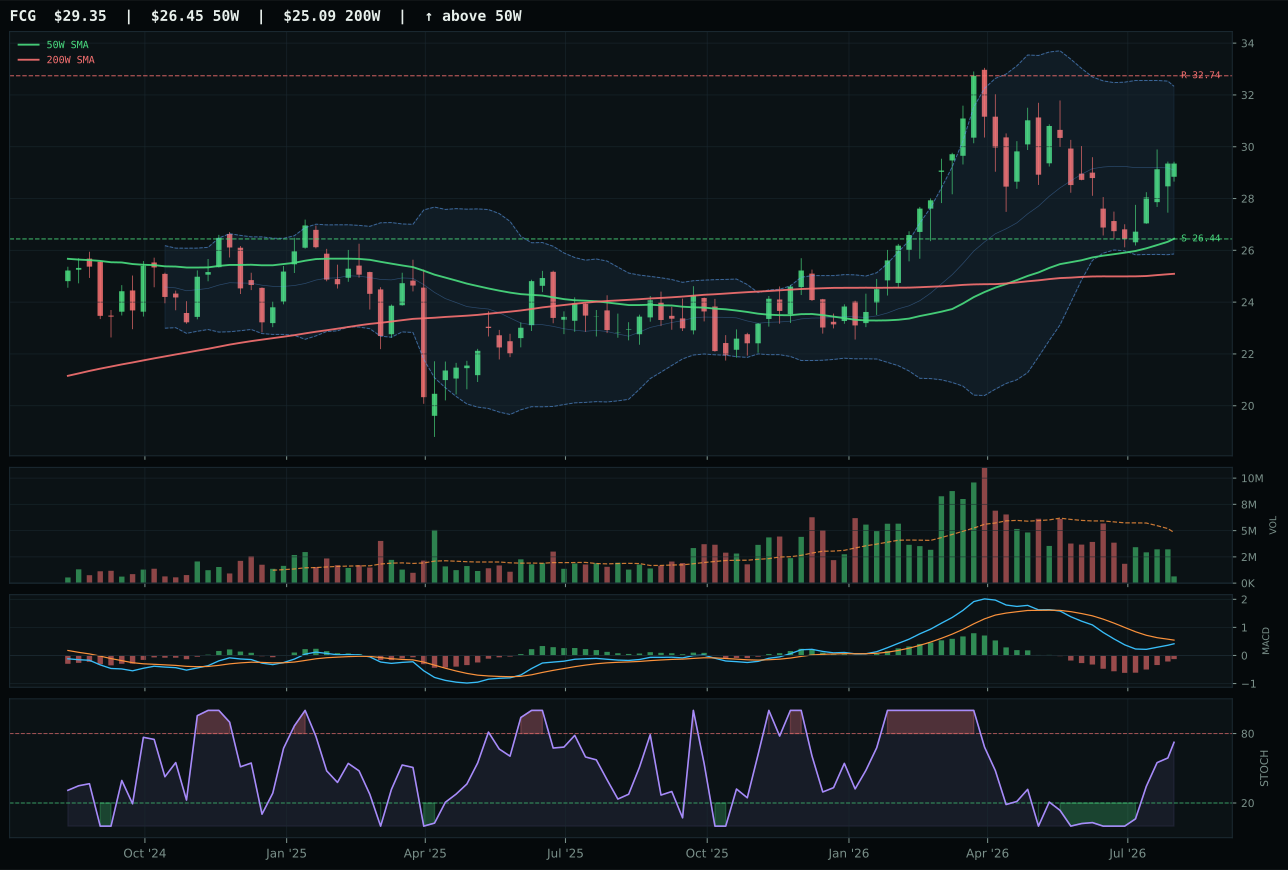
FCG has a neutral structure profile with -9.0% 13-week relative strength versus SPY.
A failed hold above support would weaken the setup.
Actionable but governed by invalidation levels.
XOP wins top-2 allocation because its 72.1 category score is the second-highest in the portfolio, and it achieves this despite a timing score of only 45/100 due to being extended 18.6% above the 50W. The win is powered by perfect trend (100.0/100) and dominant momentum confirmation (96.2/100): 13W return of 7.4%, 4W return of 11.9%, RS versus SPY of 6.1%, and bullish-improving MACD all confirm that energy exploration beta is being accumulated by macro allocators rotating into inflation hedges. XOP's vertical extension setup and overbought stochastic RSI at 1.00 are entry risks, not disqualifiers—the momentum score of 96.2 indicates that every buyer is profitable and new capital is still chasing the trade. FCG loses because its MACD is bearish but improving (vs bullish and improving), its category-relative strength is -5.4% (vs +0.5%), and its structure is neutral rather than vertical extension. The 3.7-point category score gap between XOP's 72.1 and the 72.1 basket-level score reflects XOP's dominance in the 3/2/1 weighted ranking.
Traditional Energy receives 10% as top-2 overweight because its 72.1 score ranks second-highest in the portfolio, and macro fit of 88.0/100 is exceptional. Energy scarcity at +16, Stagflation Risk helping by +10, inflation pressure at +10, supply shortage at +9, and real asset sponsorship at +7 create a dominant narrative: the market is pricing energy as a permanent inflation hedge in a transition regime where supply constraints will not be resolved quickly. XOP's 7.4% 13W return and 6.1% SPY RS confirm that capital is flowing into the thematic. The allocation split 10%/10% between Energy (XOP) and Agriculture (VEGI) reflects a decision to remain equally weighted across the two highest-scoring real-asset categories, preventing overconcentration while capturing both the energy scarcity and food security stories. XOP's entry risk from vertical extension and overbought timing is mitigated by the fact that this is a multi-year structural trade, not a tactical bounce; new buyers at current prices are betting on $80–100/bbl oil staying structural. The allocation would rotate out if XOP breaks below the 147.89 support or if energy scarcity descriptor flips to inactive status.
Technology — CIBR
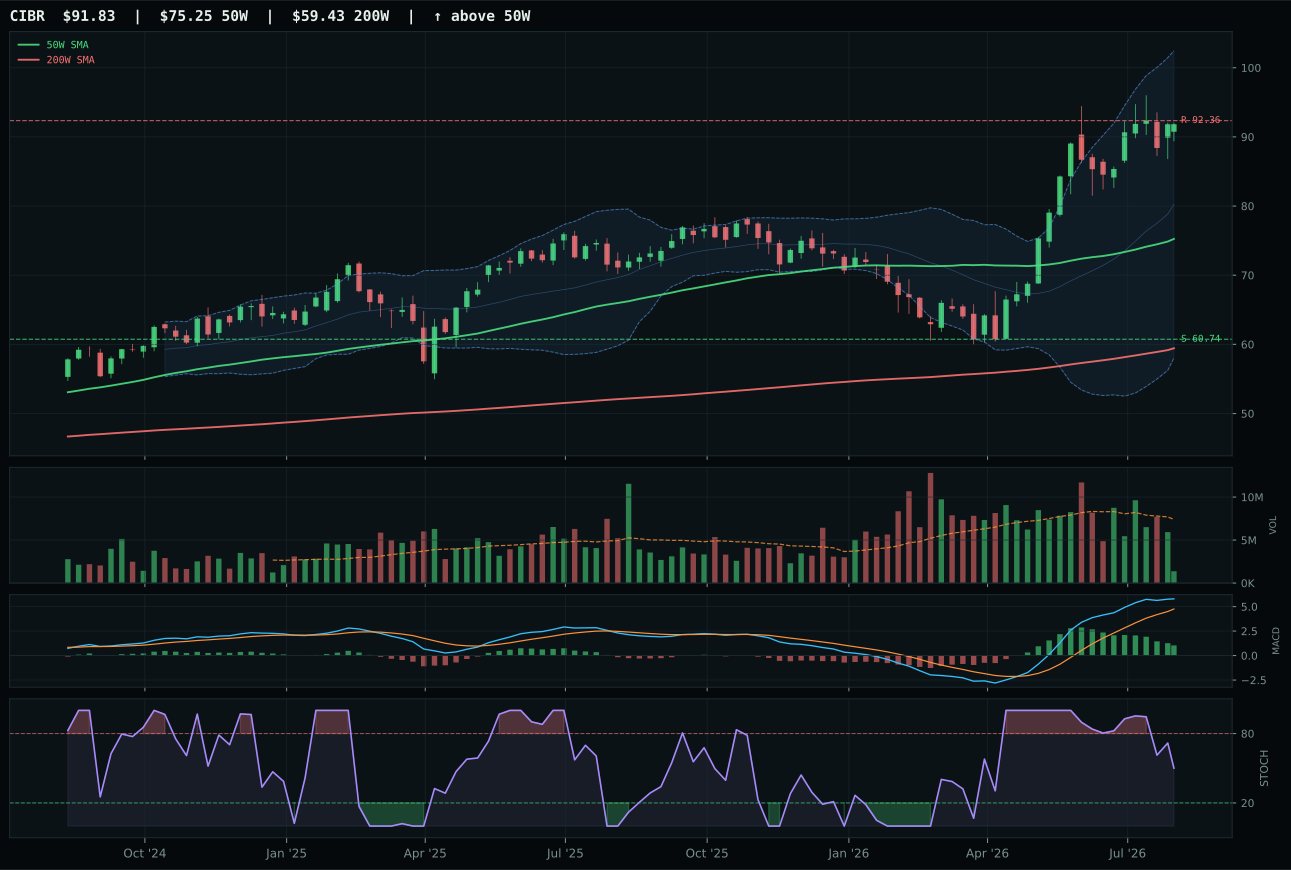
CIBR has a vertical extension profile with 29.9% 13-week relative strength versus SPY.
A failed hold above support would weaken the setup.
Actionable but governed by invalidation levels.
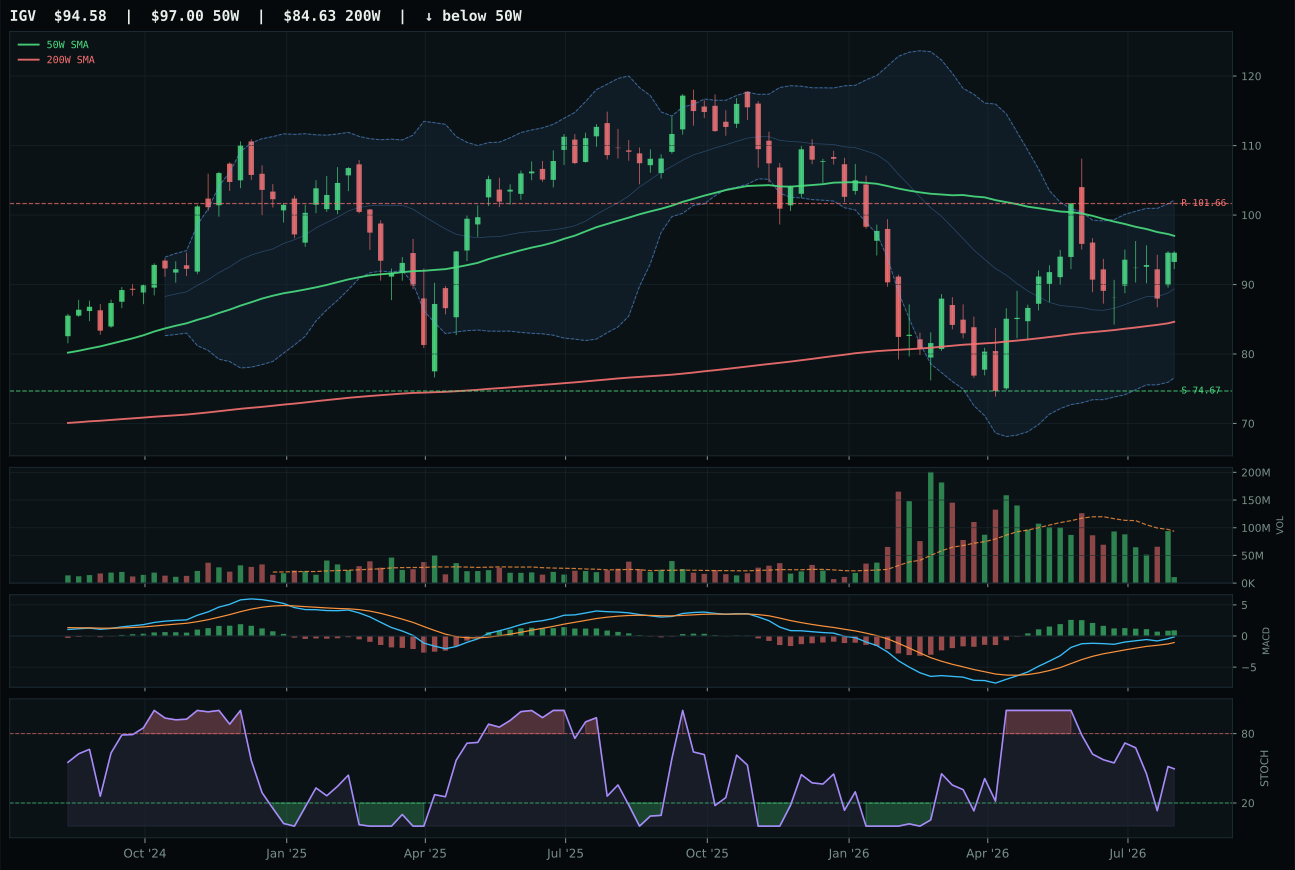
IGV has a compression near 50W profile with 5.5% 13-week relative strength versus SPY.
A failed hold above support would weaken the setup.
Actionable but governed by invalidation levels.
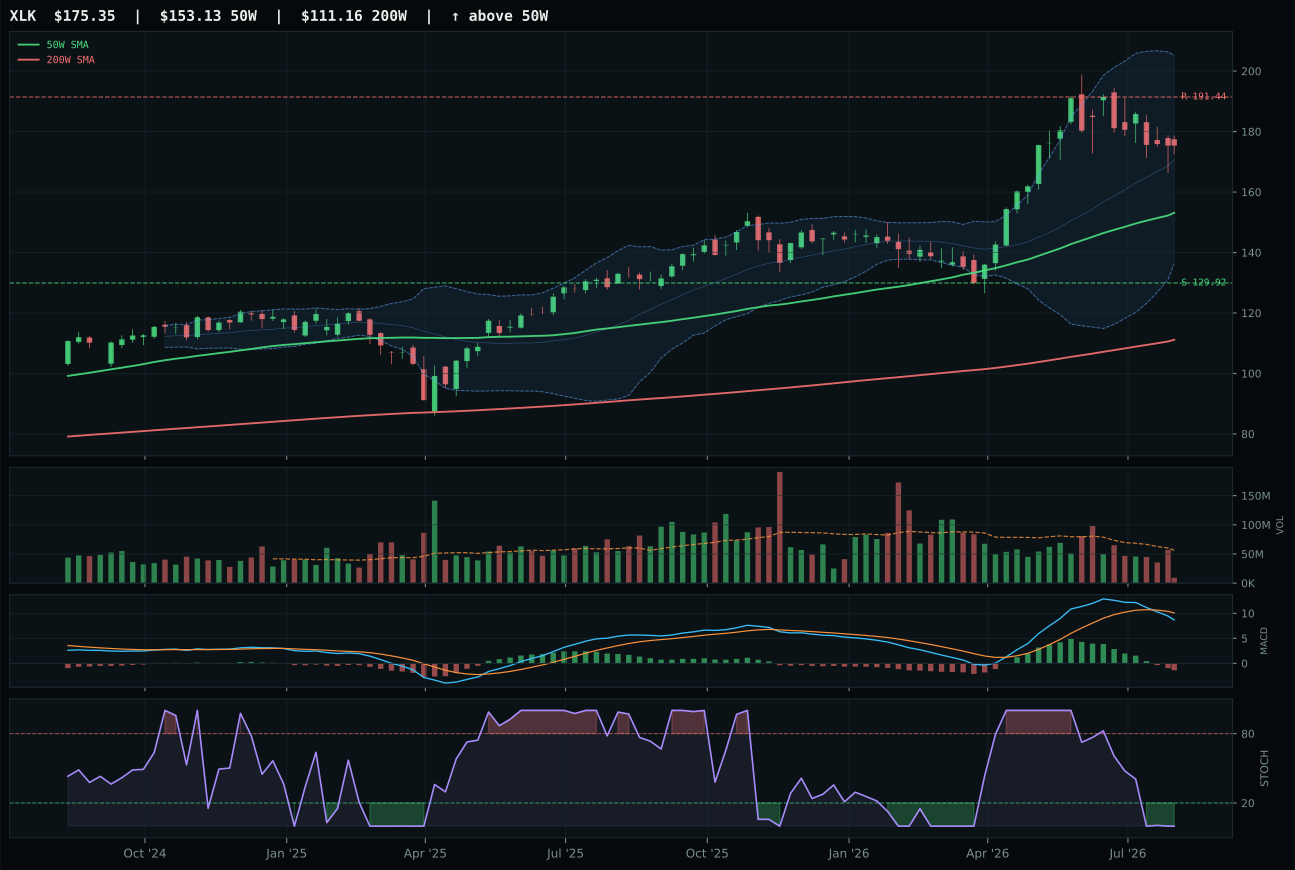
XLK has a vertical extension profile with 4.7% 13-week relative strength versus SPY.
A failed hold above support would weaken the setup.
Actionable but governed by invalidation levels.
IGV wins the category because its reset structure near the 50W offers a cleaner entry than CIBR's extended vertical momentum. With price at -2.5% from the 50W and stochastic RSI rising mid-zone at 0.50, IGV presents a compression setup with defined timing that rewards patience; CIBR sits 22.0% above the 50W with stochastic RSI already falling/neutral and overbought momentum momentum at 0.89+, putting new buyers at maximum disadvantage. The 2.5-point gap between IGV's composite 74 and CIBR's 72 reflects IGV's superior timing score (100 vs 48), which matters more in a mixed macro regime where liquidity is available but growth is decelerating. CIBR's 20.6% RS versus SPY looks impressive on paper but masks a vertical extension setup where risk/reward is asymmetric to the downside: 92.36 resistance offers only 6.0% upside while the 60.74 support sits 27.4% lower, versus IGV's more balanced 26.7% downside to 74.67 support against 7.0% upside compression.
Technology earns 5% allocation as a tier-2 holding despite a weak category-level macro fit of 36.0/100, which reflects stagflation headwinds that penalize both duration risk (growth multiples compress in high-rate environments) and execution risk (capex cycles slow). The active macro descriptors—liquidity expansion at +9 and credit stress at -7—create cross-currents that neutralize each other in the category ranking. At 49.1 category score, Technology ranks below both Agriculture (63.3) and Energy (72.1), which benefit from real-asset tailwinds and scarcity premia; it also trails Defense (50.8), which captures geopolitical duration. The allocation holds because IGV's timing setup and relative strength versus the category median (0.0%) position it to participate if liquidity expansion persists, but the thin volume participation at 0.12x 20W average and 13W return of only 3.8% signal that institutional sponsorship has not yet arrived. An upside breakout above 101.66 resistance with volume expansion above 0.20x average would justify promotion to top-2 tier.
Defense & Aerospace — ITA
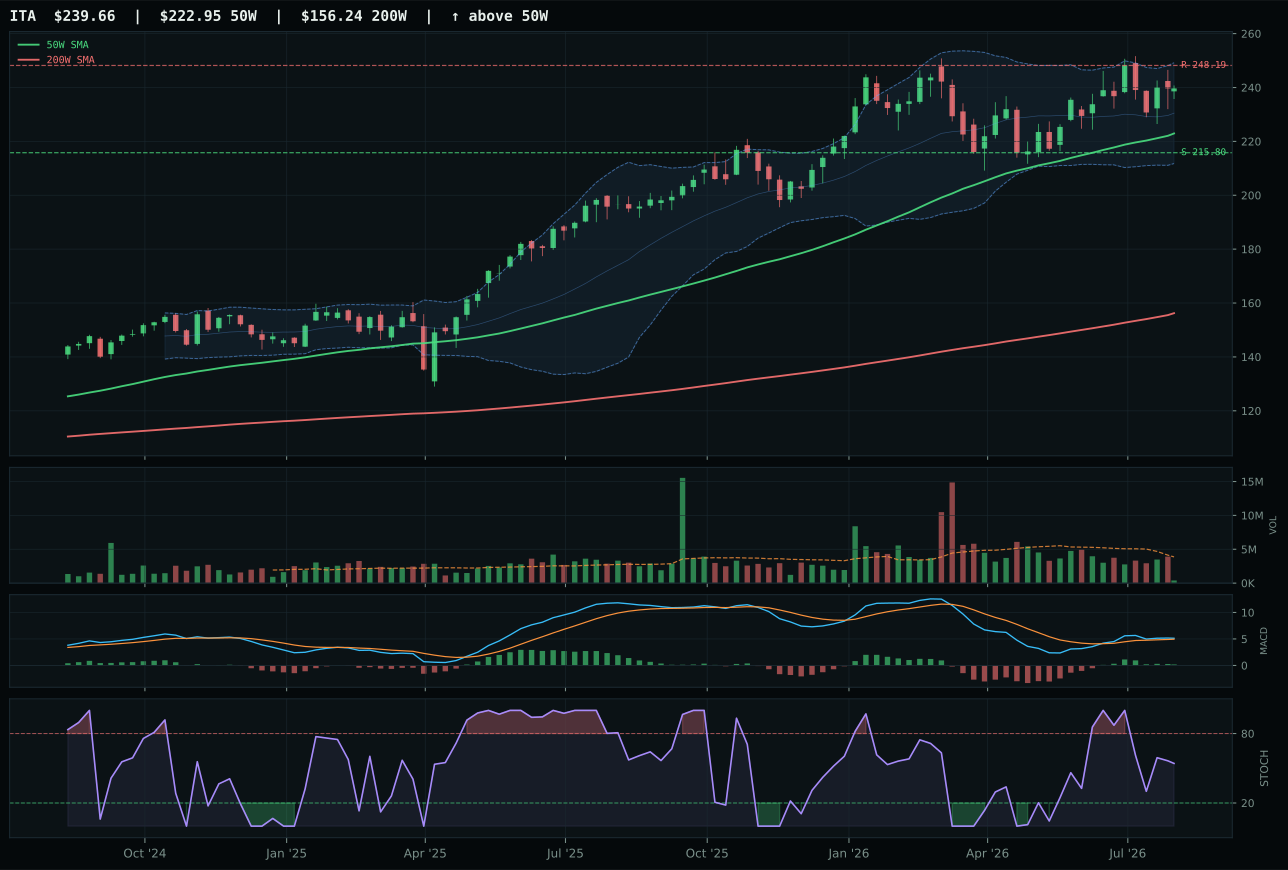
ITA has a neutral structure profile with 7.2% 13-week relative strength versus SPY.
A failed hold above support would weaken the setup.
Actionable but governed by invalidation levels.
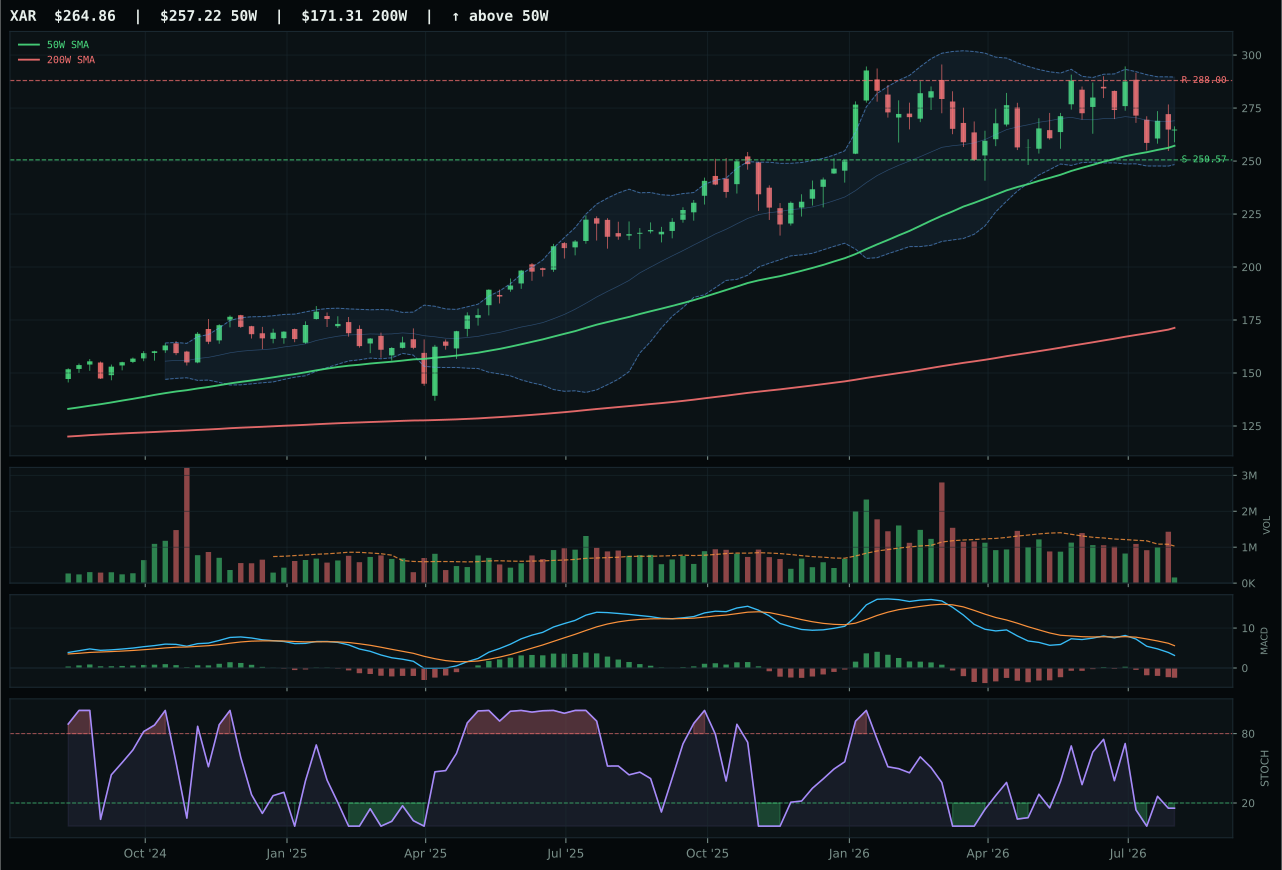
XAR has a neutral structure profile with -0.4% 13-week relative strength versus SPY.
A failed hold above support would weaken the setup.
Actionable but governed by invalidation levels.
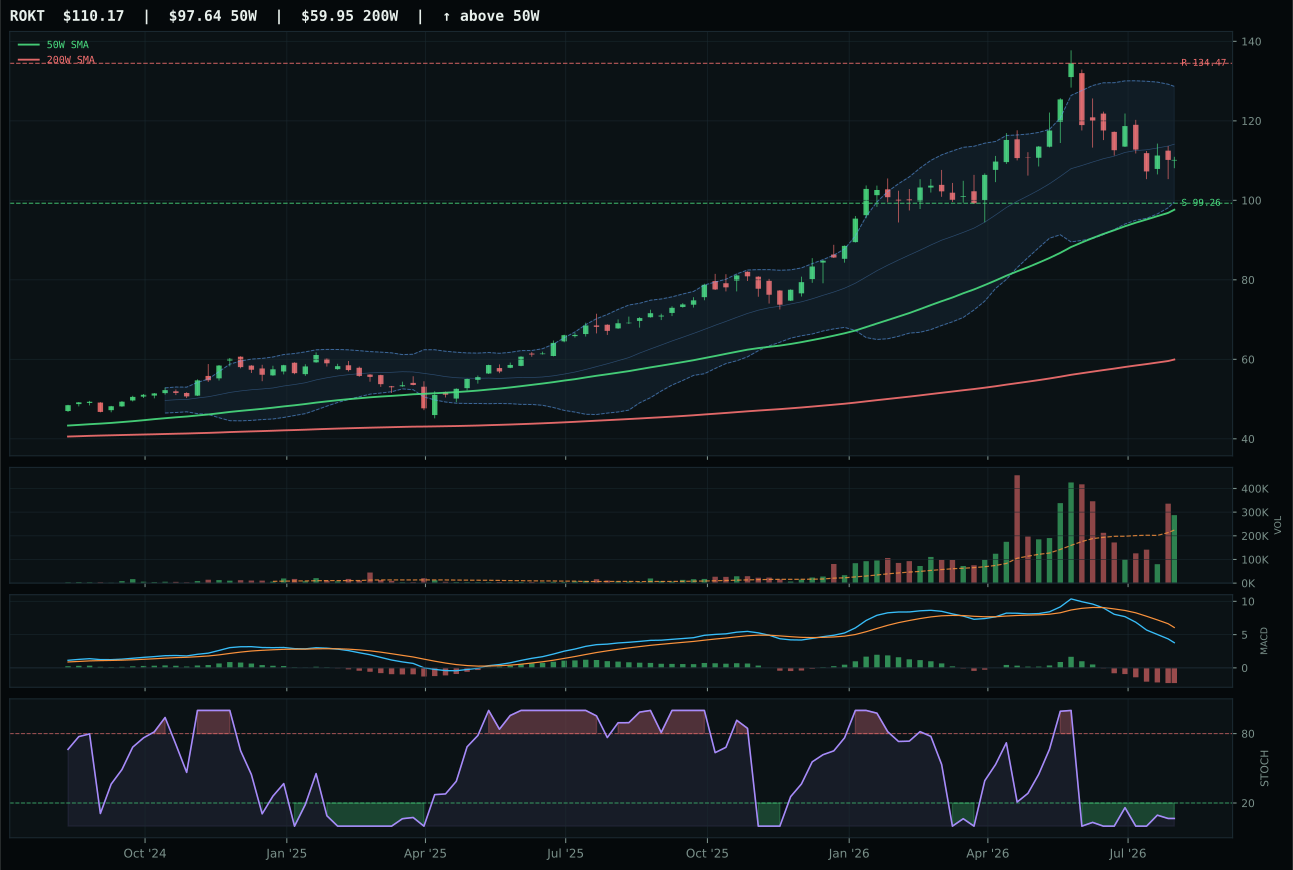
ROKT has a neutral structure profile with -4.2% 13-week relative strength versus SPY.
A failed hold above support would weaken the setup.
Actionable but governed by invalidation levels.
ITA wins cleanly because it holds above both the 50W and 200W with price at 7.5% extension and perfect trend confirmation (100.0/100) while maintaining bullish momentum that MACD confirms, even if flattening. XAR's bearish/weakening MACD and stochastic RSI at oversold turn up mark it as a technical failure point, not a leadership candidate; it sits compressed near the 50W at 288.00 resistance but carries no directional conviction, as evidenced by its -1.5% RS versus SPY and 0.0% category-relative strength. ITA's 7.4% category-relative strength and 6.0% SPY RS tell the story of steady accumulation by defense-focused allocators who are pricing in geopolitical duration. The 4.4-point gap between ITA's composite 80 and XAR's 76 is driven by ITA's trend dominance (100 vs 80), momentum confirmation (80.2 vs 29), and volume-price persistence (73.2 vs 41). ITA's 13W return of 7.2% is modest but real, whereas XAR's -0.2% return with compression near support signals exhaustion rather than base-building.
Defense & Aerospace earns 5% allocation as tier-2 despite a positive 68.0/100 macro fit that suggests it should rank higher, but its 50.8 category score falls behind Agriculture and Energy in the actual capital allocation weighting. The macro regime actively favors this sector: Stagflation Risk helps by +6 (geopolitical tensions support defense spending), Transition/Mixed helps by +3 (durability trades over growth), and broad market bear adds +3 (defensive characteristics appeal). Dollar pressure at +3 is a secondary tailwind for U.S. defense contractors with global revenue streams. The category's placement at tier-2 reflects a rebalancing decision rather than technical weakness—ITA's trend score of 100.0 and 7.2% 13W return are solid, but the allocation is capped at 5% because the portfolio is already overweight real assets and scarcity trades (Energy at 50%, Agriculture at 10%). ITA would graduate to top-2 tier if XOP energy momentum stalled or if gold found a bottom and released capital. For now, the holding captures geopolitical duration at a disciplined size.
Utilities & Infrastructure — IGF
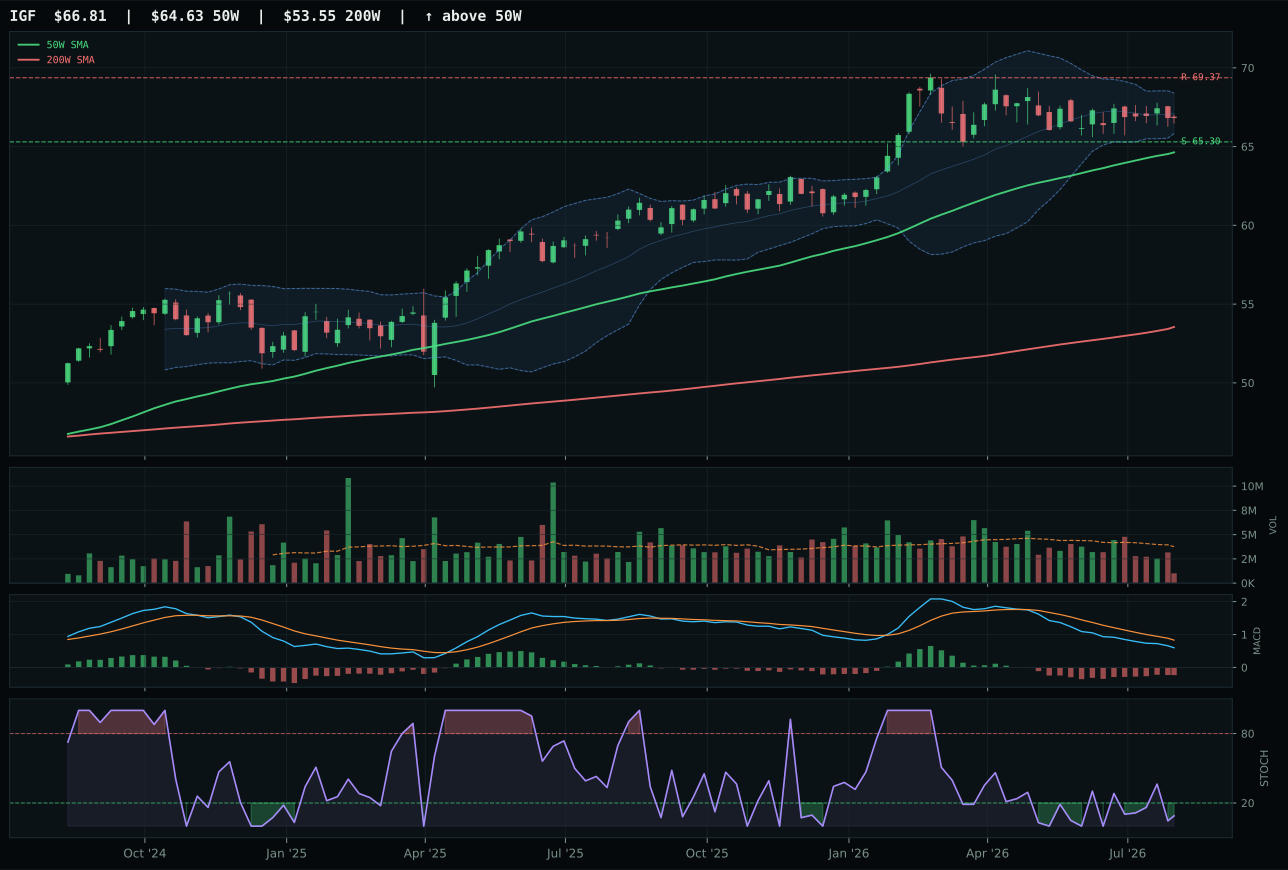
IGF has a pullback into support profile with -5.6% 13-week relative strength versus SPY.
A failed hold above support would weaken the setup.
Actionable but governed by invalidation levels.
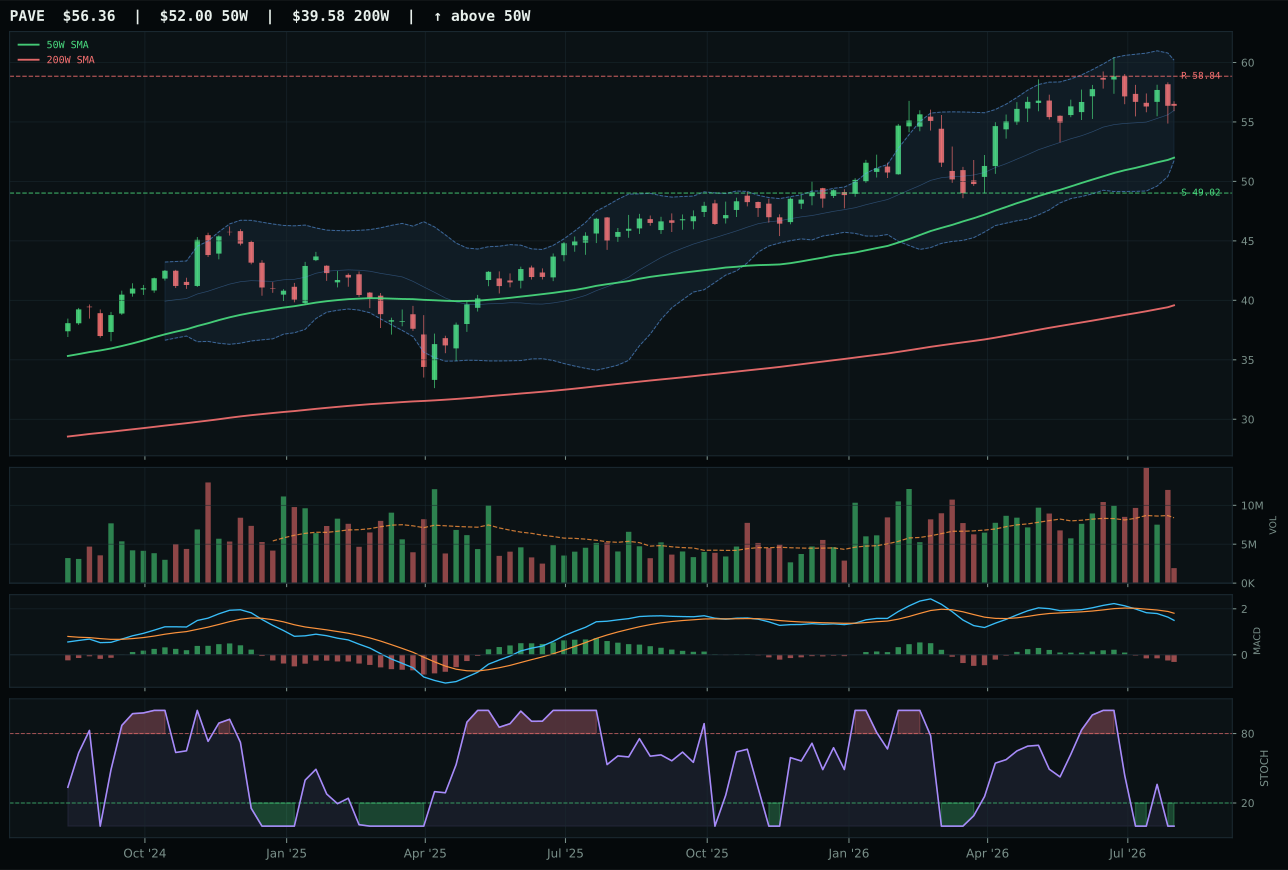
PAVE has a neutral structure profile with -4.2% 13-week relative strength versus SPY.
A failed hold above support would weaken the setup.
Actionable but governed by invalidation levels.
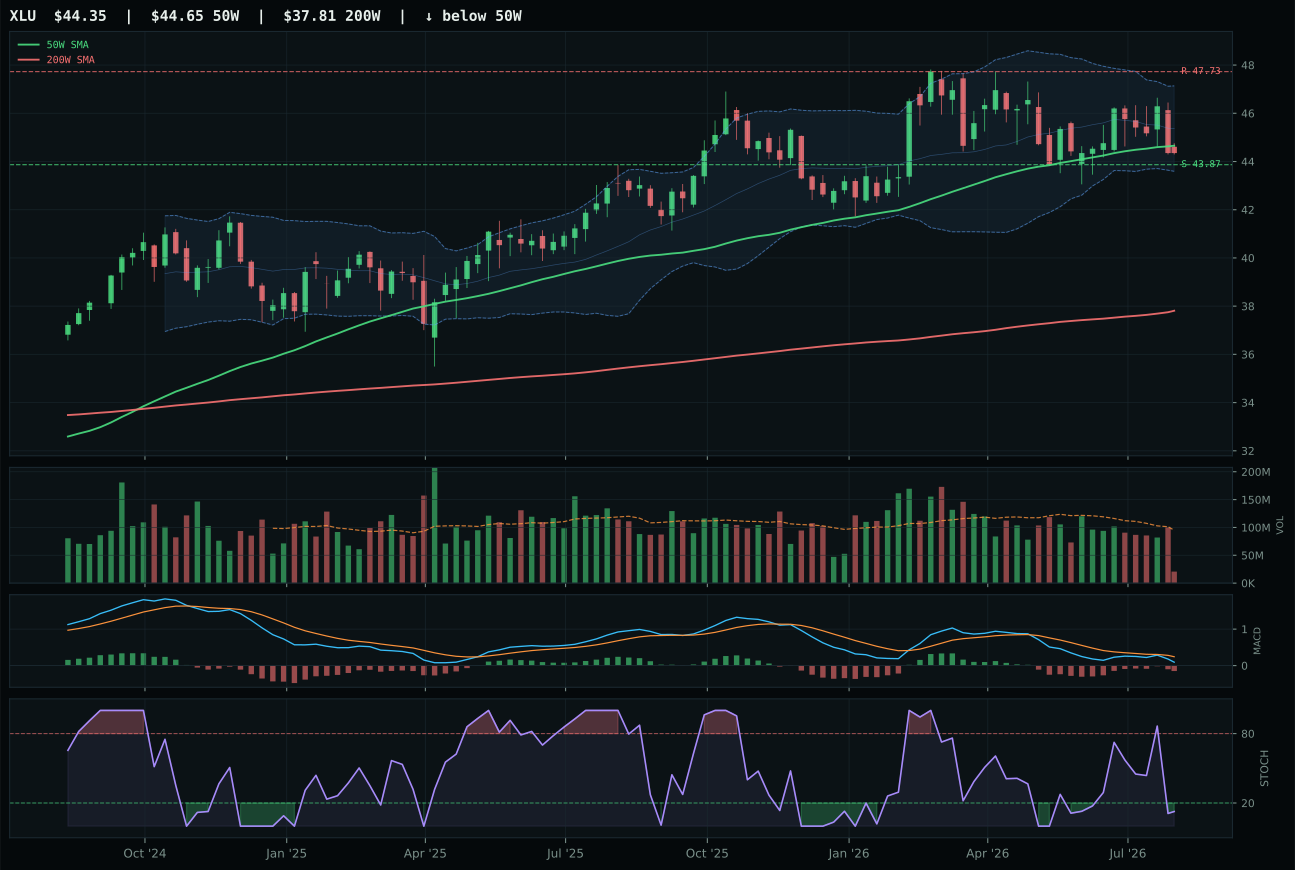
XLU has a pullback into support profile with -8.4% 13-week relative strength versus SPY.
A failed hold above support would weaken the setup.
Actionable but governed by invalidation levels.
IGF wins cleanly because it pullsinto support near 65.30 with perfect timing (100.0/100), excellent risk/reward (73.7/100), and strong structure (74.4/100), while PAVE sits further extended at 8.4% from the 50W with worse timing (70 vs 100), worse risk/reward (50.1 vs 73.7), and worse structure (72.3 vs 74.4). IGF's 3.4% distance from the 50W and stochastic RSI oversold at 0.09 offer a tighter entry than PAVE's 8.4% extension with stochastic also oversold but from a worse price level. IGF's MACD bearish but improving reads more constructively than PAVE's bearish/weakening MACD. Both show weak momentum (13W returns near -0.3% to -0.8% and SPY RS near -1.5% to -2.0%), indicating no institutional accumulation, but IGF's structure is technically superior for tactical entry.
Utilities & Infrastructure receives 5% allocation as tier-2 despite a 58.0/100 macro fit, placing it in the lower tier of capital priority. The macro regime offers mixed signals: Transition/Mixed helps by +4, growth slowdown helps by +6 (defensive beta appeal), and broad market bear helps by +4, but inflation pressure at -6 and dollar pressure at -4 create offsetting headwinds. Infrastructure trades on capex expectations and utility multiples; growth slowdown favors defensive earnings stability, but inflation pressure and rising rates compress valuations. The 43.5 category score reflects this tension: IGF is technically clean and timed well, but it lacks the scarcity premium or inflation leverage that Energy and Agriculture capture. Allocation holds at 5% as a portfolio ballast—utilities offer yield and defensive beta in a transition regime—but it does not warrant top-2 status. IGF would earn promotion if the category score reached above 55 and macro fit improved above 65, signaling either that infrastructure capex expectations are being repriced higher or that rate expectations have stabilized.
Industrial Metals — COPX
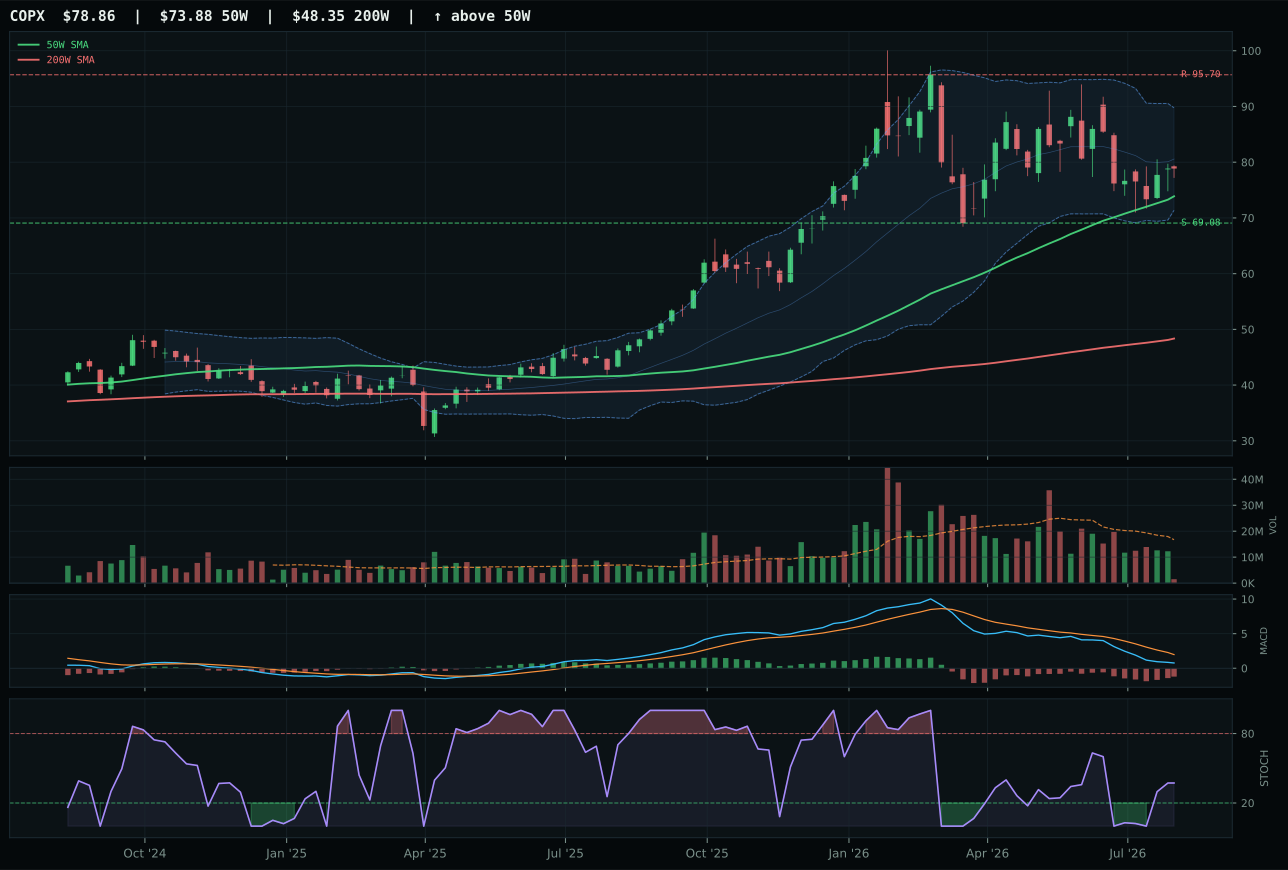
COPX has a neutral structure profile with -3.9% 13-week relative strength versus SPY.
A failed hold above support would weaken the setup.
Actionable but governed by invalidation levels.
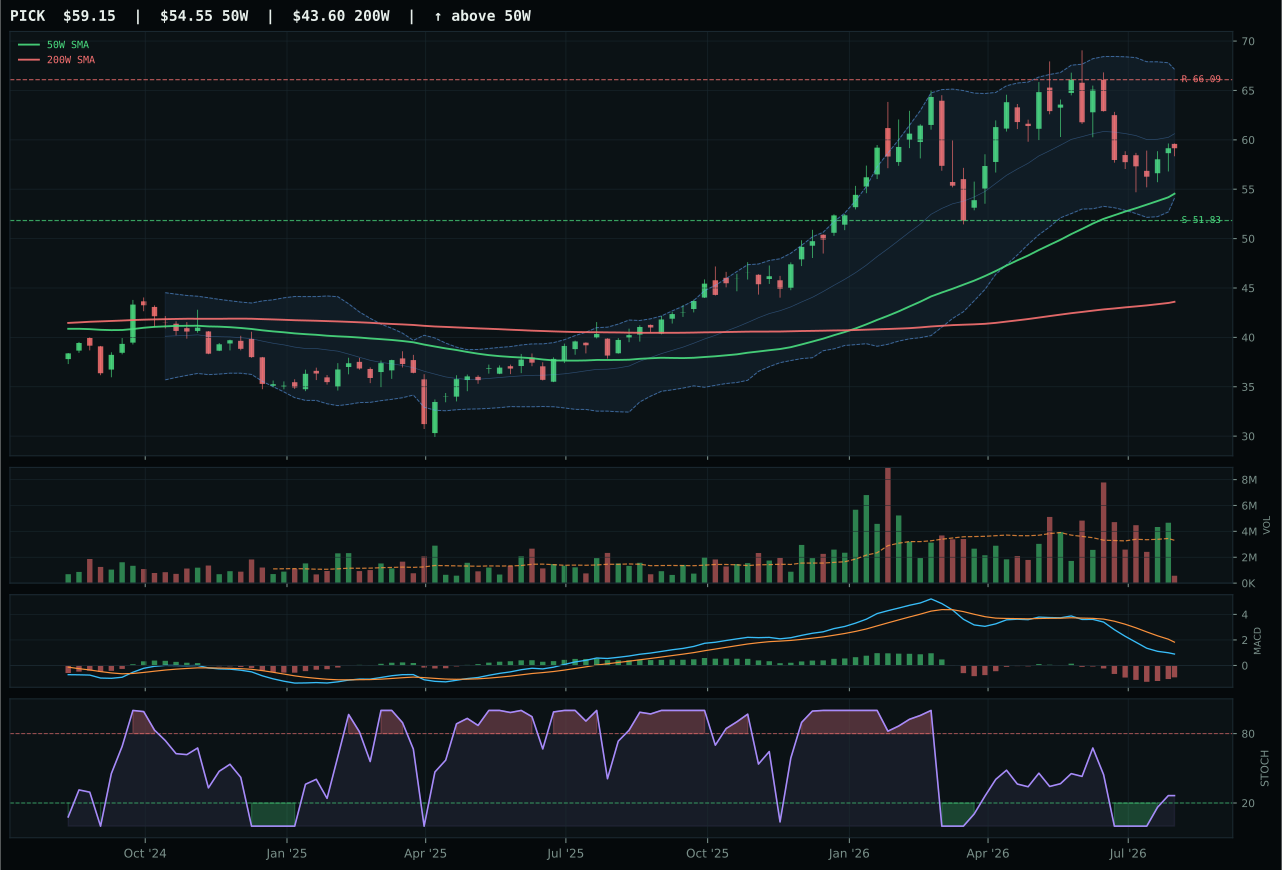
PICK has a neutral structure profile with -7.3% 13-week relative strength versus SPY.
A failed hold above support would weaken the setup.
Actionable but governed by invalidation levels.
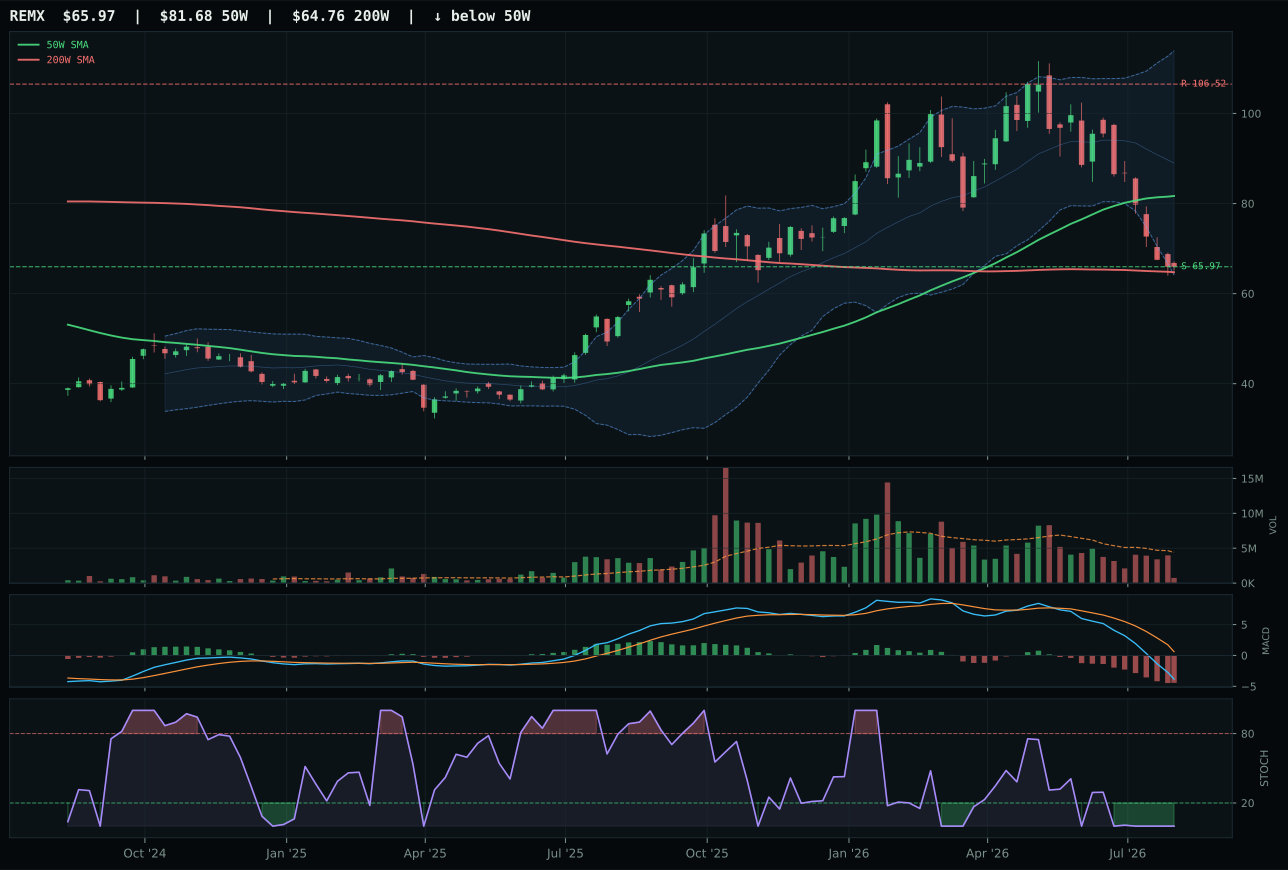
REMX has a pullback into support profile with -41.7% 13-week relative strength versus SPY.
A failed hold above support would weaken the setup.
Actionable but governed by invalidation levels.
COPX wins by a 1.7-point margin over PICK—both are mediocre setups, but COPX's timing score of 90 edges PICK's 83, and stochastic RSI rising mid-zone at 0.37 confirms that COPX's rebound has slightly more momentum than PICK's identical rising mid-zone reading. Neither ETF is being accumulated; both show 13W returns around -8.3% to -8.8% and category-relative strength near zero, indicating neutral positioning. COPX's 6.7% distance from the 50W and Fib middle retracement / decision zone (79.14) offer a cleaner reset than PICK's setup, which sits in upper retracement / momentum zone (63.09) closer to the 66.09 resistance. Risk/reward is nearly identical (60.4 vs 58.4), but COPX's 0.5% category-relative strength versus PICK's 0.0% tips the scale. Both carry MACD bearish but improving and thin volume participation, meaning this is a technical bounce in a fundamentally weak category, not a conviction trade.
Industrial Metals receives 5% allocation as tier-2 despite strong macro tailwinds, ranking below top-2 categories because the 37.9 category score reflects poor technical execution in both the category representative (COPX at 57.9 reasoned ETF score) and the broader basket. Macro fit of 56.0/100 is respectable: metals scarcity at +14, commodity breadth positive at +10, and real asset sponsorship at +6 are solid, but growth slowdown at -10 and credit stress at -7 create a meaningful headwind that reduces the category's risk-adjusted appeal. The Transition/Mixed regime does not favor cyclical copper demand as strongly as it favors energy scarcity or agricultural supply constraints. Allocation holds at 5% because copper's industrial-demand linkage and scarcity positioning (EV transition demand, renewable energy grid expansion) offer portfolio exposure to secular capex themes. However, COPX's -9.5% SPY RS and -8.3% 13W return signal that copper miners are not being repriced higher by the market despite macro tailwinds. Allocation would double to 10% if COPX reaches above 95.70 resistance on volume above 0.15x average, confirming that institutional rotation into industrial metals is underway.
Precious Metals — GLD
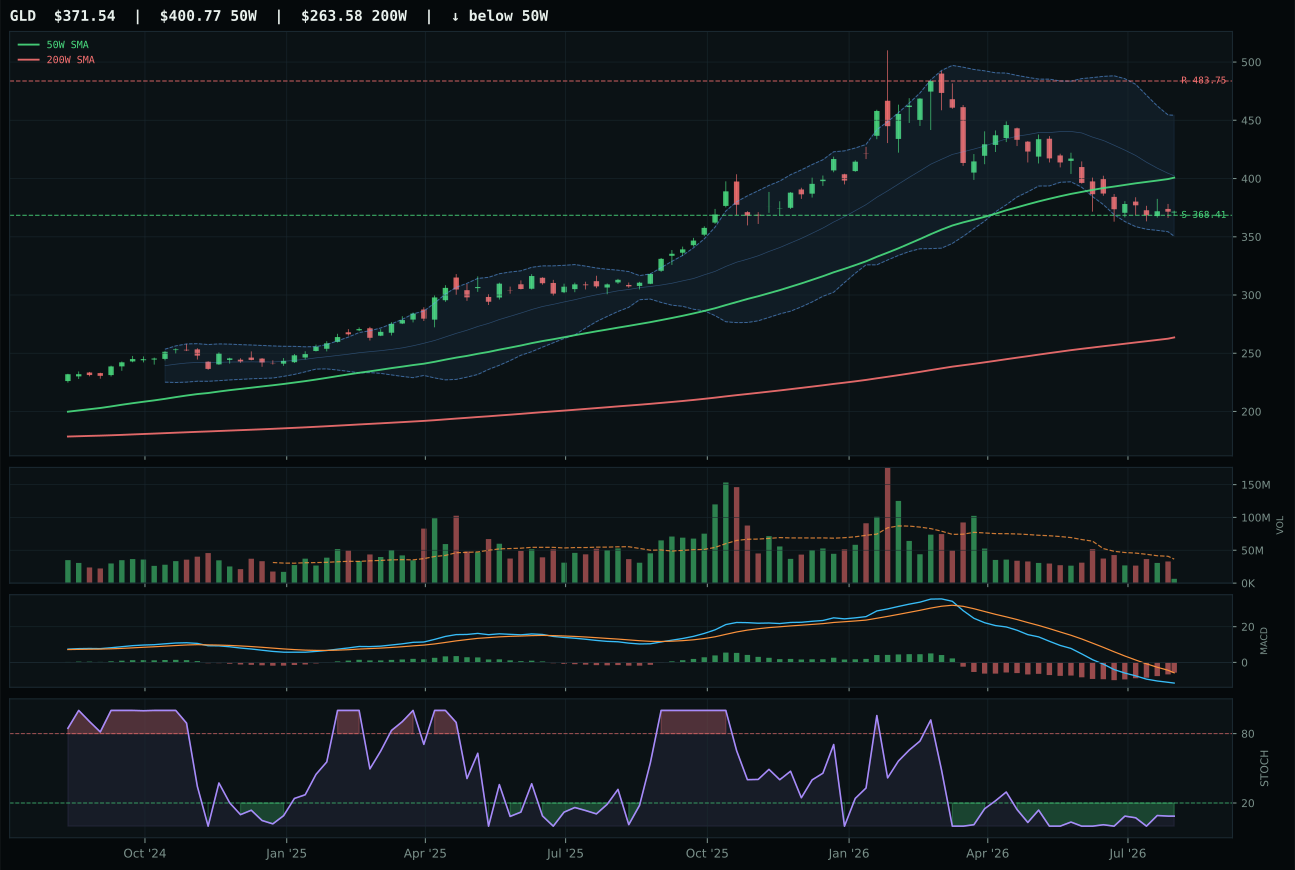
GLD has a pullback into support profile with -15.9% 13-week relative strength versus SPY.
A failed hold above support would weaken the setup.
Actionable but governed by invalidation levels.
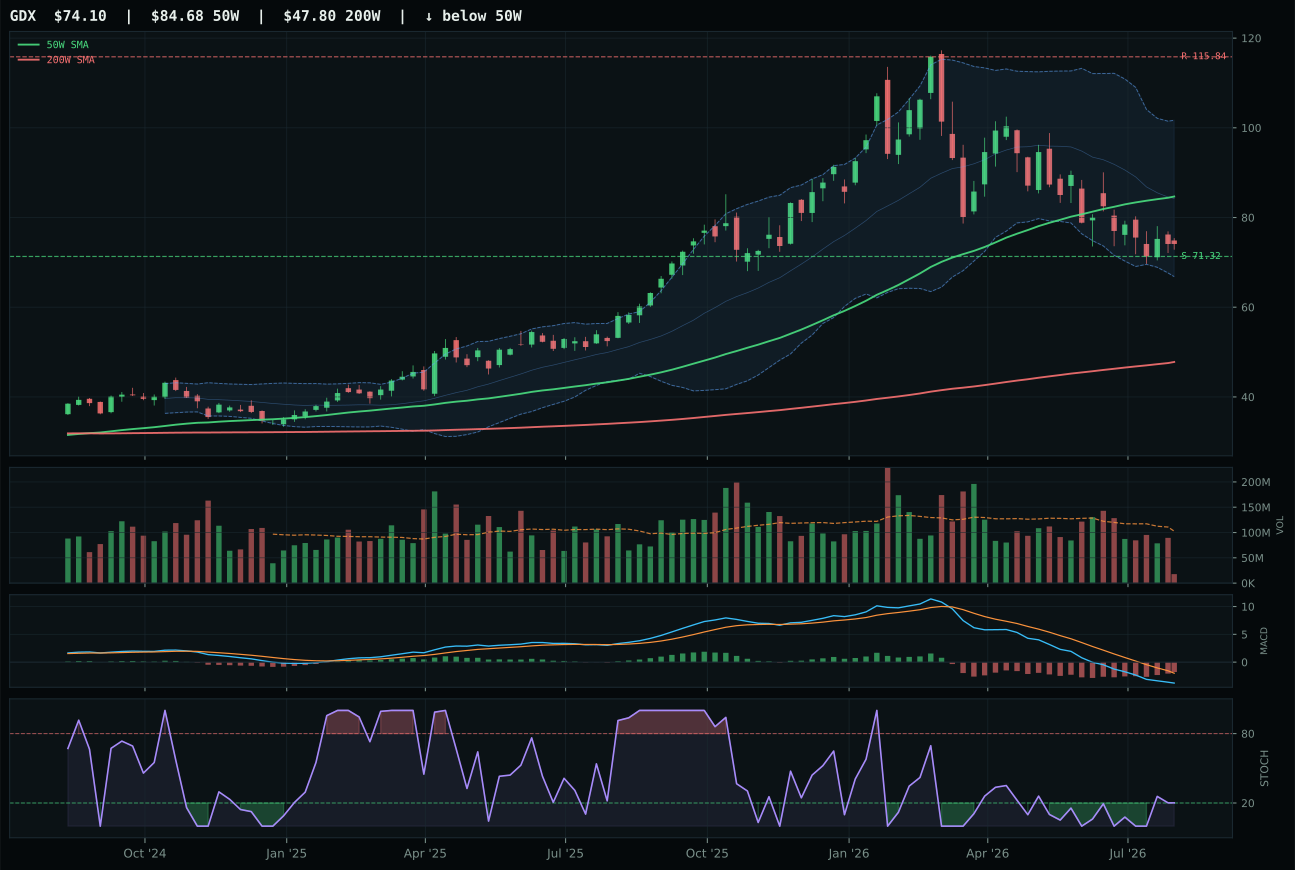
GDX has a pullback into support profile with -18.6% 13-week relative strength versus SPY.
A failed hold above support would weaken the setup.
Actionable but governed by invalidation levels.
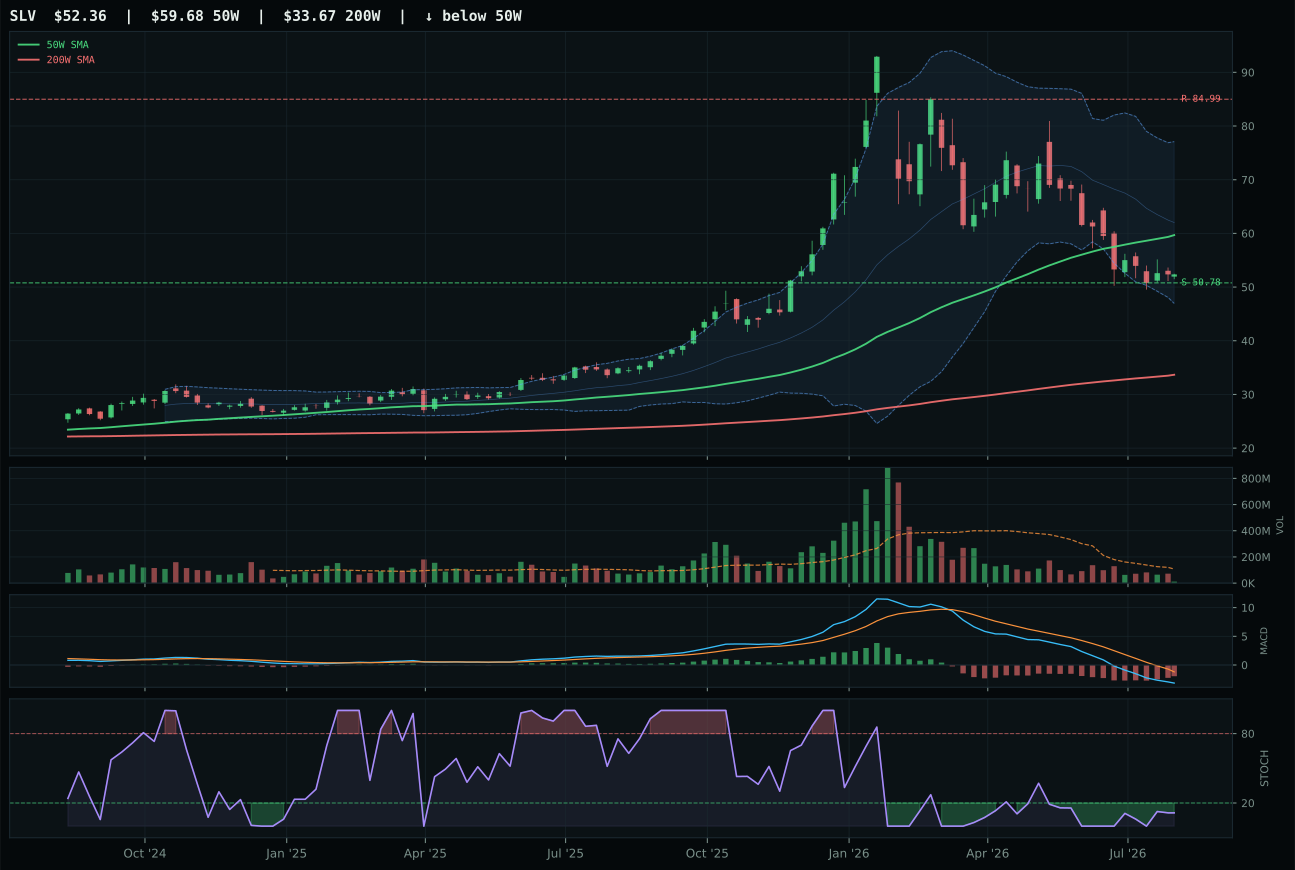
SLV has a pullback into support profile with -27.0% 13-week relative strength versus SPY.
A failed hold above support would weaken the setup.
Actionable but governed by invalidation levels.
GLD wins on a narrow technical edge despite both it and GDX being deeply underwater on 13W performance (-14.3% and -21.7% respectively). The win is determined by timing geometry: GLD sits -7.3% from the 50W in deep retracement / value zone (Fib 0.618) with stochastic RSI oversold turn up at 0.09, versus GDX's oversold stochastic at rising mid-zone from a less extreme price location. GLD's timing score maxes at 100 because the setup rewards patience—the -23.2% upside compression to 483.75 resistance and only 0.8% downside to 368.41 support create a risk asymmetry that makes this a defined trade, not a hope play. GDX loses 20 timing points (80 vs 100) because rising mid-zone stochastic RSI signals rebound momentum already underway, which reduces the margin of safety for fresh entries at higher prices. Both carry category-relative strength of 7.3% and 0.0%, meaning neither is experiencing genuine institutional accumulation—these are oversold technicals in a bear regime, suitable for portfolio hedges but not convictions.
Precious Metals receives 5% allocation as tier-2 despite a positive 61.0/100 macro fit, placing it behind Agriculture, Energy, and Defense in capital priority. The macro regime is mixed: Stagflation Risk helps by +10 (inflation hedge), and liquidity expansion active at -2 is a mild headwind that reflects rising real rates crushing gold's carry economics. Dollar pressure at +3 is the only active tailwind beside stagflation, and it's weak. The category score of 39.9 reflects a broad technical breakdown in both gold and miners, with GLD at 55.0 reasoned ETF score and GDX at 42.2. Allocation holds at 5% because GLD's timing setup offers genuine value for tactical duration allocation—a portfolio need in transition regimes. However, gold's 13W return of -14.3% and SPY RS of -15.6% confirm that macro headwinds (rising real rates, dollar strength, recession hedging demand) remain dominant. Allocation would expand to 10% if either: (1) stochastic RSI bounces AND volume rises above 0.30x average confirming institutional entry, or (2) credit stress descriptor flips from active to inactive, signaling financial system stabilization that favors gold's monetary role.
Nuclear Energy — NLR
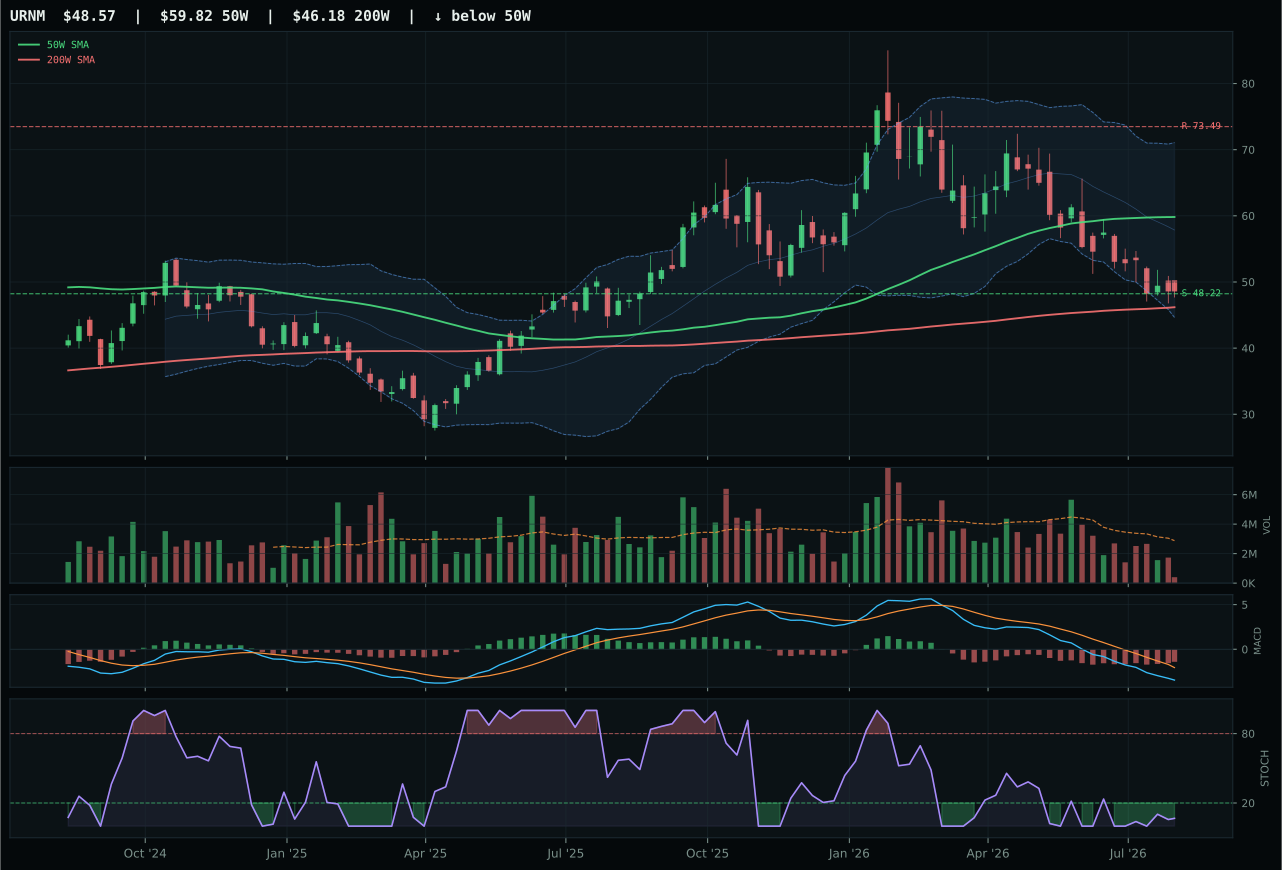
URNM has a pullback into support profile with -31.3% 13-week relative strength versus SPY.
A failed hold above support would weaken the setup.
Actionable but governed by invalidation levels.
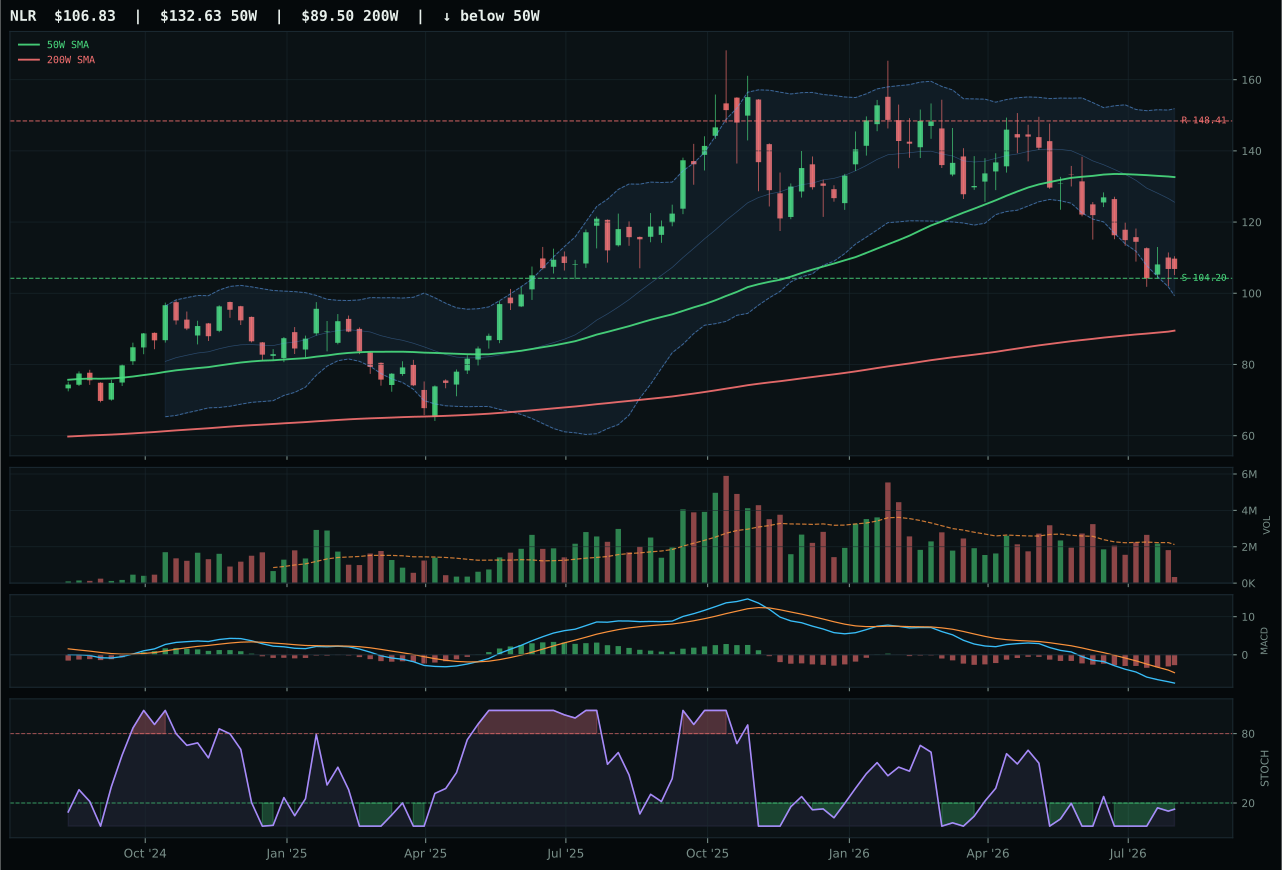
NLR has a pullback into support profile with -29.5% 13-week relative strength versus SPY.
A failed hold above support would weaken the setup.
Actionable but governed by invalidation levels.
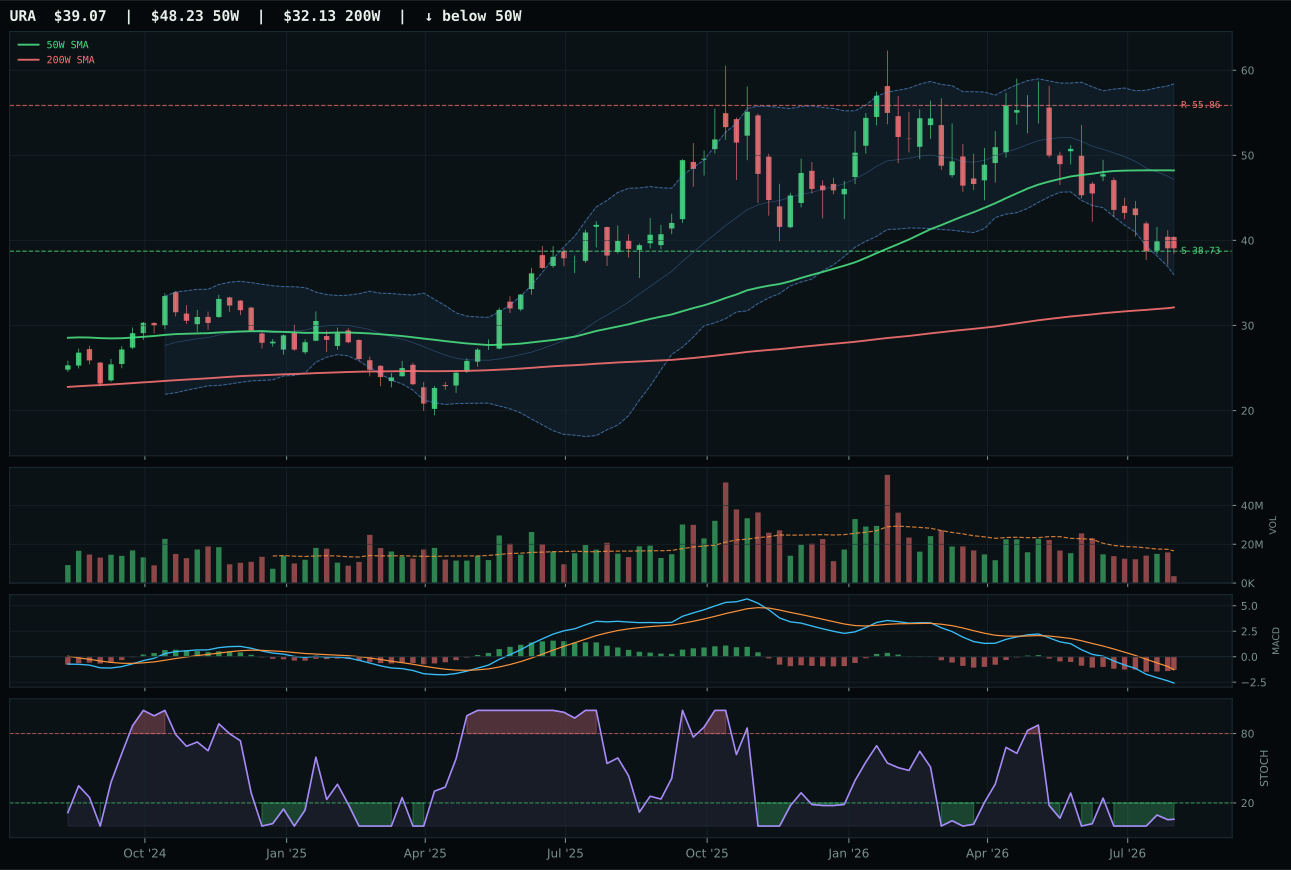
URA has a pullback into support profile with -33.7% 13-week relative strength versus SPY.
A failed hold above support would weaken the setup.
Actionable but governed by invalidation levels.
NLR wins by marginal structure quality (61.6 vs 59.7 for URNM) and category-relative strength (1.1% vs 0.0%), despite both ETFs showing identical catastrophic 13W returns around -24% to -25% and being deep underwater on momentum confirmation (0.0/100 for NLR). Neither is being accumulated; both are technical relief trades sitting in deep retracement / value zones with oversold stochastic RSI turning up. NLR's pullback-into-support structure at 104.20 offers a cleaner invalidation level than URNM's similar pullback, and NLR's MACD bearish but improving reads more constructively than URNM's identical MACD but from worse structural placement. The category-relative strength of 1.1% is noise, but it technically belongs to NLR's side of the ledger. Both sit in the near 52W low / repair zone (Fib 0.786), meaning this is capitulation bottom-fishing, not accumulation.
Nuclear Energy receives 5% allocation as tier-2 despite a respectable 68.0/100 macro fit that combines energy scarcity at +9, Stagflation Risk helping by +8, real asset sponsorship at +7, and inflation pressure at +3. These tailwinds should favor nuclear, but the 39.2 category score places it well below top-2 and below Defense (50.8) and Precious Metals (39.9), limiting allocation to 5%. Technical weakness is the culprit: NLR's -25.4% SPY RS, -24.2% 13W return, and zero momentum confirmation place it among the portfolio's worst performers. The category's ranking reflects a market skepticism about nuclear energy that macro tailwinds have not yet overcome—geopolitical uncertainty, regulatory risk, and capex cycle timing concerns weigh on sentiment despite structural supply advantages. Allocation holds at 5% because nuclear's long-cycle durability and zero-carbon positioning offer optionality on energy transition policy; this is a core holding awaiting macro cognition rather than a tactical trade. NLR would earn top-2 tier if MACD bullish-improving confirmation appears alongside a weekly close above 148.41 resistance on volume above 0.25x average, signaling institutional rotation into nuclear-specific energy exposure.
Emerging Markets — ILF
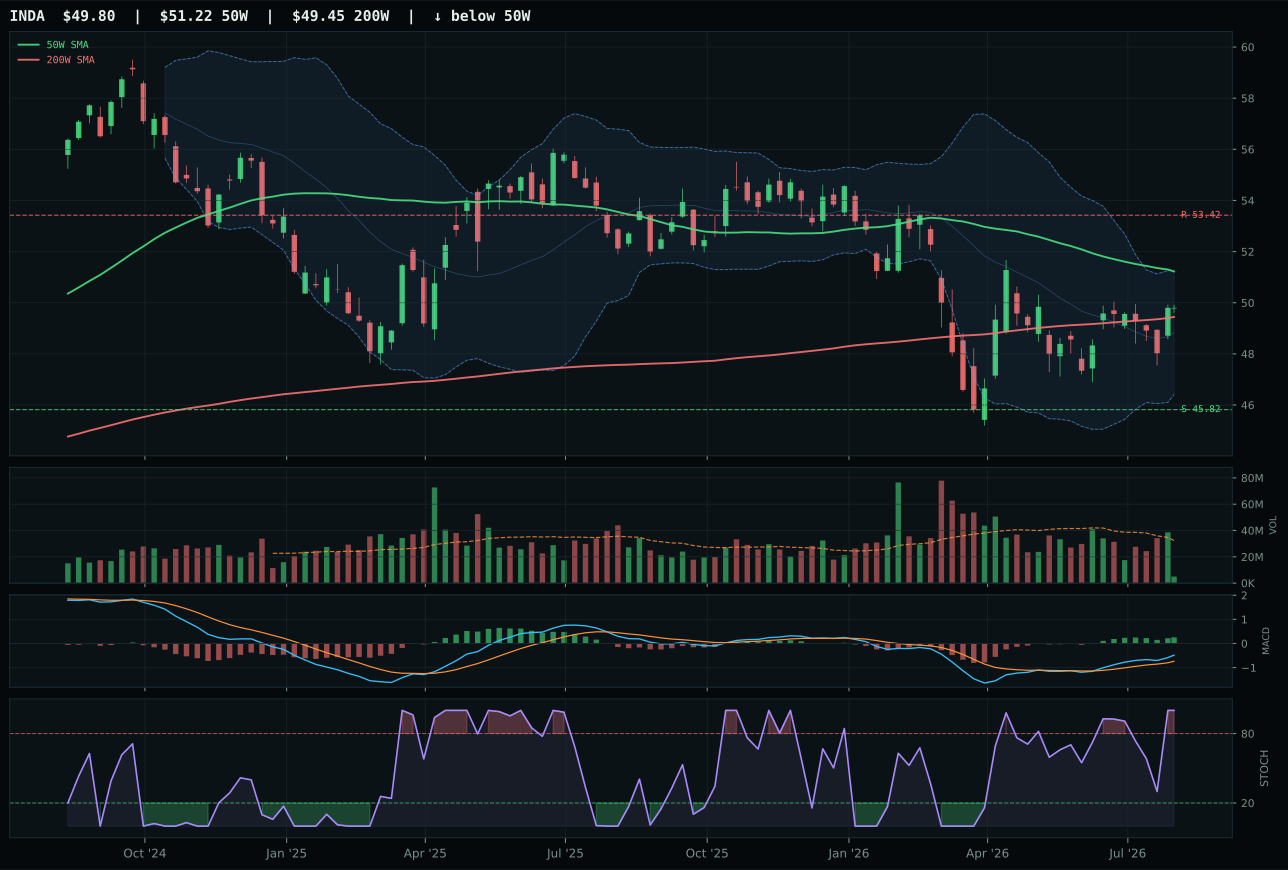
INDA has a compression near 50W profile with -2.3% 13-week relative strength versus SPY.
A failed hold above support would weaken the setup.
Actionable but governed by invalidation levels.
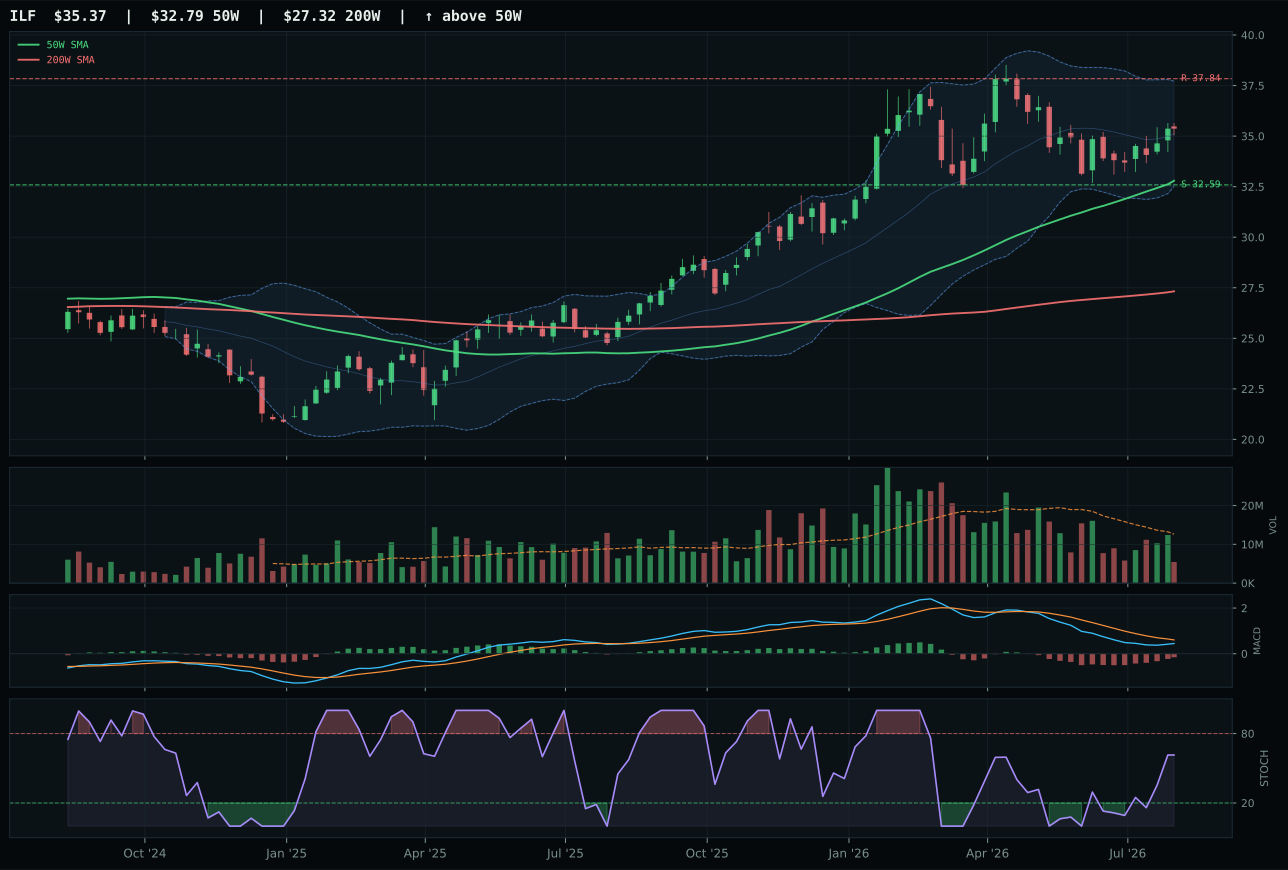
ILF has a neutral structure profile with -6.0% 13-week relative strength versus SPY.
A failed hold above support would weaken the setup.
Actionable but governed by invalidation levels.
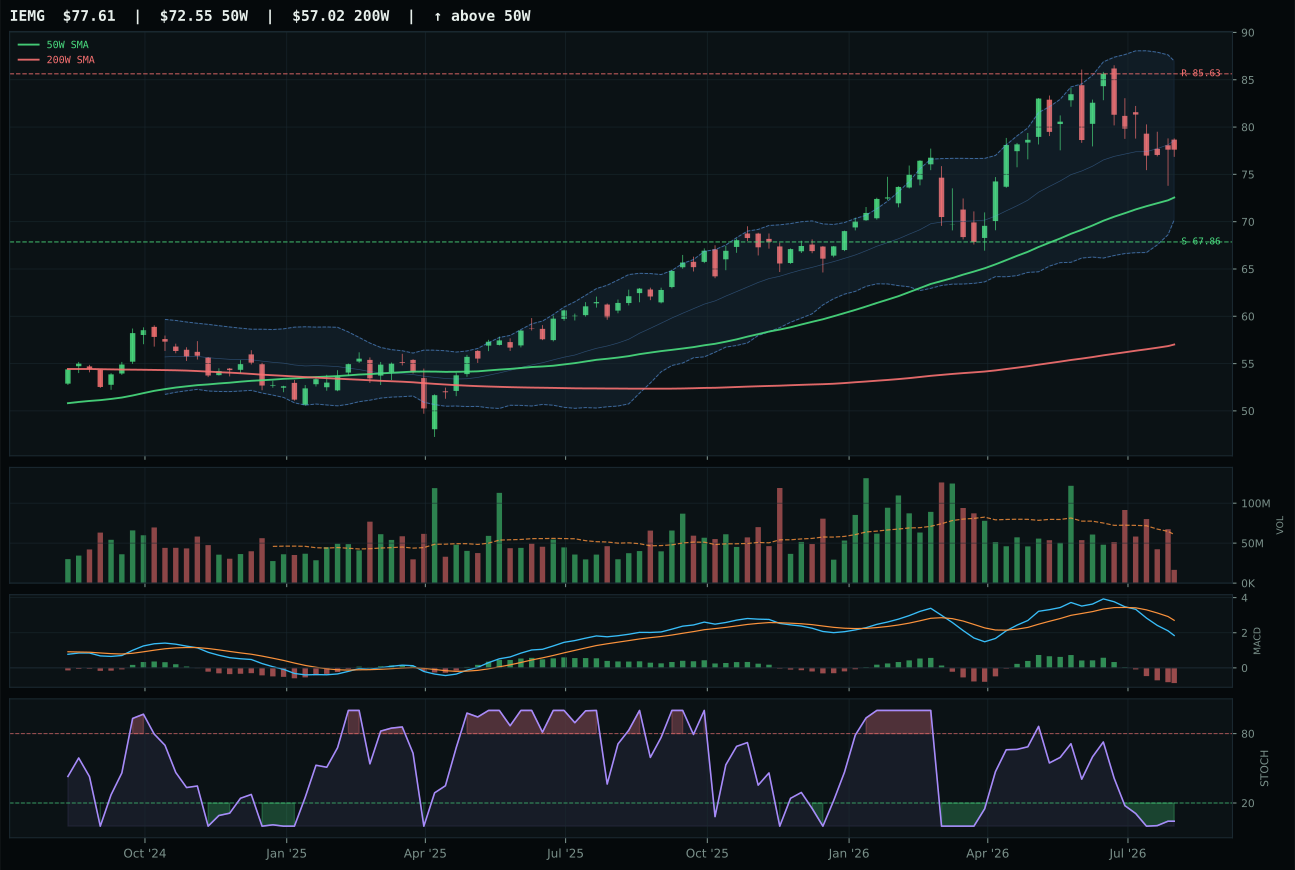
IEMG has a neutral structure profile with -5.0% 13-week relative strength versus SPY.
A failed hold above support would weaken the setup.
Actionable but governed by invalidation levels.
ILF wins because its structure is neutral (cleaner than INDA's compression near 50W) and stochastic RSI is rising mid-zone at 0.61, versus INDA's overbought momentum at 0.89+. Both carry weak macro setups with dollar pressure at -14 and credit stress at -10 creating powerful structural headwinds, but ILF at least offers a patient entry at 7.9% extension from the 50W with MACD bearish but improving, versus INDA's compression at 50W with MACD bullish and improving but stochastic already overbought. ILF's 13W return of -2.9% is worse than INDA's -0.1%, but timing geometry favors ILF—the setup is further extended but less overextended, offering a better risk/reward trade-off in a weak environment. The category-relative strength is 0.0% for both, meaning neither is being accumulated; this is a category where the best performer is still structurally weak.
Emerging Markets receives 0% allocation this week and ranks 9th or 10th in the portfolio tier, excluded entirely despite ILF and INDA showing near-positive technical setups. The category score of 18.0 reflects a catastrophic -32.0/100 macro fit driven by active dollar pressure at -14 (the strongest headwind in the portfolio), credit stress at -10, broad market bear at -9, and Stagflation Risk hurting by -8. Liquidity expansion at +8 is insufficient to offset this constellation of headwinds. Dollar strength is the dominant narrative in emerging markets allocation: a strong dollar makes EM debt repayment harder, reduces U.S. investor returns on foreign holdings, and shifts flows toward dollar assets. Allocation would require either: (1) a meaningful shift in the macro regime away from Transition/Mixed and toward Risk Appetite Intact, or (2) a flipping of dollar pressure from active to inactive status, signaling Fed pivot expectations. ILF's Latin America commodity beta and INDA's India quality-growth exposure offer structural appeal in a multi-year horizon, but the current regime does not support them at the portfolio level.
AI — AIQ
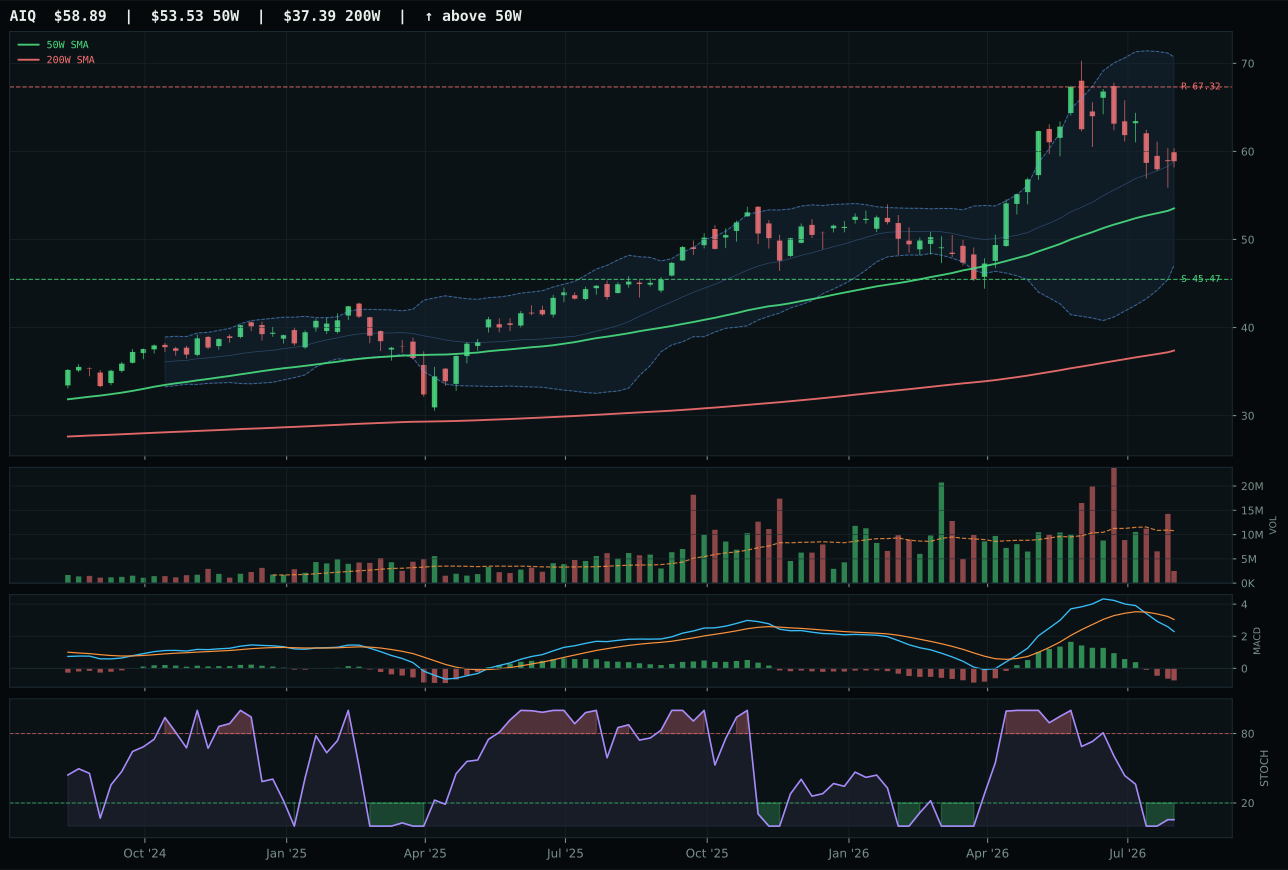
AIQ has a neutral structure profile with -0.0% 13-week relative strength versus SPY.
A failed hold above support would weaken the setup.
Actionable but governed by invalidation levels.
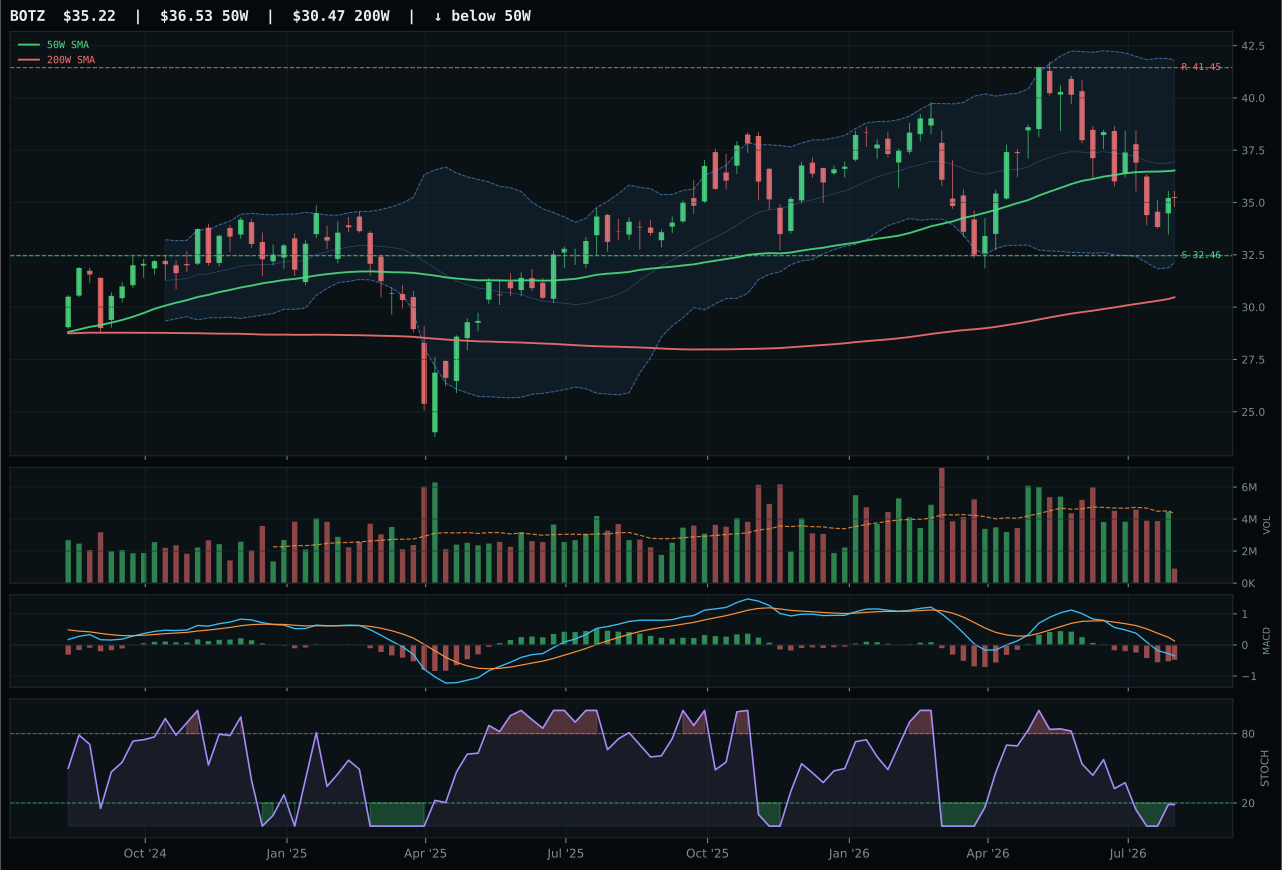
BOTZ has a neutral structure profile with -12.4% 13-week relative strength versus SPY.
A failed hold above support would weaken the setup.
Actionable but governed by invalidation levels.
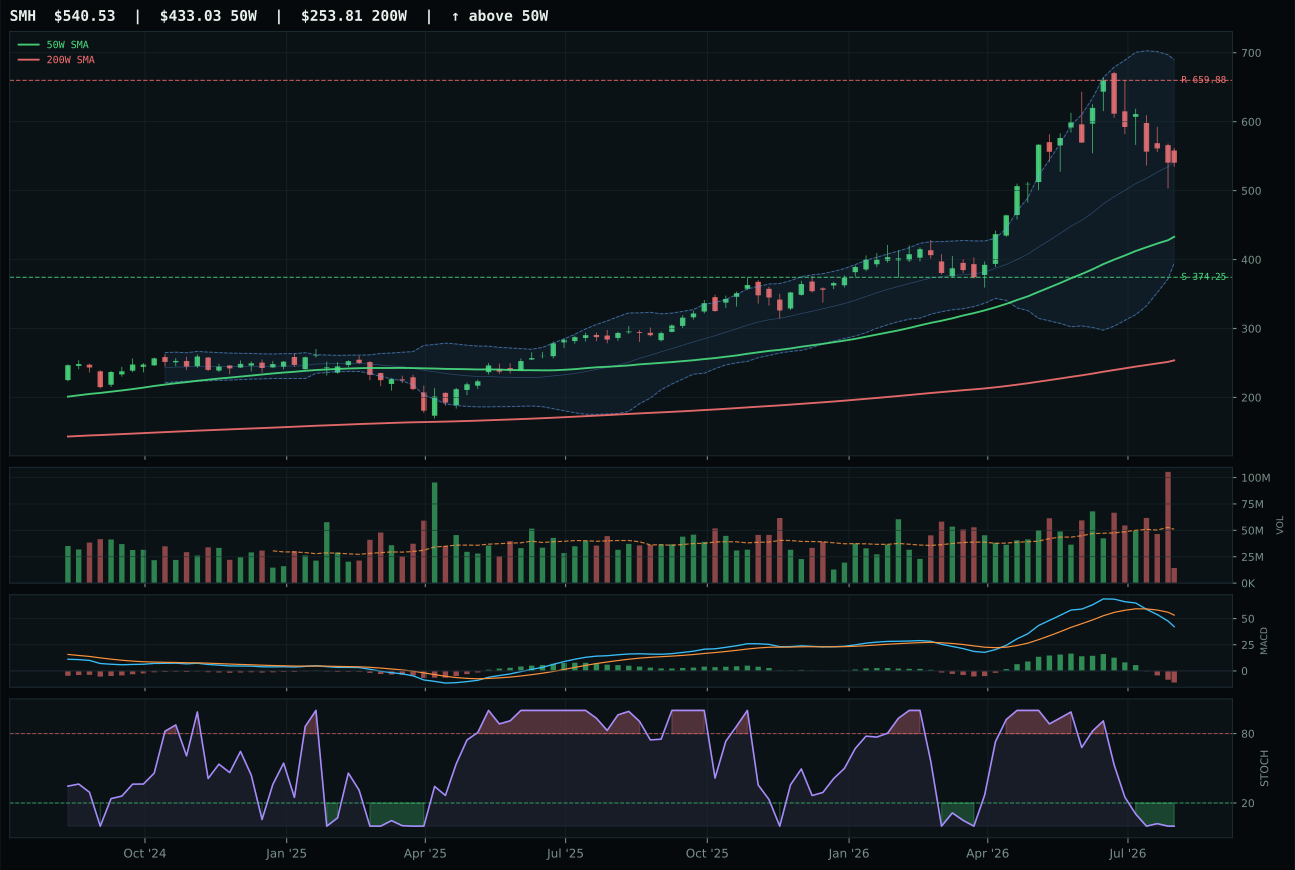
SMH has a vertical extension profile with 2.4% 13-week relative strength versus SPY.
A failed hold above support would weaken the setup.
Actionable but governed by invalidation levels.
BOTZ wins by virtue of risk/reward geometry, not momentum breadth: it offers 84.8/100 risk/reward versus AIQ's 60.6 despite being the worst performer in the basket on both absolute and relative grounds. At -3.6% from the 50W with a 15.0% upside gap to the 41.45 resistance level and only 8.5% downside to 32.46 support, BOTZ presents a defined value trap with oversold stochastic RSI at 0.19 turning up. AIQ sits 10.0% above the 50W, which compresses both upside (to 67.32) and downside protection (to 45.47), and its stochastic RSI is also oversold turn up but from a worse structural position. The timing score differential is decisive: BOTZ's timing of 100 reflects deep retracement / value zone placement and distance to 50W that favor mean reversion, while AIQ's timing of 91 loses points for being further extended. Both ETFs show zero momentum confirmation—13W returns of -15.0% and -5.5% respectively, with category-relative strength of -9.5% and 0.0%—meaning this is pure technical setup, not a bet on near-term AI sector healing.
AI receives 0% allocation this week and ranks 9th or 10th in the portfolio tier, excluded entirely despite BOTZ's favorable risk/reward setup. The category score of 16.8 reflects a devastating -32.0/100 macro fit, driven by active stagflation headwinds (-8), credit stress (-8), and broad market bear (-8) that overwhelm the +10 liquidity expansion signal. Growth slowdown (-4) and dollar pressure (-4) compound the regime headwinds. Even though the 3/2/1 weighted ETF basket starts at 26.5 before adjustment, the category reasoner penalizes it further when testing against macro descriptor misalignment and the active market regime of Transition/Mixed, which does not support cycle-dependent technology hardware or software. The risk/reward skew that made BOTZ the category winner is insufficient to overcome the fact that oversold bounces in bear regimes offer poor risk adjustment—holding 84.8% risk/reward in a -32.0 macro fit environment is catching a falling knife. Allocation would require either a macro regime shift away from Stagflation Risk or a material shift in credit stress and dollar pressure descriptors from active to inactive status.