
2026-07-24
Informational purposes only. The content in this report, including allocations, analysis, and commentary, is provided solely for informational and educational purposes. It does not constitute financial advice, investment advice, trading advice, or any other type of advice. Past performance does not guarantee future results. Always conduct your own research and consult a qualified financial professional before making investment decisions.
Weekly Allocation
| Ticker | Category | Weight | Role |
|---|---|---|---|
| WEAT | Agriculture & Livestock | 20% | Top-2 (20%) |
| XLE | Traditional Energy | 20% | Top-2 (20%) |
| XLU | Utilities & Infrastructure | 10% | Tier-2 (10%) |
| CIBR | Technology | 10% | Tier-2 (10%) |
| ITA | Defense & Aerospace | 10% | Tier-2 (10%) |
| BOTZ | AI | 10% | Tier-2 (10%) |
| COPX | Industrial Metals | 10% | Tier-2 (10%) |
| GLD | Precious Metals | 10% | Tier-2 (10%) |
Trade Instructions — Monday Open
Sell the tranche from 2026-06-26 (completing its 4-week hold). Buy the new tranche. Instructions show net portfolio changes — same-asset positions cancel, weight changes show the delta.
| Action | Ticker | Instruction |
|---|---|---|
| SELL | CIBR | Sell 14% of CIBR position (reduce 17.50% → 15.00%) |
| SELL | ITA | Sell 20% of ITA position (reduce 12.50% → 10.00%) |
| SELL | SMH | Sell 33% of SMH position (reduce 7.50% → 5.00%) |
| SELL | ILF | Sell entire ILF position (2.50% of portfolio) |
| SELL | NLR | Sell entire NLR position (2.50% of portfolio) |
| BUY | BOTZ | Buy BOTZ — 20.00% of freed cash (adds 2.50% to portfolio) |
| BUY | WEAT | Buy WEAT — 40.00% of freed cash (adds 5.00% to portfolio) |
| BUY | XLE | Buy XLE — 40.00% of freed cash (adds 5.00% to portfolio) |
Current Portfolio After Trade
Combined holdings across all 4 active tranches. Each tranche is 25% of the portfolio.
| Ticker | % of Portfolio | Weight Bar |
|---|---|---|
| CIBR | 15.00% | |
| WEAT | 12.50% | |
| ITA | 10.00% | |
| XLU | 10.00% | |
| COPX | 10.00% | |
| XLE | 10.00% | |
| URNM | 7.50% | |
| BOTZ | 7.50% | |
| SMH | 5.00% | |
| GLD | 5.00% | |
| VEGI | 2.50% | |
| FCG | 2.50% | |
| AIQ | 2.50% |
Macro Regime — Transition / Mixed
Macro Evidence Charts
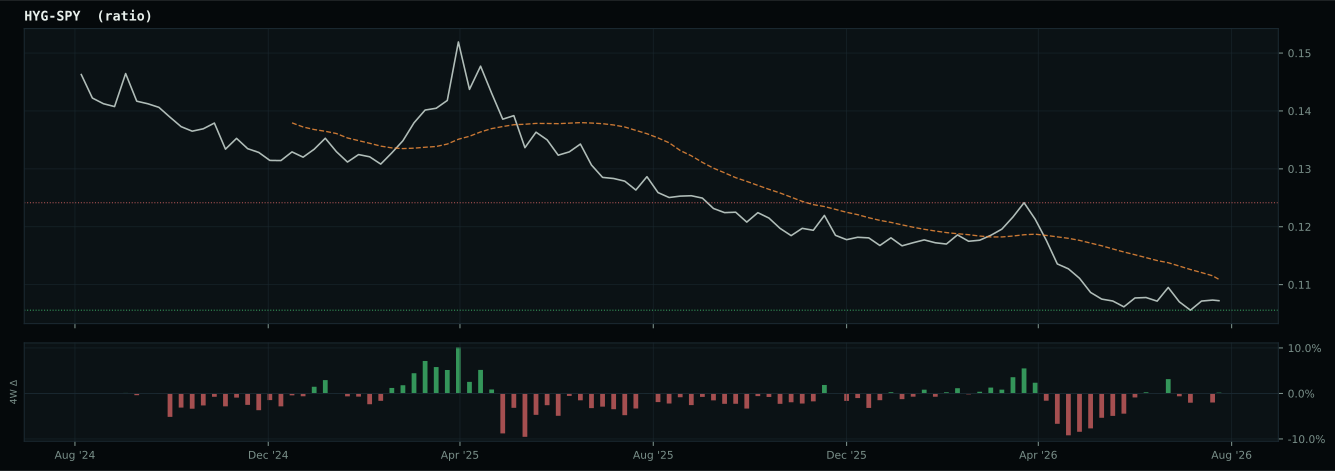
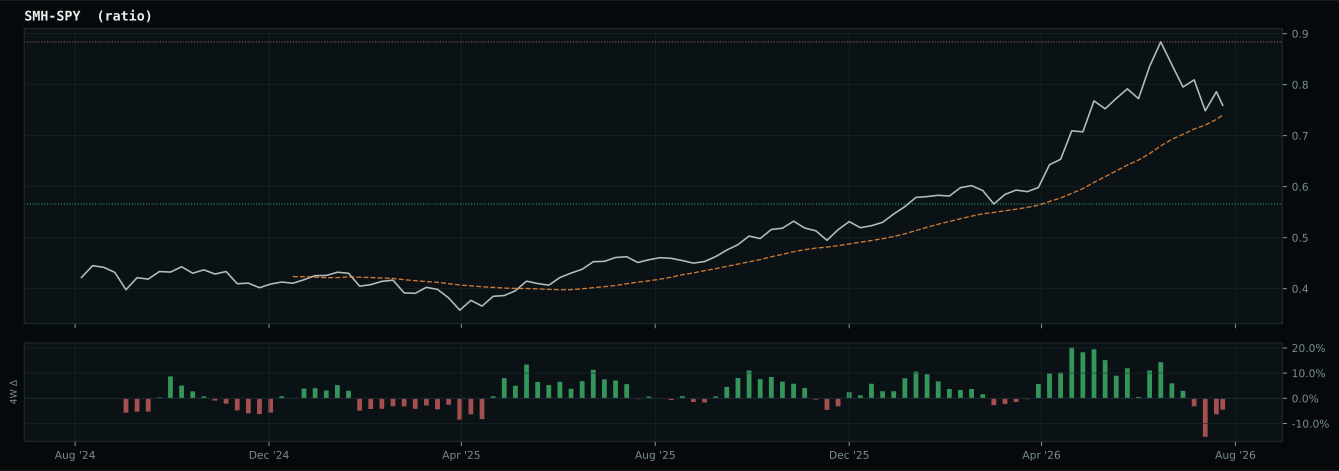
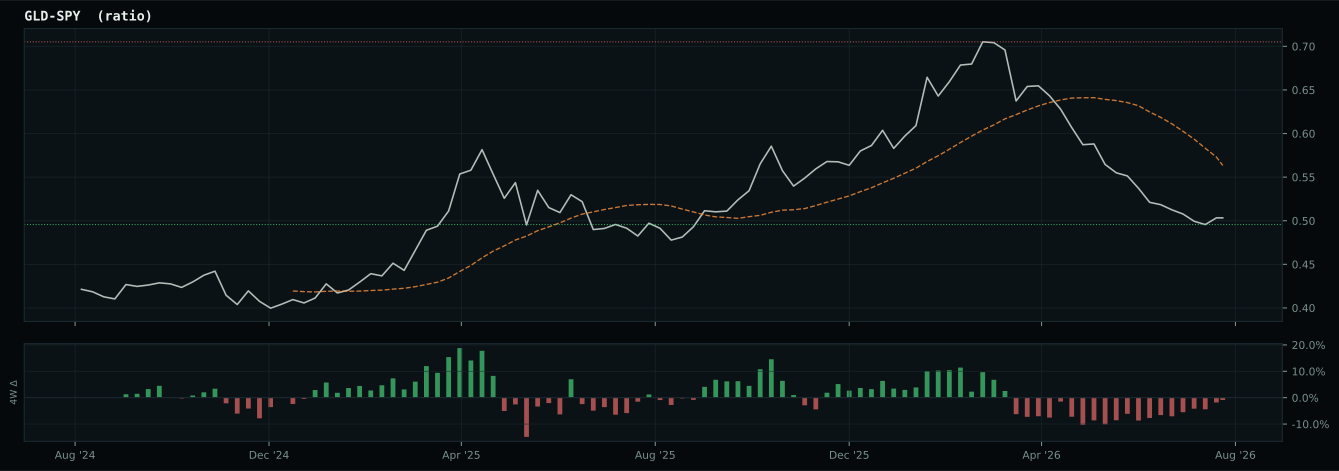
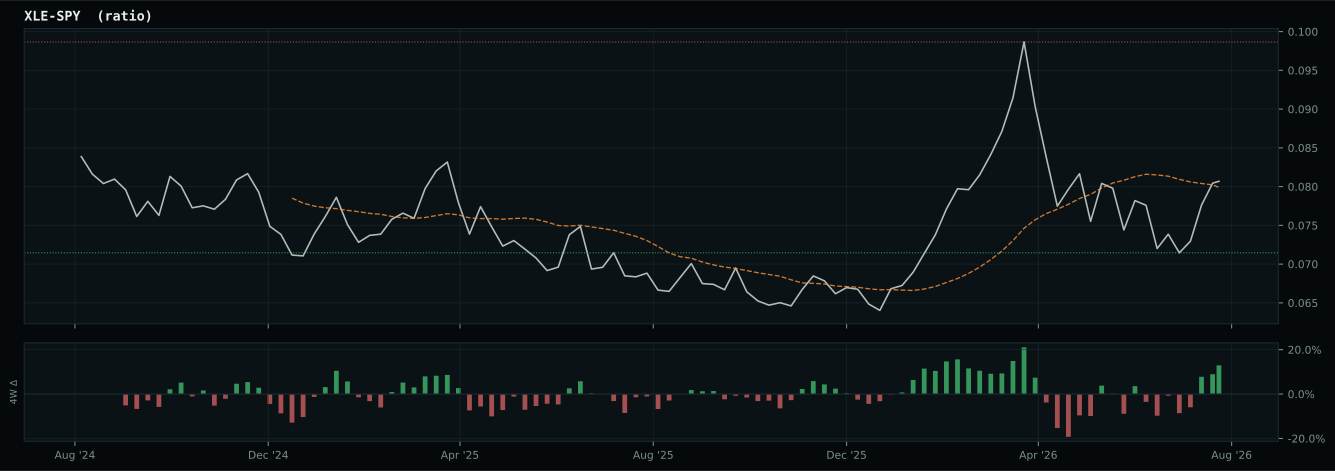
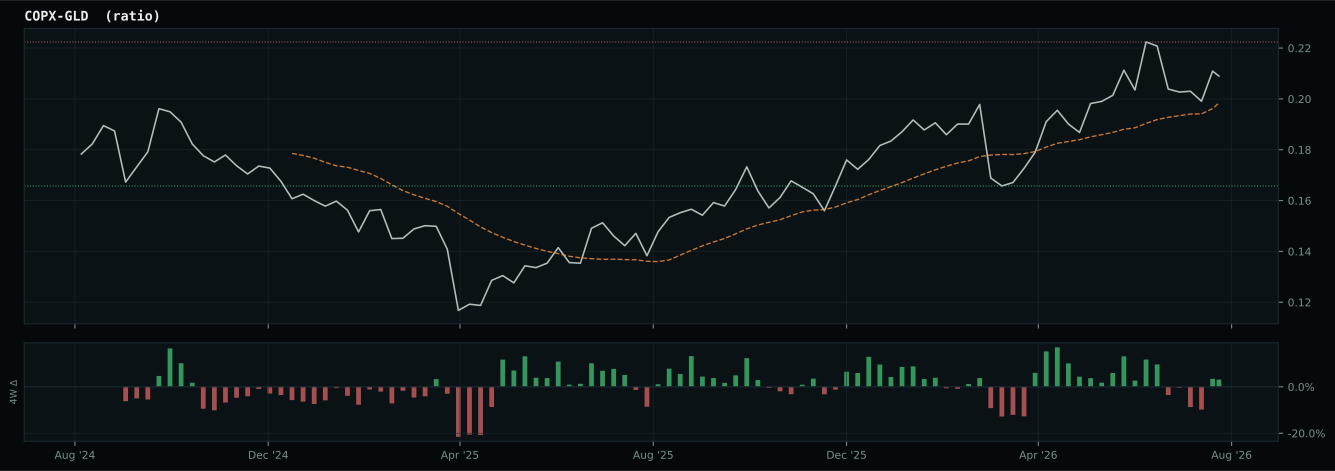
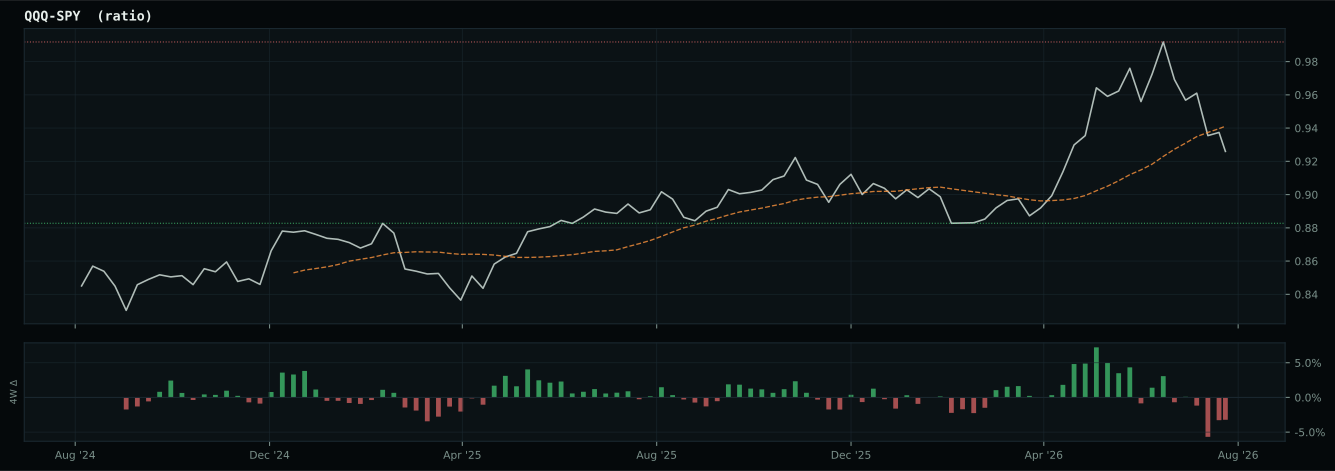
Market-implied signals behind the macro regime scores. Each ratio compares two assets; the direction and slope of the ratio is what the macro engine reads.
Crypto Regime — NoCrypto
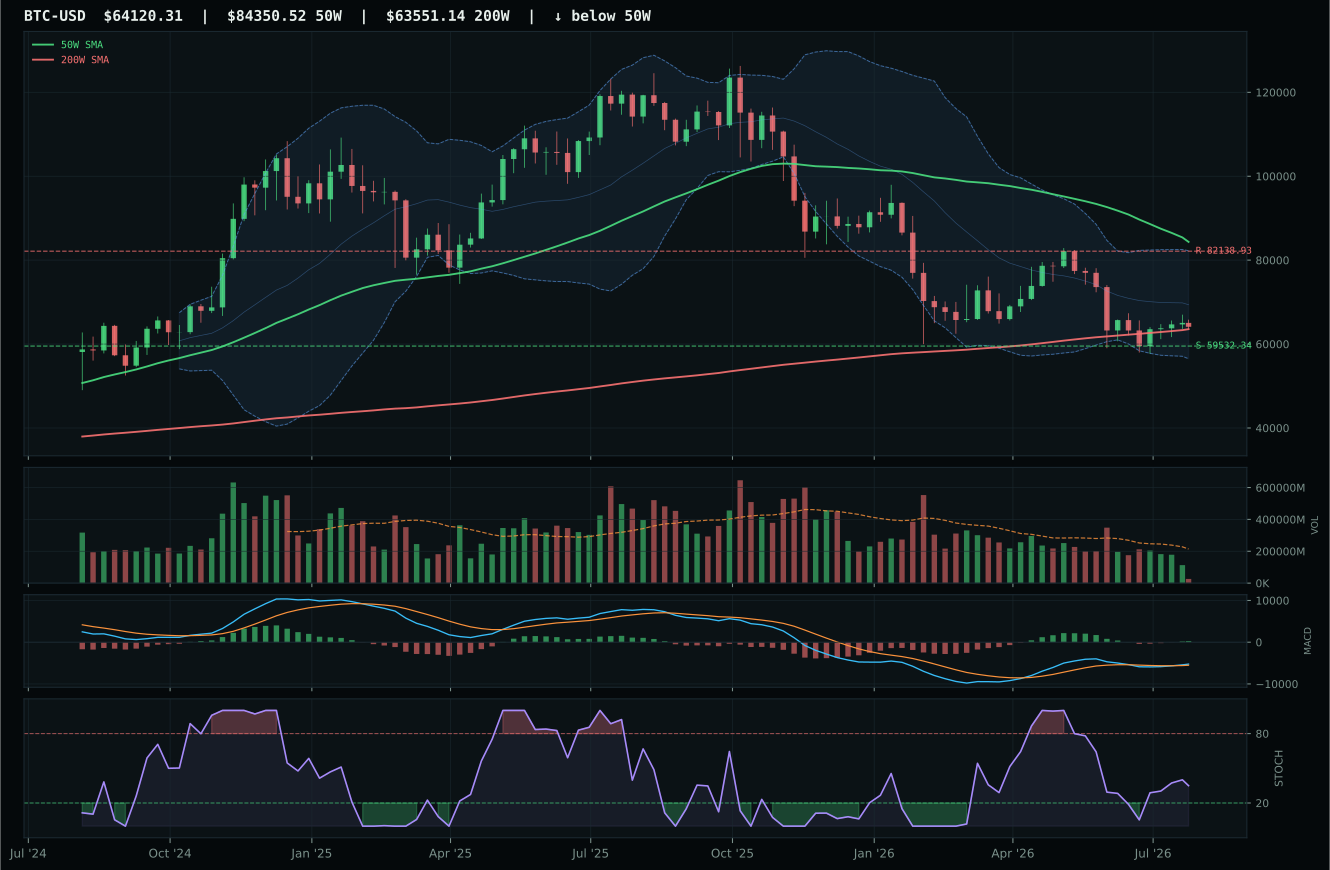
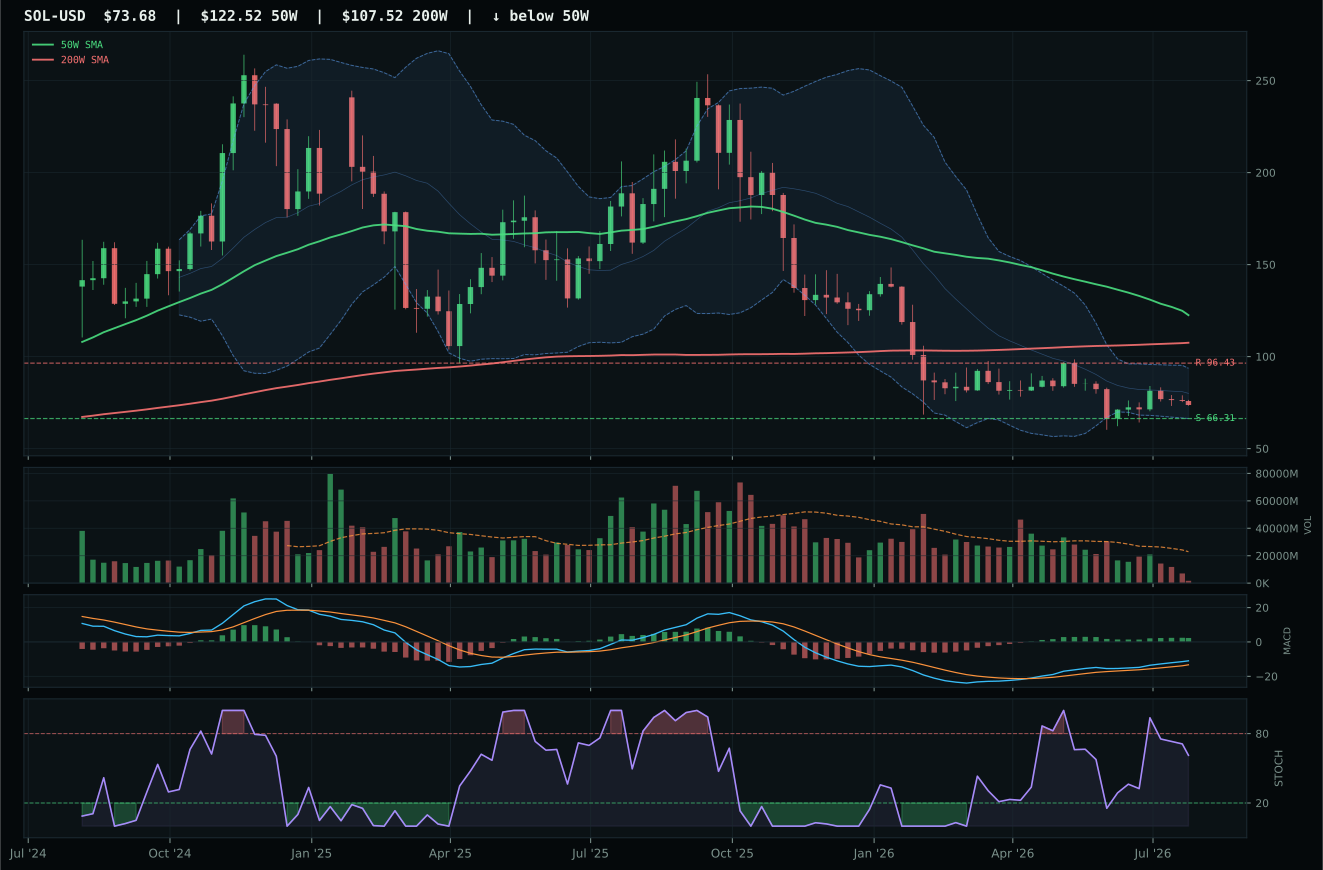
post-touch range has not been tested enough: support tests 1/2, resistance tests 3/2
TrendBTC not confirmed
one or more available conditions failed
Category Rankings
| Rank | Category | Winner | Score | Alloc | 4W Ret | Peers (4W) |
|---|---|---|---|---|---|---|
| 1 | Agriculture & Livestock | WEAT | 73.5 | 20% | — | VEGI — · MOO — |
| 2 | Traditional Energy | XLE | 60.0 | 20% | — | XOP — · FCG — |
| 3 | Utilities & Infrastructure | XLU | 52.7 | 10% | — | IGF — · PAVE — |
| 4 | Technology | CIBR | 51.3 | 10% | — | IGV — · XLK — |
| 5 | Defense & Aerospace | ITA | 49.4 | 10% | — | XAR — · ROKT — |
| 6 | AI | BOTZ | 43.3 | 10% | — | AIQ — · SMH — |
| 7 | Industrial Metals | COPX | 41.3 | 10% | — | PICK — · REMX — |
| 8 | Precious Metals | GLD | 38.9 | 10% | — | SLV — · GDX — |
| 9 | Nuclear Energy | URNM | 37.4 | 0% | — | NLR — · URA — |
| 10 | Emerging Markets | IEMG | 22.0 | 0% | — | ILF — · INDA — |
Agriculture & Livestock — WEAT
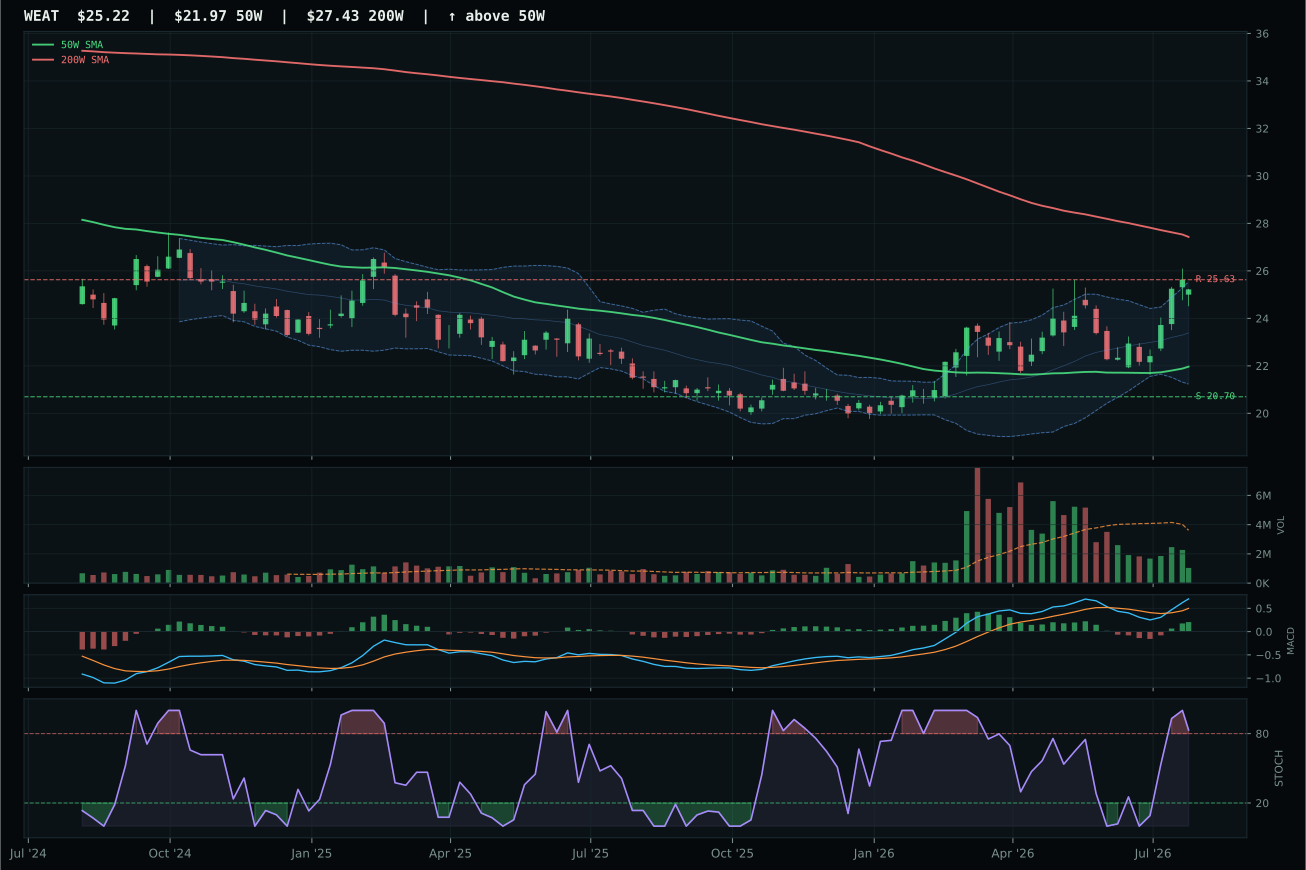
WEAT has a vertical extension profile with 5.3% 13-week relative strength versus SPY.
A failed hold above support would weaken the setup.
Actionable but governed by invalidation levels.
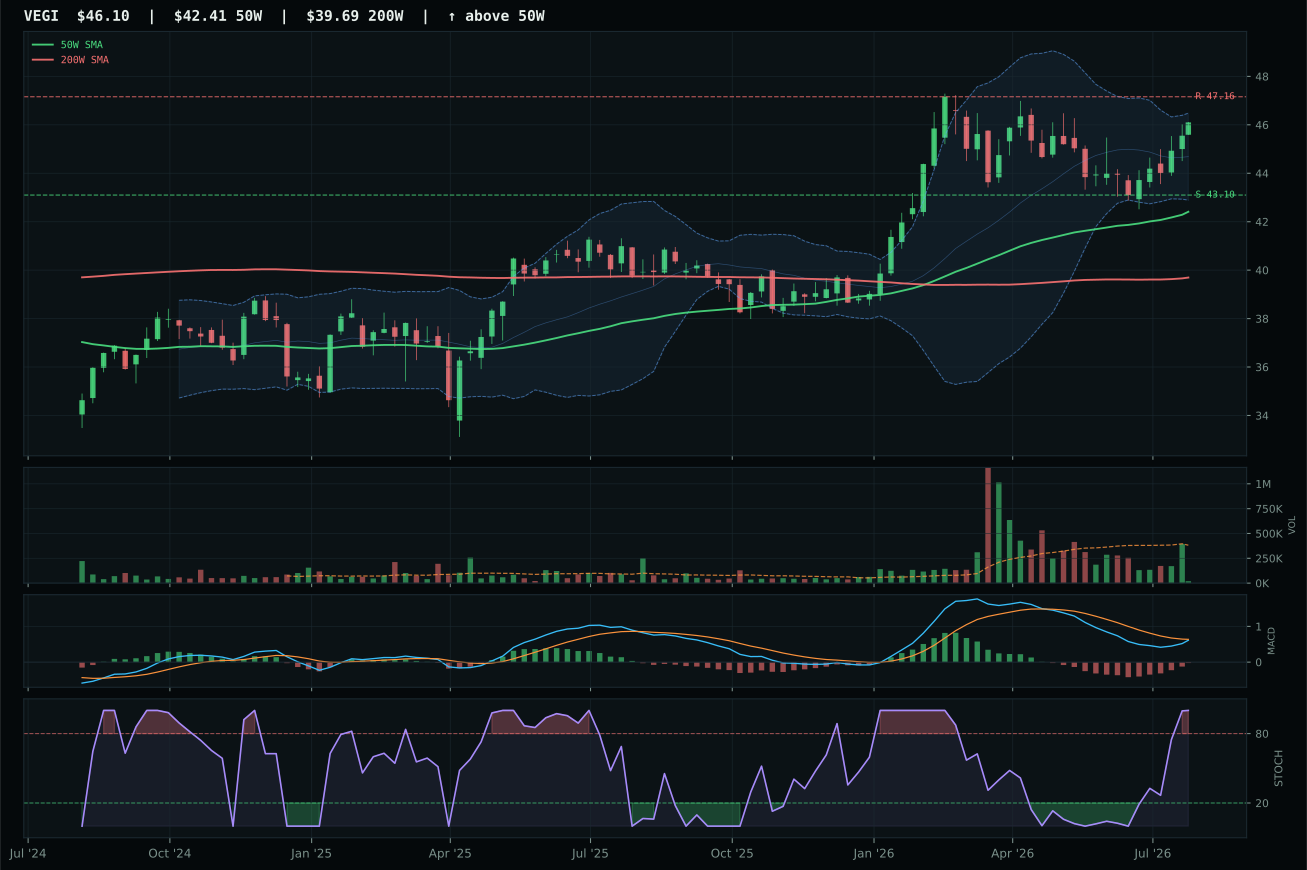
VEGI has a neutral structure profile with -0.3% 13-week relative strength versus SPY.
A failed hold above support would weaken the setup.
Actionable but governed by invalidation levels.
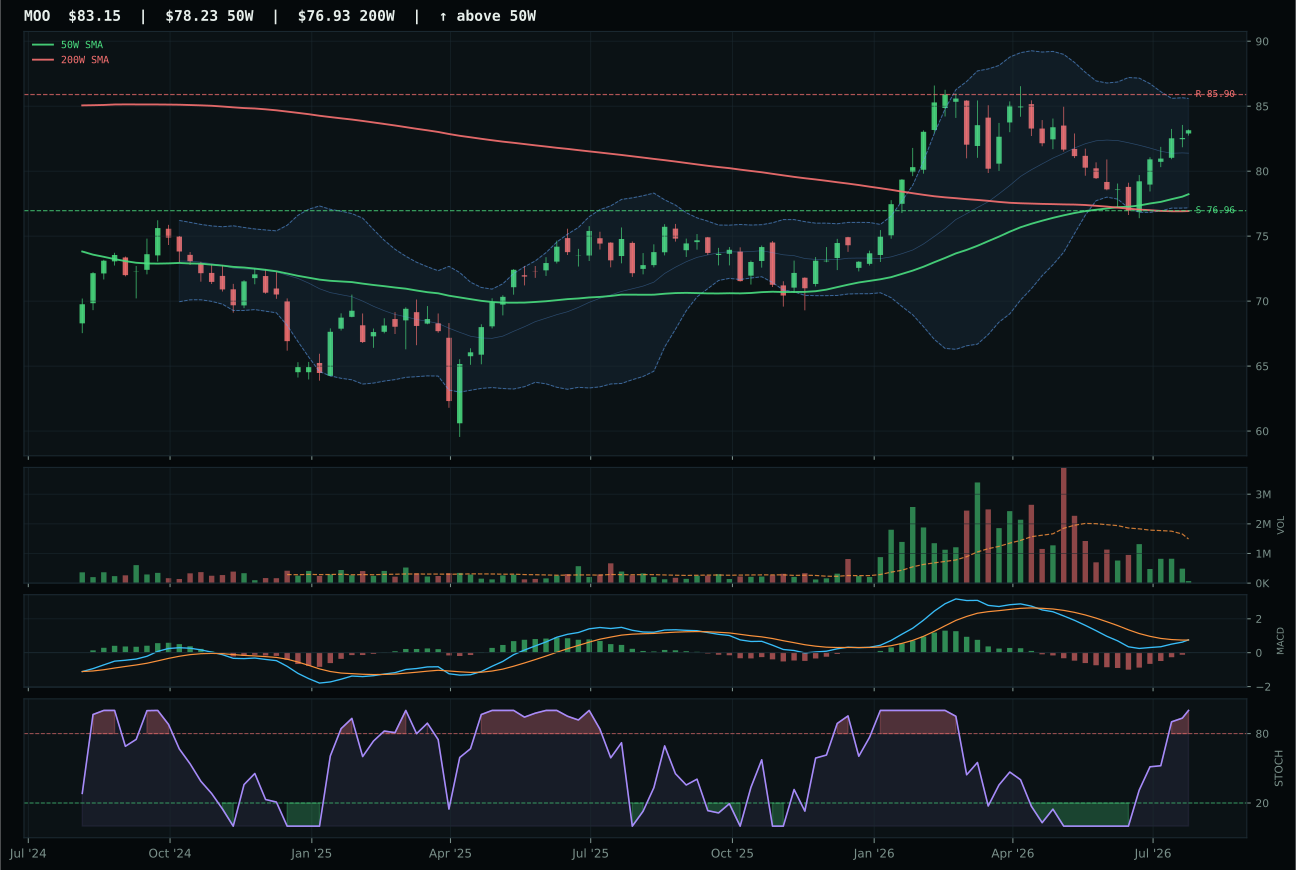
MOO has a neutral structure profile with -2.3% 13-week relative strength versus SPY.
A failed hold above support would weaken the setup.
Actionable but governed by invalidation levels.
WEAT claimed top-2 selection by defeating VEGI despite scoring 65/100 to VEGI's 74/100 composite—the rare case where momentum confirmation and category-relative strength override composite score hierarchy. WEAT generates 100/100 momentum confirmation from a 13.8% four-week return and 8.8% thirteen-week return, both powered by 5.6% category-relative strength, whereas VEGI's bearish-but-improving MACD and 3.2% thirteen-week return score only 64/100 momentum. The supply shortage and real-asset sponsorship macros activated at +13 and +8 respectively favor short-term wheat volatility over global producer breadth; WEAT's stochastic at 0.92 (overbought momentum) trades lower friction into the commodity rotation. Price sits 15.3% above the 50-week with resistance only 0.1% away, a two-sided setup that rewards aggressive but not greedy positioning. VEGI's neutral structure and longer-dated macro support will outperform WEAT over six months, but this week belongs to the wheat spike.
Agriculture & Livestock merits 20% as the portfolio's second-highest-ranked category because category-level macro fit reaches 86/100, powered by supply shortage (+13), inflation pressure (+10), real-asset sponsorship (+8), and commodity breadth positive (+5). WEAT's 73.5 final category score ranks second only to XLE's 60.0, a distinction earned by the three-ETF basket testing strong at 68.8 before category reasoning layer adjustments. The allocation weights the bullish-but-flattening MACD and overbought stochastic heavily against entry timing (45/100), but 62% technical evidence weighting + 38% macro weighting produces a risk-adjusted case that extends beyond the short-squeeze. Real assets are moving capital from equities; wheat's supply shock creates optionality that generalist equity portfolios lack. The 20% slot recognizes that rotation into inflation hedges will dominate portfolio construction until labor data or rates surprise materially.
Traditional Energy — XLE
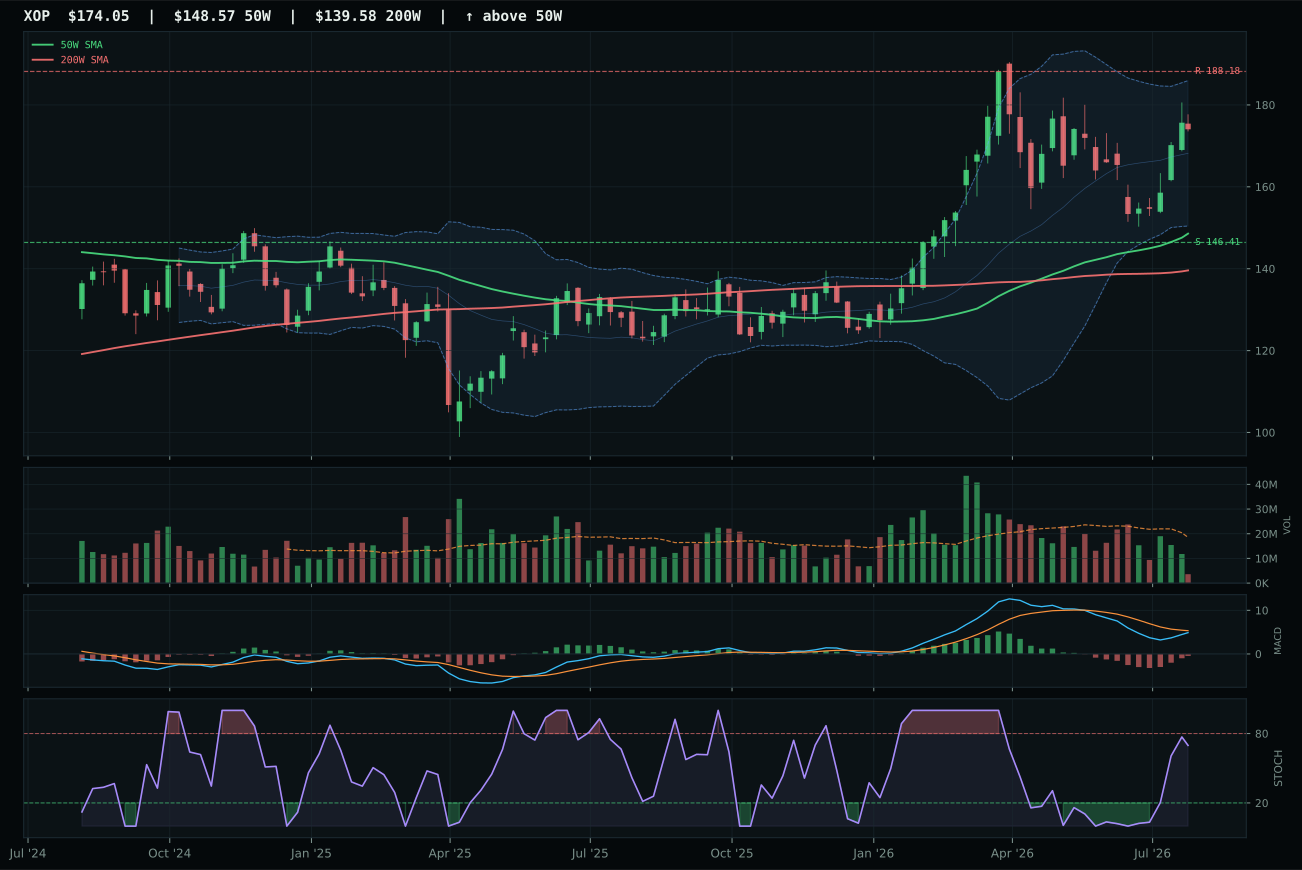
XOP has a vertical extension profile with 0.1% 13-week relative strength versus SPY.
A failed hold above support would weaken the setup.
Actionable but governed by invalidation levels.
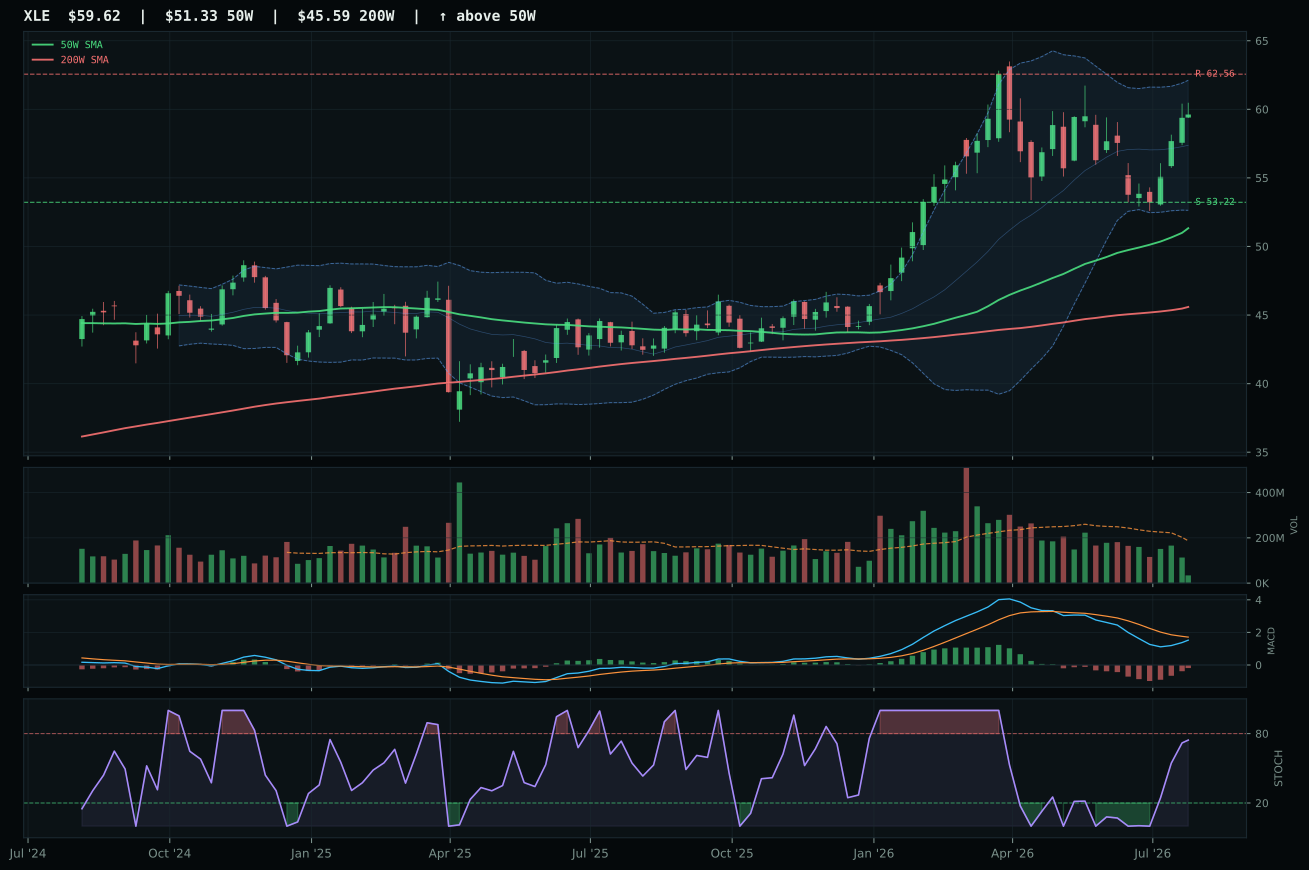
XLE has a vertical extension profile with 1.3% 13-week relative strength versus SPY.
A failed hold above support would weaken the setup.
Actionable but governed by invalidation levels.
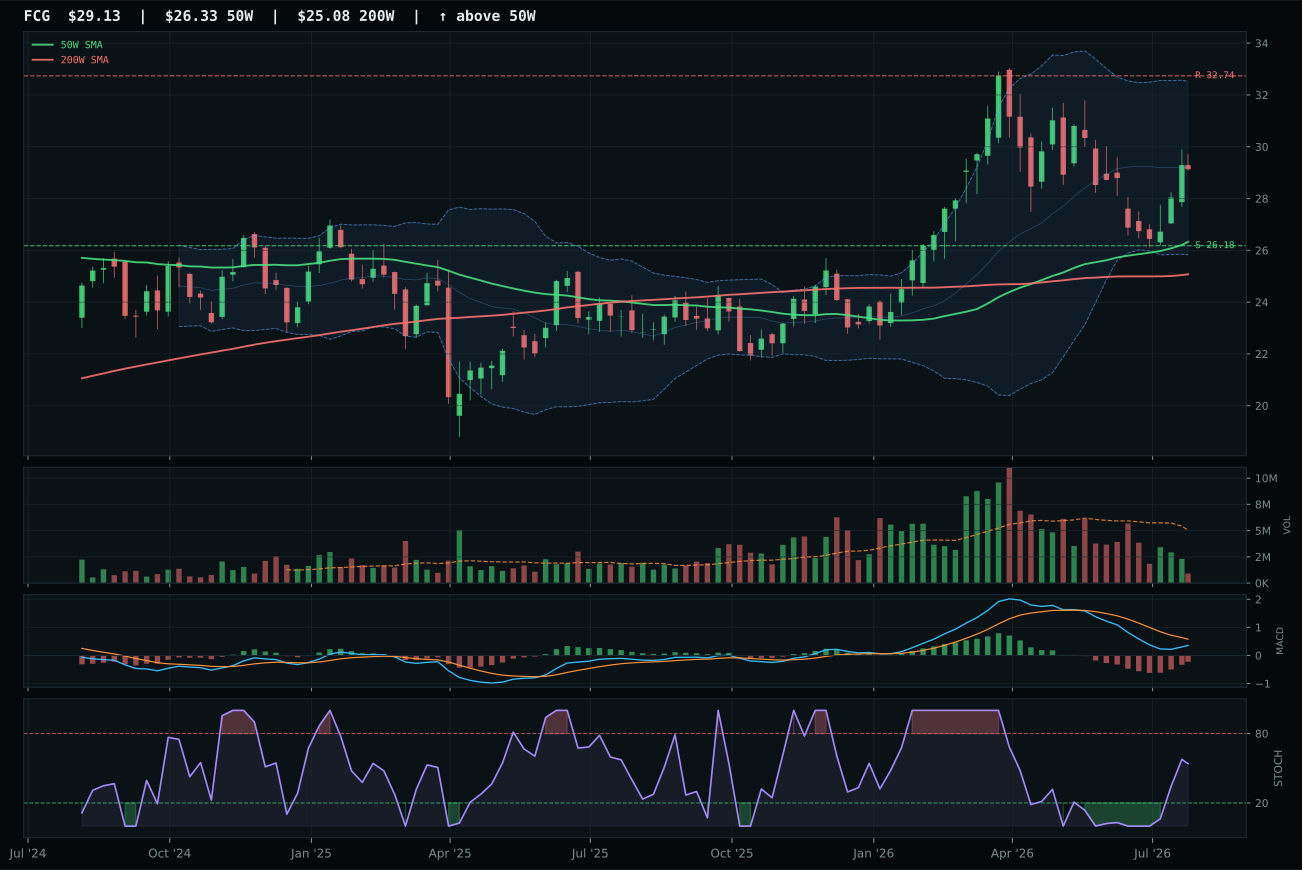
FCG has a neutral structure profile with -5.8% 13-week relative strength versus SPY.
A failed hold above support would weaken the setup.
Actionable but governed by invalidation levels.
XLE claimed top-2 selection by defeating XOP on structure and category-relative strength (+1.3% vs 0.0%) despite nearly identical setups: both show vertical extension with 16-17% distance to the 50-week, bearish-but-improving MACD, rising stochastic in mid-zone, and thin participation. XLE's structure scores 71.1/100 versus XOP's 67.6/100 because integrated cash-flow models tolerate extension better than exploration beta during macro transitions. Technical evidence slightly favors XLE (53.8 vs 52.1), but the winning margin comes from category-relative strength: XLE's 28.5 billion in assets and dividend consistency attract rotation capital that XOP, despite higher beta leverage, cannot capture at current volatility. Price sits 16.9% above the 50-week with only 4.7% upside to resistance—a crowded-trade indicator—but energy scarcity (+14 macro weighting), inflation pressure (+10), and supply shortage (+7) deliver enough external sponsorship to justify holding extended names through consolidation.
Traditional Energy merits 20% as the portfolio's co-leader because energy scarcity reaches +16 weighting, paired with inflation pressure (+10), supply shortage (+9), and real-asset sponsorship (+7)—the highest-concentration macro suite driving capital reallocation this week. The 60.0 final category score earns top-2 ranking at precisely the portfolio's threshold for meaningful allocation; unlike WEAT's 73.5 (substantially higher), XLE's advantage is narrower, making the 20% slot conditional on macro persistence. XLE's 85/100 category-level macro fit versus 50-60/100 across most growth categories signals structural capital flow advantage: inflation remains sticky, dollar strength remains contested, and geopolitical energy security creates optionality that growth tech cannot provide. The 53.8/100 technical evidence is modest—momentum at 74.8 reflects recovery into extension rather than fresh accumulation—so position-sizing discipline is essential; if support at 51.05 breaks, reallocation to BOTZ or GLD executes immediately.
Utilities & Infrastructure — XLU
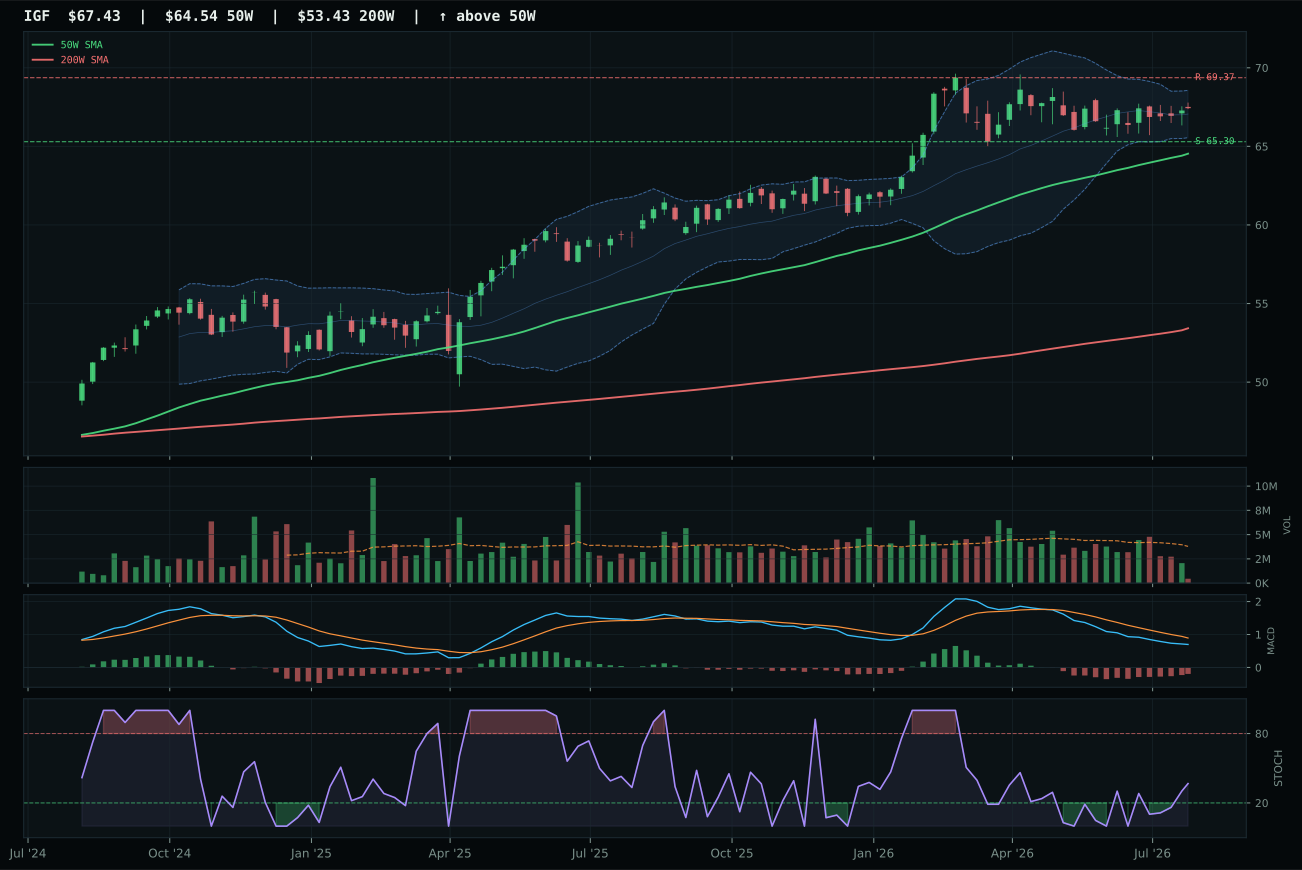
IGF has a pullback into support profile with -4.0% 13-week relative strength versus SPY.
A failed hold above support would weaken the setup.
Actionable but governed by invalidation levels.
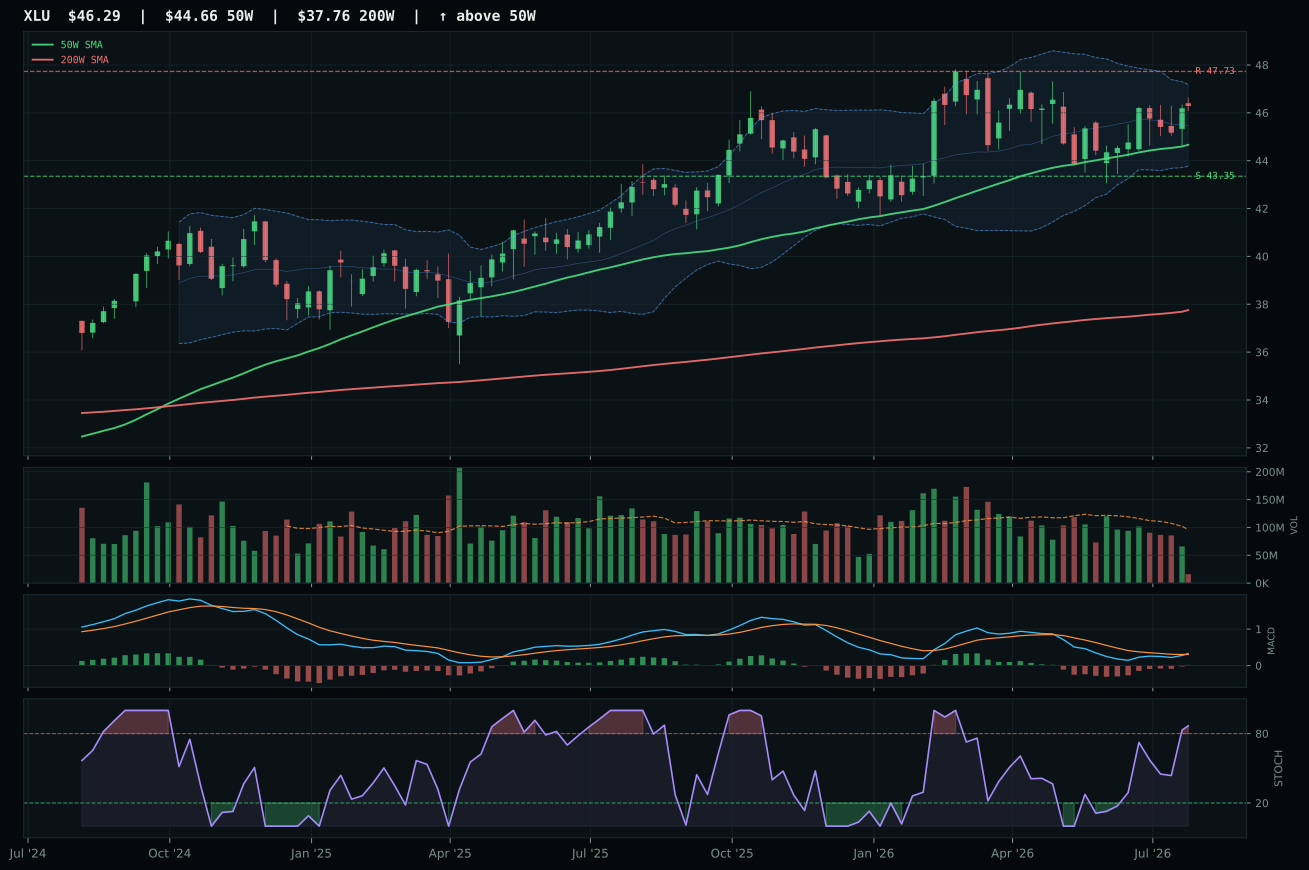
XLU has a neutral structure profile with -3.3% 13-week relative strength versus SPY.
A failed hold above support would weaken the setup.
Actionable but governed by invalidation levels.
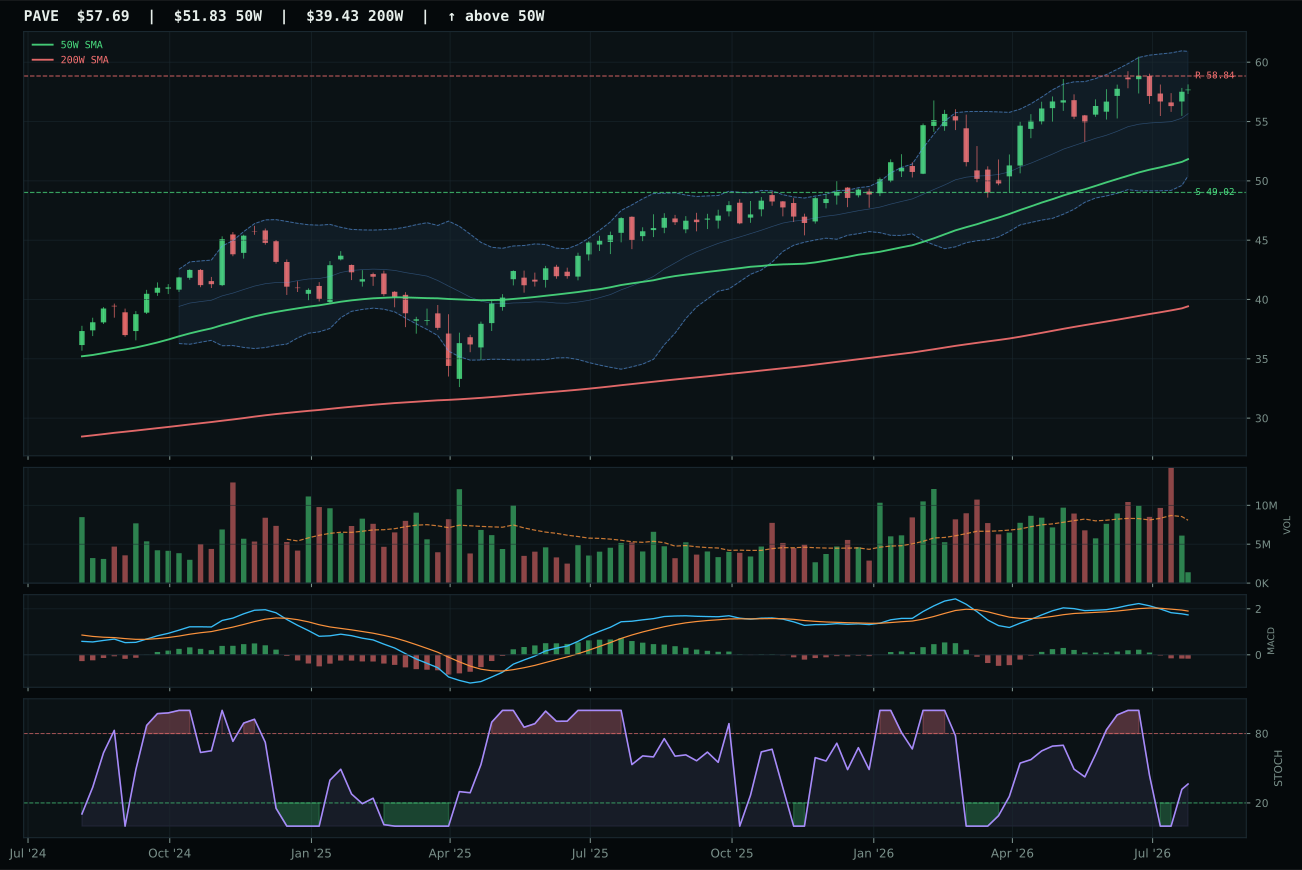
PAVE has a neutral structure profile with -0.7% 13-week relative strength versus SPY.
A failed hold above support would weaken the setup.
Actionable but governed by invalidation levels.
XLU defeated IGF by 6 points because volume participation (0.80x versus thin at 0.75x) and timing (90/100 versus 100/100) created a technical reason to prefer regulated utility defense over global infrastructure income in a broad-market-bear regime. Price sits only 3.8% above the 50-week with nearly symmetric risk-reward (7% downside to 43.25 support, 3% upside to 47.73 resistance)—a coil setup where compression (82.8/100 score) indicates that institutional capital is consolidating rather than accumulating. IGF generated superior technical evidence (70.9/100 vs 62.5/100) and pullback-into-support geometry with rising stochastic, but its -0.7% category-relative strength versus XLU's 0.0% broke the tiebreaker. XLU's 47/100 momentum (zero thirteen-week alpha) is disqualifying for momentum portfolios, but the 88/100 trend and 90/100 timing scores telegraph that this is a defensive hold for investors who prioritize capital preservation.
Utilities earned 10% because the 52.7 category score ranks sixth and the macro environment provides modest support via broad-market-bear (+4) and transition-regime tailwinds (+4), offsetting inflation pressure (-6) and risk-appetite-positive drag (-3). XLU's 62.5/100 technical evidence is mid-portfolio, held up by clean trend (88/100) and tight timing (90/100) rather than momentum or relative strength. The allocation reflects defensive rotation: when credit stress risk increases or equity-market volatility spikes, utilities' 3.8% distance to the 50-week provides quick capital-preservation shelter. Unlike precious metals, which offer structural hedging asymmetry, utilities function as slow consolidation: capital parks here when growth outlooks deteriorate but risk-off catalysts haven't yet arrived. If broad-market-bear intensifies from +6 to +10 or higher, XLU reranks to top-3 instantly; if risk appetite surprise reverses (-3 to +6), exit immediately into higher-upside categories.
Technology — CIBR
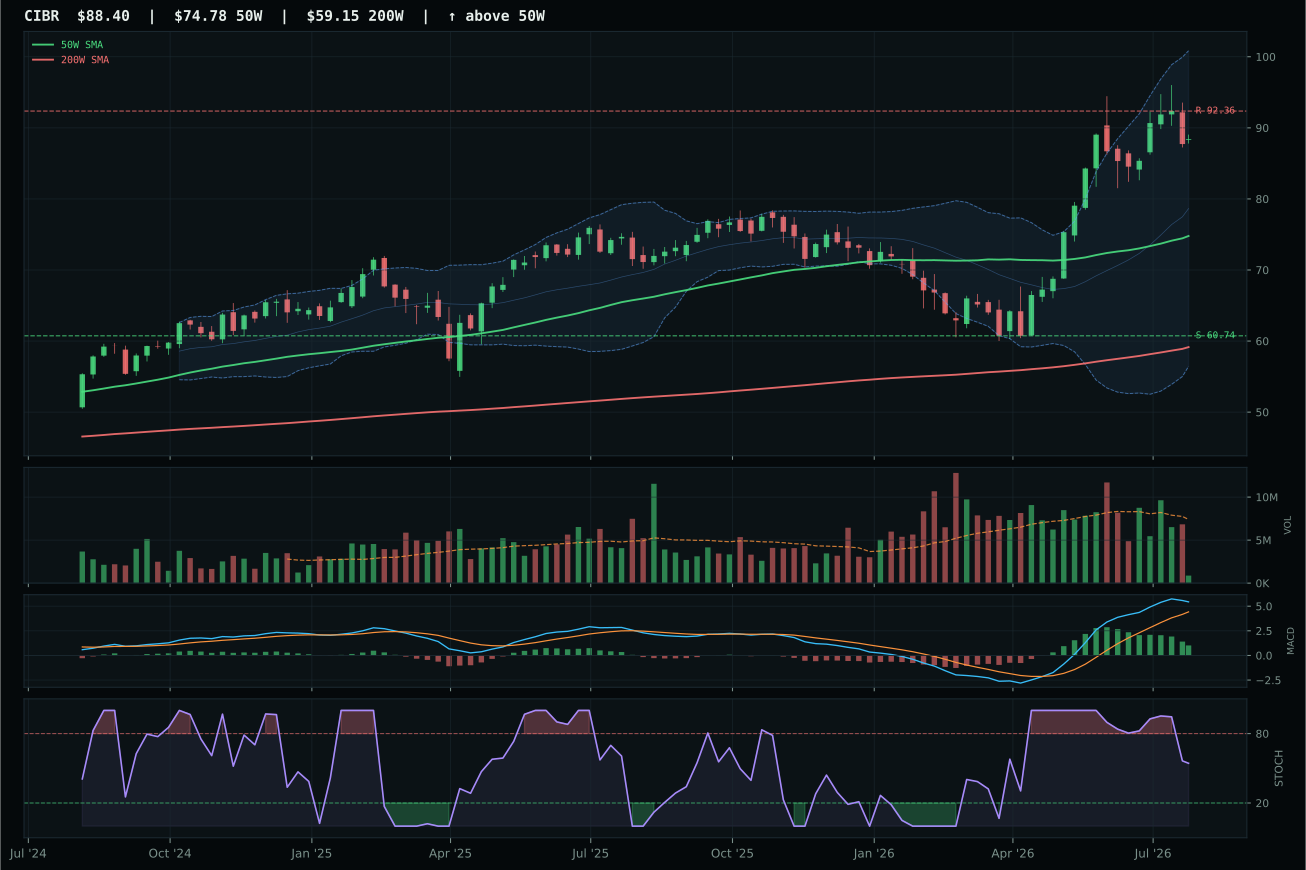
CIBR has a vertical extension profile with 28.0% 13-week relative strength versus SPY.
A failed hold above support would weaken the setup.
Actionable but governed by invalidation levels.
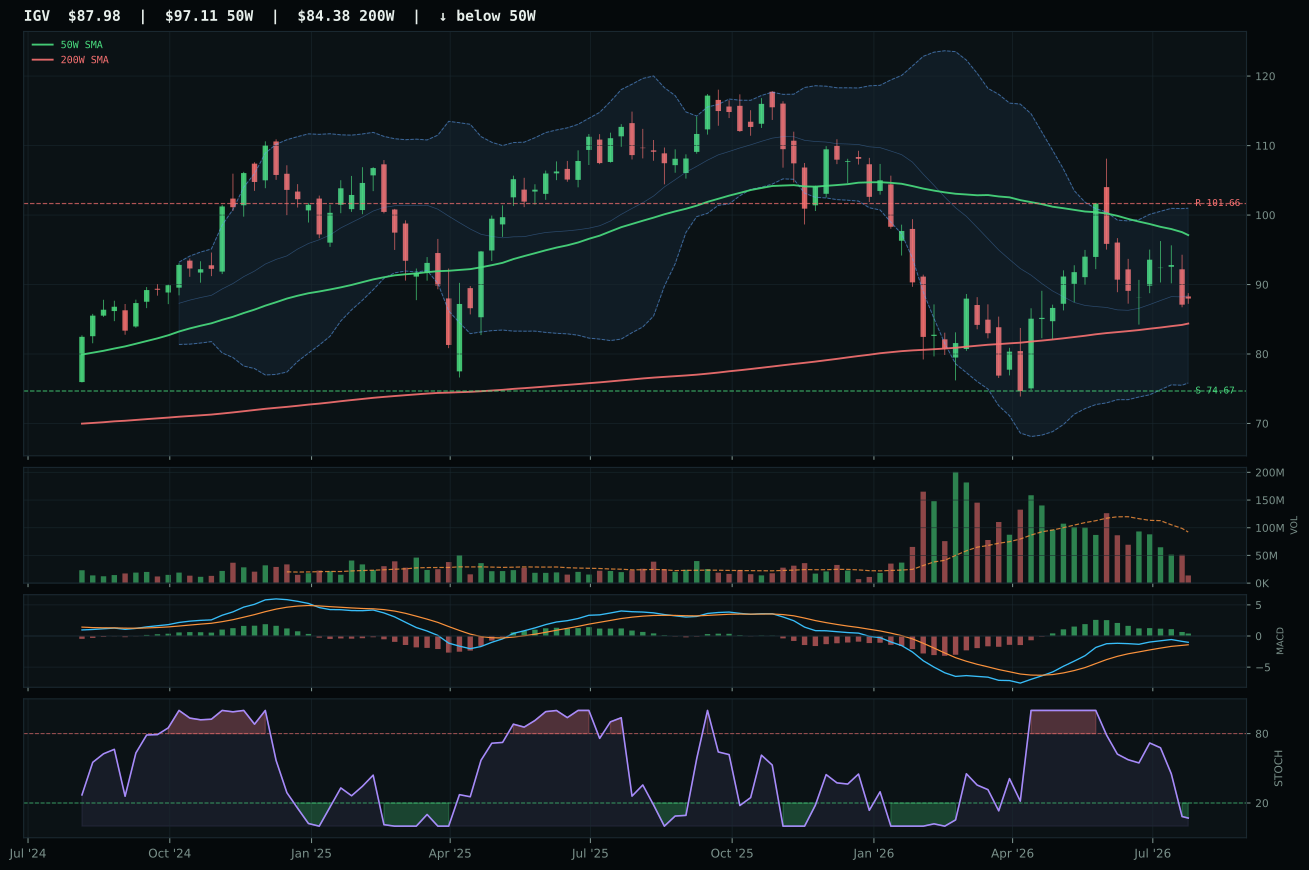
IGV has a neutral structure profile with -0.2% 13-week relative strength versus SPY.
A failed hold above support would weaken the setup.
Actionable but governed by invalidation levels.
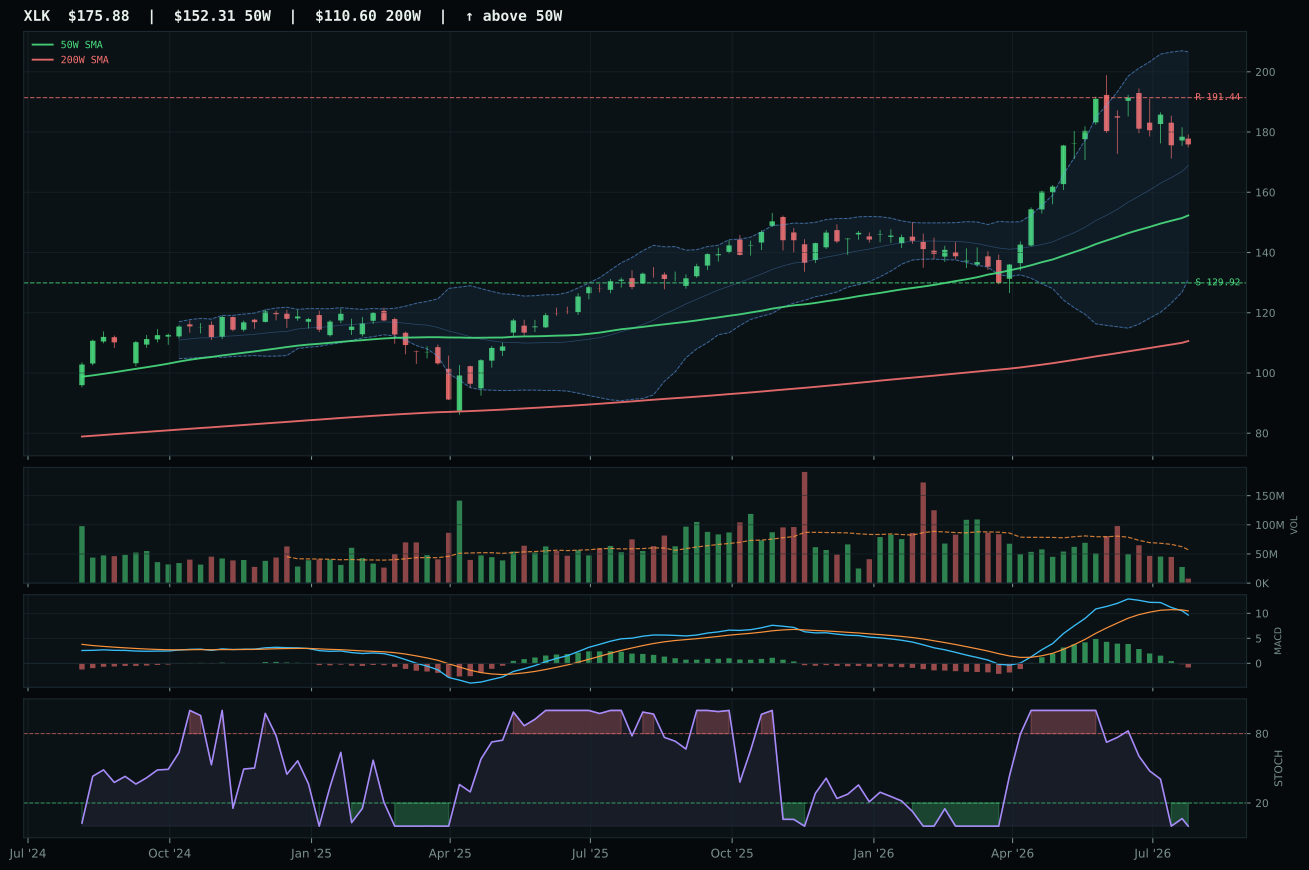
XLK has a vertical extension profile with 6.3% 13-week relative strength versus SPY.
A failed hold above support would weaken the setup.
Actionable but governed by invalidation levels.
CIBR defeated IGV by 21.3 points because cybersecurity maintained the tighter technical structure the category demanded in a mixed macro environment. Price sits 18.7% above the 50-week moving average with a bullish but flattening MACD and falling stochastic RSI—a setup that penalizes entry risk but rewards those already positioned, especially when 28% relative strength versus SPY and 31.5% thirteen-week returns confirm new money is still flowing in. IGV's problem wasn't ambiguity; it was concrete weakness: category-relative strength collapsed to -6.5% versus CIBR's 21.7%, stochastic RSI rolled over into oversold territory, and volume participation thinned to near zero, signaling early abandonment of the position. The 67-point structure score versus 74 for CIBR tells a story: one is being accumulated; the other is drifting.
Technology earned 10% because two higher-scoring categories dominated the allocation decision this week, not because the setup lacks merit. CIBR's technical evidence scores 81.8/100—among the portfolio's cleanest trend-relative-strength combinations—but macro/narrative fit registers only 56/100, dragged down by active credit stress (-9 weighting), dollar pressure (-4), and broad market bear dynamics. The category's 58/100 macro fit sits well below the 85/100 we see in Traditional Energy or the 86/100 strength in Agriculture. In a transition regime where liquidity expansion and risk appetite remain partially intact, a cybersecurity name with extended valuation cannot compete with real-asset sectors where inflation pressure, supply shortage, and commodity breadth actively push capital toward the bottom of the capital structure. Move macro fit to 70+ and CIBR graduates to top-2 allocation instantly.
Defense & Aerospace — ITA
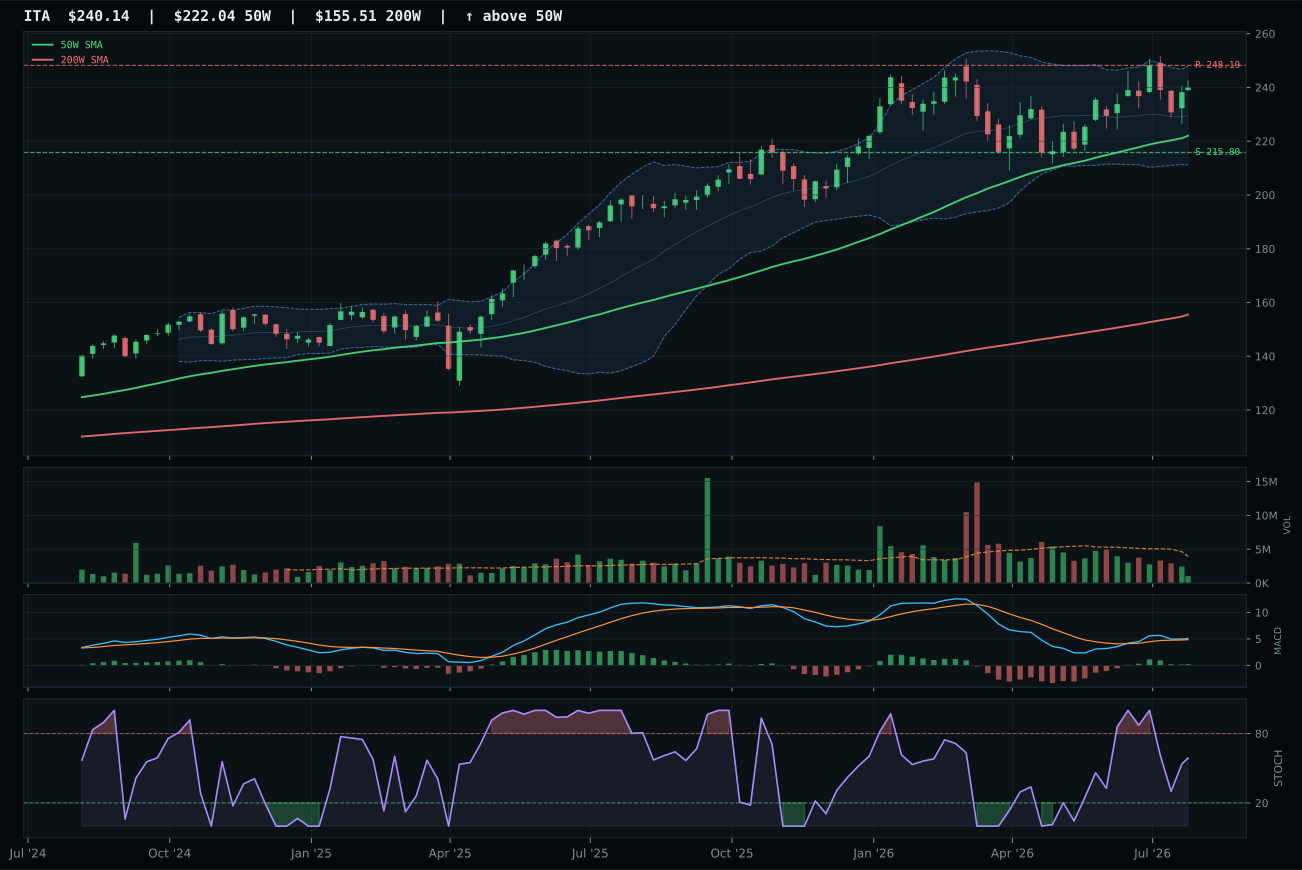
ITA has a neutral structure profile with 7.8% 13-week relative strength versus SPY.
A failed hold above support would weaken the setup.
Actionable but governed by invalidation levels.
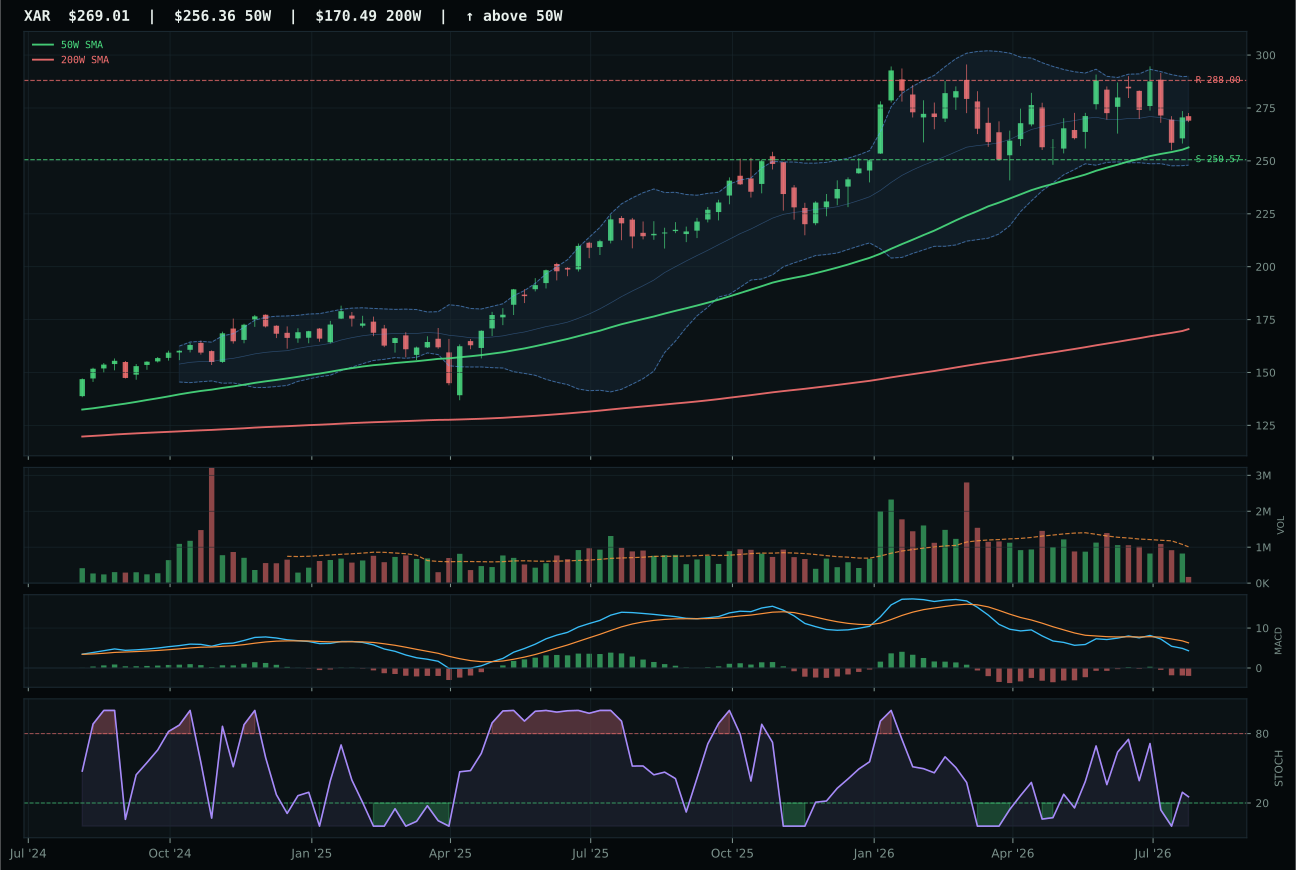
XAR has a neutral structure profile with 1.4% 13-week relative strength versus SPY.
A failed hold above support would weaken the setup.
Actionable but governed by invalidation levels.
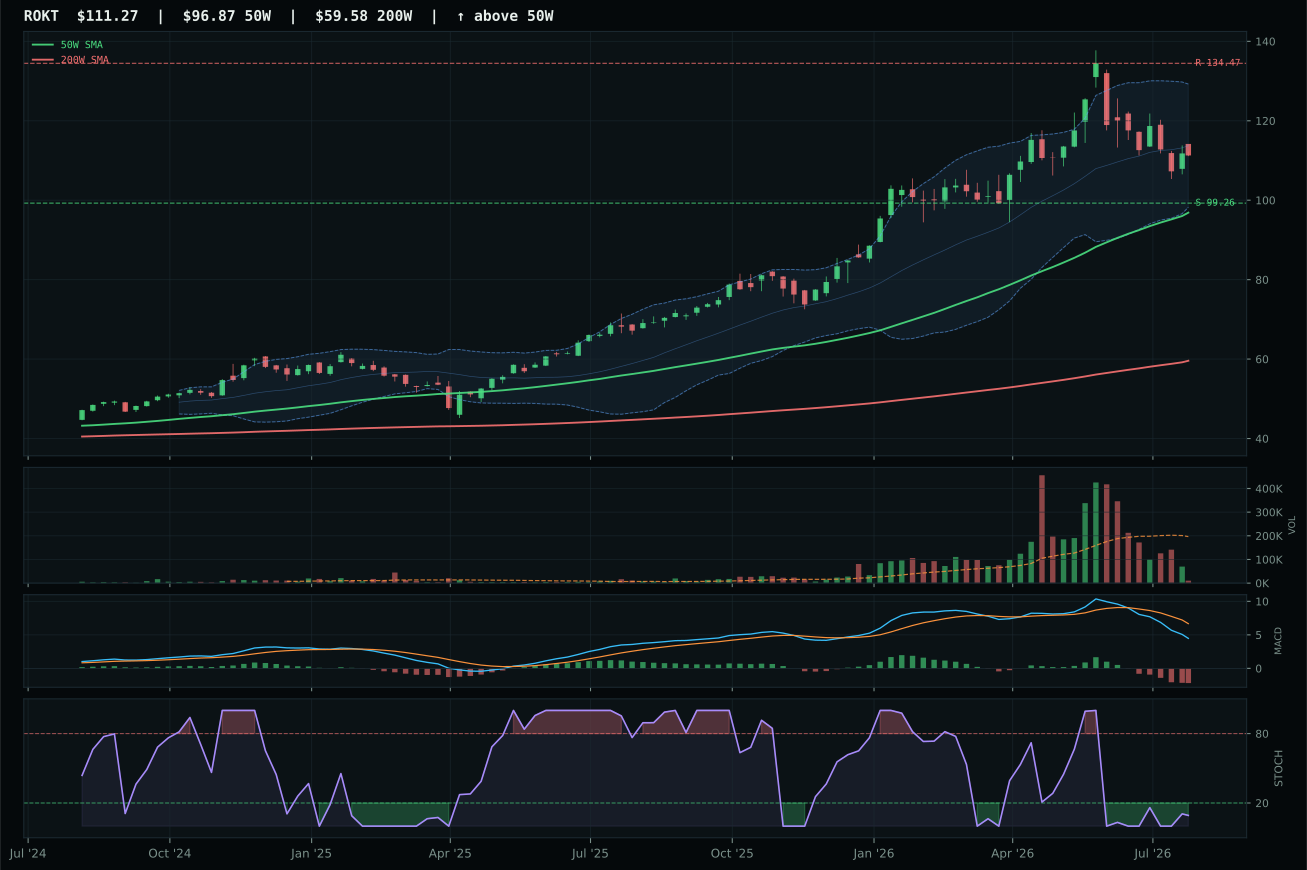
ROKT has a vertical extension profile with -2.9% 13-week relative strength versus SPY.
A failed hold above support would weaken the setup.
Actionable but governed by invalidation levels.
ITA won by 12.5 points over XAR because relative strength remained positive while the broader defense category weakened. Price trades 8.6% above the 50-week moving average with MACD still bullish (though flattening) and category-relative strength at 6.4%—meaning ITA is taking share inside the defense basket even as defense itself faces headwinds. XAR's MACD rolled into bearish/weakening territory while its category-relative strength flatlined at 0%, a double negative that disqualifies it from leadership despite neutral volume. ITA's 87.5/100 momentum confirmation versus XAR's 39/100 underscores the technical gap: one is showing fresh leadership, the other is treading water. Volume at 0.75x the 20-week average is thin but acceptable when structure (71/100) and trend (100/100) combine to support the thesis that defense-prime cash flows are rotating into large-cap durable names.
Defense & Aerospace earns 10% because the macro environment actively supports it (+6 for broad market bear, +3 for dollar pressure) while its 64/100 category-level macro fit sits above the portfolio median. At 49.4 category score, it ranks fifth—a solid mid-tier position that justifies allocation but not top-2 selection where WEAT and XLE dominate. ITA's 77/100 technical evidence is respectable, but the 59/100 macro/narrative fit reveals structural dependency on crisis dynamics that the current mixed macro regime only partially supplies. Unlike energy, where energy scarcity (+16) and real-asset sponsorship (+7) compound, defense benefits from a narrow risk-off impulse that could reverse on even modest good news. Hold the position as portfolio ballast; it offers positive risk-adjusted return without heroic macro assumptions.
AI — BOTZ
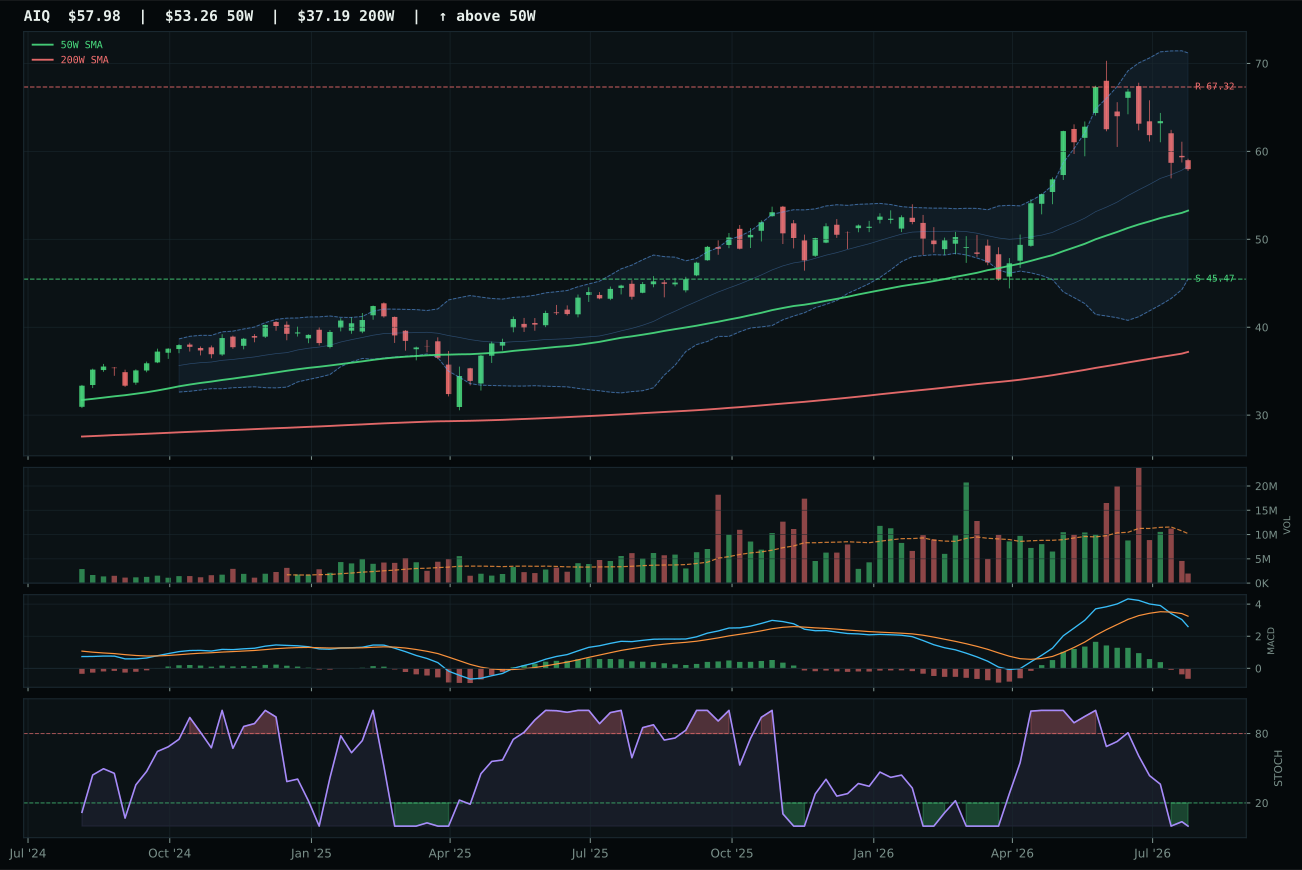
AIQ has a neutral structure profile with 1.7% 13-week relative strength versus SPY.
A failed hold above support would weaken the setup.
Actionable but governed by invalidation levels.
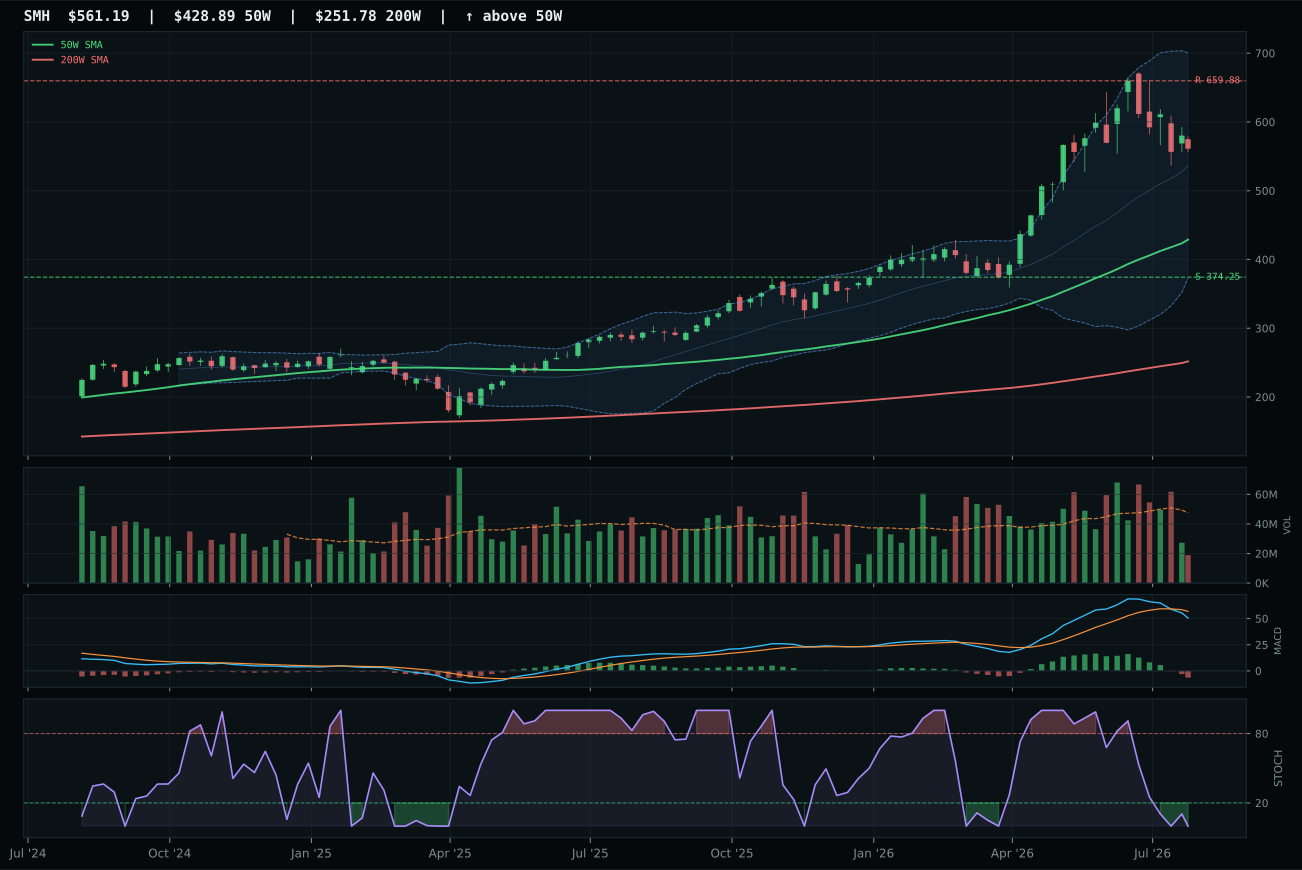
SMH has a vertical extension profile with 7.3% 13-week relative strength versus SPY.
A failed hold above support would weaken the setup.
Actionable but governed by invalidation levels.
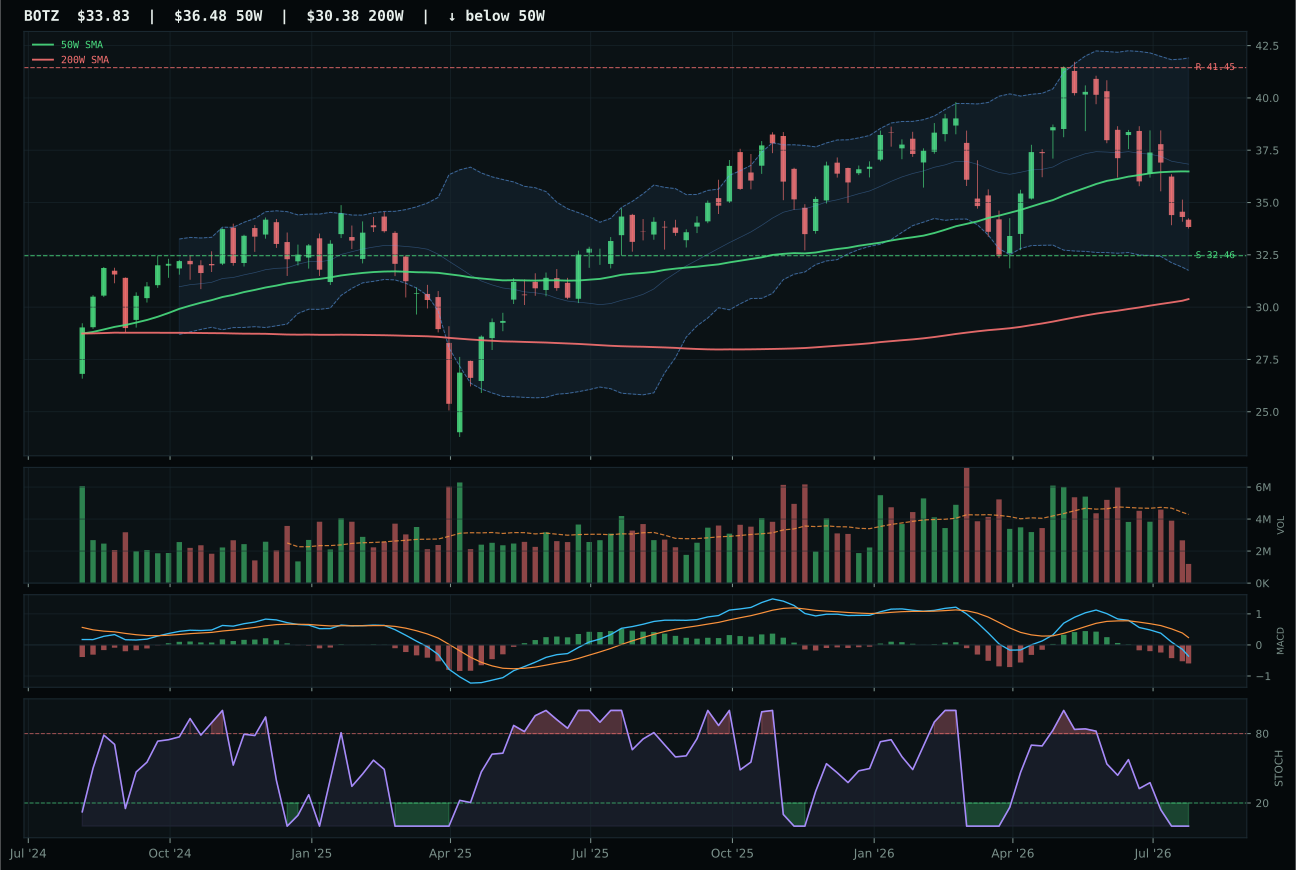
BOTZ has a pullback into support profile with -12.9% 13-week relative strength versus SPY.
A failed hold above support would weaken the setup.
Actionable but governed by invalidation levels.
BOTZ won the AI category despite the worst composite score in the entire portfolio—a 37/100—precisely because the risk-reward asymmetry inverted in its favor. Price dropped 17.3% below the 50-week average to sit near 52-week lows with only 4.2% downside to support but 90-point risk/reward structure, meaning every dollar of capital deployed has limited loss potential and unlimited repair upside when oversold stochastic RSI (0.00) and improving MACD confirm capitulation. AIQ carried superior momentum (+24 composite vs 0) and better macro sponsorship (71/100 fit versus 55/100), but it's still 9.4% above the 50-week and generating -12.9% RS versus SPY—late-party positioning in a bear regime. BOTZ's pullback-into-support setup with timing scoring 80/100 is objectively cleaner than AIQ's neutral structure at 77/100 timing, because pullback setups with defined support offer discrete invalidation levels that match portfolio risk discipline.
AI merits 10% because macro sponsorship for AI growth is active at +14 weighting, and BOTZ's risk-reward profile (98/100) functions as portfolio insurance when broad market bear remains active (-8). The 43.3 category score ranks seventh among the 10 categories, trailing WEAT (73.5), XLE (60.0), XLU (52.7), CIBR (51.2), and ITA (49.4), so it loses the top-2 fight on absolute merit. However, the category's 64/100 macro fit and active energy/real-asset bias mean that when liquidations accelerate, oversold AI hardware and robotics demand capital to rotate before recovery. The tight support level at 32.46 with neutral volume creates a technical reason to maintain exposure without forcing large new allocation at extended prices; this is portfolio construction wisdom, not a momentum chase. If BOTZ holds support and MACD recrosses above signal, reallocation to higher-ranked categories will execute automatically.
Industrial Metals — COPX
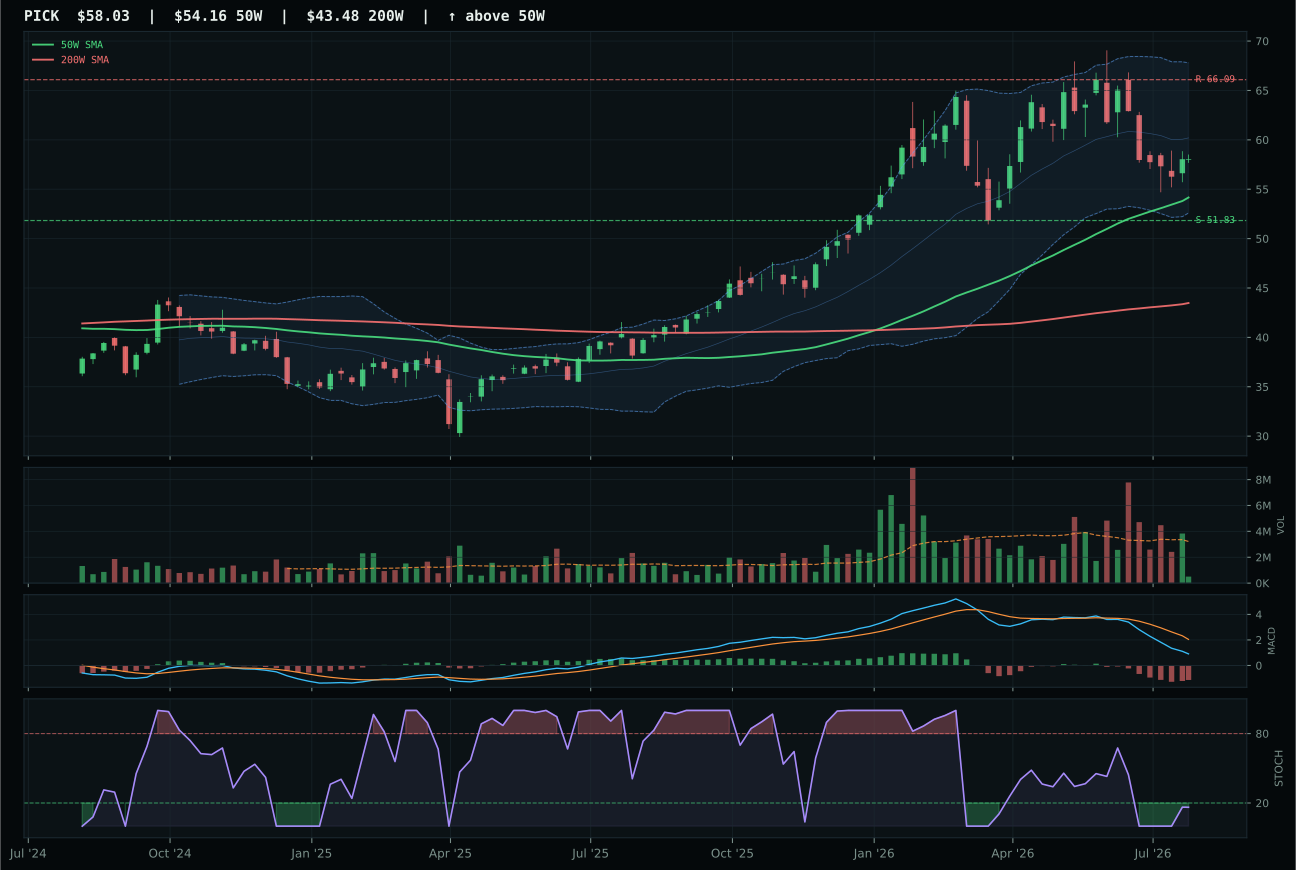
PICK has a neutral structure profile with -9.6% 13-week relative strength versus SPY.
A failed hold above support would weaken the setup.
Actionable but governed by invalidation levels.
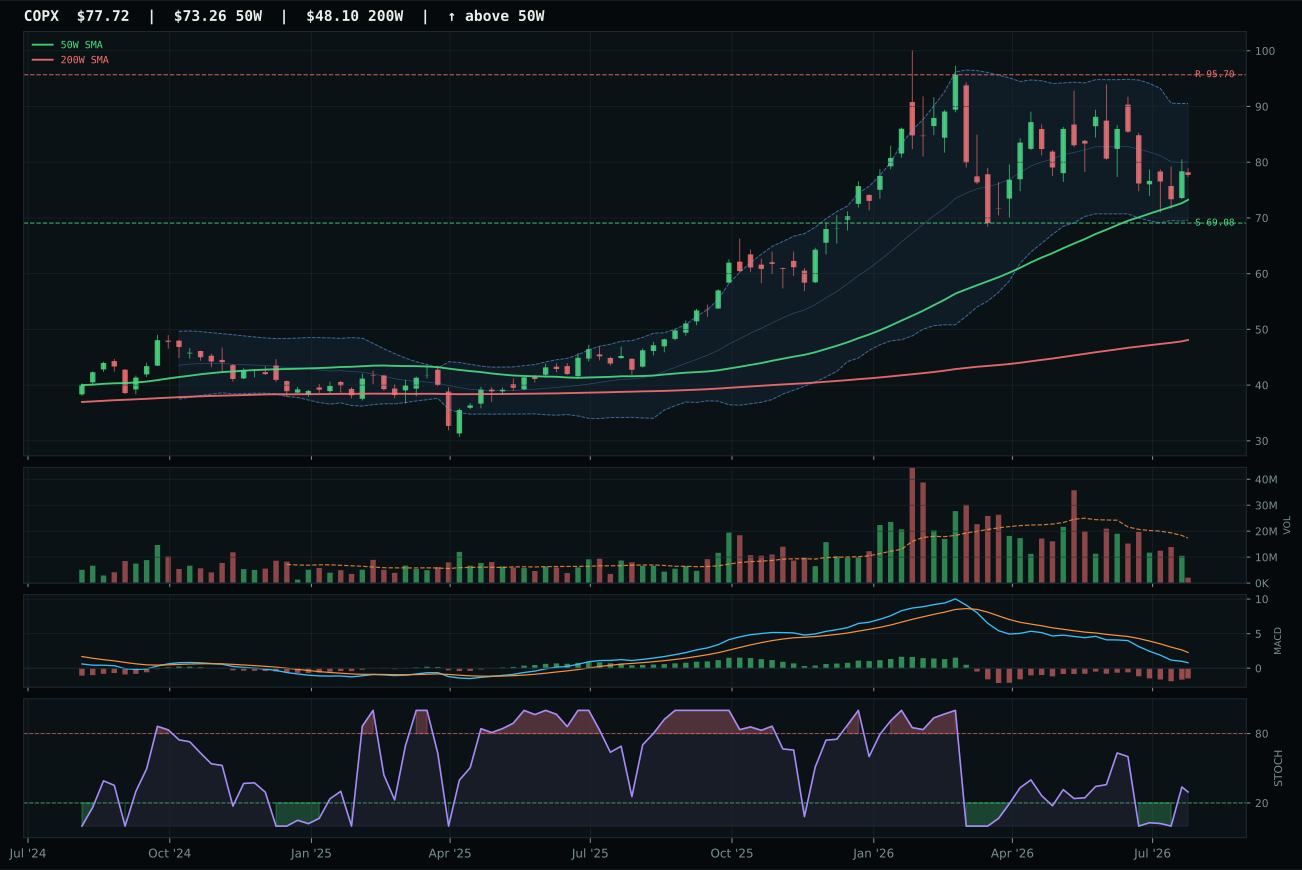
COPX has a neutral structure profile with -9.1% 13-week relative strength versus SPY.
A failed hold above support would weaken the setup.
Actionable but governed by invalidation levels.
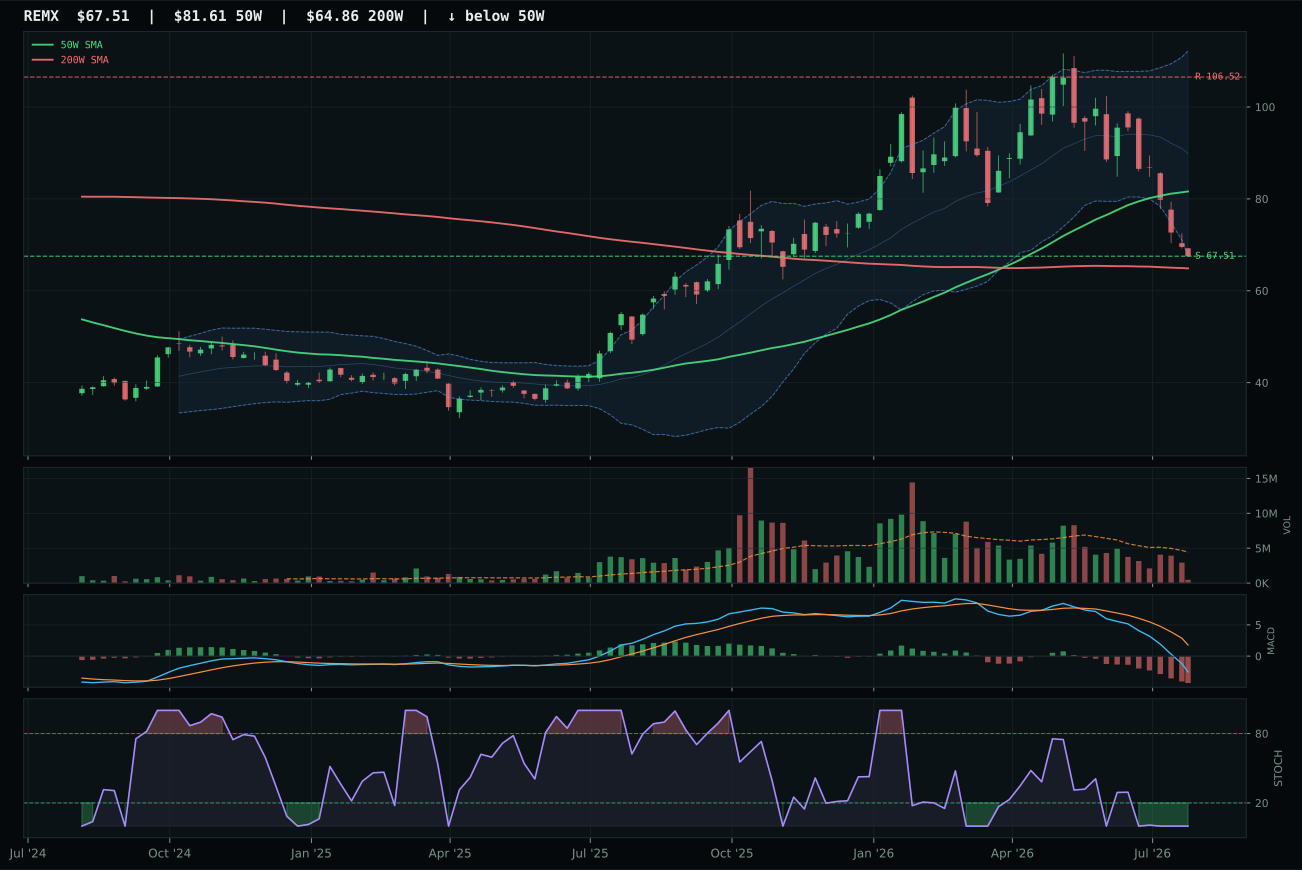
REMX has a pullback into support profile with -35.0% 13-week relative strength versus SPY.
A failed hold above support would weaken the setup.
Actionable but governed by invalidation levels.
COPX edged PICK by only 1.6 points in the closest category decision of the week because both exhibit weak technical evidence (39.0 vs 37.7) and depend entirely on macro sponsorship—metals scarcity and commodity breadth positive. COPX's timing score (85/100) beat PICK's (84/100) because stochastic RSI at 0.30 (rising mid-zone) offers cleaner entry geometry than PICK's oversold-turn-up oscillator pattern. Both trade bearish MACD and thin volume at 0.68x participation, but COPX's 0.5% category-relative strength versus PICK's 0.0% provides the marginal advantage when the category itself generates negative momentum. This is a call between two mediocre technicals where macro sponsorship for metals scarcity (+14 weighting) and commodity breadth (+10) provides the only conviction. Price at 7% above the 50-week with resistance 18.8% higher creates unfavorable risk-reward (65/100), so the allocator must accept that both setups are waiting for catalysts, not confirming them.
Industrial metals earned 10% allocation because metals scarcity macro (+14), commodity breadth positive (+10), and real-asset sponsorship (+6) total +30 weighting despite credit stress (-7) and dollar pressure (-7) headwinds. The 41.3 category score ranks eighth—above only precious metals (38.9) and nuclear (37.4)—reflecting weak technical evidence across the three-ETF basket. COPX's 39/100 technical evidence is propped up by 63/100 macro fit, creating a portfolio slot that works only if macro descriptors persist. Unlike agriculture or energy where price structure reinforces macro, industrial metals require external shock (Chinese stimulus, supply accident, inventory short-squeeze) to generate directional conviction. Hold for rotation alpha if base metals' recent underperformance extends; exit immediately if COPX's support at 69.08 breaks, signaling that even macro support cannot sustain demand.
Precious Metals — GLD
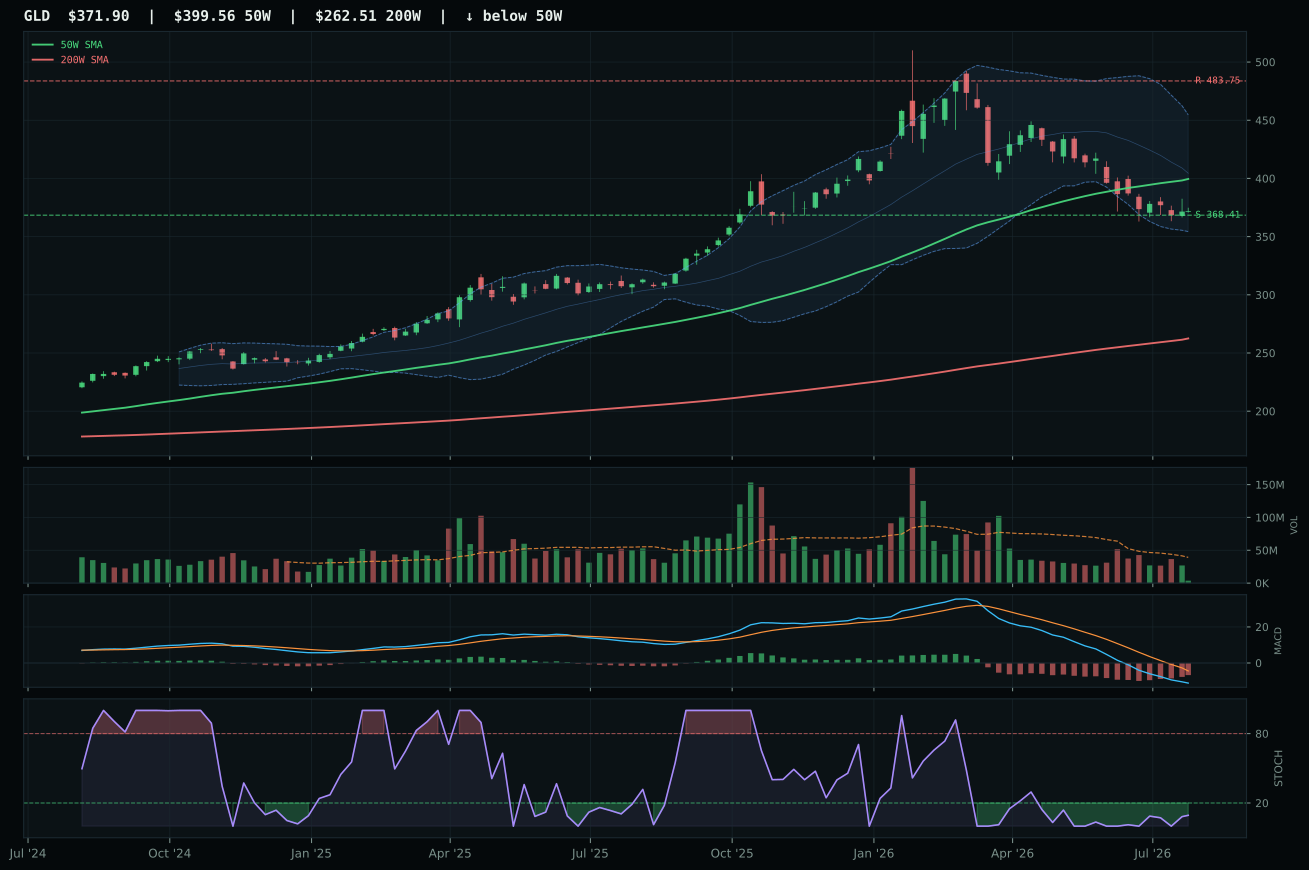
GLD has a pullback into support profile with -17.7% 13-week relative strength versus SPY.
A failed hold above support would weaken the setup.
Actionable but governed by invalidation levels.
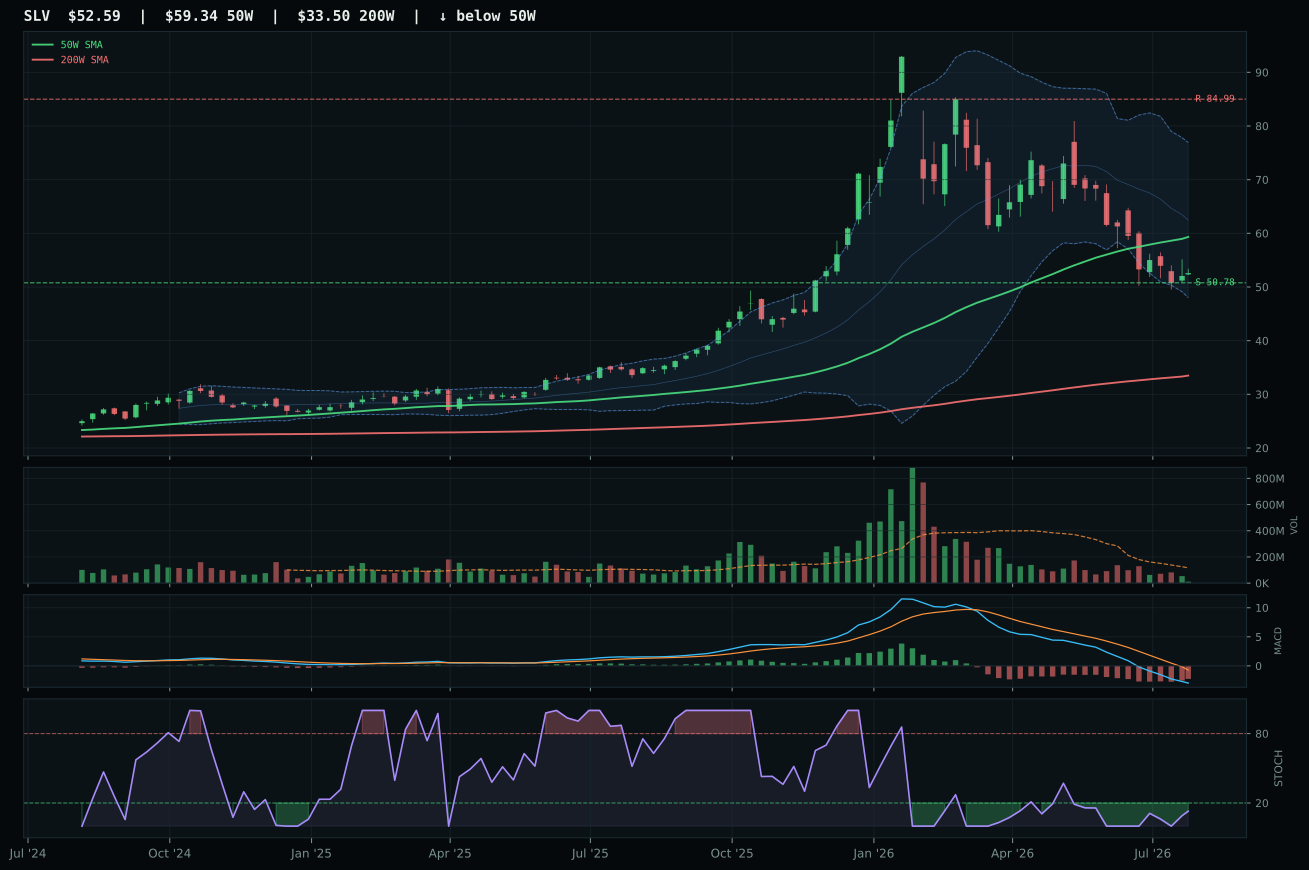
SLV has a pullback into support profile with -27.1% 13-week relative strength versus SPY.
A failed hold above support would weaken the setup.
Actionable but governed by invalidation levels.
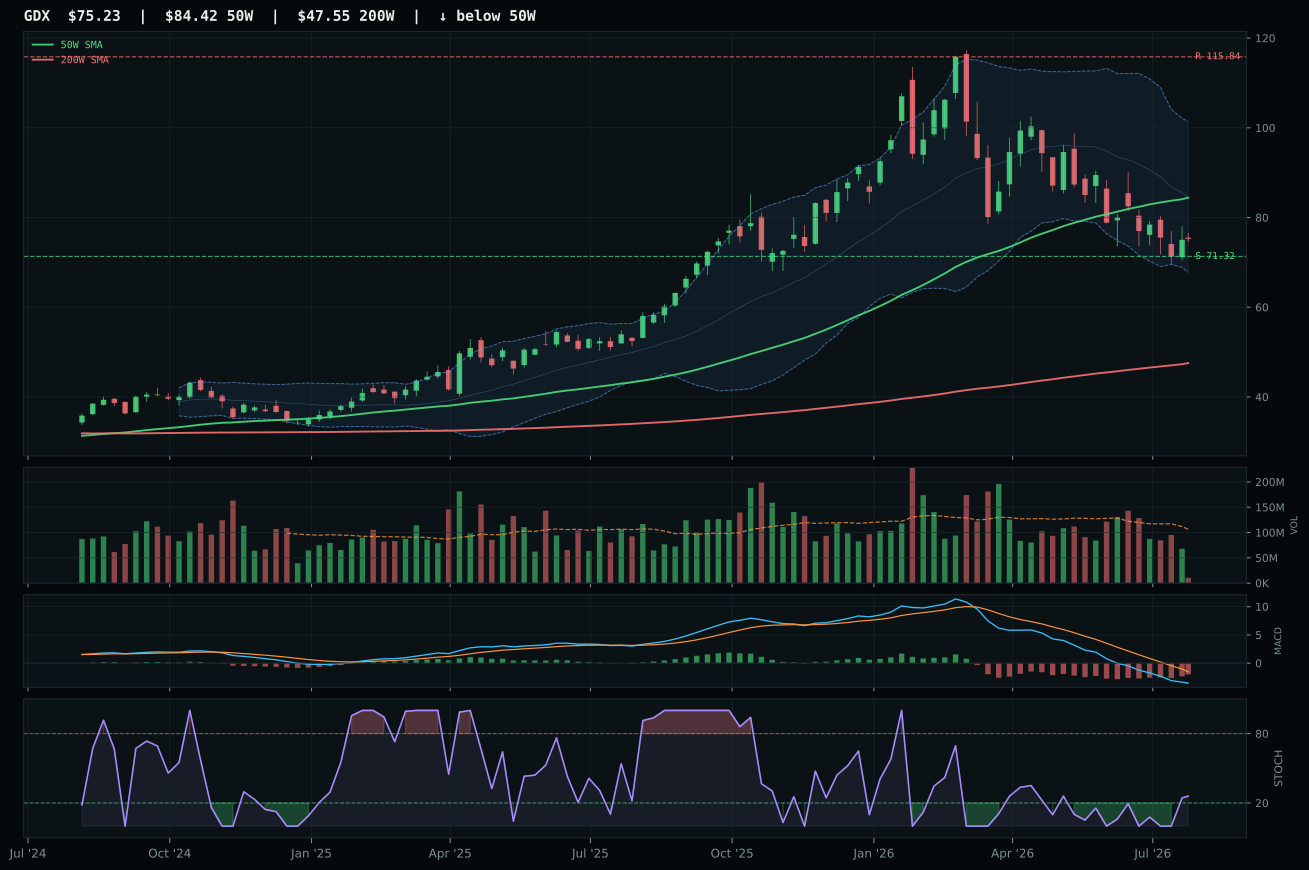
GDX has a neutral structure profile with -23.8% 13-week relative strength versus SPY.
A failed hold above support would weaken the setup.
Actionable but governed by invalidation levels.
GLD won precious metals by 21.3 points over SLV because gold's monetary-hedge identity carries less industrial beta volatility during macro transition periods. Price pulled 6.6% below the 50-week to sit near Fibonacci 0.618 (380.70) with stochastic RSI at 0.09 (oversold turn up) and MACD bearish-but-improving—textbook capitulation setup with 100/100 timing and 98/100 risk/reward (0.9% downside to support, -23.1% upside to resistance). SLV's -27.1% thirteen-week relative strength versus gold's -17.7% tells the story: silver got hit twice—once as equities fell, again as industrial demand rolled over. GLD's 6.1% category-relative strength versus SLV's -3.3% confirms the gold-versus-silver rotation. Volume at 0.74x participation is thin but acceptable when invalidation support sits explicitly defined at 368.41 and mean-reversion setup geometry is this clean.
Precious metals earned 10% because timing score (100/100) and risk/reward (98/100) created a portfolio-wide hedge opportunity against credit stress (-9 weighting) and risk-appetite-positive drawdown. At 38.9 final category score, metals rank ninth of ten categories, but that ranking reflects temporary momentum underperformance, not structural exclusion. The 47/100 category-level macro fit sits materially below WEAT and XLE due to dollar pressure (+3, net negative in transition) and risk appetite remaining partially intact. GLD's technical evidence (53.1/100) is modest, held up almost entirely by timing and risk/reward rather than trend or relative strength, which means this is a tactical consolidation hold, not a structural overweight. If credit stress activates (+2 weighting currently), metals rerank to top-3 instantly. Current position size reflects option value: the portfolio buys insurance cheaply and holds through support at 368.41, exiting if that level breaks.
Nuclear Energy — URNM
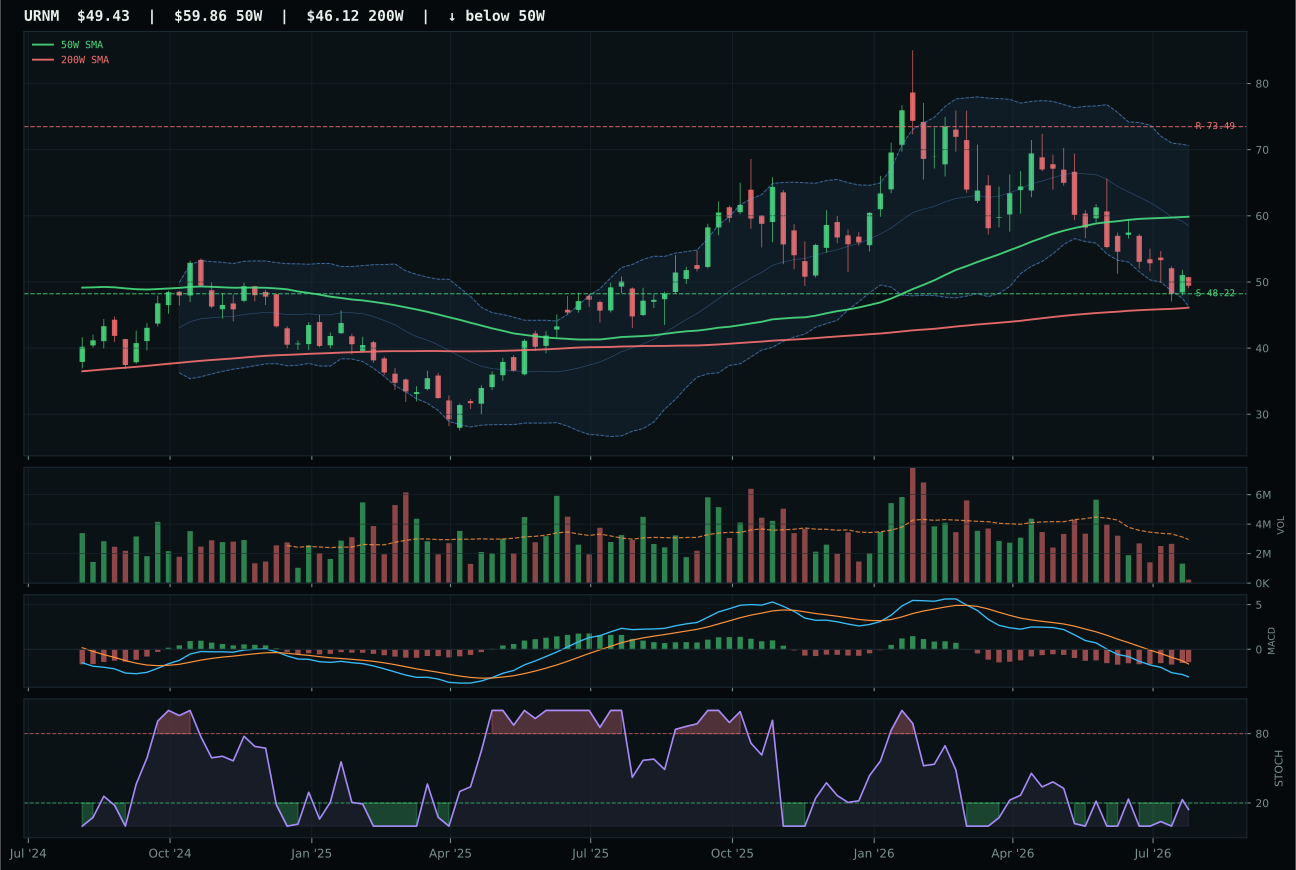
URNM has a pullback into support profile with -29.7% 13-week relative strength versus SPY.
A failed hold above support would weaken the setup.
Actionable but governed by invalidation levels.
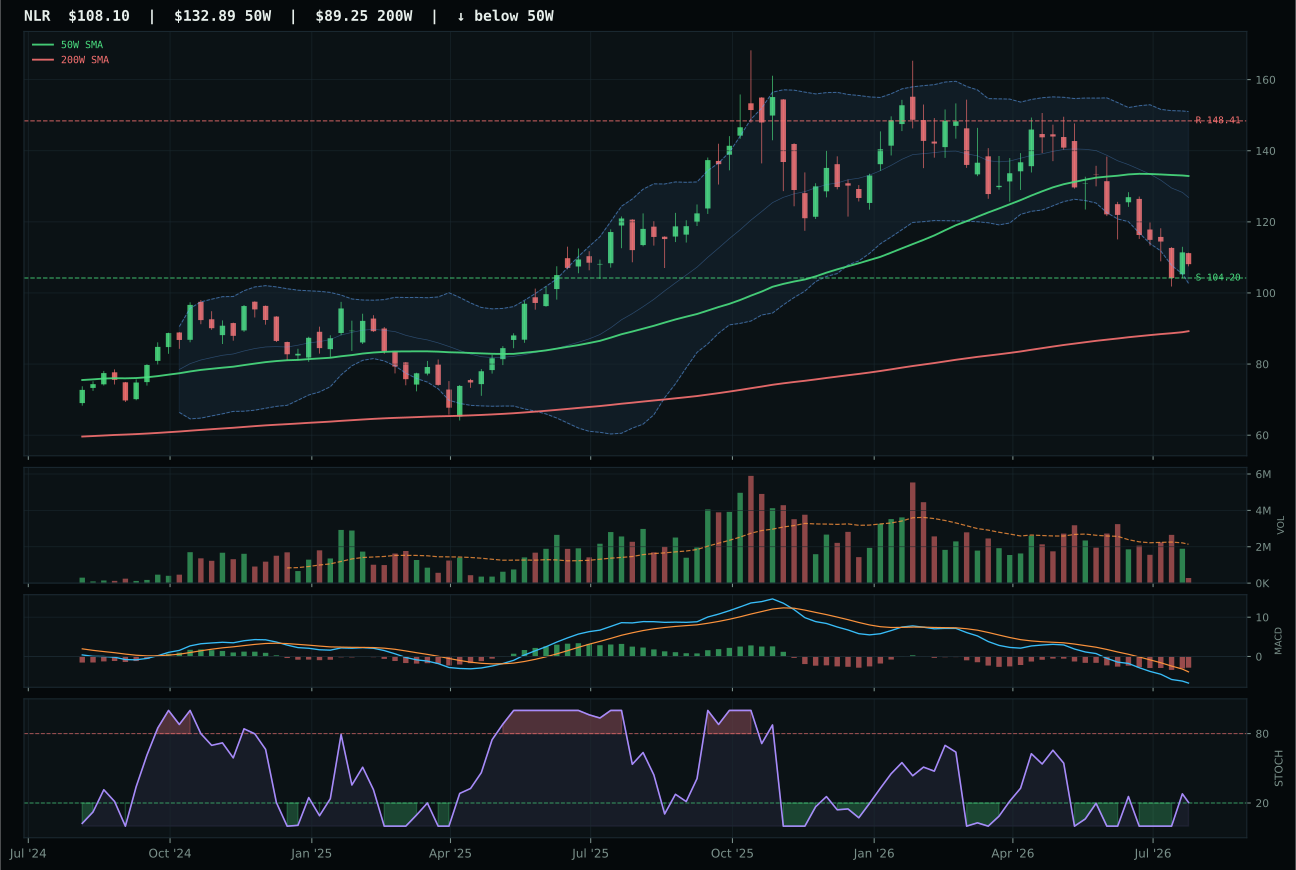
NLR has a pullback into support profile with -28.3% 13-week relative strength versus SPY.
A failed hold above support would weaken the setup.
Actionable but governed by invalidation levels.
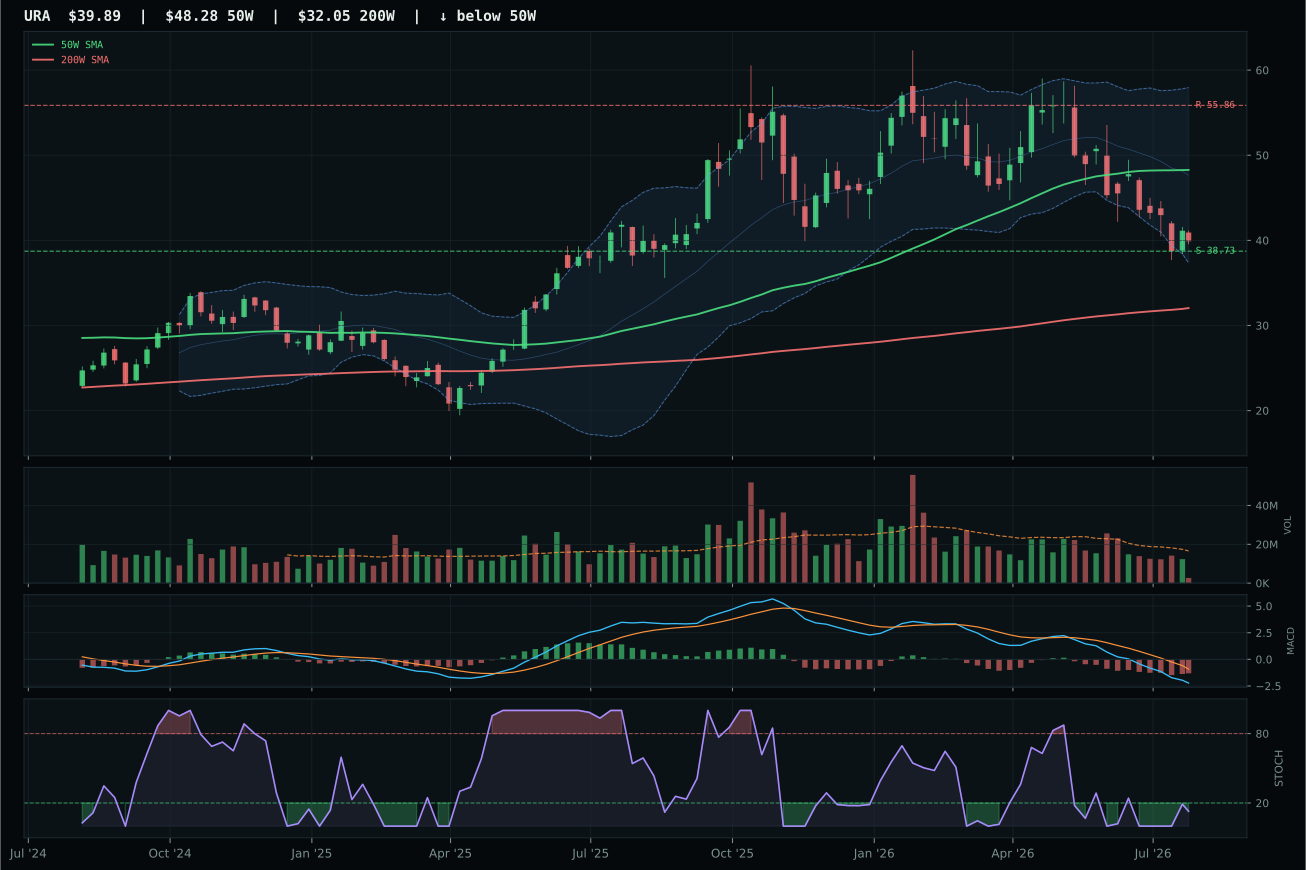
URA has a pullback into support profile with -31.4% 13-week relative strength versus SPY.
A failed hold above support would weaken the setup.
Actionable but governed by invalidation levels.
URNM won nuclear despite a 37.4 category score (tied with precious metals at the portfolio bottom) because timing (79/100) and risk/reward (75/100) created the cleanest invalidation setup available in the category. Price dropped 17.3% below the 50-week to sit near 52-week lows with 2.5% downside to support at 48.22 and stochastic RSI at 0.10 (oversold turn up), meeting the technical criteria for defined-risk entry. NLR's timing (74/100) and bearish-weakening MACD disqualified it despite neutral volume; URA's weak composition sealed its third-place finish. Energy scarcity (+8 weighting) and real-asset sponsorship (+7) provide marginal support, but the 69/100 macro fit and broad-market-bear activation (-8) mean URNM trades on capitulation mechanics, not fundamental demand. Zero category-relative strength and zero four-week momentum confirm this is a technical-only case built on mean-reversion Fibonacci geometry, not sponsor behavior.
Nuclear Energy earned 0% allocation this week, ranking 9th or 10th among the 10 categories, because despite a respectable 69.0 macro fit score (energy scarcity, real-asset sponsorship, positive risk appetite all active), the category's technical destruction—URNM at minus 26.2% thirteen-week, minus 29.7% versus SPY—combined with almost nonexistent volume and persistence (15.9 and 30.6 respectively) place it in bottom-tier breakdown territory. The macro narrative (energy security, nuclear proliferation hedge) is sound, but the category's 37.4 final score reflects the reality that no amount of macro support can justify allocating to securities in complete capitulation without at least one or two weeks of technical confirmation that the reversal is real rather than another lower-bounce. For Nuclear to earn even 10%, URNM would need to close decisively above 52.06 on the Fibonacci 0.786 reversal level with volume expansion above 1.0x average and MACD crossing above the signal line—proof that institutional buyers, not algorithmic bounce-traders, are accumulating. The exclusion is not a prediction that nuclear never recovers; it is a requirement that before committing capital to beaten-down names, you wait for technical sponsorship to materialize. URNM will be the first name considered when that setup appears.
Emerging Markets — IEMG
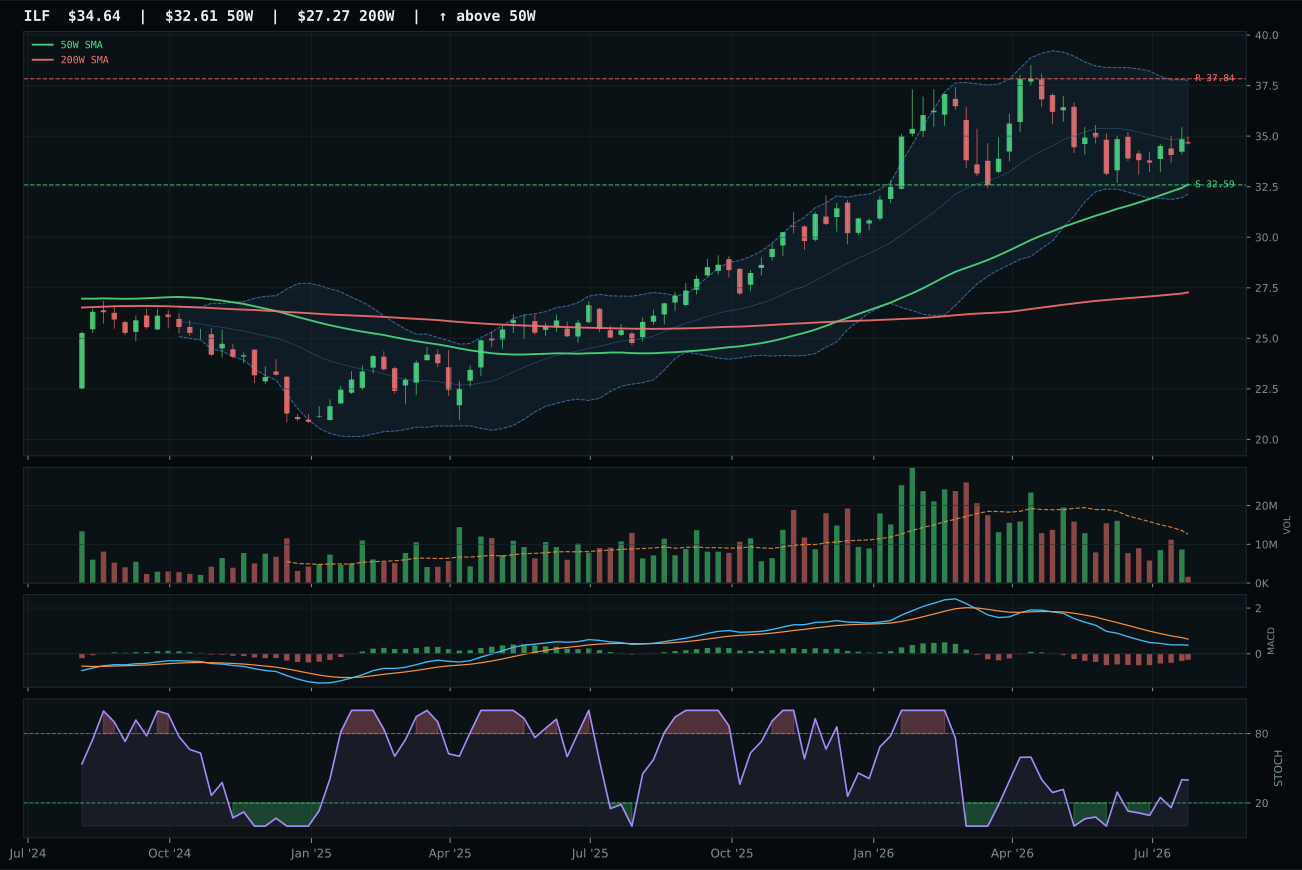
ILF has a neutral structure profile with -9.4% 13-week relative strength versus SPY.
A failed hold above support would weaken the setup.
Actionable but governed by invalidation levels.
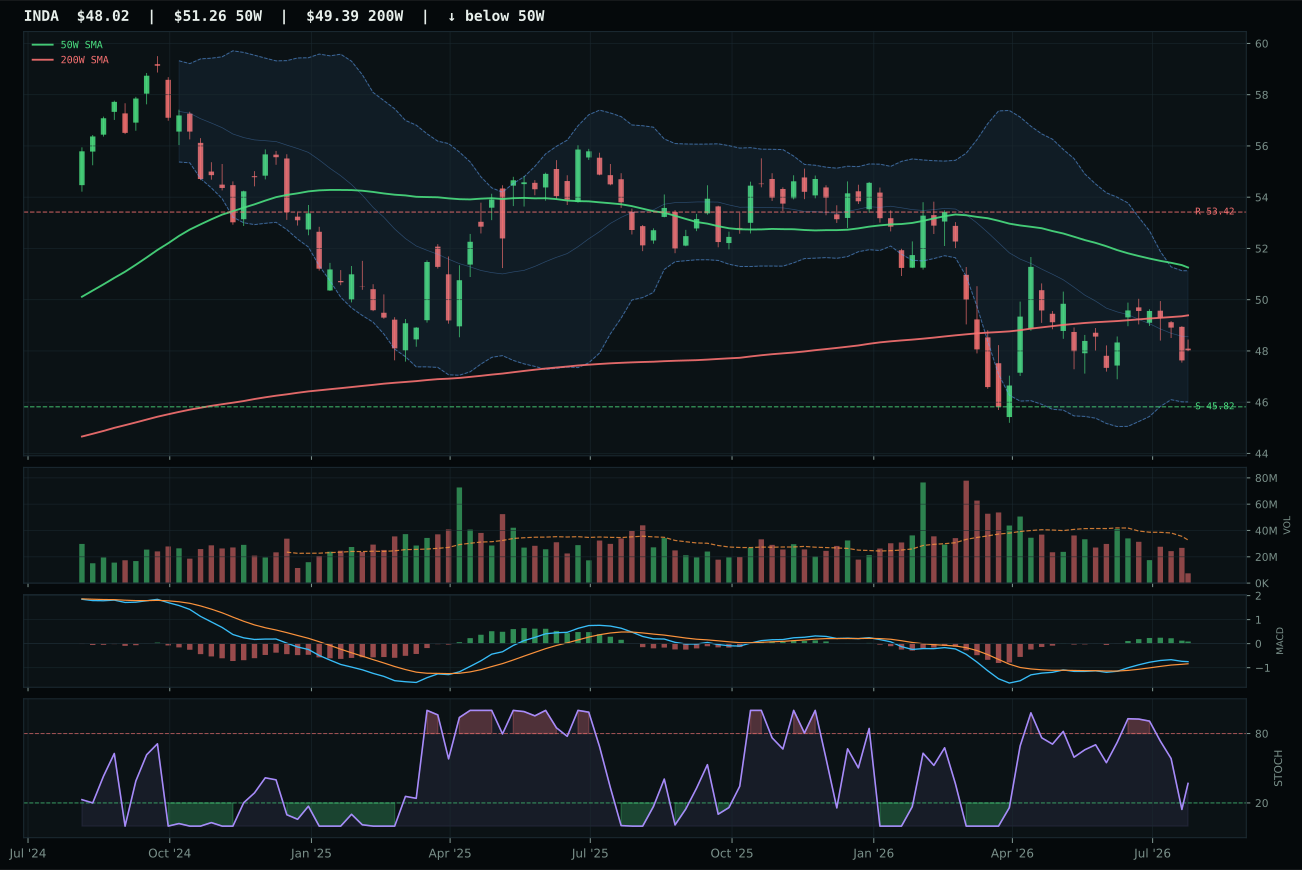
INDA has a pullback into support profile with -6.6% 13-week relative strength versus SPY.
A failed hold above support would weaken the setup.
Actionable but governed by invalidation levels.
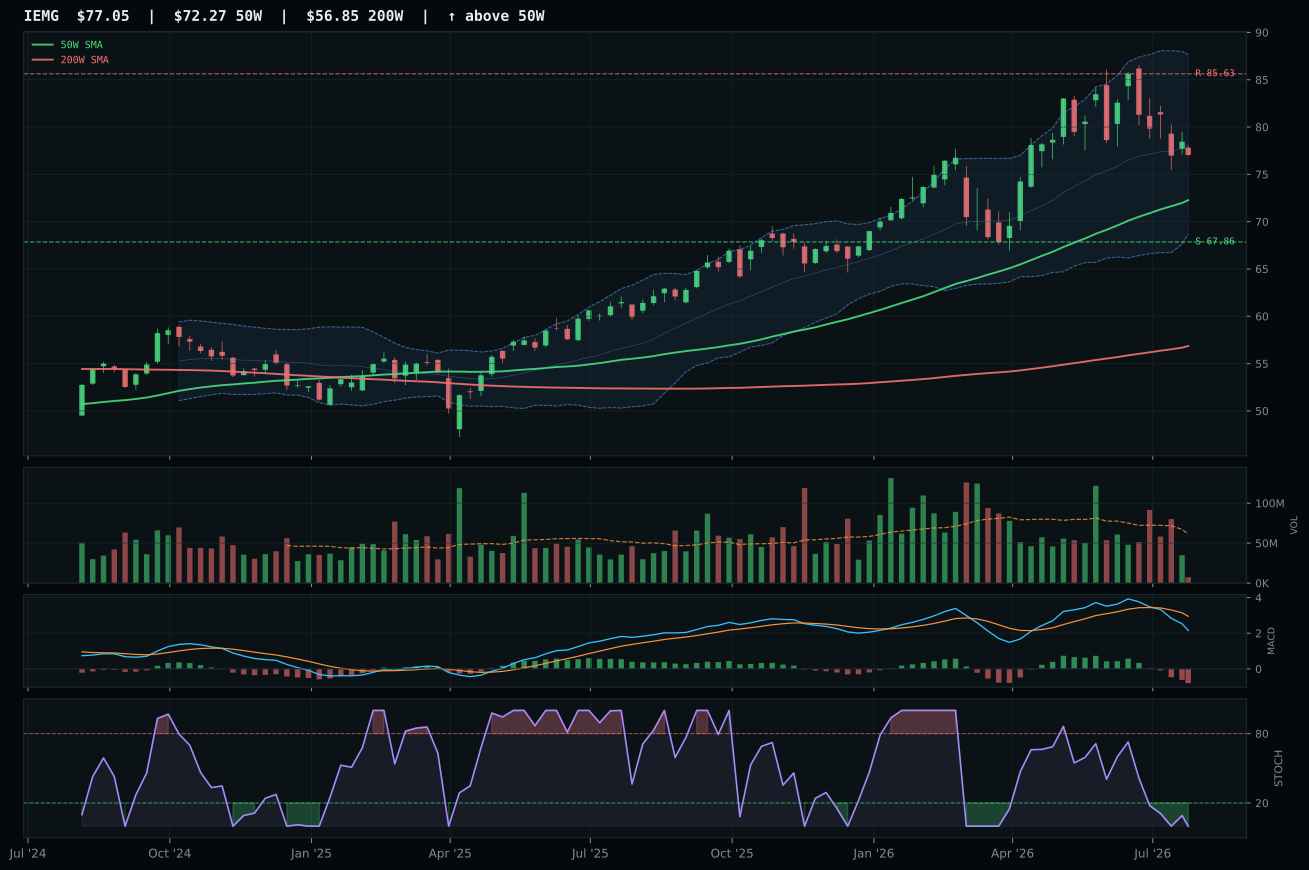
IEMG has a neutral structure profile with -4.9% 13-week relative strength versus SPY.
A failed hold above support would weaken the setup.
Actionable but governed by invalidation levels.
IEMG won emerging markets by 14.5 points over ILF because broad category weakness made every ETF's loss a relative victory, and IEMG's -4.9% SPY relative strength marginally beat ILF's -9.4% decline. Both show oversold technicals with MACD rollover and thin volume, but IEMG's neutral-structure setup avoids the pullback-into-support geometry that ILF presents at 32.59 support. Category-relative strength split decisively: IEMG managed 1.7% versus ILF's -2.8%, a signal that broad-market beta outperformed commodity-linked Latin America during the week's rotation. Neither ETF generated positive momentum; IEMG's 14.5/100 momentum confirmation versus ILF's 31/100 reflects the entire category's deterioration. Price sits 7.1% above the 50-week with stochastic at 0.00 (oversold), creating the technical setup that emerges when macro support collapses—a mean-reversion coil with undefined catalyst timing.
Emerging Markets earned 0% allocation, ranking 9th or 10th in the portfolio, because the category score of 22.0 reflects deep structural headwinds that no technical setup can overcome in a Transition/Mixed regime. Dollar pressure (active, minus 14) and credit stress (active, minus 10) are both hammering emerging-market capital flows; despite positive risk-appetite and liquidity-expansion signals, the dollar-denominated liability and credit-event risks dominate. The macro fit of only 33.0 tells the entire story: this category is swimming upstream against two major forces, and waiting for a better technical setup makes vastly more sense than rotating in because IEMG's oversold stochastic offers mean-reversion potential. For Emerging Markets to earn even 10%, the dollar would need to sustainably weaken (either through narrative shift or Fed pivot), credit stress would need to subside, and IEMG would need to reclaim the 50-week moving average on volume expansion. Until all three occur, capital is better deployed into real-asset and energy hedges that align with the current macro directions. IEMG and ILF are on the watchlist, not the portfolio.