
2026-07-17
Informational purposes only. The content in this report, including allocations, analysis, and commentary, is provided solely for informational and educational purposes. It does not constitute financial advice, investment advice, trading advice, or any other type of advice. Past performance does not guarantee future results. Always conduct your own research and consult a qualified financial professional before making investment decisions.
Weekly Allocation
| Ticker | Category | Weight | Role |
|---|---|---|---|
| WEAT | Agriculture & Livestock | 20% | Top-2 (20%) |
| XLE | Traditional Energy | 20% | Top-2 (20%) |
| CIBR | Technology | 10% | Tier-2 (10%) |
| XLU | Utilities & Infrastructure | 10% | Tier-2 (10%) |
| AIQ | AI | 10% | Tier-2 (10%) |
| ITA | Defense & Aerospace | 10% | Tier-2 (10%) |
| COPX | Industrial Metals | 10% | Tier-2 (10%) |
| URNM | Nuclear Energy | 10% | Tier-2 (10%) |
Trade Instructions — Monday Open
Sell the tranche from 2026-06-19 (completing its 4-week hold). Buy the new tranche. Instructions show net portfolio changes — same-asset positions cancel, weight changes show the delta.
| Action | Ticker | Instruction |
|---|---|---|
| SELL | SMH | Sell 40% of SMH position (reduce 12.50% → 7.50%) |
| SELL | ITA | Sell 17% of ITA position (reduce 15.00% → 12.50%) |
| SELL | PAVE | Sell entire PAVE position (2.50% of portfolio) |
| SELL | GDX | Sell entire GDX position (2.50% of portfolio) |
| SELL | MOO | Sell entire MOO position (2.50% of portfolio) |
| SELL | XLK | Sell entire XLK position (2.50% of portfolio) |
| BUY | CIBR | Buy CIBR — 14.29% of freed cash (adds 2.50% to portfolio) |
| BUY | XLU | Buy XLU — 14.29% of freed cash (adds 2.50% to portfolio) |
| BUY | WEAT | Buy WEAT — 28.57% of freed cash (adds 5.00% to portfolio) |
| BUY | XLE | Buy XLE — 28.57% of freed cash (adds 5.00% to portfolio) |
| BUY | AIQ | Buy AIQ — 14.29% of freed cash (adds 2.50% to portfolio) |
Current Portfolio After Trade
Combined holdings across all 4 active tranches. Each tranche is 25% of the portfolio.
| Ticker | % of Portfolio | Weight Bar |
|---|---|---|
| CIBR | 17.50% | |
| ITA | 12.50% | |
| COPX | 10.00% | |
| XLU | 10.00% | |
| URNM | 7.50% | |
| WEAT | 7.50% | |
| SMH | 7.50% | |
| GLD | 5.00% | |
| BOTZ | 5.00% | |
| XLE | 5.00% | |
| ILF | 2.50% | |
| NLR | 2.50% | |
| VEGI | 2.50% | |
| FCG | 2.50% | |
| AIQ | 2.50% |
Macro Regime — Transition / Mixed
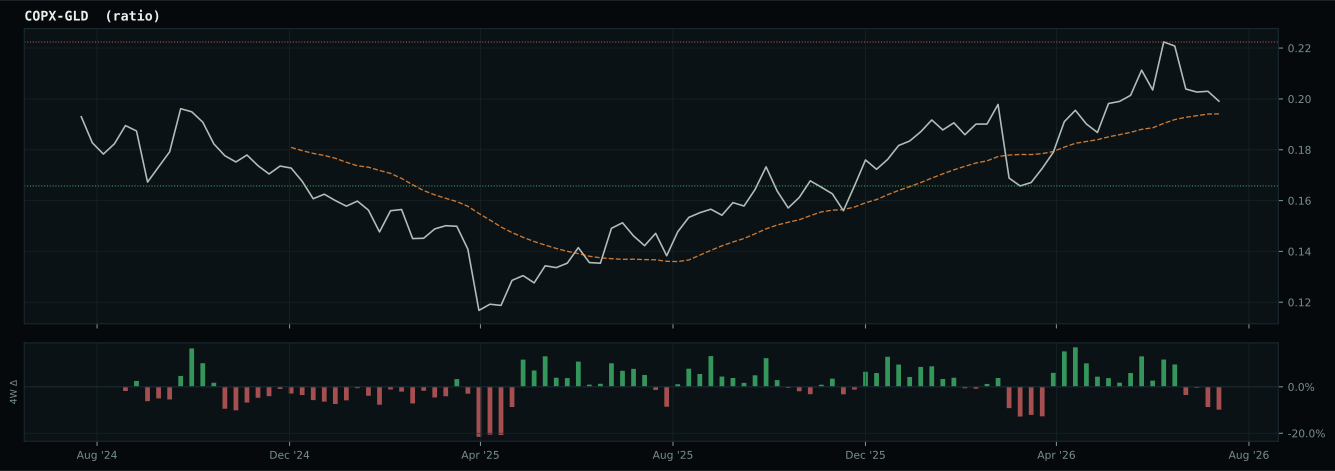
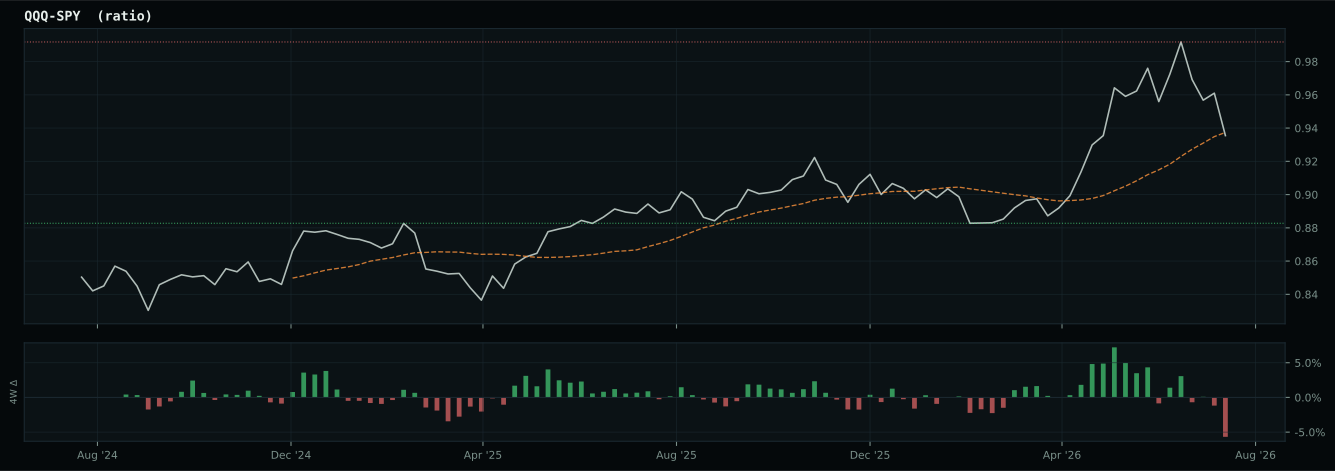
Macro Evidence Charts
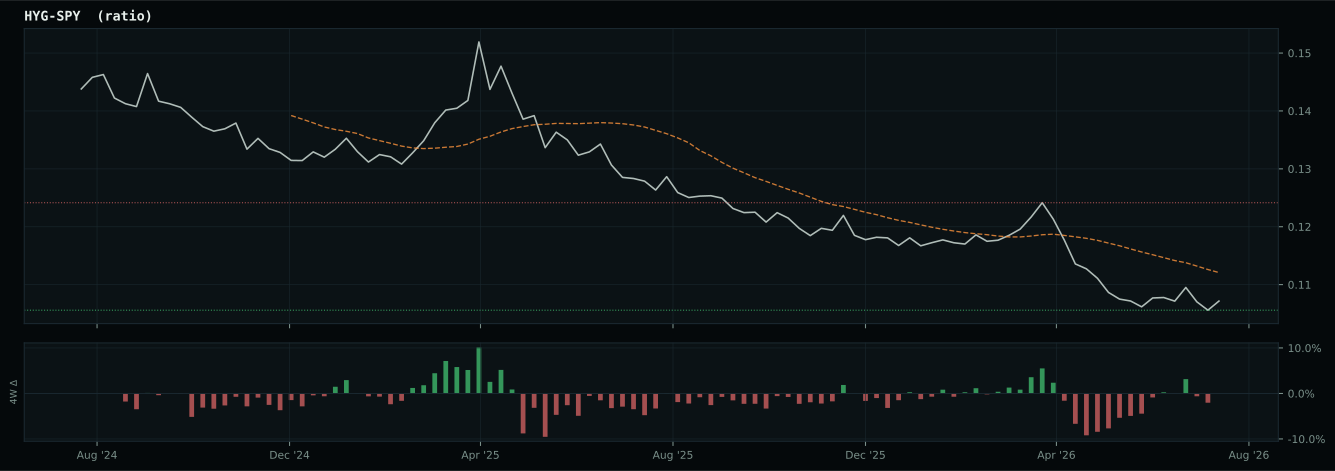
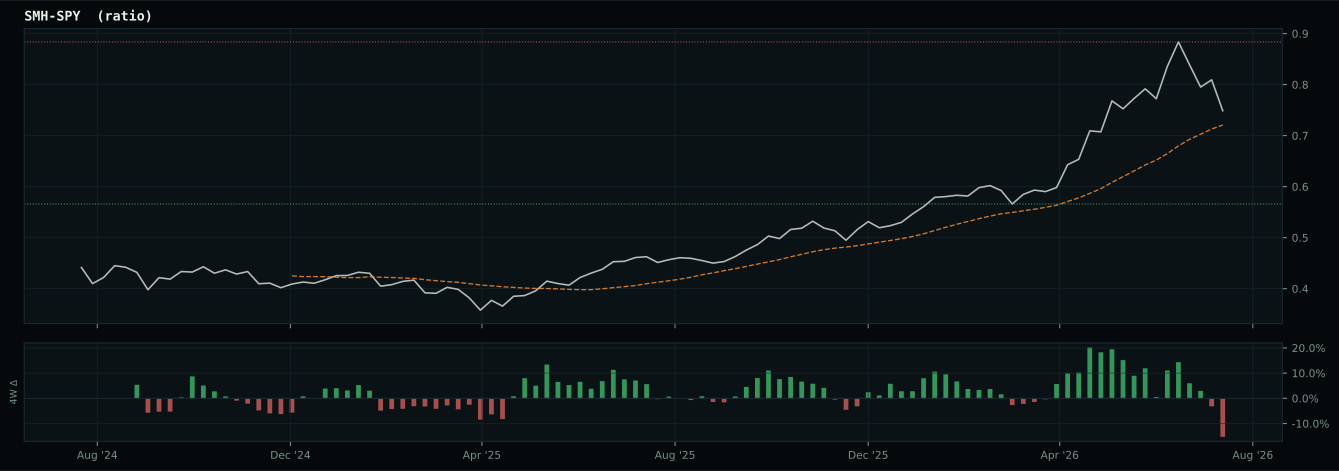
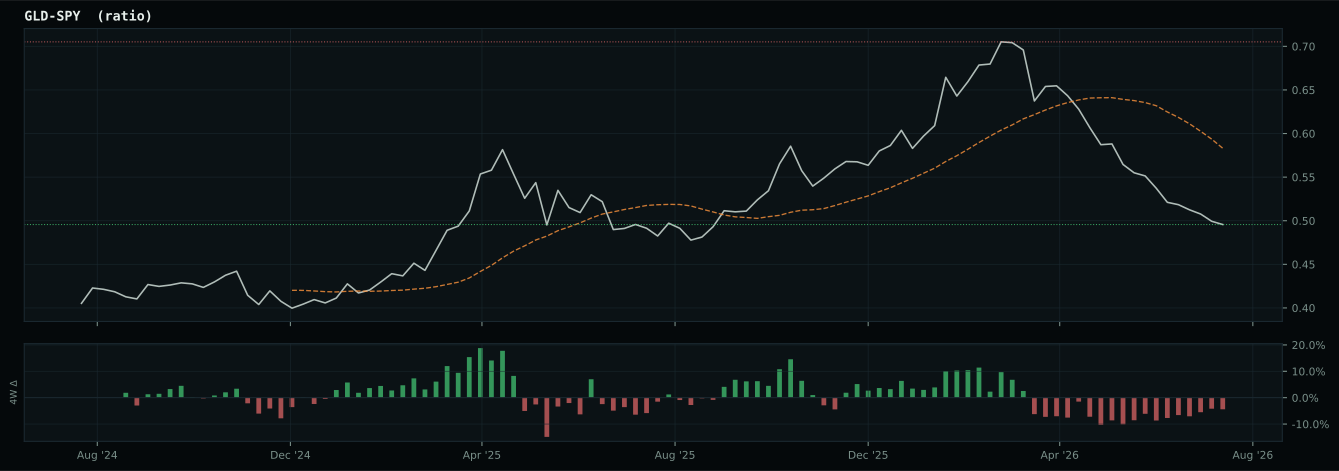
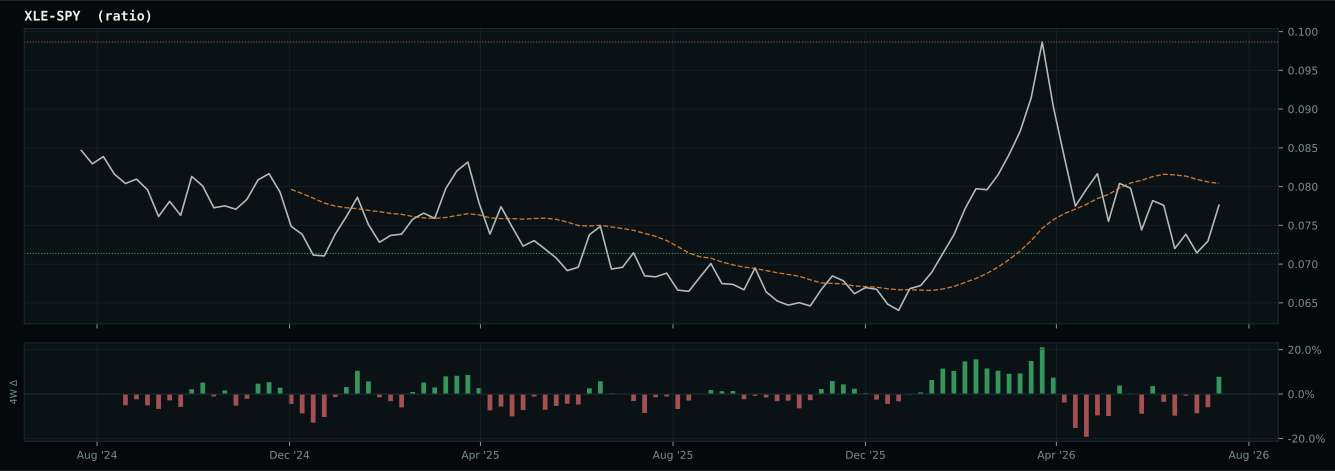
Market-implied signals behind the macro regime scores. Each ratio compares two assets; the direction and slope of the ratio is what the macro engine reads.
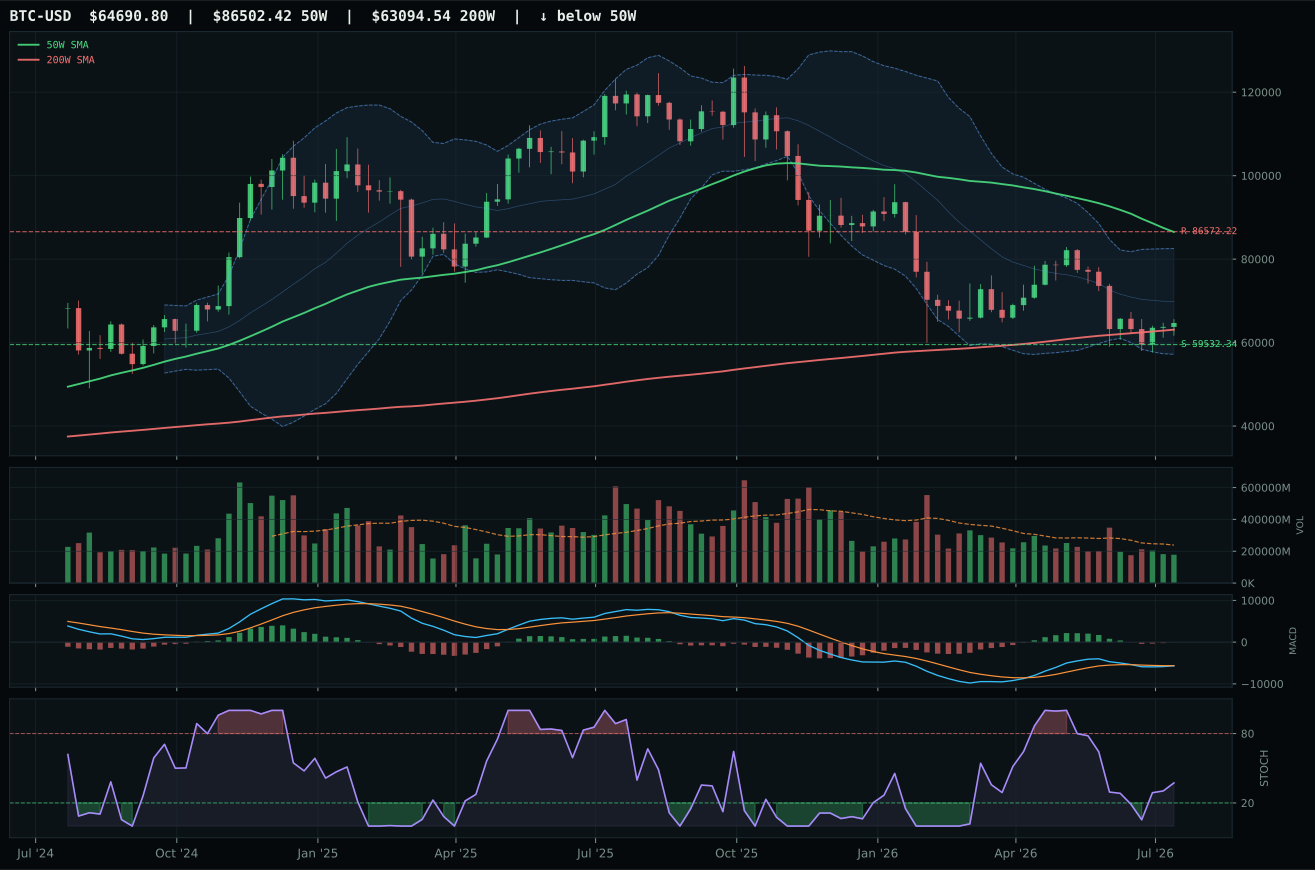
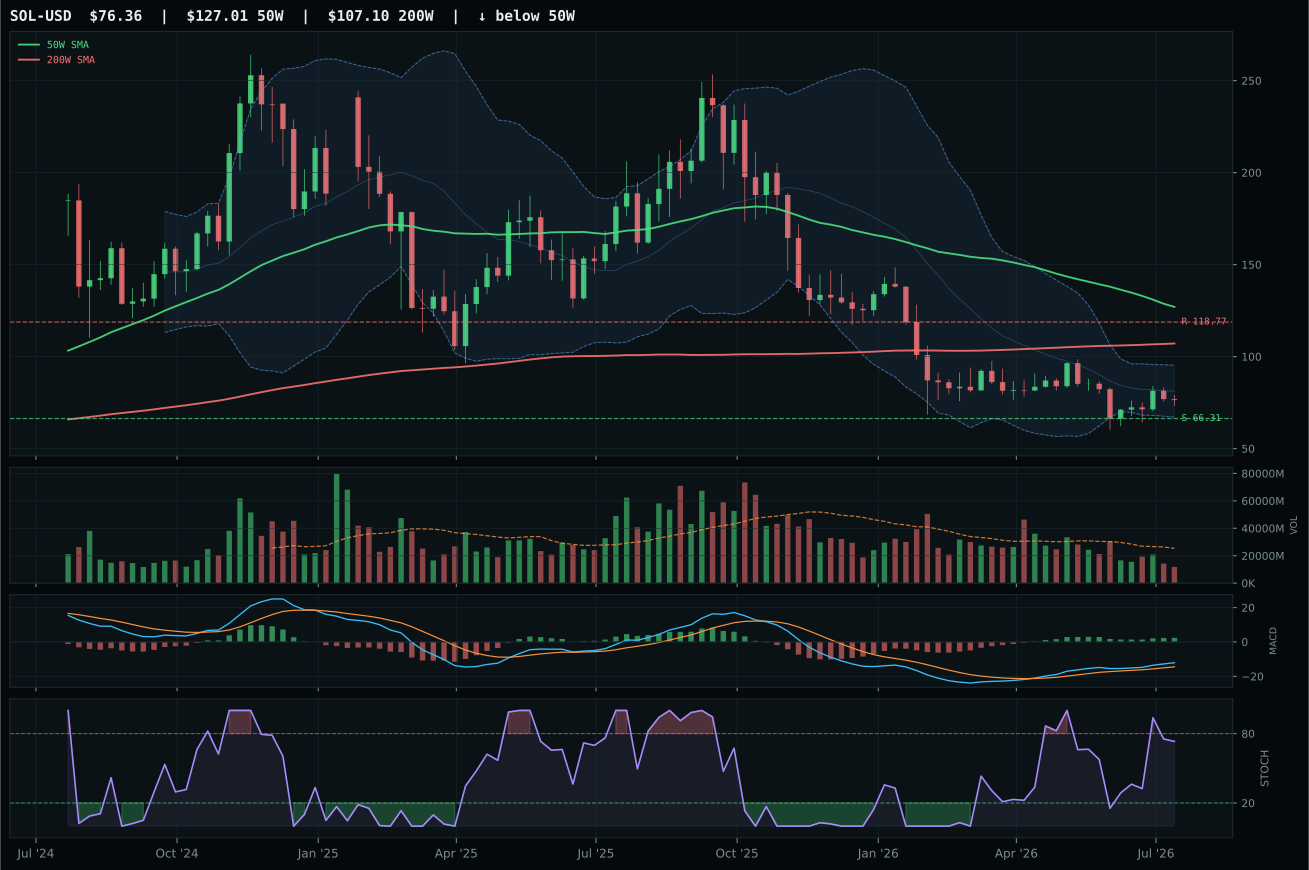
Crypto Regime — NoCrypto
post-touch range has not been tested enough: support tests 1/2, resistance tests 3/2
TrendBTC not confirmed
one or more available conditions failed
Category Rankings
| Rank | Category | Winner | Score | Alloc | 4W Ret | Peers (4W) |
|---|---|---|---|---|---|---|
| 1 | Agriculture & Livestock | WEAT | 64.0 | 20% | — | MOO — · VEGI — |
| 2 | Traditional Energy | XLE | 60.0 | 20% | — | XOP — · FCG — |
| 3 | Technology | CIBR | 57.2 | 10% | — | IGV — · XLK — |
| 4 | Utilities & Infrastructure | XLU | 47.2 | 10% | — | IGF — · PAVE — |
| 5 | AI | AIQ | 46.3 | 10% | — | SMH — · BOTZ — |
| 6 | Defense & Aerospace | ITA | 43.3 | 10% | — | XAR — · ROKT — |
| 7 | Industrial Metals | COPX | 37.2 | 10% | — | PICK — · REMX — |
| 8 | Nuclear Energy | URNM | 34.0 | 10% | — | NLR — · URA — |
| 9 | Precious Metals | GLD | 31.1 | 0% | — | GDX — · SLV — |
| 10 | Emerging Markets | ILF | 18.2 | 0% | — | INDA — · IEMG — |
Agriculture & Livestock — WEAT
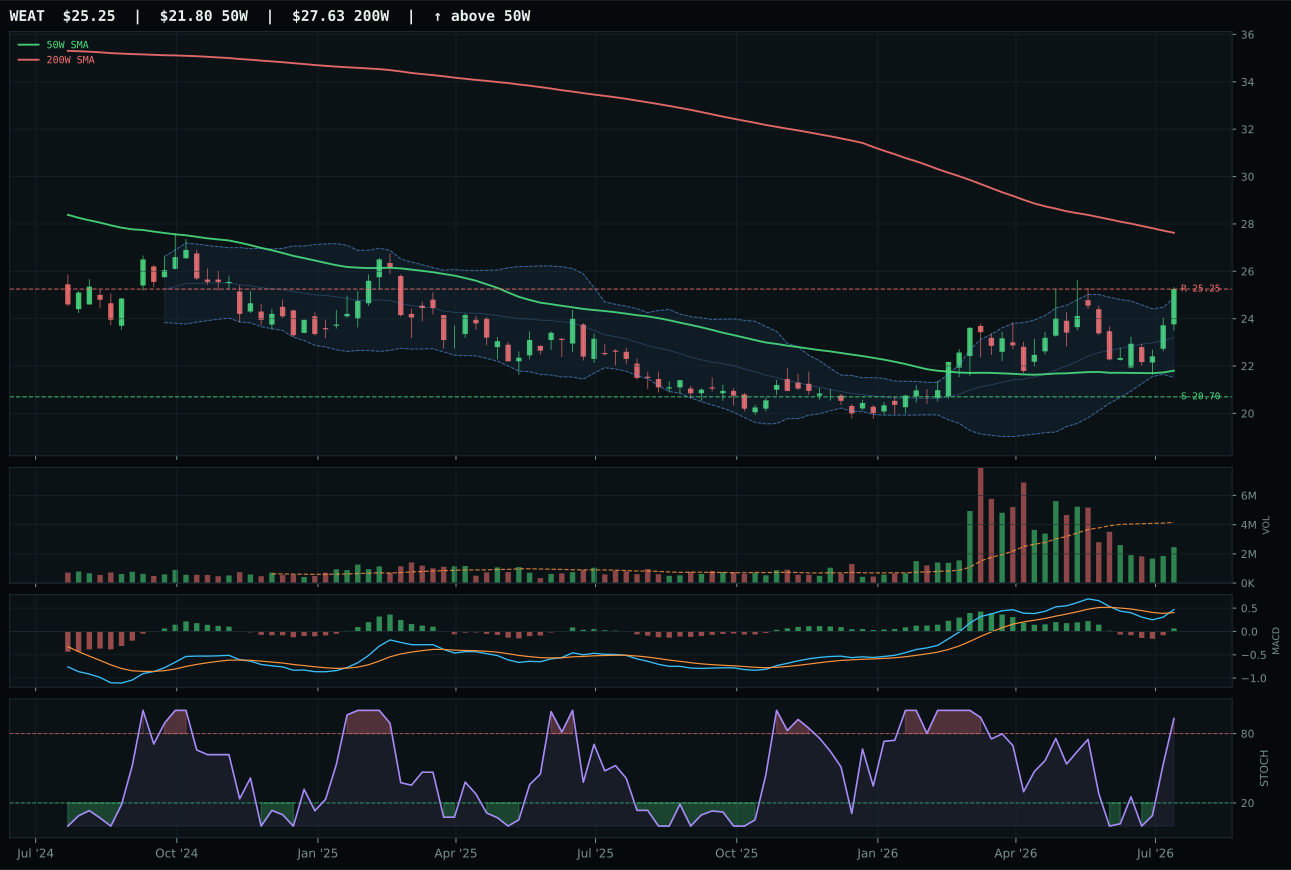
WEAT has a vertical extension profile with 7.7% 13-week relative strength versus SPY.
A failed hold above support would weaken the setup.
Actionable but governed by invalidation levels.
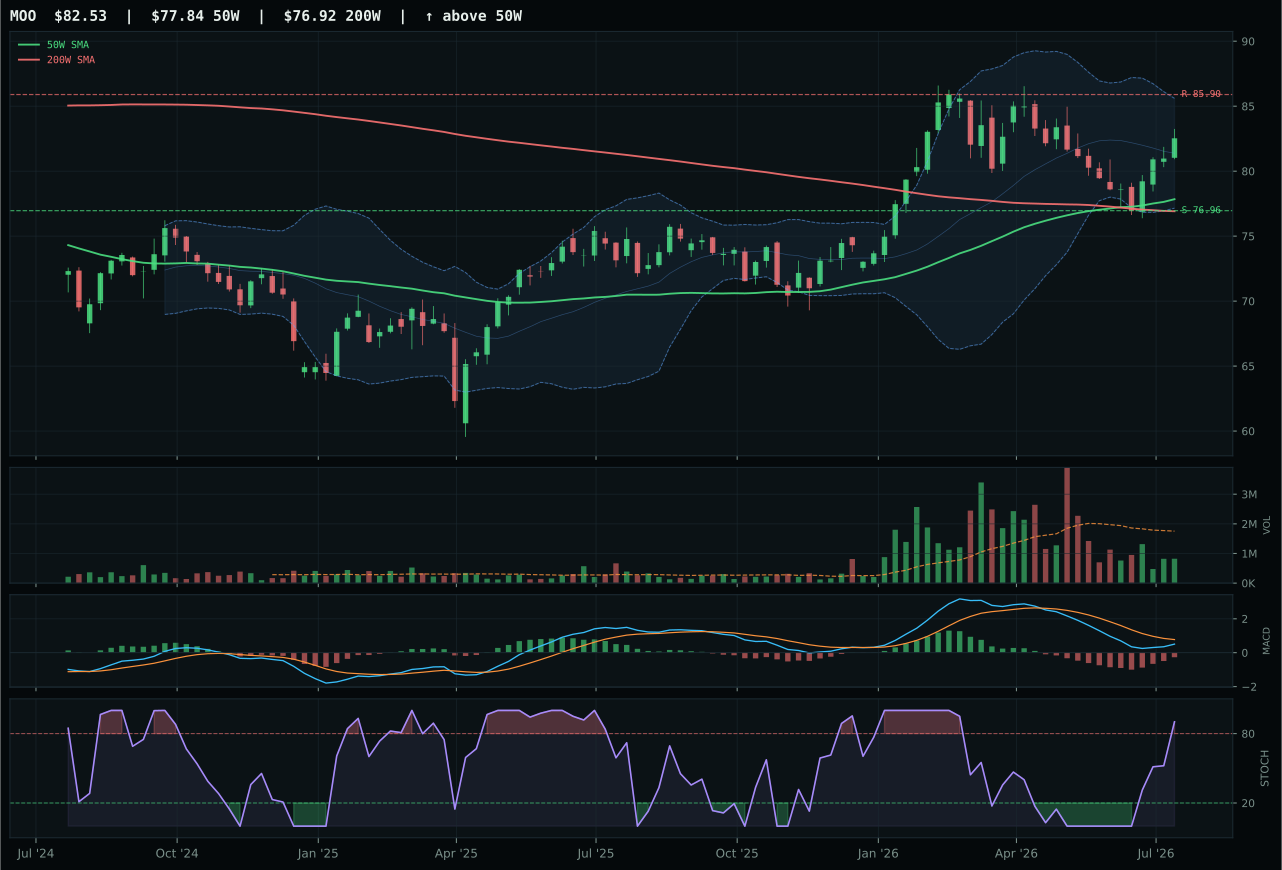
MOO has a neutral structure profile with -5.6% 13-week relative strength versus SPY.
A failed hold above support would weaken the setup.
Actionable but governed by invalidation levels.
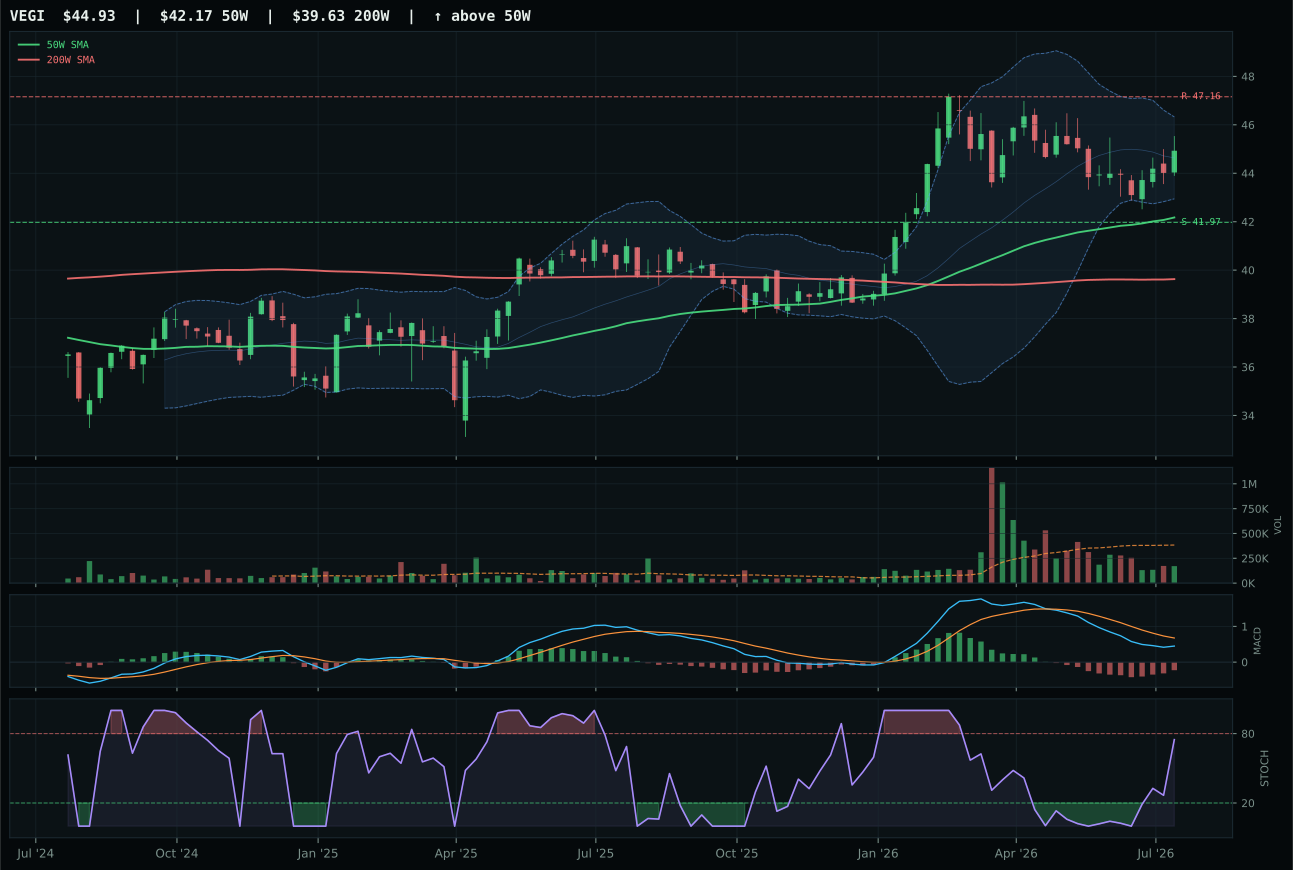
VEGI has a neutral structure profile with -5.6% 13-week relative strength versus SPY.
A failed hold above support would weaken the setup.
Actionable but governed by invalidation levels.
WEAT wins in a photo finish because structure is marginally cleaner (73.3 vs 68.7) and MACD is bullish and improving versus MOO's bearish-but-improving state, a critical divergence in a category where supply-shortage and inflation-pressure narratives are driving allocation. WEAT sits 15.8% above the 50W with stochastic RSI overbought at 0.93, so momentum confirmation is maxed out (100.0/100), but the real edge is category-relative strength: WEAT leads at +13.3% versus MOO's 0.0%. Price is near the 52W high and Fib 0.236, so this is an extended setup, yet persistence of 80.0/100 and volume-price confirmation of 65.9/100 show the move is still being accumulated despite thin participation (0.59x). MOO's -0.9% 13W return and -5.6% RS versus SPY create a divergence between MACD improving and price rolling over—the classic bear-flag signature. The score gap was only -1.1 points, making this the closest race in the allocation sheet, but WEAT's superior trend mechanics and category leadership won the tiebreak.
Agriculture & Livestock claims a 20% top-2 overweight spot because its 64.0 final category score ranked among the two highest eligible categories this week, driven by category-level macro fit of 86.0/100 that is exceptional in this regime. Supply-shortage (+13), inflation pressure (+10), real-asset-sponsorship (+8), and commodity-breadth-positive (+5) combine to create a rare macro alignment where the category itself is endorsed by multiple descriptor chains. WEAT's technical evidence of 66.2/100 is respectable but not dominant; the category's strength comes from macro narrative at 50.0/100, which gets weighted at 38% in the final calculation. The allocation recognizes that real assets are the only portfolio hedge to stagflation fears in a mixed regime, and wheat prices are being bid up by weather and geopolitical supply disruption. WEAT is extended, so entry risk is real, but the alternative—sitting in credit-sensitive equities while inflation pressure persists—is worse. This 20% overweight is a macro-driven bet that stagflation outweighs recession risk through the end of this quarter; if inflation pressure flips off the descriptor list, allocation will contract immediately.
Traditional Energy — XLE
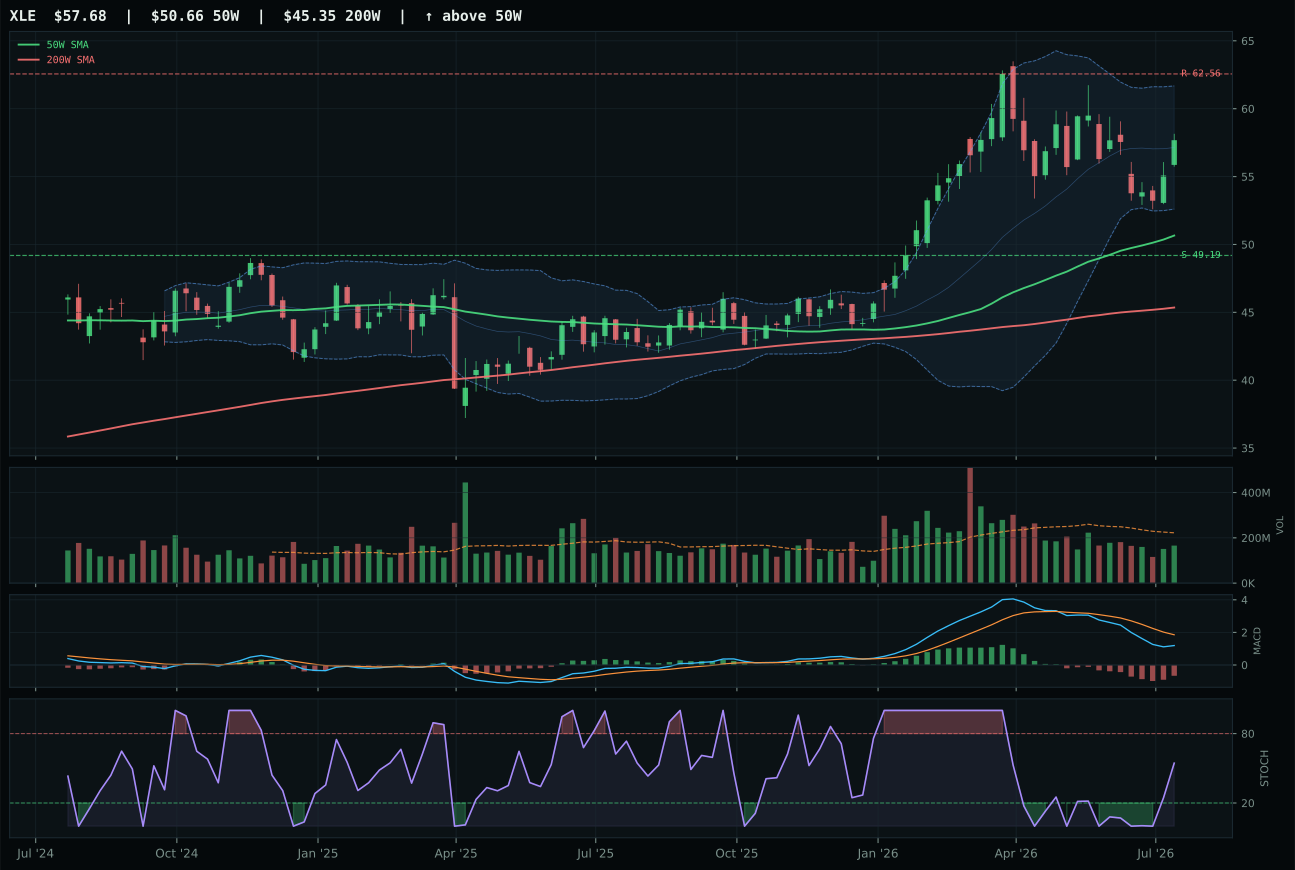
XLE has a neutral structure profile with 0.2% 13-week relative strength versus SPY.
A failed hold above support would weaken the setup.
Actionable but governed by invalidation levels.
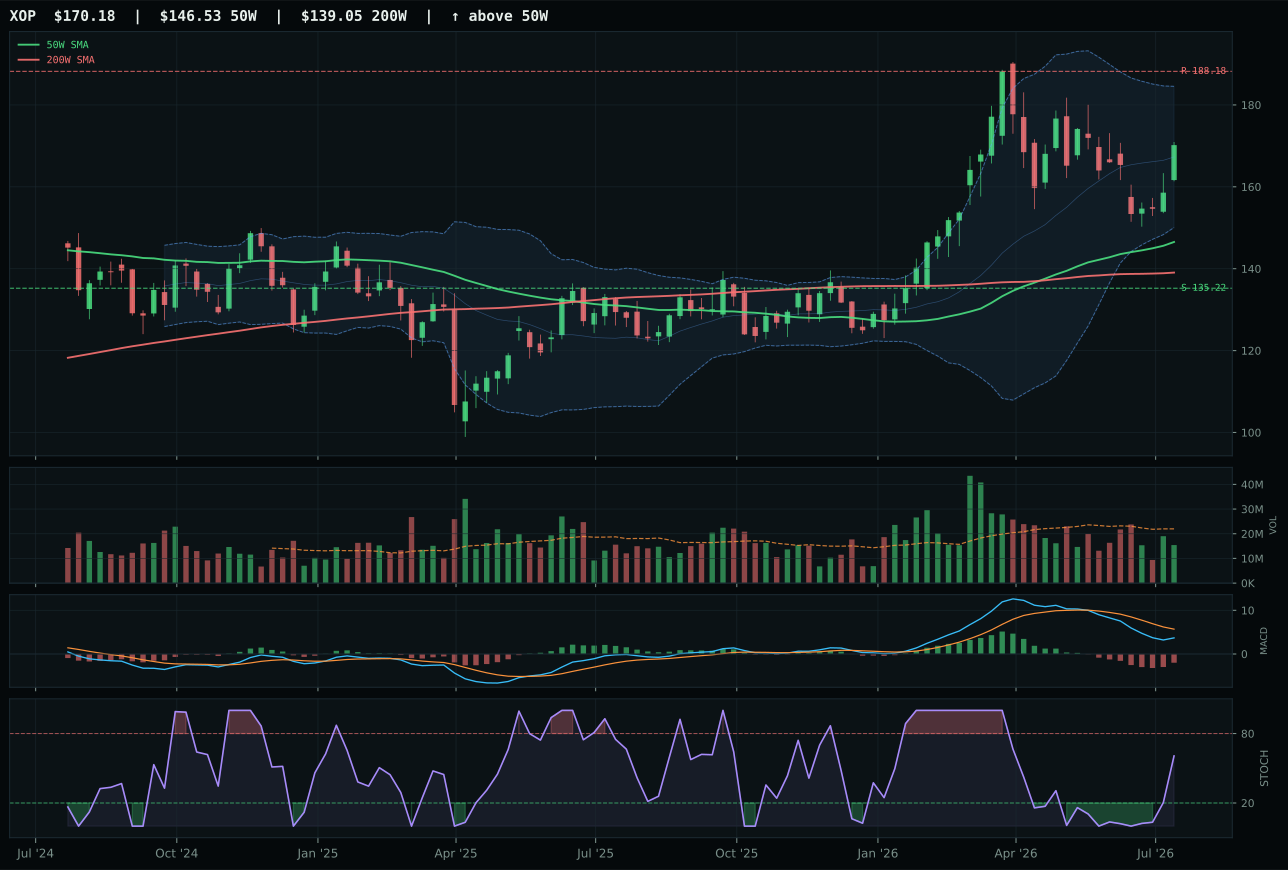
XOP has a vertical extension profile with 1.9% 13-week relative strength versus SPY.
A failed hold above support would weaken the setup.
Actionable but governed by invalidation levels.
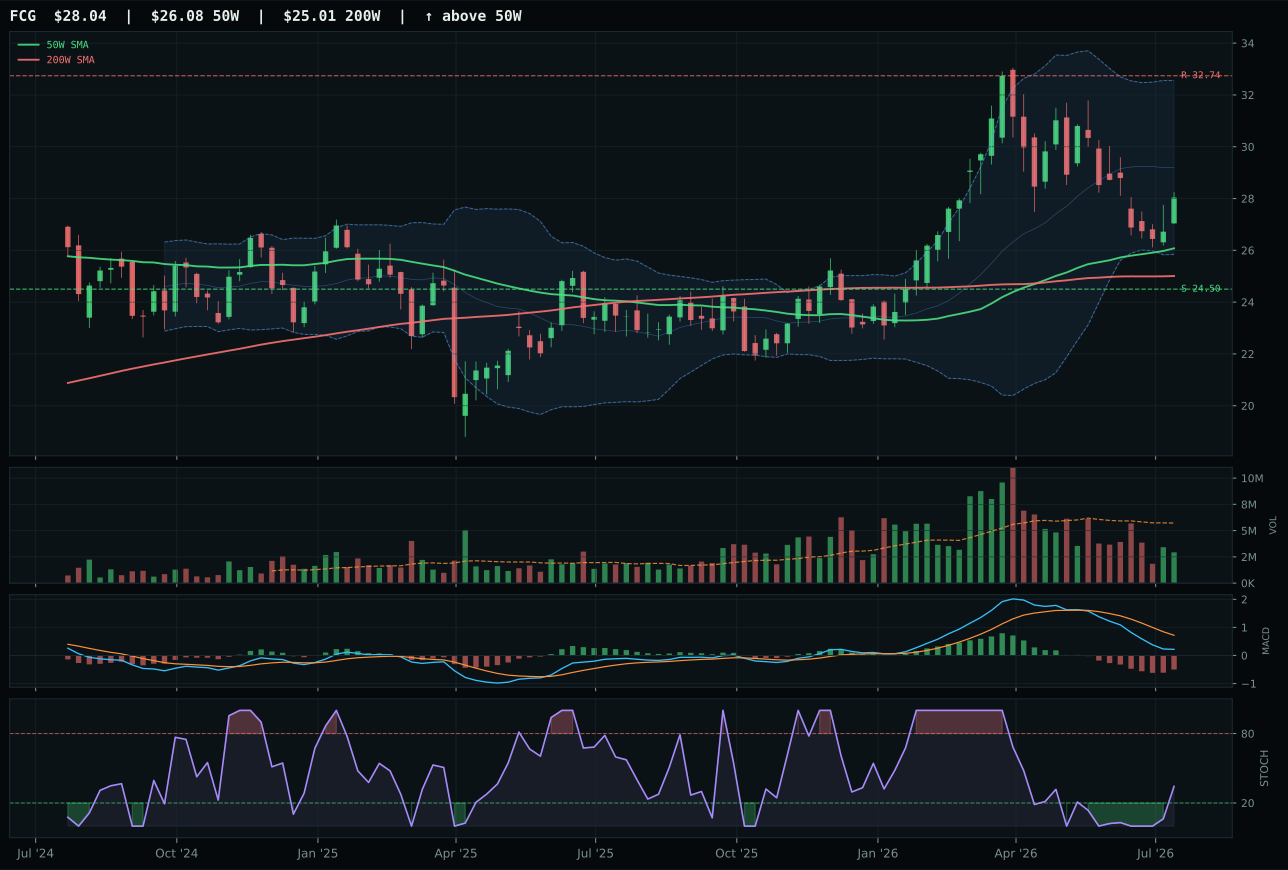
FCG has a neutral structure profile with -6.1% 13-week relative strength versus SPY.
A failed hold above support would weaken the setup.
Actionable but governed by invalidation levels.
XLE wins and secures a 20% top-2 slot by delivering the category's cleanest macro sponsorship alongside acceptable technical setup. It trades 13.9% above the 50W with price near Fib 0.236 in the upper-momentum zone, but that extension is backed by 93.2 trend score (price above both the 50W and 200W, 0.6% slope, 0.2% RS versus SPY) and crucially, a 83.0 timing score that reflects MACD bearish-but-improving and stochastic RSI rising mid-zone (0.54)—momentum is turning, not exhausted. XOP loses 8.2 points because its vertical-extension setup (0.236 Fib but 61.0 timing versus 83.0) has MACD in the same state but stochastic RSI further advanced, making it look more extended without better confirmation. XLE's structure is neutral at 70.7 versus XOP's 67.2, and the real winner is the macro narrative: energy-scarcity (+14), inflation-pressure (+10), supply-shortage (+7), real-asset-sponsorship (+5) create a 86.0/100 macro fit that is matched only by Agriculture. XOP's better 13W return (6.6% vs 4.8%) tells you exploration beta is leading, but in a mixed regime, integrated energy's cash-flow defense beats exploration leverage.
Traditional Energy earned 20% as the second top-2 overweight category because its 60.0 final score and 85.0/100 category-level macro fit made it an obvious allocation. Energy-scarcity (+16), inflation-pressure (+10), supply-shortage (+9), real-asset-sponsorship (+7) are the four strongest macro descriptors active in the portfolio, and XLE captured 62.3 technical evidence to pair with 86.0 macro narrative fit. The allocation is a pure macro bet: stagflation fears, geopolitical supply disruption (Middle East, Russia), and demand recovery in a Transition / Mixed regime all point to energy outperformance. XLE's 4.8% 13W return and 0.2% RS versus SPY suggest the category is neither leading nor collapsing—it's grinding higher on narrative rather than momentum, which is exactly the profile for a Transition regime where yields matter and cash flow beats capital appreciation. Volume is thin (0.75x), so liquidity is a constraint, and risk/reward is modest (53.1/100) because upside to resistance is -7.8%. But the category allocation is not about immediate price appreciation; it's about hedge value in an inflation scenario where energy supply remains constrained. This is the portfolio's answer to the stagflation question.
Technology — CIBR
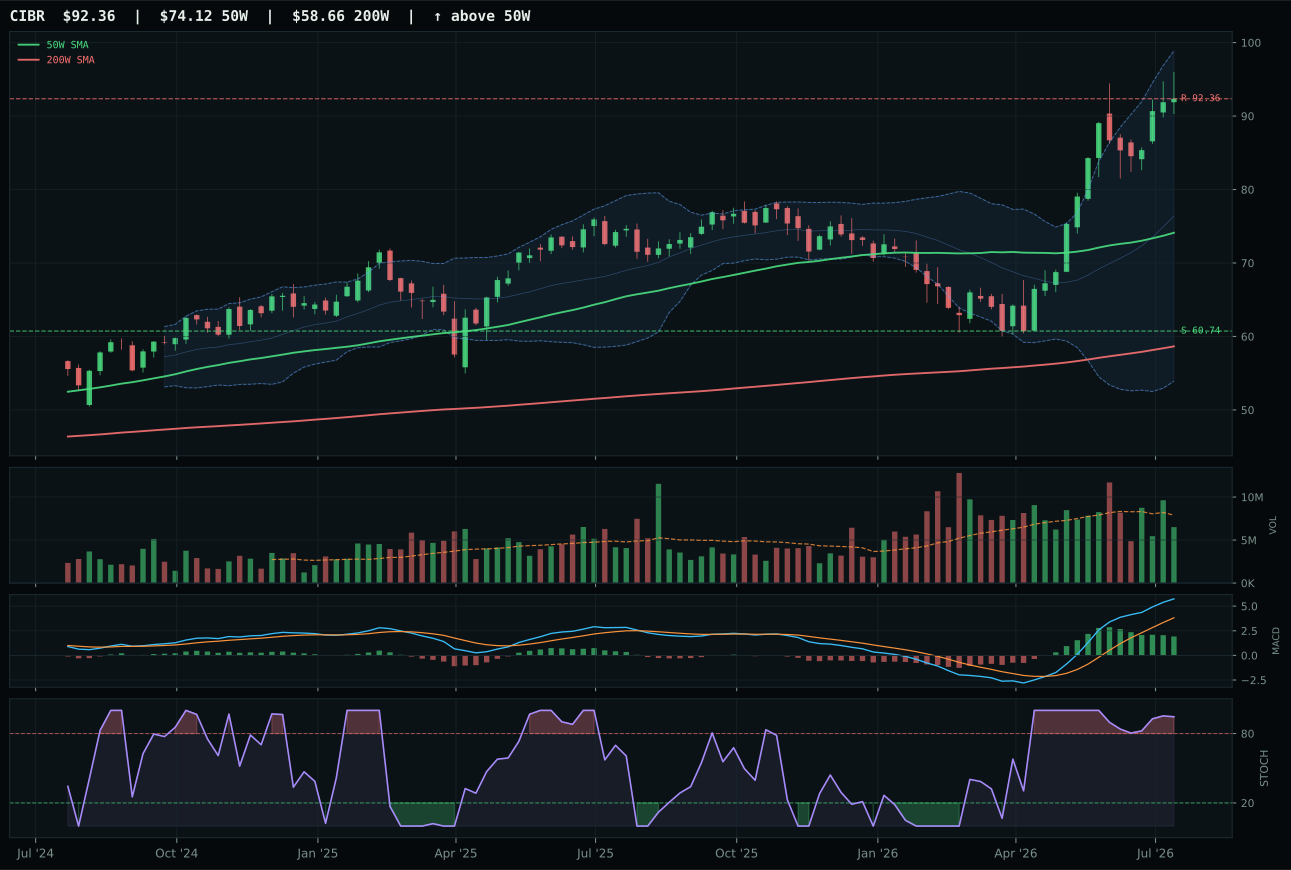
CIBR has a vertical extension profile with 34.3% 13-week relative strength versus SPY.
A failed hold above support would weaken the setup.
Actionable but governed by invalidation levels.
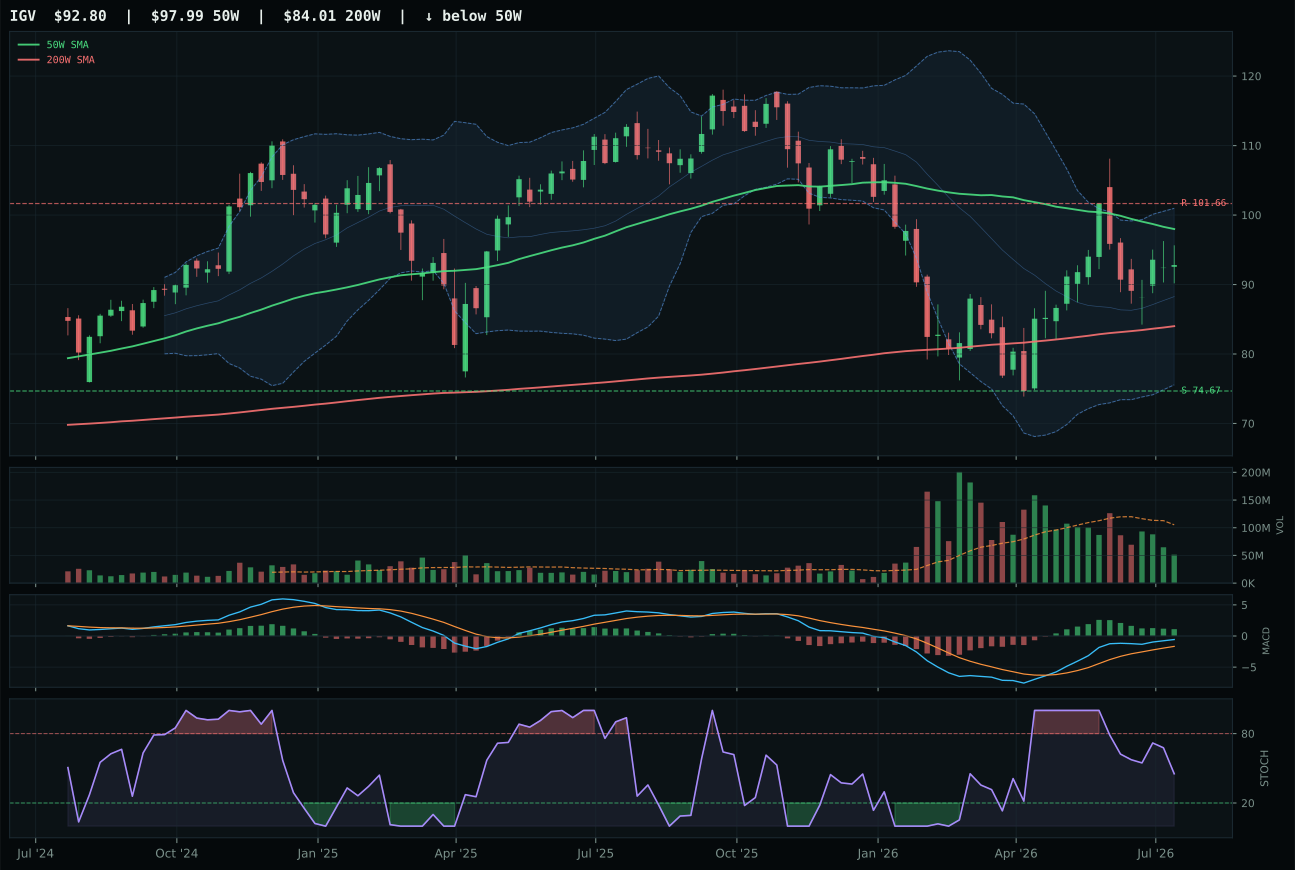
IGV has a neutral structure profile with 4.4% 13-week relative strength versus SPY.
A failed hold above support would weaken the setup.
Actionable but governed by invalidation levels.
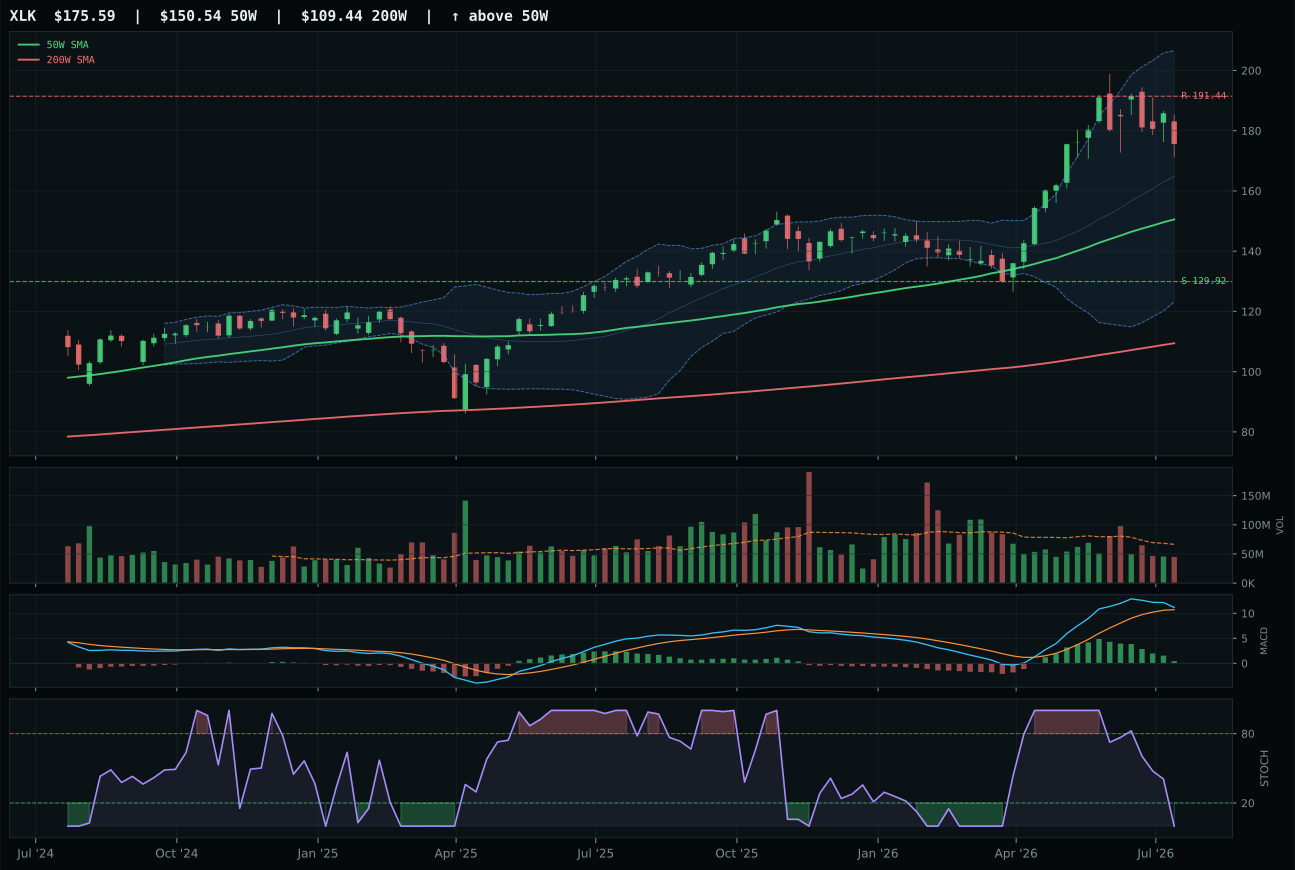
XLK has a vertical extension profile with 9.1% 13-week relative strength versus SPY.
A failed hold above support would weaken the setup.
Actionable but governed by invalidation levels.
CIBR wins because it sits above both the 50W and 200W with a flat 0.6% slope, placing it in early-stage trend persistence rather than late-stage exhaustion. Its 34.3% relative strength versus SPY and 25.2% category-relative strength tell you that new capital is still rotating into cybersecurity despite the 24.6% extension above the 50W—a risk penalty that IGV avoids but cannot offset without better momentum sponsorship. MACD is bullish but flattening, and stochastic RSI sits at 0.94 overbought, so the setup is extended but not yet rolling over. IGV lost because it generated only 4.4% RS versus SPY with a neutral structure score of 68.2, thin volume participation, and a falling stochastic RSI; the gap was 14.3 points, a decisive technical separation. CIBR's vertical-extension setup is the cleanest available inside the category—strength being punished for timing risk is still better than weakness being rewarded for mean-reversion hope.
Technology earned 10% allocation as a tier-2 category in a Transition / Mixed macro regime where credit stress and broad-market bear are both active headwinds. The category-level macro fit of 49.0/100 is weak, pulled down by credit stress (-7) and dollar pressure (-5), yet risk-appetite-positive (+9) and AI-growth sponsorship (+6) keep it from falling off the board entirely. CIBR's 83.9/100 technical evidence score—driven by 100.0 trend, 100.0 momentum confirmation, and 86.2 volume-price sponsorship—carries enough weight to land it in the allocation despite the category's modest 57.2 final score ranking below both Agriculture and Energy. The real tension is timing: cybersecurity is extended and momentum has flattened, so 10% is right-sized exposure to a setup that works until it doesn't, with no room for the allocation to expand if breadth fails.
Utilities & Infrastructure — XLU
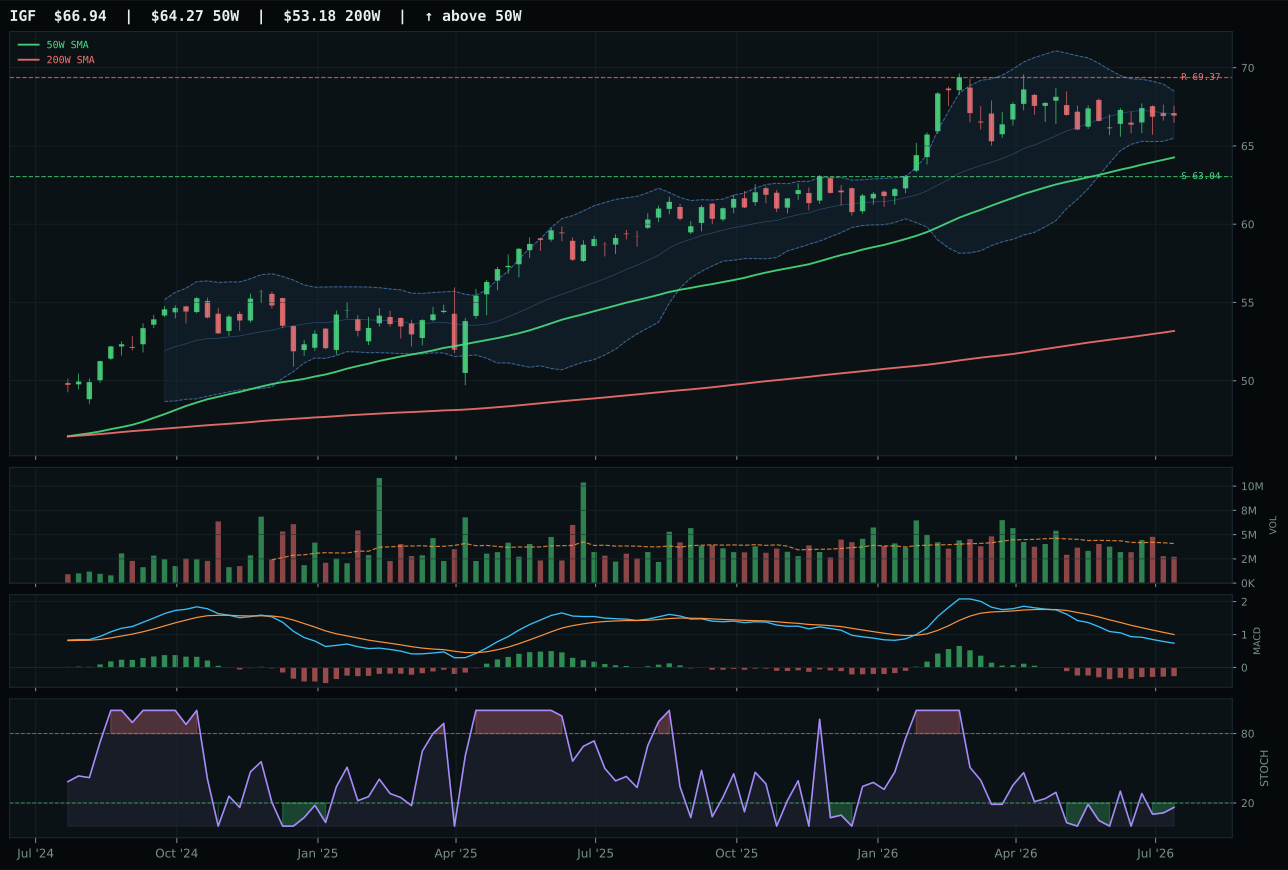
IGF has a neutral structure profile with -5.6% 13-week relative strength versus SPY.
A failed hold above support would weaken the setup.
Actionable but governed by invalidation levels.
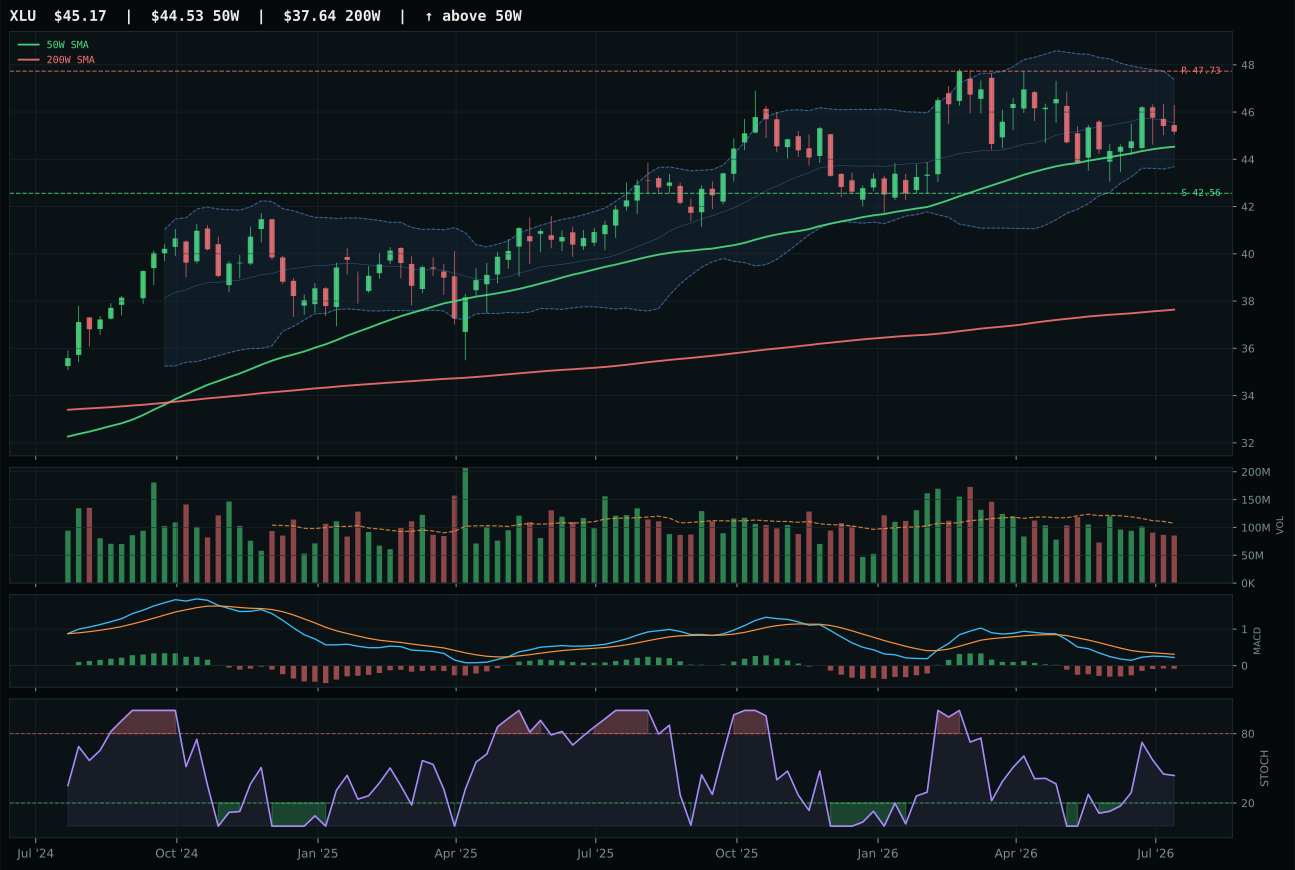
XLU has a compression near 50W profile with -6.8% 13-week relative strength versus SPY.
A failed hold above support would weaken the setup.
Actionable but governed by invalidation levels.
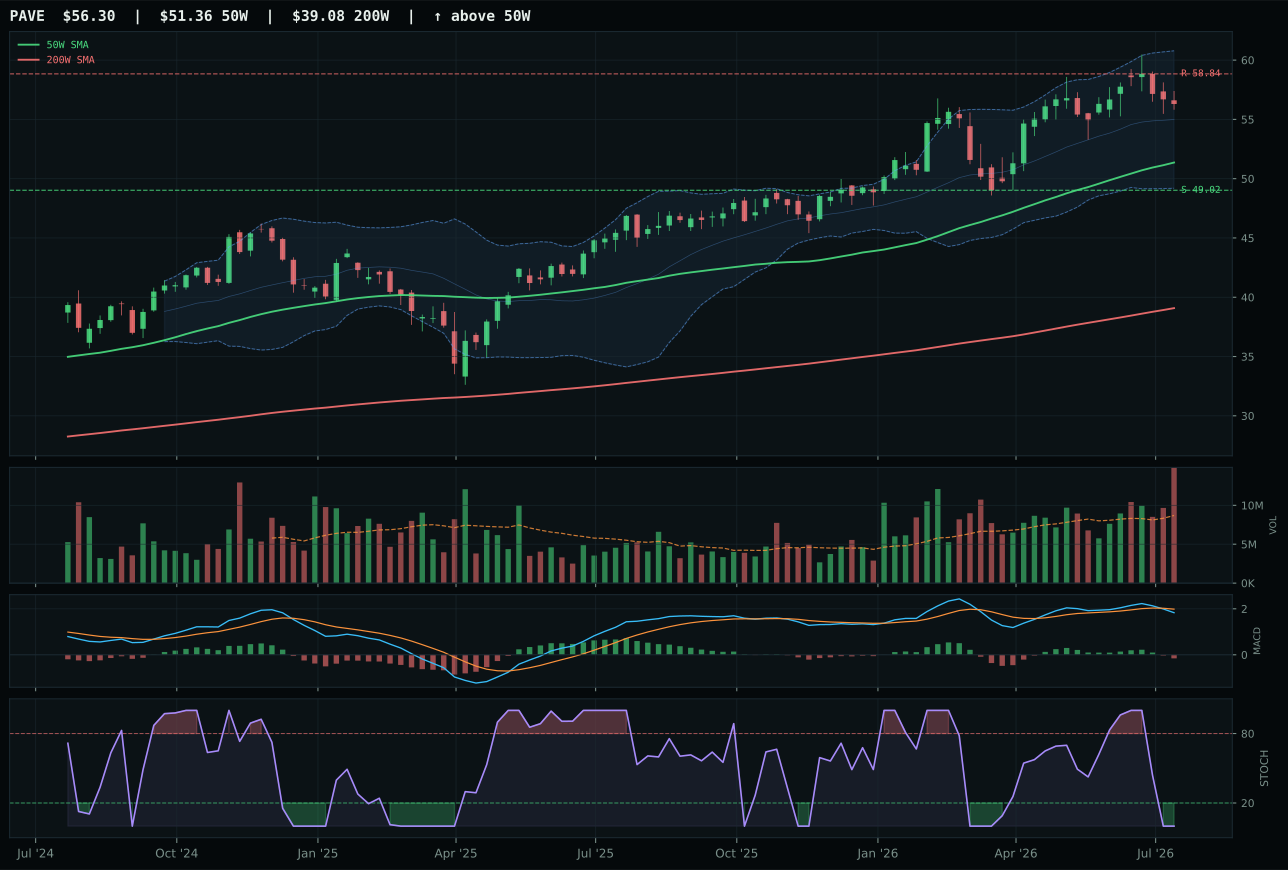
PAVE has a neutral structure profile with -2.4% 13-week relative strength versus SPY.
A failed hold above support would weaken the setup.
Actionable but governed by invalidation levels.
XLU wins because it offers the only compression-near-50W setup in a category where three ETFs are all fighting to avoid becoming permanent value traps. At only 1.4% above the 50W with price at Fib 0.382, XLU sits in the tightest entry zone across the portfolio, and more importantly, its 100.0 timing score reflects the perfect setup mechanics: distance to 50W minimal (1.4%), MACD bearish-but-improving, stochastic RSI falling/neutral (0.44, not yet oversold). Structure scores 69.7 for compression-near-50W with 82.9 compression reading, the tightest band in the category. IGF loses 7.7 points because it has neutral structure (no compression), worse timing (90.0 vs 100.0), and thin participation (volume at 0.59x), meaning there's no defined entry and no sponsorship. XLU's -2.1% 13W return and -6.8% RS versus SPY are terrible, but category-relative strength is -1.2%, indicating balanced weakness. XLU is the least bad option by setup geometry.
Utilities & Infrastructure earned 10% as tier-2 despite a weak 47.2 category score because defensive positioning in a Transition / Mixed regime with broad-market-bear active (+4) has portfolio value. Category-level macro fit is only 50.0/100, hurt by inflation-pressure (-6) that makes utility valuations vulnerable and risk-appetite-positive (-2) that should rotate capital into growth. Yet the regime itself helps (+4), and XLU's 60.2 technical evidence combines with 45.0 macro narrative fit to land just barely into the allocation. The real case for 10% is risk-management: XLU offers yield (proxy for income stability), low beta to equity crashes, and inflation-pass-through on regulated revenues. Compression near the 50W creates a defined stop-loss (break below 42.56 support invalidates the setup), making position sizing mechanical rather than faith-based. This is not a conviction allocation; it's a portfolio shock absorber. If broad-market-bear flips off the descriptors or risk-appetite-positive strengthens, this 10% rotates into higher-beta categories immediately. XLU should be watched for signs that buyers are defending the 50W; if volume dries up further and compression breaks, the category becomes oversized relative to its technical condition.
AI — AIQ
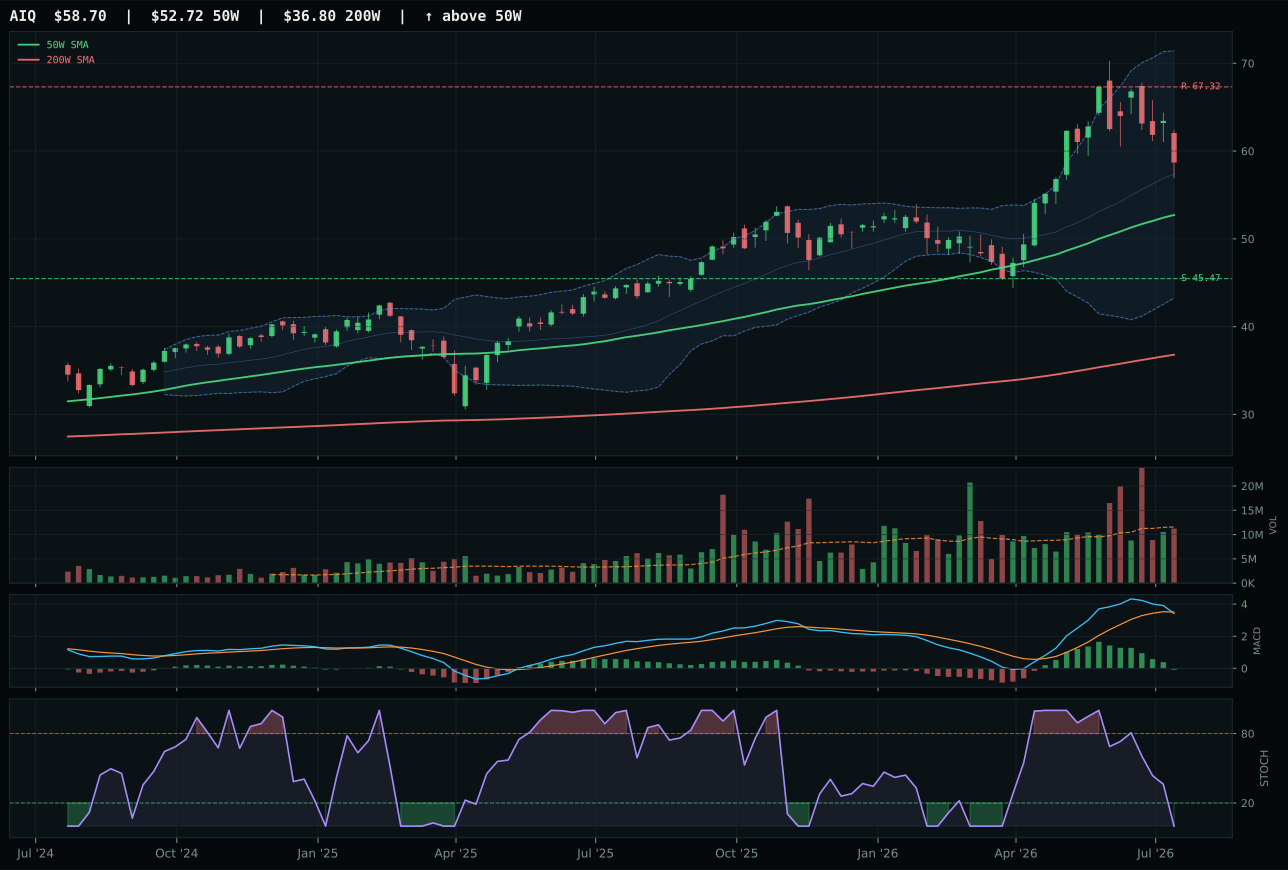
AIQ has a neutral structure profile with 3.8% 13-week relative strength versus SPY.
A failed hold above support would weaken the setup.
Actionable but governed by invalidation levels.
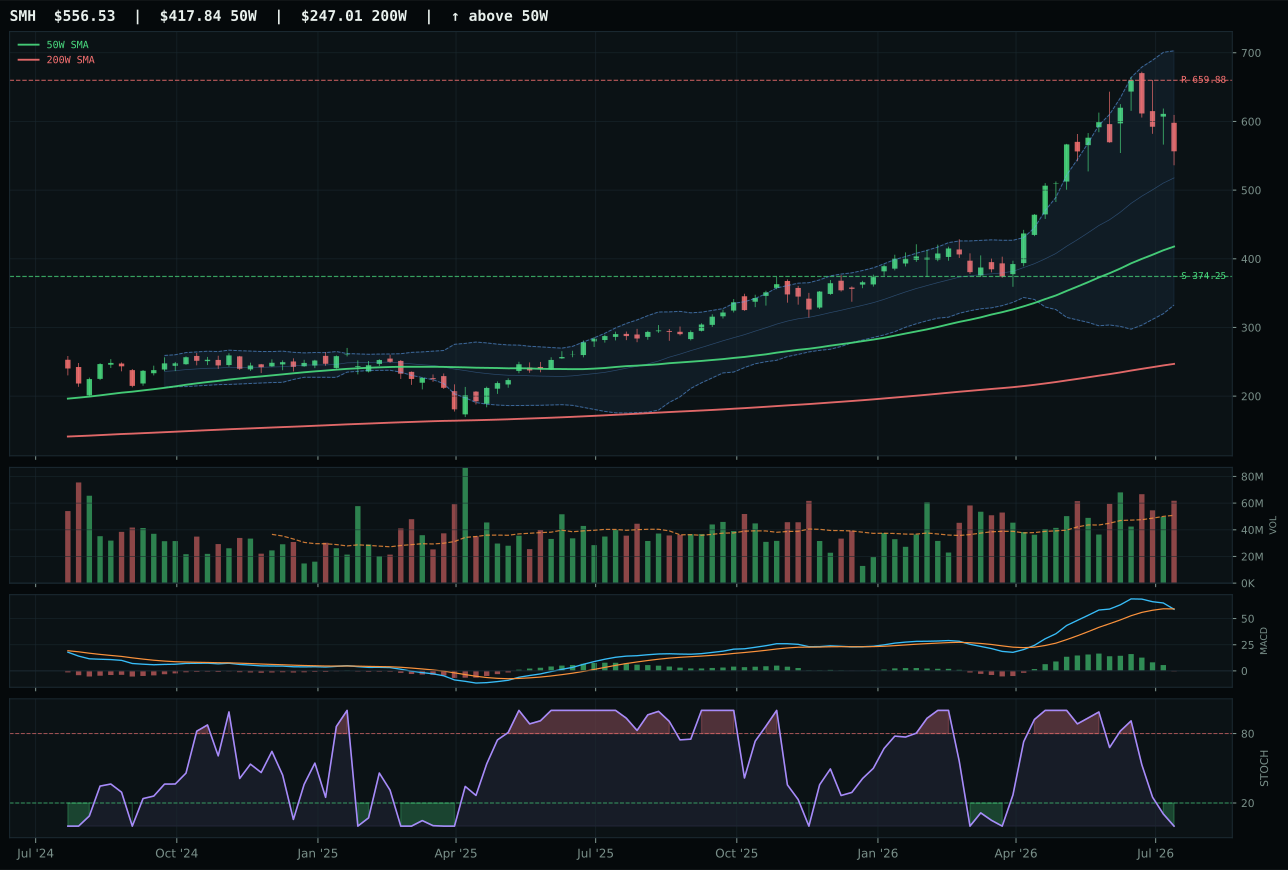
SMH has a vertical extension profile with 15.2% 13-week relative strength versus SPY.
A failed hold above support would weaken the setup.
Actionable but governed by invalidation levels.
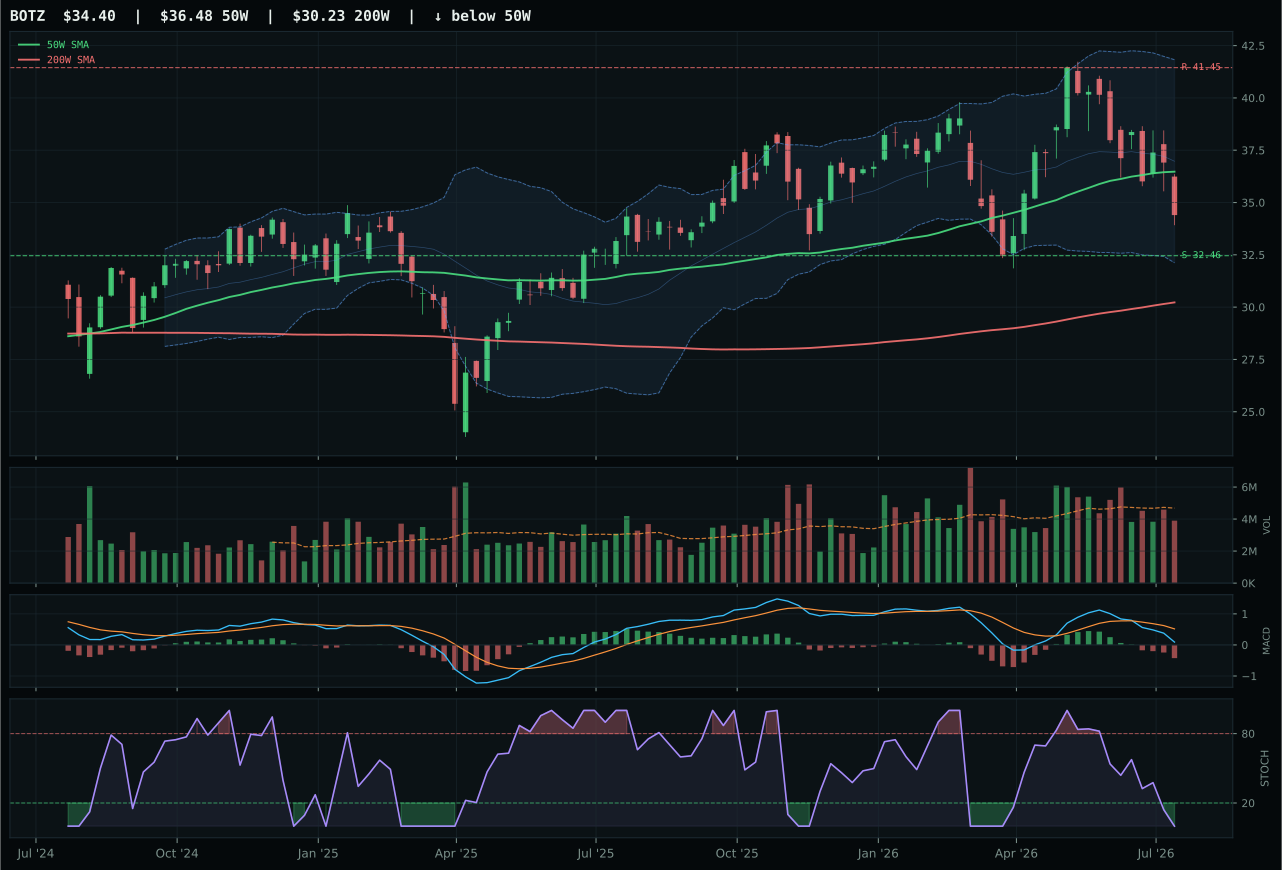
BOTZ has a neutral structure profile with -12.7% 13-week relative strength versus SPY.
A failed hold above support would weaken the setup.
Actionable but governed by invalidation levels.
AIQ wins by accepting lower momentum in exchange for better entry geometry and risk-adjusted reward. It sits above the 50W and 200W with only 11.3% extension, placing new buyers much closer to meaningful support at 45.47 than SMH's buyers, who are 33.2% away from their 50W and sitting in the upper Fib zone. AIQ's neutral structure and oversold stochastic RSI (0.00) create a setup where the downside to support is 29.1% but the upside to resistance is -12.8%—a margin-of-safety inversion that paradoxically appeals to value-hungry allocators in a beaten-down category. SMH sports superior 13W momentum (19.9% vs 8.5%) and category-relative strength (11.4% vs 0.0%), but its 48.0 timing score versus AIQ's 77.0 reveals the problem: SMH is vertical-extended with above-average volume and MACD already weakening, the classic overstretched setup. The score gap of 14.0 points reflects a category-level decision that entry risk trumps momentum confirmation when macro is this mixed.
AI received 10% as tier-2 despite a 46.3 category score that ranks below Agriculture, Energy, Technology, and Defense. The macro tailwind is real—AI-growth sponsorship (+14), risk-appetite-positive (+10)—but credit stress (-8) and broad-market-bear (-8) offset it to a 54.0/100 category-level macro fit. What keeps AI in the allocation is not top-down conviction but bottom-up setup quality: AIQ's 45.2 technical evidence combines with 62.0 macro narrative fit to land it just shy of tier-1 thresholds, and the category reasoner recognized that a pullback into oversold territory is more durable than a momentum-chase extension. The real message is caution: this category has high beta to risk-appetite reversals and zero breadth leadership right now, so 10% is a holding position, not a conviction bet. If credit stress eases and broad-market-bear flips, AI would immediately move to overweight; until then, it occupies a tier-2 slot pending macro clarity.
Defense & Aerospace — ITA
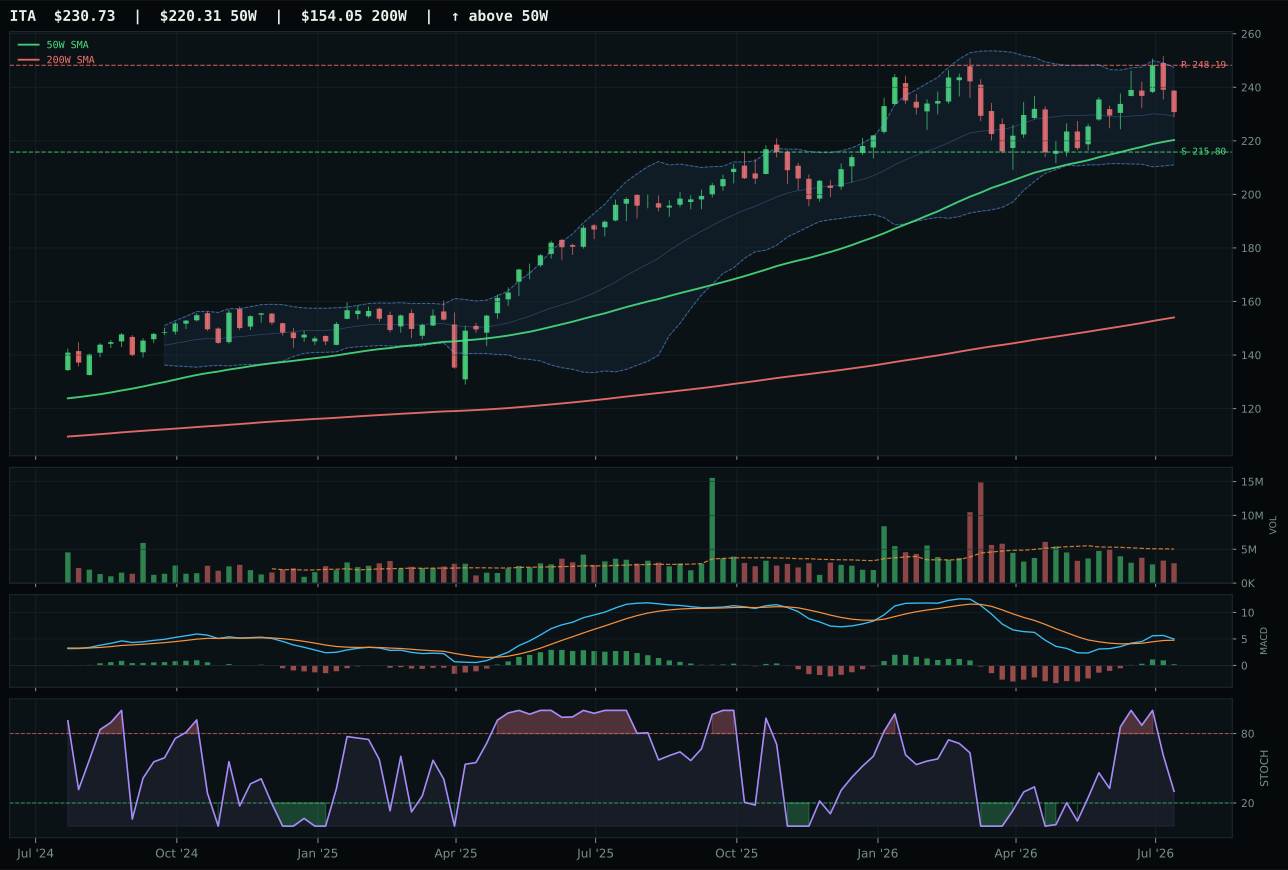
ITA has a neutral structure profile with -5.2% 13-week relative strength versus SPY.
A failed hold above support would weaken the setup.
Actionable but governed by invalidation levels.
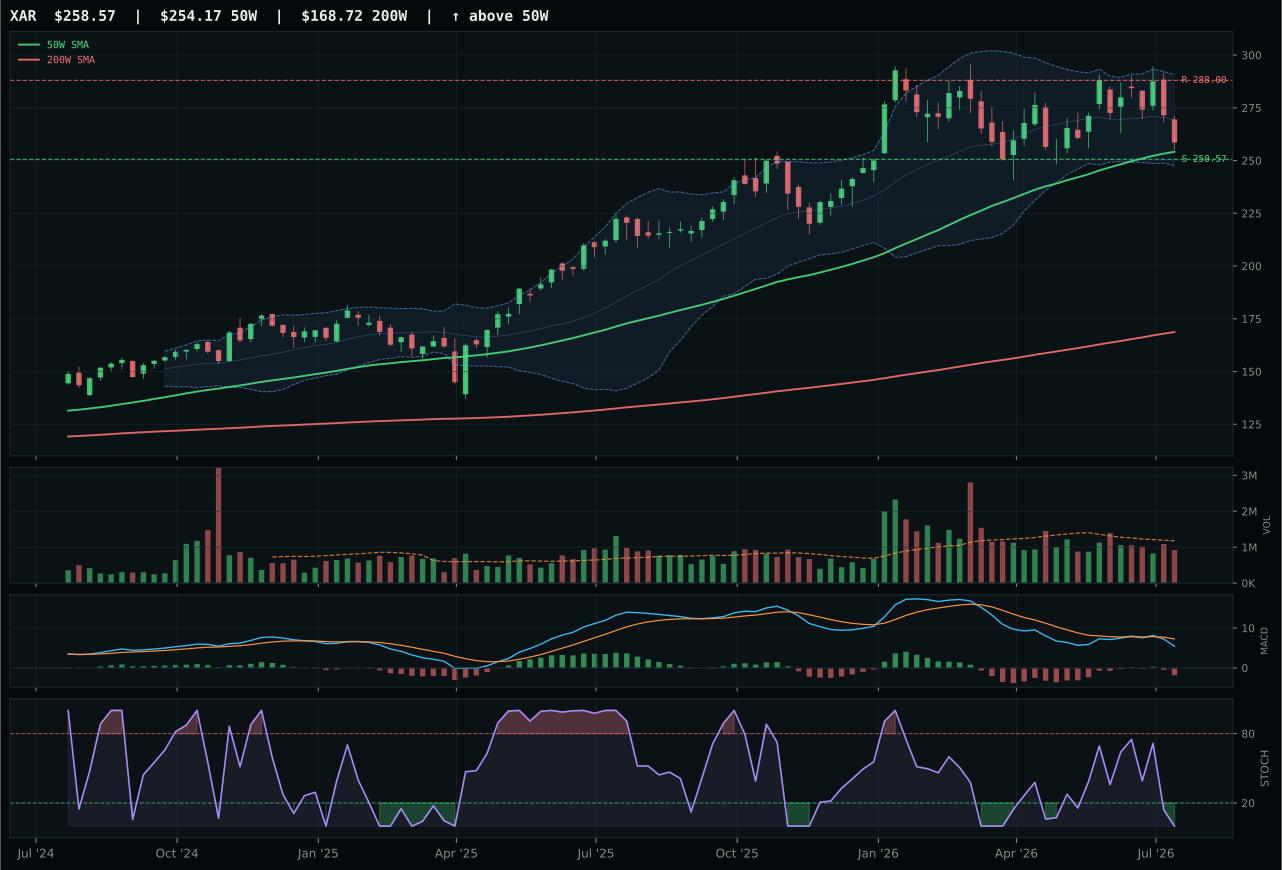
XAR has a pullback into support profile with -11.1% 13-week relative strength versus SPY.
A failed hold above support would weaken the setup.
Actionable but governed by invalidation levels.
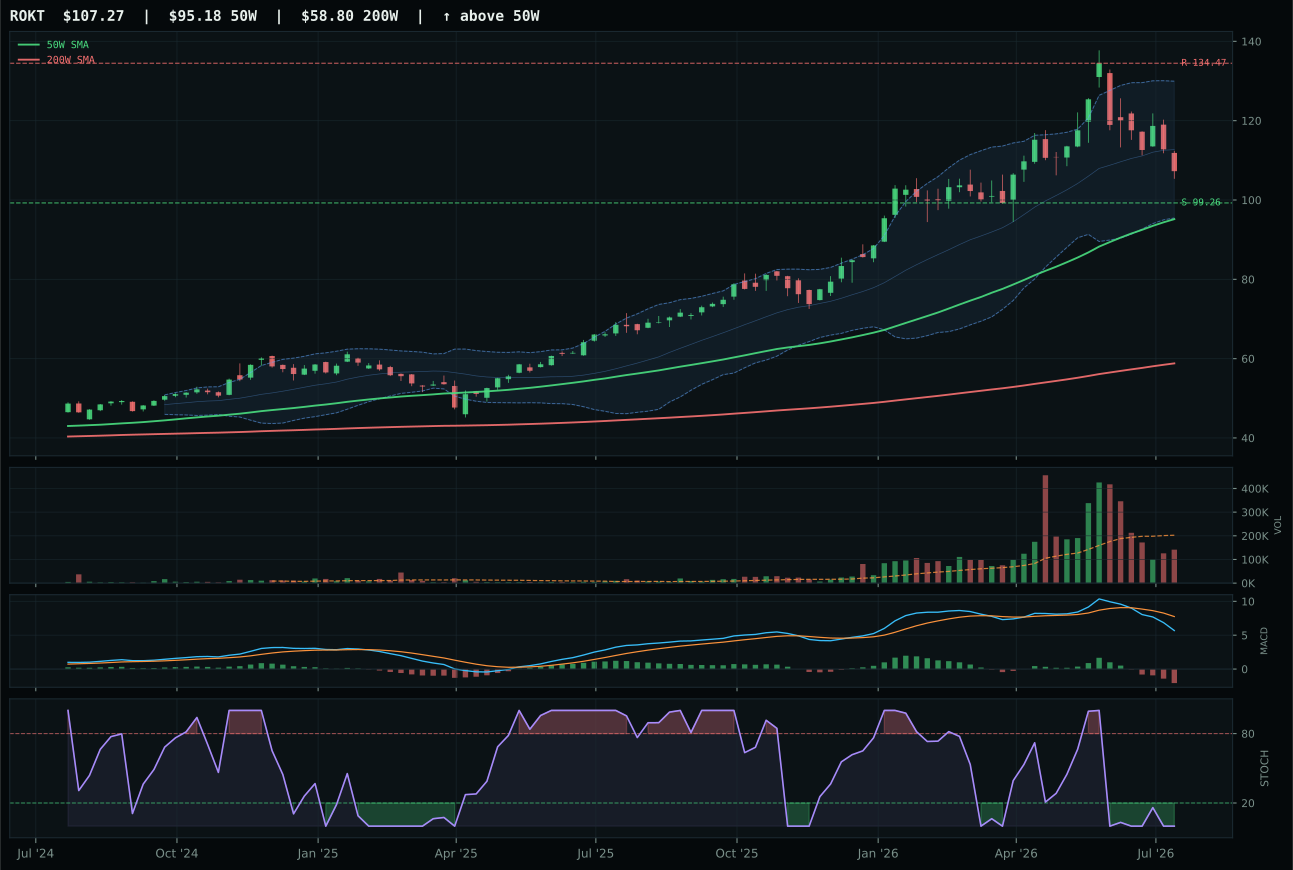
ROKT has a neutral structure profile with -11.5% 13-week relative strength versus SPY.
A failed hold above support would weaken the setup.
Actionable but governed by invalidation levels.
ITA wins because it offers the cleanest pullback-and-hold setup in a category dominated by deep drawdowns. At only 4.7% above the 50W with price near Fib 0.382 and stochastic RSI at 0.30 (falling but not yet oversold), ITA is the only ETF in the basket that hasn't been turned to ash by macro headwinds. Its MACD is bullish and improving—a crucial divergence versus XAR's bearish/weakening condition—and structure scores 71.1 versus XAR's 68.7, a small but meaningful edge when trend is this weak. ITA's -0.5% 13W return and -5.2% RS versus SPY are ugly absolute numbers, but category-relative strength of +5.9% tells you that ITA is losing less than its peers. XAR crashed to -6.4% 13W with -11.1% RS versus SPY, pulled in by a pullback-into-support setup that has no MACD confirmation and stochastic RSI completely oversold. The gap of 5.1 points is tight, signaling a weak category that won't reward aggressive entry.
Defense & Aerospace earned 10% allocation despite a 43.3 final category score and no top-2 eligibility, making it one of the weakest tier-2 holds. The macro case is genuine—Transition / Mixed helps (+3), broad-market-bear is active (+6), dollar pressure is active (+3)—and the 64.0/100 category-level macro fit is respectable. Yet this category's technical evidence is falling apart: ITA's 73.0/100 is solid, but the broader 3/2/1 weighted basket starts at 55.0 and decays to 43.3 after stress-testing against leadership and volume-price sponsorship. ITA's thin-participation volume (0.58x) is a red flag that buyers aren't stepping in aggressively. The allocation exists because Defense has genuine strategic value in a bear-market setup (aerospace demand from geopolitical tension is real), but 10% should be viewed as a defensive hedge, not a tactical conviction. If the category cannot generate above-average volume alongside positive MACD, this allocation becomes vulnerable to reallocation into stronger names.
Industrial Metals — COPX
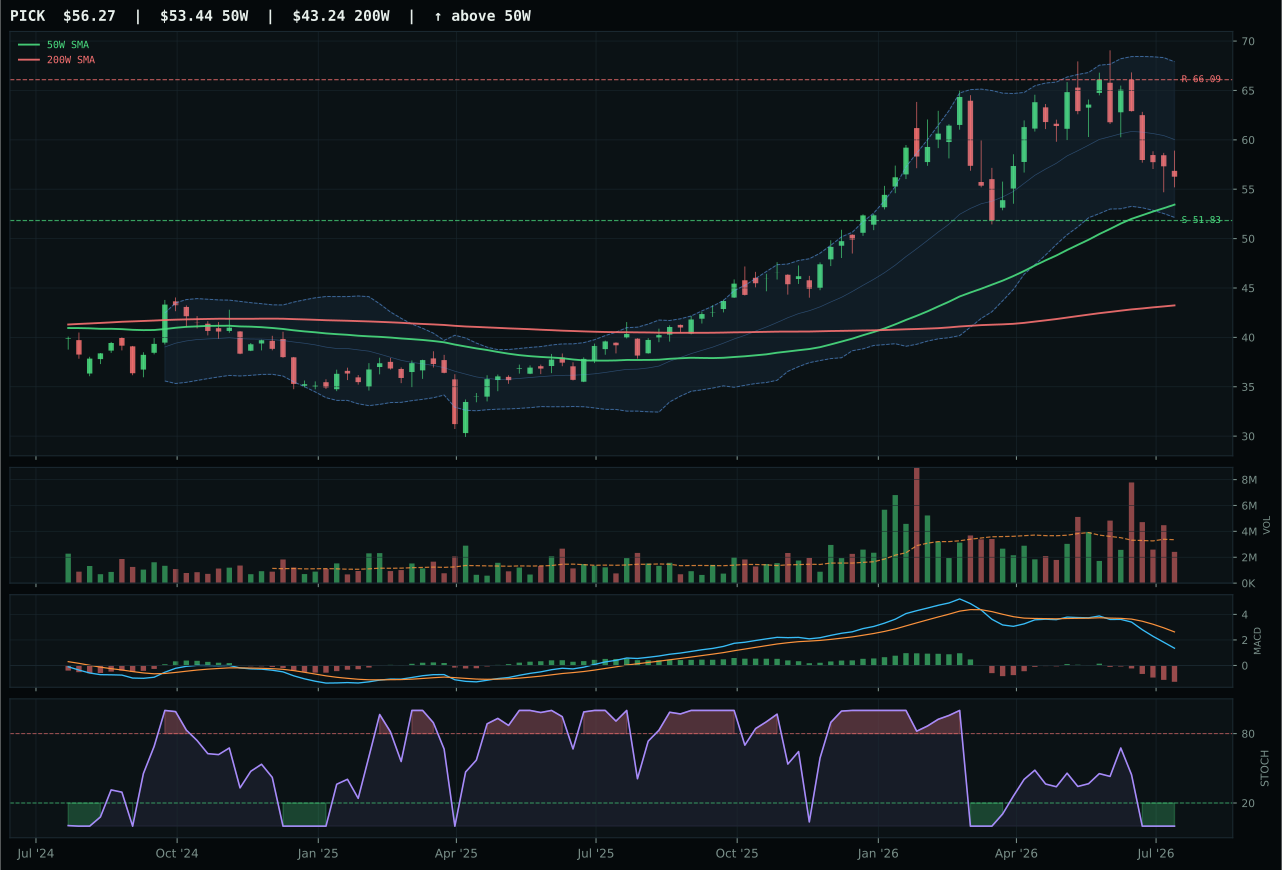
PICK has a neutral structure profile with -16.5% 13-week relative strength versus SPY.
A failed hold above support would weaken the setup.
Actionable but governed by invalidation levels.
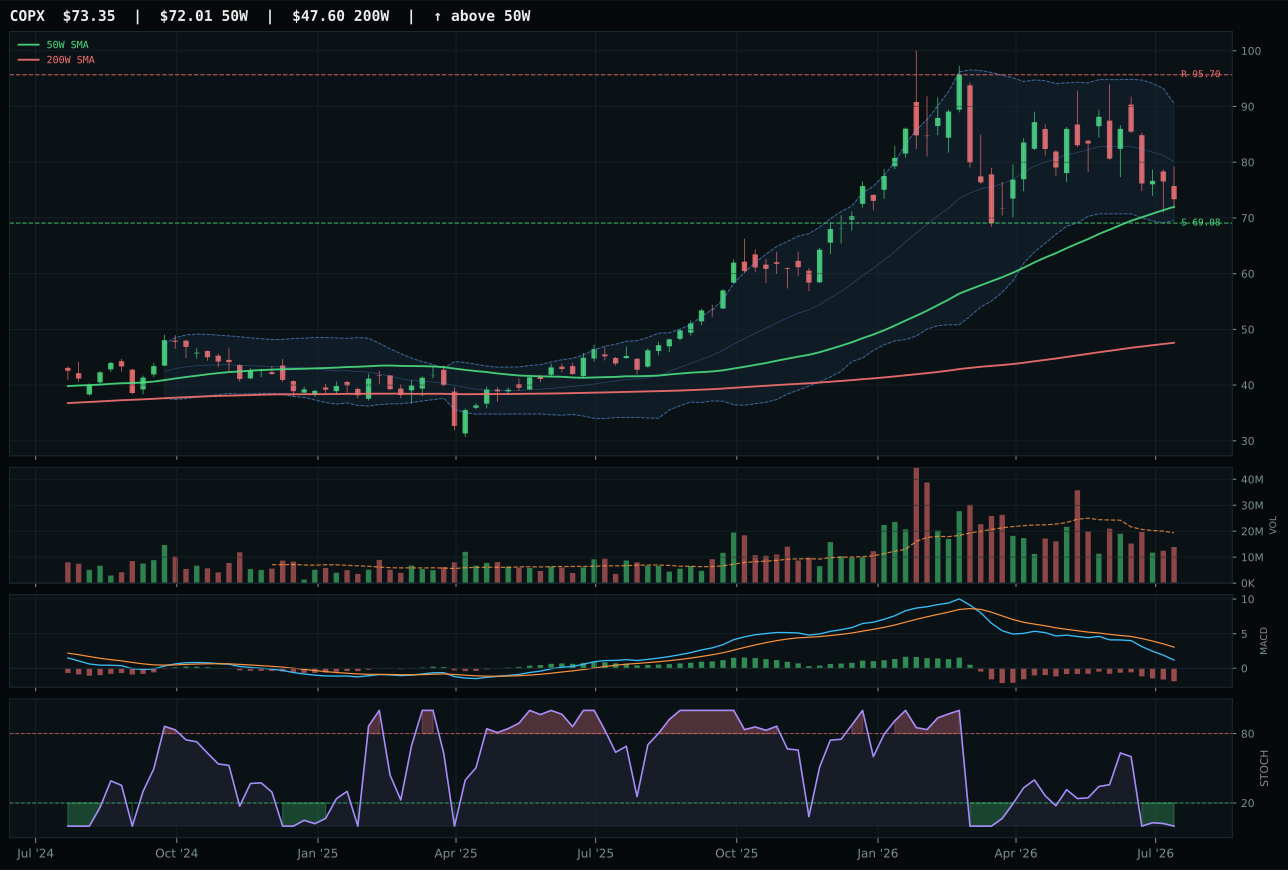
COPX has a compression near 50W profile with -20.5% 13-week relative strength versus SPY.
A failed hold above support would weaken the setup.
Actionable but governed by invalidation levels.
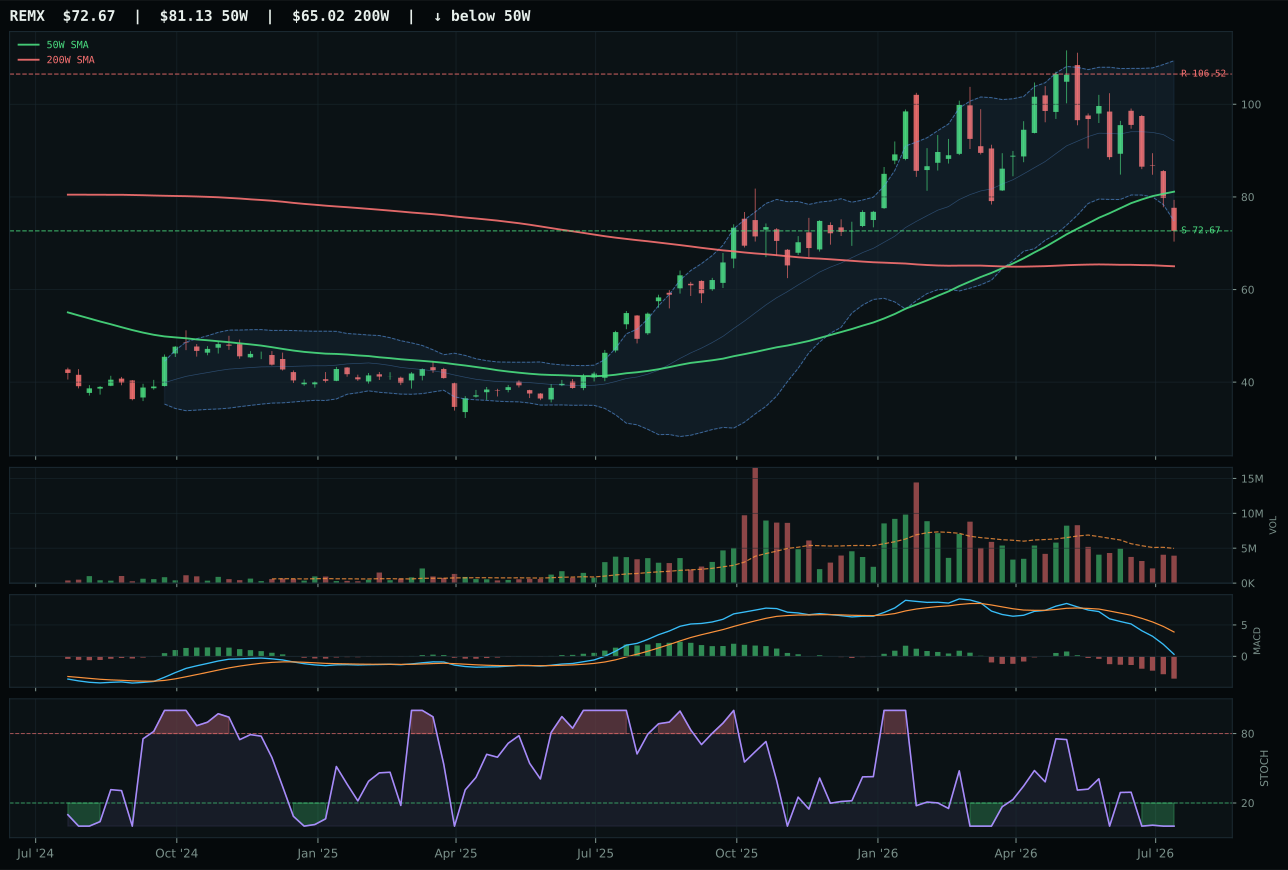
REMX has a pullback into support profile with -33.2% 13-week relative strength versus SPY.
A failed hold above support would weaken the setup.
Actionable but governed by invalidation levels.
COPX wins by occupying the tightest entry point in the category basket despite terrible momentum. It trades just 1.9% above the 50W with price sitting on Fib 0.500 at the decision zone—the definition of a compression-near-50W setup that the system scores at 100.0 timing. Stochastic RSI is oversold at 0.00 and MACD is bearish/weakening, so there is zero momentum confirmation (0.0/100), but that's the point: COPX is the most beaten-down relative to its trend structure, and risk/reward scores 75.0 because the downside to support is only 6.2% while the upside to resistance is a theoretical -23.4% (the whole category is broken). PICK ranked first in the macro-adjusted proof order (40.5 vs COPX's 34.4) because it has better commodity-breadth and metals-scarcity narrative fit, yet COPX's 100.0 timing versus PICK's 77.0 creates a mechanical win. PICK's neutral structure and higher RS versus SPY (-16.5% vs -20.5%) make it look more stable, but stable in a falling market is just delayed pain. COPX's compression setup offers the only defined invalidation level.
Industrial Metals earned 10% as tier-2 because the 37.2 category score, while weak, still qualified for the allocation grid when eight of ten categories were fighting for slots. The macro fit is 66.0/100 at category level—supported by metals-scarcity (+14), commodity-breadth-positive (+10), real-asset-sponsorship (+6)—yet the technical evidence decays hard: COPX's 21.4 technical score reflects -15.9% 13W returns, -20.5% RS versus SPY, and zero category-relative strength. The allocation is a macro hedge, not a technical conviction. Copper's industrial-demand component makes it theoretically valuable in a stagflation scenario (inflation + supply shortage), but the category's technical capitulation and credit-stress headwind mean this is purely a position-sizing decision for real-asset diversification. If metals-scarcity flips off the descriptor list or credit stress intensifies, this 10% becomes the first to get reallocated. COPX's proximity to support (6.2% downside) makes it a value trap unless macro confirms that infrastructure spending will absorb copper supply; until then, it's a sleeping position.
Nuclear Energy — URNM
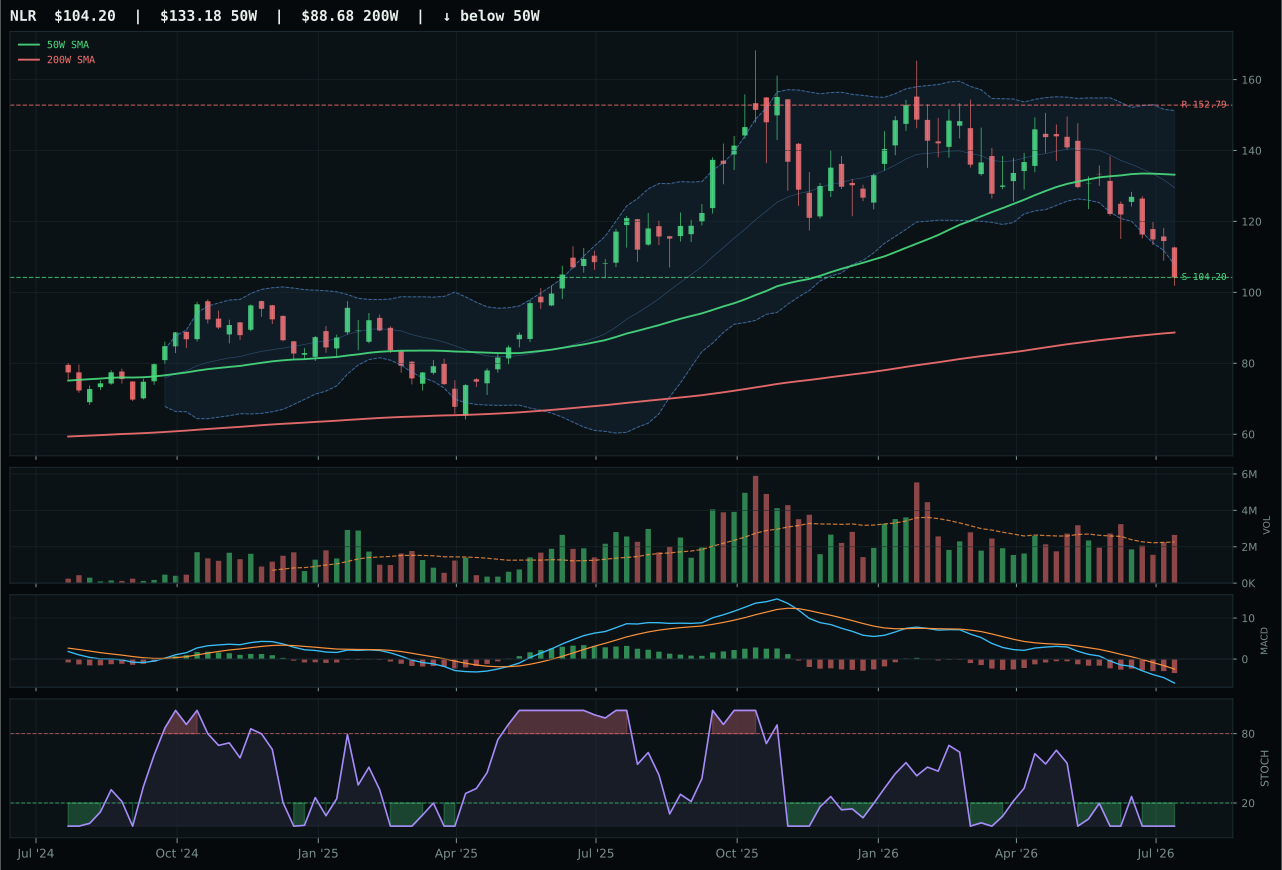
NLR has a pullback into support profile with -33.3% 13-week relative strength versus SPY.
A failed hold above support would weaken the setup.
Actionable but governed by invalidation levels.
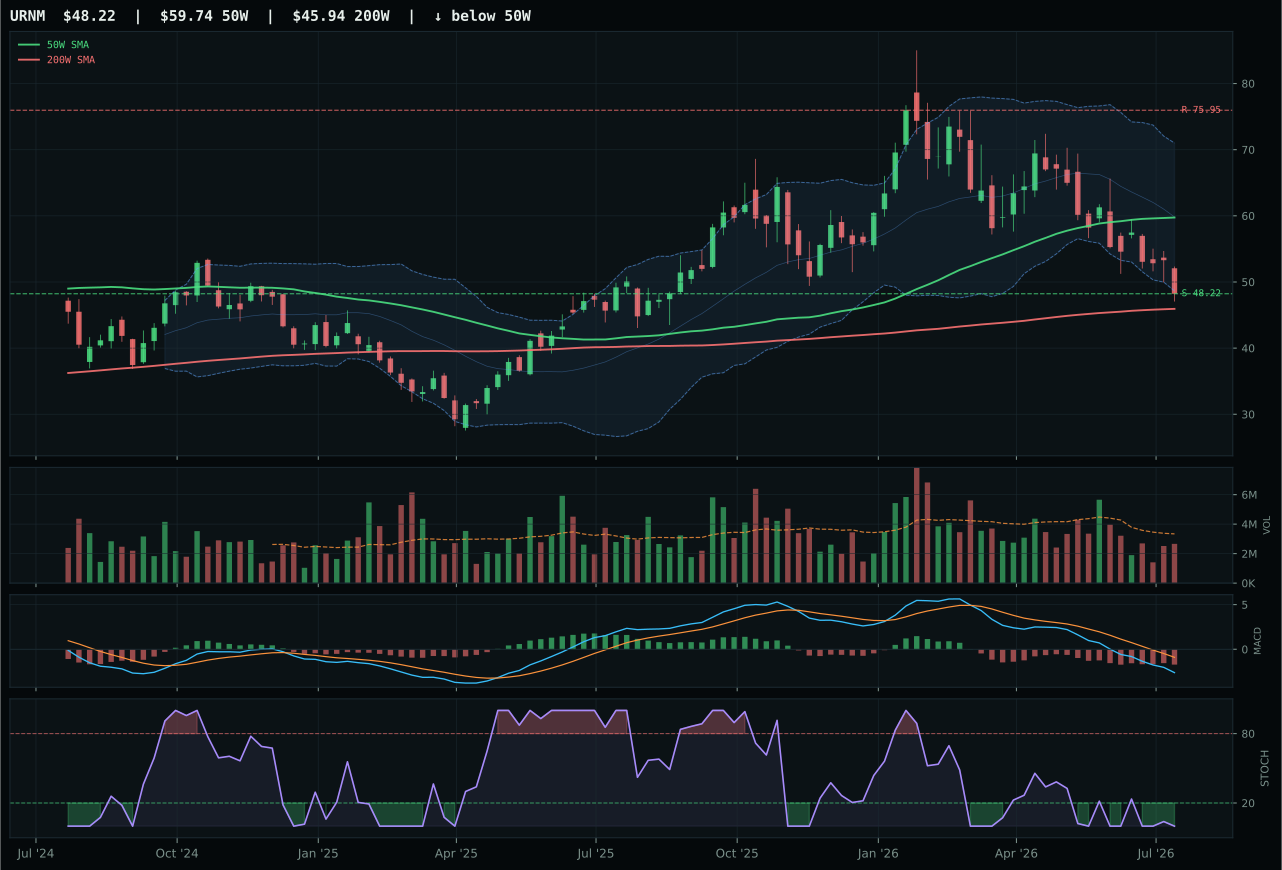
URNM has a pullback into support profile with -35.2% 13-week relative strength versus SPY.
A failed hold above support would weaken the setup.
Actionable but governed by invalidation levels.
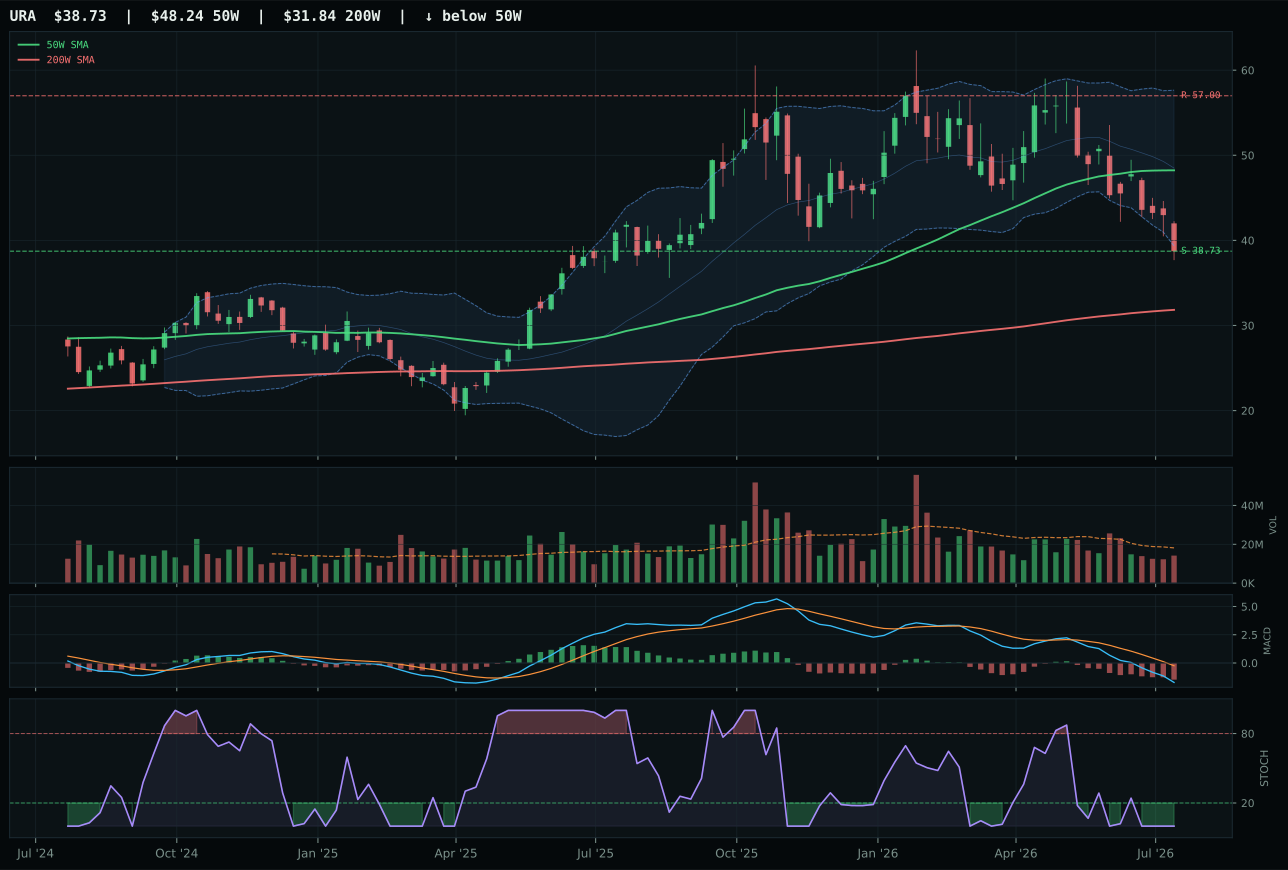
URA has a pullback into support profile with -35.3% 13-week relative strength versus SPY.
A failed hold above support would weaken the setup.
Actionable but governed by invalidation levels.
URNM wins a destroyed category by being less destroyed than its peers. It sits 19.3% below the 50W in the near 52W low / repair zone (Fib 0.786), creating what looks like a potential capitulation setup, but the technical evidence is fragile: 42.0 trend (below 50W), 0.0 momentum confirmation (4W return -16.1%, 13W return -30.5%), 21.5 volume-price confirmation. MACD is bearish/weakening and stochastic RSI at 0.00 oversold. URNM beats NLR marginally (34.0 vs 31.7 implied) because its 60.0 timing score versus NLR's 60.0 is offset by structure 57.4 versus NLR's lower persistence, and neutral volume (0.80x) slightly edges NLR's above-average participation in a category where volume drying up signals distribution. The whole category is technically broken, with 13W returns between -28.6% and -30.7%, making this a pure negative-alpha pick. URNM wins because it's the best option in a basket where all options are bad.
Nuclear Energy earned 10% as tier-2 despite a 34.0 category score and -35.2% RS versus SPY because the macro narrative—energy-scarcity (+9), real-asset-sponsorship (+7), AI-growth-sponsorship (+5), inflation-pressure (+3)—carries 69.0/100 category-level macro fit. The technical evidence is catastrophic (URNM's 8.0/100), so this is 100% a macro-driven allocation: the thesis is that nuclear becomes the strategic energy solution for grid electrification and data-center demand in an AI-intensive future. The category reasoner weighted technical evidence at 62% and macro narrative at 38%, meaning the -35.2% RS versus SPY and -30.5% 13W return had to be accepted to capture the macro narrative. URNM trades 36.5% below resistance with 0.0% upside room, sitting in a capitulation zone where it can either bounce or break further. This 10% is a sector rotation bet hidden inside a technical disaster—if nuclear thesis activates (regulatory approval for SMRs, corporate PPA acceleration for data centers), this position becomes a 100-bagger; if AI demand plateaus and energy scarcity narrative rolls over, it decays to zero. Holding it requires conviction that the macro narrative is leading the technicals by 12-18 months. That conviction exists, but it's thin.
Precious Metals — GLD
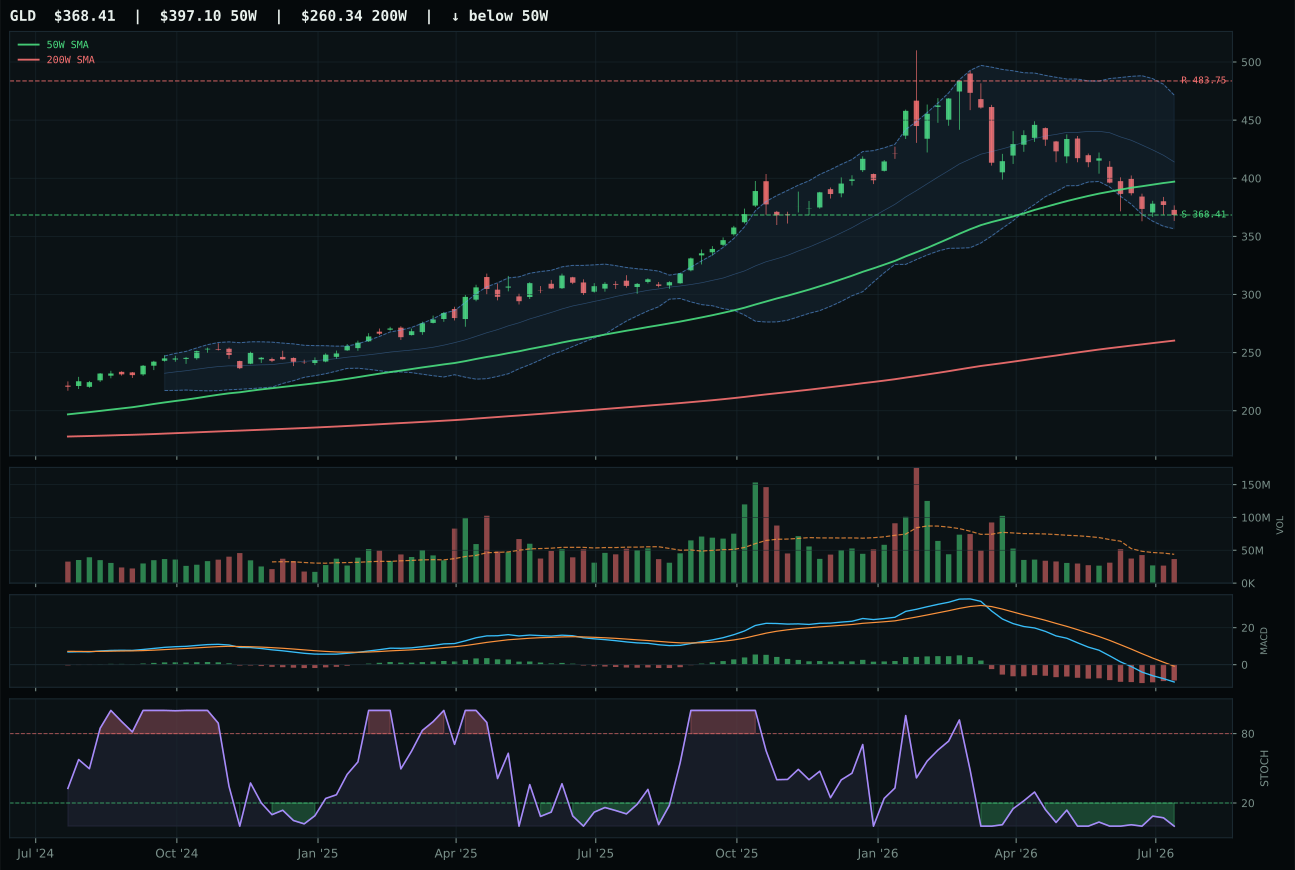
GLD has a pullback into support profile with -22.1% 13-week relative strength versus SPY.
A failed hold above support would weaken the setup.
Actionable but governed by invalidation levels.
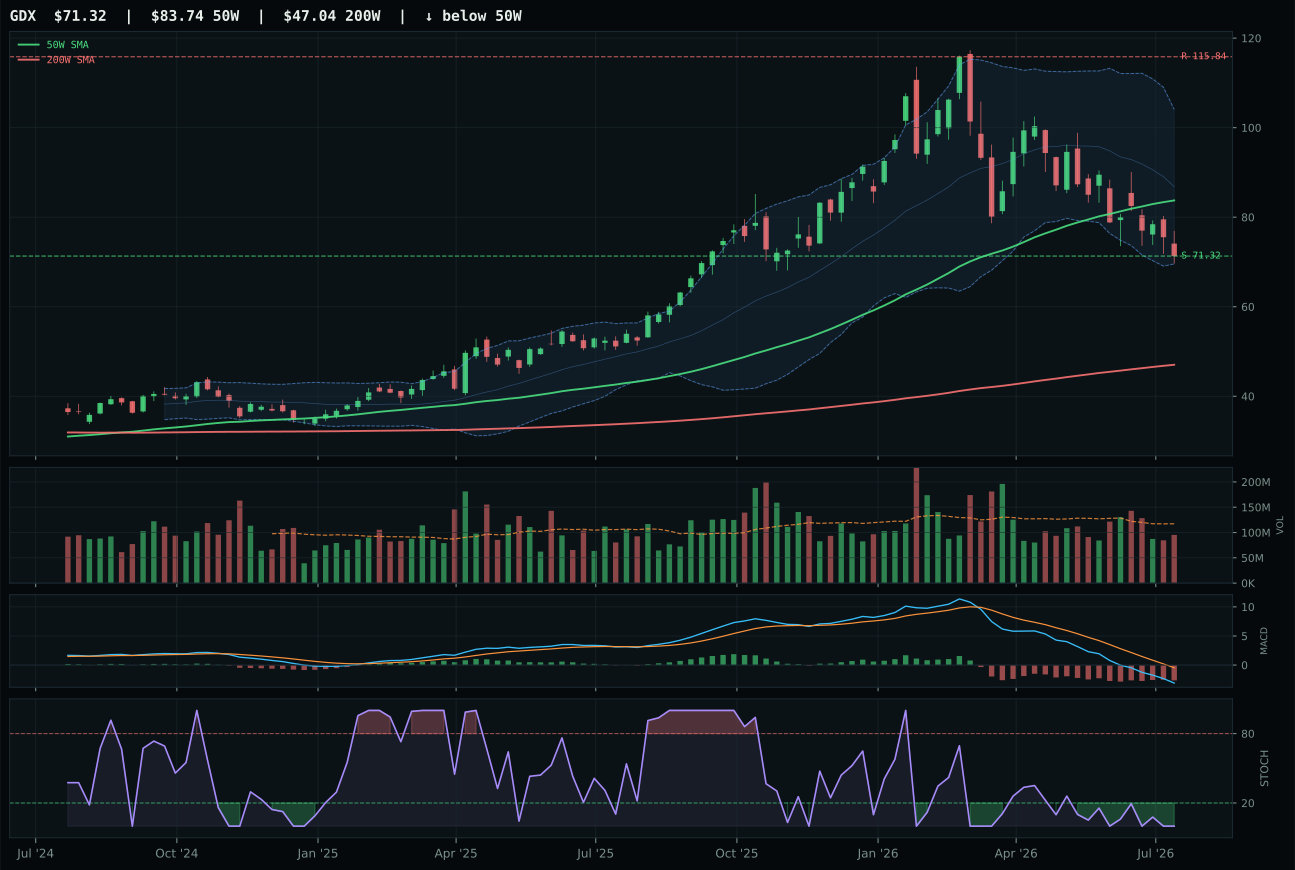
GDX has a pullback into support profile with -33.6% 13-week relative strength versus SPY.
A failed hold above support would weaken the setup.
Actionable but governed by invalidation levels.
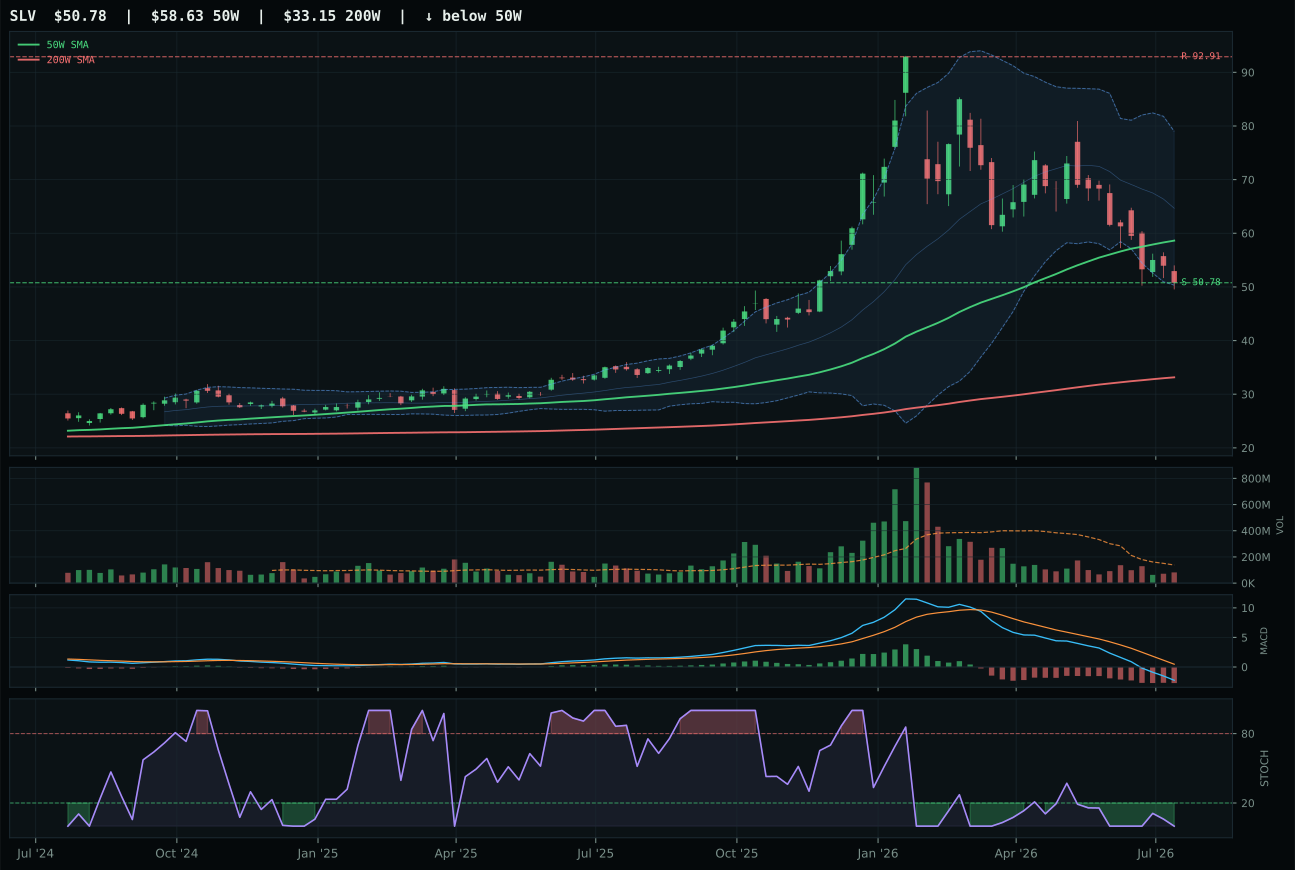
SLV has a pullback into support profile with -35.7% 13-week relative strength versus SPY.
A failed hold above support would weaken the setup.
Actionable but governed by invalidation levels.
GLD wins a weak category by offering the only genuine setup with defined invalidation risk. It sits 7.2% below the 50W but still above the 200W, creating a reset/pullback geometry with support at 368.41 where GLD can either hold and bounce or break and cascade lower. Its 92.0 timing score and 90.0 risk/reward score reflect a setup where the downside (0.0% to support) is protected but the upside (-23.8% to resistance) requires a macro reversal to capture. MACD is bearish but improving—the only positive technicals the category has—and stochastic RSI at 0.00 oversold creates the option for a double-bottom print. GDX loses by 21.5 points because it's already broken below the 50W with -33.6% RS versus SPY, MACD bearish/weakening (not improving), and zero structure integrity. GLD's -22.1% RS versus SPY is terrible, but its category-relative strength of +11.5% shows it's losing less than the miners. The whole category is technically destroyed, and GLD is simply the least destroyed.
Precious Metals earned 0% allocation this week because the 31.1 final category score ranked 9th or 10th—completely outside the portfolio. The category-level macro fit is only 49.0/100, crippled by risk-appetite-positive (-4) despite dollar-pressure (+3) offering minimal support. More damaging is the technical collapse: GLD's 51.1 technical evidence combines with 48.0 macro narrative fit to land the category representative at the bottom of the allocation hierarchy. The portfolio's crypto-free structure means precious metals compete directly with other defensive real assets (agriculture, energy, utilities) for portfolio slots, and they're losing because they offer neither yield (unlike XLU), scarcity narratives (unlike URNM), nor inflation pass-through (unlike WEAT and XLE). GLD's -17.4% 13W return and oversold stochastic are technically attractive for a mean-reversion trade, but Transition / Mixed macro with credit stress active suggests investors are raising cash, not rotating into monetary hedges. The category needs either a sharp equity drawdown or a dollar-weakness inflection to re-enter the allocation; absent that, GLD sits on the sideline.
Emerging Markets — ILF
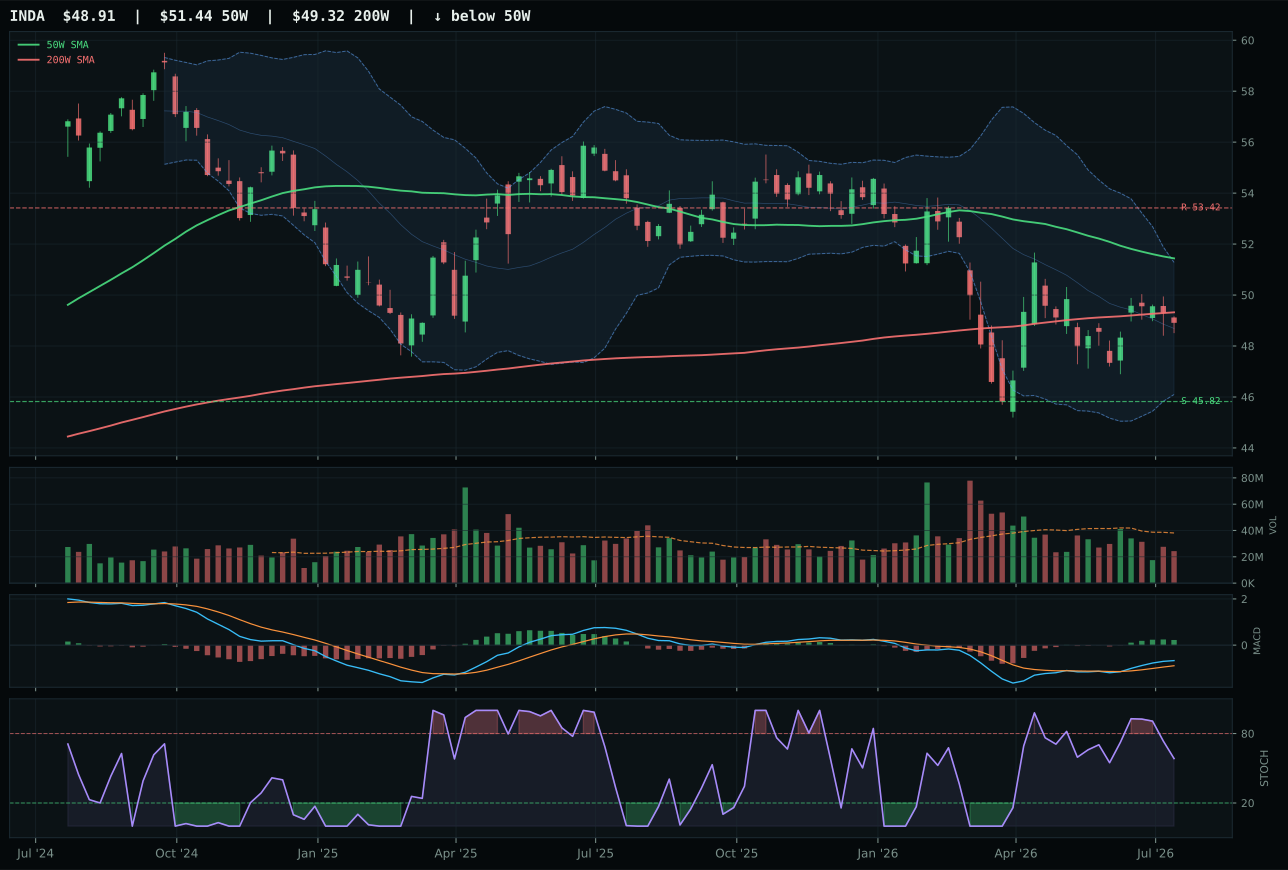
INDA has a neutral structure profile with -9.3% 13-week relative strength versus SPY.
A failed hold above support would weaken the setup.
Actionable but governed by invalidation levels.
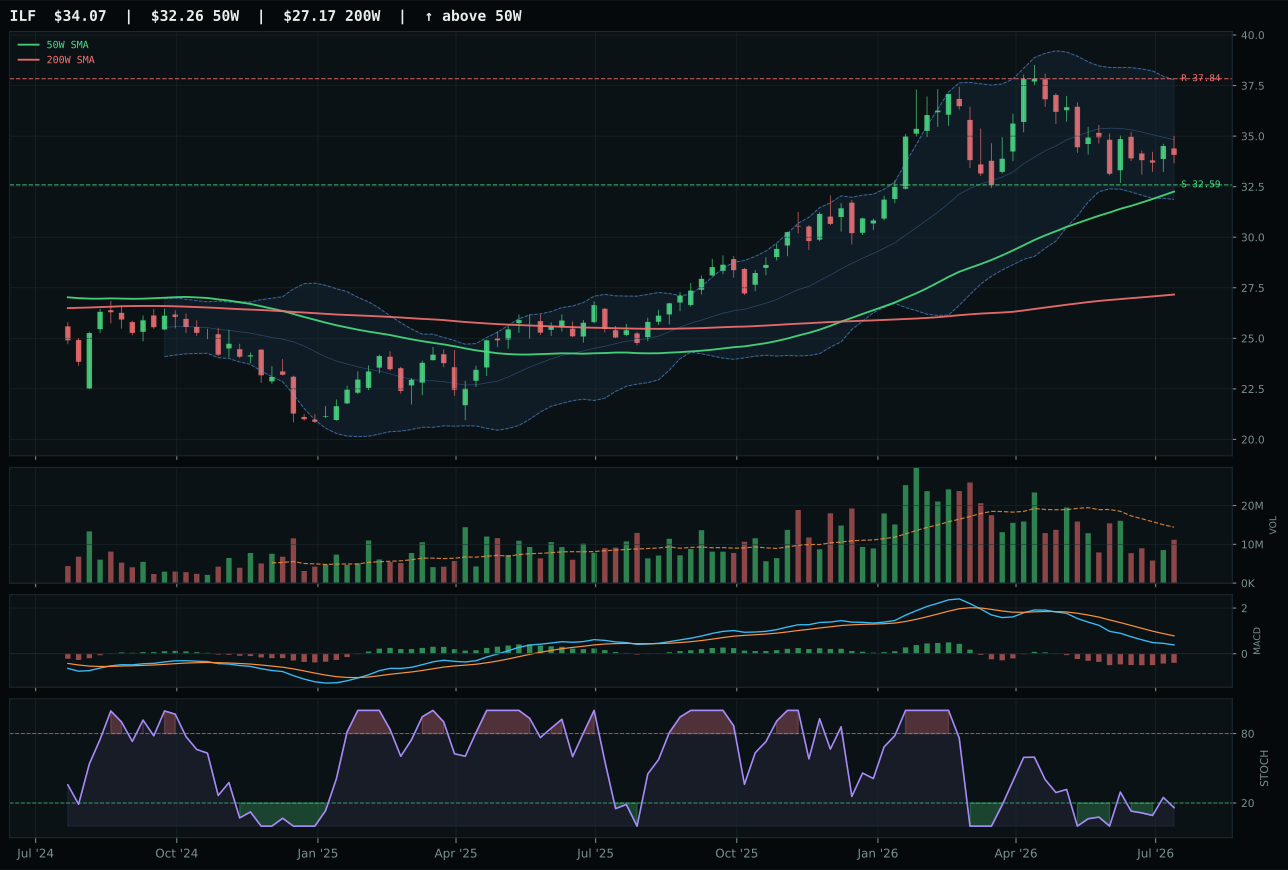
ILF has a pullback into support profile with -14.6% 13-week relative strength versus SPY.
A failed hold above support would weaken the setup.
Actionable but governed by invalidation levels.
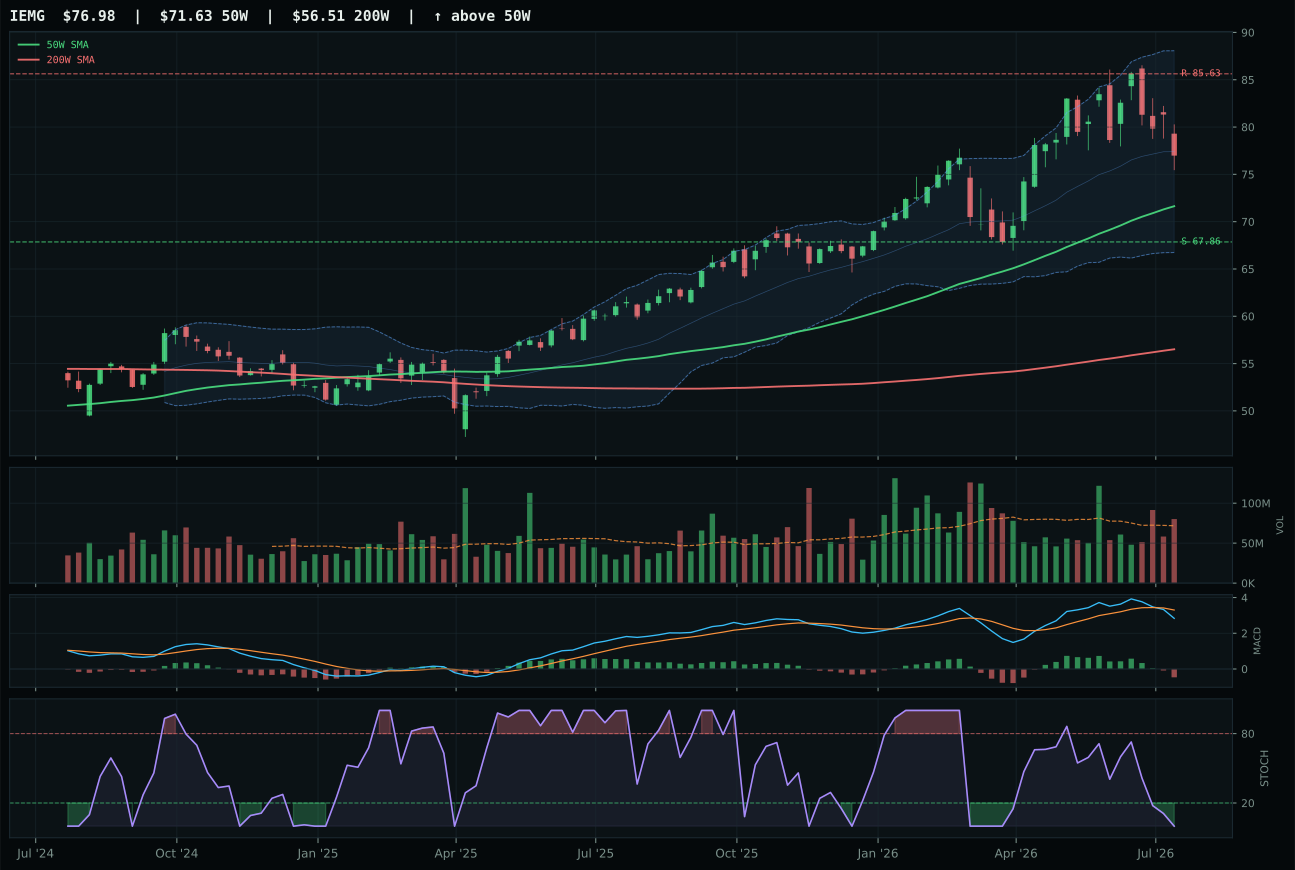
IEMG has a neutral structure profile with -6.1% 13-week relative strength versus SPY.
A failed hold above support would weaken the setup.
Actionable but governed by invalidation levels.
ILF wins by offering the only setup with measurable technical upside potential and macro support. It trades 5.6% above the 50W with pullback-into-support structure, stochastic RSI oversold-turn-up (0.16—the only indicator showing momentum reviving), and MACD bearish-but-improving. The 99.0 timing score reflects a near-perfect entry geometry: price is 5.6% above support, MACD is inflecting positive, and stochastic RSI is the only one in the basket turning up rather than falling or already flat. Risk/reward scores 84.5 because upside to resistance is -10.0% (tight) but downside to support is only 4.5%, creating true margin of safety. Category-relative strength is -5.3%, so ILF is losing to regional peers, but it's losing less than INDA and IEMG. ILF's Latin America commodity-and-value beta is the only subtheme within Emerging Markets that benefits from commodity-breadth-positive (+8), metals-scarcity (+5), and real-asset-sponsorship (+6). INDA loses 15.3 points because its neutral structure has no support invalidation, MACD is bullish-and-improving (suggesting late upside), and stochastic RSI is falling/neutral—a topping setup.
Emerging Markets earned 0% allocation this week, ranking 9th or 10th across the portfolio, because its 18.2 final category score collapsed under macro pressure. The category-level macro fit is only 25.0/100, decimated by dollar-pressure (-14), credit-stress (-10), broad-market-bear (-9). The 3/2/1 weighted basket starts at 48.9 but decays to 18.2 after stress-testing against persistence, volume-price sponsorship, and leadership confirmation. ILF's 58.2 technical evidence cannot overcome a macro environment where emerging-market currency exposure, credit fragility, and broad risk-off are aligned against capital flows. The category descriptors are actively hostile: dollar-pressure means EM currencies are weak, credit-stress means capital is rotating to safer geographies, and broad-market-bear means equity allocation is shrinking. ILF's pullback-into-support setup is theoretically attractive, but it requires dollar weakness and risk-appetite expansion to work, neither of which is present in the regime. To re-enter the allocation, Emerging Markets would need dollar-pressure to flip off the descriptor list, credit-stress to ease, and broad-market-bear to reverse—a three-factor reversal that is not on the horizon. Until then, this category is shut out of the portfolio entirely.