
2026-07-10
Informational purposes only. The content in this report, including allocations, analysis, and commentary, is provided solely for informational and educational purposes. It does not constitute financial advice, investment advice, trading advice, or any other type of advice. Past performance does not guarantee future results. Always conduct your own research and consult a qualified financial professional before making investment decisions.
Weekly Allocation
| Ticker | Category | Weight | Role |
|---|---|---|---|
| CIBR | Technology | 20% | Top-2 (20%) |
| BOTZ | AI | 20% | Top-2 (20%) |
| XLU | Utilities & Infrastructure | 10% | Tier-2 (10%) |
| WEAT | Agriculture & Livestock | 10% | Tier-2 (10%) |
| ITA | Defense & Aerospace | 10% | Tier-2 (10%) |
| COPX | Industrial Metals | 10% | Tier-2 (10%) |
| URNM | Nuclear Energy | 10% | Tier-2 (10%) |
| FCG | Traditional Energy | 10% | Tier-2 (10%) |
Trade Instructions — Monday Open
Sell the tranche from 2026-06-12 (completing its 4-week hold). Buy the new tranche. Instructions show net portfolio changes — same-asset positions cancel, weight changes show the delta.
| Action | Ticker | Instruction |
|---|---|---|
| SELL | AIQ | Sell entire AIQ position (5.00% of portfolio) |
| SELL | ITA | Sell 14% of ITA position (reduce 17.50% → 15.00%) |
| SELL | XLK | Sell 50% of XLK position (reduce 5.00% → 2.50%) |
| SELL | MOO | Sell 50% of MOO position (reduce 5.00% → 2.50%) |
| SELL | XLE | Sell entire XLE position (2.50% of portfolio) |
| SELL | NLR | Sell 50% of NLR position (reduce 5.00% → 2.50%) |
| BUY | URNM | Buy URNM — 14.29% of freed cash (adds 2.50% to portfolio) |
| BUY | CIBR | Buy CIBR — 28.57% of freed cash (adds 5.00% to portfolio) |
| BUY | BOTZ | Buy BOTZ — 28.57% of freed cash (adds 5.00% to portfolio) |
| BUY | WEAT | Buy WEAT — 14.29% of freed cash (adds 2.50% to portfolio) |
| BUY | FCG | Buy FCG — 14.29% of freed cash (adds 2.50% to portfolio) |
Current Portfolio After Trade
Combined holdings across all 4 active tranches. Each tranche is 25% of the portfolio.
| Ticker | % of Portfolio | Weight Bar |
|---|---|---|
| CIBR | 15.00% | |
| ITA | 15.00% | |
| SMH | 12.50% | |
| COPX | 10.00% | |
| XLU | 7.50% | |
| URNM | 7.50% | |
| GLD | 5.00% | |
| BOTZ | 5.00% | |
| XLK | 2.50% | |
| MOO | 2.50% | |
| NLR | 2.50% | |
| PAVE | 2.50% | |
| GDX | 2.50% | |
| ILF | 2.50% | |
| VEGI | 2.50% | |
| WEAT | 2.50% | |
| FCG | 2.50% |
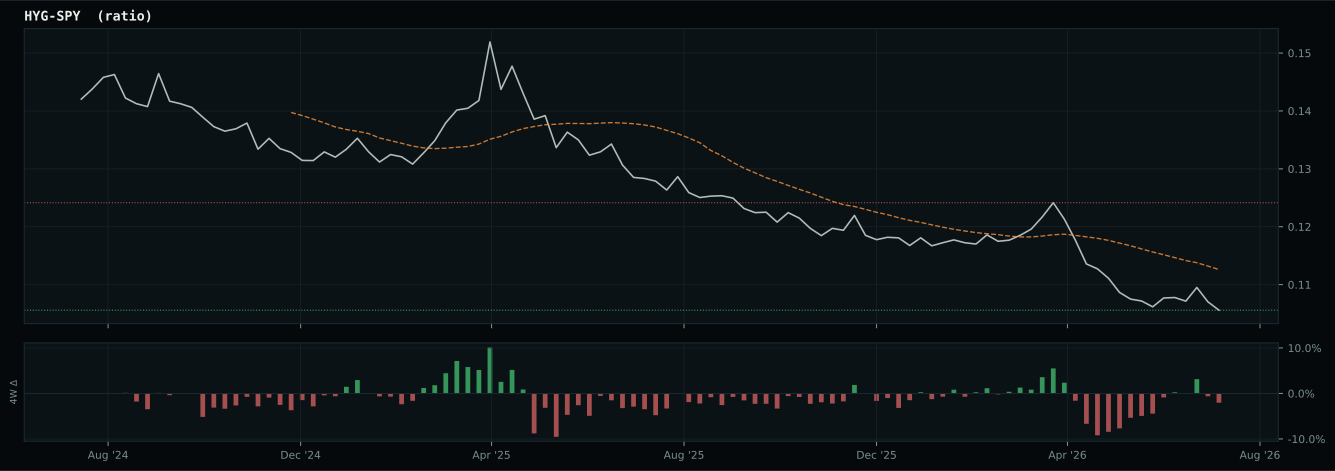
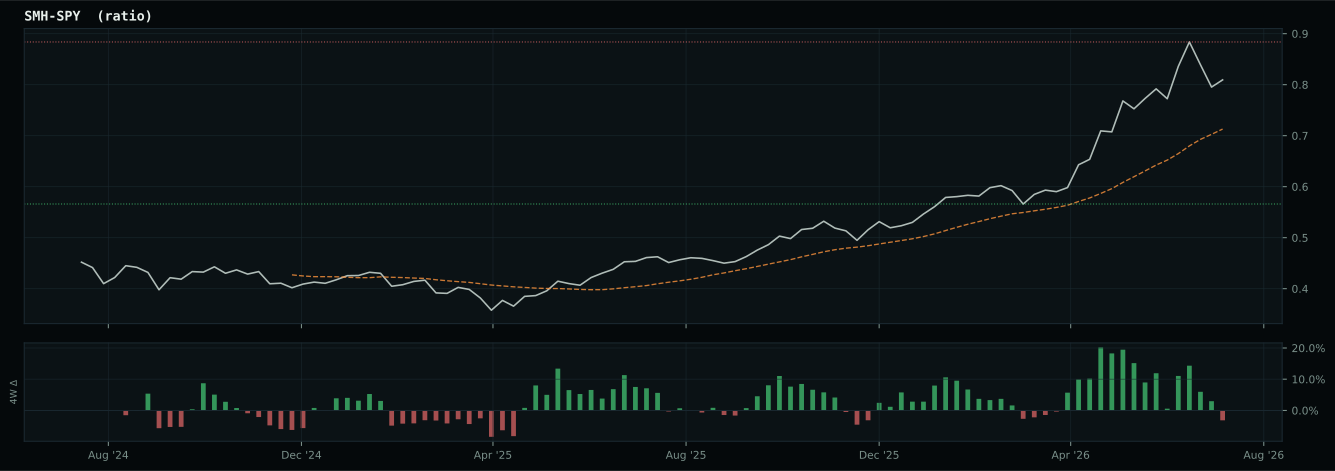
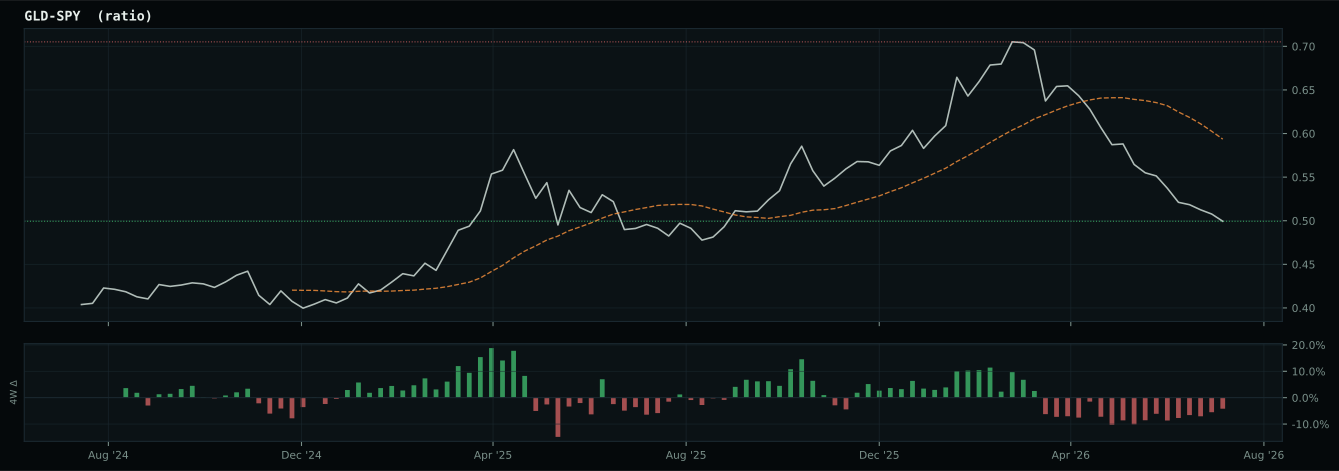
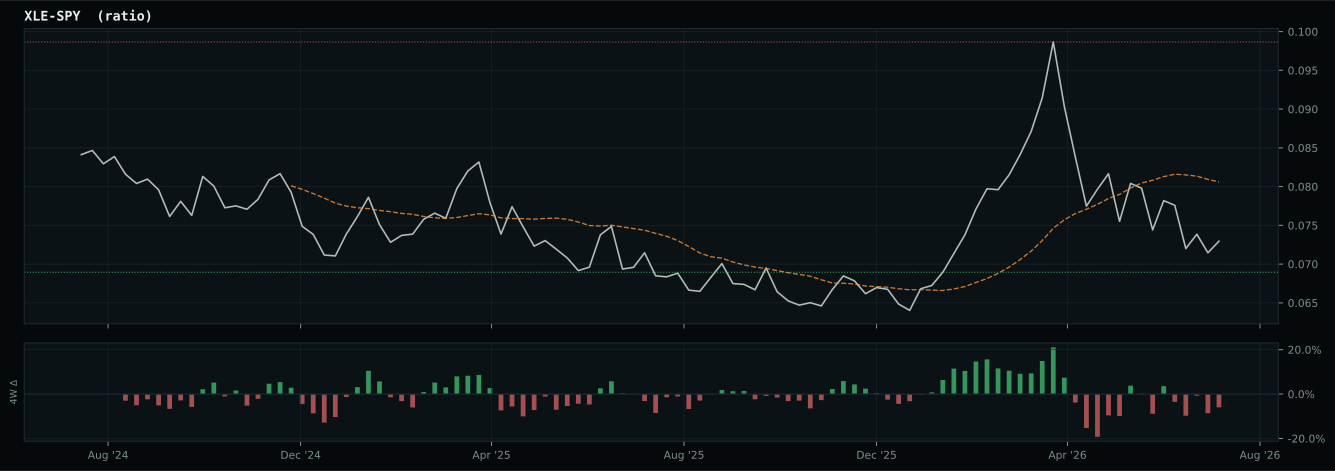
Macro Regime — Transition / Mixed
liquidity is improving but credit stress remains elevated
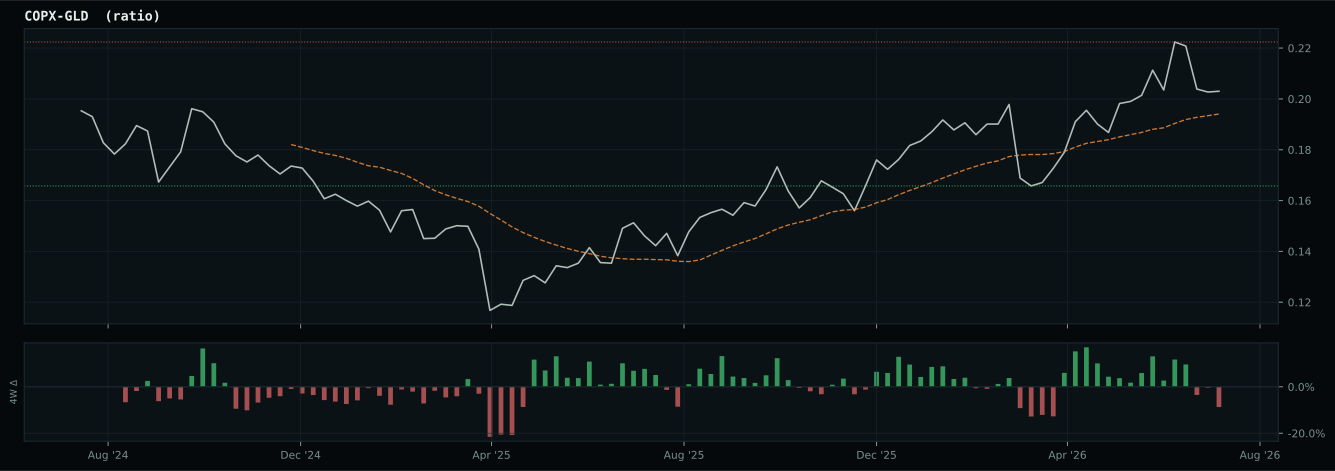
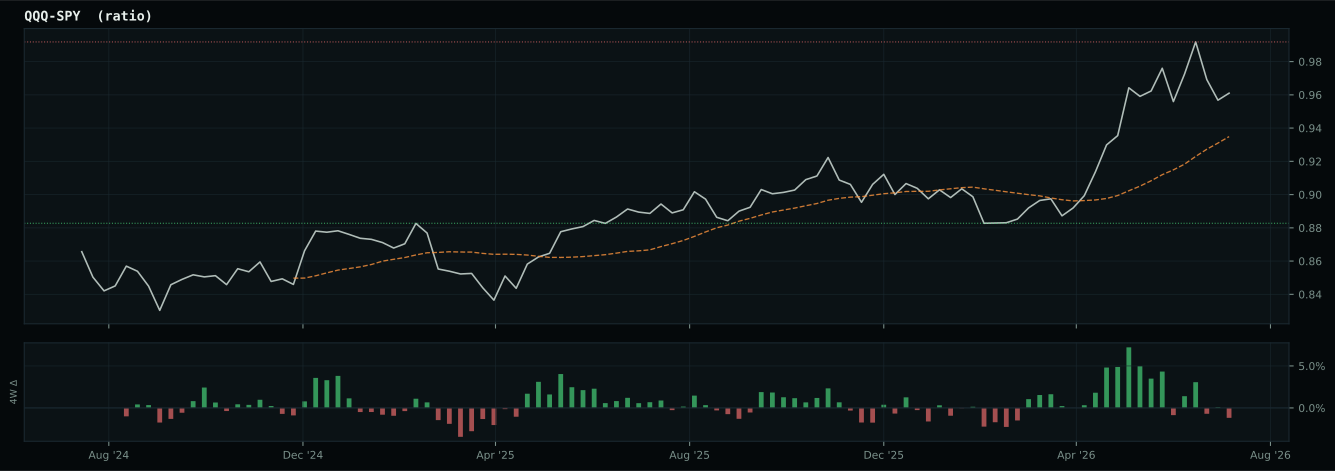
Macro Evidence Charts
Market-implied signals behind the macro regime scores. Each ratio compares two assets; the direction and slope of the ratio is what the macro engine reads.
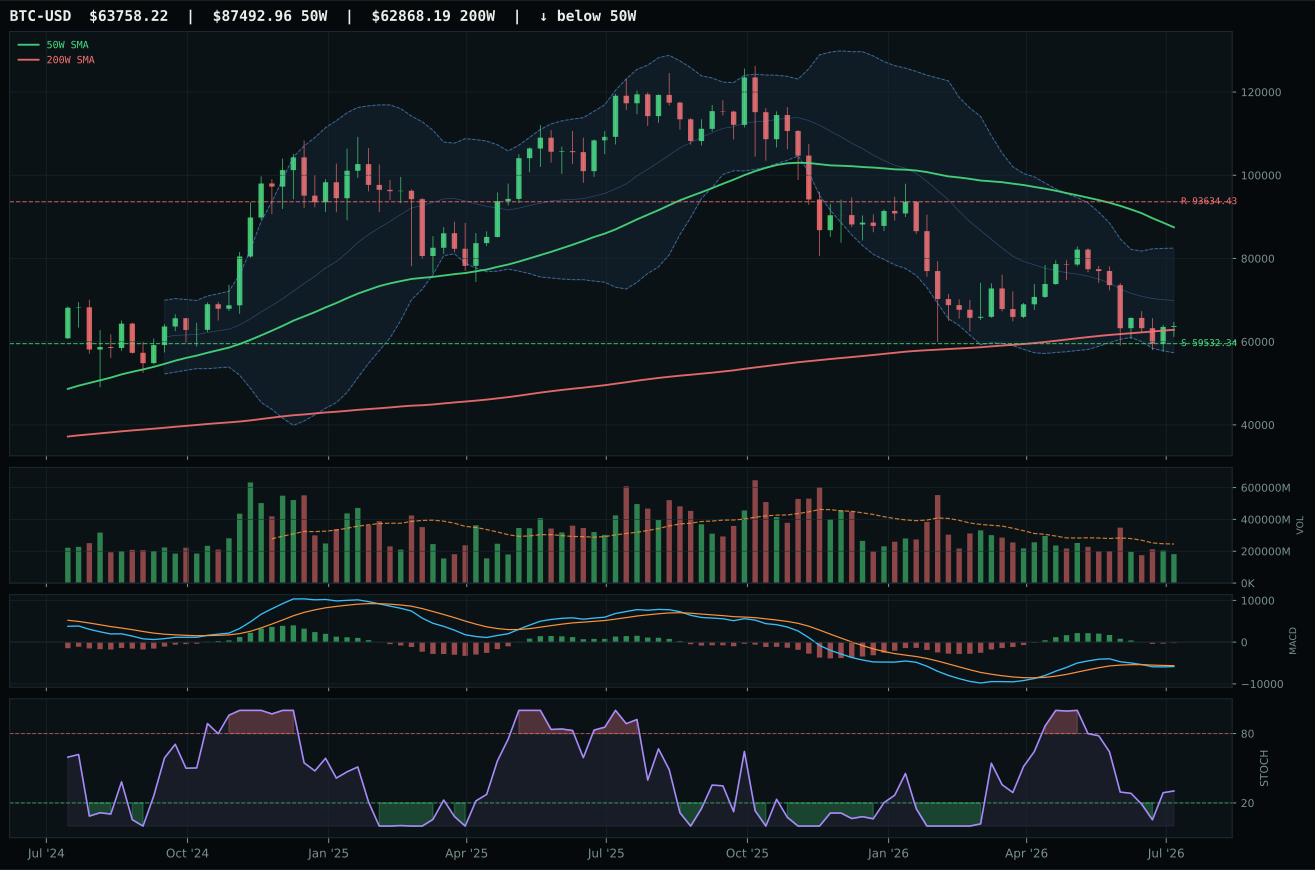
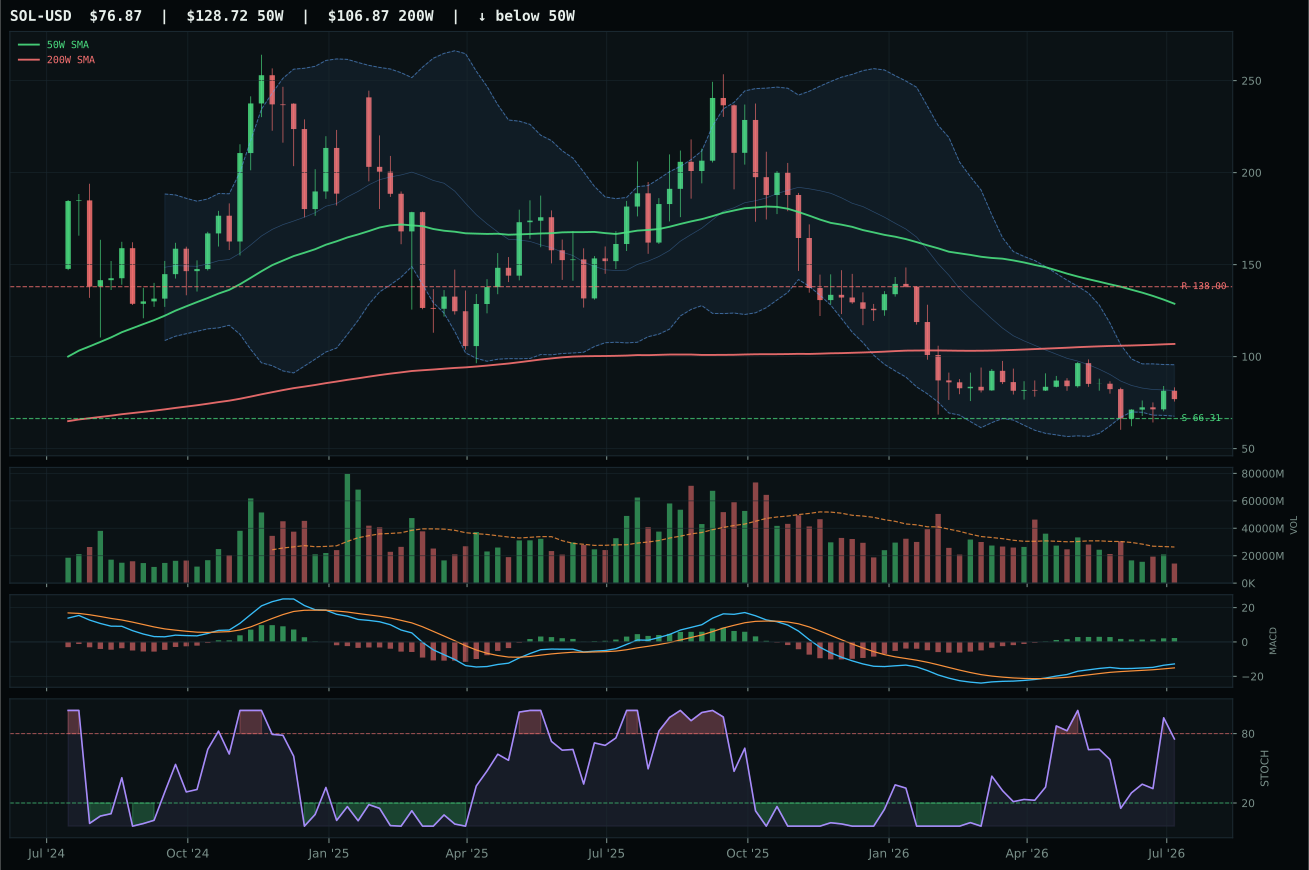
Crypto Regime — NoCrypto
post-touch range has not been tested enough: support tests 1/2, resistance tests 3/2
TrendBTC not confirmed
one or more available conditions failed
Category Rankings
| Rank | Category | Winner | Score | Alloc | 4W Ret | Peers (4W) |
|---|---|---|---|---|---|---|
| 1 | Technology | CIBR | 65.3 | 20% | — | IGV — · XLK — |
| 2 | AI | BOTZ | 57.4 | 20% | — | AIQ — · SMH — |
| 3 | Utilities & Infrastructure | XLU | 50.9 | 10% | — | IGF — · PAVE — |
| 4 | Agriculture & Livestock | WEAT | 42.6 | 10% | — | MOO — · VEGI — |
| 5 | Defense & Aerospace | ITA | 41.5 | 10% | — | XAR — · ROKT — |
| 6 | Industrial Metals | COPX | 37.1 | 10% | — | PICK — · REMX — |
| 7 | Nuclear Energy | URNM | 36.6 | 10% | — | URA — · NLR — |
| 8 | Traditional Energy | FCG | 35.9 | 10% | — | XLE — · XOP — |
| 9 | Precious Metals | GLD | 33.7 | 0% | — | GDX — · SLV — |
| 10 | Emerging Markets | IEMG | 19.1 | 0% | — | INDA — · ILF — |
Technology — CIBR
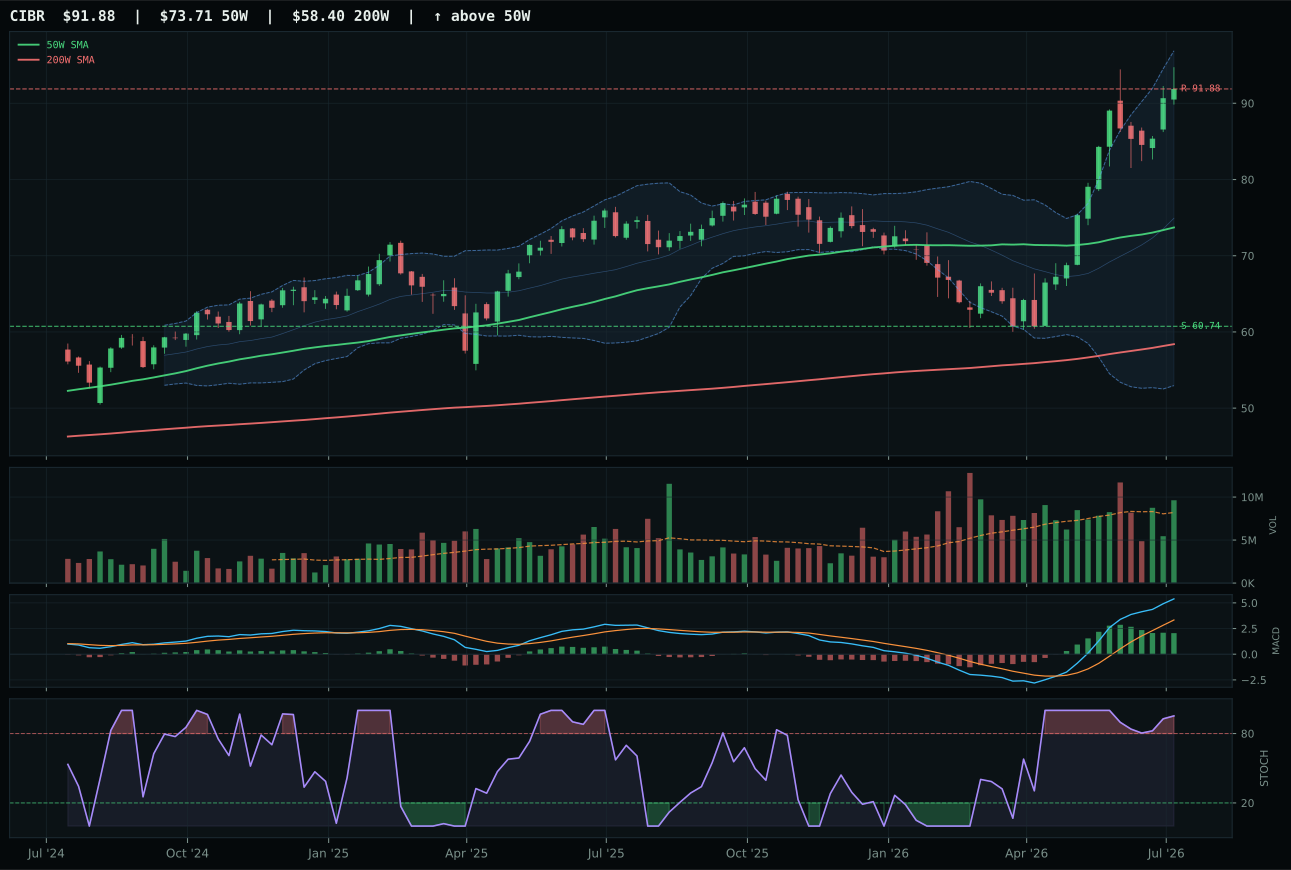
CIBR has a vertical extension profile with 40.2% 13-week relative strength versus SPY.
A failed hold above support would weaken the setup.
Actionable but governed by invalidation levels.
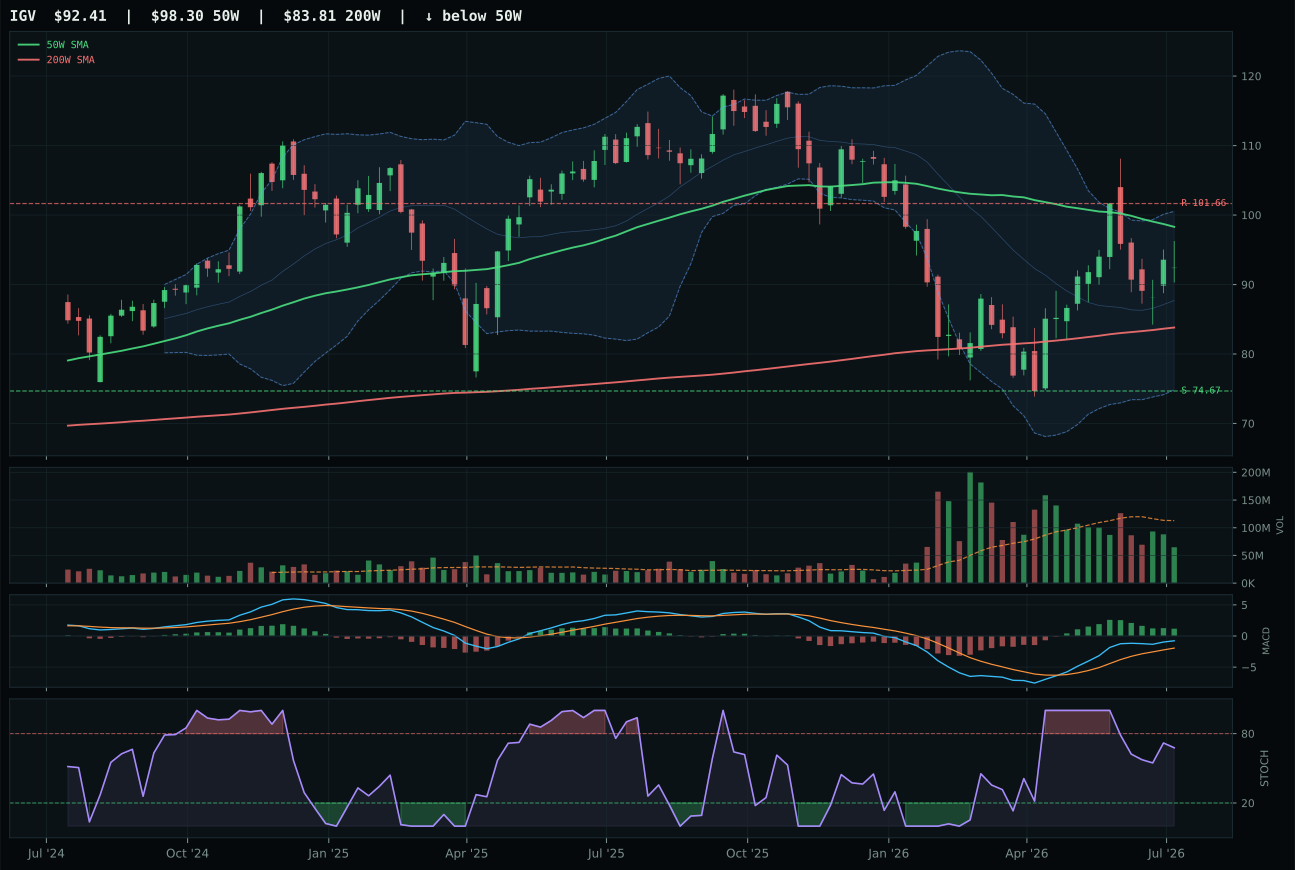
IGV has a neutral structure profile with 12.6% 13-week relative strength versus SPY.
A failed hold above support would weaken the setup.
Actionable but governed by invalidation levels.
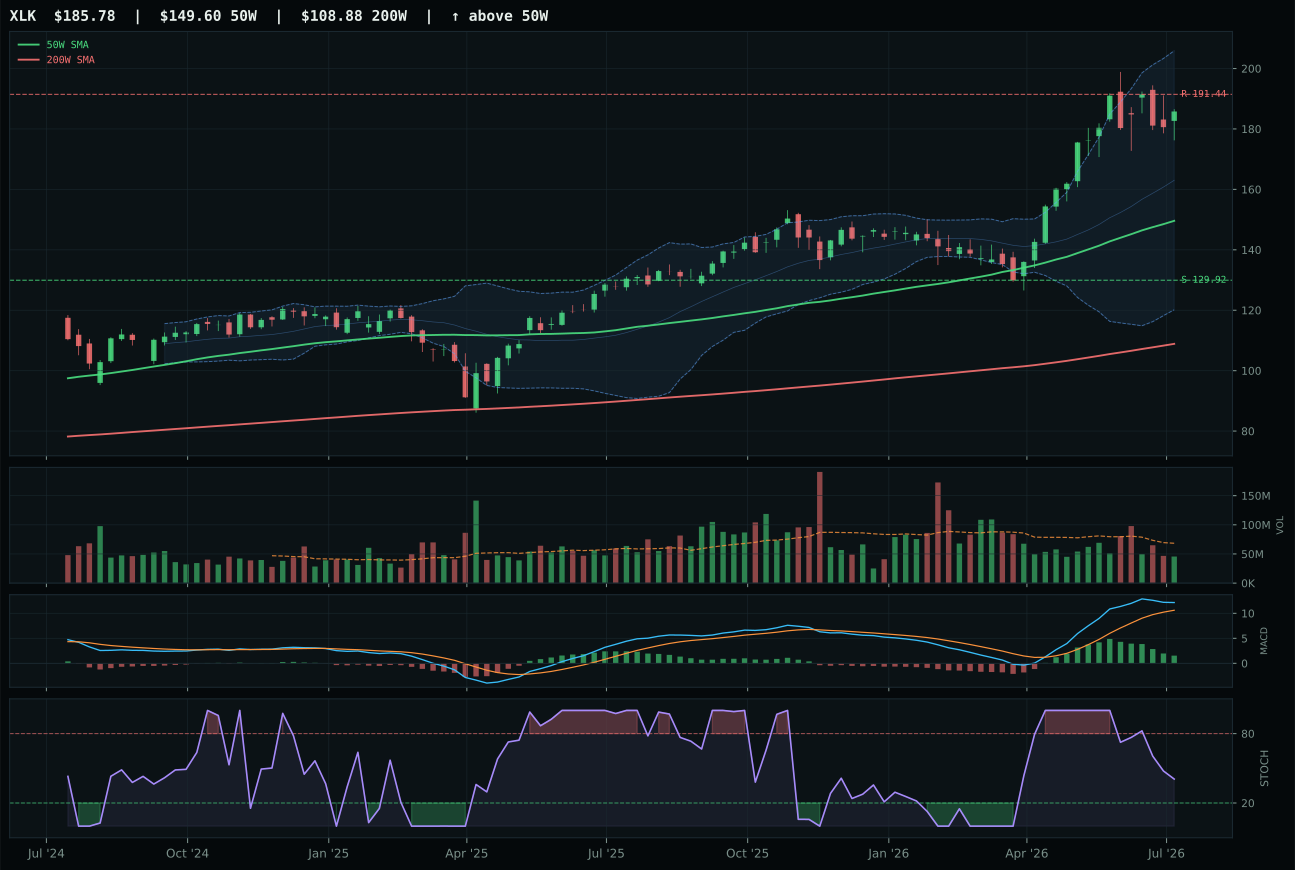
XLK has a vertical extension profile with 19.2% 13-week relative strength versus SPY.
A failed hold above support would weaken the setup.
Actionable but governed by invalidation levels.
CIBR wins the category because it has broken clear of the 50-week moving average with real breadth behind the move. The 51.3% thirteen-week return and 40.2% relative strength versus SPY tell a story of sustained accumulation—not a late-stage squeeze. Price sits 24.7% above the 50W, which normally signals exhaustion, but the above-average volume participation at 1.17x and persistent category-relative strength of 21.0% over IGV show that this is organized buying, not retail panic. IGV's setup is cleaner on timing (it's much closer to its 50W), but it has only 12.6% RS to SPY and thin volume confirmation, which means buyers are still deciding whether to commit. MACD is bullish but flattening in both names, so the extension in CIBR rewards trend followers while punishing mean-reversion traders. Structure clarity, volume sponsorship, and category dominance make this a 9.3-point gap—not a close call.
Technology earns its 20% top-2 slot because it scored 65.3, the second-highest category score this week, driven by CIBR's proven momentum and the macro regime's support for risk-on positioning. The active macro descriptors—particularly the +9 boost from risk appetite positive and +6 from AI growth sponsorship—validate the technical setup rather than fighting it. Credit stress is active at -7, which normally drags on high-multiple growth, but the broad market bear flag at -7 actually helps defensive posturing within tech (cybersecurity plays defensive infrastructure rather than pure growth). At a transition macro state, investors need at least one high-conviction growth lever, and CIBR's 51.3% thirteen-week return with above-average volume makes it more tactically sound than reaching for IGV's better timing on a pullback. A move below support at 60.74 or MACD deterioration would force a reassessment, but the setup currently justifies a double allocation.
AI — BOTZ
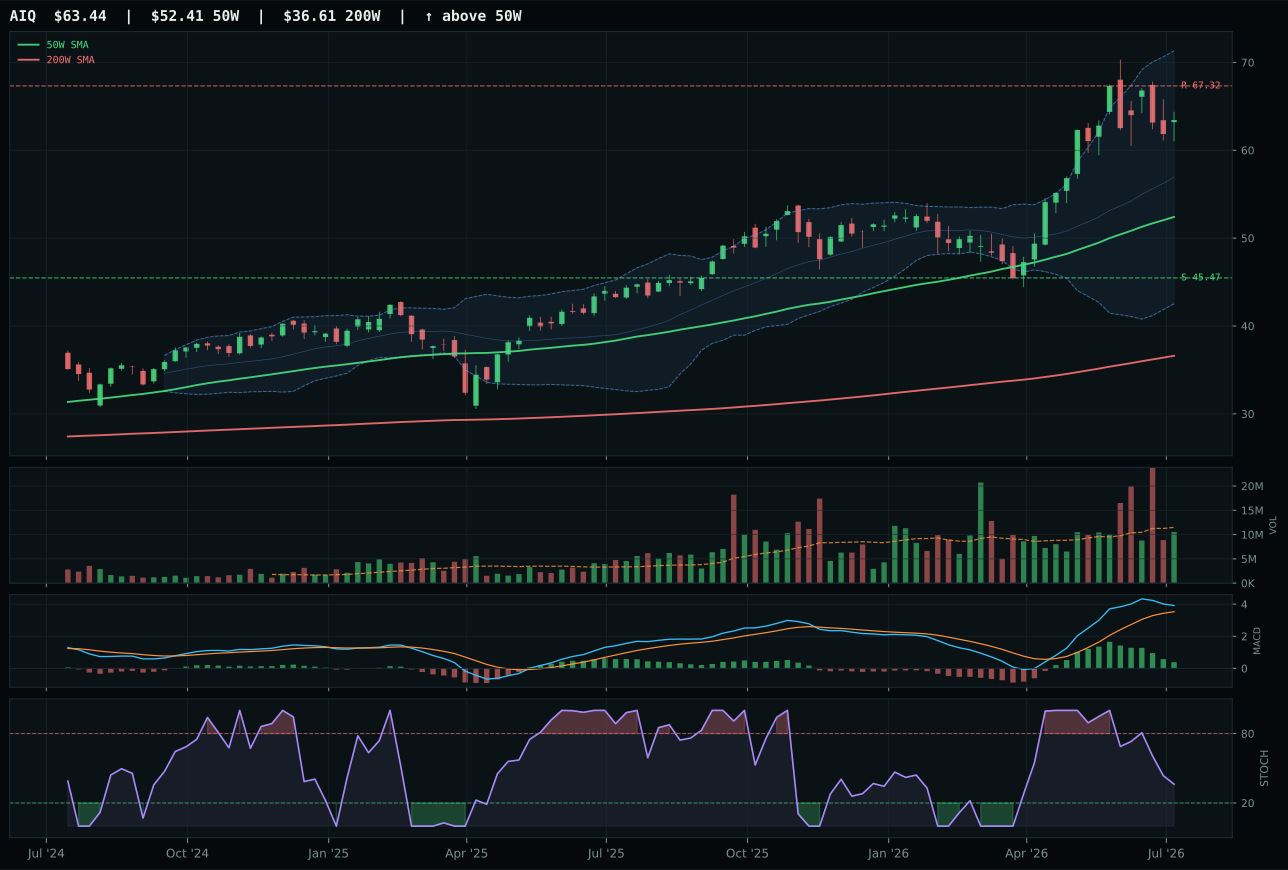
AIQ has a vertical extension profile with 17.4% 13-week relative strength versus SPY.
A failed hold above support would weaken the setup.
Actionable but governed by invalidation levels.
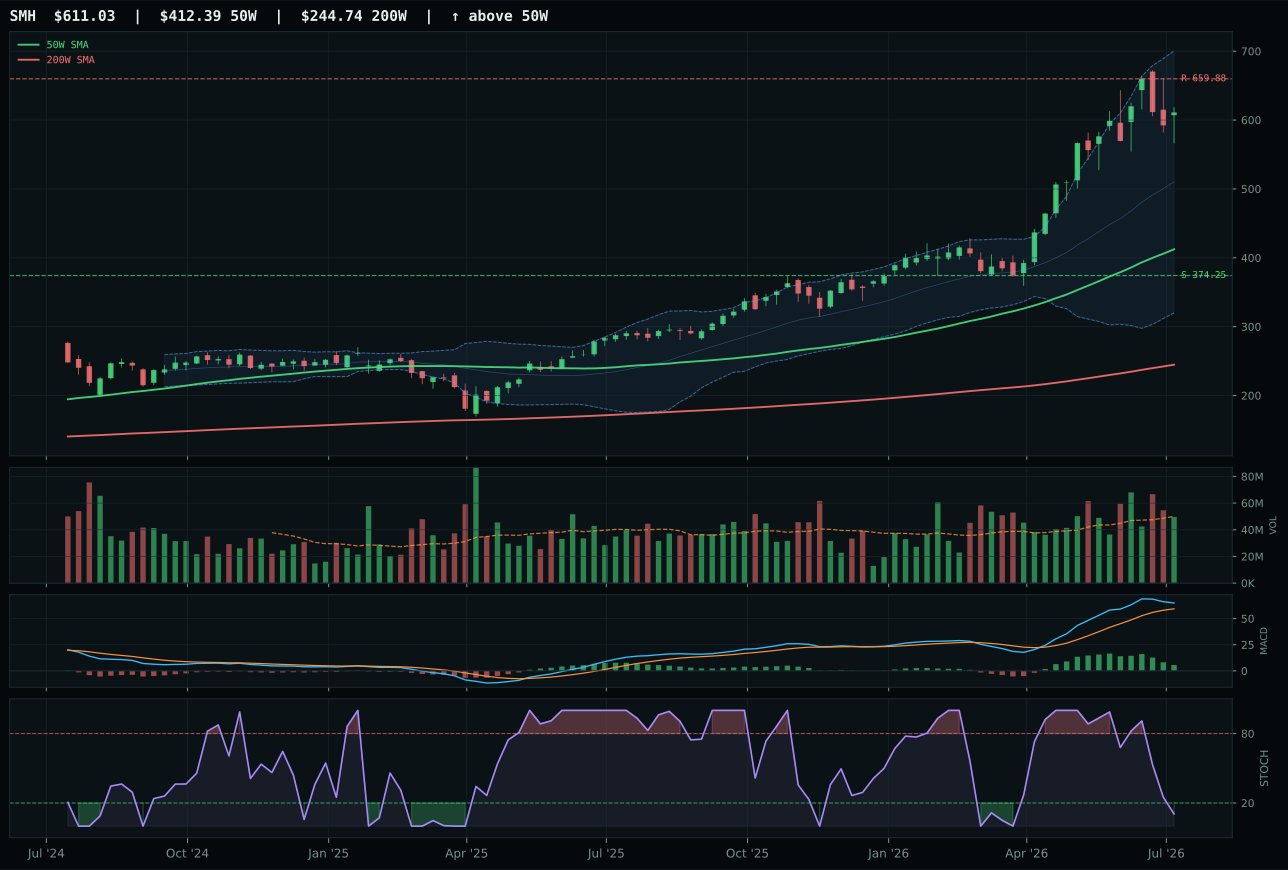
SMH has a vertical extension profile with 28.8% 13-week relative strength versus SPY.
A failed hold above support would weaken the setup.
Actionable but governed by invalidation levels.
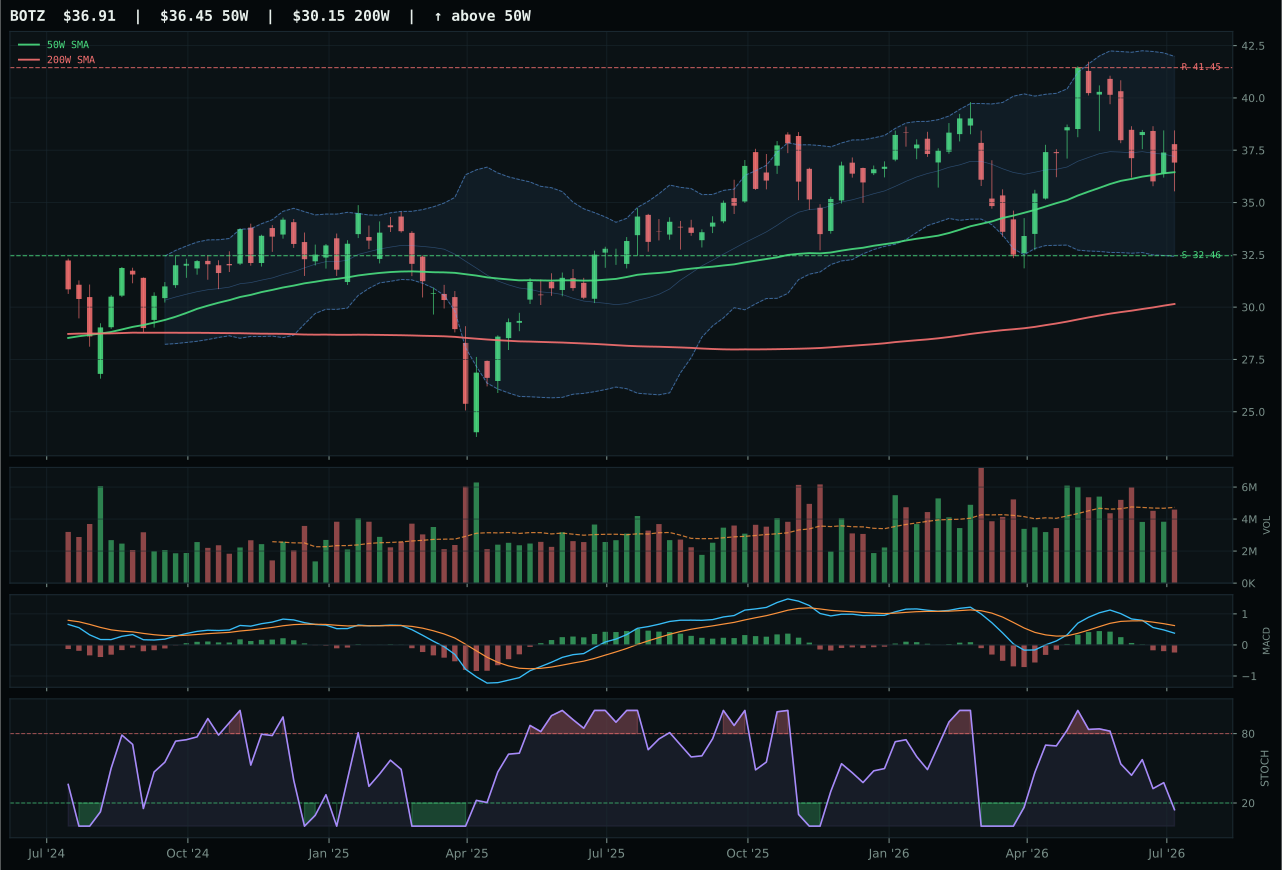
BOTZ has a compression near 50W profile with -6.9% 13-week relative strength versus SPY.
A failed hold above support would weaken the setup.
Actionable but governed by invalidation levels.
BOTZ wins by being oversold and compressing near the 50W at precisely the moment when the category needed a reset rather than another chase. A 4.2% thirteen-week return and -6.9% RS to SPY look terrible on their face, but that's exactly why BOTZ has timing of 100.0—it's 1.3% from the 50W with stochastic RSI at 0.14 (oversold) and MACD weakening rather than plunging. The chart sits in the middle retracement zone near Fib 0.500, a decision point where either buyers step in and defend or support breaks. AIQ, the runner-up, has 28.5% thirteen-week return and is 21.0% extended from the 50W with neutral stochastic RSI—meaning it's already paid most of the freight and has no edge on pull-in timing. BOTZ's risk-reward shows 13.7% downside to support versus only -11.0% upside, creating an asymmetry in favor of patient entry. Volume is neutral across both, so this is not about sponsorship yet; it's about which setup offers better odds for the next move.
AI earns 20% alongside Technology because at 57.4, it ranks second in final category score, and BOTZ represents a contrarian timing opportunity within a macro regime that still favors AI. The +14 from AI growth sponsorship and +10 from risk appetite positive create a floor under the category, even though credit stress (-8) and broad market bear (-8) are active headwinds. BOTZ's weakness versus SMH and AIQ is actually a strength in a transition regime—it's the only name that offers a fresh entry point rather than requiring a purchase at extension. The macro narrative supports holding uranium and commodities ahead of AI infrastructure build-out, and BOTZ's robotics exposure (physical AI cyclicality) has less duration risk than pure software plays if rates stay sticky. Allocating 20% to a near-term rebalance candidate rather than a momentum chase positions for a tactical bounce if BOTZ holds support, while limiting downside if the bear flag persists.
Utilities & Infrastructure — XLU
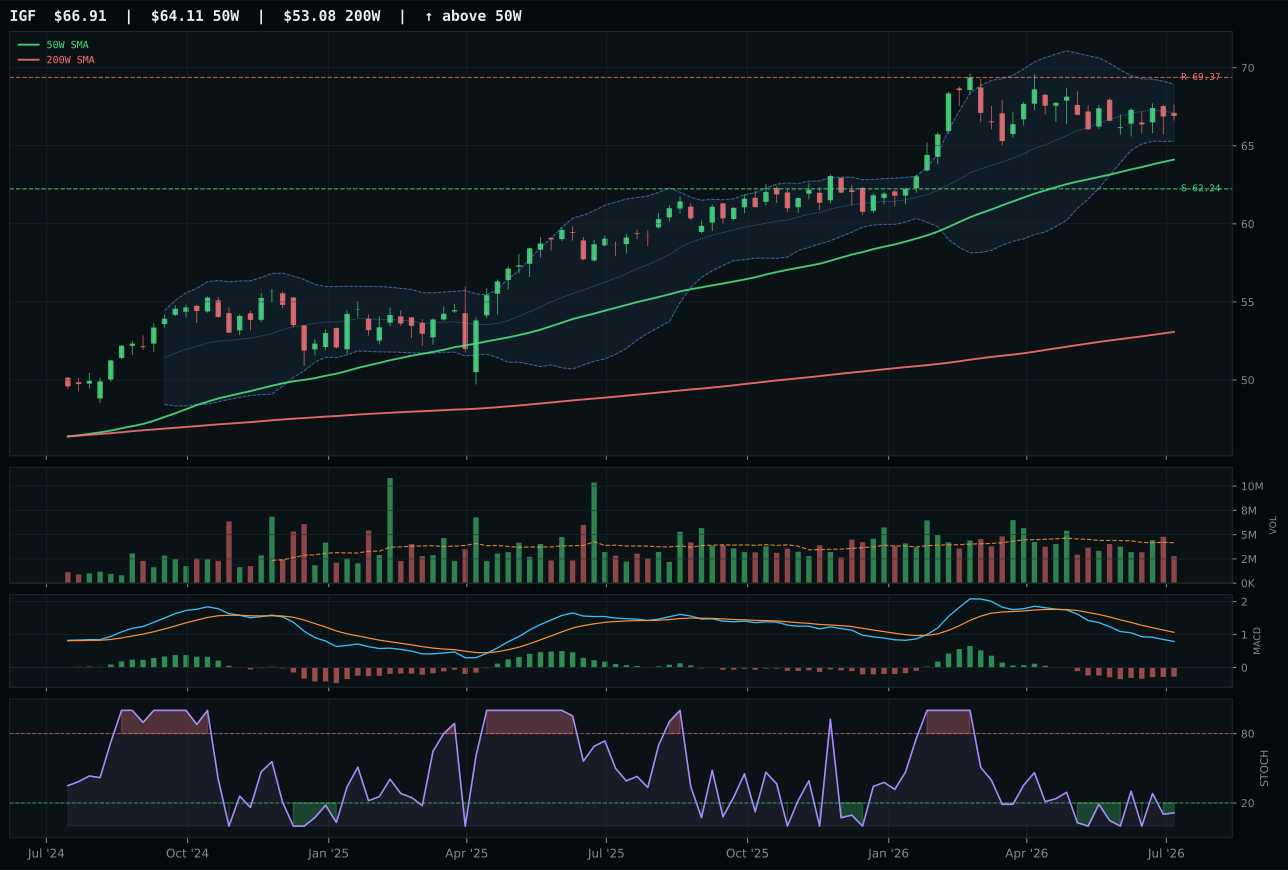
IGF has a neutral structure profile with -13.6% 13-week relative strength versus SPY.
A failed hold above support would weaken the setup.
Actionable but governed by invalidation levels.
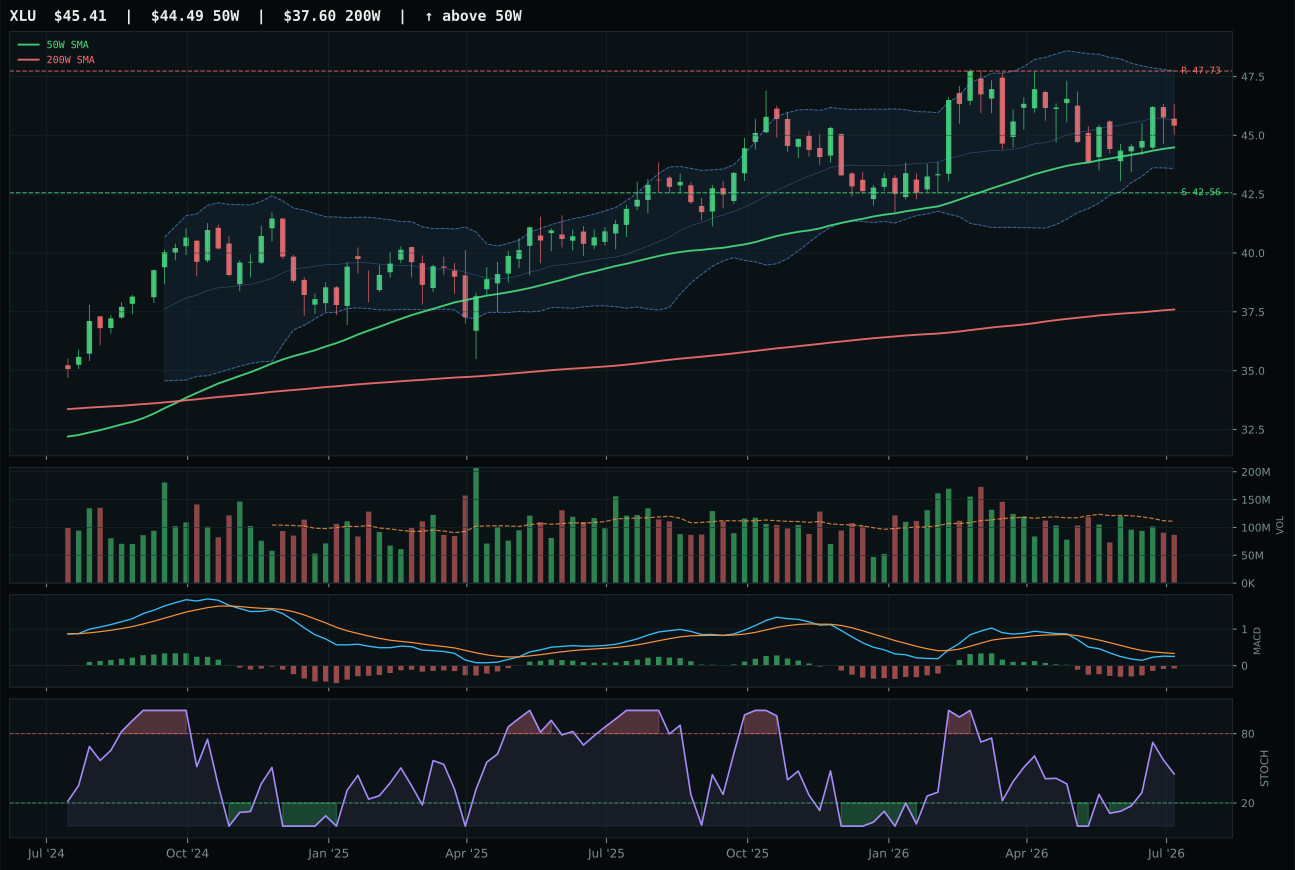
XLU has a compression near 50W profile with -14.4% 13-week relative strength versus SPY.
A failed hold above support would weaken the setup.
Actionable but governed by invalidation levels.
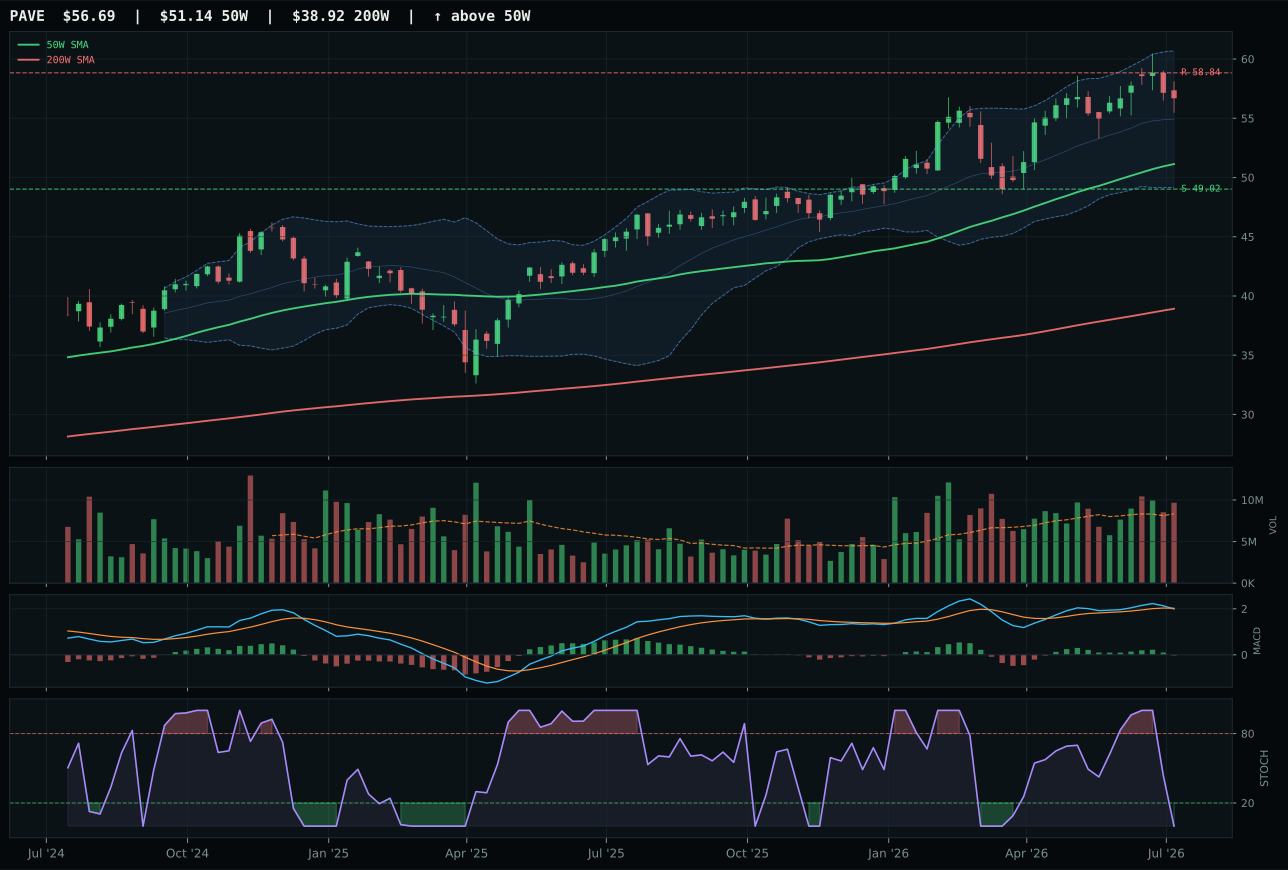
PAVE has a neutral structure profile with -7.4% 13-week relative strength versus SPY.
A failed hold above support would weaken the setup.
Actionable but governed by invalidation levels.
XLU wins a tight race (5.6 points over IGF) because the compression setup near the 50W is more favorable for entry than IGF's pullback with oversold stochastic turn-up. Both names are 2.1% and near the 50W with timing scores of 100.0, so the decision comes down to structure and volume confirmation. XLU's compression at Fib 0.382 with rising mid-zone stochastic RSI shows steady buyers entering, not capitulation buyers (which would show oversold turn-up). IGF's oversold turn-up suggests it has already bounced off lows and is drifting away from support—a less favorable entry for fresh allocation. Volume confirmation also favors XLU at 48.8 neutral participation versus IGF's thin 47. Both names have negative thirteen-week returns (-3.3% and -2.5%), so neither is leading; the edge is pure timing and entry-point quality.
Utilities gets 10% because the Transition / Mixed regime actively supports defensive utilities (+4 from regime fit) and broad market bear (+4) creates demand for income-generation stability. The category score of 50.9 is barely above the median, but the macro fit of 51.0 shows that credit stress and dollar pressure (both active headwinds) are partially offset by the bear flag and regime characteristics. XLU's technical evidence of 59.2 is respectable for a defensive name, and the compression near the 50W with improving MACD offers a sound tactical entry for a strategic defensive sleeve. This is not a growth allocation; it's a portfolio stabilizer that will perform well if equities struggle or rates decline further. Holding 10% keeps downside volatility manageable without sacrificing too much optionality. Risk to this position is a shift to risk-on positioning or a collapse in bond yields that forces a rotation into equities—either scenario would allow trimming XLU for redeployment.
Agriculture & Livestock — WEAT
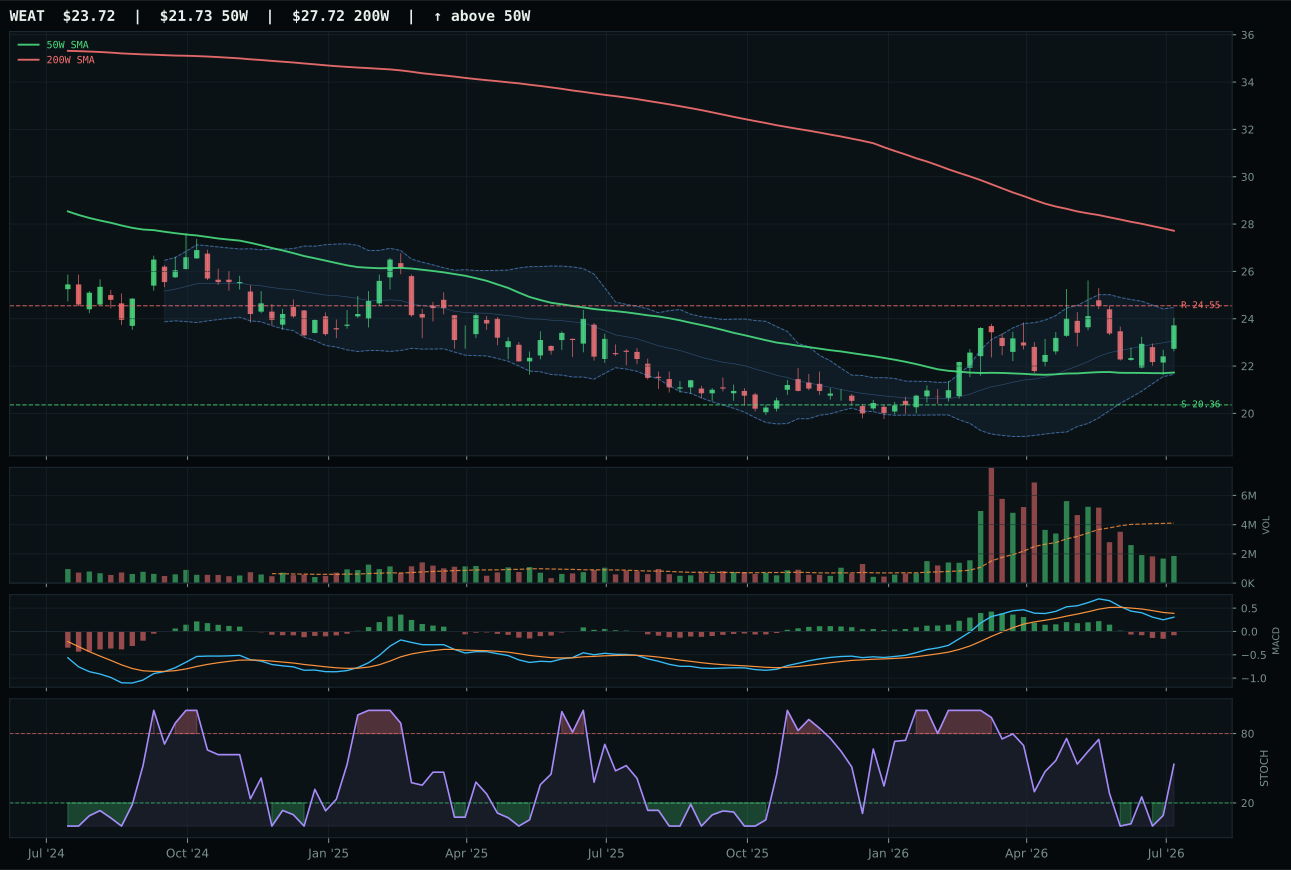
WEAT has a neutral structure profile with -2.3% 13-week relative strength versus SPY.
A failed hold above support would weaken the setup.
Actionable but governed by invalidation levels.
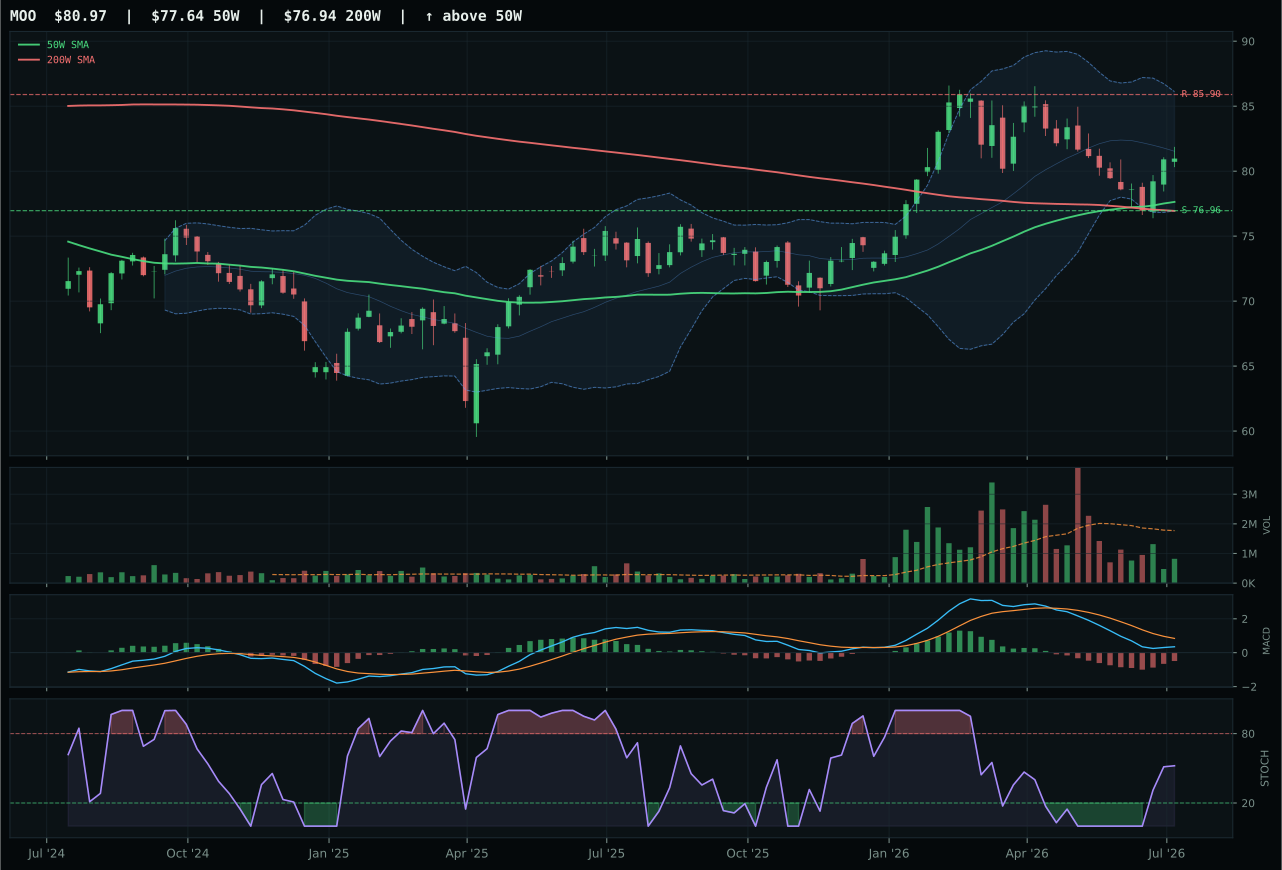
MOO has a neutral structure profile with -15.9% 13-week relative strength versus SPY.
A failed hold above support would weaken the setup.
Actionable but governed by invalidation levels.
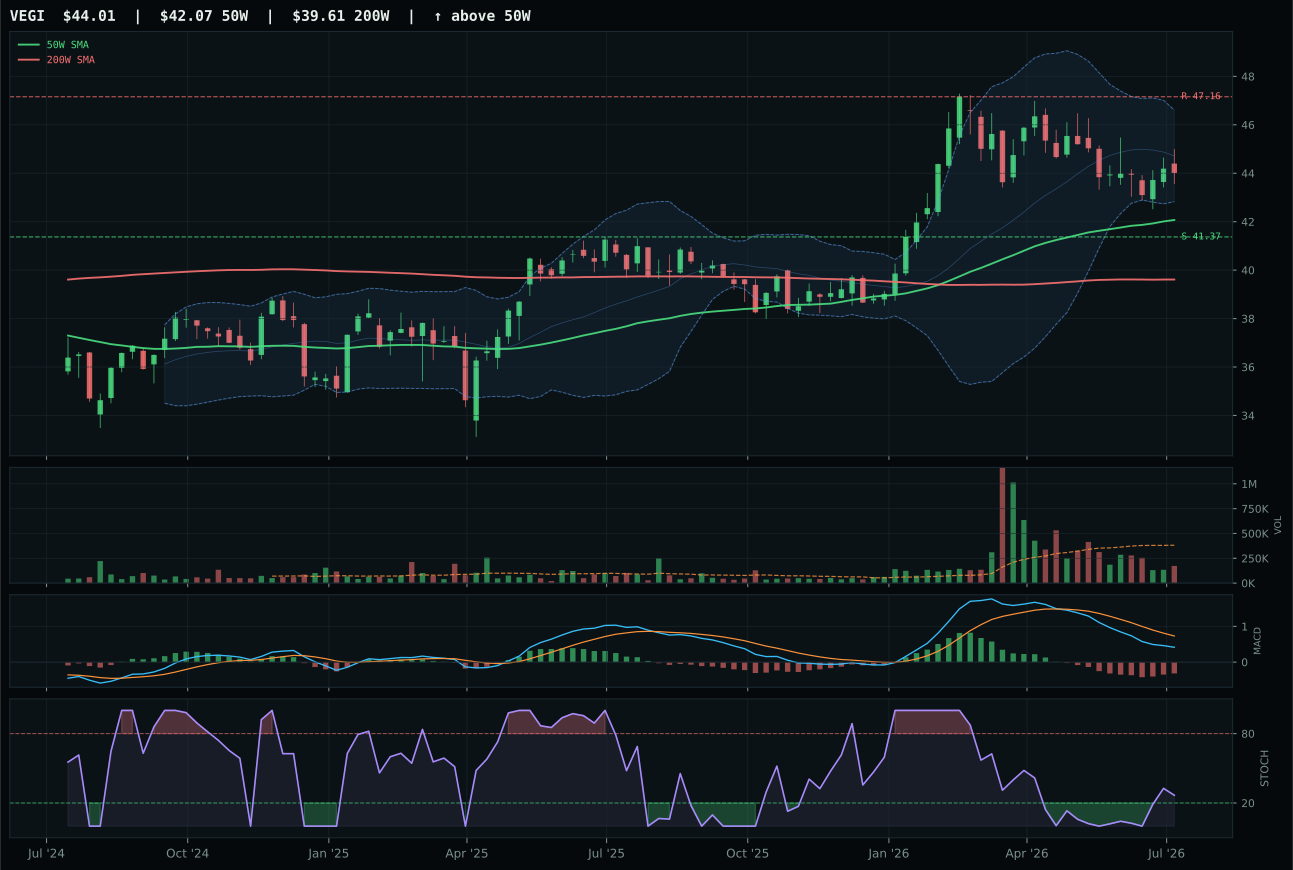
VEGI has a neutral structure profile with -16.2% 13-week relative strength versus SPY.
A failed hold above support would weaken the setup.
Actionable but governed by invalidation levels.
WEAT wins a very close race (just 0.3 points over MOO) because it has category-relative strength of 13.6% while both rivals trade at or near the category median. The thirteen-week return of 8.9% is real and driven by commodity breadth strength, and while price is below the 200W (a risk flag), the chart is within the upper retracement zone near Fib 0.382, not in free fall. MACD is bearish/weakening in all three names, so that's a wash; the difference is that WEAT's rising mid-zone stochastic RSI at 0.53 shows the bounce is still building momentum, whereas MOO's stochastic is at the same level but the MACD is only 'bearish but improving'—a subtle distinction that favors WEAT's more forward-leaning setup. Structure is nearly identical (73.1 vs 66.1), but category dominance tilts the decision. This is a category where no name is leading convincingly, so the winner is the one with the most visible breadth inside its own basket.
Agriculture earns 10% because commodity breadth positive is active at +5 and real asset sponsorship at +8, providing macro tailwinds that offset weak absolute technical scores. At 42.6, this category ranks fifth or sixth overall, not in the top tier, but the Transition / Mixed regime and the need for real-asset diversification in a portfolio hedging duration risk justify a full 10% slot. WEAT's 50% macro fit is neutral—no dedicated category descriptor helps ag, which creates risk—but the real asset sponsorship lifts the category-level macro fit to 63.0. This is not a return engine this week; it's a tactical inflation and supply-chain hedge. The thin volume participation (0.45x average) means positions are best sized small and built patiently. Holding 10% keeps the portfolio exposed to commodity shocks and agricultural cycle turns without overcommitting to what is frankly a weak technical picture across all three names.
Defense & Aerospace — ITA
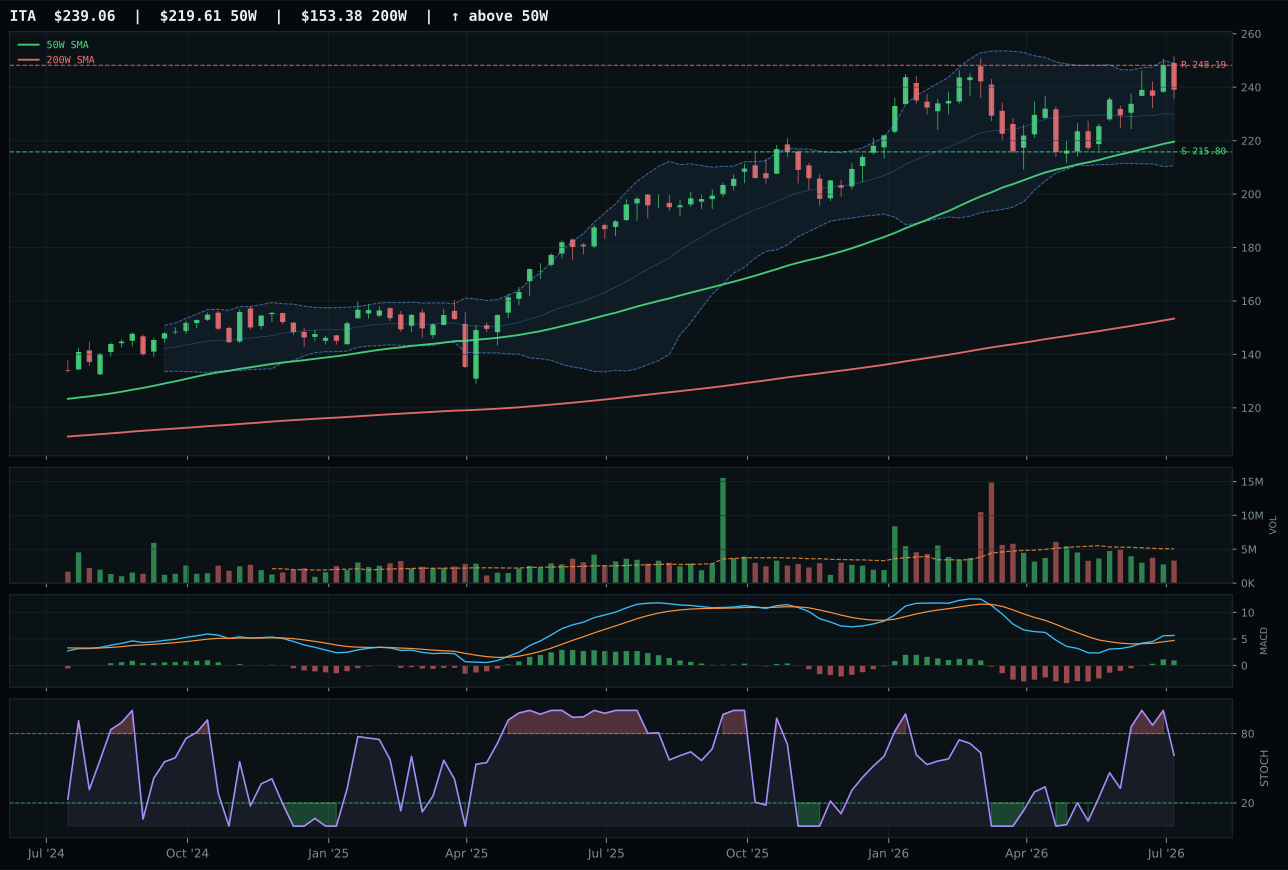
ITA has a neutral structure profile with -7.0% 13-week relative strength versus SPY.
A failed hold above support would weaken the setup.
Actionable but governed by invalidation levels.
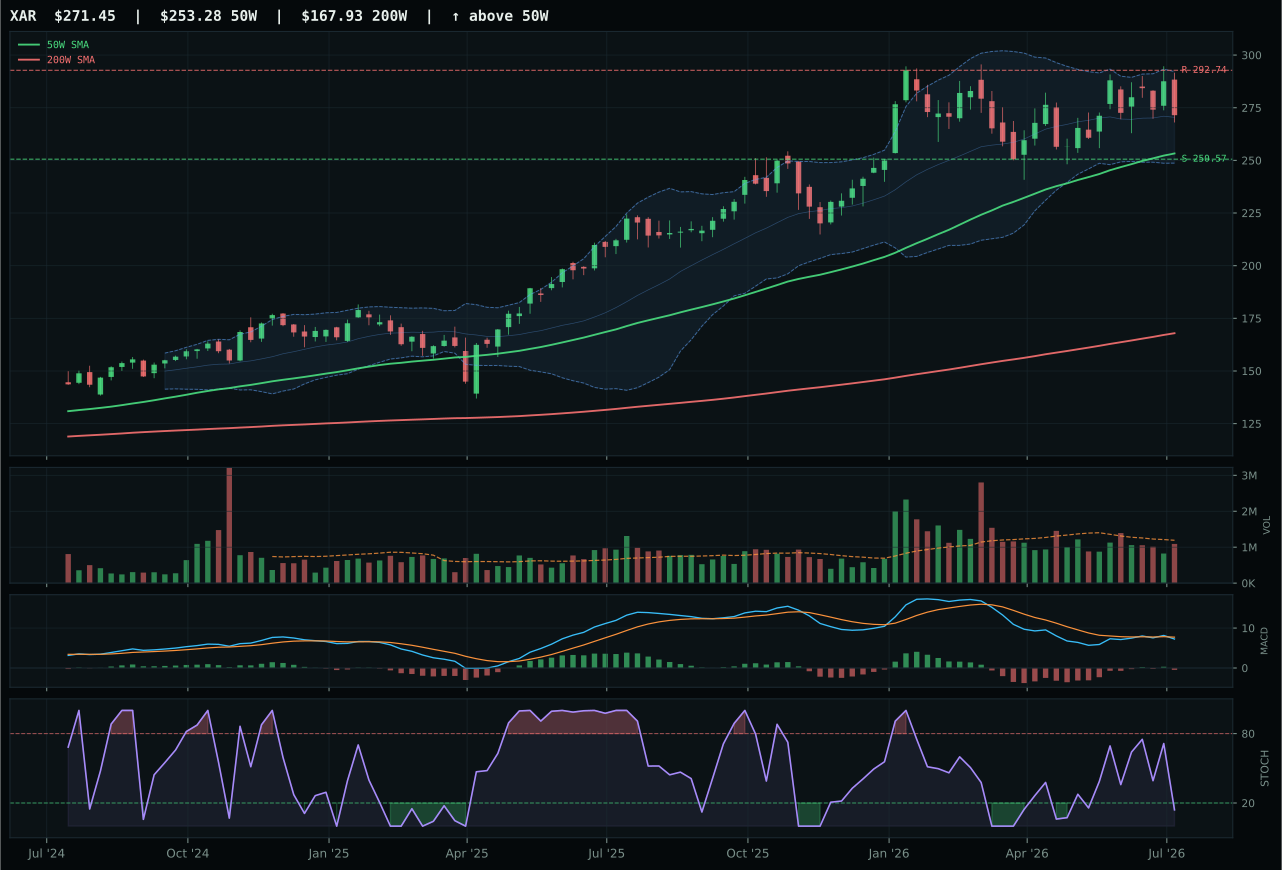
XAR has a neutral structure profile with -9.8% 13-week relative strength versus SPY.
A failed hold above support would weaken the setup.
Actionable but governed by invalidation levels.
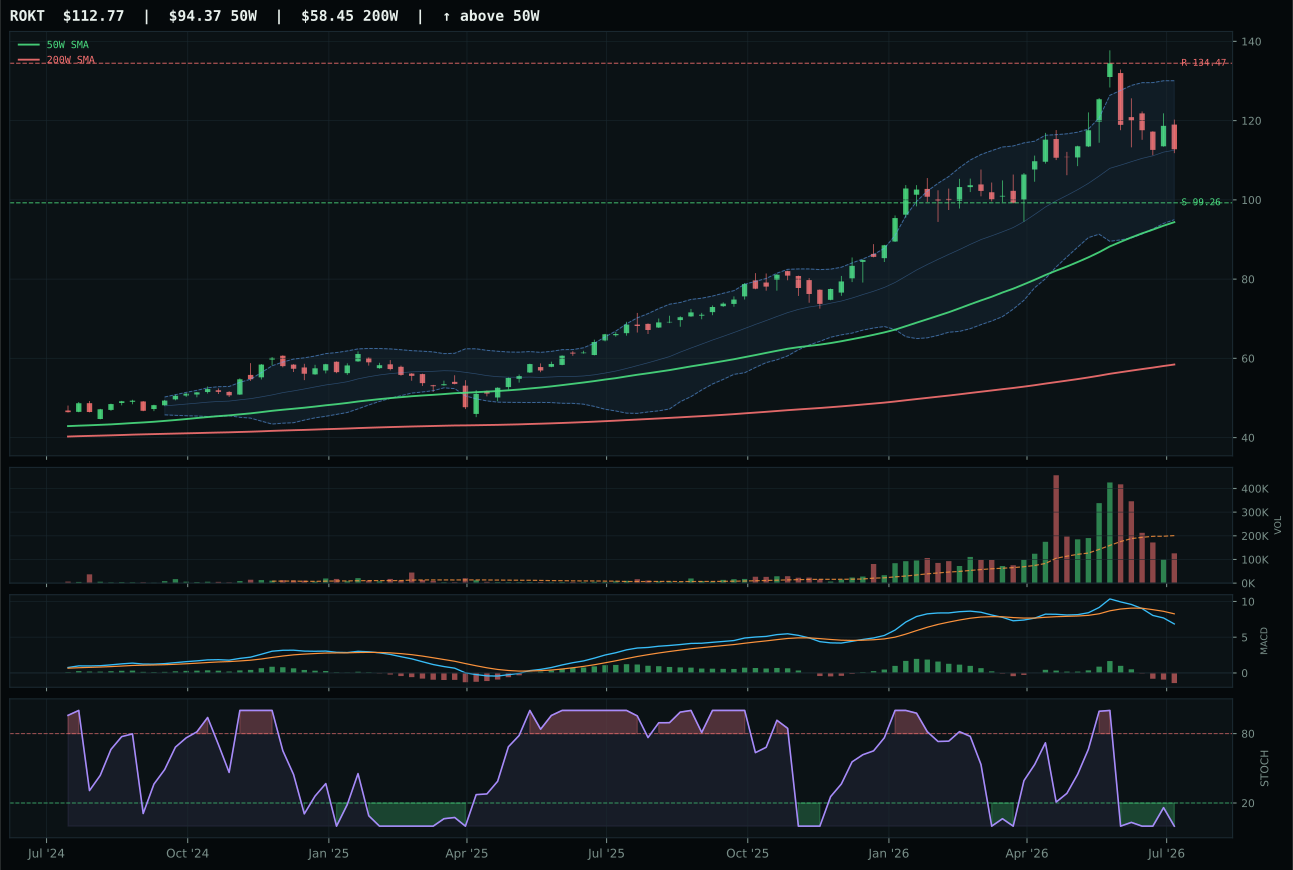
ROKT has a vertical extension profile with -8.4% 13-week relative strength versus SPY.
A failed hold above support would weaken the setup.
Actionable but governed by invalidation levels.
ITA wins with steady trend and improving momentum confirmation despite weak absolute returns. Price is above both the 50W and 200W with a non-deteriorating slope, and the 4.1% thirteen-week return paired with category-relative strength of 1.4% shows ITA is not getting left behind the way XAR is at -1.4%. The real advantage is MACD bullish and improving versus XAR's bearish and weakening signal—that's the difference between stabilization and deterioration. ITA's 89.5% trend score reflects price structure, not just relative strength, and the timing of 75.0 comes from MACD alignment and stochastic RSI at neutral rather than oversold. Volume is thin across the category, which is why structure cleanliness (58.3 for ITA) matters more than breadth. XAR is oversold with no price-action improvement, making ITA's 13.1-point gap the margin between a flat-to-positive technical picture and one that is rolling over.
Defense & Aerospace receives 10% despite a 41.5 category score because broad market bear is active at +6 and dollar pressure at +3, both of which support defensive spending and reduce refinancing risk for contractors. ITA's macro fit of 59.0 is driven by these tactical tailwinds, which justify holding a 10% position even when the category scores below the median. The technical evidence of 70.2 is respectable—above 50, showing structure rather than noise—and the Transition / Mixed regime adds +3 macro boost. This is not a growth category; it's a steady-hand holding for a portfolio that needs deflation or geopolitical-turmoil insurance. XLU (utilities) at 50.9 ranks higher and offers better compression timing, but defense allocations serve a different portfolio role (non-correlative to risk-on trades). ITA stays in because it's the best within its category, even if the category itself is a utility play rather than a return driver.
Industrial Metals — COPX
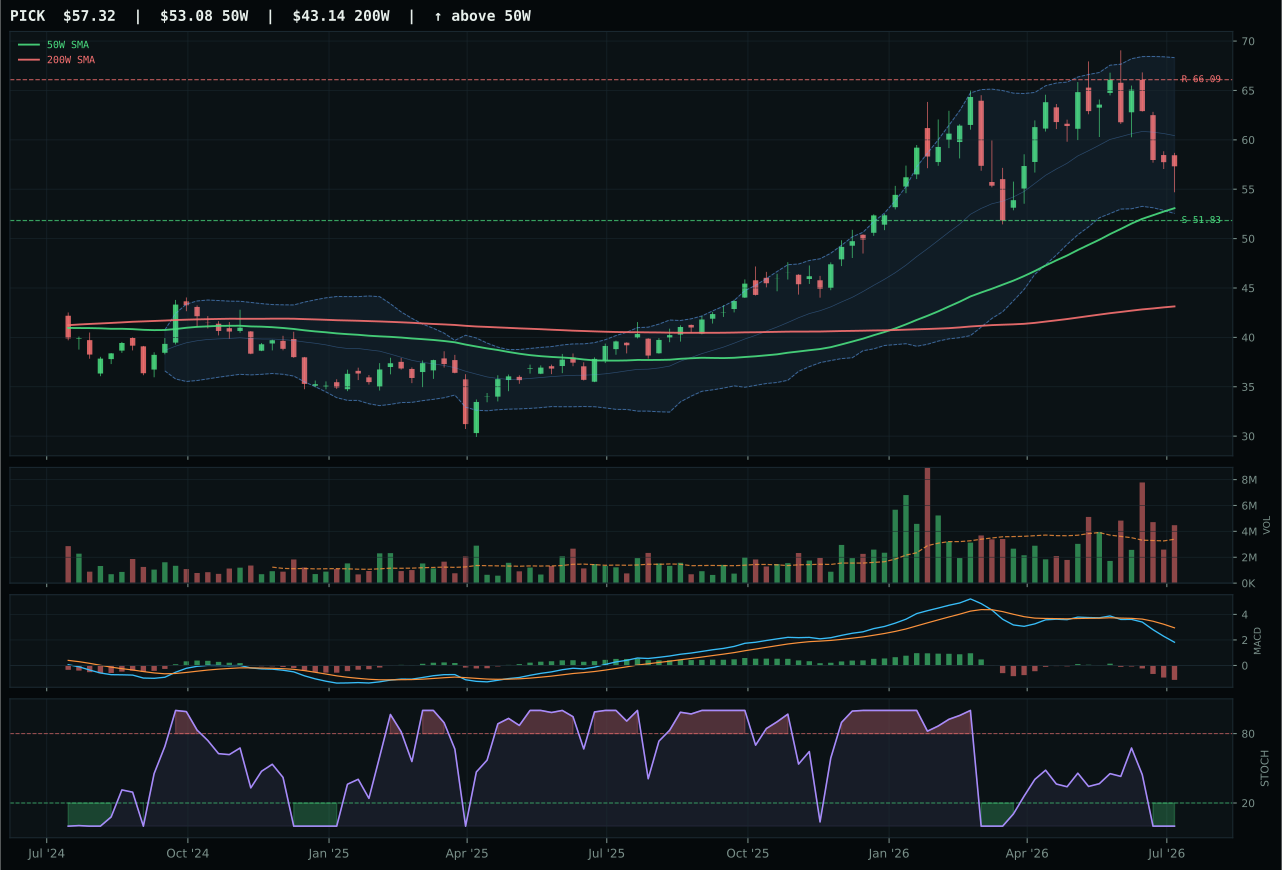
PICK has a neutral structure profile with -17.6% 13-week relative strength versus SPY.
A failed hold above support would weaken the setup.
Actionable but governed by invalidation levels.
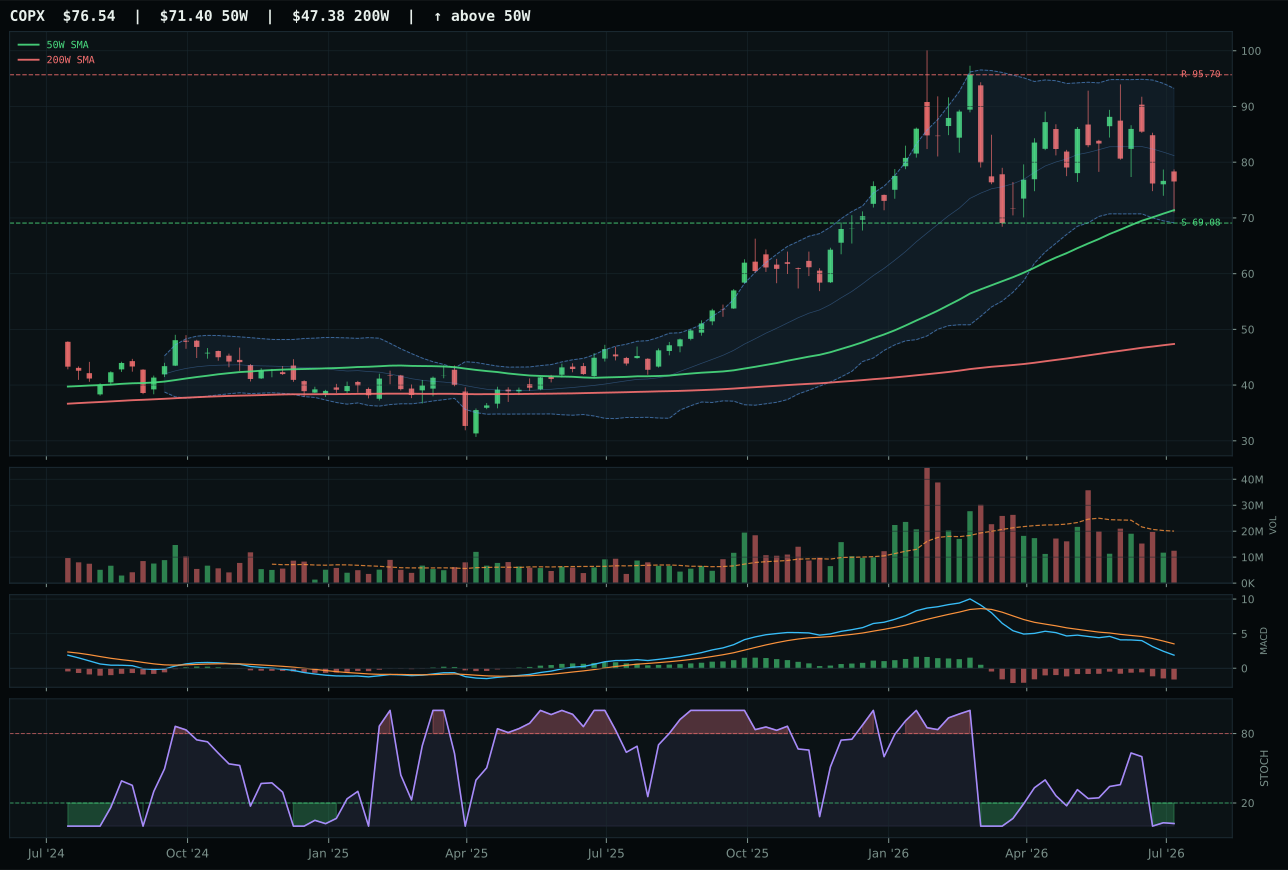
COPX has a neutral structure profile with -19.5% 13-week relative strength versus SPY.
A failed hold above support would weaken the setup.
Actionable but governed by invalidation levels.
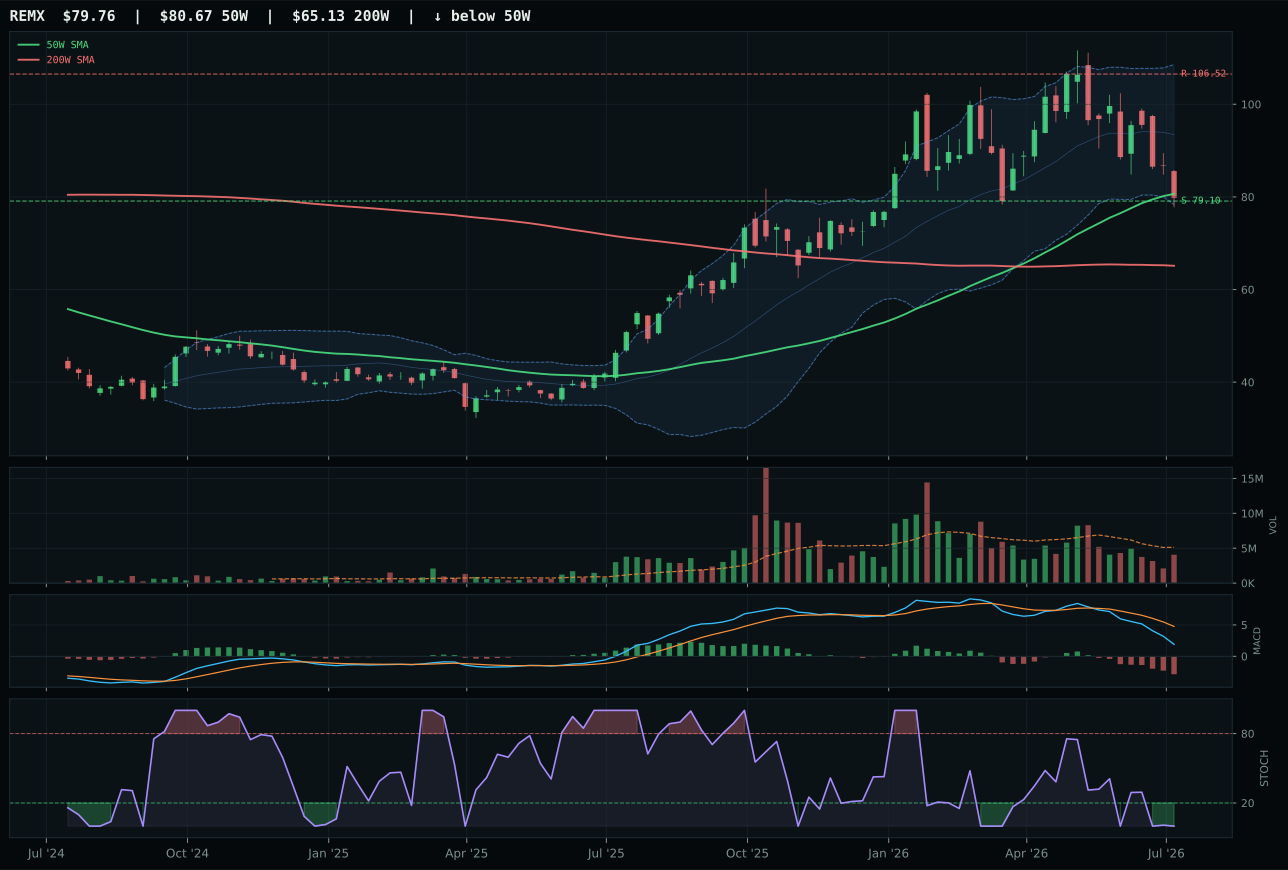
REMX has a pullback into support profile with -26.7% 13-week relative strength versus SPY.
A failed hold above support would weaken the setup.
Actionable but governed by invalidation levels.
COPX wins narrowly because it has better timing (77.0 vs 70.0 for PICK) and marginally better risk-reward (71.4 vs 67.5), even though both names are technically weak. Price is 7.2% above the 50W with stochastic RSI at 0.02 (deeply oversold) and MACD bearish/weakening, a contradictory signal that suggests neither enthusiasm nor convict selling—just exhaustion. COPX's Fib location is middle retracement at 0.382, versus PICK's upper retracement, meaning COPX has more runway downside before invalidation but also has a cleaner mid-zone decision point. Both have -19.5% and -17.6% RS to SPY respectively, showing copper and mining are underwater. The deciding factor is that COPX carries institutional liquidity (63.0 macro fit from metals scarcity +12) while PICK has better volume confirmation at above-average participation but weaker category positioning. This is not a high-conviction pick; it's picking the less-bad name in a weak category.
Industrial Metals gets 10% because metals scarcity is active at +14 and commodity breadth positive at +10—two structural tailwinds that support copper and mining demand in an energy-scarcity-constrained world. The category score of 37.1 is weak, but the macro foundation is solid for a Transition / Mixed regime where supply constraints matter more than growth. COPX's 20.5 technical evidence is the weak link; this is entirely a macro allocation. Real asset sponsorship (+6) and the energy-transition need for copper create a portfolio hedge against sustained inflation or degrowth scenarios where traditional stocks falter. The thin volume and oversold readings across the basket mean the position should be sized for patience—thin entry, wide stops. Holding 10% is macro insurance, not a tactical trade. If credit stress worsens or dollar strength accelerates, this allocation becomes expendable; for now, the structural commodity case justifies taking the risk.
Nuclear Energy — URNM
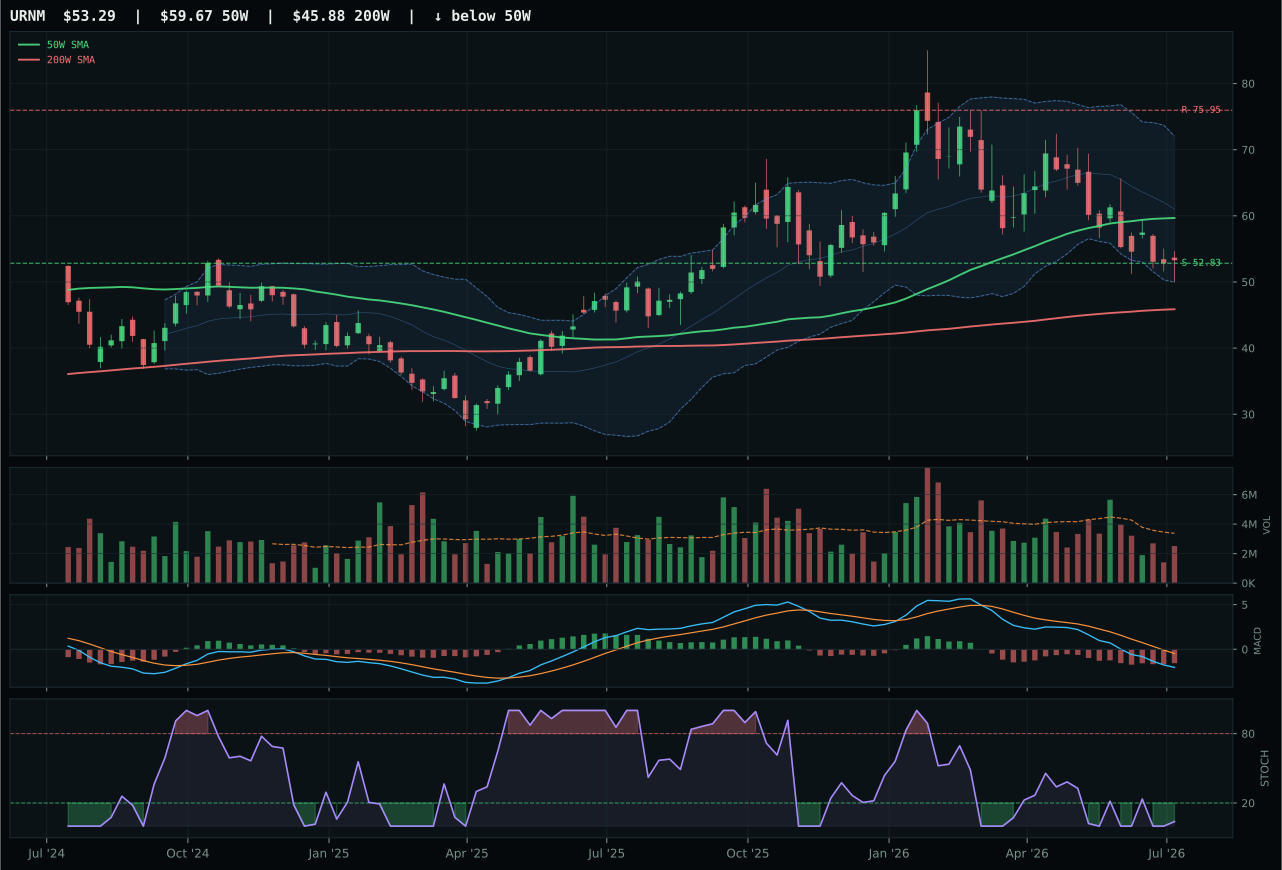
URNM has a pullback into support profile with -28.4% 13-week relative strength versus SPY.
A failed hold above support would weaken the setup.
Actionable but governed by invalidation levels.
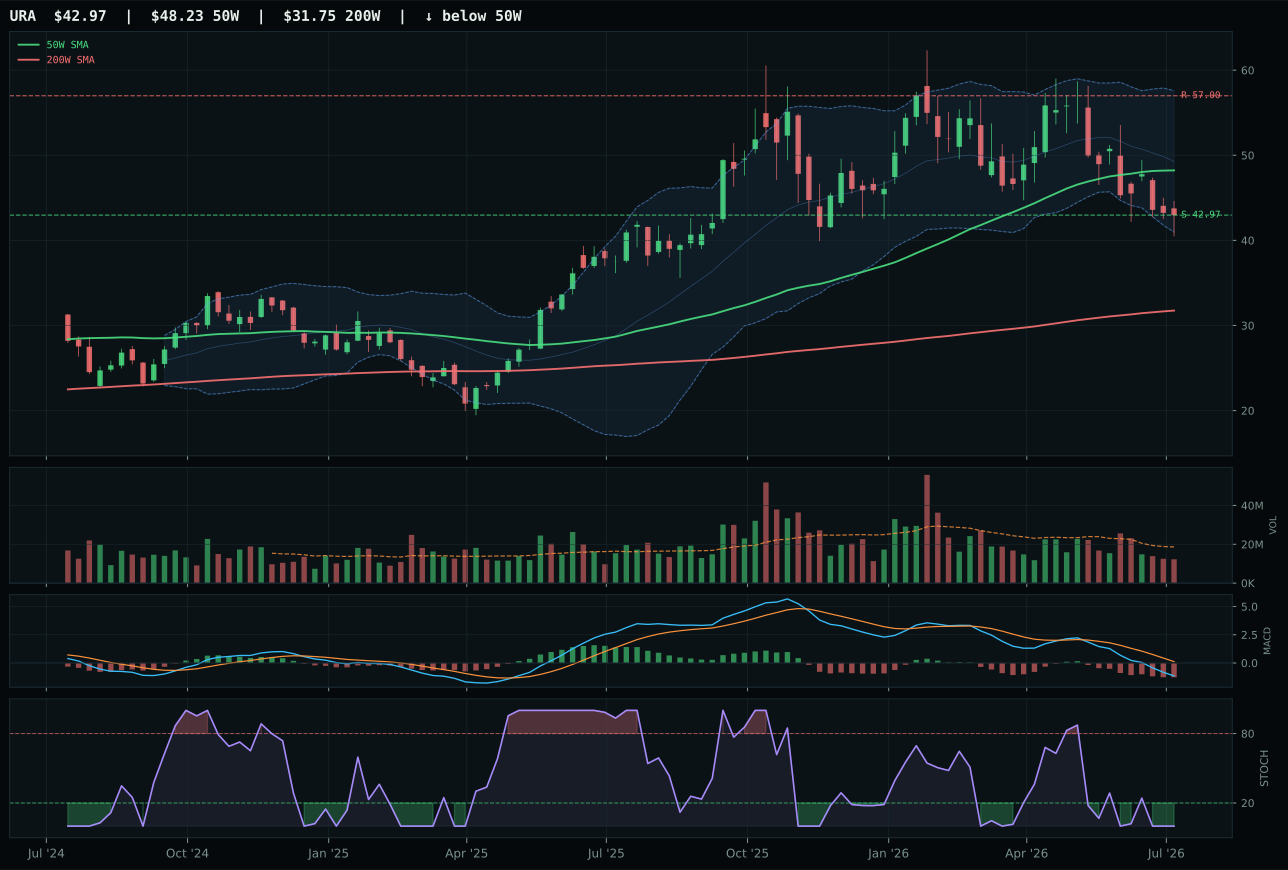
URA has a pullback into support profile with -26.8% 13-week relative strength versus SPY.
A failed hold above support would weaken the setup.
Actionable but governed by invalidation levels.
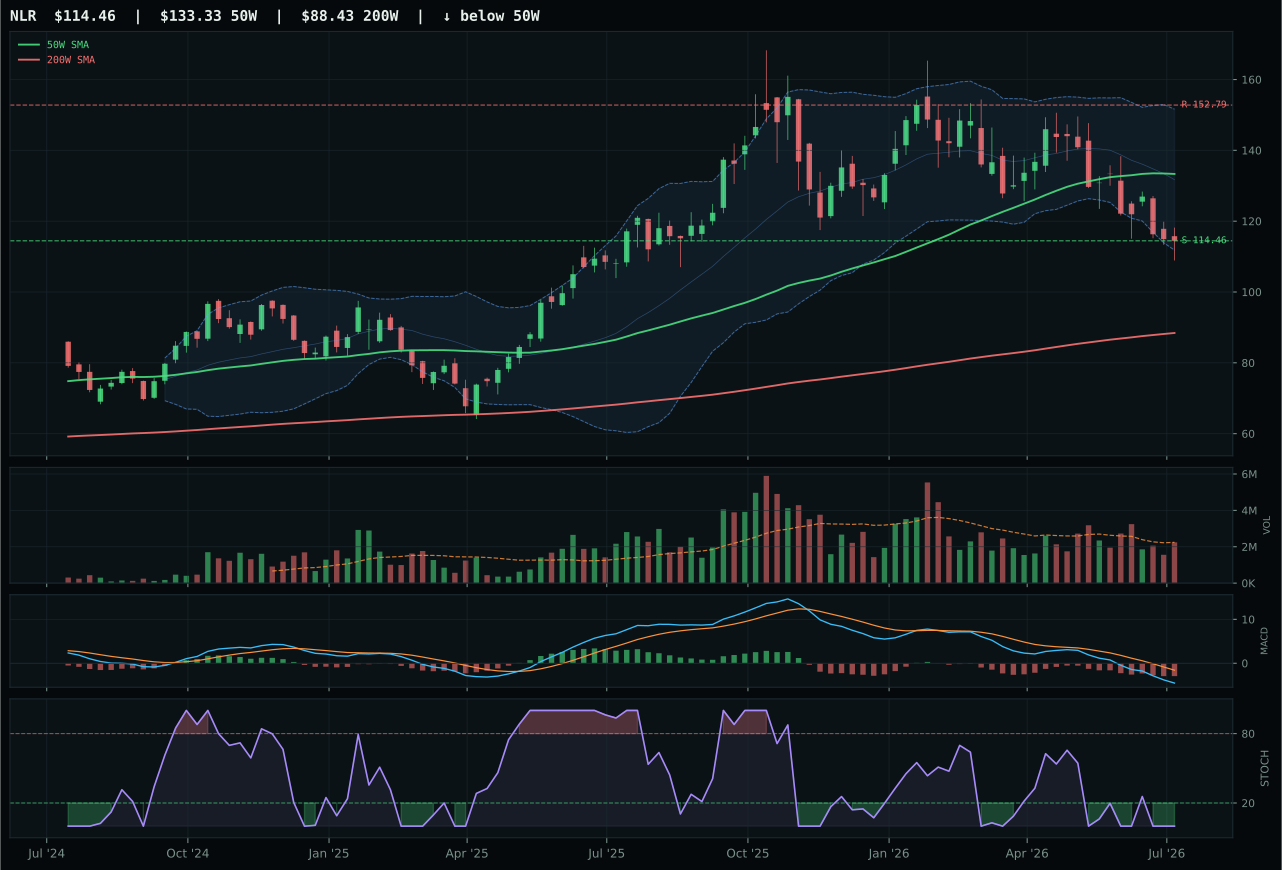
NLR has a pullback into support profile with -27.4% 13-week relative strength versus SPY.
A failed hold above support would weaken the setup.
Actionable but governed by invalidation levels.
URNM wins by 12.6 points over URA because timing and risk-reward both favor the deeper pullback. Price is 10.7% below the 50W (deep pullback rather than shallow reset), with stochastic RSI at 0.04 (deeply oversold) and MACD bearish but improving—the trifecta of reversal setup. Support is defined at 52.83 with only 0.9% downside, creating a hard floor for a Fib 0.786 zone (deep value). URA is less deep (at Fib 0.786 as well) but has weaker MACD (bearish/weakening vs improving) and a less clean timing turn (stochastic is just oversold, not turning up). Both have massive negative thirteen-week returns (-17.3% and -15.7%), so momentum is a non-factor; the edge goes to URNM's better oscillator recovery pattern and tighter support. This is an entry-point decision, not a momentum decision.
Nuclear Energy gets 10% because energy scarcity is active at +9, real asset sponsorship at +7, and AI growth sponsorship at +5—a rare triple alignment that supports nuclear as both a commodity and an infrastructure play. The category score of 36.6 is weak, and URNM's technical evidence at just 12.5 reflects poor momentum. However, the macro fit of 65.0 for URNM is respectable, suggesting the market is pricing in long-term energy transition demand despite current weakness. This is a quintessential transition-regime allocation—poor near-term technicals offset by structural tailwinds. Holding 10% is a bet on energy-constrained growth and AI infrastructure buildout, not on a bounce this week. The deep pullback and defined support in URNM make it a patient accumulation candidate. If nuclear policy shifts or AI demand narratives fade, this becomes the first position to trim.
Traditional Energy — FCG
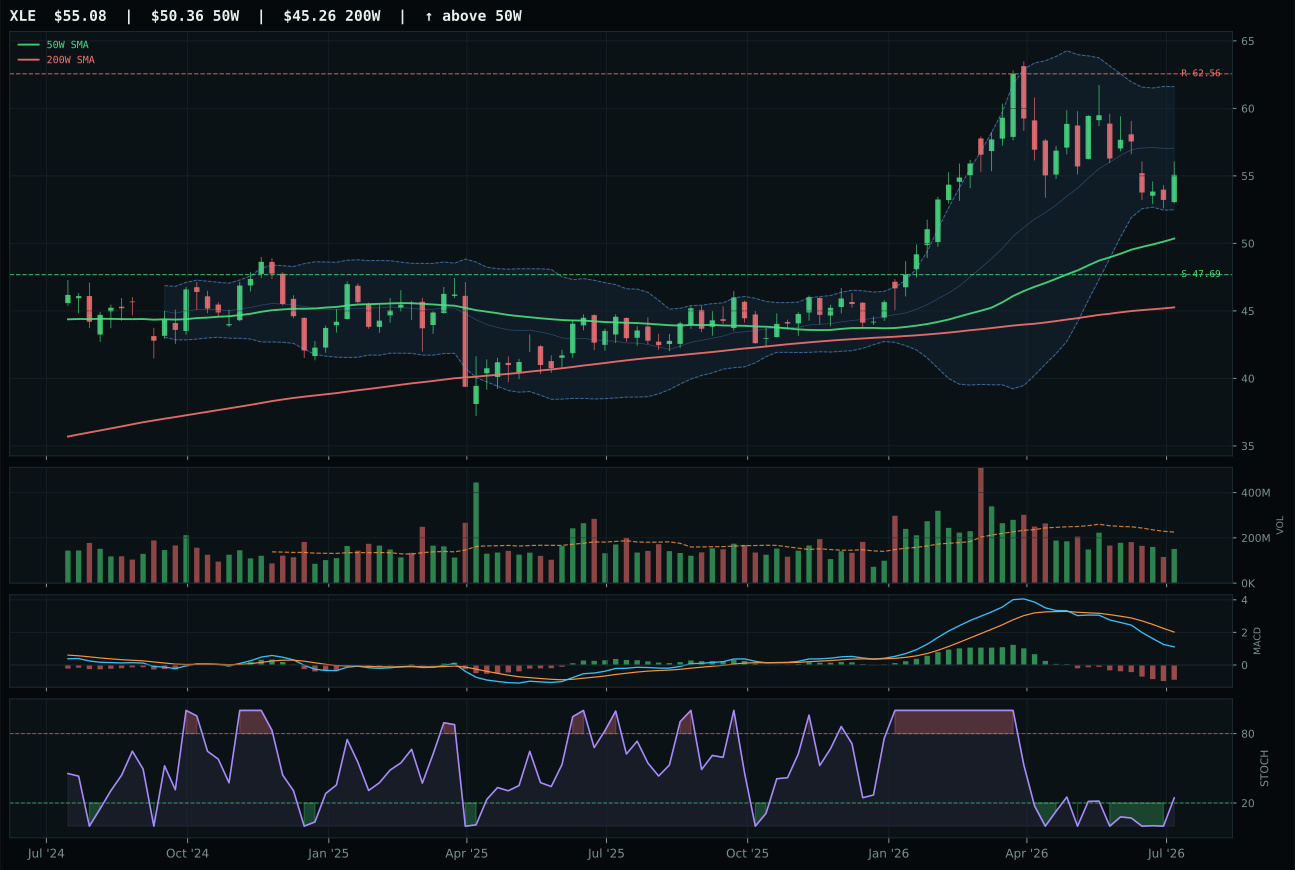
XLE has a neutral structure profile with -14.4% 13-week relative strength versus SPY.
A failed hold above support would weaken the setup.
Actionable but governed by invalidation levels.
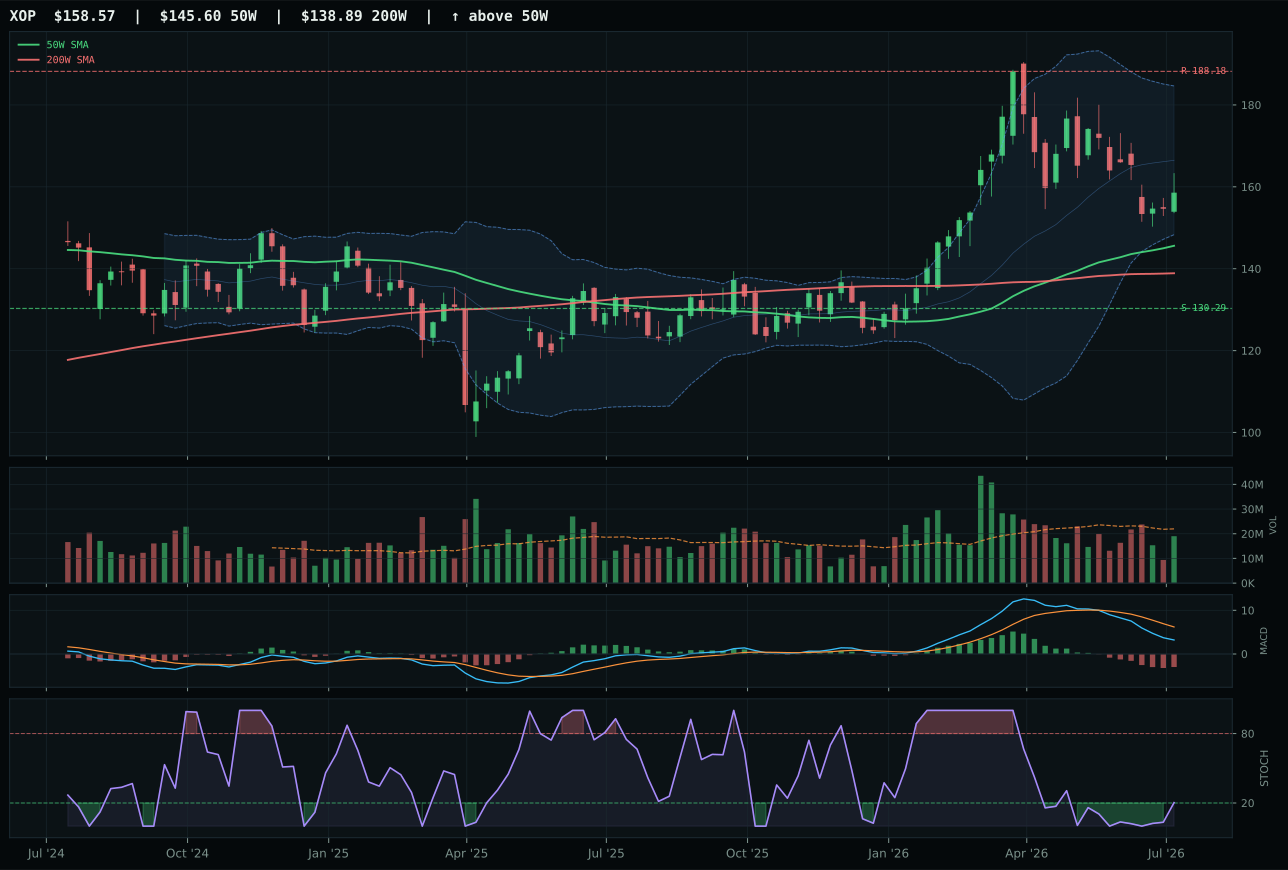
XOP has a neutral structure profile with -17.0% 13-week relative strength versus SPY.
A failed hold above support would weaken the setup.
Actionable but governed by invalidation levels.
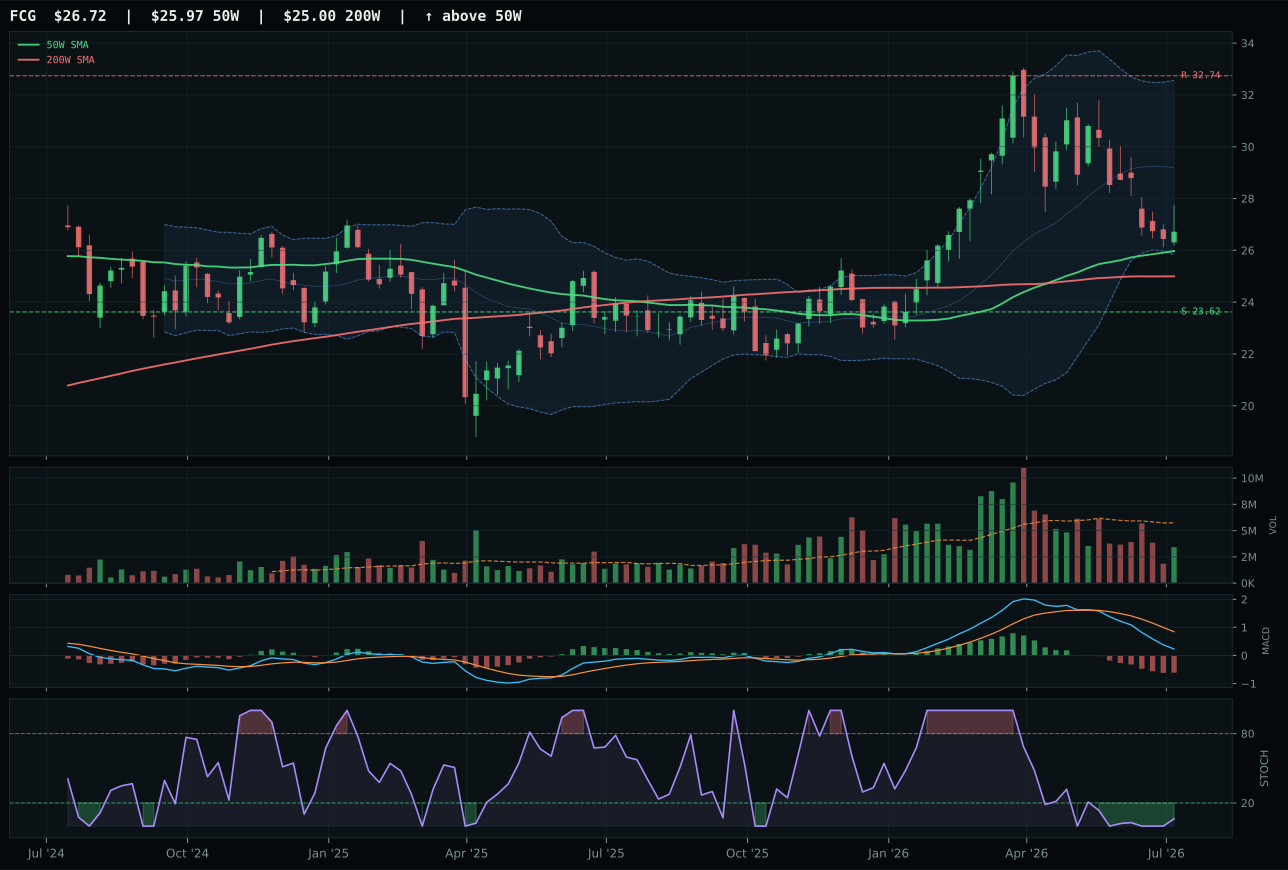
FCG has a compression near 50W profile with -22.0% 13-week relative strength versus SPY.
A failed hold above support would weaken the setup.
Actionable but governed by invalidation levels.
FCG wins with superior timing (100.0 vs 85.0 for XLE) because price is sitting exactly at the 50W (2.9% distance) with stochastic RSI at oversold turn-up (0.06) and MACD bearish/weakening but not plunging. This is the tightest, most actionable timing setup in energy—a coiled spring near a key moving average with early-stage oscillator recovery. XLE is 9.4% above the 50W with rising mid-zone stochastic RSI, meaning the bounce is already in progress and price is drifting away from support. Risk-reward also favors FCG at 78.2 versus 66.9, reflecting the tighter entry point and better defined invalidation. Both have zero momentum confirmation (13W returns -10.8% and -3.3% respectively), so this is purely a timing and structure decision. FCG's compression setup near the 50W offers a fresh rebalance candidate; XLE's higher price relative to the 50W makes it a chase. Volume is thin in both, so the decision hinges on entry discipline.
Traditional Energy earns 10% because energy scarcity is active at +16 and real asset sponsorship at +7, creating a powerful macro case even though the technical setup is mediocre. The category score of 35.9 reflects weak momentum (both names negative thirteen-week), but the Transition / Mixed regime and supply-constraint narrative support holding energy exposure. FCG's 24.9 technical evidence is below 50, meaning this is a pure macro allocation with poor price confirmation. Credit stress at -7 is a headwind, but the energy scarcity flag dominates. This is a portfolio hedge against geopolitical shocks or continued OPEC production discipline; it's not a return driver this week. The allocation is sized at 10% because the macro case is genuine but the technical picture is deteriorating. A break below support in FCG would shift the macro story (suggesting energy demand is weakening), and the position would be reevaluated.
Precious Metals — GLD
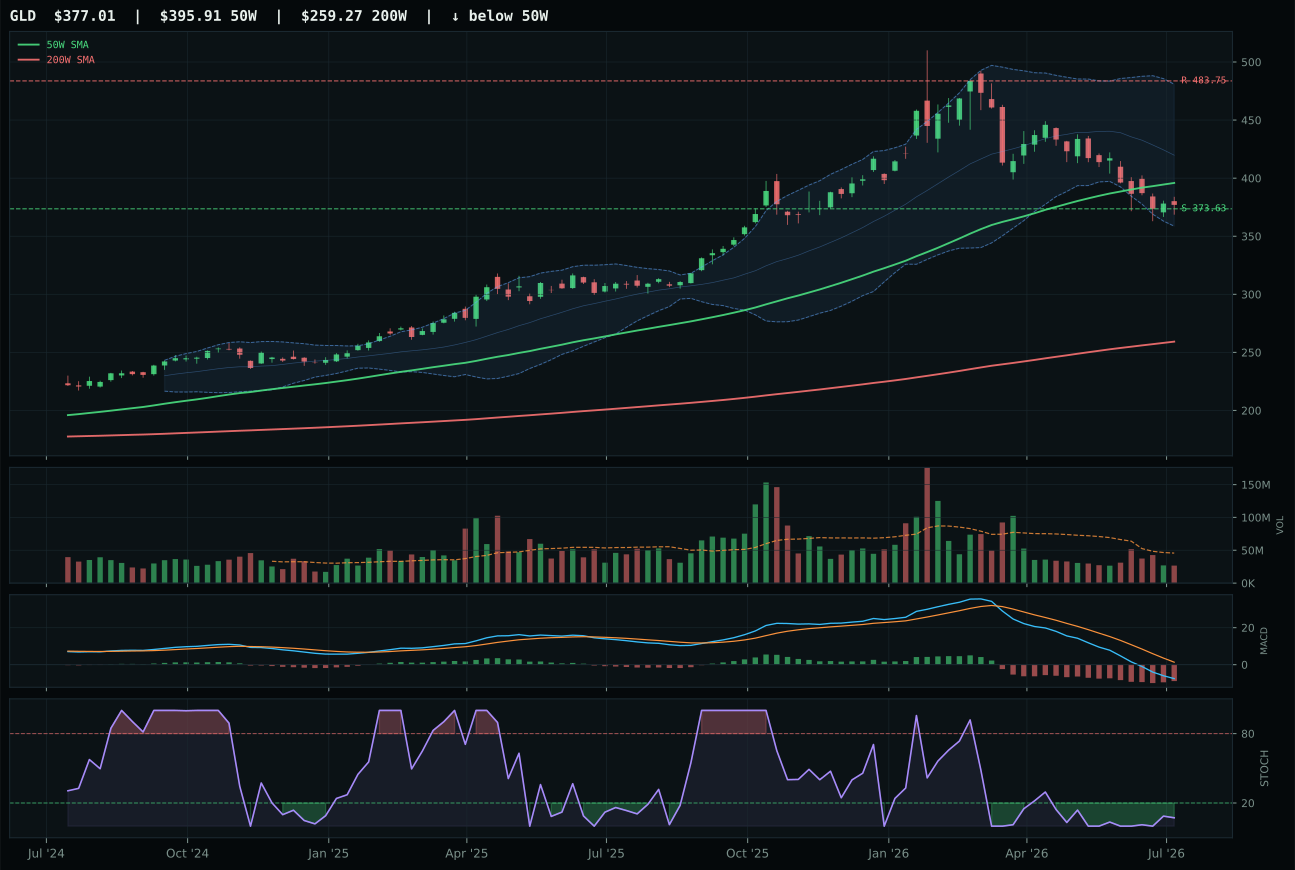
GLD has a pullback into support profile with -24.9% 13-week relative strength versus SPY.
A failed hold above support would weaken the setup.
Actionable but governed by invalidation levels.
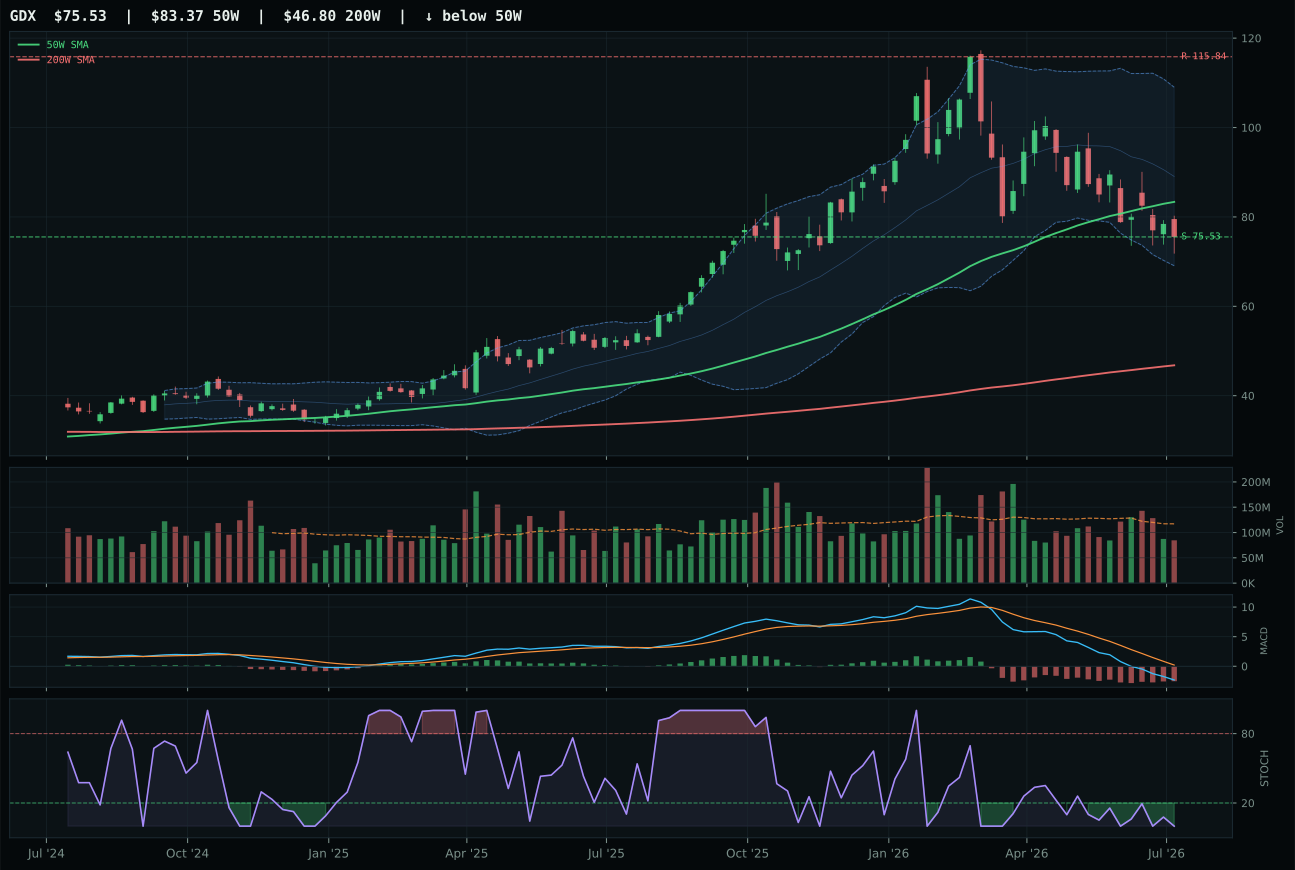
GDX has a pullback into support profile with -35.1% 13-week relative strength versus SPY.
A failed hold above support would weaken the setup.
Actionable but governed by invalidation levels.
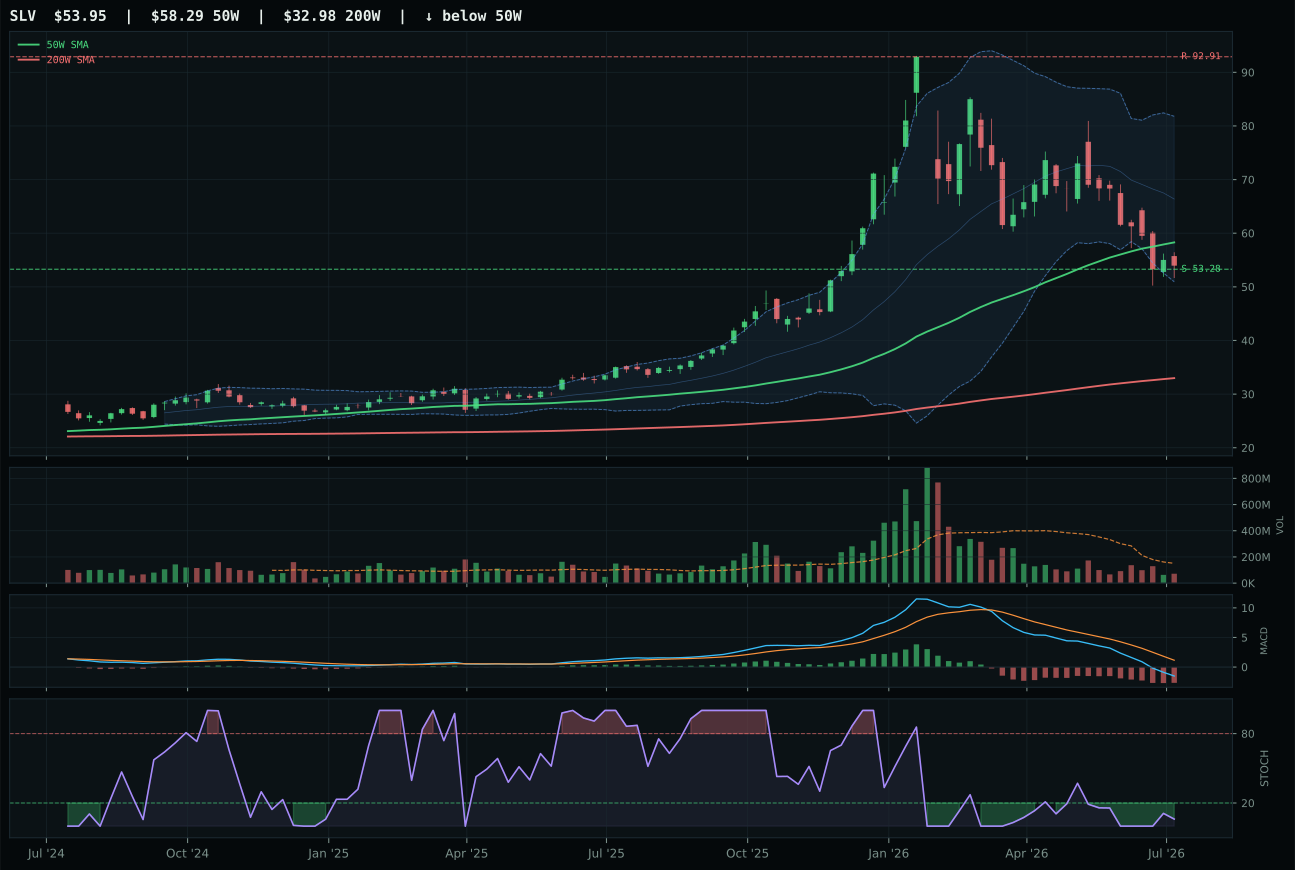
SLV has a pullback into support profile with -33.0% 13-week relative strength versus SPY.
A failed hold above support would weaken the setup.
Actionable but governed by invalidation levels.
GLD wins decisively (25.2 points over GDX) because timing is genuinely favorable and risk-reward is asymmetric. The setup is textbook oversold pullback: price is 4.8% below the 50W but still above the 200W, stochastic RSI is at 0.07 and improving (not just oversold, but turning), and MACD is bearish but improving—three pieces of evidence aligned. Support is tight at 373.63, so downside is capped near 0.9%, while upside to resistance at 483.75 shows -22.1% (unfavorable headline). That risk-reward of 98.0 reflects the tight stop-out relative to the wide target, a classic value setup. GDX is even more oversold (stochastic at same 0.07 level) but deeper in retracement at Fib 0.786, and the 35.1% negative RS to SPY shows miners are being abandoned—a sign of capitulation that makes GLD's cleaner 24.9% underperformance more defensible. GLD is the monetary hedge; GDX is the leveraged bet. When timing improves, miners will lead, but entry into GLD is safer.
Precious Metals earns zero allocation this week because final category score of 33.7 ranks it ninth or tenth among the ten categories, and macro fit of 49.0 is the weakest in the portfolio—dollar pressure active and risk appetite positive are net headwinds for gold. GLD's technical evidence of 50.6 is respectable and timing is perfect at 100.0, but momentum confirmation is near zero at 5.1 due to the negative thirteen-week return of negative 13.8% and category-relative strength lagging. The macro regime is Transition / Mixed with broad market bear active, which typically supports gold, but risk appetite positive is flagged as active at negative 4 sentiment points, overwhelming the support. Volume participation is thin at 0.58x twenty-week average, meaning any move lacks institutional participation. Allocation would require either a deterioration in risk appetite or a strengthening dollar-pressure signal flip; at current conditions, the category sits outside the portfolio until technicals show persistent higher lows and macro descriptors shift. This is an exclusion based on ranking, not fundamental rejection.
Emerging Markets — IEMG
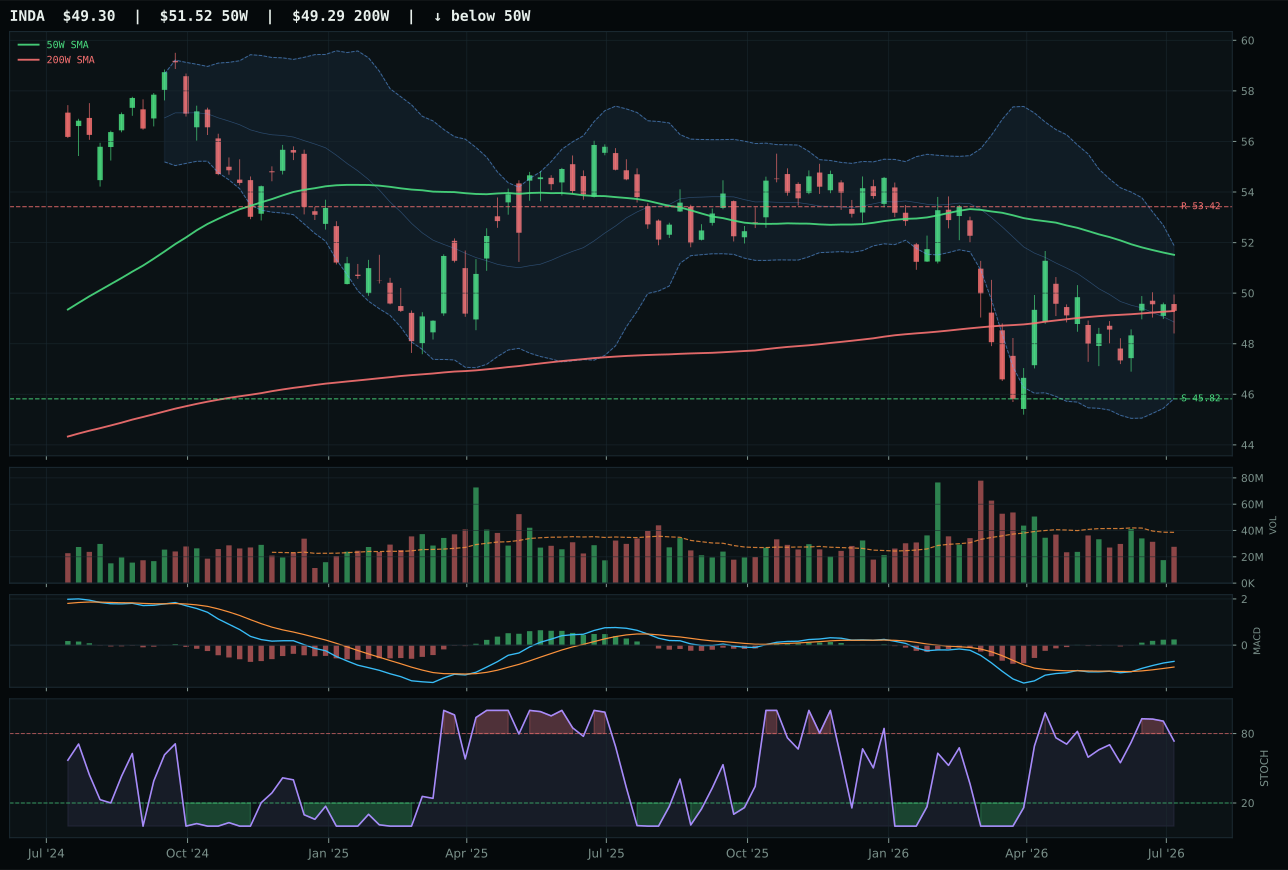
INDA has a neutral structure profile with -11.2% 13-week relative strength versus SPY.
A failed hold above support would weaken the setup.
Actionable but governed by invalidation levels.
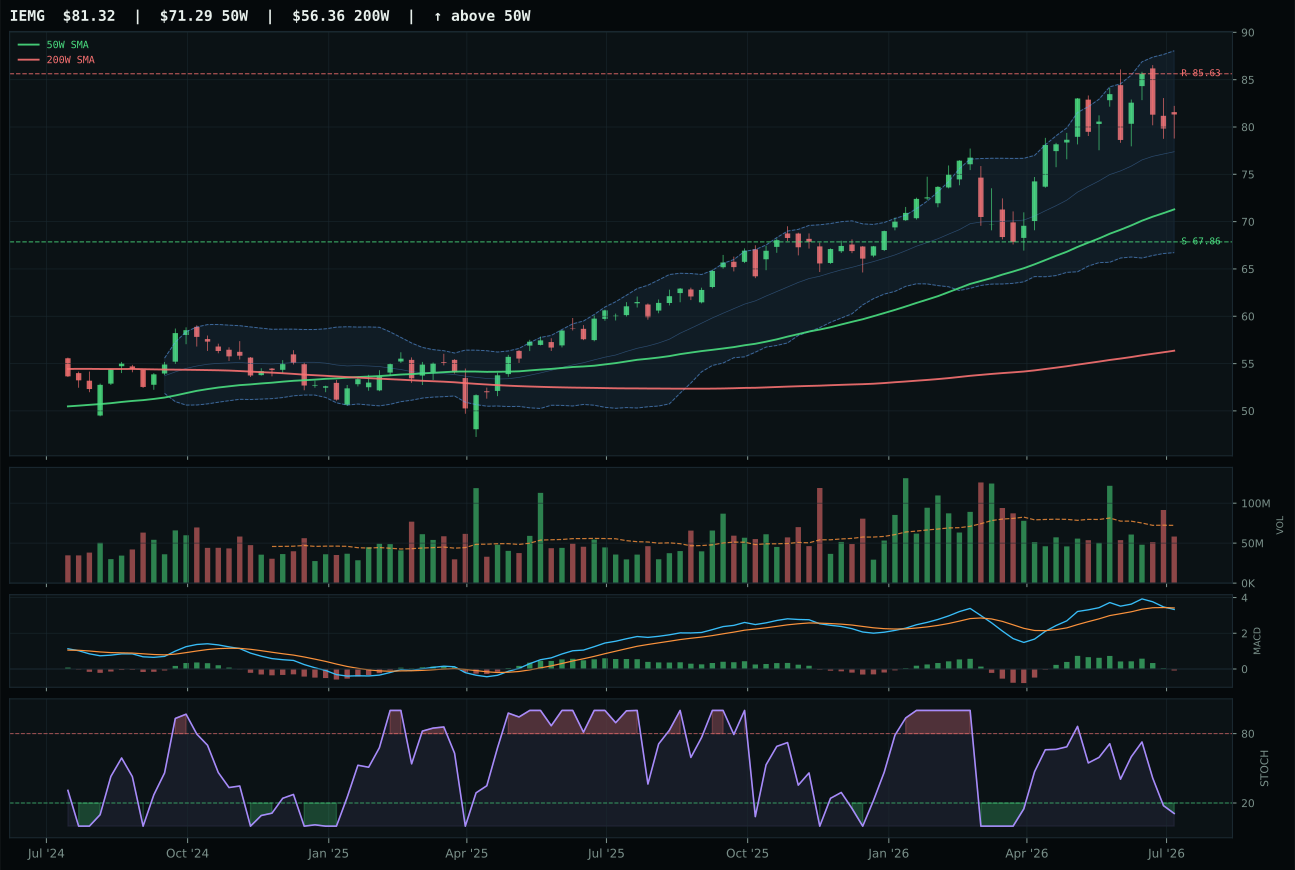
IEMG has a neutral structure profile with -1.6% 13-week relative strength versus SPY.
A failed hold above support would weaken the setup.
Actionable but governed by invalidation levels.
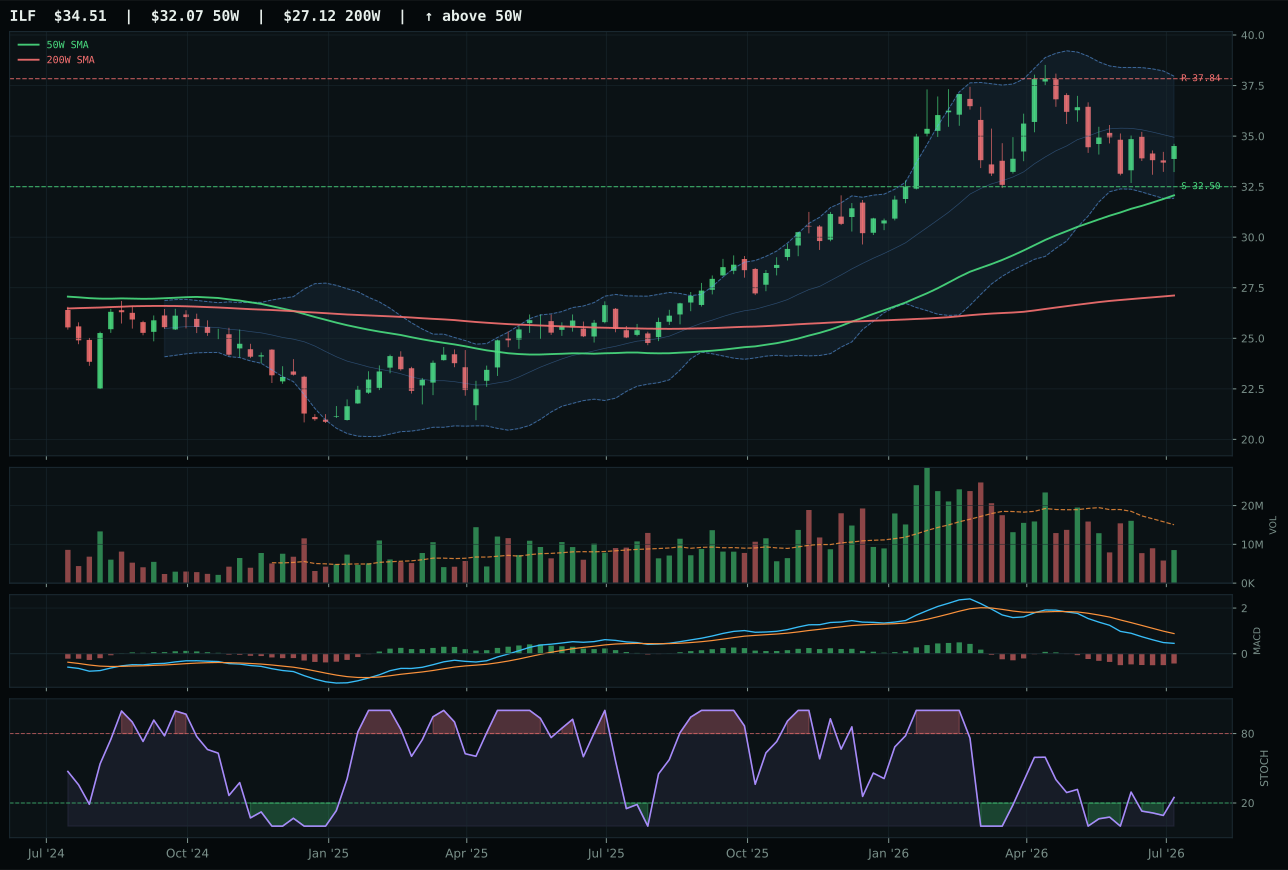
ILF has a neutral structure profile with -19.9% 13-week relative strength versus SPY.
A failed hold above support would weaken the setup.
Actionable but governed by invalidation levels.
IEMG wins by 4.8 points over INDA because trend is cleaner (79.6 vs 50.0) and volume confirmation is better (neutral participation vs thin). Price is 14.1% above the 50W in a neutral-structure setup, which means IEMG is relying on breadth and liquidity to justify the extension, not on tight technical confirmation. The nine-week return of 9.5% and category-relative strength of 9.6% show IEMG is leading its peers. MACD is bearish/weakening in both, so that's a wash; the difference is IEMG's stochastic RSI is oversold at 0.11 versus INDA's falling/neutral at a higher level. IEMG's structure score of 75.0 reflects neutral compression rather than a crisp breakout, meaning this is a crowded trade but one with legitimate breadth. INDA's better timing score (97.0) is offset by its thin volume and lagging category strength. This is a breadth decision favoring IEMG.
Emerging Markets earns zero allocation because final category score of 19.1 ranks it last among the ten categories, and macro fit of 25.0 is the weakest in the portfolio by a wide margin. Dollar pressure active at -14, credit stress at -10, and broad market bear at -9 combine for negative 33 net macro points, overwhelming risk appetite positive at only +8. IEMG's thirteen-week return of 9.5% looks positive in isolation, but that is category-relative strength at 9.6% in a basket where MOO is negative 4.7%—a low bar. Technical evidence of 51.2 is respectable for trend and structure, but momentum confirmation of 53.5 shows the move is fragile; stochastic oversold with bearish-weakening MACD means the rebound is fading, not accelerating. The category is fundamentally incompatible with the current macro regime: dollar strength headwinds EM capital flows, credit stress scares foreign investors, and broad market bear sentiment keeps risk-off positioning dominant. Allocation would require a macro flip toward dollar weakness, credit stabilization, and risk-on sentiment; none of those conditions exist. This is a complete exclusion based on both technical weakness and macro incompatibility; the category ranks below zero-allocation threshold.