
2026-07-03
Informational purposes only. The content in this report, including allocations, analysis, and commentary, is provided solely for informational and educational purposes. It does not constitute financial advice, investment advice, trading advice, or any other type of advice. Past performance does not guarantee future results. Always conduct your own research and consult a qualified financial professional before making investment decisions.
Weekly Allocation
| Ticker | Category | Weight | Role |
|---|---|---|---|
| CIBR | Technology | 20% | Top-2 (20%) |
| SMH | AI | 20% | Top-2 (20%) |
| ITA | Defense & Aerospace | 10% | Tier-2 (10%) |
| XLU | Utilities & Infrastructure | 10% | Tier-2 (10%) |
| COPX | Industrial Metals | 10% | Tier-2 (10%) |
| URNM | Nuclear Energy | 10% | Tier-2 (10%) |
| GLD | Precious Metals | 10% | Tier-2 (10%) |
| VEGI | Agriculture & Livestock | 10% | Tier-2 (10%) |
Trade Instructions — Monday Open
Sell the tranche from 2026-06-05 (completing its 4-week hold). Buy the new tranche. Instructions show net portfolio changes — same-asset positions cancel, weight changes show the delta.
| Action | Ticker | Instruction |
|---|---|---|
| SELL | XLE | Sell 50% of XLE position (reduce 5.00% → 2.50%) |
| SELL | MOO | Sell 33% of MOO position (reduce 7.50% → 5.00%) |
| SELL | ILF | Sell 50% of ILF position (reduce 5.00% → 2.50%) |
| BUY | URNM | Buy URNM — 33.33% of freed cash (adds 2.50% to portfolio) |
| BUY | GLD | Buy GLD — 33.33% of freed cash (adds 2.50% to portfolio) |
| BUY | VEGI | Buy VEGI — 33.33% of freed cash (adds 2.50% to portfolio) |
Current Portfolio After Trade
Combined holdings across all 4 active tranches. Each tranche is 25% of the portfolio.
| Ticker | % of Portfolio | Weight Bar |
|---|---|---|
| ITA | 17.50% | |
| SMH | 12.50% | |
| CIBR | 10.00% | |
| COPX | 10.00% | |
| XLU | 7.50% | |
| MOO | 5.00% | |
| AIQ | 5.00% | |
| XLK | 5.00% | |
| NLR | 5.00% | |
| URNM | 5.00% | |
| GLD | 5.00% | |
| XLE | 2.50% | |
| ILF | 2.50% | |
| PAVE | 2.50% | |
| GDX | 2.50% | |
| VEGI | 2.50% |
Macro Regime — Risk-Off Deterioration
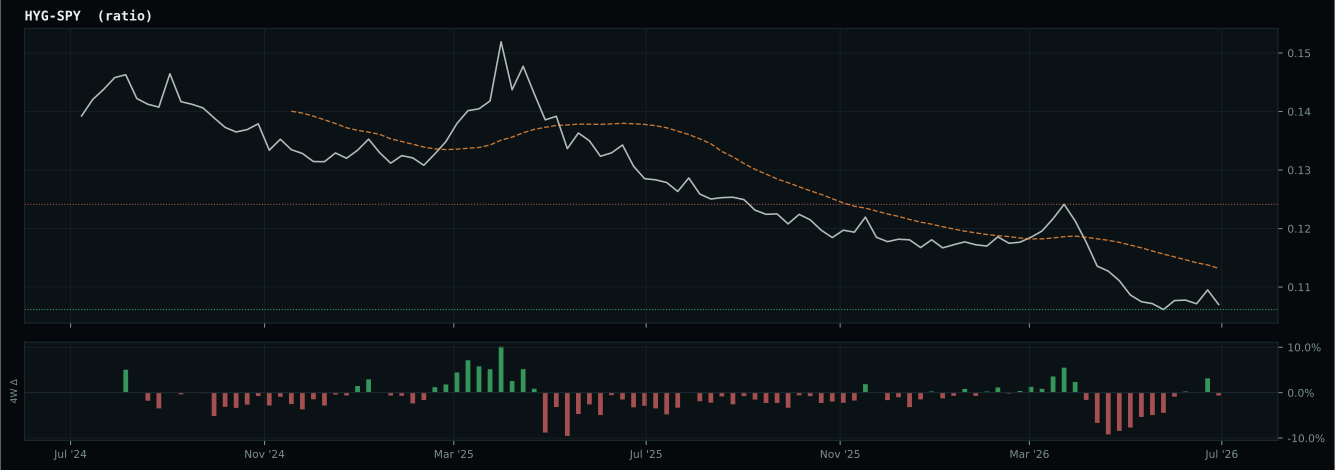
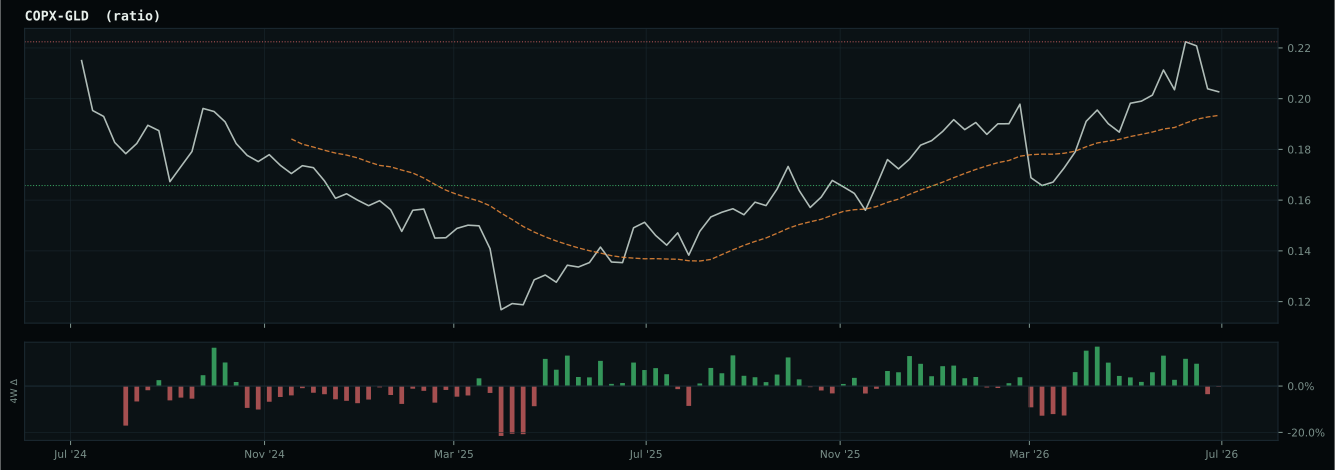
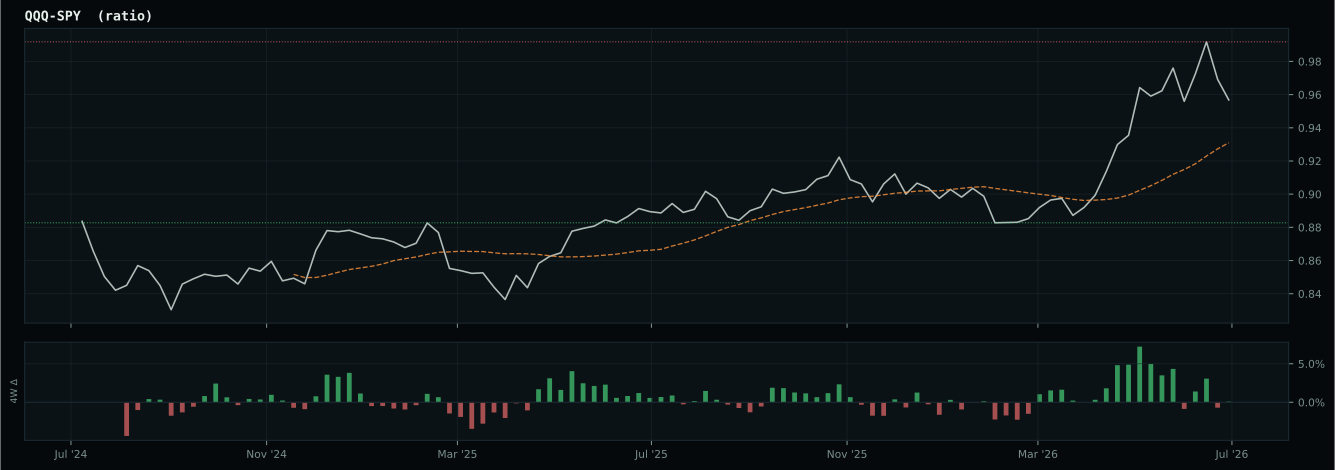
liquidity is improving but credit stress remains elevated
Macro Evidence Charts
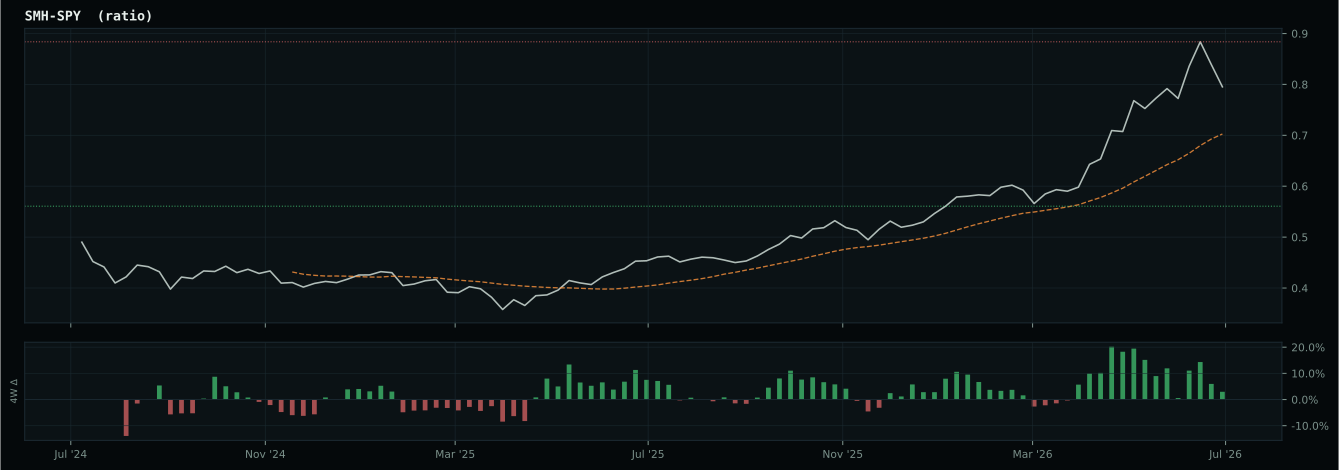
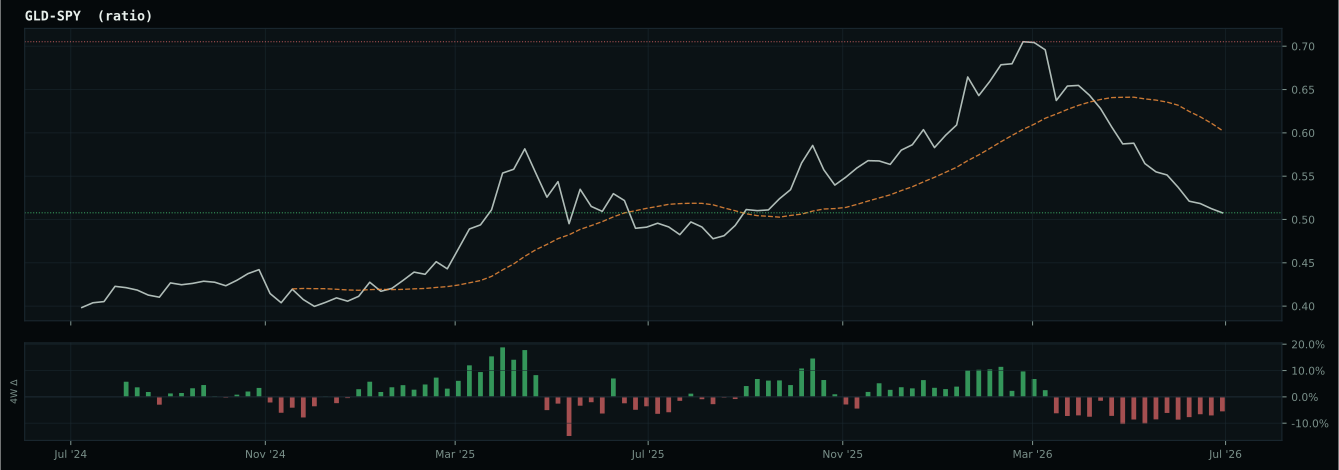
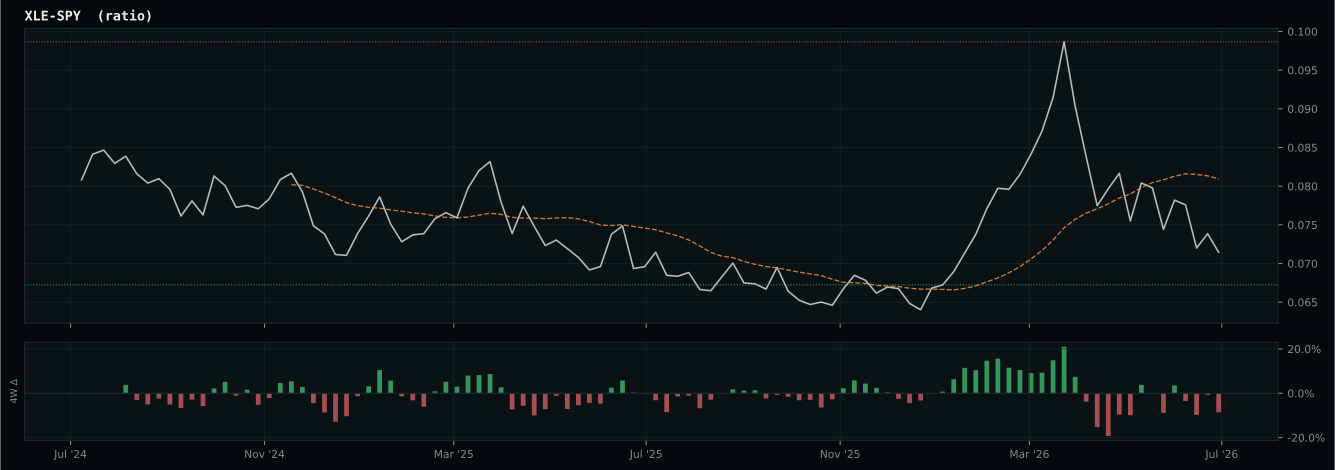
Market-implied signals behind the macro regime scores. Each ratio compares two assets; the direction and slope of the ratio is what the macro engine reads.
Crypto Regime — NoCrypto
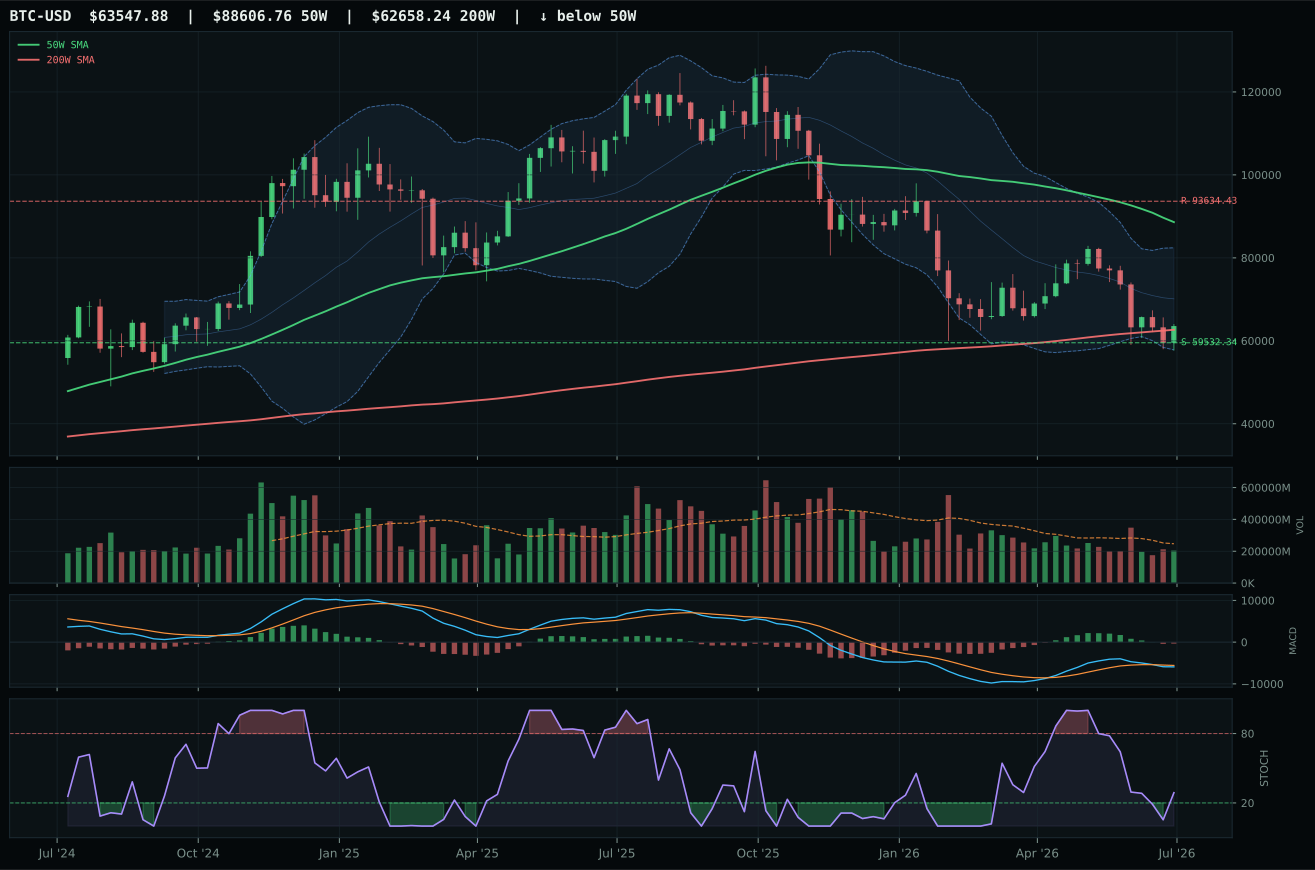
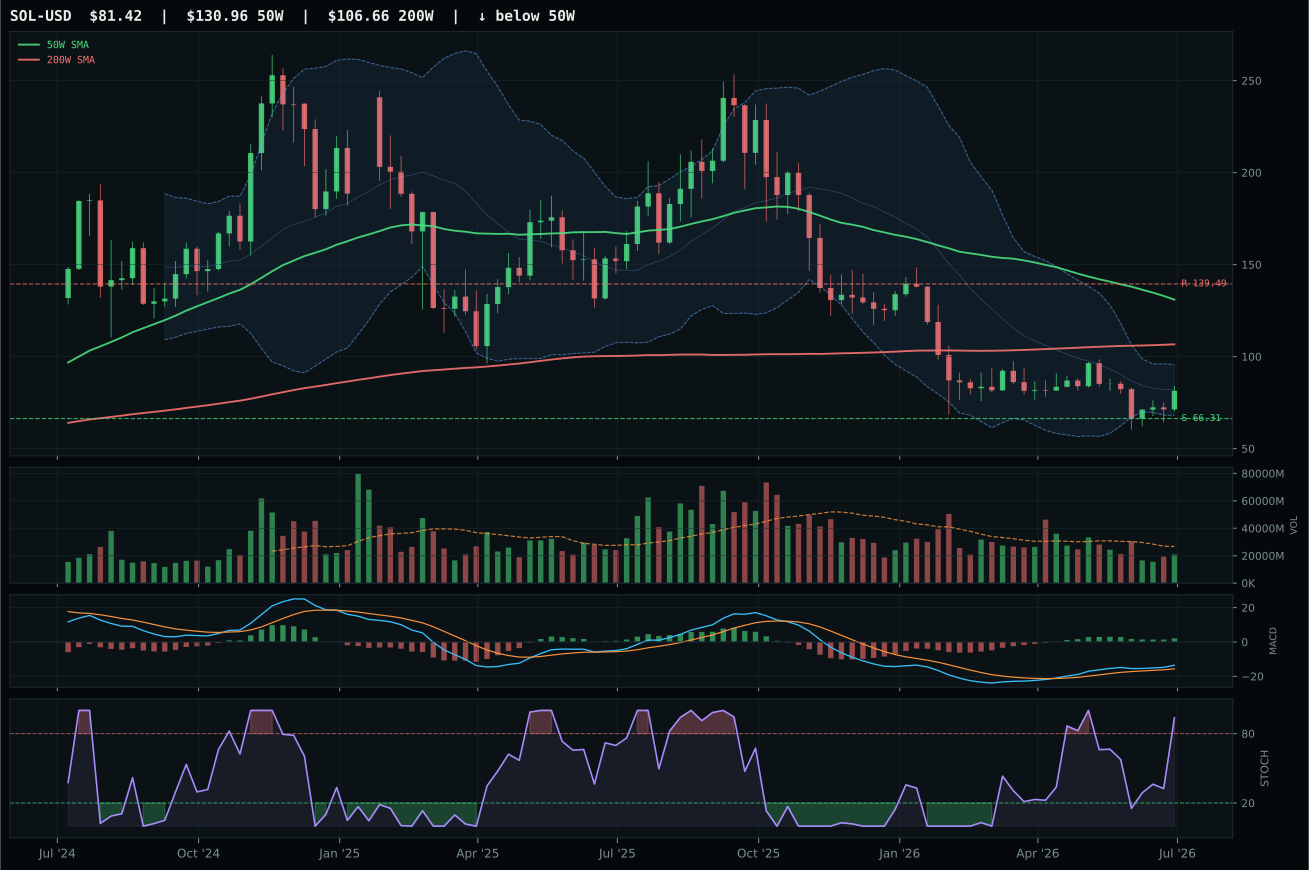
post-touch range has not been tested enough: support tests 1/2, resistance tests 3/2
TrendBTC not confirmed
one or more available conditions failed
Category Rankings
| Rank | Category | Winner | Score | Alloc | 4W Ret | Peers (4W) |
|---|---|---|---|---|---|---|
| 1 | Technology | CIBR | 61.6 | 20% | — | XLK — · IGV — |
| 2 | AI | SMH | 59.9 | 20% | — | AIQ — · BOTZ — |
| 3 | Defense & Aerospace | ITA | 55.3 | 10% | — | XAR — · ROKT — |
| 4 | Utilities & Infrastructure | XLU | 53.4 | 10% | — | PAVE — · IGF — |
| 5 | Industrial Metals | COPX | 38.9 | 10% | — | REMX — · PICK — |
| 6 | Nuclear Energy | URNM | 35.0 | 10% | — | URA — · NLR — |
| 7 | Precious Metals | GLD | 34.7 | 10% | — | GDX — · SLV — |
| 8 | Agriculture & Livestock | VEGI | 30.2 | 10% | — | MOO — · WEAT — |
| 9 | Emerging Markets | ILF | 27.1 | 0% | — | IEMG — · INDA — |
| 10 | Traditional Energy | XLE | 8.6 | 0% | — | XOP — · FCG — |
Technology — CIBR
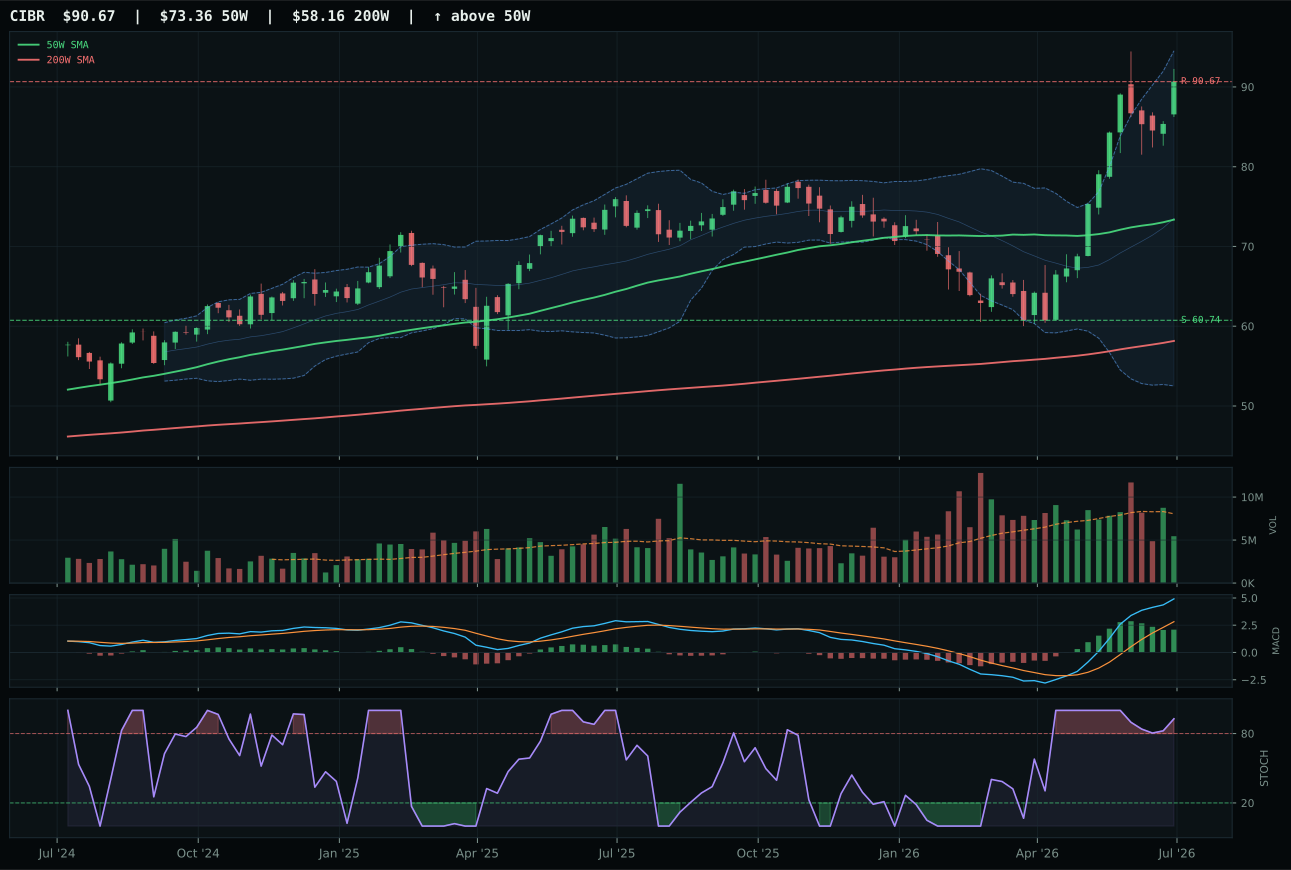
CIBR has a vertical extension profile with 27.7% 13-week relative strength versus SPY.
A failed hold above support would weaken the setup.
Actionable but governed by invalidation levels.
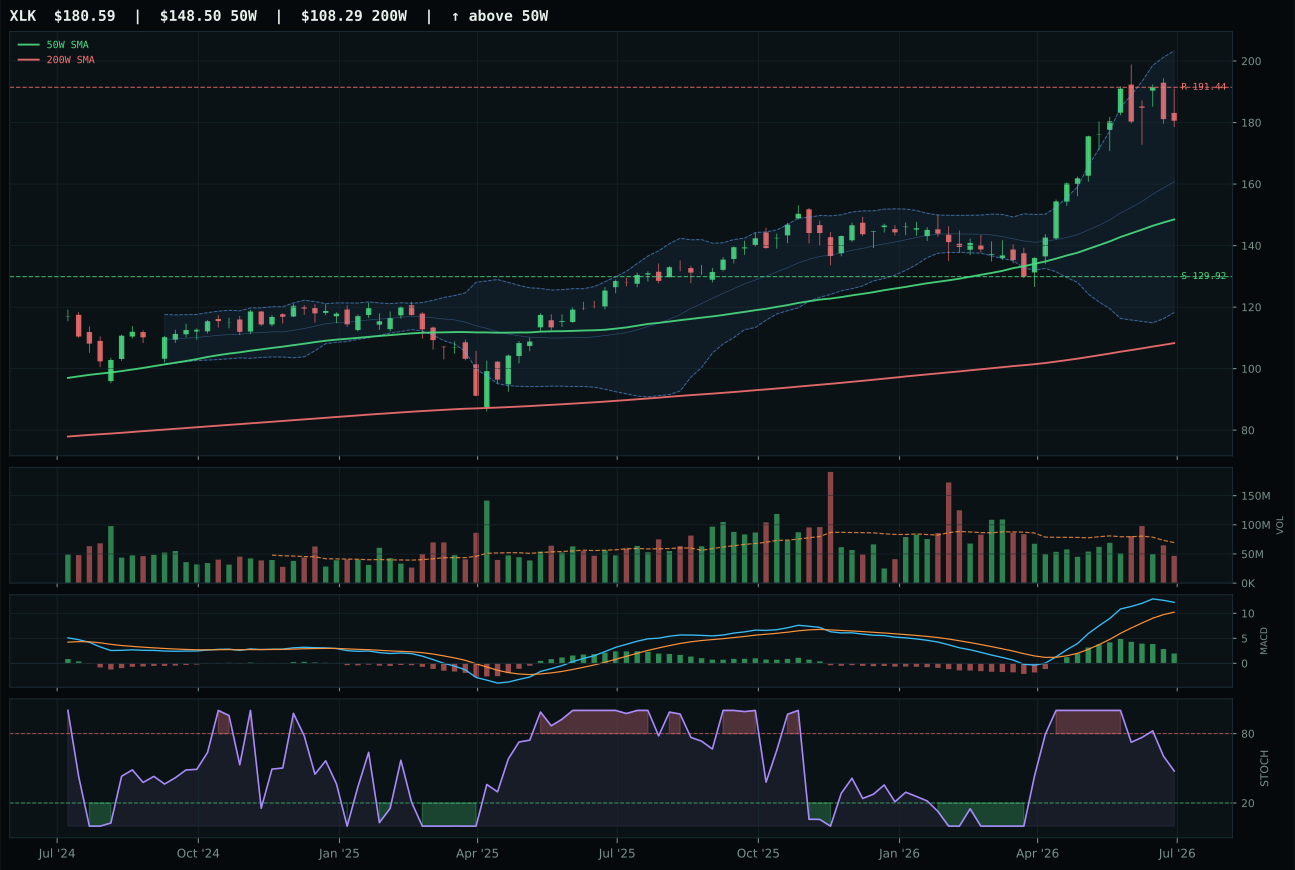
XLK has a vertical extension profile with 19.2% 13-week relative strength versus SPY.
A failed hold above support would weaken the setup.
Actionable but governed by invalidation levels.
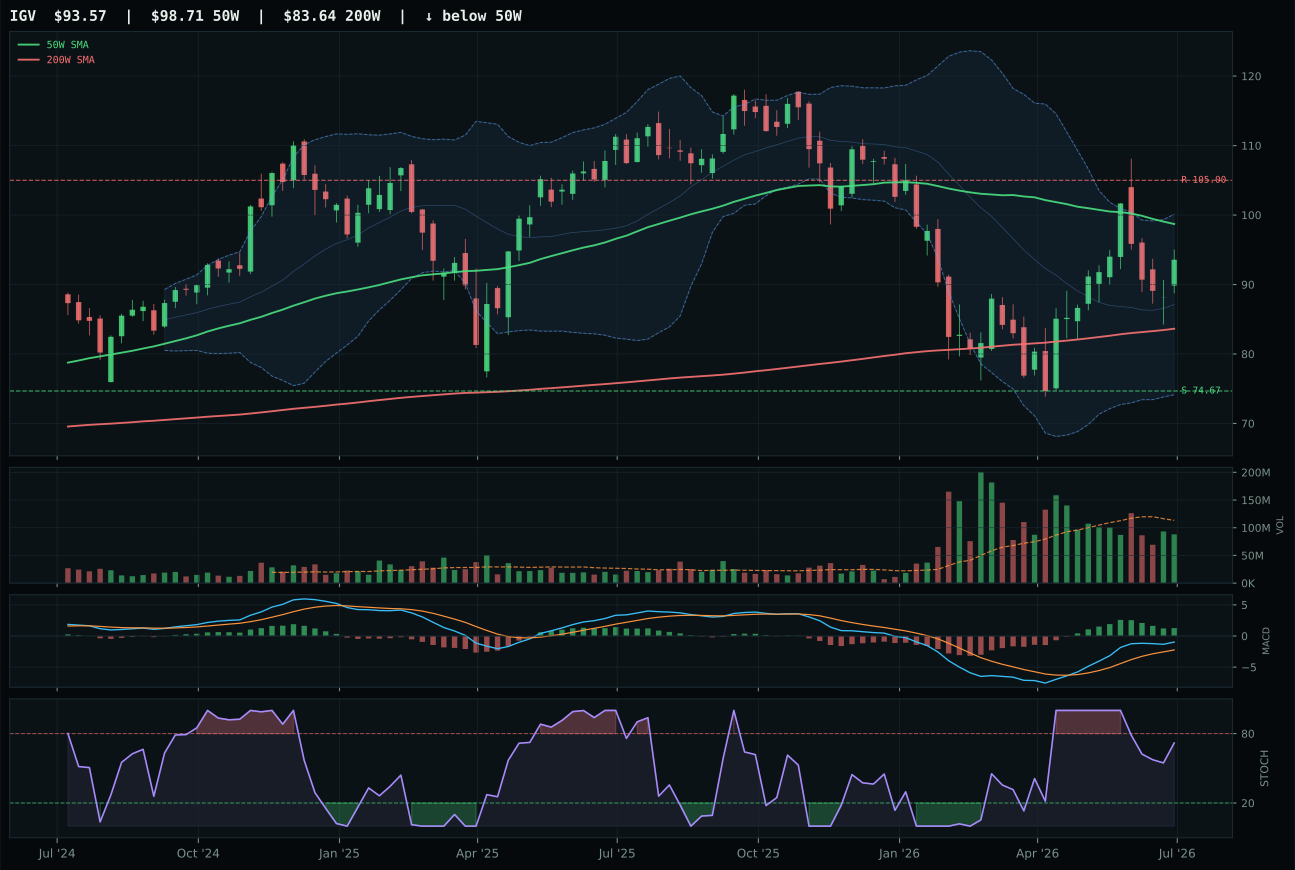
IGV has a neutral structure profile with 2.9% 13-week relative strength versus SPY.
A failed hold above support would weaken the setup.
Actionable but governed by invalidation levels.
CIBR wins the category with a 61.6 score by capturing relative strength leadership within its peer set, posting 27.7% RS versus SPY and 8.5% outperformance versus the category median—the decisive margin that separates it from XLK's 19.2% SPY RS and flat 0.0% category RS. The cybersecurity-focused ETF sits 23.6% above its 50-week moving average in a vertical extension, with MACD bullish but flattening and stochastic RSI at overbought 0.93, signaling that momentum has peaked and entry risk is being correctly penalized in timing (40.0/100) and risk-reward (47.9/100). Its 41.3% thirteen-week return and 0.68x volume participation tell the story of late-stage accumulation—buyers are committed but thin, and upside to resistance sits at 0.0%, meaning every remaining dollar of gain requires the market to reprice risk. XLK's broader profitable technology expression lost on structure cleanliness (74.8 vs 75.0) and pure relative strength mathematics, not fundamental weakness, but in a risk-off macro regime the category needed the strongest relative performer.
Technology earned its 20% allocation slot as the top-ranked category because the technical evidence of trend (100/100) and momentum confirmation (100/100) provided enough sponsorship to overcome the macro headwinds of risk-off deterioration and credit stress, despite liquidity stress being active. The 64% technical weight in the scoring process preserved the leadership of the strongest chart-based setup, even though macro/narrative fit came in at only 48.0/100—meaning the category is allocated on pure execution and relative strength, not on the macro tailwind. This allocation reflects a directional bet that technology leadership persists despite deteriorating conditions, which is defensible only if you believe the AI growth sponsorship signal (worth +6 at category level) and risk appetite positive descriptor (+9) will override the headwinds. Hold this allocation tight; a single breakdown in CIBR's trend structure or failure to hold above the 50W would signal the need to rebalance into more macro-resilient positions.
AI — SMH
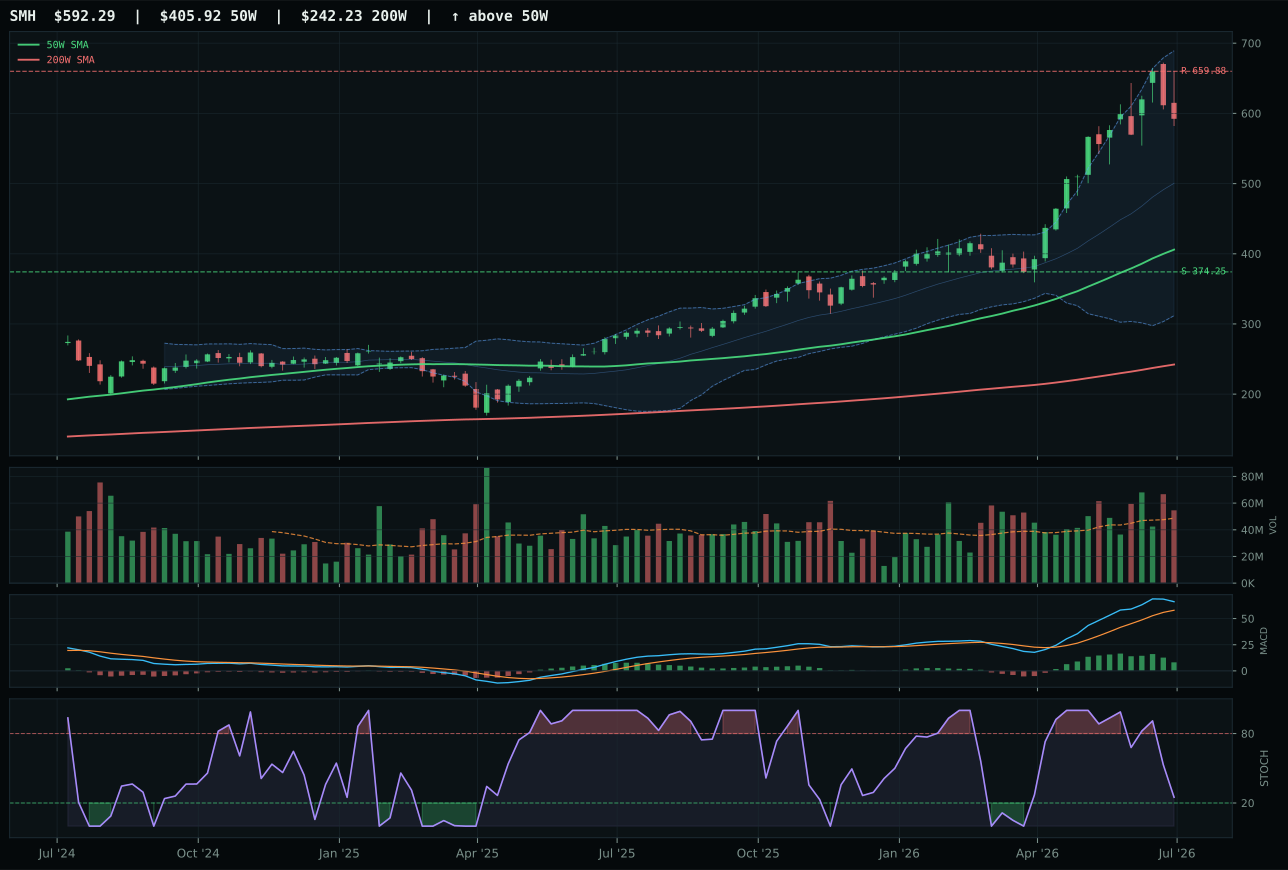
SMH has a vertical extension profile with 37.4% 13-week relative strength versus SPY.
A failed hold above support would weaken the setup.
Actionable but governed by invalidation levels.
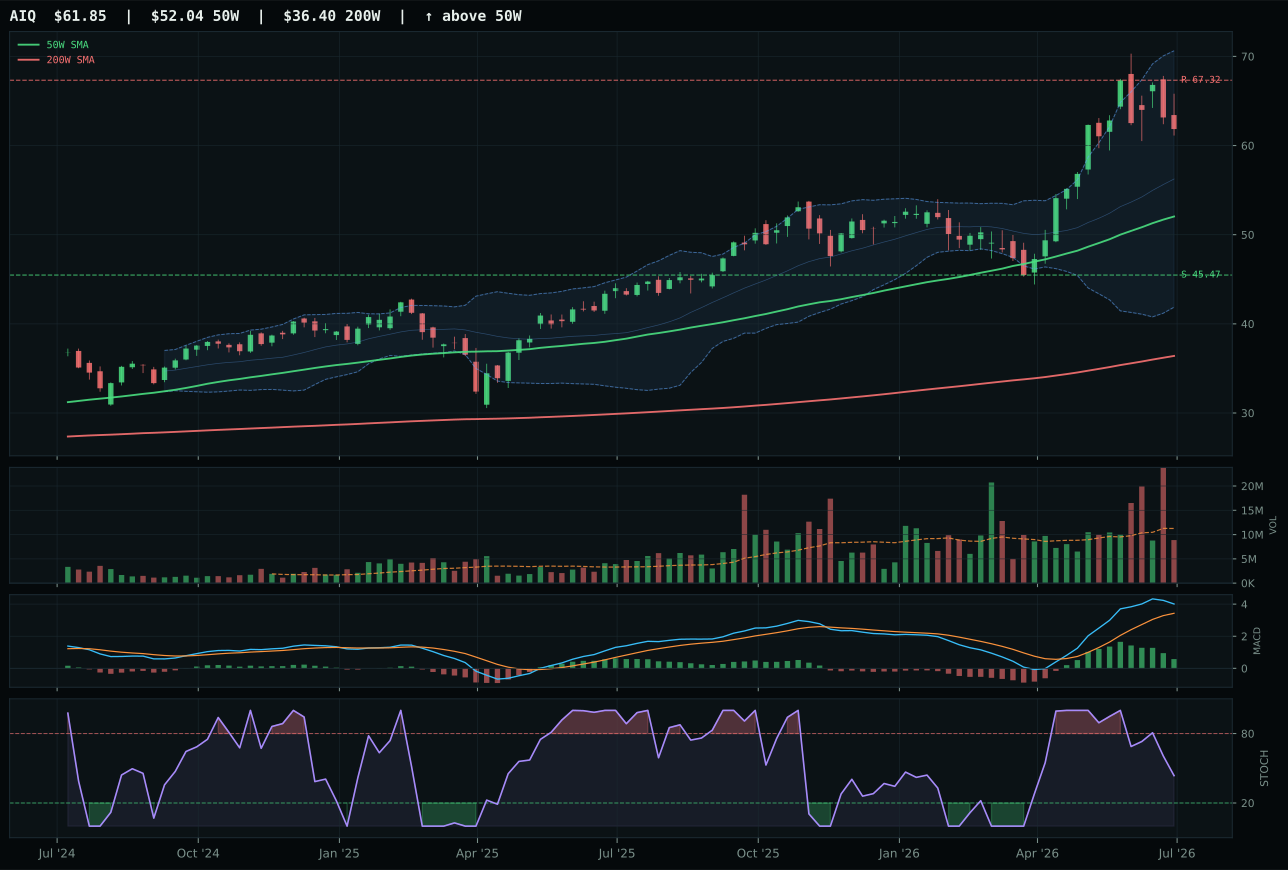
AIQ has a vertical extension profile with 17.3% 13-week relative strength versus SPY.
A failed hold above support would weaken the setup.
Actionable but governed by invalidation levels.
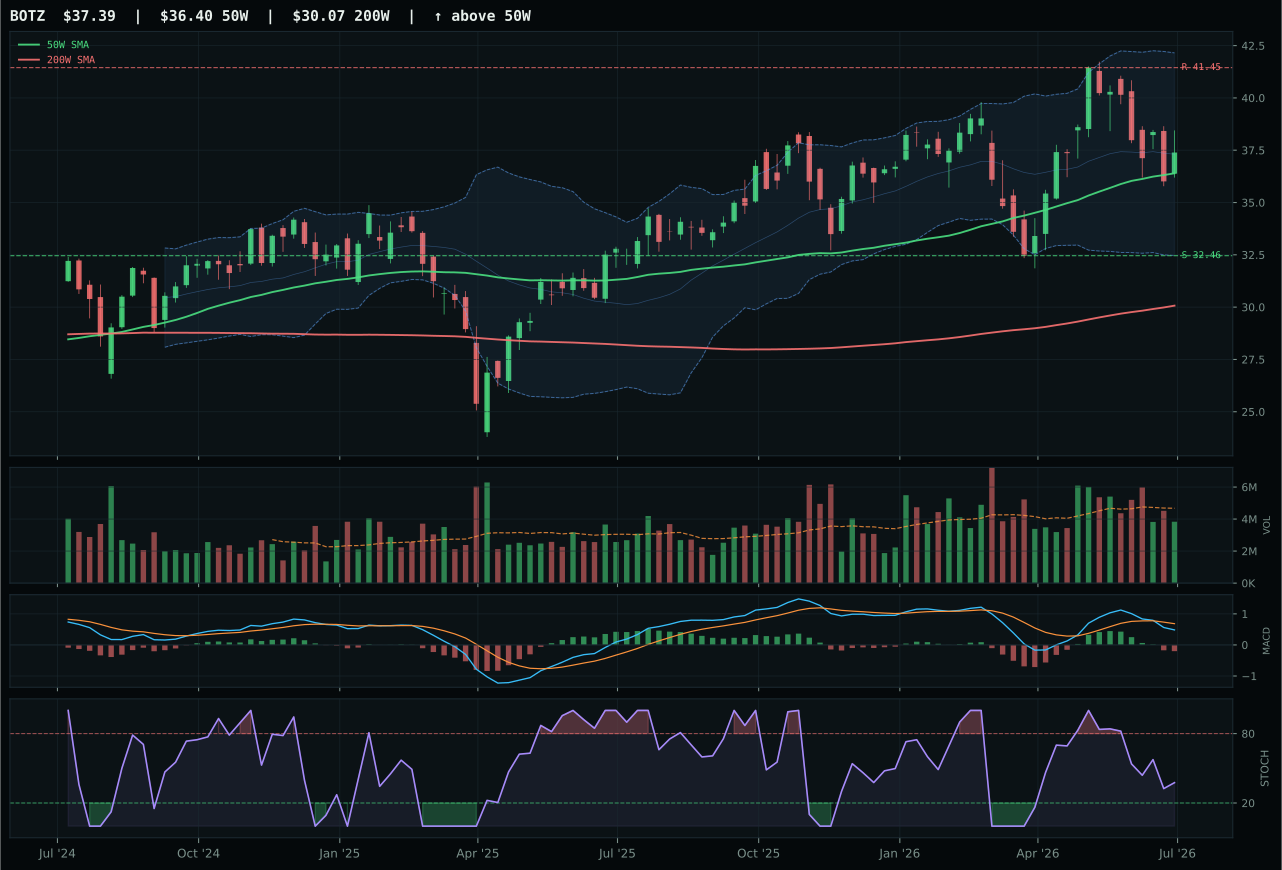
BOTZ has a compression near 50W profile with -1.6% 13-week relative strength versus SPY.
A failed hold above support would weaken the setup.
Actionable but governed by invalidation levels.
SMH dominates the AI category with a 59.9 score and clear technical superiority, delivering the hardest data point: 51.0% thirteen-week return with 37.4% RS versus SPY and 20.1% outperformance versus the category median—AIQ trails at 30.8% return, 17.3% SPY RS, and 0.0% category RS. The semiconductor and AI compute expression sits at extreme 45.9% above its 50-week moving average with stochastic RSI falling/neutral (0.25), which is the correct technical signal for extended strength—MACD is bullish but flattening, volume is 1.12x average (above-average participation), and risk-reward is severely compressed at 33.2/100 (upside only -10.2% to resistance, downside 58.3% to support). The setup is vertical extension with zero ambiguity: buyers have been consistent, price has run hard, and the only reason to stay long is conviction that momentum persists or that the downside risk is justified by the macro narrative. AIQ's neutral volume versus SMH's above-average participation and its lagging category-relative strength made the selection clear.
AI earned 20% allocation as co-leader with Technology because SMH's technical evidence score (84.7/100) is the highest individual ETF score in the entire portfolio—a data point that cannot be ignored even though the macro regime is Risk-Off Deterioration and liquidity stress is active (-12 points at category level). The AI growth sponsorship descriptor (+14) and risk appetite positive (+10) created enough narrative offset to justify 62% technical weighting and keep the category in the top two. However, the risk-reward compression (33.2/100) and the -10.2% upside to resistance mean this allocation is now purely a momentum hold; the position must be sized with awareness that the setup is extended and any volume or MACD deterioration will force a re-evaluation. The portfolio is double-weighted in momentum-driven technology exposure; this is intentional but fragile.
Defense & Aerospace — ITA
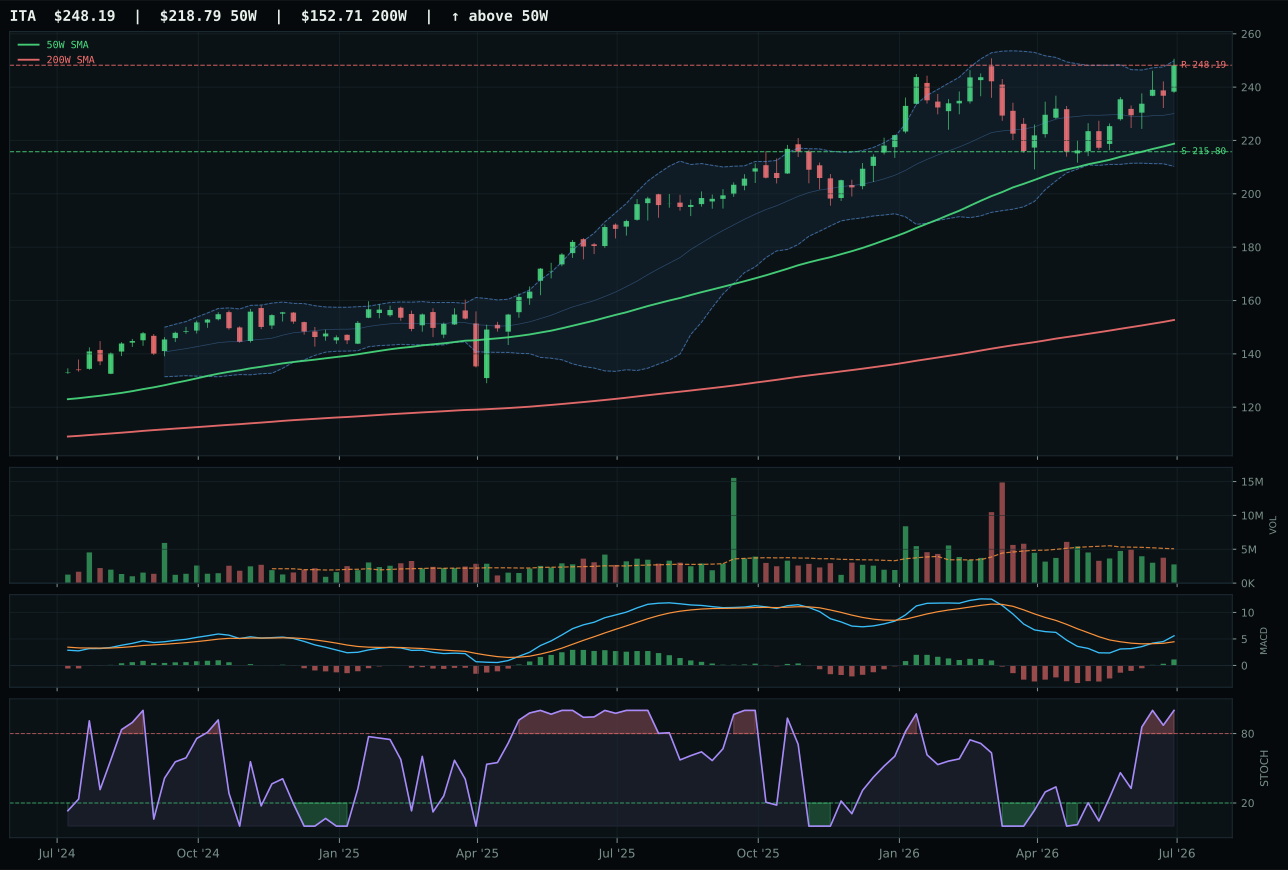
ITA has a neutral structure profile with -1.7% 13-week relative strength versus SPY.
A failed hold above support would weaken the setup.
Actionable but governed by invalidation levels.
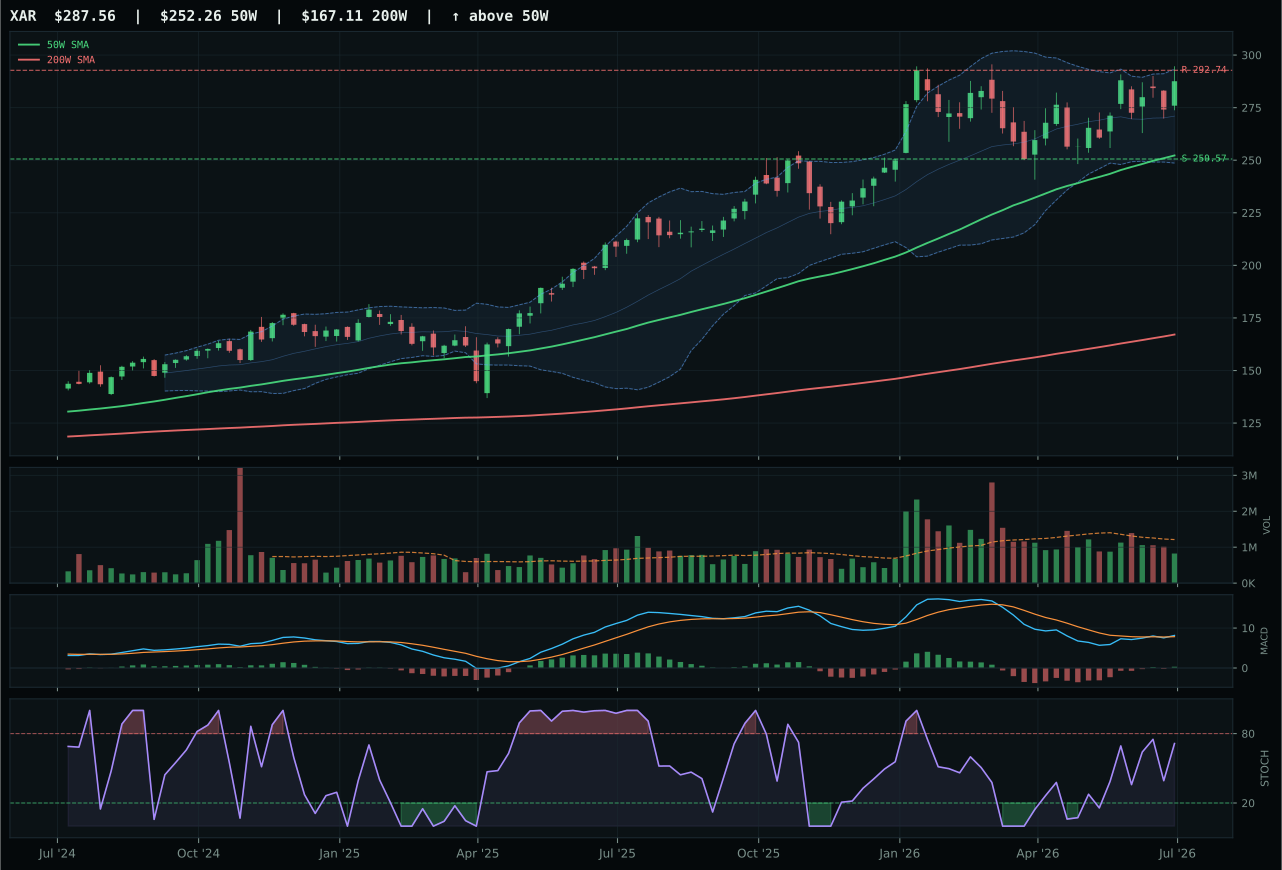
XAR has a neutral structure profile with -2.8% 13-week relative strength versus SPY.
A failed hold above support would weaken the setup.
Actionable but governed by invalidation levels.
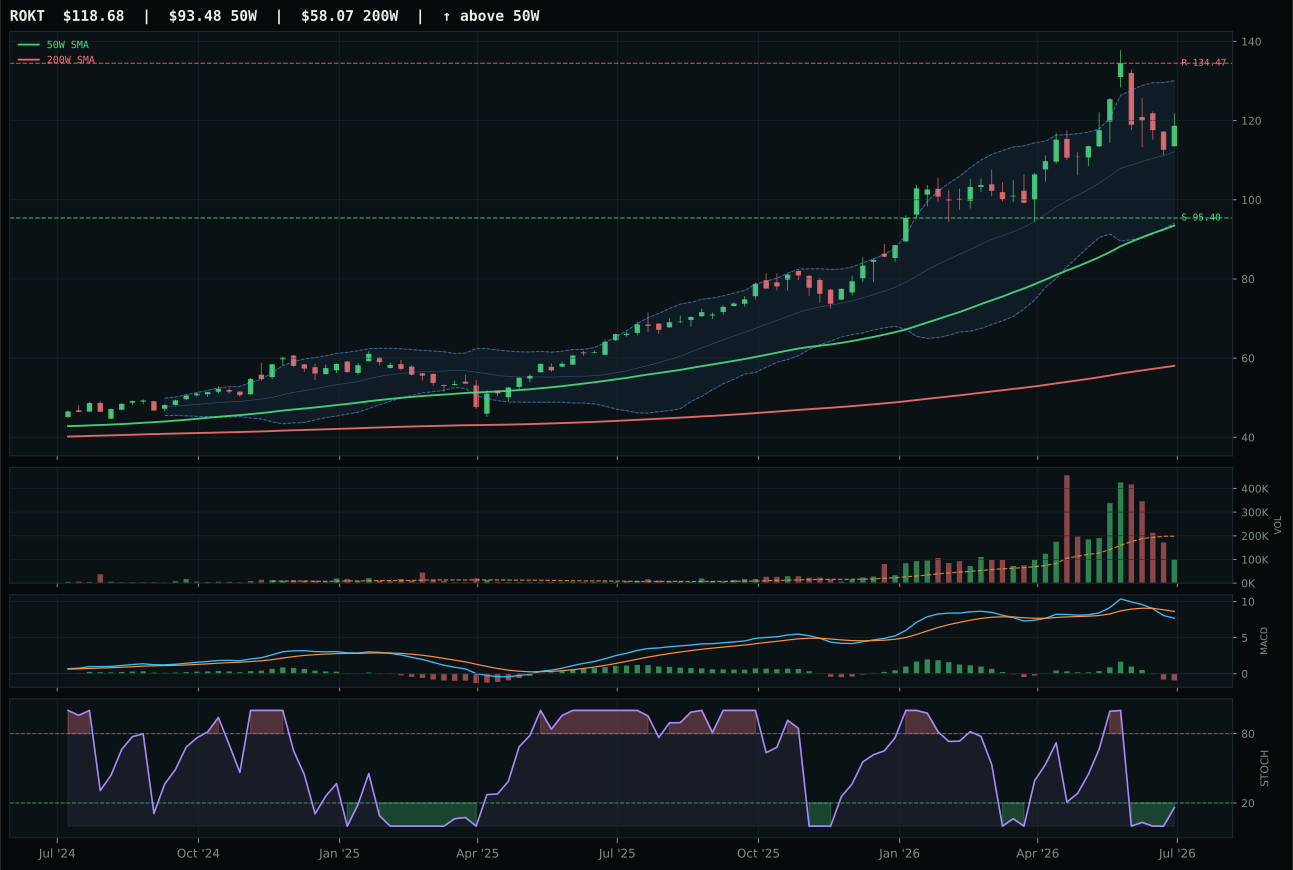
ROKT has a vertical extension profile with -2.0% 13-week relative strength versus SPY.
A failed hold above support would weaken the setup.
Actionable but governed by invalidation levels.
ITA edges XAR by 1.3 points to claim the 10% allocation slot, winning on cleaner structure (73.9 vs 70.1), better risk-reward (46.6 vs 39.2), and marginally superior category-relative strength (0.3% vs -0.8%). The defense-prime durability expression sits 13.4% above the 50-week moving average in neutral structure with MACD bullish and improving and stochastic RSI at overbought 1.00, reflecting a steady uptrend without extension—price is near the 52-week high with resistance at 248.19 and limited upside. The thirteen-week return of 11.8% is steady but not spectacular, and critically, the -1.7% RS versus SPY and thin 0.54x volume participation suggest this position is holding via trend-following discipline rather than active buying. XAR's 10.8% thirteen-week return and rising mid-zone stochastic RSI offered some technical advantage in timing (75 vs 59), but ITA's cleaner setup and marginally positive category relative strength sealed the win in a category where breadth and liquidity matter more than momentum.
Defense & Aerospace earned a modest 10% allocation because Risk-Off Deterioration (+7 at category level) actually helps this category, and credit stress is also constructive (+2)—the macro regime rewards defensive, cash-generative businesses. However, the category score of 55.3 is firmly in the middle tier; it did not crack the top two because overall technical evidence is diluted by thin participation and weak SPY relative strength (both ETFs are slightly underwater relative to the broad market). The timing score (59-75 range) across the two finalists suggests pullback opportunities are more attractive than current prices, and the allocation reflects a holding position—not a build. This is a stalwart macro hedge, not a growth driver; hold it for downside protection and allow it to underperform in risk-on conditions without regret.
Utilities & Infrastructure — XLU
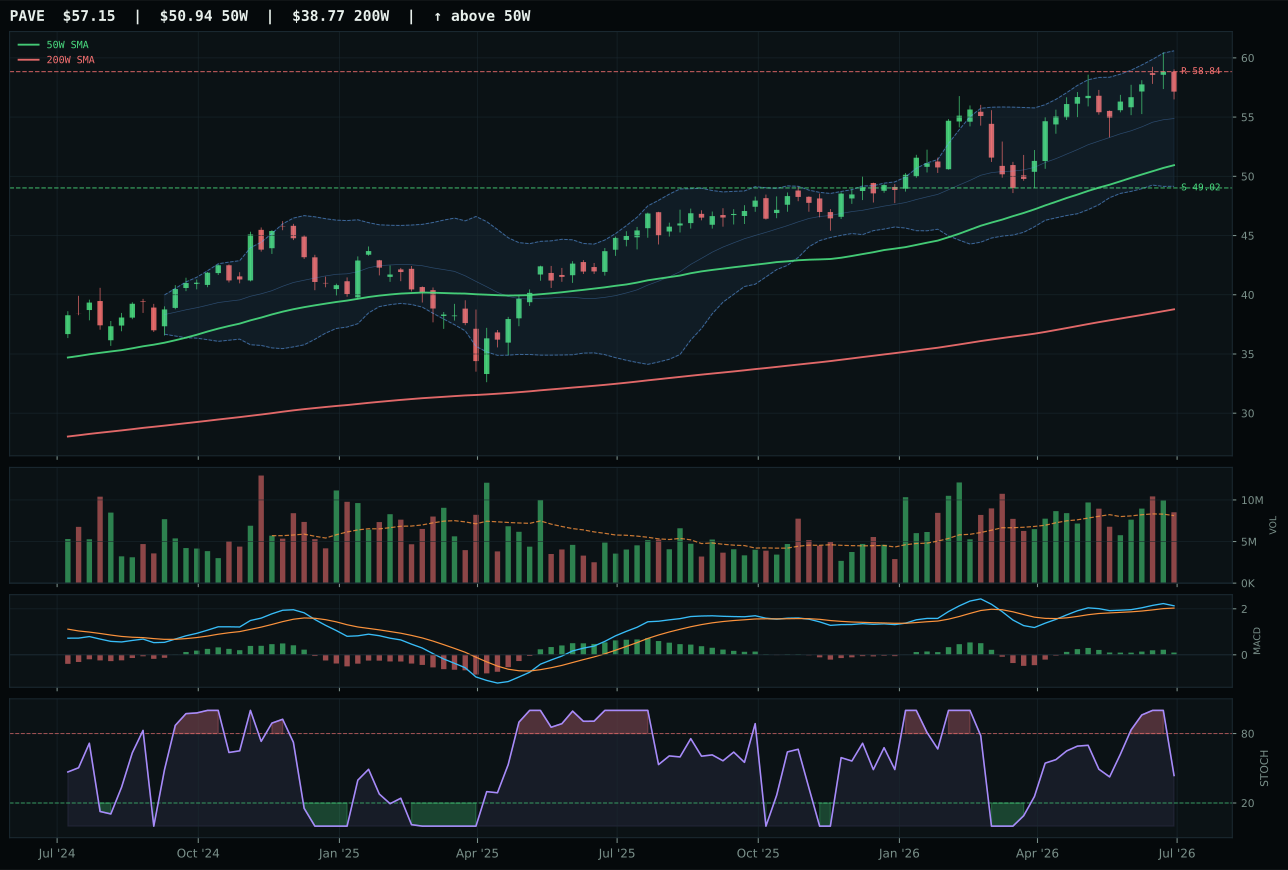
PAVE has a neutral structure profile with -2.2% 13-week relative strength versus SPY.
A failed hold above support would weaken the setup.
Actionable but governed by invalidation levels.
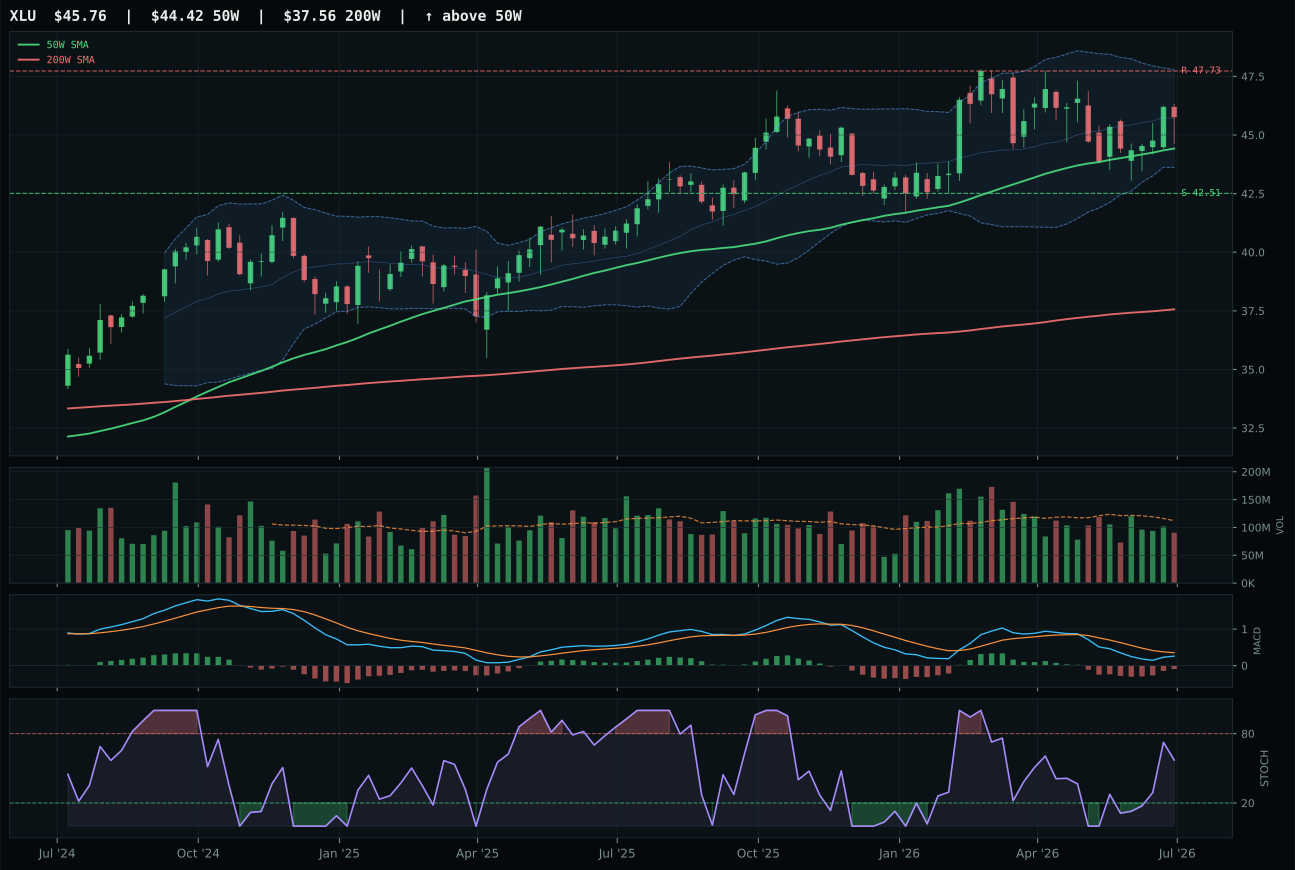
XLU has a neutral structure profile with -14.8% 13-week relative strength versus SPY.
A failed hold above support would weaken the setup.
Actionable but governed by invalidation levels.
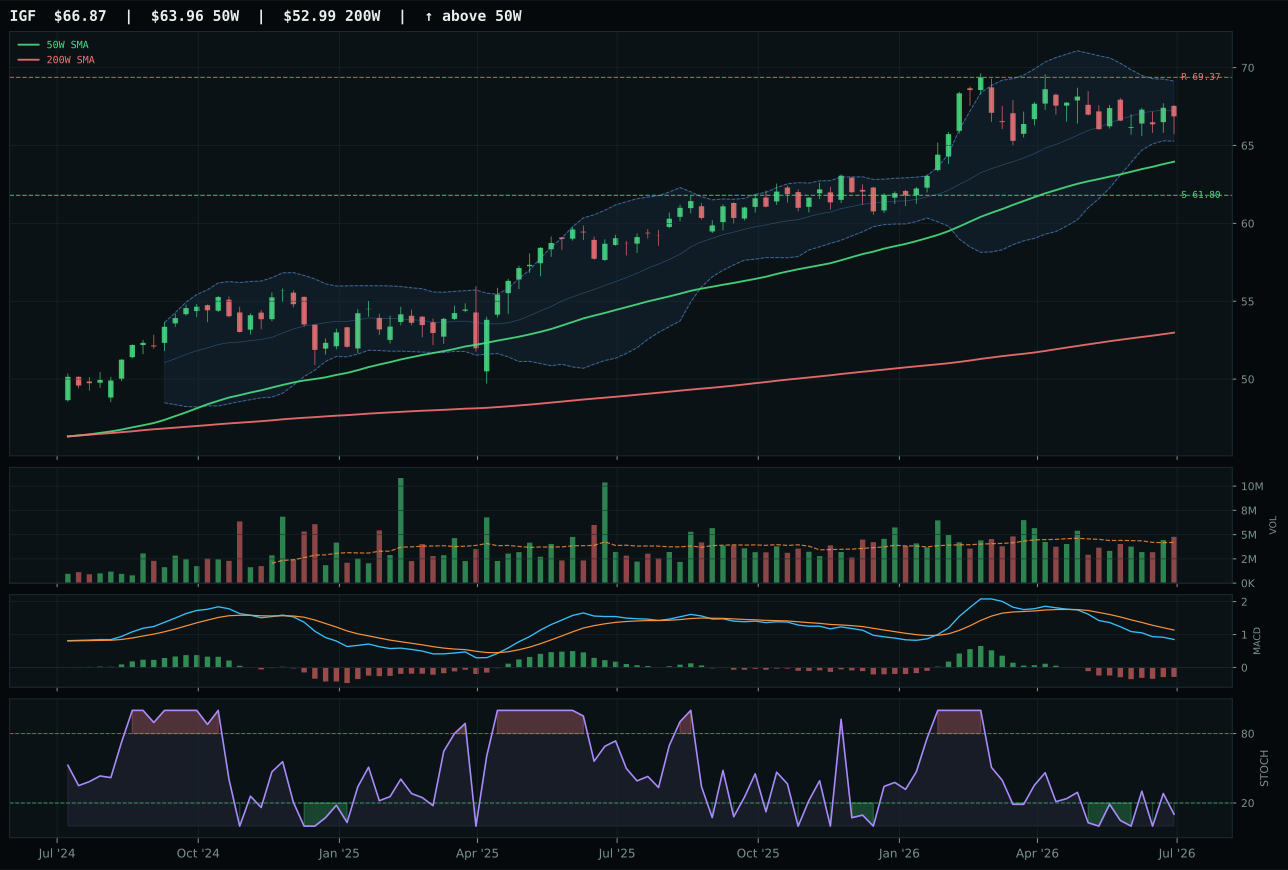
IGF has a neutral structure profile with -14.8% 13-week relative strength versus SPY.
A failed hold above support would weaken the setup.
Actionable but governed by invalidation levels.
XLU wins Utilities & Infrastructure with a 53.4 score over PAVE (-11.4 points) by capturing the critical timing advantage (98.0 vs 75.0) and superior risk-reward (54.7 vs 48.1), despite losing on trend (78.0 vs 97.0) and momentum confirmation (31.3 vs 89.0). The regulated utility defense sits just 3.0% above the 50-week moving average with stochastic RSI rising mid-zone (0.57), MACD bearish but improving, and excellent support structure with 82.7% compression and a tight 7.6% downside to support at 42.51—the chart shows early-stage recovery, not extended strength. The thirteen-week return is flat at -1.3% with neutral volume (0.81x), reflecting steady dividend demand rather than capital appreciation momentum, and -14.8% RS versus SPY is expected in a risk-off regime. PAVE's bullish structure (97.0 trend, 89.0 momentum, 11.4% thirteen-week return) looks superior on momentum metrics, but it is 12.2% extended from the 50-week moving average with falling/neutral stochastic RSI, making it a later-stage entry with worse timing asymmetry.
Utilities & Infrastructure earned 10% allocation as a defensive core holding because Risk-Off Deterioration (+8) and disinflation pressure (+6) support the regulated utility thesis, and XLU's exceptional timing (98.0/100) signals that the chart is coiling for potential upside. The macro fit (53.0/100) is above-neutral, driven by defensive cash-flow generation, and the 59.9 technical evidence for XLU balances trend moderation with timing precision—this is an entry position, not a momentum chase. The allocation is sized to provide portfolio stability and downside cushion; do not trade around it. XLU is a multi-quarter hold designed to smooth volatility when equities struggle; it will lag in risk-on environments without regret. Exit into any sharp bounce in broader market breadth, and redeploy to growth exposures. This is the portfolio's ballast anchor, not a return driver.
Industrial Metals — COPX
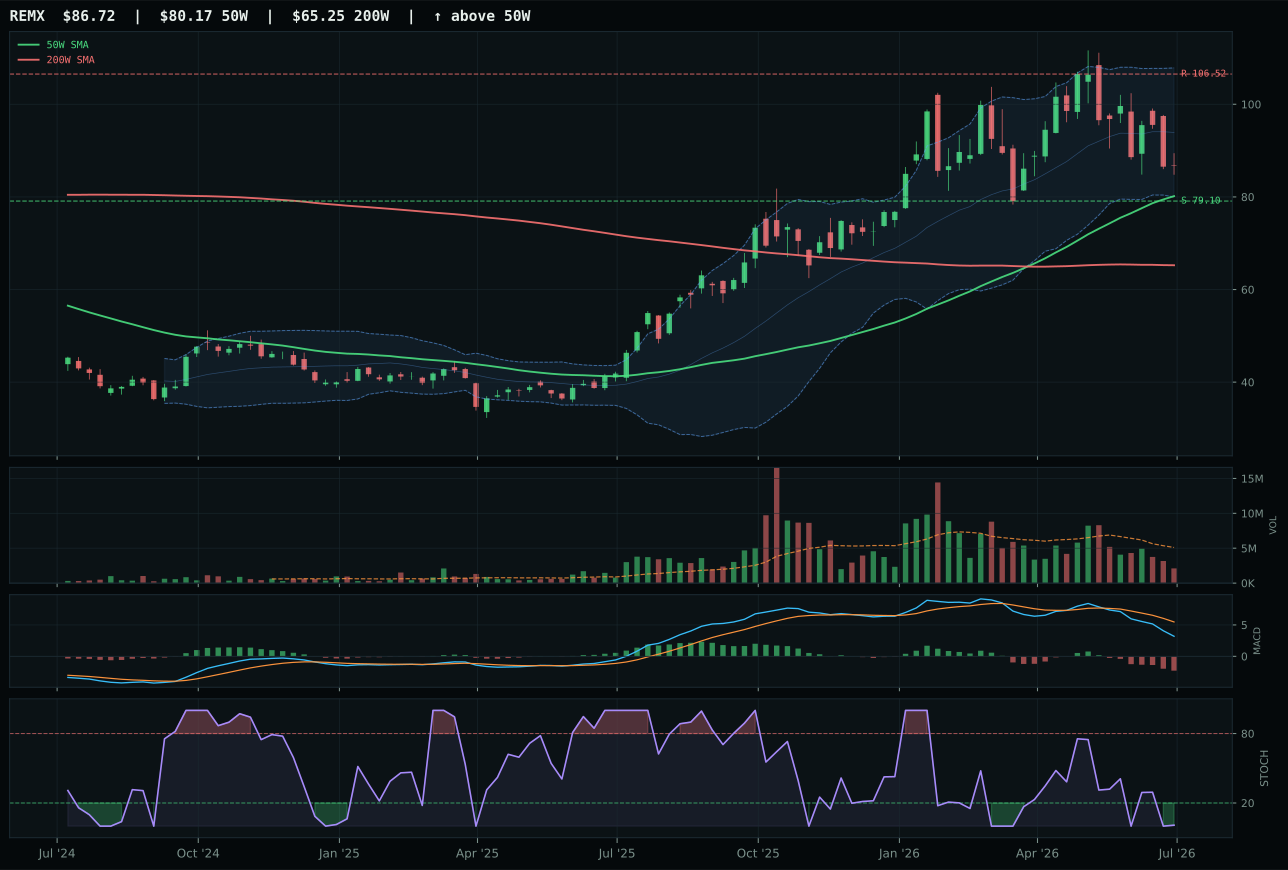
REMX has a neutral structure profile with -16.0% 13-week relative strength versus SPY.
A failed hold above support would weaken the setup.
Actionable but governed by invalidation levels.
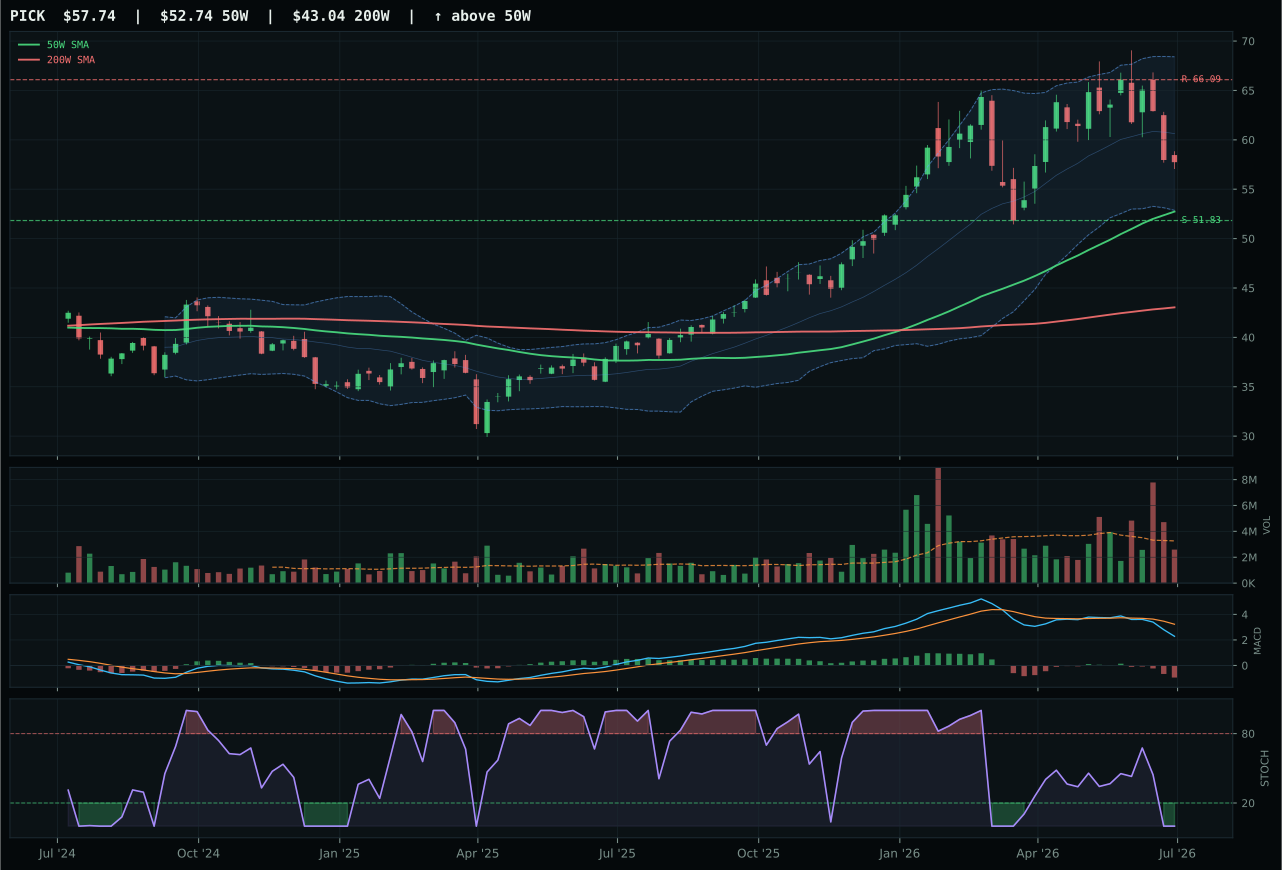
PICK has a neutral structure profile with -12.9% 13-week relative strength versus SPY.
A failed hold above support would weaken the setup.
Actionable but governed by invalidation levels.
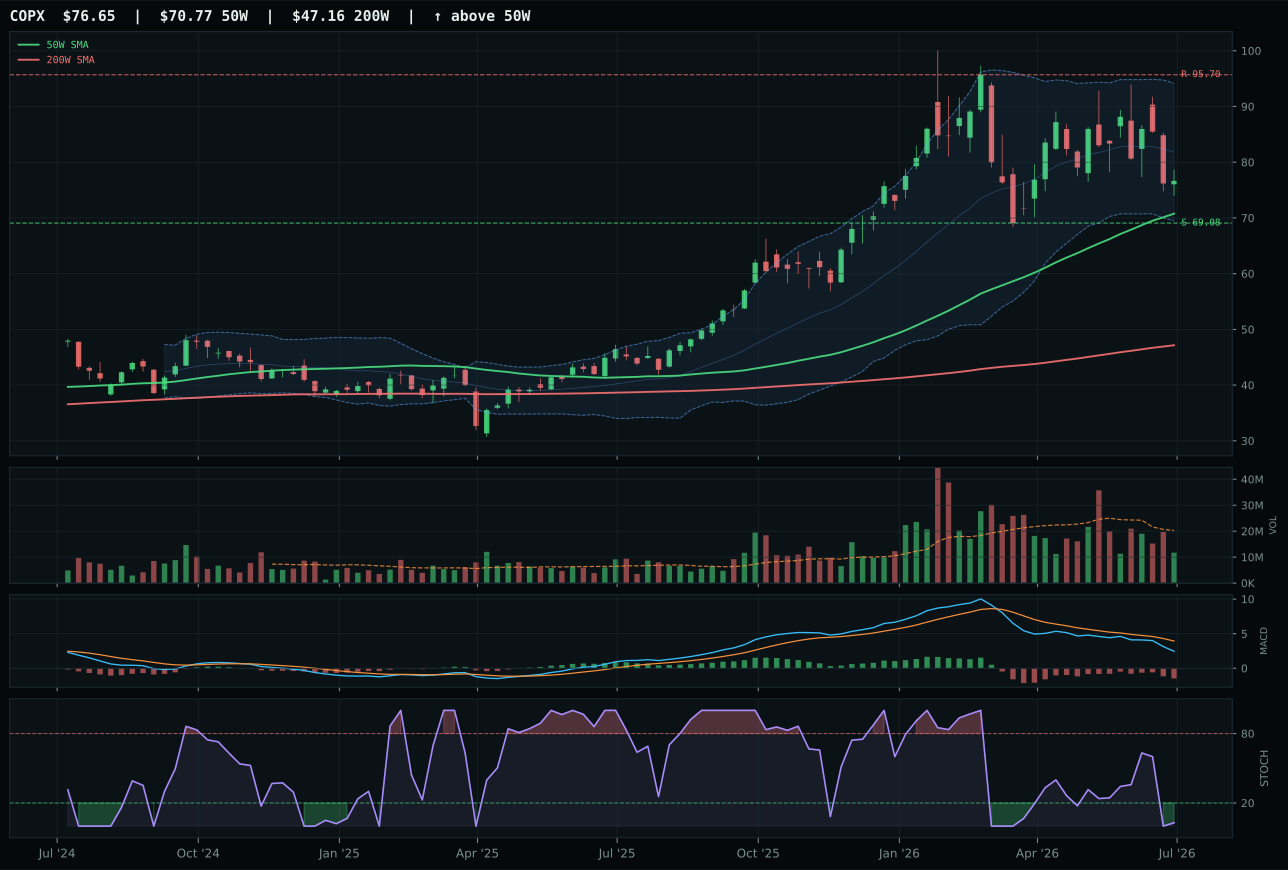
COPX has a neutral structure profile with -13.8% 13-week relative strength versus SPY.
A failed hold above support would weaken the setup.
Actionable but governed by invalidation levels.
COPX captures the Industrial Metals allocation over REMX by a slim 2.3-point margin, winning on timing (77.0 vs 70.0), risk-reward (70.7 vs 64.7), and neutral category-relative strength (0.0% vs -2.2%), despite both ETFs being momentum-dead with zero confirmation scores and bearish/weakening MACD. The copper scarcity expression sits 8.3% above the 50-week moving average in neutral structure with stochastic RSI at extreme oversold (0.03), price near the Fibonacci 0.382 middle retracement zone (77.81), and an asymmetric risk-reward favoring downside protection (downside 11.0% to support, upside capped at -19.9% to resistance). The thirteen-week return is flat at -0.3% with thin 0.58x volume, meaning industrial metals have stopped falling but have not attracted new buying. REMX's rare-earth tilt and higher momentum sensitivity (-2.5% thirteen-week return) made it the weaker vehicle in a macro regime where scarcity tailwinds are real but not yet reflected in price action.
Industrial Metals earned 10% allocation on macro conviction rather than technical readiness; the category-level macro fit is a strong 63.0/100 because metals scarcity (+14) and commodity breadth positive (+10) are active descriptors in a real-asset sponsorship environment (+6), even though the technical evidence is sparse (22.8/100 for COPX). COPX's tight risk-reward (70.7/100) and well-defined support near 69.08 make this more of a floor-play than a momentum add; the position is sized to participate in any industrial recovery driven by AI capex, energy transition, or inflation re-acceleration, without requiring immediate upside. This is a structural bet, not a timing call: hold COPX and let the copper thesis unwind over time. Exit only if support breaks or if commodity breadth signals reverse; do not chase into strength on weak volume.
Nuclear Energy — URNM
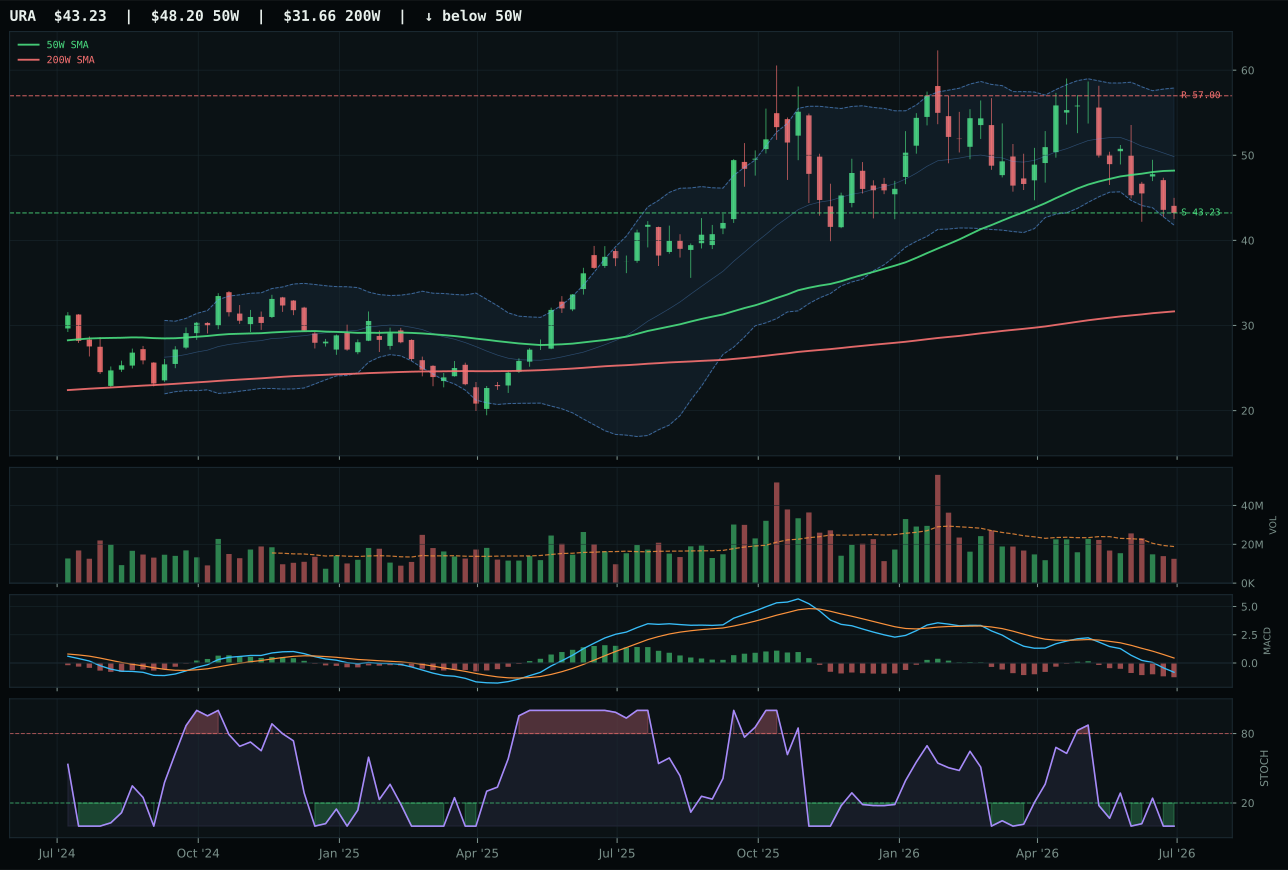
URA has a pullback into support profile with -25.2% 13-week relative strength versus SPY.
A failed hold above support would weaken the setup.
Actionable but governed by invalidation levels.
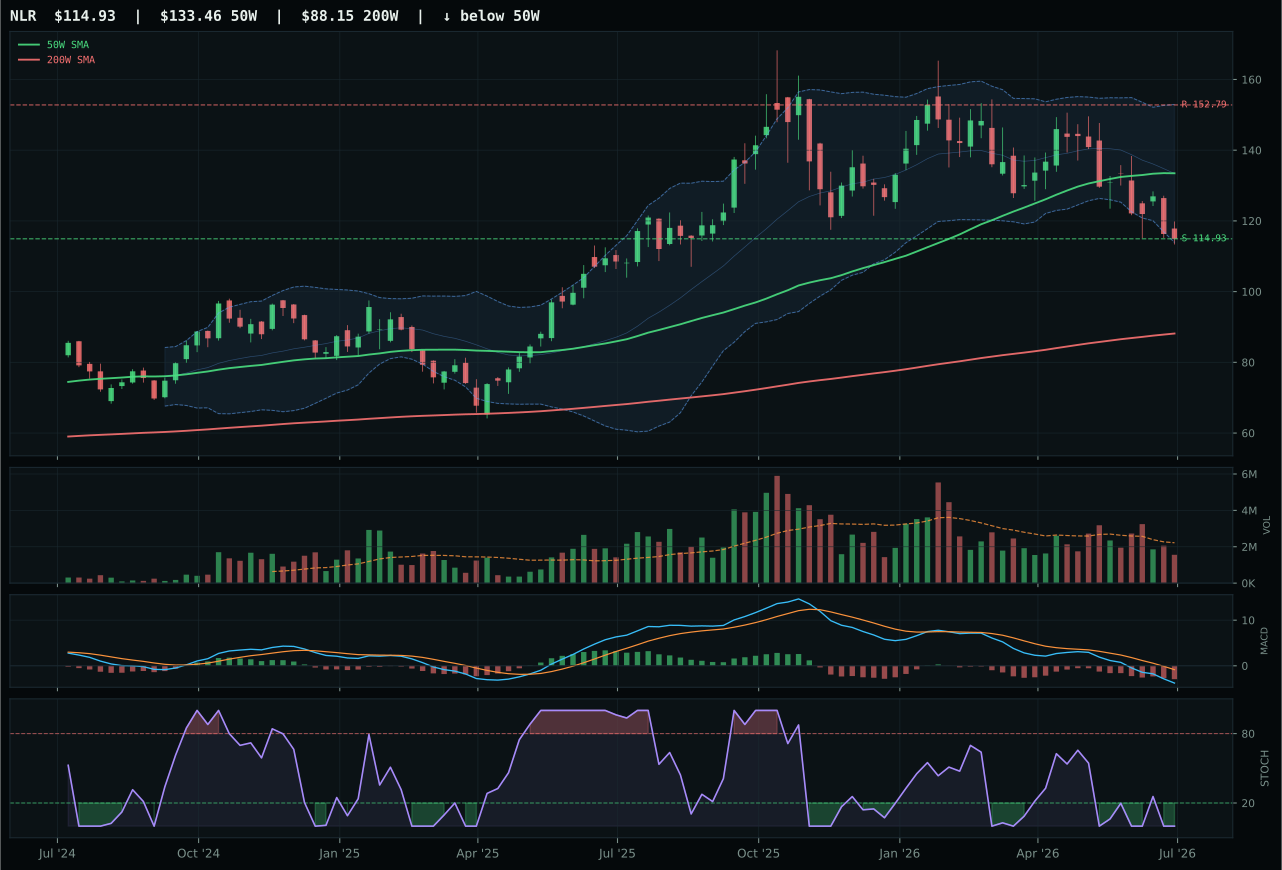
NLR has a pullback into support profile with -27.6% 13-week relative strength versus SPY.
A failed hold above support would weaken the setup.
Actionable but governed by invalidation levels.
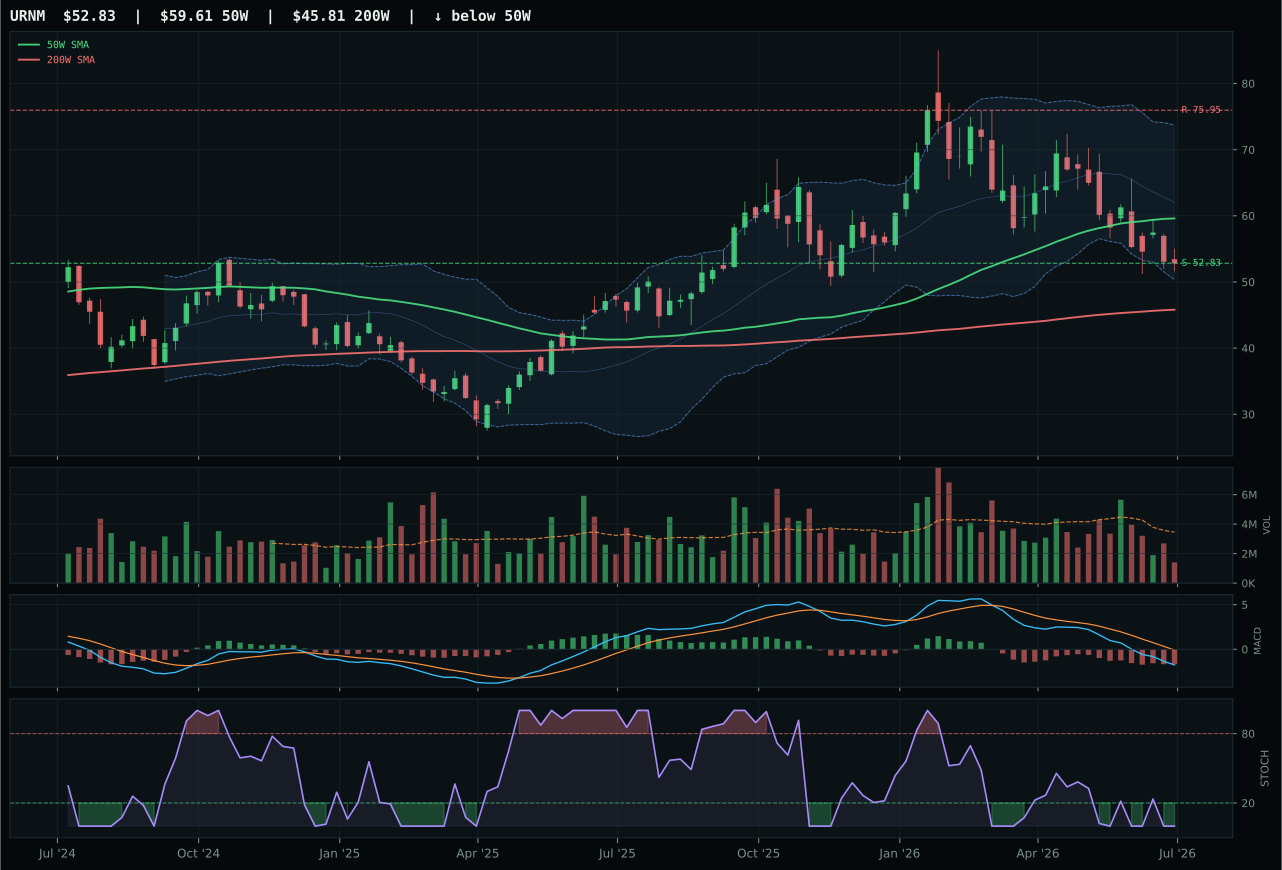
URNM has a pullback into support profile with -30.2% 13-week relative strength versus SPY.
A failed hold above support would weaken the setup.
Actionable but governed by invalidation levels.
URNM wins Nuclear Energy with a 35.0 score over URA (-11.4 points) by posting a marginally better blend of trend (52.0), structure (56.2), timing (60.0), and risk-reward (75.0), despite both ETFs being deep in repair mode—thirteen-week returns are -16.7% (URNM) and -11.6% (URA), MACD is bearish/weakening for both, stochastic RSI is oversold at 0.00 for URNM. The uranium-miner scarcity beta sits 11.4% below the 50-week moving average in pullback-into-support structure with support locked near 52.83 and resistance at 75.95, placing price in the near 52-week low / repair zone near Fibonacci 0.786. The setup offers defined downside risk (0.0% to support) but severely constrained upside (-30.4% to resistance), which makes this a floor-play rather than a growth bet. Volume is extremely thin at 0.41x average, and category-relative strength is negative (-2.7%), meaning uranium equities are out-of-favor even within the energy space. URA's pullback structure is comparable, but URNM's marginally tighter structure gave it the nod.
Nuclear Energy earned 10% allocation on energy scarcity (+9) and real asset sponsorship (+7) macro signals, even though the technical evidence collapsed to 0.0/100 for URNM—the lowest technical score among all winning ETFs. This allocation is pure macro conviction: you believe that energy security concerns will force a rerating of nuclear capacity, and that today's uranium miners represent an asymmetric payoff into that thesis. The allocation is not sized for near-term trading; it is a three-to-five-year structural position. Do not trade around this holding; treat it as a venture bet that carries drawdown risk until the energy scarcity macro case is validated by price action. If stochastic RSI stays oversold and volume remains anemic beyond Q3 2026, reduce the position and redeploy to other macro hedges with better technical traction.
Precious Metals — GLD
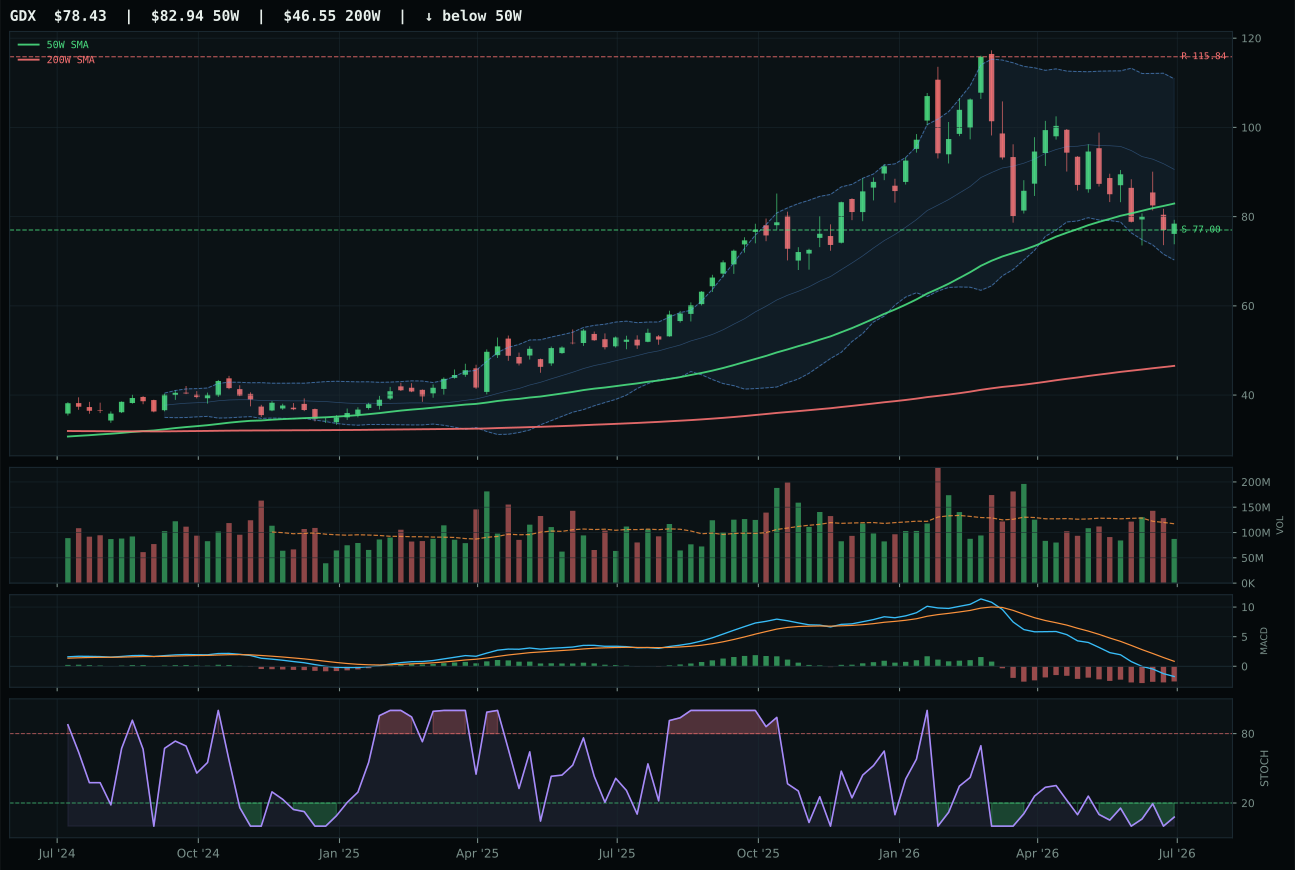
GDX has a pullback into support profile with -30.6% 13-week relative strength versus SPY.
A failed hold above support would weaken the setup.
Actionable but governed by invalidation levels.
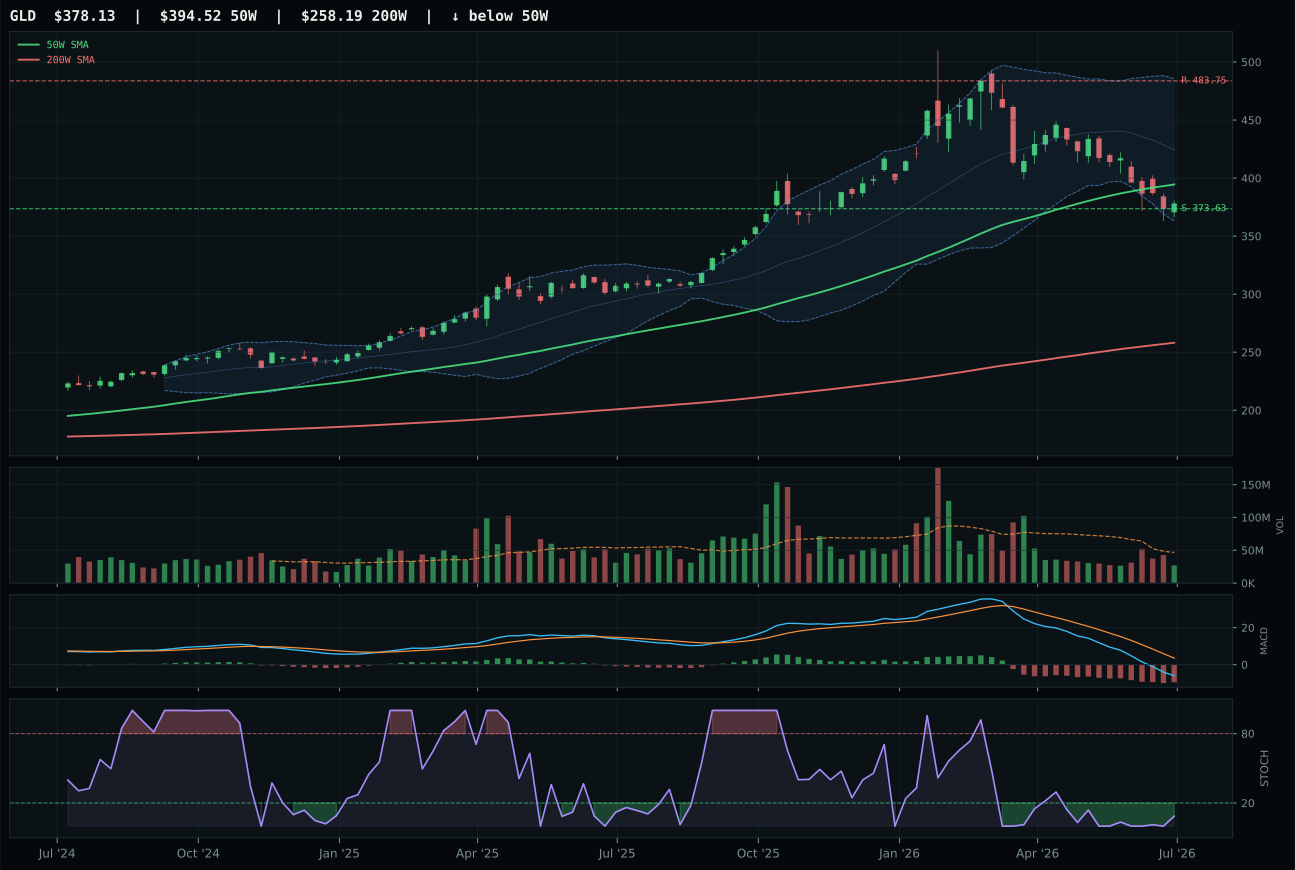
GLD has a pullback into support profile with -25.5% 13-week relative strength versus SPY.
A failed hold above support would weaken the setup.
Actionable but governed by invalidation levels.
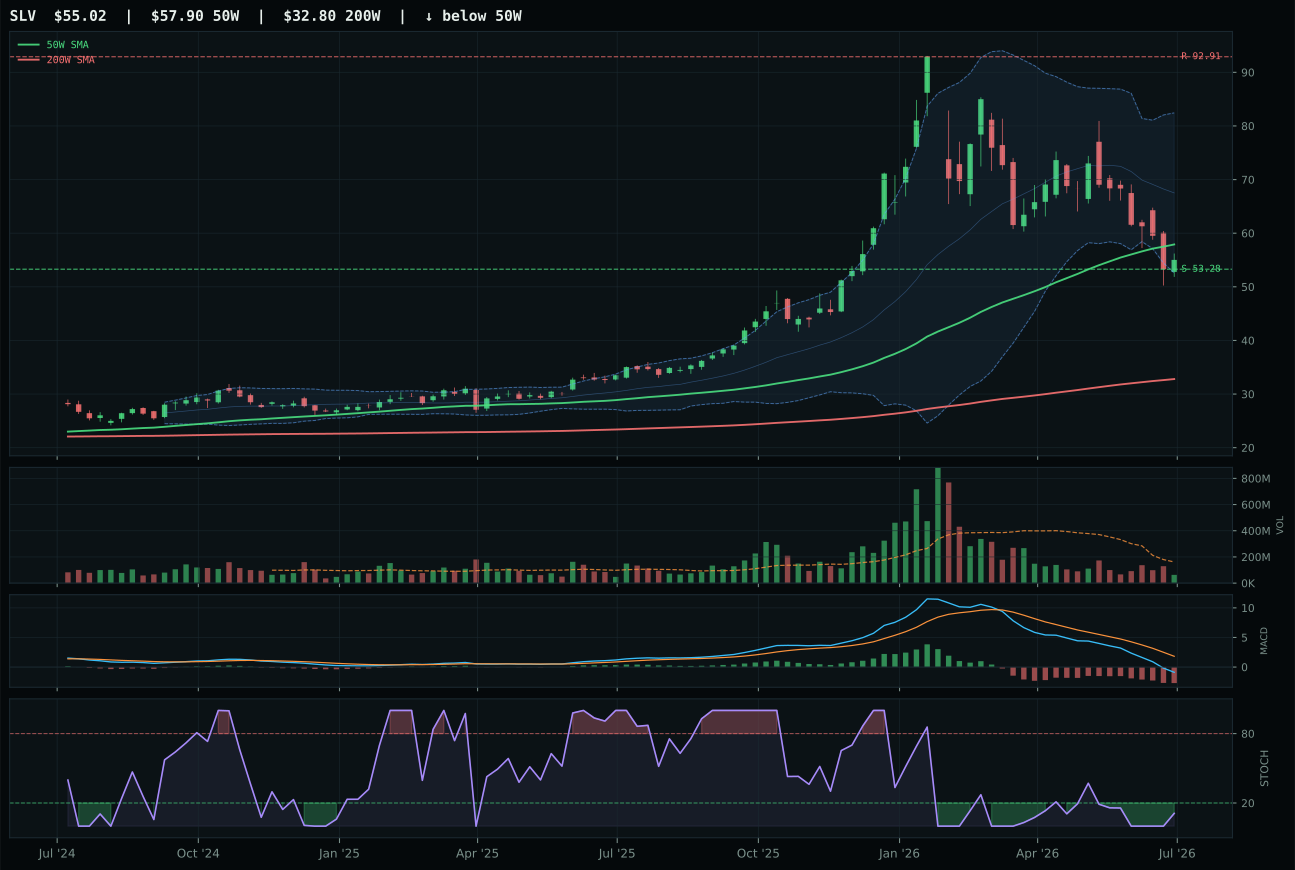
SLV has a pullback into support profile with -29.9% 13-week relative strength versus SPY.
A failed hold above support would weaken the setup.
Actionable but governed by invalidation levels.
GLD wins Precious Metals with a 34.7 category score and beats GDX (-4.8 points) by capturing superior risk-reward mathematics (98.0 vs 75.0)—the gold spot exposure sits 4.2% below the 50-week moving average in pullback-into-support structure with support near 373.63 and resistance at 483.75, yielding a tightly defined one-way bet. MACD is bearish/weakening, stochastic RSI is oversold turn-up at 0.09, and the Fibonacci location is deep retracement/value zone (0.618), meaning the chart has technically repaired enough to hint at value entry without requiring new conviction. The thirteen-week return is -11.9% and RS versus SPY is -25.5%, but that drawdown has compressed risk-reward to an asymmetric 98.0/100—downside to support is only 1.2%, while upside to resistance is -21.8% (unfavorable), but in a true panic the asymmetry reverses. GDX's leverage amplified the SPY underperformance (-30.6%) and structure noise, making it a worse vehicle for riding out the correction.
Precious Metals earned 10% as a diversifier in a Risk-Off Deterioration regime because macro fit (60.0/100) is solid—disinflation pressure (+6) and risk-off dynamics (+8) support gold as a hedge, even though technical evidence is anemic (30.0/100 for GLD). The allocation is a put-like position: you expect continued credit and liquidity stress, and gold is the clean monetary hedge when equities are impaired. Do not expect GLD to lead the portfolio during risk-off dislocation; expect it to provide ballast and act as a volatility dampener. The 10% slot reflects low conviction in immediate upside; it is sized to stabilize portfolio volatility, not to capture appreciation. Exit this position into any sustained rally in risk appetite, and build it only on fresh breakdown in the 50-week trend for equities.
Agriculture & Livestock — VEGI
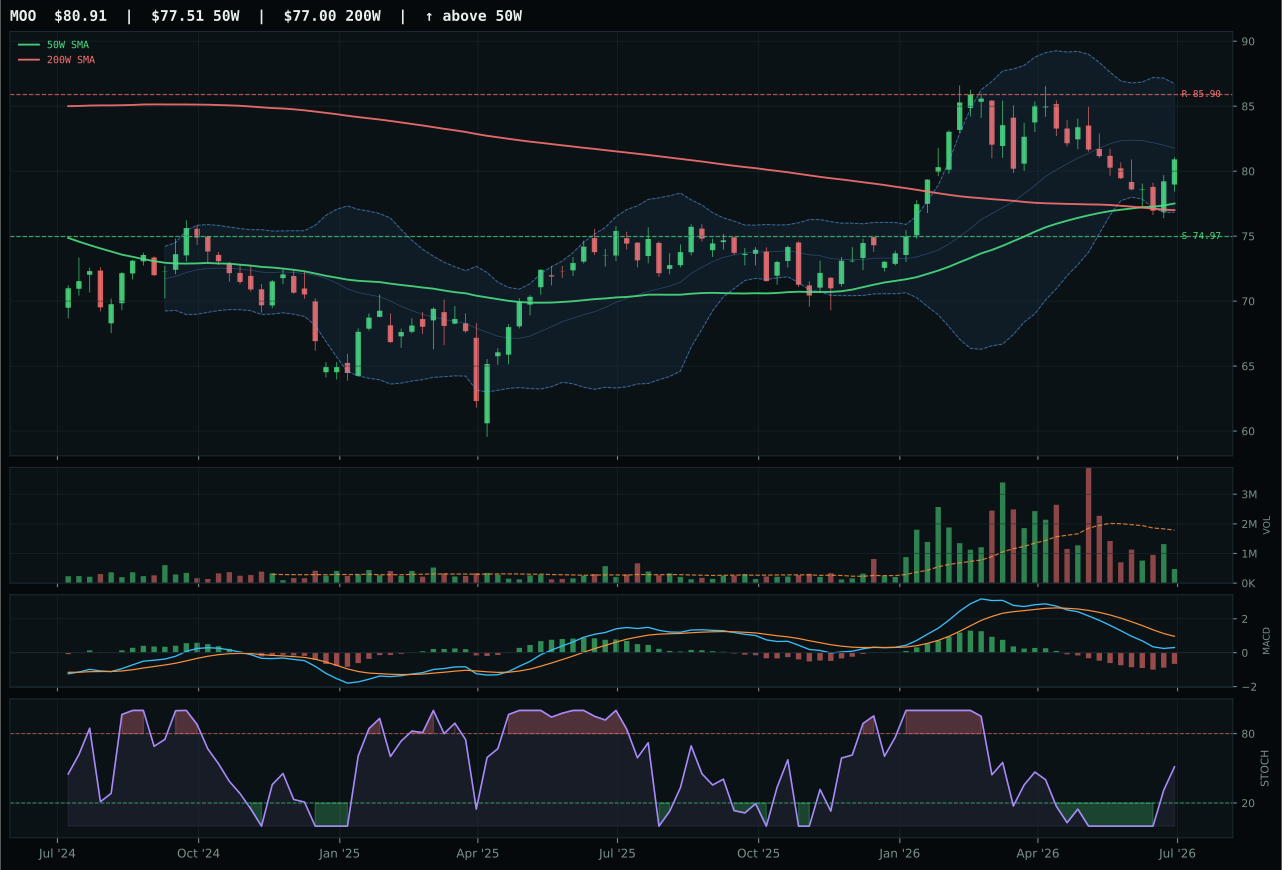
MOO has a neutral structure profile with -18.4% 13-week relative strength versus SPY.
A failed hold above support would weaken the setup.
Actionable but governed by invalidation levels.
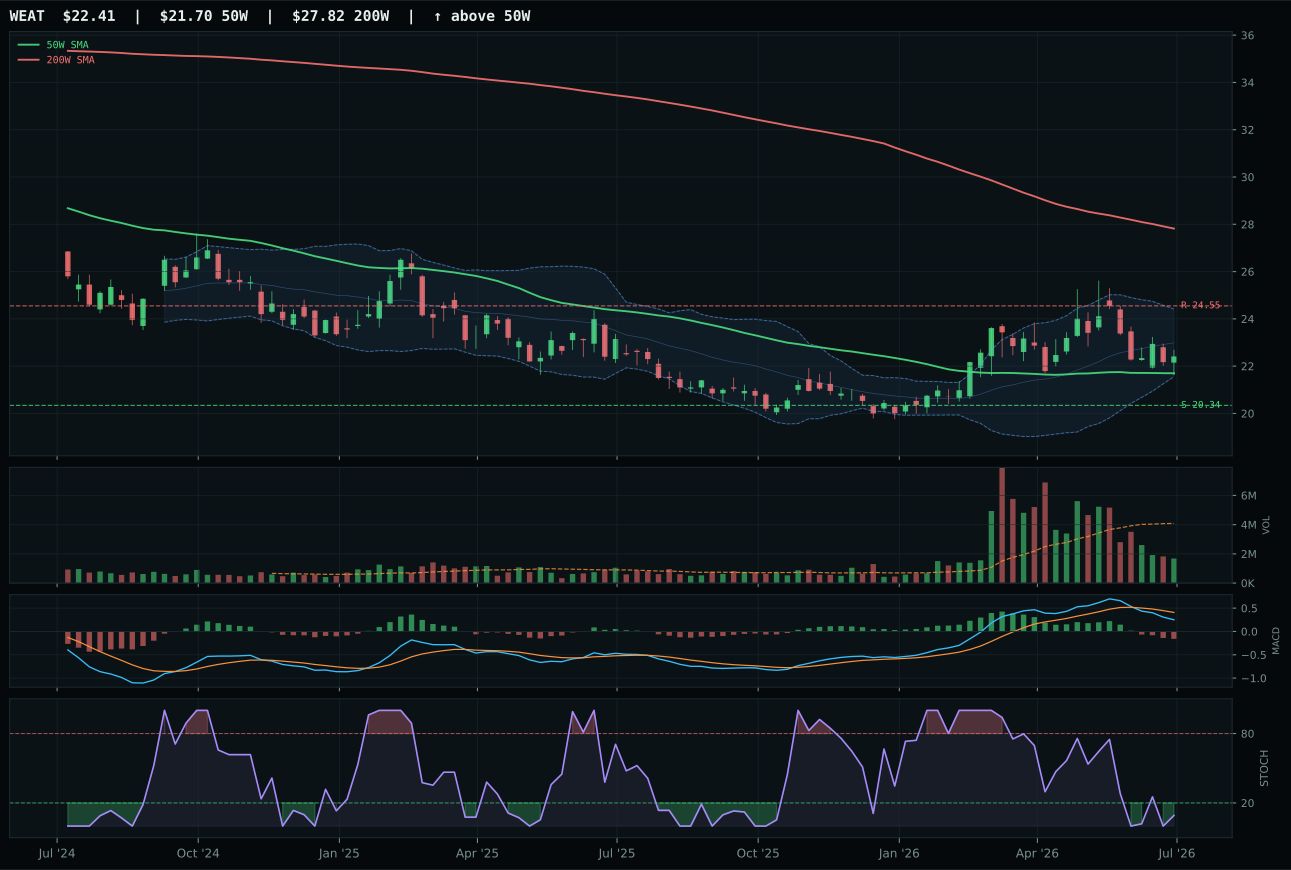
WEAT has a neutral structure profile with -15.6% 13-week relative strength versus SPY.
A failed hold above support would weaken the setup.
Actionable but governed by invalidation levels.
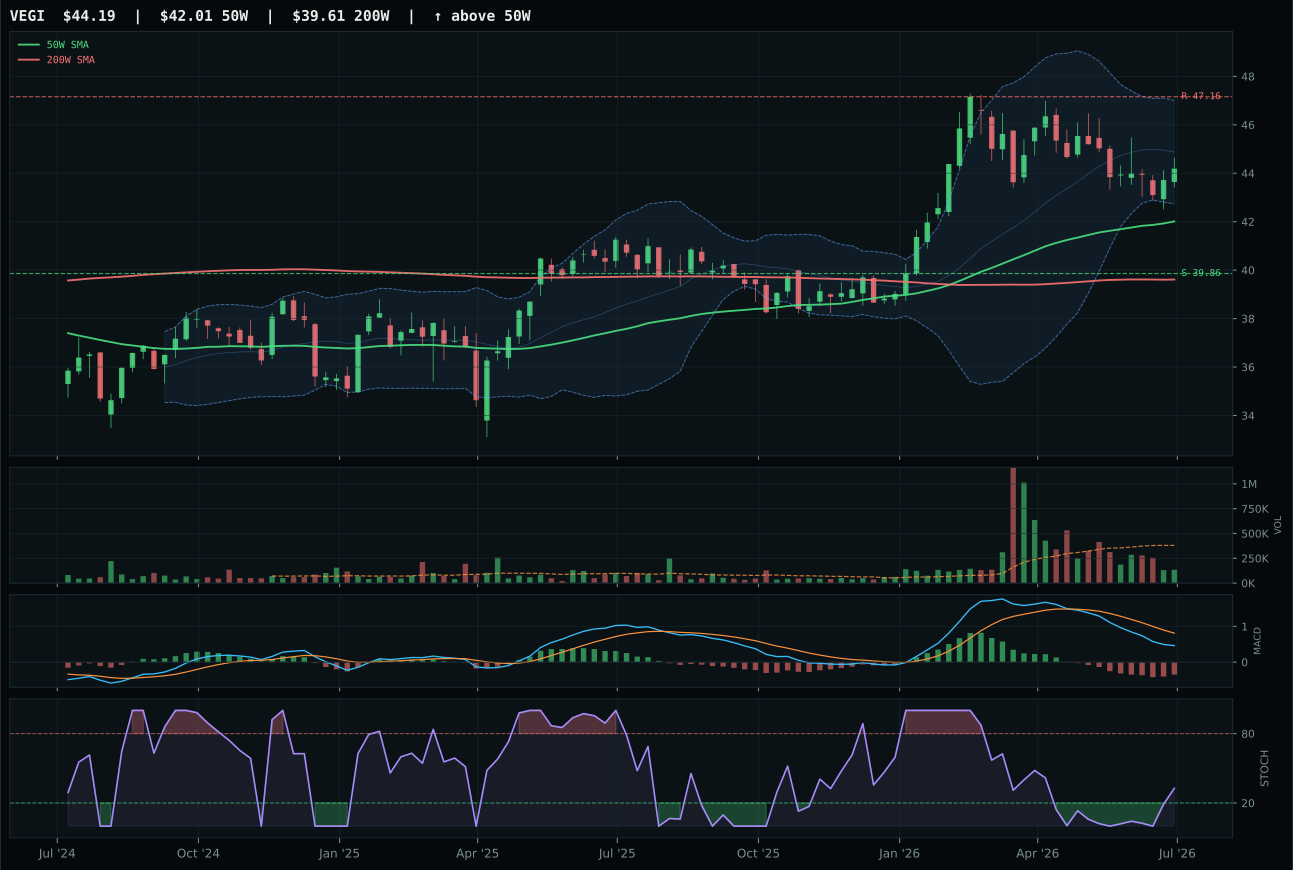
VEGI has a neutral structure profile with -17.2% 13-week relative strength versus SPY.
A failed hold above support would weaken the setup.
Actionable but governed by invalidation levels.
VEGI wins the agriculture category over MOO by a narrow 1.4-point gap, driven by better structure cleanliness (68.3 vs 63.5) and neutral category-relative strength (0.0% vs -1.2%), despite both ETFs being underwater on momentum—both show negative thirteen-week returns (-3.7% VEGI, -4.8% MOO), bearish MACD improving, and thin participation. VEGI's global agriculture producer breadth sits 5.2% above the 50-week moving average with excellent timing (83.0/100) and rising-mid-zone stochastic RSI (0.33), suggesting this chart is coiling for a potential long setup rather than rolling over further. The risk-reward is actually favorable at 55.4/100 (upside -6.3%, downside 10.9%), meaning the chart has defined its downside risk tightly near support, and MOO's inferior cleanliness score reflects noisier price action and less conviction in the setup structure. Neither ETF is a strength buy; both are mean-reversion candidates anchored to oversold conditions and commodity breadth positive macro support.
Agriculture earned 10% allocation despite the category score bottoming at 30.2 among all ten categories, driven entirely by macro fit (51.0/100) rather than technical evidence—the real asset sponsorship (+8), commodity breadth positive (+5), and metals scarcity signals provided enough narrative support to justify a slot in a risk-off regime. The technical evidence (54.7/100 for the winner VEGI) is weak, with zero momentum confirmation and heavy reliance on the chart's pullback into support near 39.86 to justify entry. This is a portfolio hedge allocation: you are betting that commodity breadth remains constructive and that oversold agricultural equities will participate in any rebound. Do not add to this position on strength; the case for holding it rests entirely on macro descriptor persistence, not on improving chart evidence.
Emerging Markets — ILF
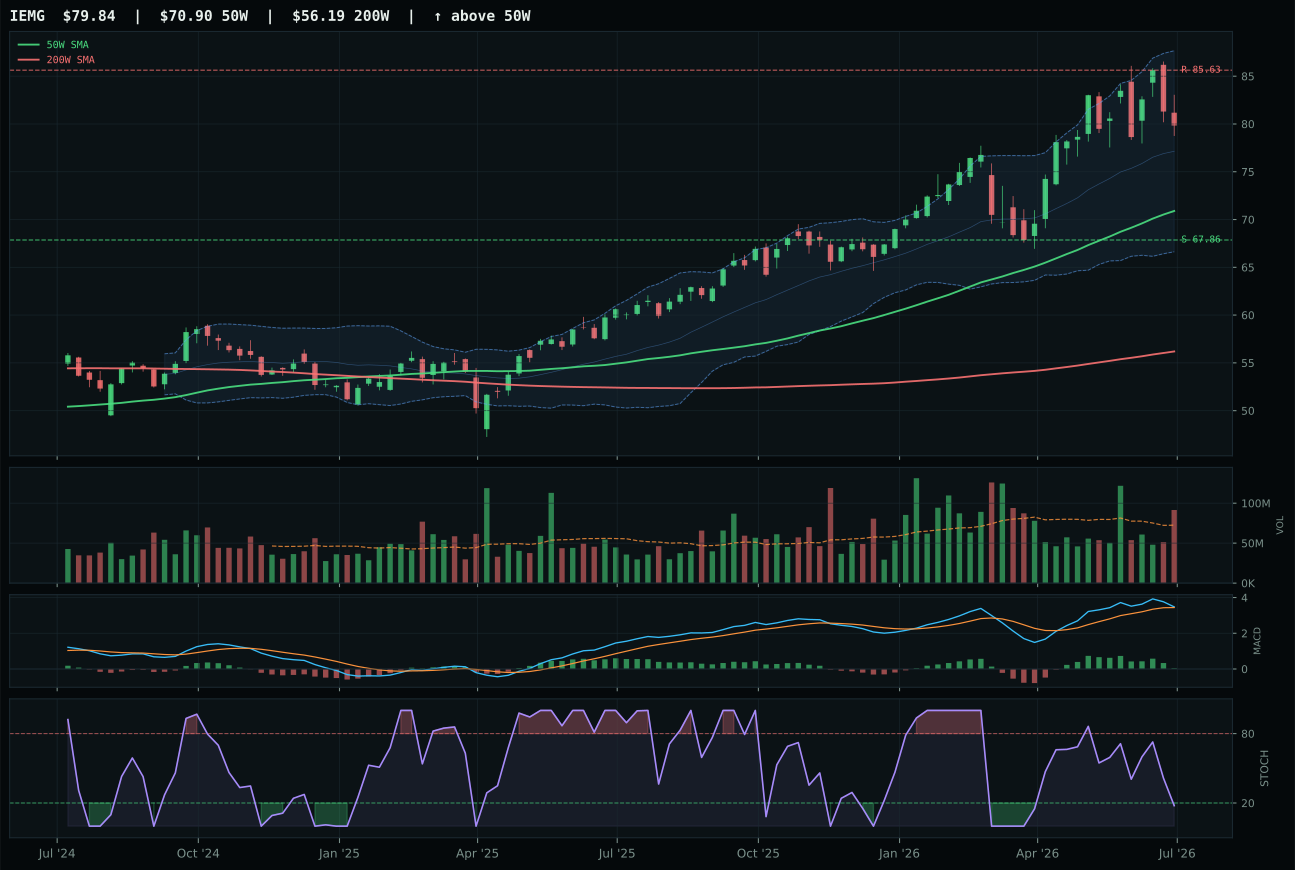
IEMG has a neutral structure profile with 1.2% 13-week relative strength versus SPY.
A failed hold above support would weaken the setup.
Actionable but governed by invalidation levels.
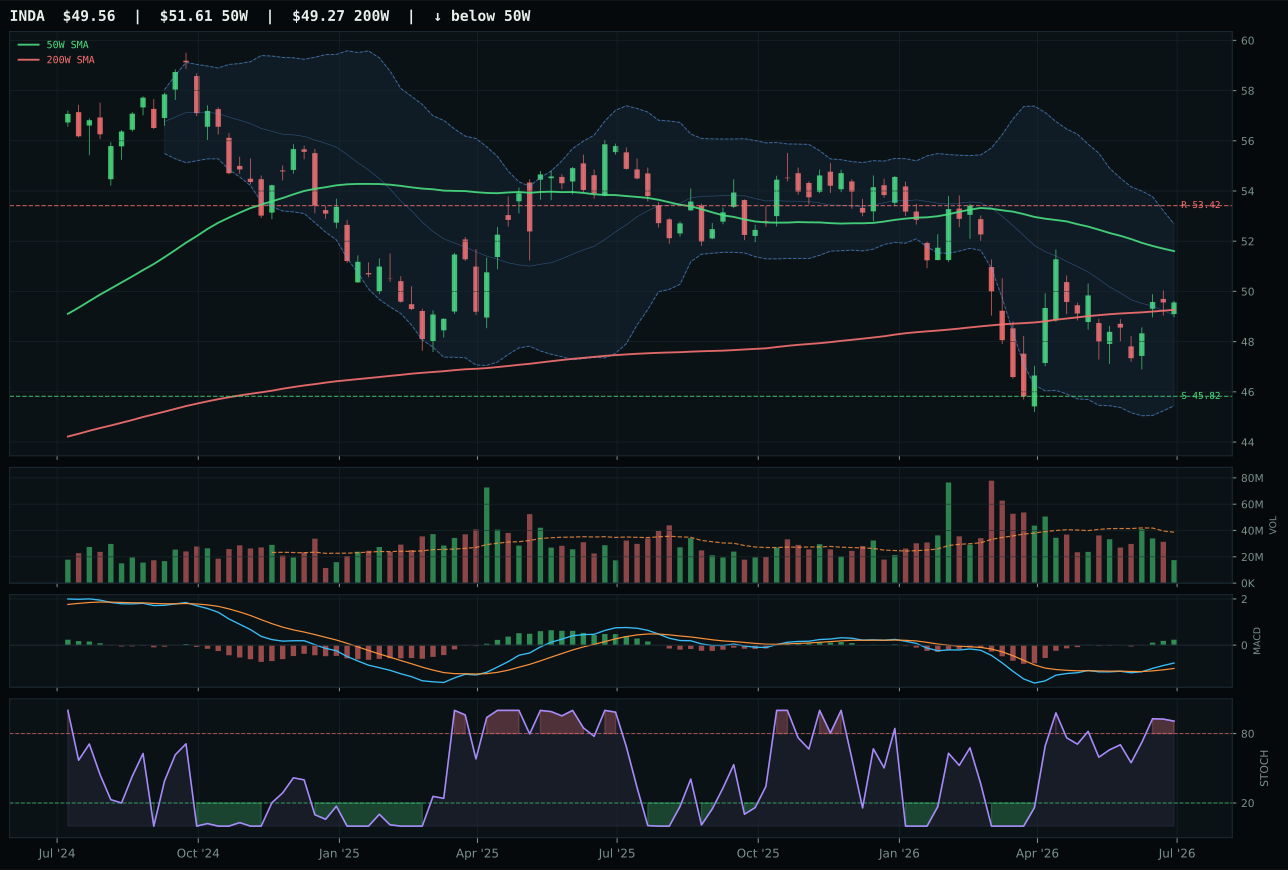
INDA has a neutral structure profile with -7.3% 13-week relative strength versus SPY.
A failed hold above support would weaken the setup.
Actionable but governed by invalidation levels.
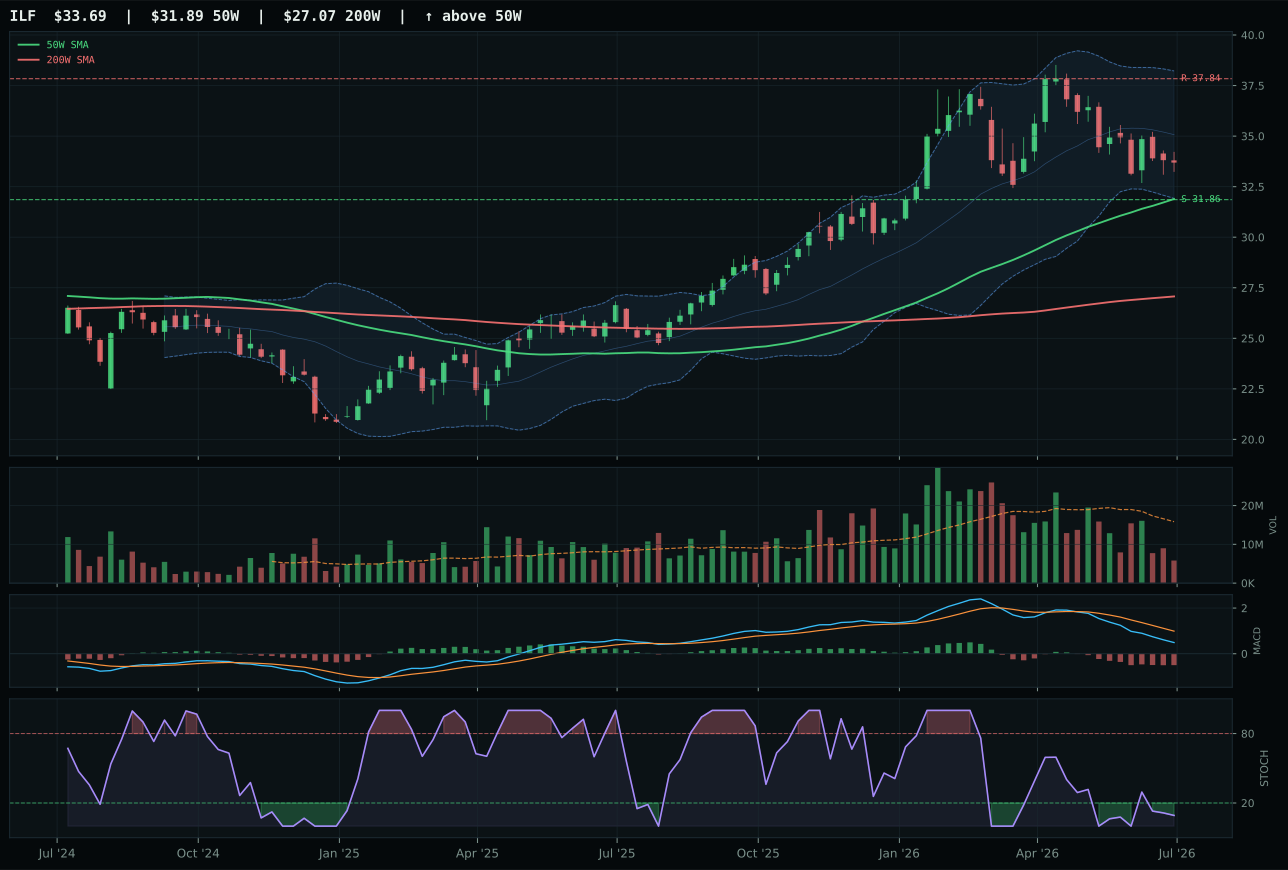
ILF has a neutral structure profile with -19.0% 13-week relative strength versus SPY.
A failed hold above support would weaken the setup.
Actionable but governed by invalidation levels.
ILF wins Emerging Markets with a 27.1 category score over IEMG (-17.3 points) by offering superior timing (75.0 vs 70.0), risk-reward (79.4 vs 51.9), and slightly better category-relative strength (-11.7% vs -8.5% underperformance), despite being the weaker technical performer overall. The Latin America commodity and value beta sits 5.6% above the 50-week moving average in neutral structure with stochastic RSI oversold at 0.09, MACD bearish but improving, and price in the upper retracement/momentum zone near Fibonacci 0.382—the setup is tightly coiled with -6.3% upside to resistance and only 5.7% downside to support, offering defined risk geometry. The thirteen-week return is -5.4% with thin 0.37x volume and RS-19.0% versus SPY, but that weakness has compressed entry risk and made ILF a higher-quality pullback candidate than IEMG's extended momentum position. IEMG's 14.8% thirteen-week return and above-average 82x volume looks bullish, but stretched valuation and positive risk-appetite context make it the wrong horse in a Risk-Off regime.
Emerging Markets scored 27.1, the lowest category score of the portfolio, yet earned 0% allocation, ranked outside the eight holdings. Even though ILF offered entry geometry advantages over IEMG, the entire category failed the allocator's threshold test due to category-level macro fit of only 34.0/100, driven by Risk-Off Deterioration penalty at -12 crushing any support from commodity and real-asset sponsorship. ILF's 43.2 technical evidence meant the allocation would rest entirely on macro descriptors that conflict with the regime. IEMG's strong technicals were rendered irrelevant because its 40.0 macro fit was structured to benefit from risk appetite recovery that the allocation committee does not expect in the near term. The exclusion is decisive: credit stress, liquidity stress, and risk-off deterioration are active now, and emerging markets suffer first in those environments. Any improvement in these three descriptors—either by fading credit stress or by increasing liquidity—would resurrect the category as a recovery play, but current positioning judges that opportunity as weeks or months away, not immediate.
Traditional Energy — XLE
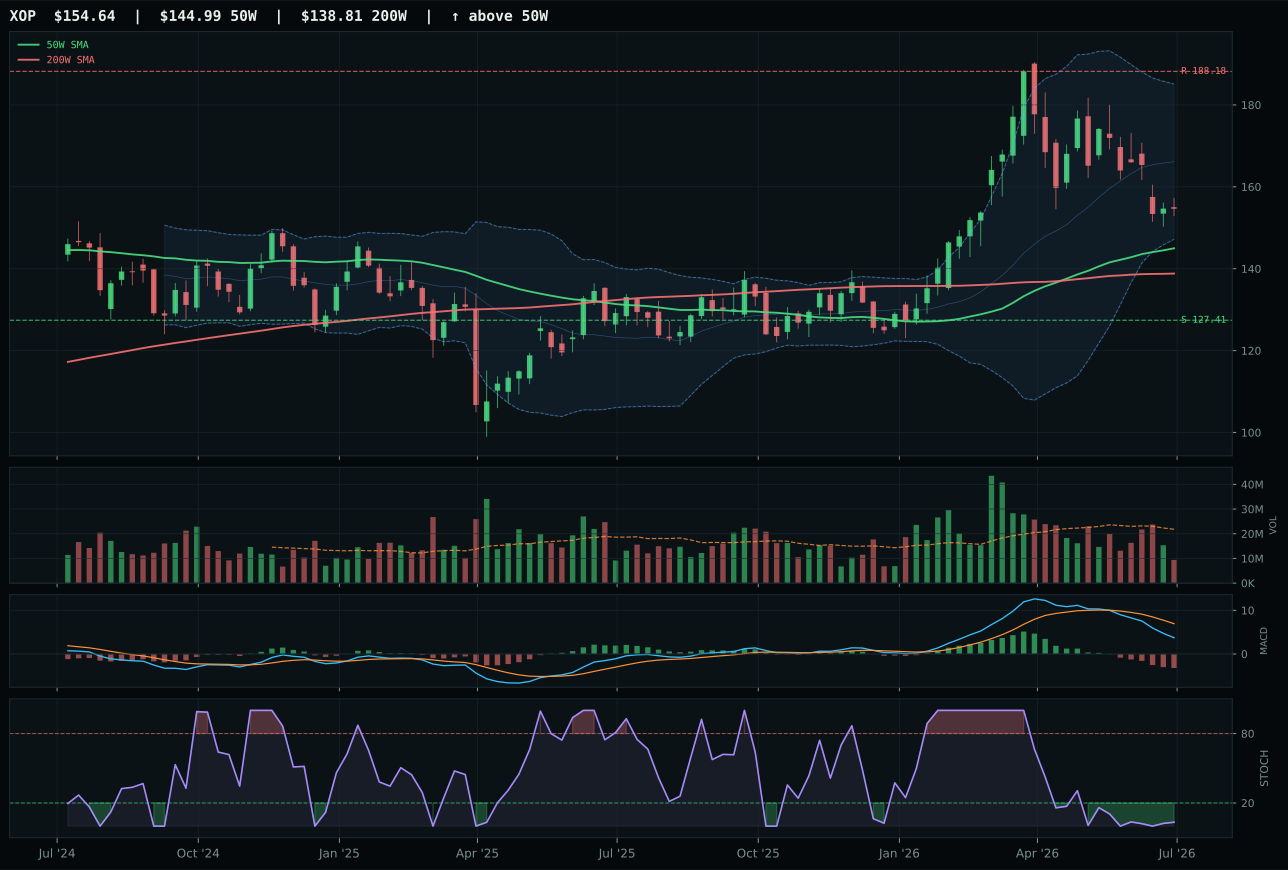
XOP has a neutral structure profile with -26.5% 13-week relative strength versus SPY.
A failed hold above support would weaken the setup.
Actionable but governed by invalidation levels.
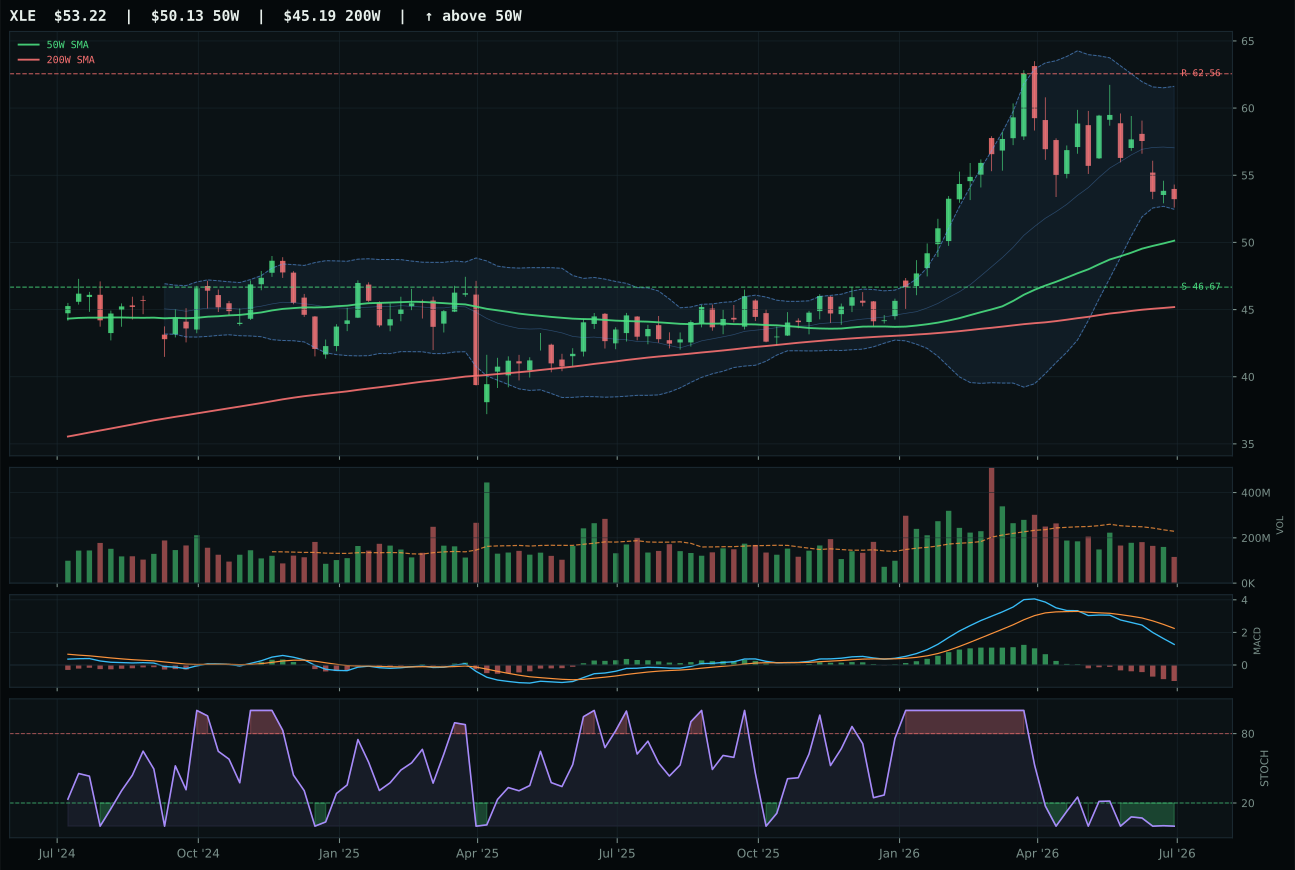
XLE has a neutral structure profile with -23.7% 13-week relative strength versus SPY.
A failed hold above support would weaken the setup.
Actionable but governed by invalidation levels.
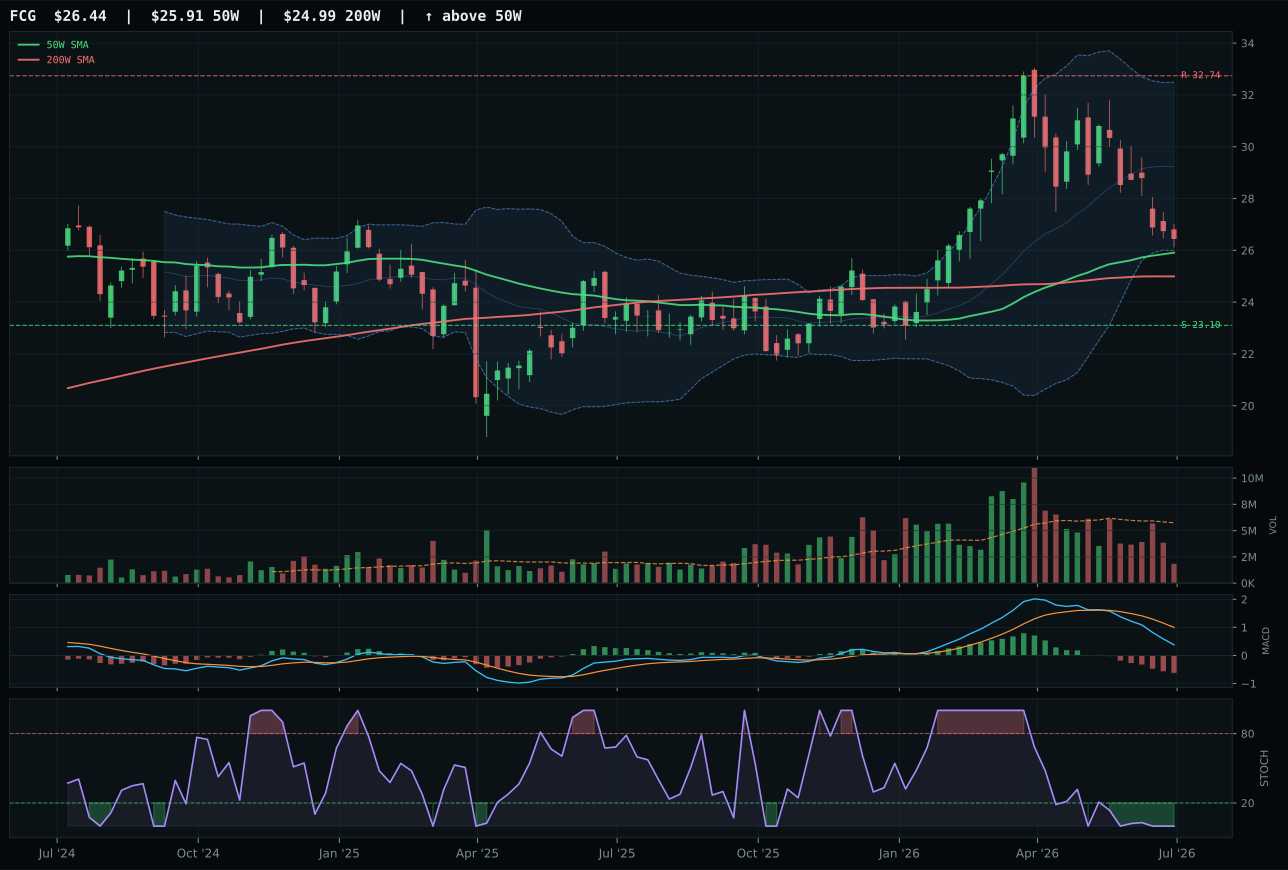
FCG has a compression near 50W profile with -28.7% 13-week relative strength versus SPY.
A failed hold above support would weaken the setup.
Actionable but governed by invalidation levels.
XLE wins the energy category with the lowest overall score (8.6) among all ten categories, edging XOP by just 0.8 points on superior risk-reward (72.2 vs 68.0), structure cleanliness (67.2 vs 63.3), and marginally better category-relative strength (2.8% vs 0.0%). The integrated energy cash-flow defense sits 6.2% above the 50-week moving average in neutral structure with MACD bearish/weakening, stochastic RSI at extreme oversold (0.00), and price near the Fibonacci 0.500 middle retracement zone—a textbook oversold reset with 14% downside to support and only -14.9% upside to resistance. The thirteen-week return is -10.2% with thin 0.50x volume participation and -23.7% RS versus SPY, meaning energy is deeply out of favor across both absolute and relative metrics. XOP's exploration beta (+91 timing score, early oversold turn-up on stochastic) offered some nuance, but XLE's integrated cash-flow generation and stable dividend support made it the safer vehicle in a regime where energy demand is questioned.
Traditional Energy scored a devastating 8.6 and earned 0% allocation, ranked firmly outside the portfolio despite energy scarcity descriptor active at +14 and real asset sponsorship at +5. The macro fit of 61.0/100 looked reasonable, but technical evidence for XLE was only 29.9/100, reflecting the brutal combination of negative momentum, thin participation, and bear-market MACD. Risk-Off Deterioration itself penalized energy exposure at -10, and the category's credit stress sensitivity created a toxic combination. The allocation committee explicitly excluded this category because it requires two things to work: (1) immediate risk-appetite recovery and (2) a sustained breakout above resistance at 62.56, neither of which shows conviction in current technical structure. Energy will return to portfolio only when momentum confirmation becomes positive or when macro risk shifts from deterioration toward stabilization. Current positioning reflects a judgment that energy equities are the last to recover in risk-off environments and the first to break on any renewed stress signal.