
2026-06-26
Informational purposes only. The content in this report, including allocations, analysis, and commentary, is provided solely for informational and educational purposes. It does not constitute financial advice, investment advice, trading advice, or any other type of advice. Past performance does not guarantee future results. Always conduct your own research and consult a qualified financial professional before making investment decisions.
Weekly Allocation
| Ticker | Category | Weight | Role |
|---|---|---|---|
| CIBR | Technology | 20% | Top-2 (20%) |
| ITA | Defense & Aerospace | 20% | Top-2 (20%) |
| XLU | Utilities & Infrastructure | 10% | Tier-2 (10%) |
| SMH | AI | 10% | Tier-2 (10%) |
| COPX | Industrial Metals | 10% | Tier-2 (10%) |
| ILF | Emerging Markets | 10% | Tier-2 (10%) |
| GLD | Precious Metals | 10% | Tier-2 (10%) |
| NLR | Nuclear Energy | 10% | Tier-2 (10%) |
Trade Instructions — Monday Open
Sell the tranche from 2026-05-29 (completing its 4-week hold). Buy the new tranche. Instructions show net portfolio changes — same-asset positions cancel, weight changes show the delta.
| Action | Ticker | Instruction |
|---|---|---|
| SELL | AIQ | Sell 50% of AIQ position (reduce 10.00% → 5.00%) |
| SELL | ROKT | Sell entire ROKT position (2.50% of portfolio) |
| SELL | XLE | Sell 33% of XLE position (reduce 7.50% → 5.00%) |
| SELL | MOO | Sell 25% of MOO position (reduce 10.00% → 7.50%) |
| SELL | PAVE | Sell 50% of PAVE position (reduce 5.00% → 2.50%) |
| BUY | SMH | Buy SMH — 16.67% of freed cash (adds 2.50% to portfolio) |
| BUY | ITA | Buy ITA — 33.33% of freed cash (adds 5.00% to portfolio) |
| BUY | XLU | Buy XLU — 16.67% of freed cash (adds 2.50% to portfolio) |
| BUY | ILF | Buy ILF — 16.67% of freed cash (adds 2.50% to portfolio) |
| BUY | GLD | Buy GLD — 16.67% of freed cash (adds 2.50% to portfolio) |
Current Portfolio After Trade
Combined holdings across all 4 active tranches. Each tranche is 25% of the portfolio.
| Ticker | % of Portfolio | Weight Bar |
|---|---|---|
| ITA | 17.50% | |
| SMH | 12.50% | |
| CIBR | 10.00% | |
| COPX | 10.00% | |
| MOO | 7.50% | |
| XLU | 7.50% | |
| XLE | 5.00% | |
| AIQ | 5.00% | |
| NLR | 5.00% | |
| ILF | 5.00% | |
| XLK | 5.00% | |
| PAVE | 2.50% | |
| URNM | 2.50% | |
| GDX | 2.50% | |
| GLD | 2.50% |
Macro Regime — Risk-Off Deterioration
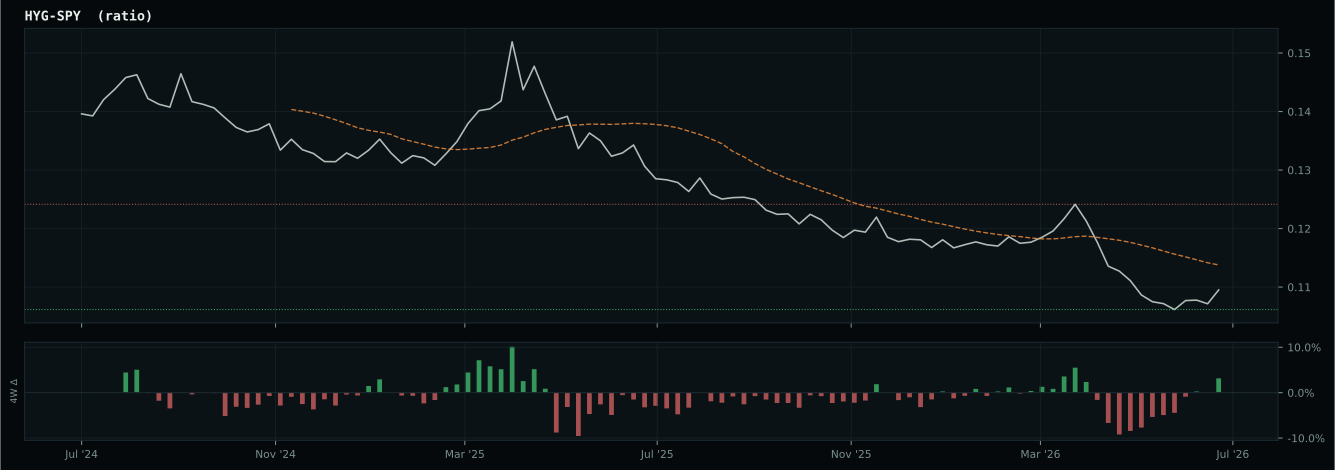
liquidity is improving but credit stress remains elevated
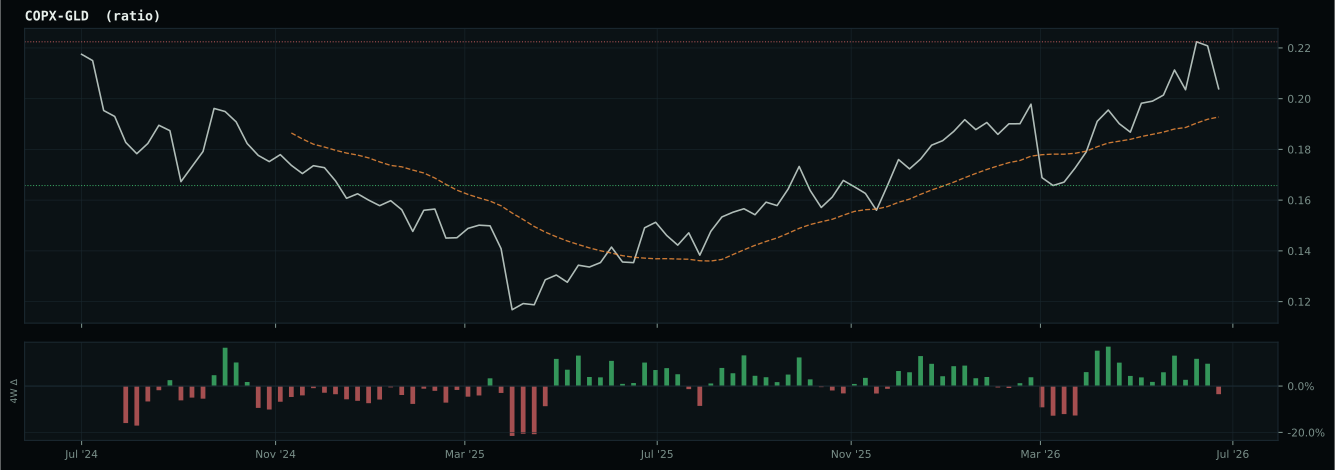
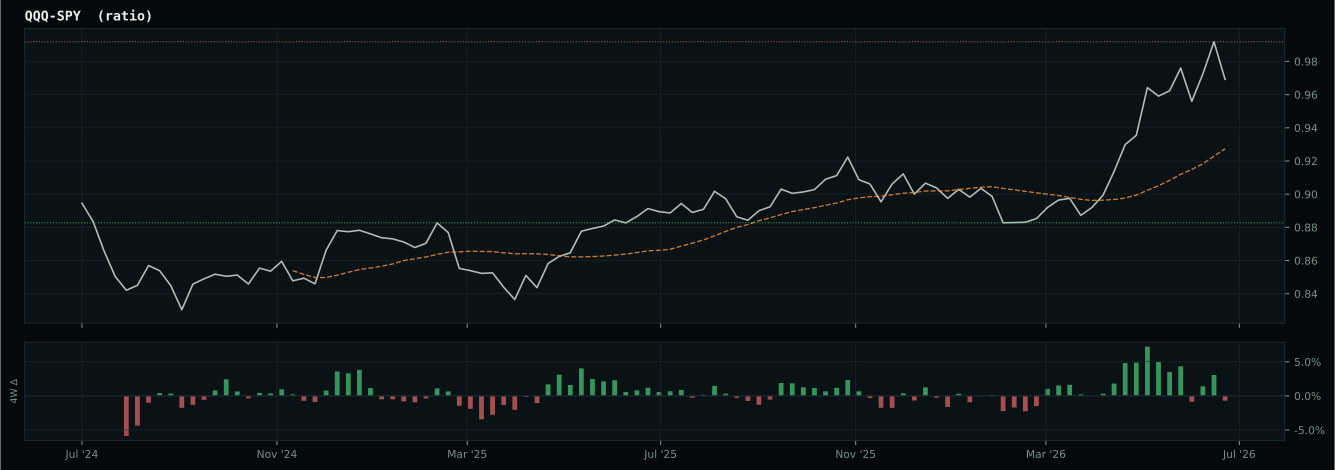
Macro Evidence Charts
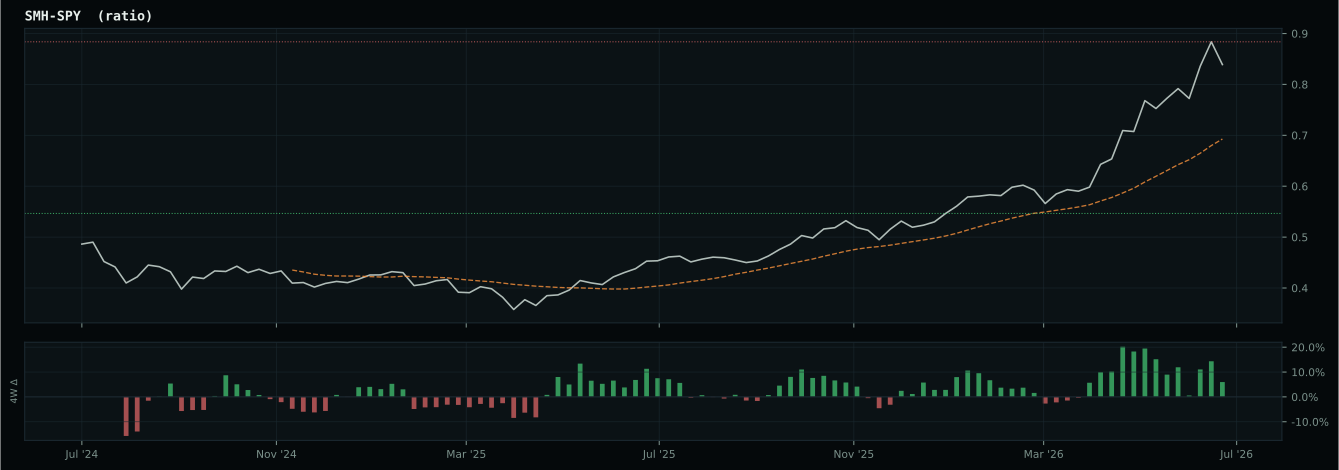
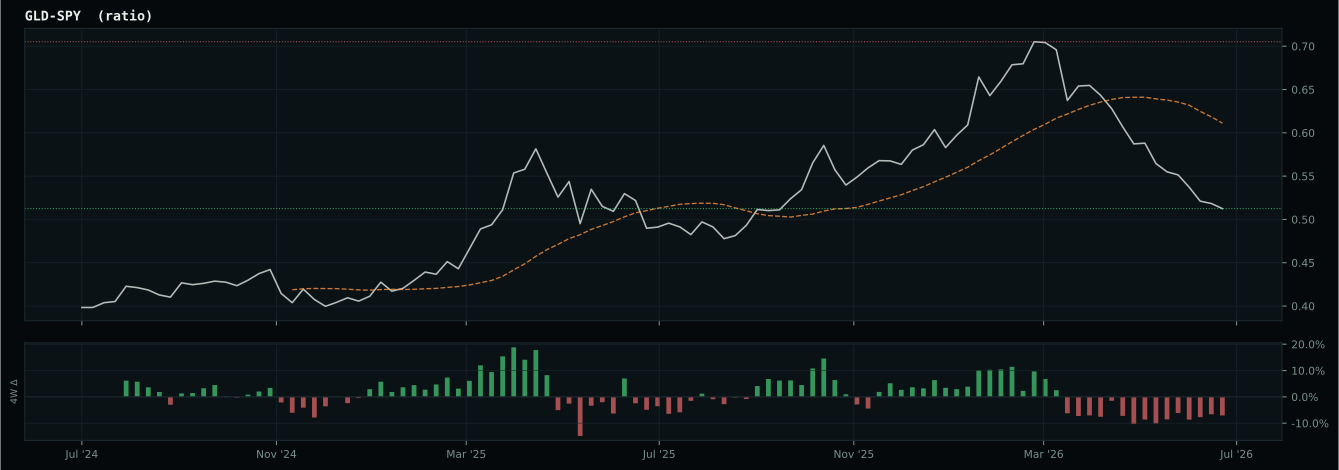
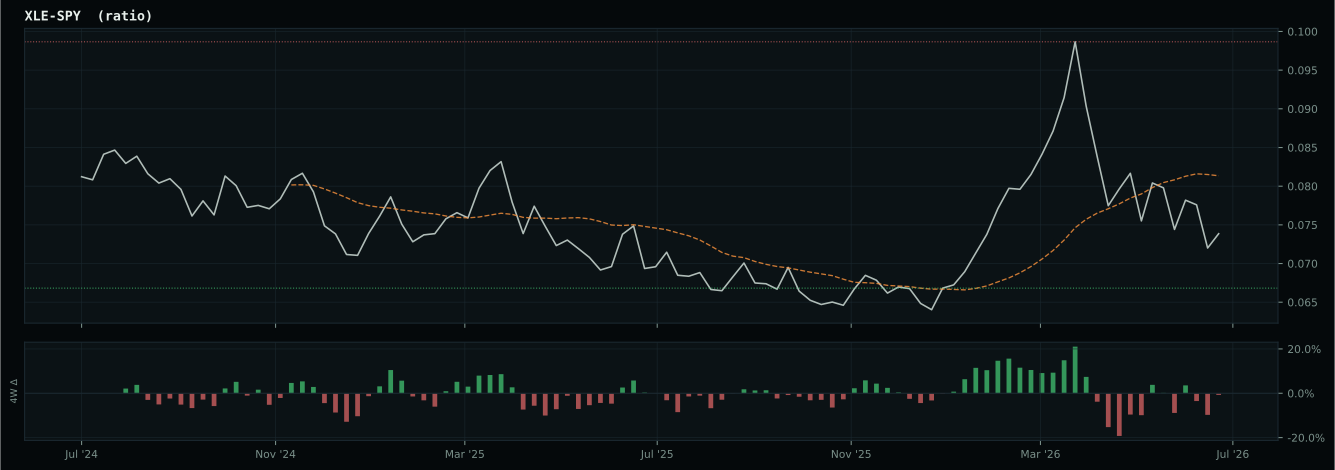
Market-implied signals behind the macro regime scores. Each ratio compares two assets; the direction and slope of the ratio is what the macro engine reads.
Crypto Regime — NoCrypto
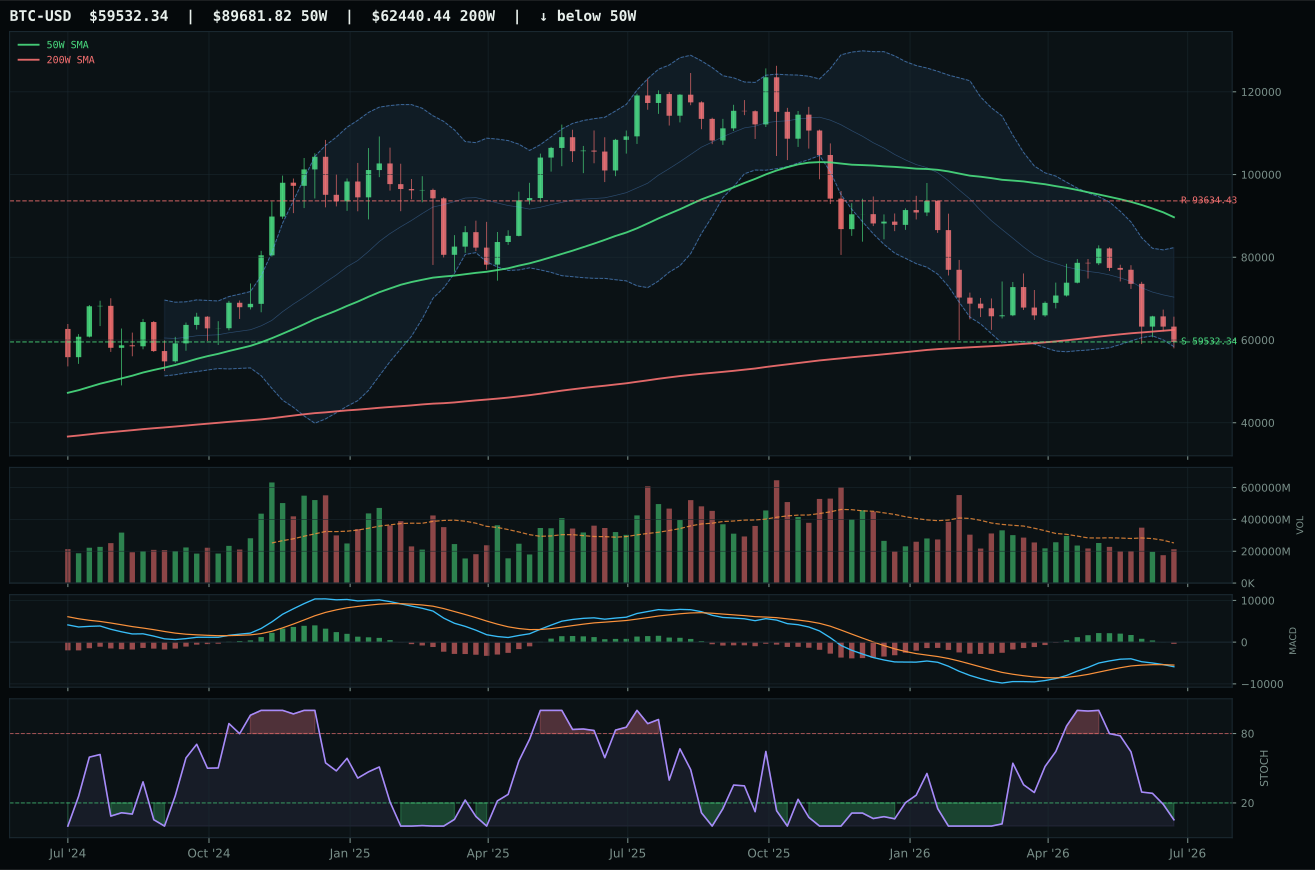
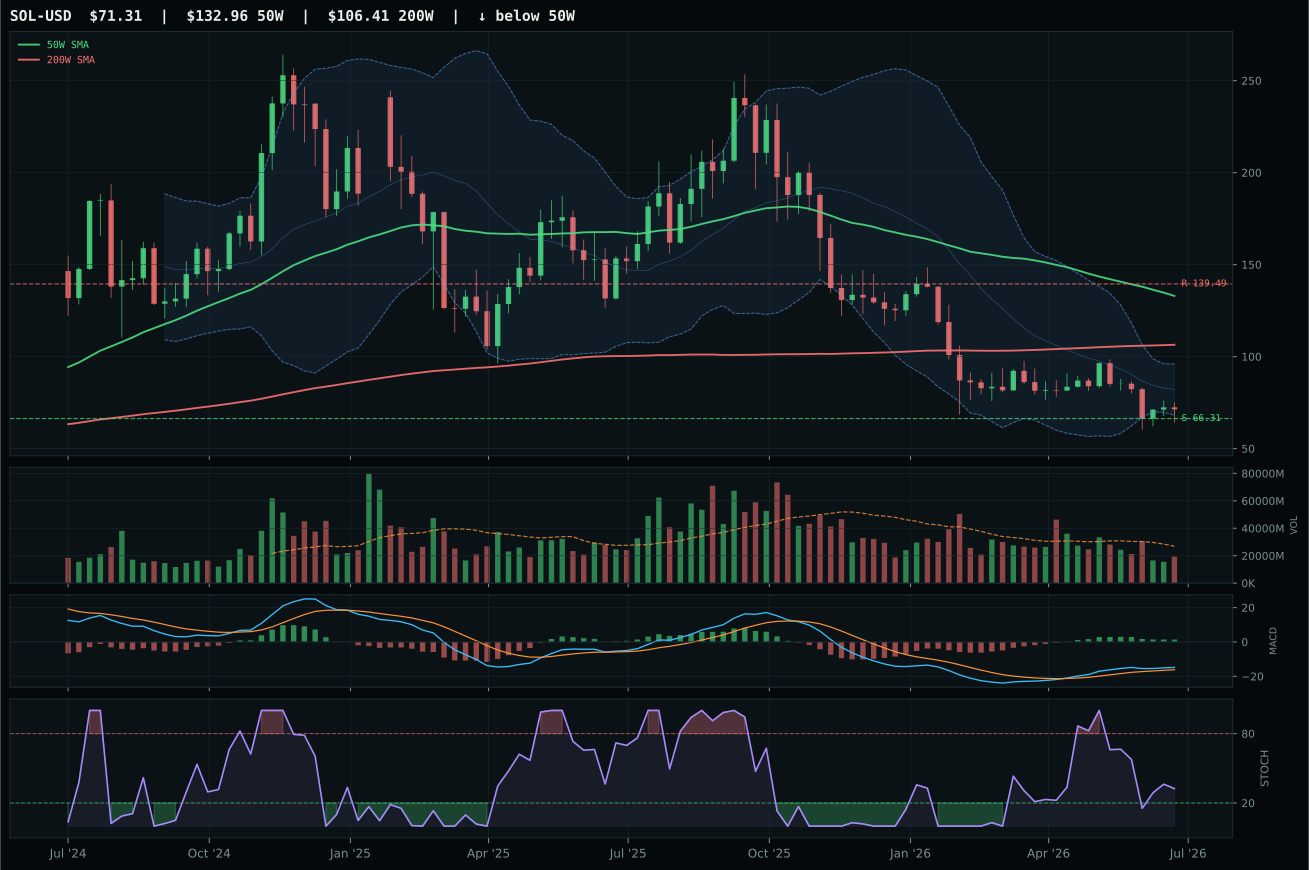
ValueBTC armed; waiting for 50W reclaim, decisive close above post-touch range resistance by 3%, close above 200W, breakout volume above 20W…
TrendBTC not confirmed
one or more available conditions failed
Category Rankings
| Rank | Category | Winner | Score | Alloc | 4W Ret | Peers (4W) |
|---|---|---|---|---|---|---|
| 1 | Technology | CIBR | 57.3 | 20% | +3.82% | XLK -2.9% · IGV +0.1% |
| 2 | Defense & Aerospace | ITA | 54.2 | 20% | +1.73% | XAR -1.4% · ROKT -0.9% |
| 3 | Utilities & Infrastructure | XLU | 53.9 | 10% | -0.15% | PAVE -1.1% · IGF +0.0% |
| 4 | AI | SMH | 48.3 | 10% | -7.98% | AIQ -7.0% · BOTZ -5.2% |
| 5 | Industrial Metals | COPX | 40.1 | 10% | +3.52% | PICK +0.3% · REMX -20.8% |
| 6 | Emerging Markets | ILF | 36.6 | 10% | +2.93% | IEMG -3.8% · INDA -0.8% |
| 7 | Precious Metals | GLD | 33.1 | 10% | +0.89% | GDX +0.1% · SLV +0.5% |
| 8 | Nuclear Energy | NLR | 31.8 | 10% | -6.62% | URA -8.2% · URNM -6.0% |
| 9 | Agriculture & Livestock | VEGI | 24.1 | 0% | +5.36% | MOO +5.5% · WEAT +13.0% |
| 10 | Traditional Energy | XLE | 0.1 | 0% | +8.21% | XOP +9.6% · FCG +6.2% |
Technology — CIBR
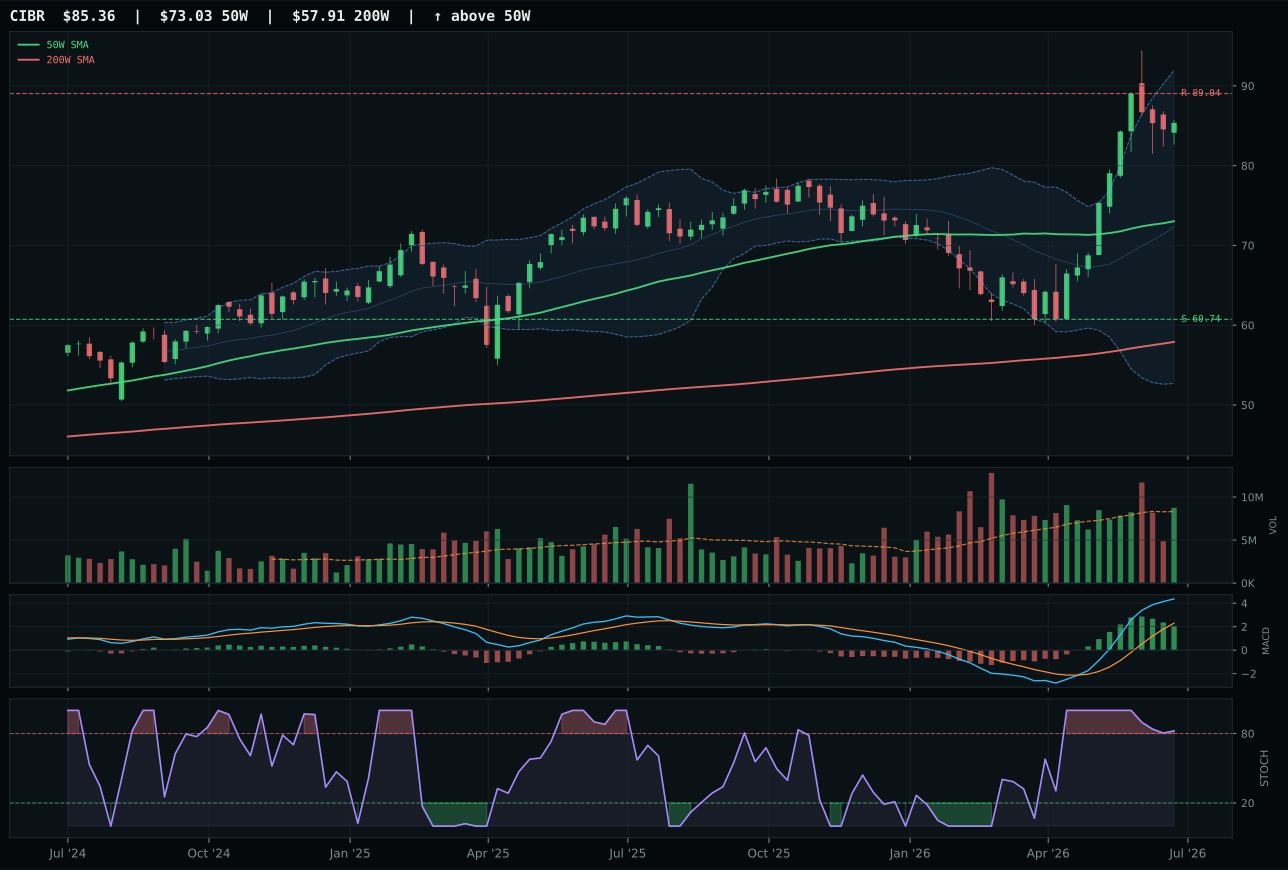
CIBR has a vertical extension profile with 25.5% 13-week relative strength versus SPY.
A failed hold above support would weaken the setup.
Actionable but governed by invalidation levels.
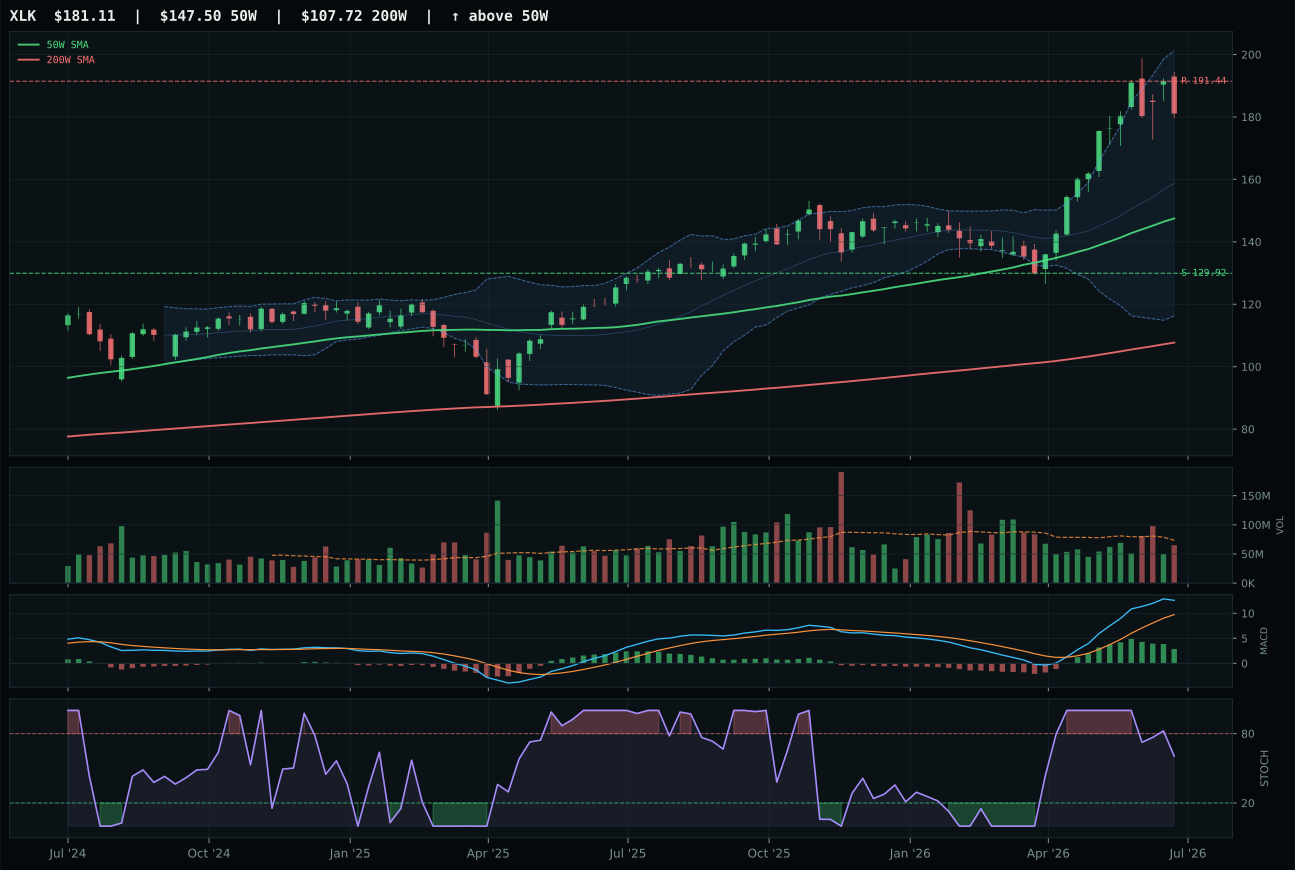
XLK has a vertical extension profile with 24.4% 13-week relative strength versus SPY.
A failed hold above support would weaken the setup.
Actionable but governed by invalidation levels.
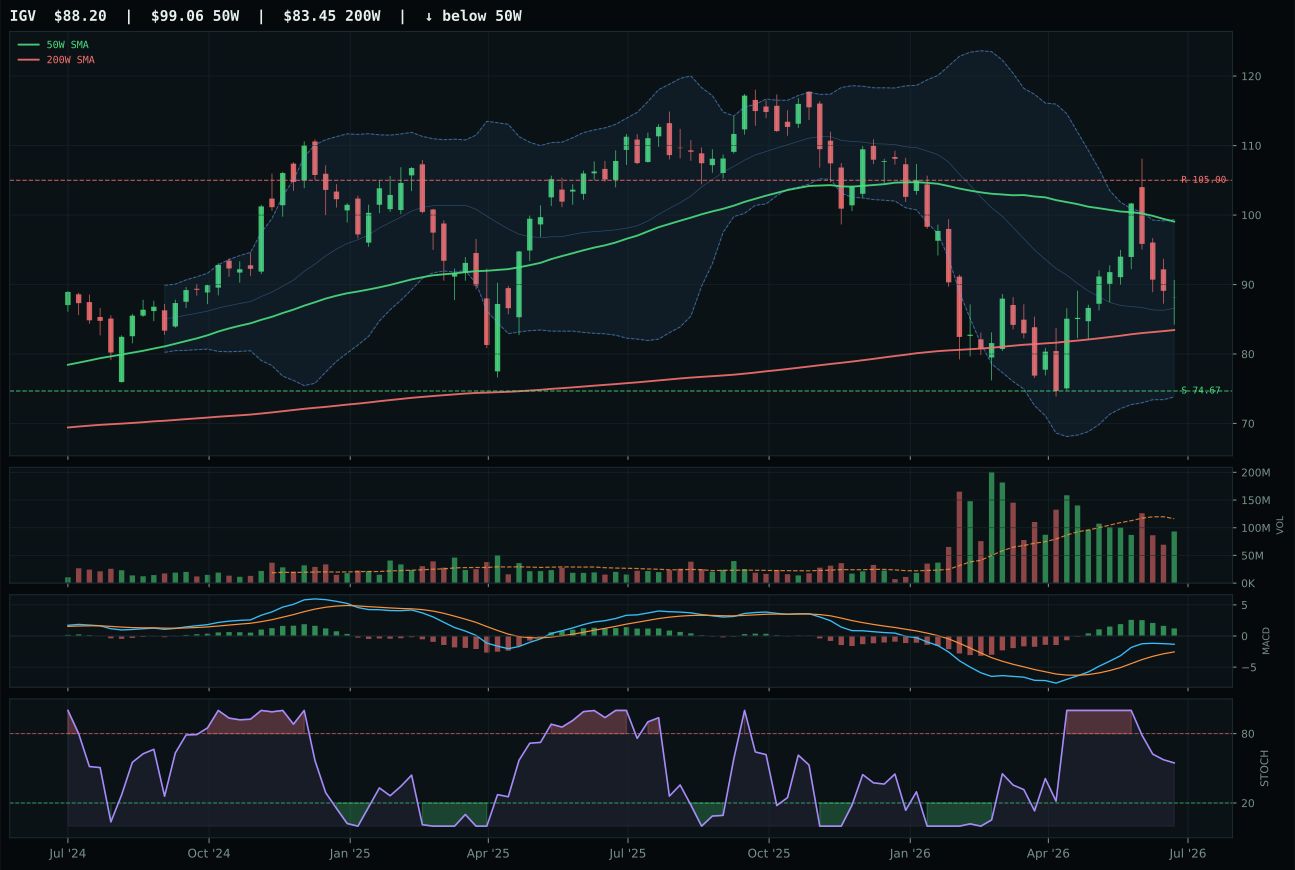
IGV has a neutral structure profile with -0.3% 13-week relative strength versus SPY.
A failed hold above support would weaken the setup.
Actionable but governed by invalidation levels.
CIBR edges XLK by maintaining tighter entry risk while preserving the same technical trend strength. Both sit in vertical extension with bullish-but-flattening MACD, but CIBR's 16.9% distance above the 50W versus XLK's 22.8% creates a meaningful timing advantage; every new dollar entering CIBR still has more room to the 50W pullback level. Category-relative strength tilts to CIBR at 1.1% versus XLK's 0.0%, a small but real signal of internal leadership within the three-ETF basket. Stochastic RSI overbought roll-over in both is identical, yet CIBR's neutral volume (1.05x) versus XLK's neutral volume (1.03x) shows marginally better participation confirmation. The 3.7-point gap in composite score reflects not a dominance but a cleaner setup: same momentum (both 100/100), same trend (both 100/100), but CIBR's structure score of 74.0 beats XLK's 70.5, and timing at 30.0 versus XLK's 48.0 is the trade-off the system accepts because entry risk is lower when every buyer is less extended.
Technology earned the co-top allocation (20%) because its 57.3 category score ranked second among all ten categories and delivered the rare combination of strong technical sponsorship with manageable macro headwinds. The macro regime of Risk-Off Deterioration typically punishes duration and growth, yet liquidity stress and credit stress active flags (-4 and -2 weighting) are offset by risk appetite positive and AI growth sponsorship both firing at +9 and +6 respectively. CIBR's 25.5% relative strength versus SPY proves the category is being accumulated despite macro deterioration; the market is making a selective bet on cybersecurity resilience through cycles. The portfolio cannot ignore a 40.5% thirteen-week return paired with 85.1% persistence—that's not a bounce but a sustained shift in fund flows. Commitment at 20% is justified because the risk-reward (46.8/100) is tight enough to exit cleanly if macro stress deepens, yet the volume-price confirmation (67.1/100) and persistence (85.1/100) suggest this money is sticky, not fleeting.
Defense & Aerospace — ITA
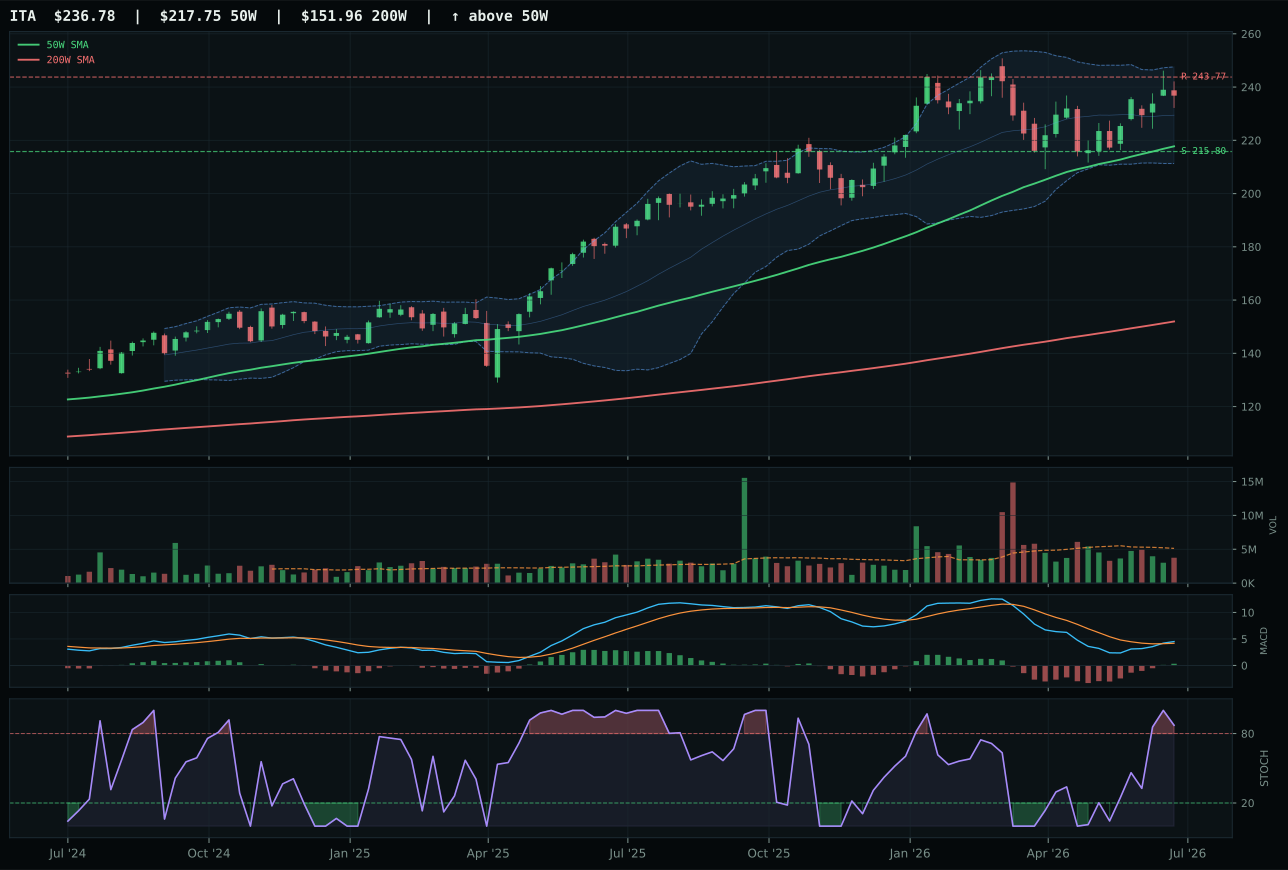
ITA has a neutral structure profile with -5.4% 13-week relative strength versus SPY.
A failed hold above support would weaken the setup.
Actionable but governed by invalidation levels.
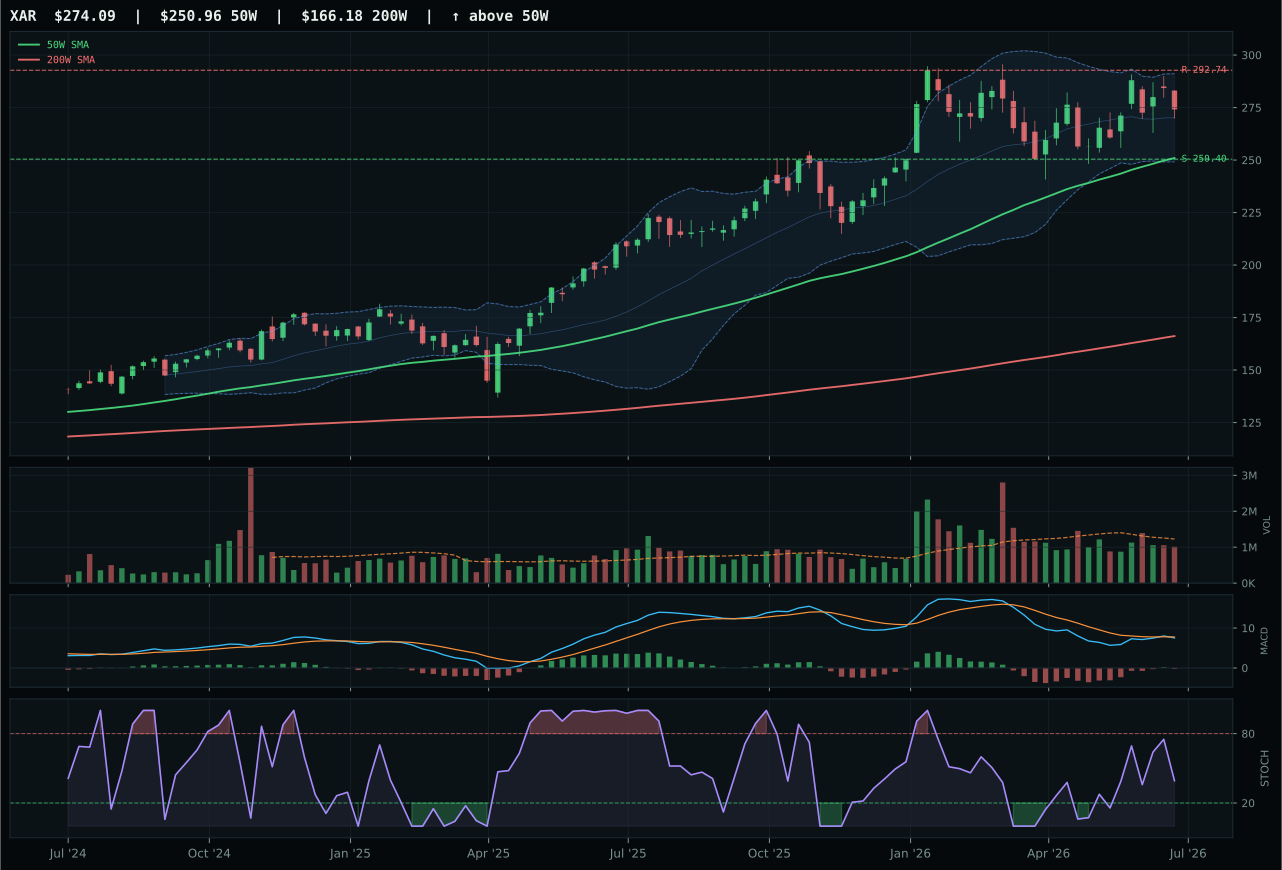
XAR has a neutral structure profile with -5.6% 13-week relative strength versus SPY.
A failed hold above support would weaken the setup.
Actionable but governed by invalidation levels.
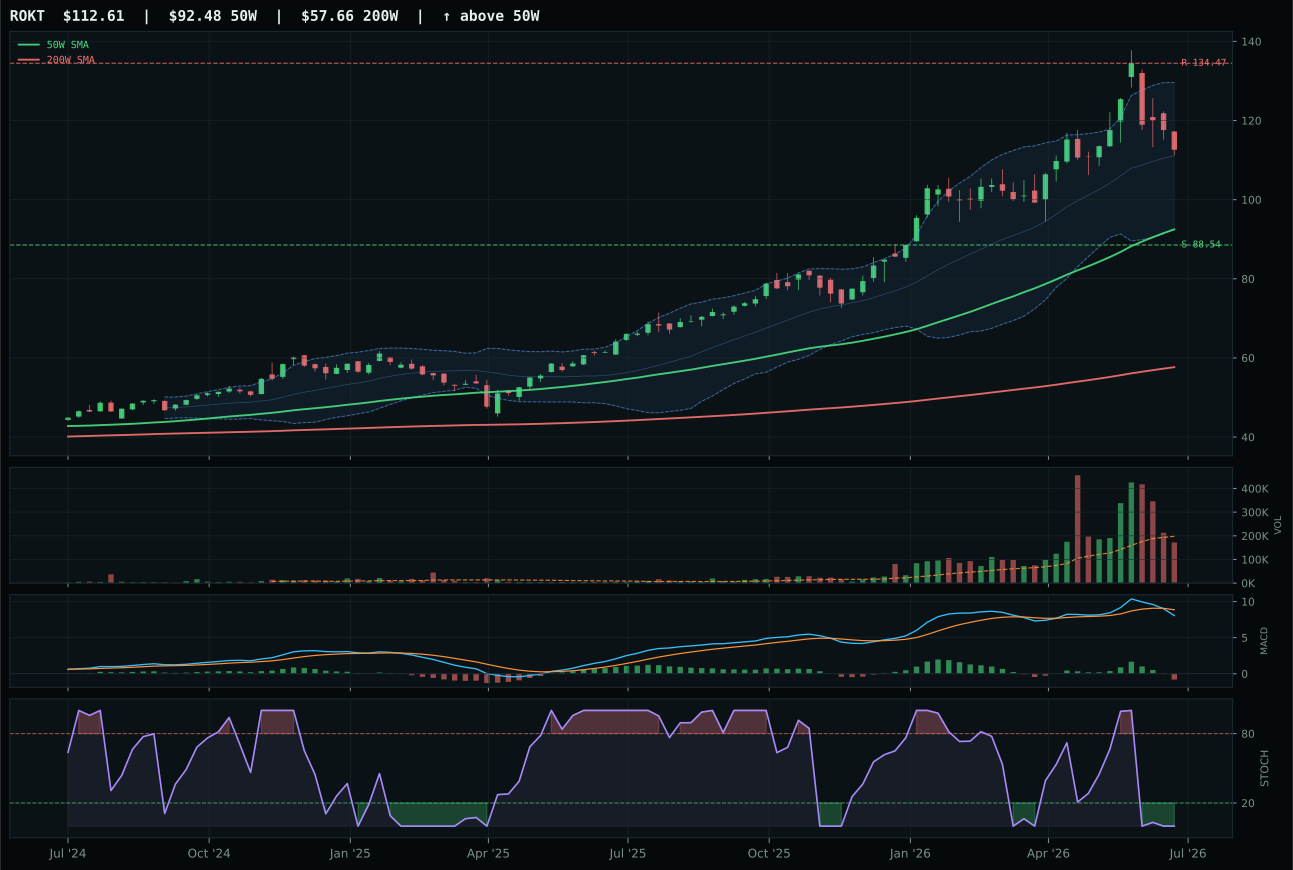
ROKT has a vertical extension profile with -1.5% 13-week relative strength versus SPY.
A failed hold above support would weaken the setup.
Actionable but governed by invalidation levels.
ITA beats XAR in a tightly matched decision where the separating factor is MACD confirmation and category-relative strength purity. Both sit above the 50W and 200W with neutral structure, but ITA's MACD is bullish and improving while XAR's is bearish but improving—a meaningful difference in momentum direction even if both are in early recovery. ITA's category-relative strength of 0.0% ties XAR's 0.0%, but ITA's stochastic RSI at overbought momentum (0.87) versus XAR's rising mid-zone (mid-0.50s) shows ITA has completed its initial move while XAR is still climbing. Structure scores are close (73.7 vs 71.7), but the 2.8-point gap in reasoned ETF proof order (65.7 vs 60.8) reflects ITA's technical cleanliness. Both show thin participation on volume (ITA 0.73x, XAR neutral), but ITA's bullish MACD inflection makes the thin volume less concerning—fewer shares needed to confirm when direction is turning up.
Defense & Aerospace claimed the co-top 20% slot because its 54.2 final score tied with Technology for second-highest category rank, and macro regime is offering a rare gift: Risk-Off Deterioration typically hurts equities, but defense benefits (+7 weighting) when credit stress (+2) and liquidity stress (-4 net) combine. The portfolio is taking a macro bet that geopolitical tension and fiscal support for military spending outlasts the near-term equity selloff. ITA's 9.6% thirteen-week return may appear modest versus CIBR's 40.5%, but in a Risk-Off regime, single-digit positive returns with tight volatility and defensive stoicism are worth double-digit momentum in extending markets. Volume-price confirmation (60.8/100) and persistence (63.2/100) are middling, yet persistence is stable, not deteriorating. The 2.9% upside to resistance and 9.7% downside to support create a favorable risk geometry—limited upside but defined stop, suitable for a top-2 allocation in a deteriorating regime where capital preservation matters as much as returns.
Utilities & Infrastructure — XLU
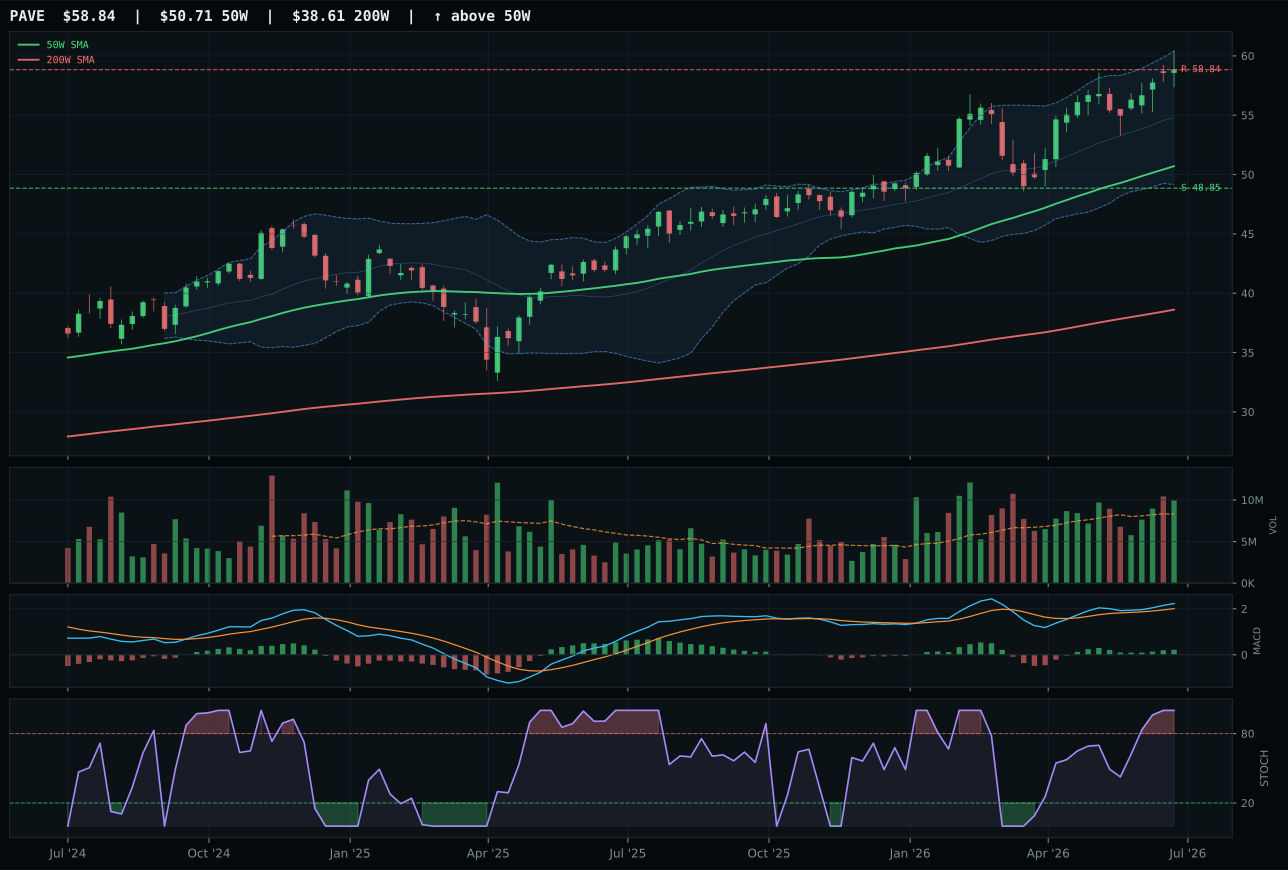
PAVE has a vertical extension profile with 3.2% 13-week relative strength versus SPY.
A failed hold above support would weaken the setup.
Actionable but governed by invalidation levels.
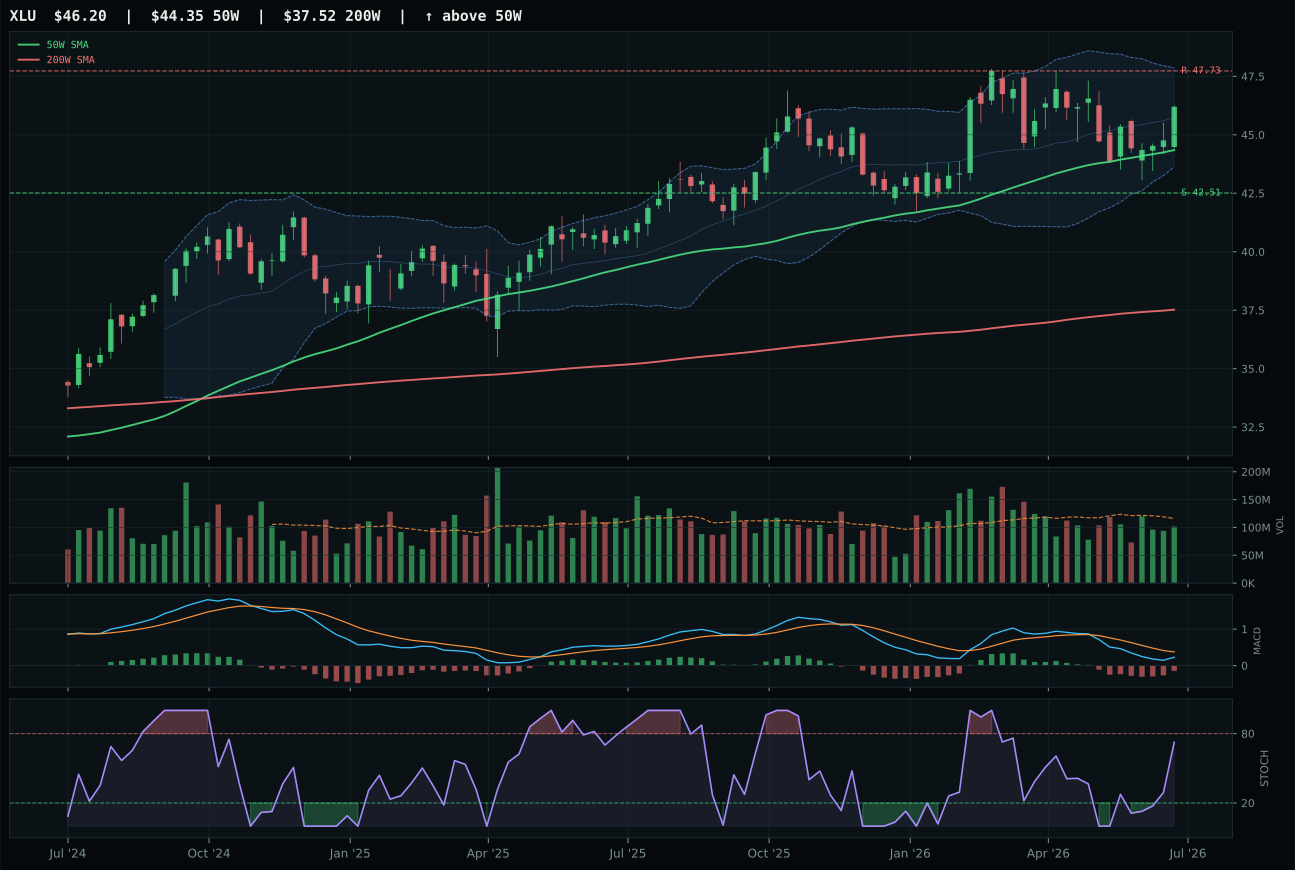
XLU has a neutral structure profile with -13.6% 13-week relative strength versus SPY.
A failed hold above support would weaken the setup.
Actionable but governed by invalidation levels.
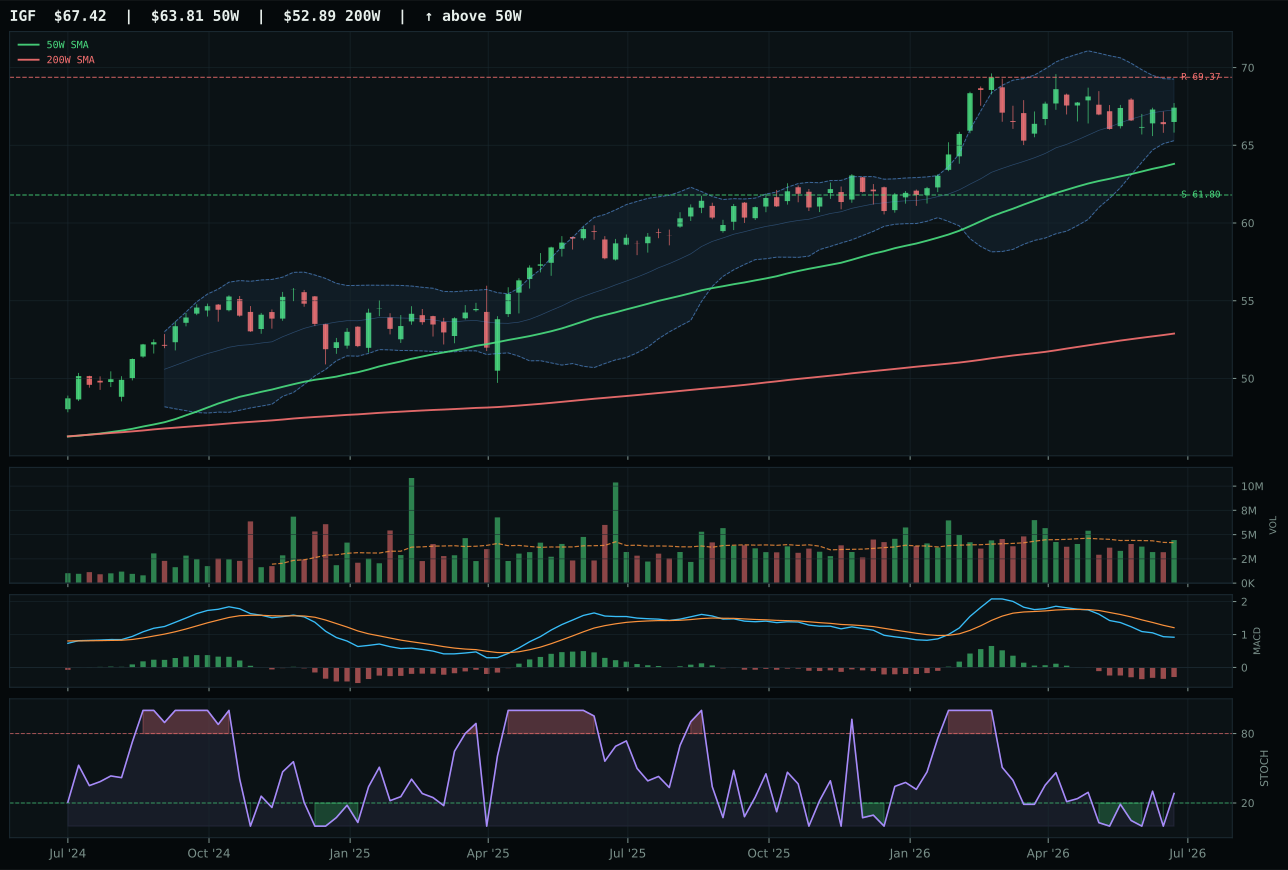
IGF has a neutral structure profile with -13.4% 13-week relative strength versus SPY.
A failed hold above support would weaken the setup.
Actionable but governed by invalidation levels.
XLU beats PAVE despite PAVE's technically superior evidence (92.8/100 vs XLU's 61.3/100) because the portfolio is explicitly choosing timing and entry geometry over raw momentum in a Risk-Off regime. PAVE sits at vertical extension (16.0% above 50W) with overbought momentum stochastic RSI (0.87+) and 18.2% thirteen-week return, the definition of extended leadership; every new buyer is late. XLU sits 4.2% above the 50W with rising mid-zone stochastic RSI (0.72) and modest 1.3% thirteen-week return, offering tighter entry and clearer invalidation. Timing scores diverge dramatically (98.0 vs 37.0) because XLU's proximity to the 50W and mid-zone stochastic setup offers superior risk geometry—XLU can pullback 8.7% to support with defined stops, while PAVE risks a 16%+ washout if momentum breaks. Category-relative strength shows PAVE leading (16.6% vs XLU's -0.2%), reflecting above-average volume participation (1.40x+), but that strong flow signal is precisely why XLU—the weaker name internally—is better timed for a deteriorating macro regime. Risk-reward (51.6 vs 44.0) slightly favors XLU despite PAVE's momentum.
Utilities & Infrastructure allocated at 10% because the 53.9 category score ranks fourth, below the two 20% categories and below AI's 48.3, yet above six lower-ranked categories. Macro fit is solid (59.0/100)—Risk-Off Deterioration helps defensive utilities (+8 weighting), disinflation pressure aids stable cash-flow businesses (+6), offsetting modest headwinds from liquidity stress (-3) and risk appetite positive (-2 because EM/growth would outperform if risk appetite truly normalized). Technical evidence is split: PAVE at 92.8 is leading, XLU at 61.3 is defensive, yet the system selects XLU's entry geometry over PAVE's momentum. The 98.0 timing score for XLU reflects the portfolio's explicit bet that in Risk-Off Deterioration, entry point matters more than current momentum—being early on tighter entry beats being late on strong technicals. Utilities' 1.3% thirteen-week return is decidedly lackluster, yet that sluggishness is precisely what makes it suitable for capital preservation when macro stress peaks. At 10%, this is a barbell positioning: not as defensive as Precious Metals' deep pullback, not as extended as Technology's vertical advance, but offering steady cash-flow defense with optionality to rotate higher if macro stabilizes.
AI — SMH
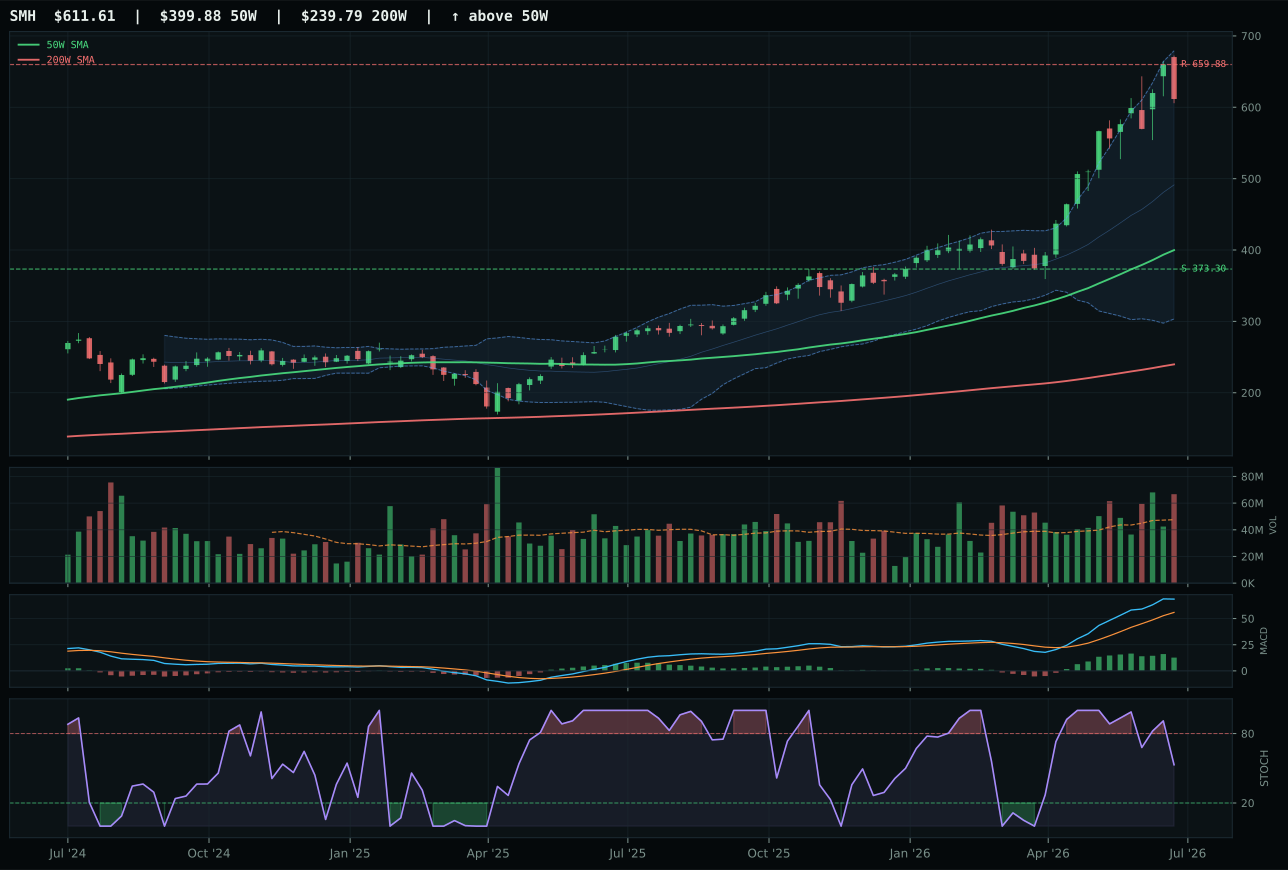
SMH has a vertical extension profile with 48.5% 13-week relative strength versus SPY.
A failed hold above support would weaken the setup.
Actionable but governed by invalidation levels.
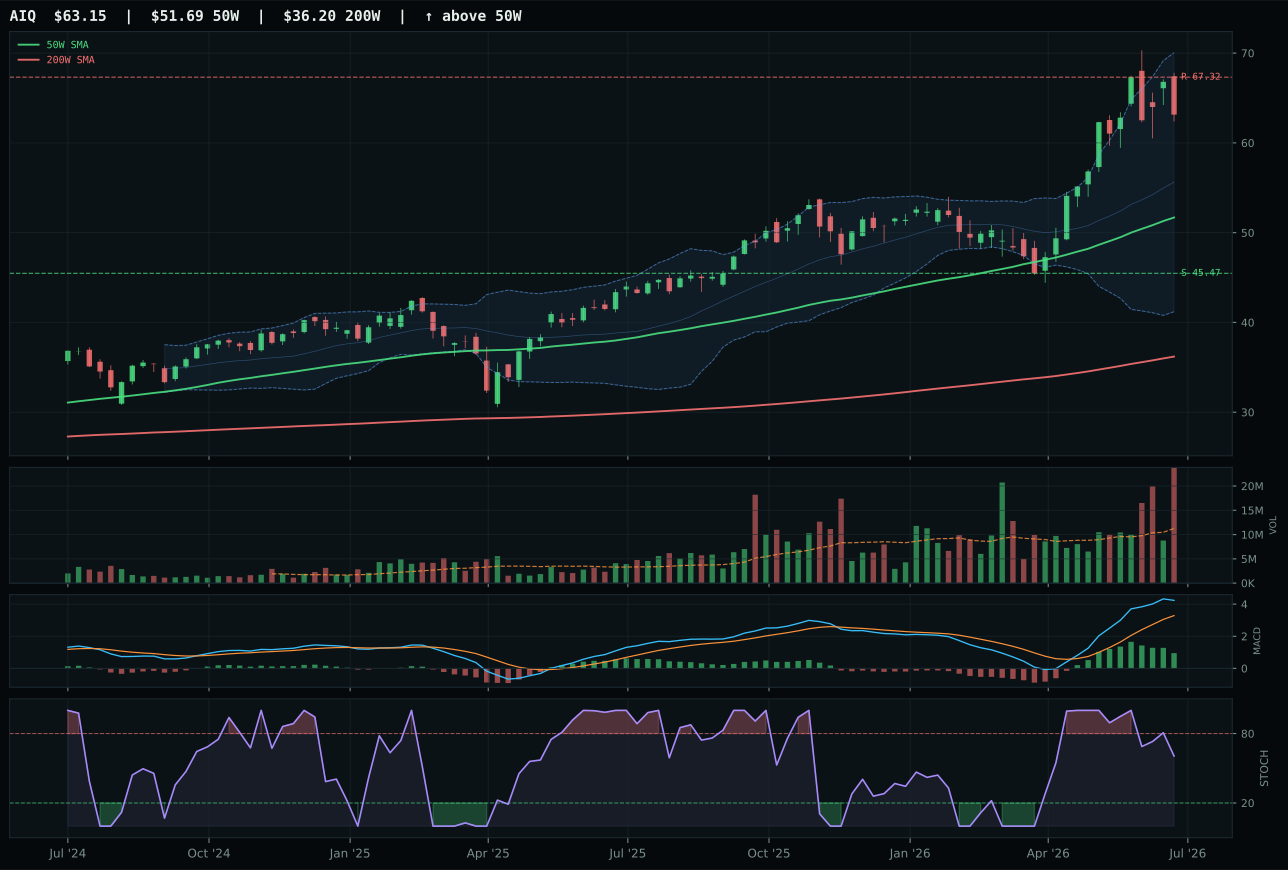
AIQ has a vertical extension profile with 23.9% 13-week relative strength versus SPY.
A failed hold above support would weaken the setup.
Actionable but governed by invalidation levels.
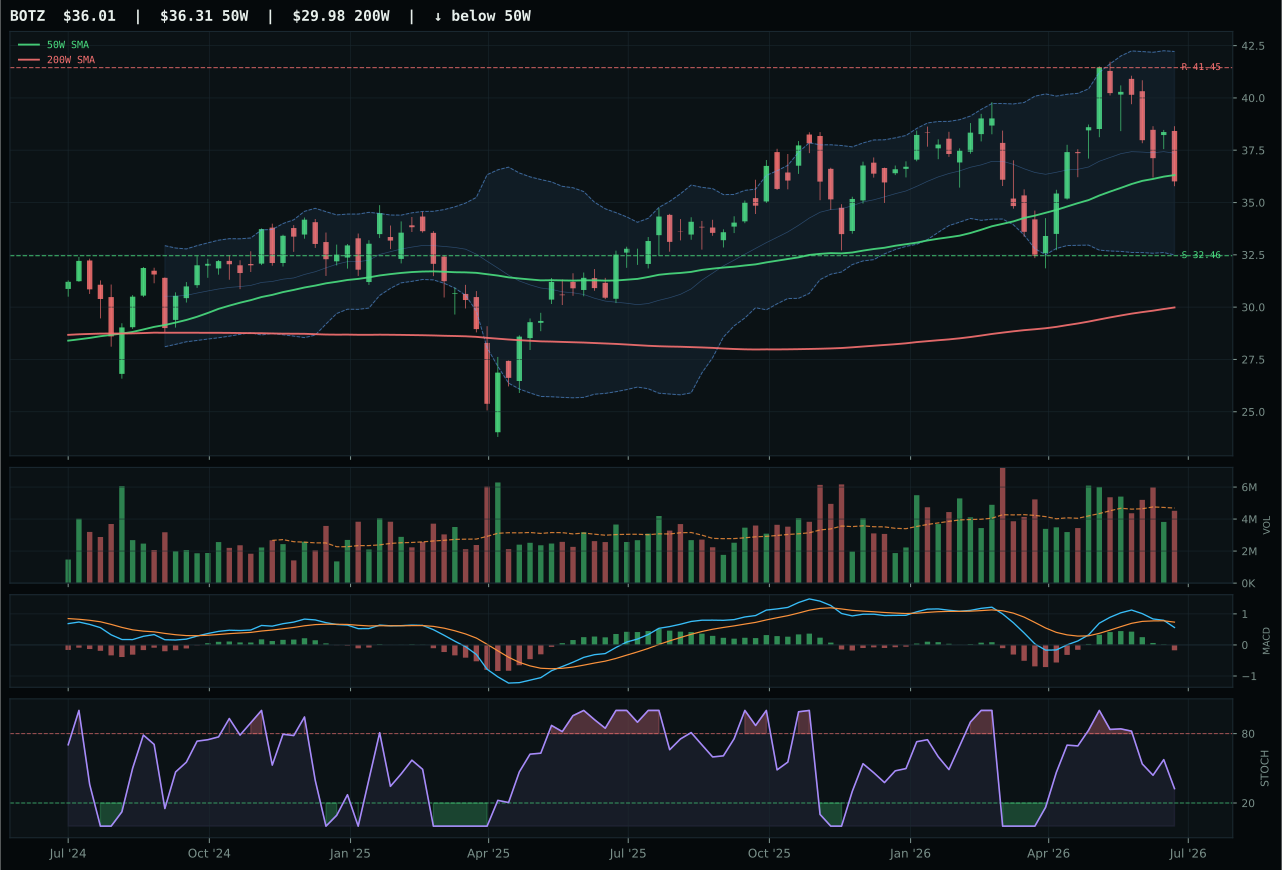
BOTZ has a compression near 50W profile with -4.0% 13-week relative strength versus SPY.
A failed hold above support would weaken the setup.
Actionable but governed by invalidation levels.
SMH wins decisively over AIQ by running 52.9% above the 50W with above-average volume participation (1.40x), turning the extreme extension into proof of institutional accumulation rather than retail chasing. Its 63.4% thirteen-week return and 48.5% SPY-relative strength dominate AIQ's 38.9% and 23.9% respectively—a gap large enough that timing risk is earned, not taken. Category-relative strength (24.5% for SMH versus 0.0% for AIQ) reveals which name is winning inflows; AIQ shows distribution pressure on volume while SMH shows buying conviction. Both MACD are bullish-but-flattening and stochastic RSI are falling/neutral, so MACD confirmation is equal; the divergence lives in structure (77.5 vs 73.3) and risk-reward (47.1 vs 39.9). SMH's 92.7% volume-price confirmation versus AIQ's weaker confirmation (59/100 range) tells the story: semiconductors are being held through this extension, AI software applications are being trimmed.
AI allocated at 10% instead of 20% because while SMH's technical evidence is excellent (89.7/100), the category-level score of 48.3 places it third among ten, behind the two 20% slots (CIBR and ITA). The macro fit (54.0/100) is sufficient—AI growth sponsorship firing at +14 and risk appetite positive at +10 partially offset the -10 and -12 hits from Risk-Off Deterioration and liquidity stress. However, the ultimate constraint is that SMH at 52.9% extension above the 50W leaves little room for new money to enter without timing risk, and thin participation from other AI names (AIQ's distribution pressure, BOTZ's 27.1 score) drags the category average. A 10% allocation preserves exposure to the semiconductor leadership that is clearly working while avoiding overcommitment to a category stretched in price. If MACD inflection turns bullish-and-improving and stochastic RSI re-enters mid-zone with volume staying above-average, category score could climb into top-2 range; for now, the portfolio respects the momentum but sizes accordingly.
Industrial Metals — COPX
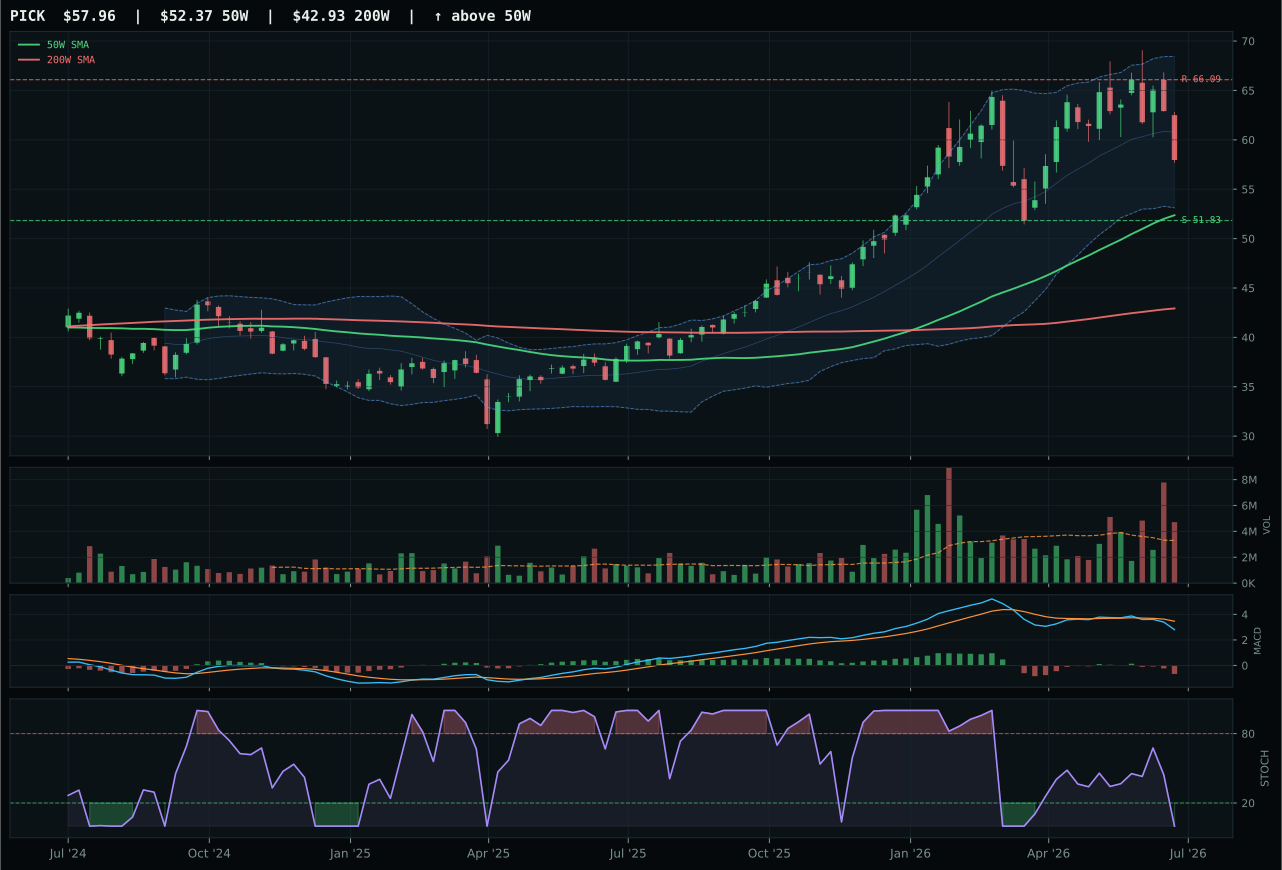
PICK has a neutral structure profile with -7.4% 13-week relative strength versus SPY.
A failed hold above support would weaken the setup.
Actionable but governed by invalidation levels.
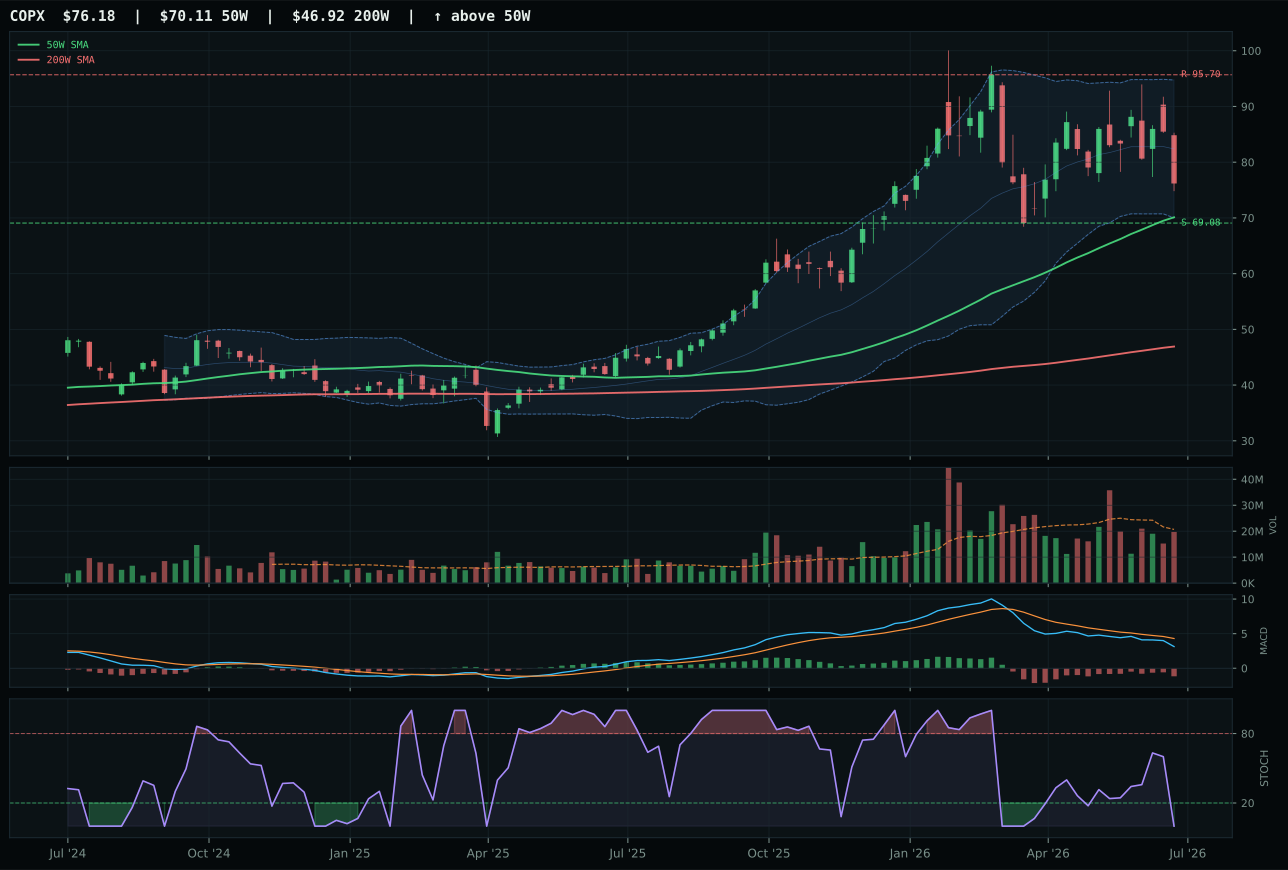
COPX has a neutral structure profile with -8.6% 13-week relative strength versus SPY.
A failed hold above support would weaken the setup.
Actionable but governed by invalidation levels.
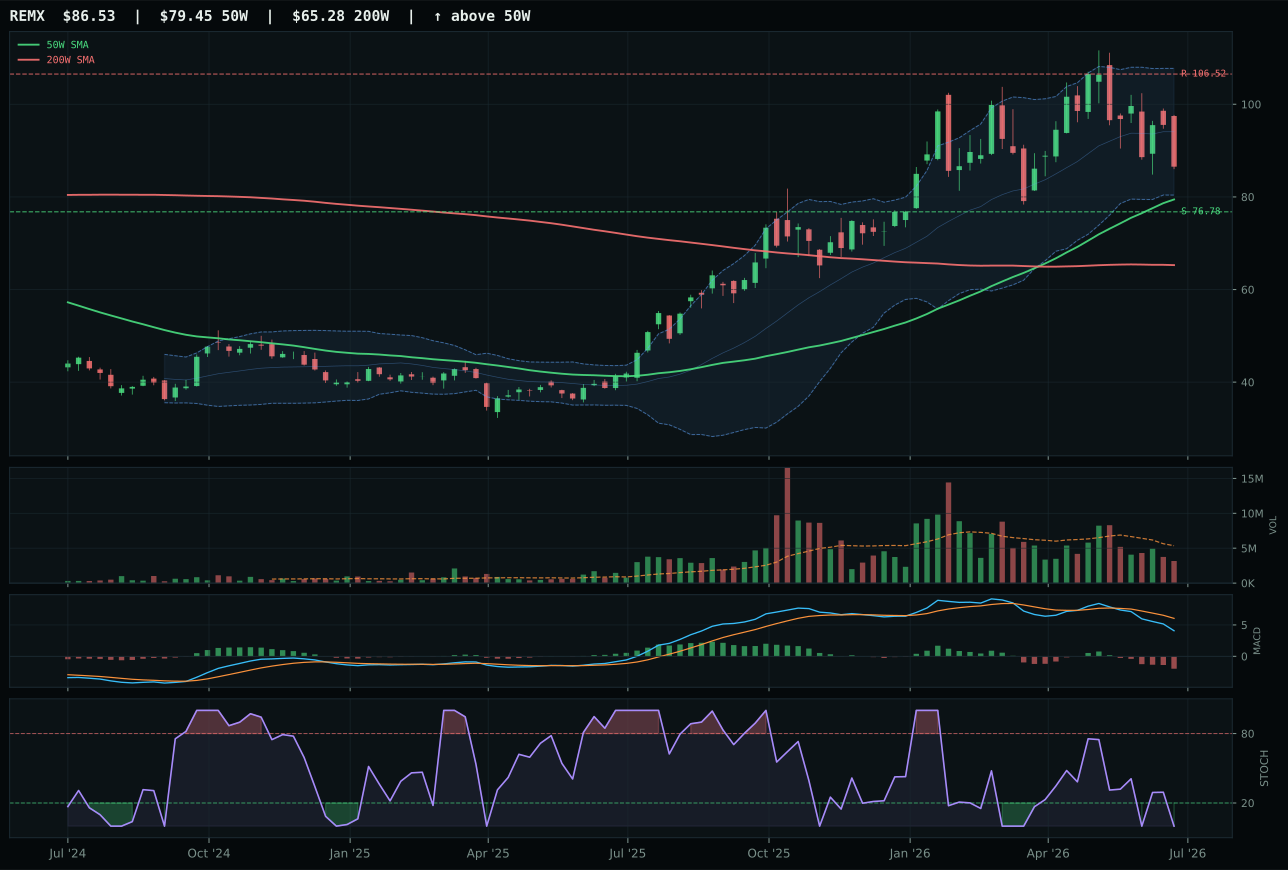
REMX has a neutral structure profile with -14.5% 13-week relative strength versus SPY.
A failed hold above support would weaken the setup.
Actionable but governed by invalidation levels.
COPX edges PICK by a razor-thin margin (0.8 points in reasoned ETF proof order) on the strength of superior timing (77.0 vs 70.0) and risk-reward (73.7 vs 63.7) despite PICK's stronger momentum confirmation (14/100 vs COPX's 3/100). Both sit above the 50W in neutral structure with bearish/weakening MACD and oversold stochastic RSI, creating identical macro vulnerability. The divergence emerges in setup geometry: COPX sits at Fibonacci 0.382 (middle retracement/decision zone near 77.81) with zero downside to support cushion remaining, while PICK sits at upper retracement/momentum zone, suggesting COPX is closer to capitulation and thus closer to reversal. Category-relative strength is tied at 0.0%, reflecting no internal ETF leadership; the winner is determined by technical precision rather than flow signals. COPX's neutral volume (0.95x) versus PICK's above-average participation (above 1.0x) suggests institutional accumulation in COPX versus potential retail exhaustion in PICK, favoring the lower-volume name in a risk-off environment.
Industrial Metals allocated at 10% because the 40.1 category score ranks fifth, below the two 20% slots and three other 10% categories (Utilities, Nuclear, Emerging Markets), yet above Agriculture and Energy. Macro fit is excellent (63.0/100)—metals scarcity active at +14 and commodity breadth positive at +10 directly offset Risk-Off Deterioration's -8 hit. However, technical evidence across the basket is weak (COPX 26.2/100, PICK 36.2/100), dragging the category down from what macro alone would justify. The portfolio is taking a duration bet on industrial metals supply constraints and AI/capex demand, but acknowledging that near-term technicals are broken (MACD bearish, momentum confirmation near zero for COPX). At 10%, this is a patient accumulation position: current weakness is creating entry points for what could be structural upside as capex cycles accelerate. If MACD turns bullish and compression resolves upward with volume confirmation, this category could rapidly re-rate into a higher allocation. For now, the portfolio is holding its position without adding, waiting for technical confirmation to match macro conviction.
Emerging Markets — ILF
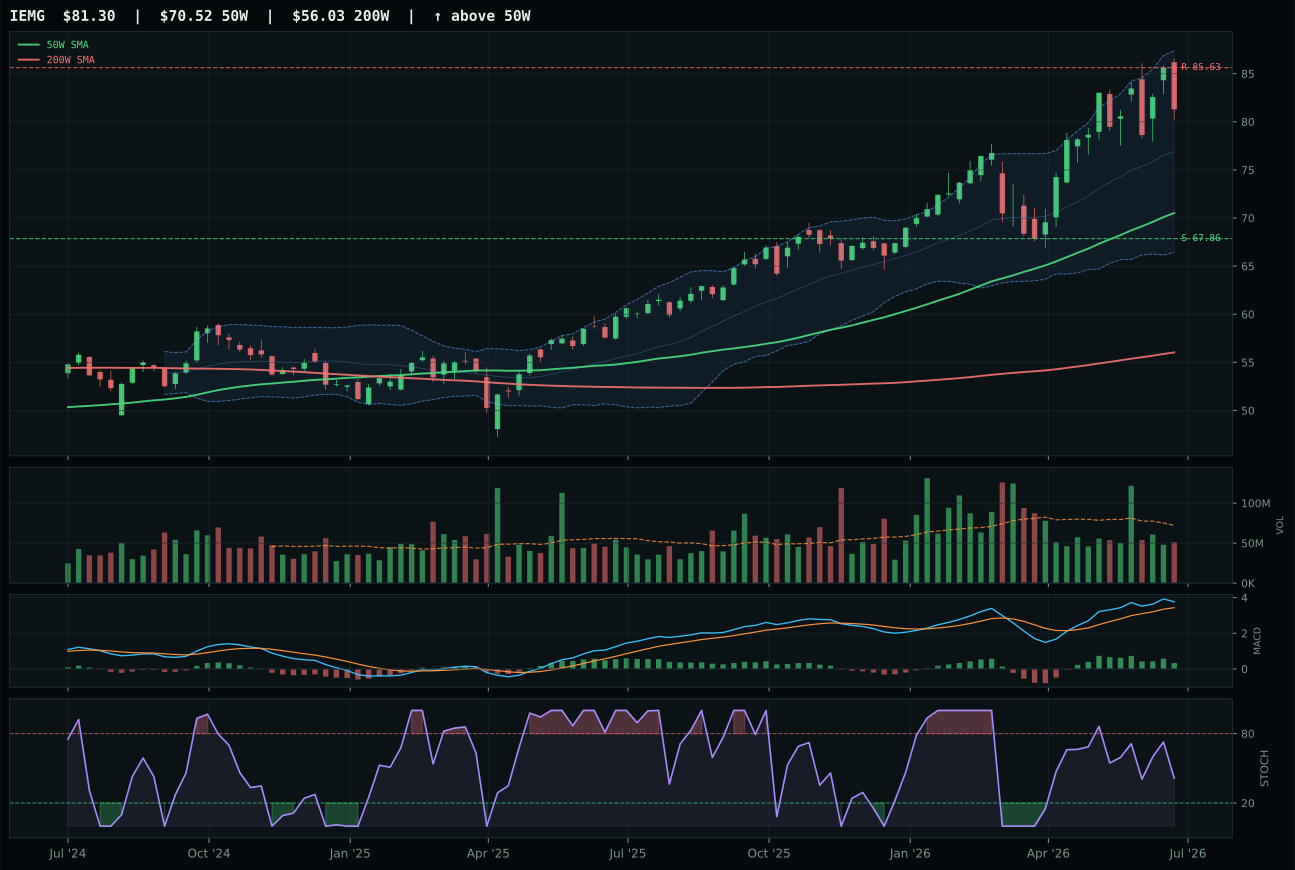
IEMG has a vertical extension profile with 4.8% 13-week relative strength versus SPY.
A failed hold above support would weaken the setup.
Actionable but governed by invalidation levels.
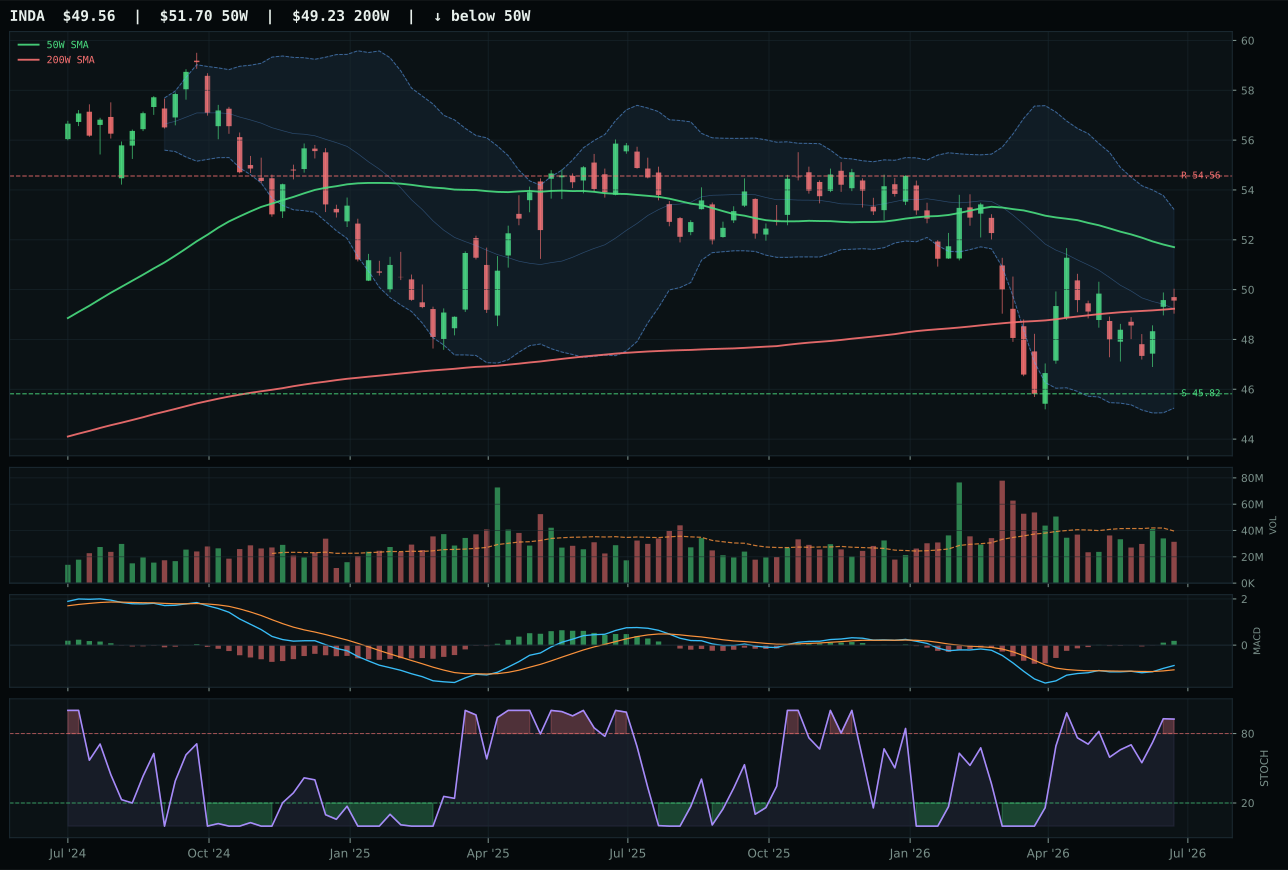
INDA has a neutral structure profile with -6.8% 13-week relative strength versus SPY.
A failed hold above support would weaken the setup.
Actionable but governed by invalidation levels.
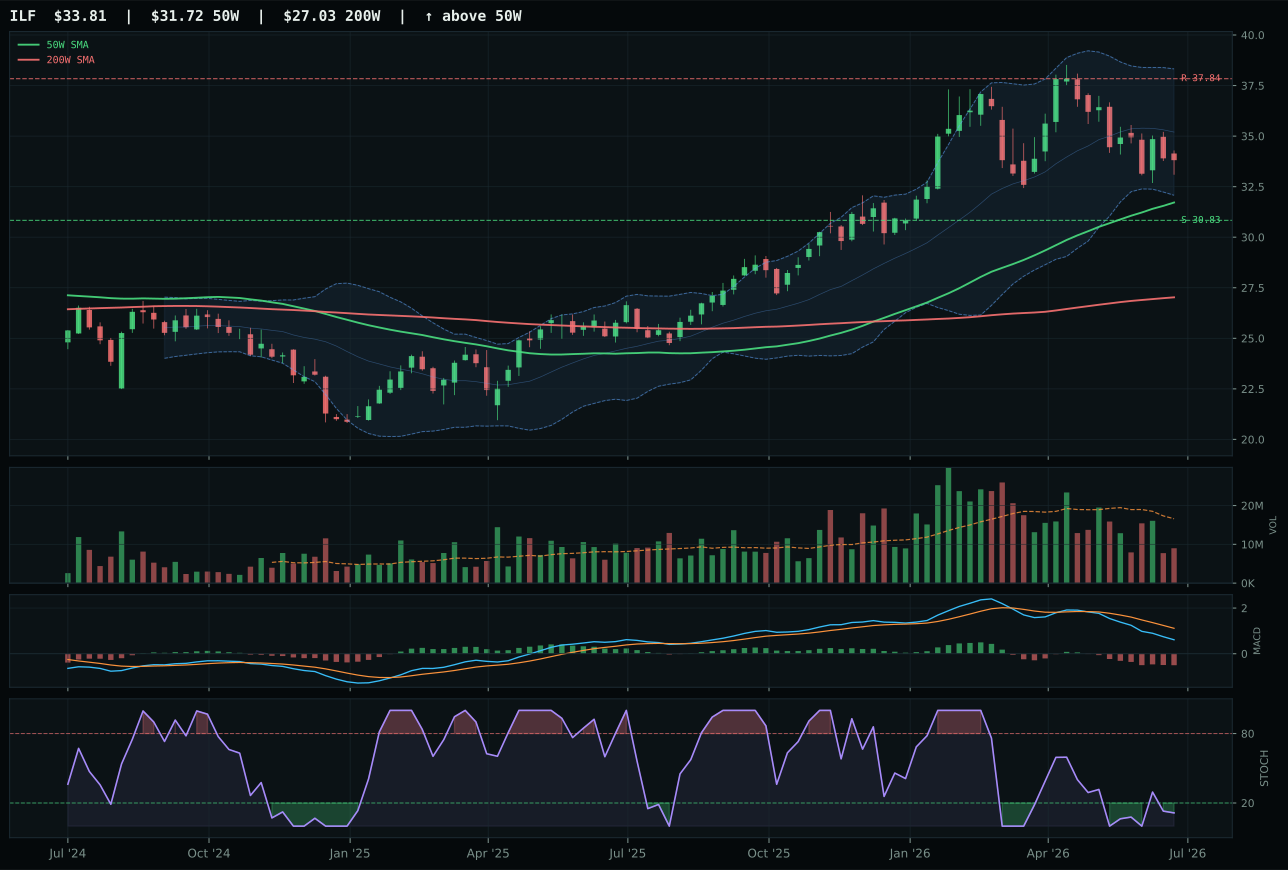
ILF has a neutral structure profile with -15.2% 13-week relative strength versus SPY.
A failed hold above support would weaken the setup.
Actionable but governed by invalidation levels.
ILF wins a close race against the fundamentally stronger IEMG setup by offering superior timing and risk-reward geometry despite being technically weaker in absolute terms. ILF's timing score of 84.0 crushes IEMG's 56.0 because ILF sits at Fibonacci 0.382 (upper retracement/momentum zone) with stochastic RSI oversold turn-up (0.11), a classic coil setup, while IEMG sits at 0.382 but is already in vertical extension (15.3% above 50W) with rising mid-zone stochastic RSI (mid-0.50s), meaning IEMG has momentum exhaustion risk. ILF's risk-reward (64.8 vs IEMG's 49.6) reflects tighter entry boundaries and more defined invalidation. Category-relative strength diverges sharply: IEMG's 11.6% versus ILF's -8.4% initially favors IEMG, but in a Risk-Off regime, relative weakness can mean better entry and lower crowding. Structure favors ILF (68.5 vs IEMG's slightly higher but extended setup), and volume-price confirmation is similarly weak for both, yet ILF's pullback setup with turn-up stochastic shows cleaner invalidation geometry.
Emerging Markets allocated at 10% because the 36.6 category score ranks sixth and provides diversification value despite IEMG's stronger technical evidence (74.4/100) being overridden by ILF's superior risk-reward and timing. Macro fit is poor (34.0/100) due to Risk-Off Deterioration (-12 weighting) and credit stress (-10) and liquidity stress (-10) actively firing, nearly overwhelming the modest support from risk appetite positive (+8) and commodity breadth positive (implicit in emerging markets commodity exporters). The portfolio is not betting on EM outperformance but on selective exposure to Latin America commodity beta and structural undervaluation as capital rotates away. ILF's oversold turn-up setup (stochastic RSI at 0.11) and neutral MACD suggest the category could reverse faster than technicals suggest; the 0.0% momentum confirmation reflects current weakness, not lasting weakness. At 10%, this is a cyclical rotation hedge: EM is out of favor precisely when it may be closest to reversal. The portfolio is maintaining exposure to capture the rebound when macro stress eases and risk appetite stabilizes, using ILF's superior timing and entry geometry to minimize drawdown while waiting for confirmation.
Precious Metals — GLD
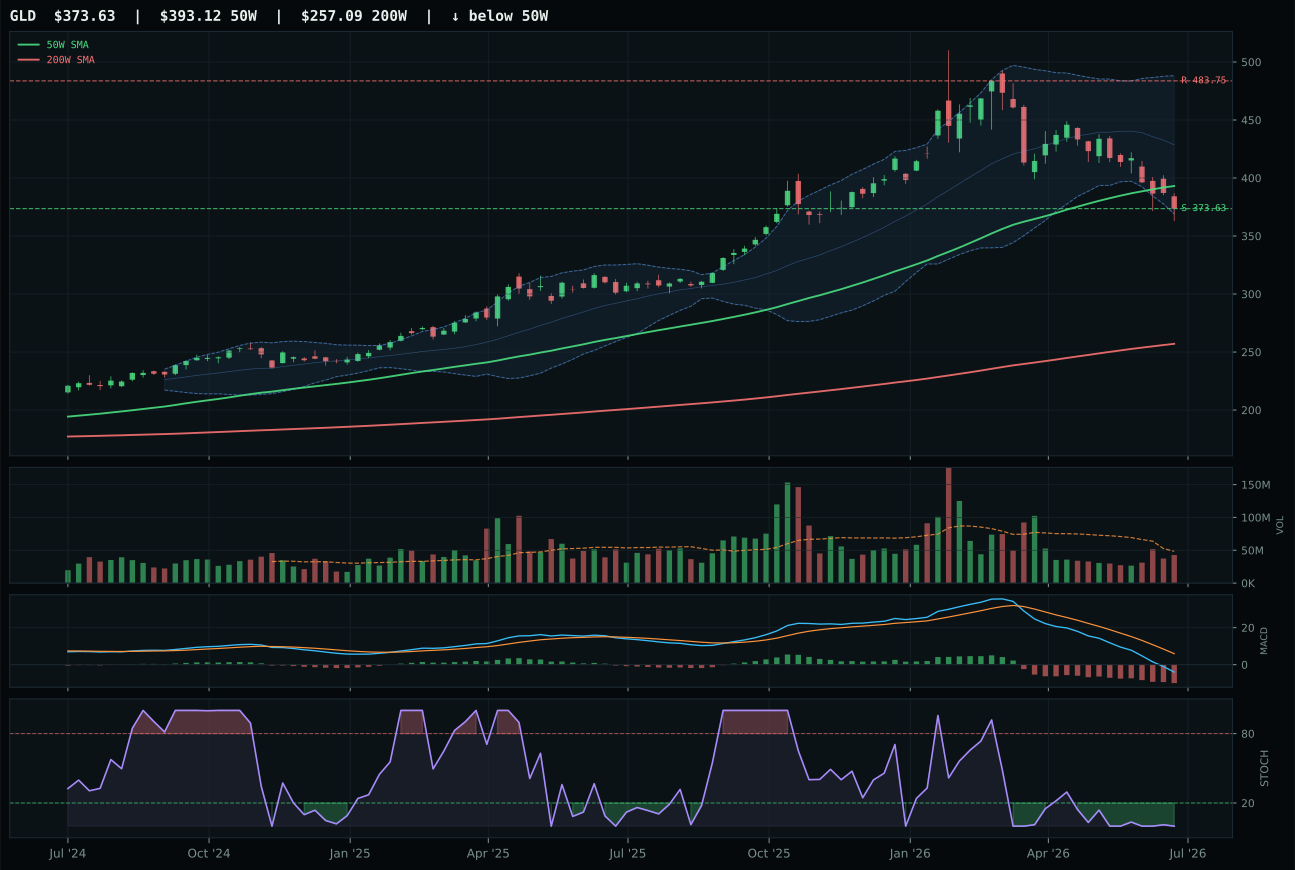
GLD has a pullback into support profile with -24.9% 13-week relative strength versus SPY.
A failed hold above support would weaken the setup.
Actionable but governed by invalidation levels.
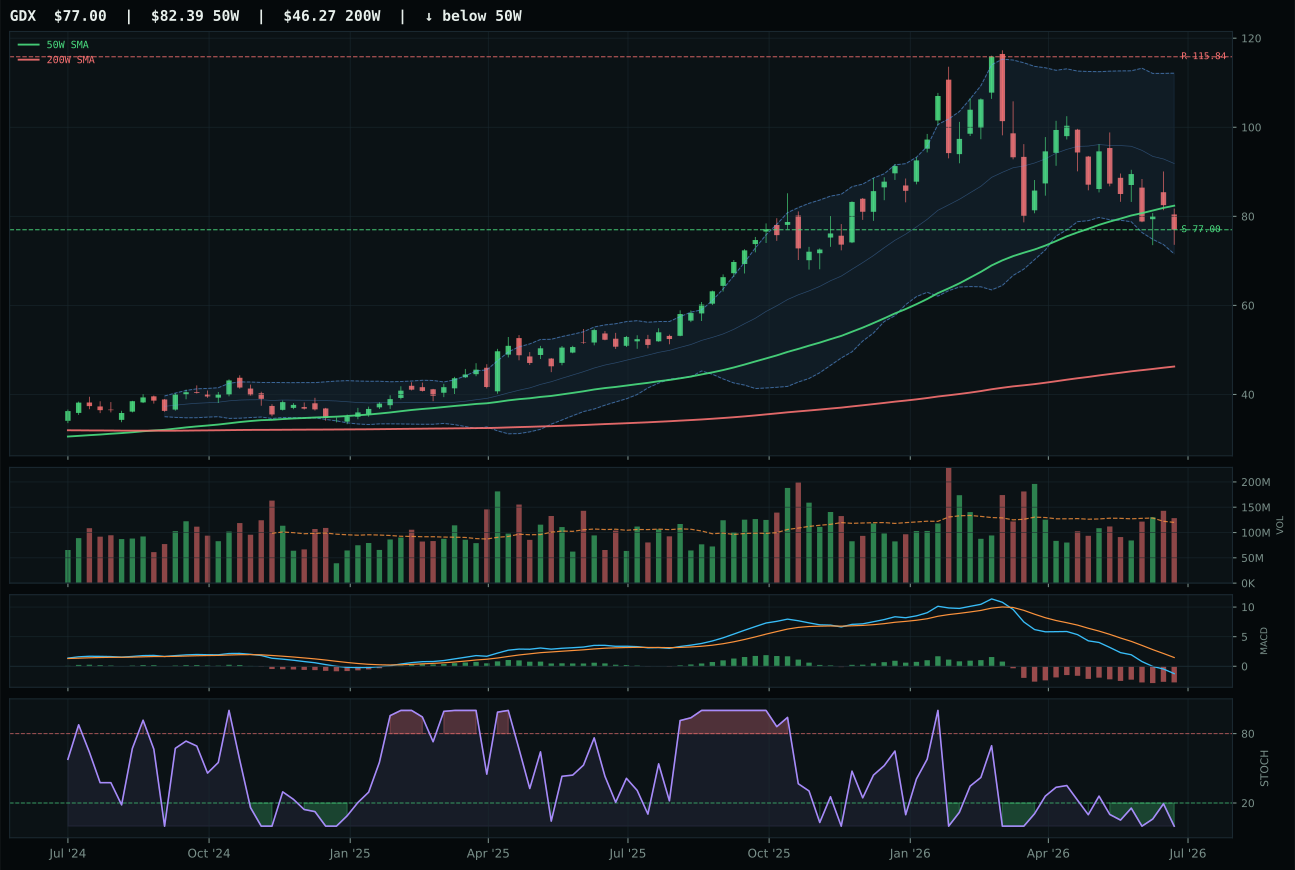
GDX has a pullback into support profile with -25.2% 13-week relative strength versus SPY.
A failed hold above support would weaken the setup.
Actionable but governed by invalidation levels.
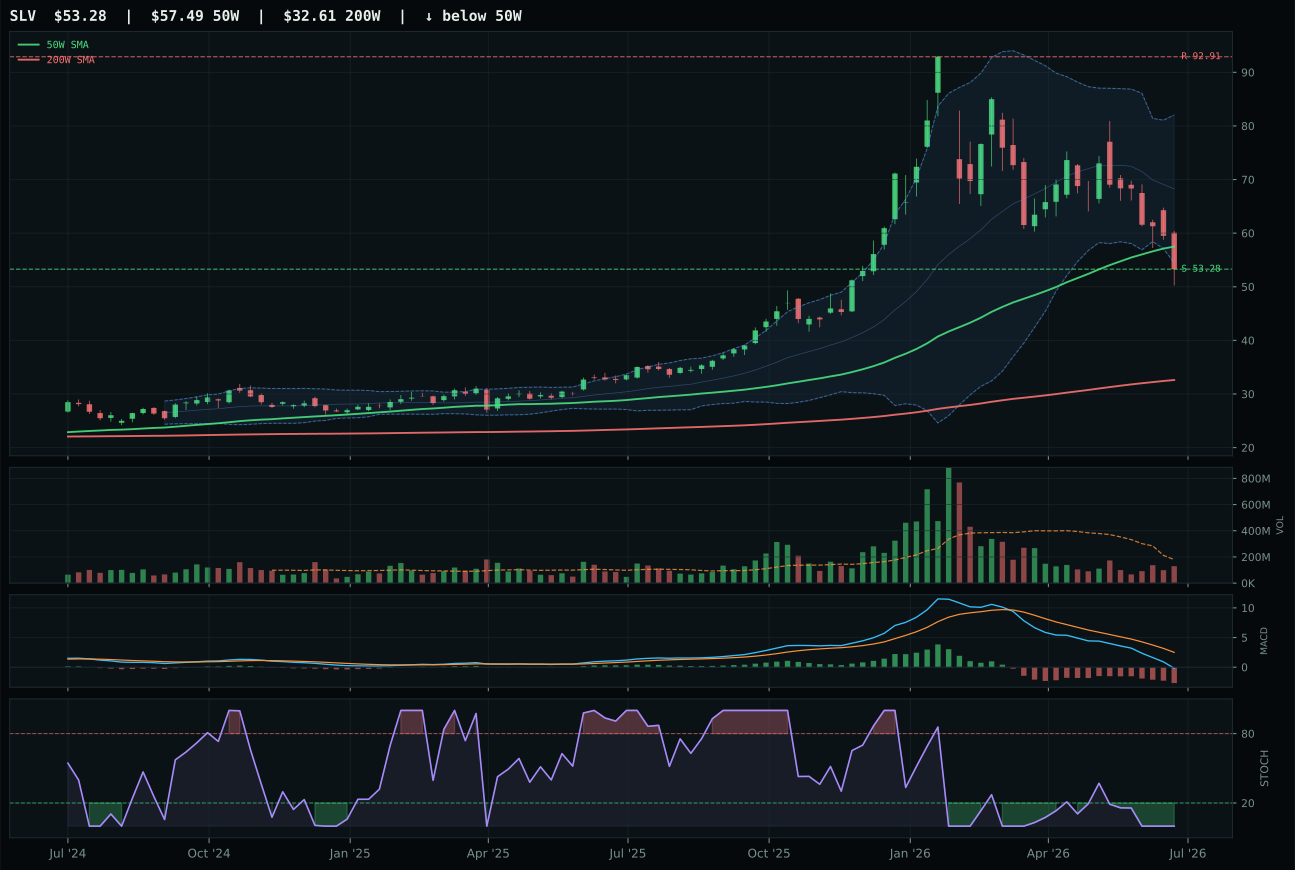
SLV has a pullback into support profile with -31.0% 13-week relative strength versus SPY.
A failed hold above support would weaken the setup.
Actionable but governed by invalidation levels.
GLD wins decisively over GDX despite both sitting in deep retracement due to GLD's superior risk-reward geometry and cleaner timing score. GLD's 98.0 risk-reward score versus GDX's 83.0 reflects zero downside to support (already at support level 373.63) and defined upside/downside boundaries—textbook value setup. Timing scores diverge meaningfully (100.0 vs 87.0) because GLD sits at Fib 0.618 (deep retracement/value zone) while GDX is at 0.500 (middle retracement/decision), giving GLD a clearer mean-reversion argument. Structure is tighter in GLD (67.5 vs 63.1), and category-relative strength marginally favors GLD at 0.3% versus GDX's 0.0%. Both MACD are bearish/weakening and stochastic RSI are oversold, so momentum confirmation is equally poor (0/100 for both), yet that equality in weakness actually favors GLD's setup because the larger pullback (-5.0% from 50W vs GDX's smaller drawdown) is more efficient for reversal trading.
Precious Metals allocated at 10% because the 33.1 category score ranks lower than both co-top 20% categories but higher than Agriculture's 24.1 and Energy's 0.1. Macro fit of 60.0/100 is surprisingly strong—disinflation pressure (+6) and Risk-Off Deterioration helping exposure (+8) mean gold benefits when nominal growth cracks. Yet technical evidence is weak across the board (GLD 28.9/100, GDX 17.9/100), pulling the category score down despite macro tailwinds. The portfolio is making a conviction call that oversold metallics (zero momentum confirmation scores) offer asymmetric payoff when volatility shifts: current MACD weakness and stochastic extremes (0.00 across all three names) leave little room for technicals to deteriorate further, but substantial room for reversal when real yields roll over or credit stress spikes sharply. At 10%, this is a levered hedge—not a growth position, but a hedge with positive carry if disinflation thesis materializes and monetary policy loosens. GLD's 100/100 timing score on the pullback-into-support setup justifies staying long despite -9.9% thirteen-week performance.
Nuclear Energy — NLR
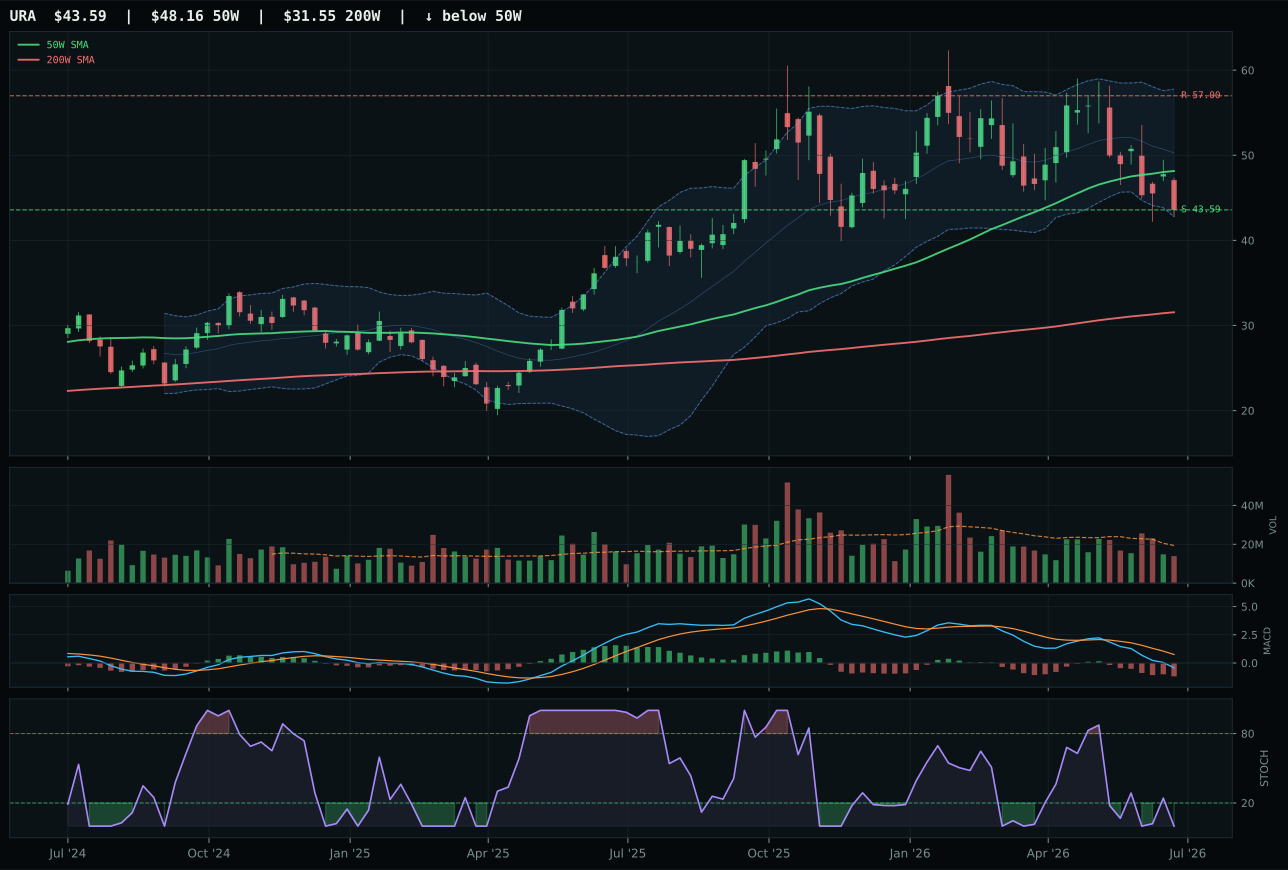
URA has a pullback into support profile with -21.5% 13-week relative strength versus SPY.
A failed hold above support would weaken the setup.
Actionable but governed by invalidation levels.
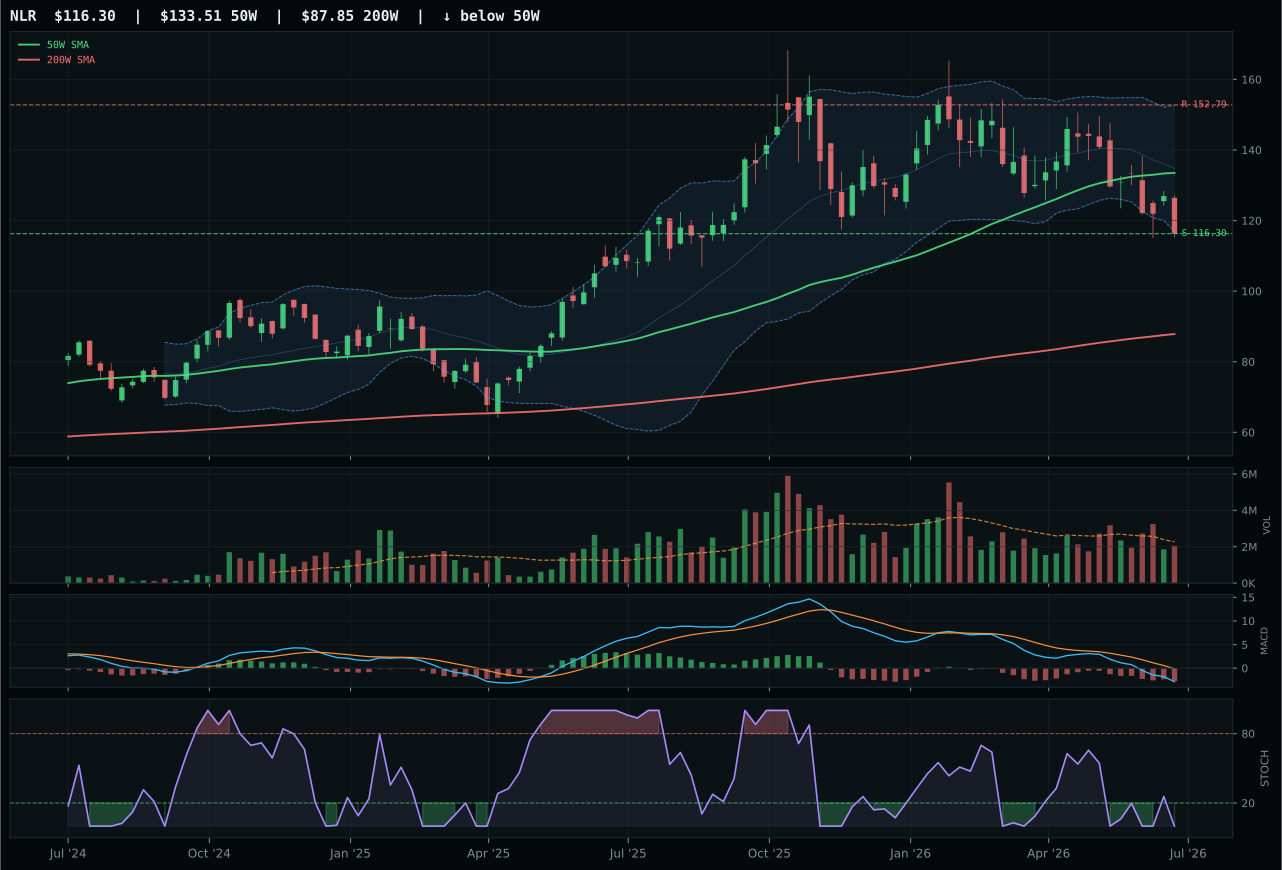
NLR has a pullback into support profile with -25.6% 13-week relative strength versus SPY.
A failed hold above support would weaken the setup.
Actionable but governed by invalidation levels.
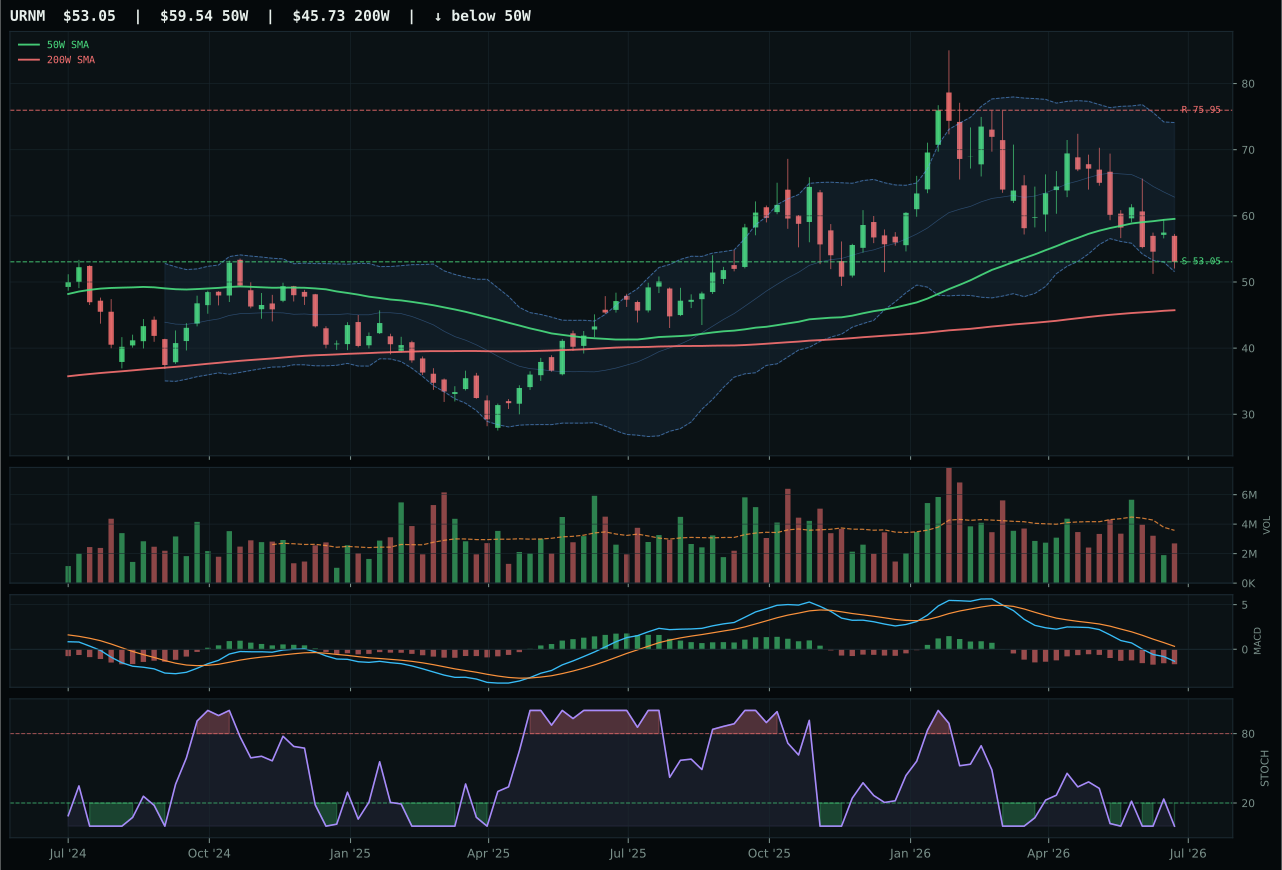
URNM has a pullback into support profile with -26.2% 13-week relative strength versus SPY.
A failed hold above support would weaken the setup.
Actionable but governed by invalidation levels.
NLR beats URA by 3.8 points in the reasoned ETF proof order despite URA having a cleaner timing score (87.0 vs 60.0) because NLR's structure is superior (65.5 vs 60.8) and its volume confirmation is better (neutral at 0.91x versus thin participation at URA). Both sit below the 50W but above the 200W—a reset setup with defined support and invalidation levels. NLR's Fibonacci location at 0.786 (near 52W low/repair zone) is deeper and cleaner than URA's 0.618 (deep retracement/value zone), giving NLR a more textbook mean-reversion argument. Risk-reward favors both equally (75.0 each), but NLR's category-relative strength at 0.0% versus URA's 4.1% is read as competitive parity rather than URA strength; URA's higher internal relative strength is offset by its worse technical cleanliness. Both show -10% to -6% thirteen-week returns and bearish MACD, yet NLR's neutral volume profile suggests institutional patience while URA's thin participation suggests retail surrender.
Nuclear Energy allocated at 10% because its 31.8 category score ranks seventh, above only Traditional Energy's 0.1 and Precious Metals' 33.1 (which barely exceeds Nuclear). Macro fit is modest (45.0/100)—real asset sponsorship (+7) and AI growth sponsorship (+5, implicitly from data center power demand) are offset by Risk-Off Deterioration (-5), credit stress (-5), and liquidity stress (-7). Technical evidence is weak across the board (NLR 23.4/100, URA 19.9/100), making this a category held for optionality rather than current conviction. The portfolio is betting that nuclear as a clean energy and AI-era power source will eventually re-rate, but acknowledging that technicals are uniformly broken and momentum confirmation is zero. At 10%, this is a long-duration hedge: NLR's 60/100 timing score (versus URA's 87/100) reflects deeper pullback into structural support, offering better entry geometry for patient capital. If AI capex narratives accelerate and tech companies explicitly pivot to nuclear-powered data centers, this sector could rapidly re-rate; for now, the portfolio is accumulating quietly at depressed technicals rather than chasing momentum.
Agriculture & Livestock — VEGI
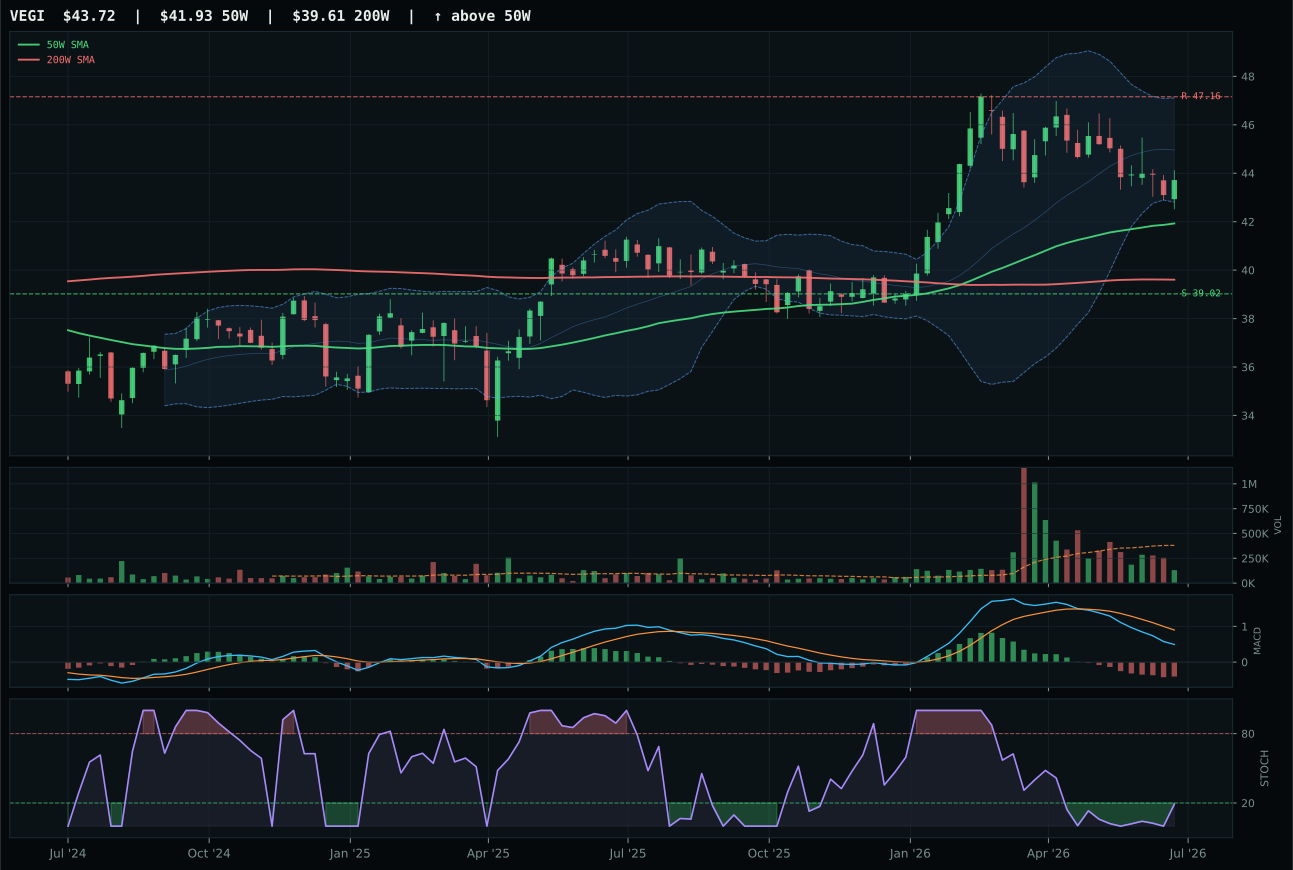
VEGI has a neutral structure profile with -17.3% 13-week relative strength versus SPY.
A failed hold above support would weaken the setup.
Actionable but governed by invalidation levels.
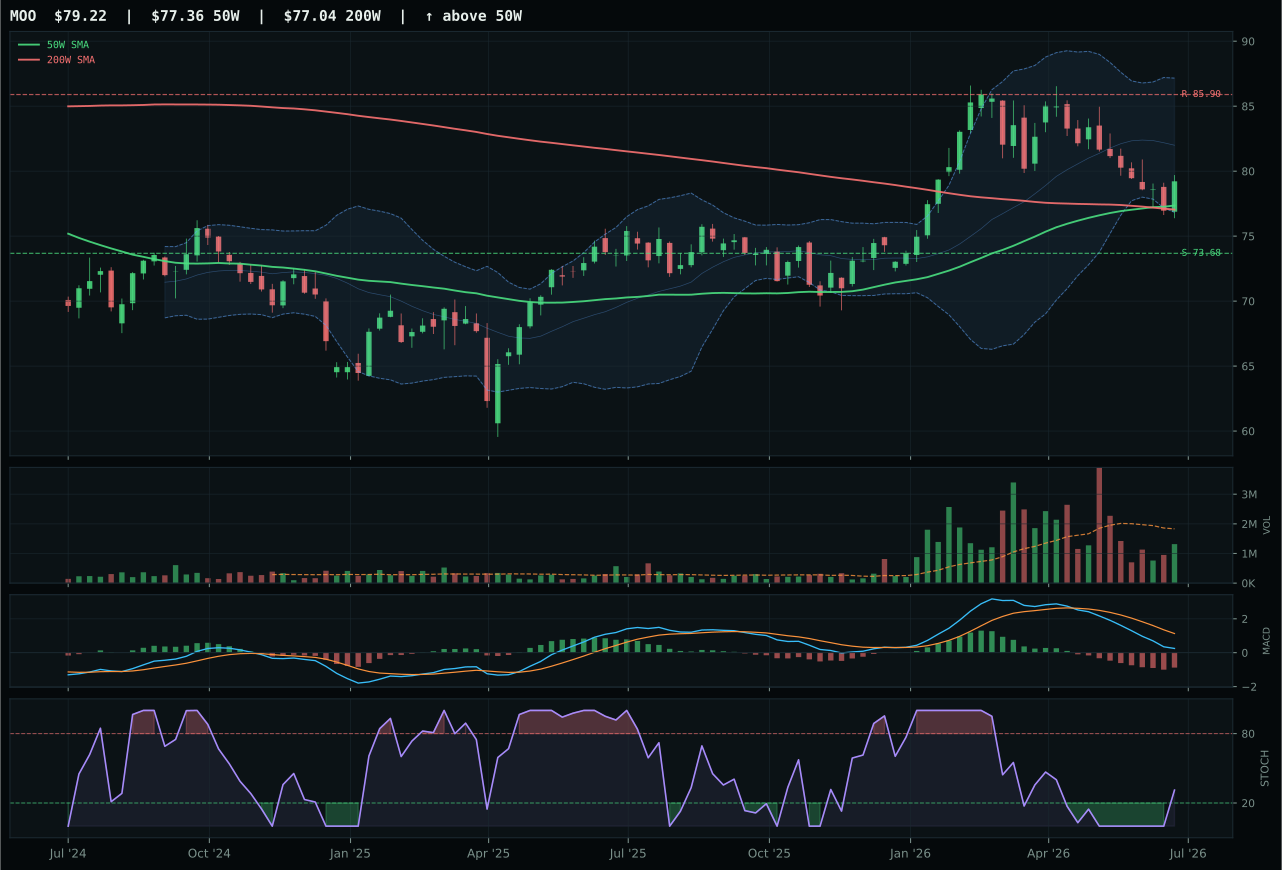
MOO has a compression near 50W profile with -19.1% 13-week relative strength versus SPY.
A failed hold above support would weaken the setup.
Actionable but governed by invalidation levels.
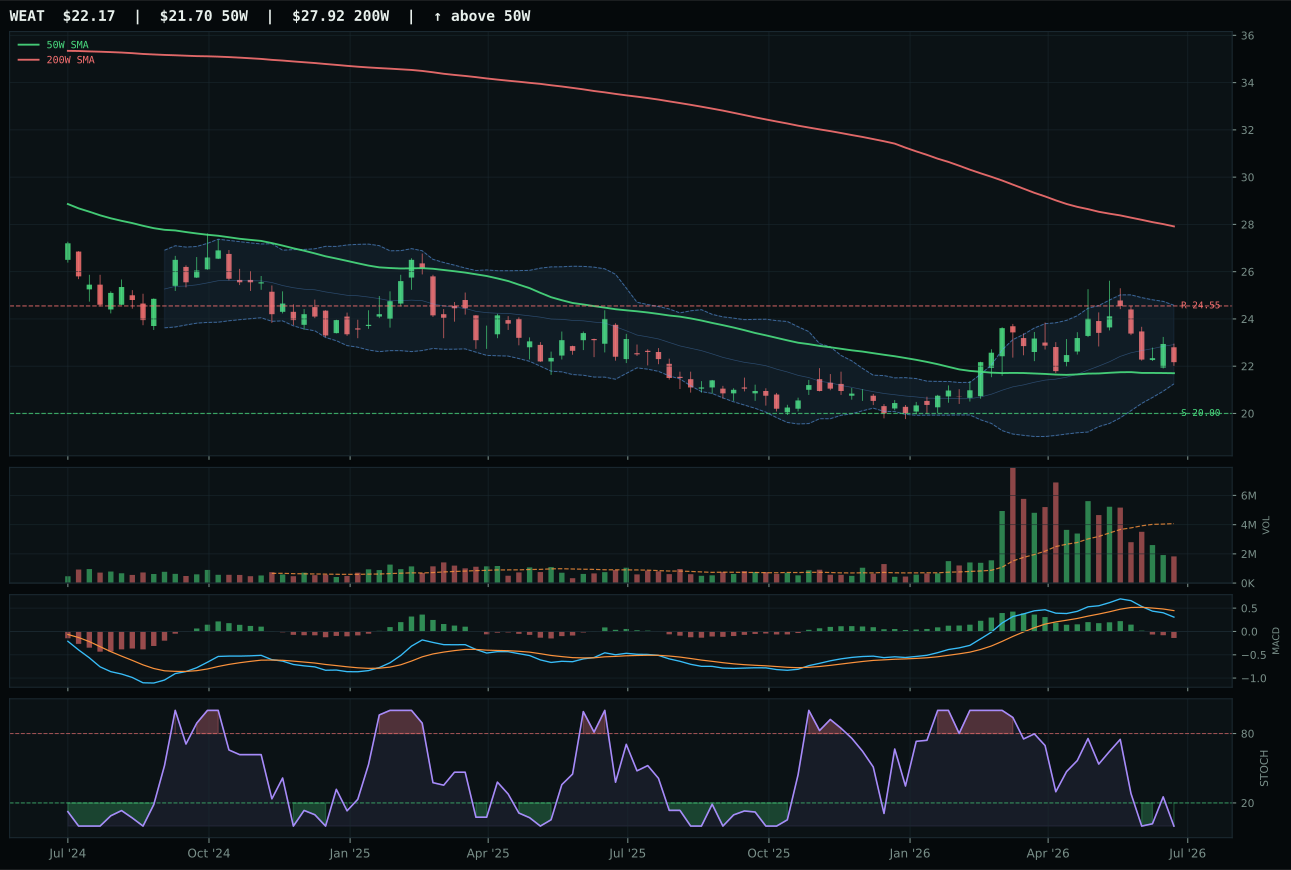
WEAT has a compression near 50W profile with -19.3% 13-week relative strength versus SPY.
A failed hold above support would weaken the setup.
Actionable but governed by invalidation levels.
VEGI narrowly beats MOO despite worse near-term momentum because its chart setup is cleaner and its stochastic RSI timing is superior. VEGI's structure score of 68.2 versus MOO's 60.9 reflects better compression geometry and defined support near 39.02. Both names are underwater on thirteen-week returns (VEGI -2.3%, MOO -4.2%), but VEGI's stochastic RSI at oversold turn-up (0.19) versus MOO's rising mid-zone tells a different story: VEGI has clearer invalidation above resistance while MOO is ambiguous. Category-relative strength favors VEGI at 1.8% versus MOO's 0.0%, a small signal that flows are rotating into the less-extended name. Timing scores both hit 100/100, but VEGI's pullback-into-support setup with Fibonacci location at 0.382 (middle retracement/decision) reads cleaner than MOO's compression near 50W. Both suffer thin participation and bearish MACD, yet VEGI's 68.2% structure implies traders are gathering, preparing; MOO's 60.9% suggests indecision.
Agriculture & Livestock scores 24.1 and earns zero allocation; the category ranks 9th or 10th in final standing. The macro-fit reason is clear: disinflation pressure (-8) combined with liquidity stress (-4) creates structural headwinds that real-asset sponsorship (+8) and commodity-breadth-positive signals (+5) cannot overcome. Technical evidence is the real killer: VEGI's 32.6/100 technical score reflects negative 13-week momentum, massive SPY underperformance, and volume confirmation of just 29.8/100—buyers have vacated this sector entirely. The 3/2/1 weighted basket (MOO 39.0, VEGI 37.6, WEAT 28.1) averages only 36.7 before penalties knock it down to 24.1. This is exclusion by design: agriculture lacks both trend confirmation and macro sponsorship in a risk-off regime. The portfolio would reconsider this category only if commodity-breadth signals accelerated further or if disinflation reversed into reflation; today, agriculture sits at the bottom of the allocation queue with no path back to capital allocation.
Traditional Energy — XLE
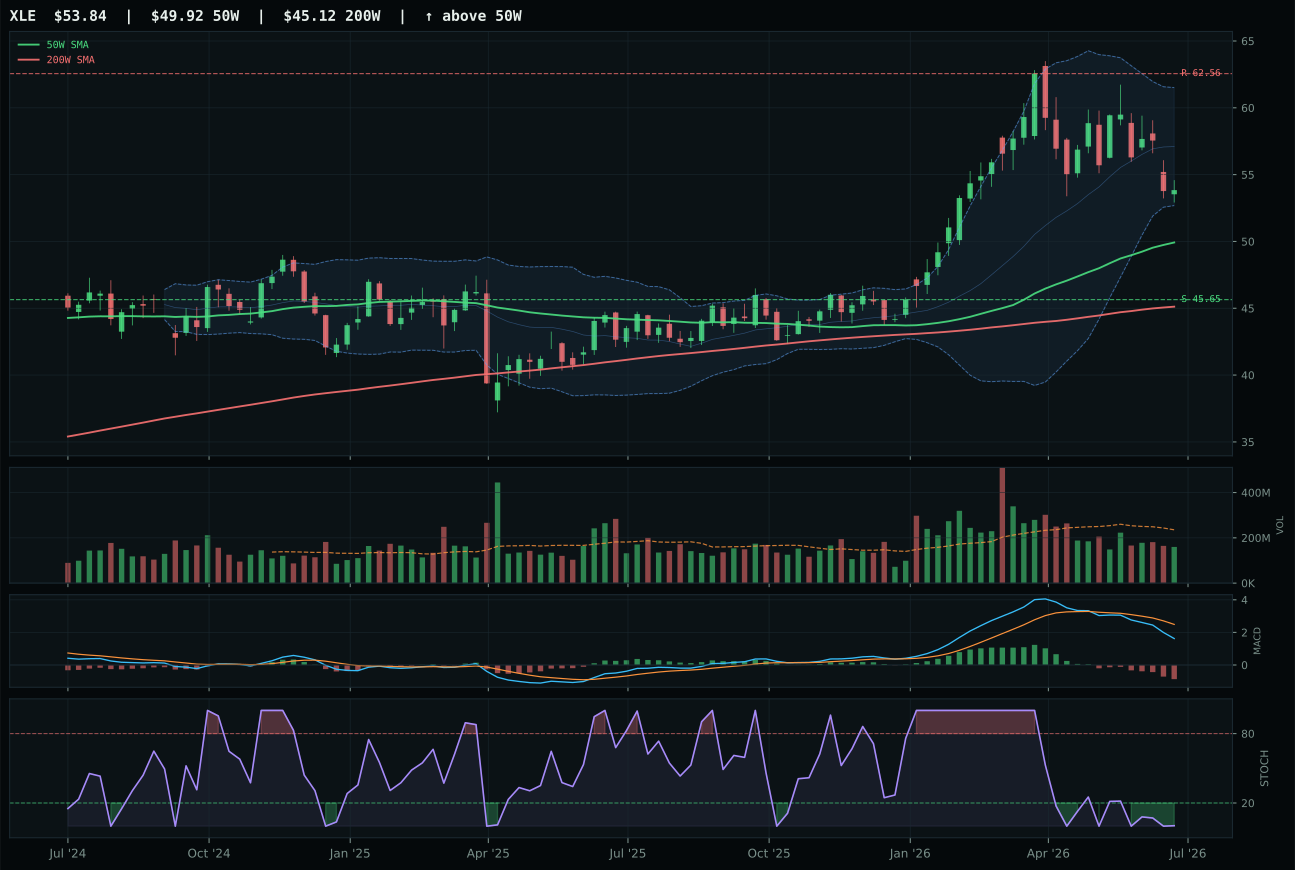
XLE has a neutral structure profile with -28.9% 13-week relative strength versus SPY.
A failed hold above support would weaken the setup.
Actionable but governed by invalidation levels.
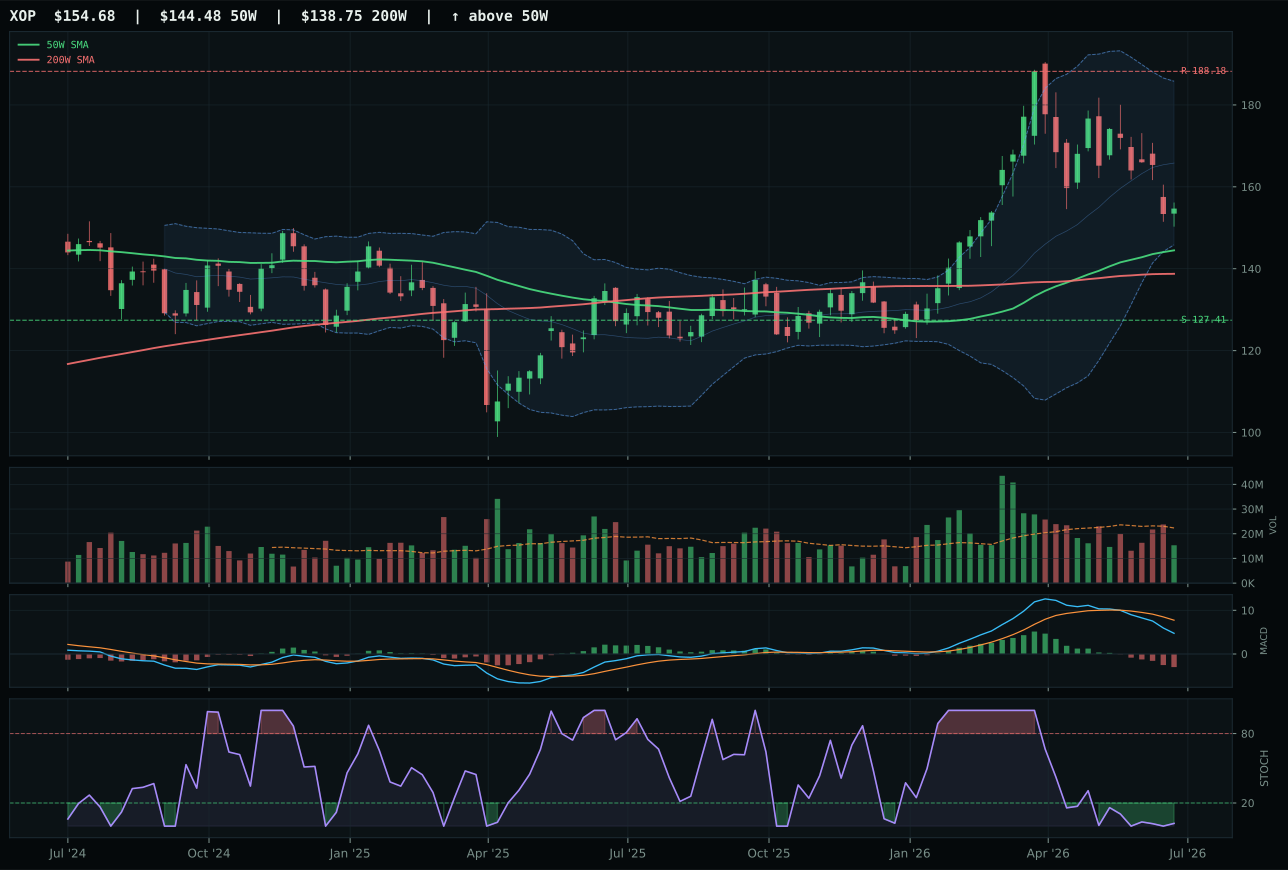
XOP has a neutral structure profile with -32.8% 13-week relative strength versus SPY.
A failed hold above support would weaken the setup.
Actionable but governed by invalidation levels.
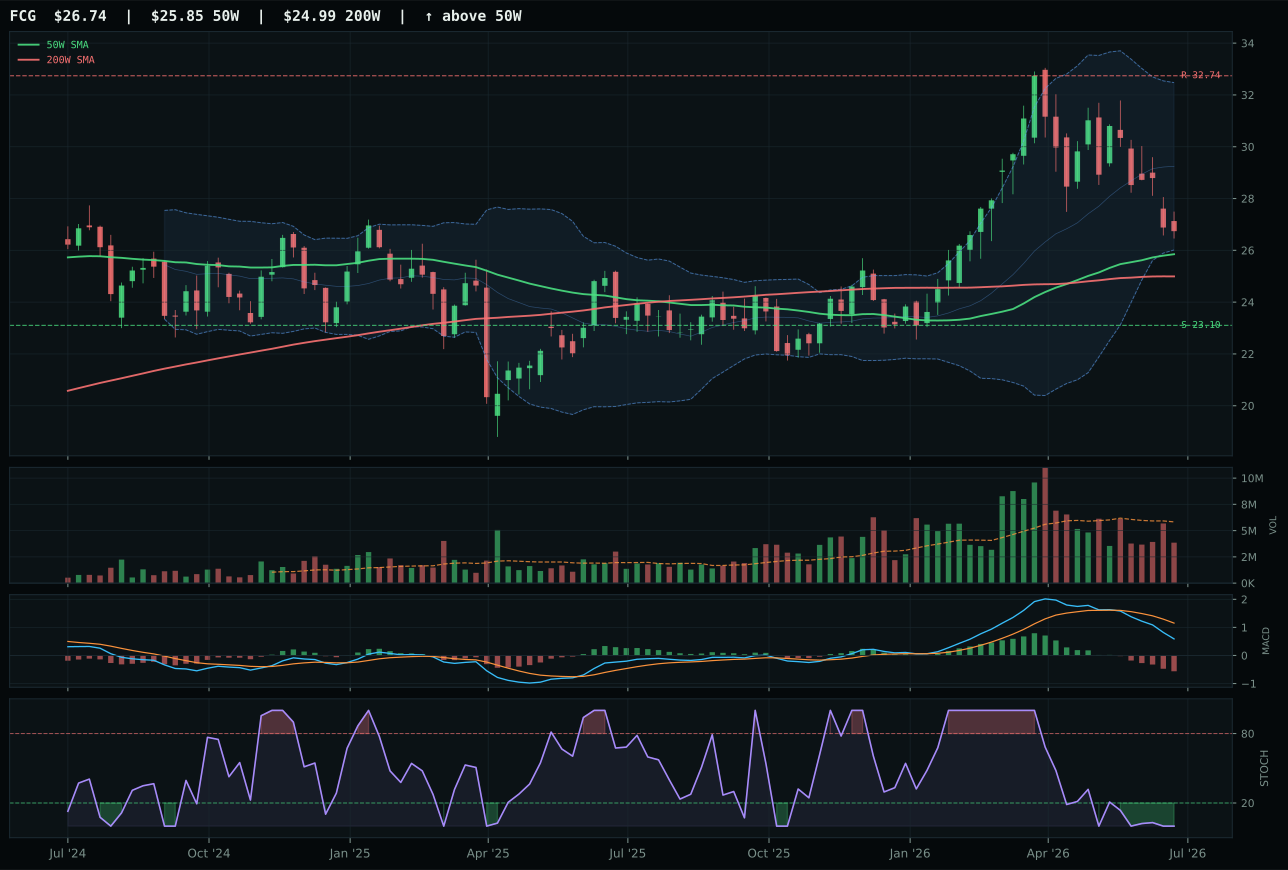
FCG has a neutral structure profile with -33.3% 13-week relative strength versus SPY.
A failed hold above support would weaken the setup.
Actionable but governed by invalidation levels.
XLE wins a thoroughly defeated category by the narrowest margin (2.8 points) because it maintains category-relative strength of 3.9% versus XOP's 0.0% and shows marginally superior risk-reward (67.0 vs 53.0). Both sit above the 50W with identical timing (77.0/100) and identical MACD/stochastic setup (bearish/weakening, oversold), but XLE's slight structural cleanliness edge (66.7 vs 62.6) and thin-but-neutral volume profile (0.68x, still better than distribution) give it the nod. This is not a quality win but a least-bad selection in a category hemorrhaging technicals: all three ETFs show -13% to -18% thirteen-week returns, -28% to -33% SPY-relative strength, and zero momentum confirmation. Support levels exist (XLE 45.65, XOP 127.41) but offer no conviction. The 2.8-point margin reflects the system's honesty: there is no good choice here, only ranked choices among severely damaged setups.
Traditional Energy scores 0.1 and receives zero allocation; it ranks 10th (dead last) in the portfolio. The macro story is unambiguous: Risk-Off Deterioration is a -10 catastrophic headwind, disinflation pressure is -10, credit stress is -7, and liquidity stress is -7. These combine to a 23.0/100 macro-fit score—the second-lowest in the portfolio after Agriculture. Real-asset sponsorship (+7) cannot overcome the regime's -34-point net deficit. Technical evidence is an additional disaster: XLE's 28.7/100 reflects 0.0% momentum confirmation, -28.9% SPY-relative strength, and thin-participation volume showing distribution. The 3/2/1 basket (XLE 30.2, XOP 26.3, FCG 24.9) averages 28.0 before final testing, then collapses to 0.1 after category reasoning applies the full deterioration penalty. This is emphatic exclusion: Traditional Energy offers neither technical strength nor macro support in a credit-stress, liquidity-stress, risk-off regime. The portfolio would need either a 20-point macro regime shift or a 50-point technical turnaround in consensus bullish energy signals to reconsider. Until then, the sector is off the table entirely.