
2026-06-05
Informational purposes only. The content in this report, including allocations, analysis, and commentary, is provided solely for informational and educational purposes. It does not constitute financial advice, investment advice, trading advice, or any other type of advice. Past performance does not guarantee future results. Always conduct your own research and consult a qualified financial professional before making investment decisions.
Weekly Allocation
| Ticker | Category | Weight | Role |
|---|---|---|---|
| CIBR | Technology | 20% | Top-2 (20%) |
| SMH | AI | 20% | Top-2 (20%) |
| ITA | Defense & Aerospace | 10% | Tier-2 (10%) |
| XLE | Traditional Energy | 10% | Tier-2 (10%) |
| COPX | Industrial Metals | 10% | Tier-2 (10%) |
| MOO | Agriculture & Livestock | 10% | Tier-2 (10%) |
| XLU | Utilities & Infrastructure | 10% | Tier-2 (10%) |
| ILF | Emerging Markets | 10% | Tier-2 (10%) |
Trade Instructions — Monday Open
Sell the tranche from 2026-05-08 (completing its 4-week hold). Buy the new tranche. Instructions show net portfolio changes — same-asset positions cancel, weight changes show the delta.
| Action | Ticker | Instruction |
|---|---|---|
| SELL | REMX | Sell entire REMX position (5.00% of portfolio) |
| SELL | URA | Sell 50% of URA position (reduce 5.00% → 2.50%) |
| SELL | WEAT | Sell 33% of WEAT position (reduce 7.50% → 5.00%) |
| SELL | ROKT | Sell 25% of ROKT position (reduce 10.00% → 7.50%) |
| SELL | PAVE | Sell 33% of PAVE position (reduce 7.50% → 5.00%) |
| BUY | CIBR | Buy CIBR — 16.67% of freed cash (adds 2.50% to portfolio) |
| BUY | MOO | Buy MOO — 16.67% of freed cash (adds 2.50% to portfolio) |
| BUY | COPX | Buy COPX — 16.67% of freed cash (adds 2.50% to portfolio) |
| BUY | ITA | Buy ITA — 16.67% of freed cash (adds 2.50% to portfolio) |
| BUY | XLU | Buy XLU — 16.67% of freed cash (adds 2.50% to portfolio) |
| BUY | ILF | Buy ILF — 16.67% of freed cash (adds 2.50% to portfolio) |
Current Portfolio After Trade
Combined holdings across all 4 active tranches. Each tranche is 25% of the portfolio.
| Ticker | % of Portfolio | Weight Bar |
|---|---|---|
| CIBR | 17.50% | |
| XLE | 12.50% | |
| SMH | 10.00% | |
| AIQ | 10.00% | |
| ROKT | 7.50% | |
| WEAT | 5.00% | |
| PAVE | 5.00% | |
| PICK | 5.00% | |
| MOO | 5.00% | |
| COPX | 5.00% | |
| URA | 2.50% | |
| IGF | 2.50% | |
| IEMG | 2.50% | |
| NLR | 2.50% | |
| ITA | 2.50% | |
| XLU | 2.50% | |
| ILF | 2.50% |
Macro Regime — Transition / Mixed
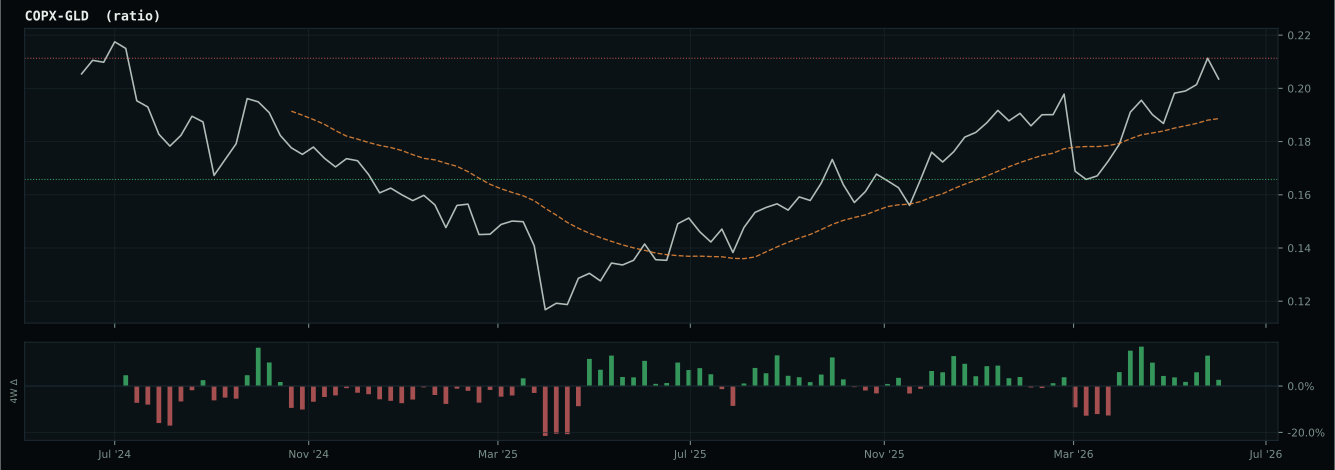
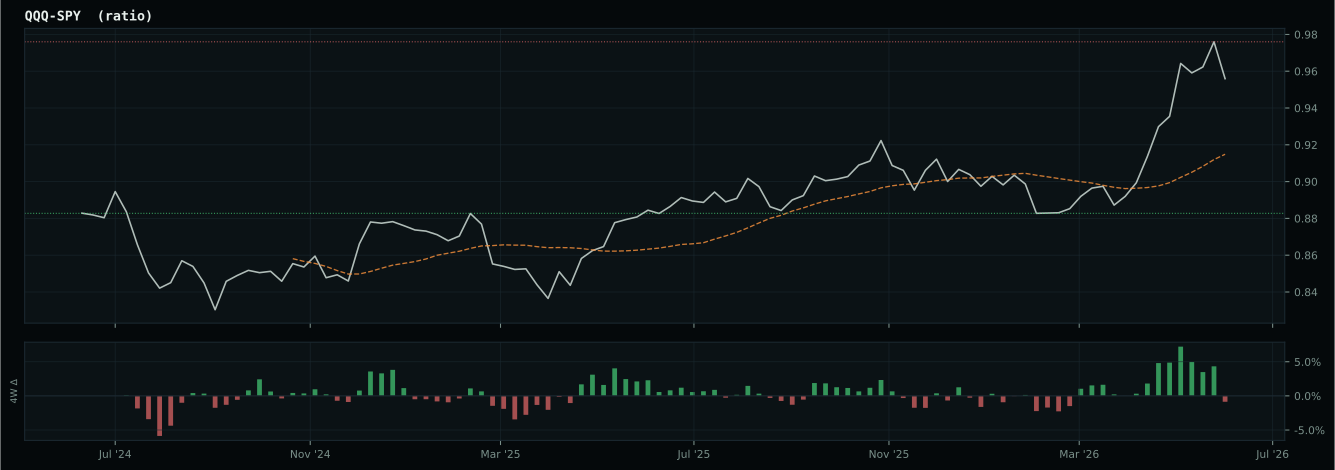
Macro Evidence Charts
Market-implied signals behind the macro regime scores. Each ratio compares two assets; the direction and slope of the ratio is what the macro engine reads.
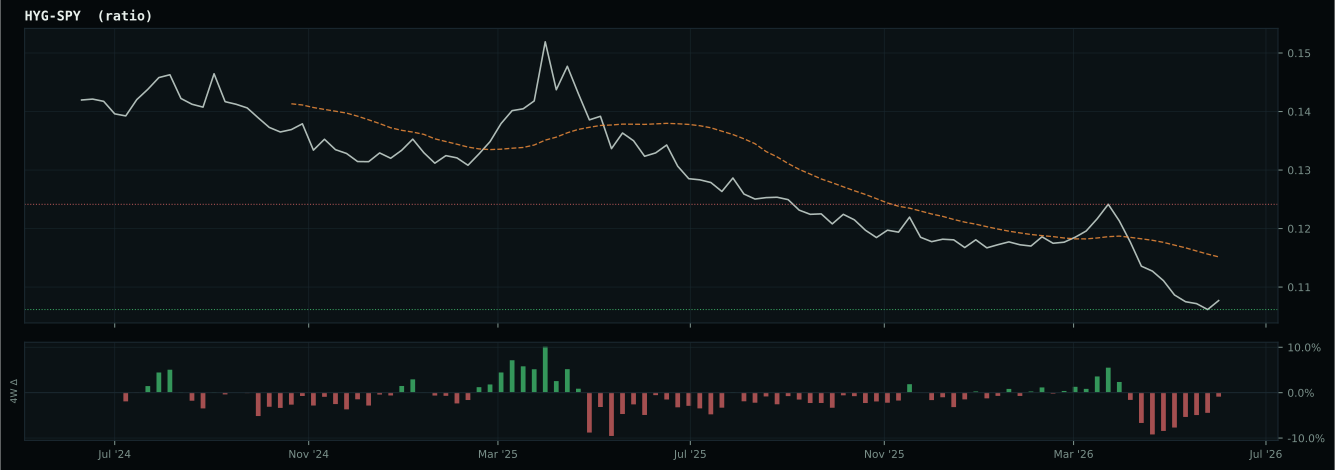
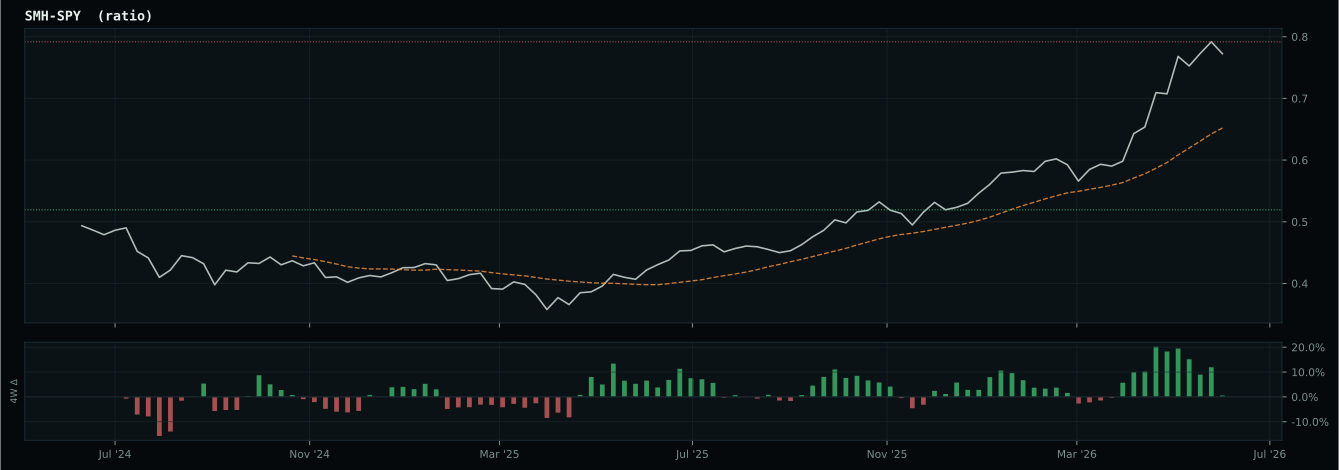
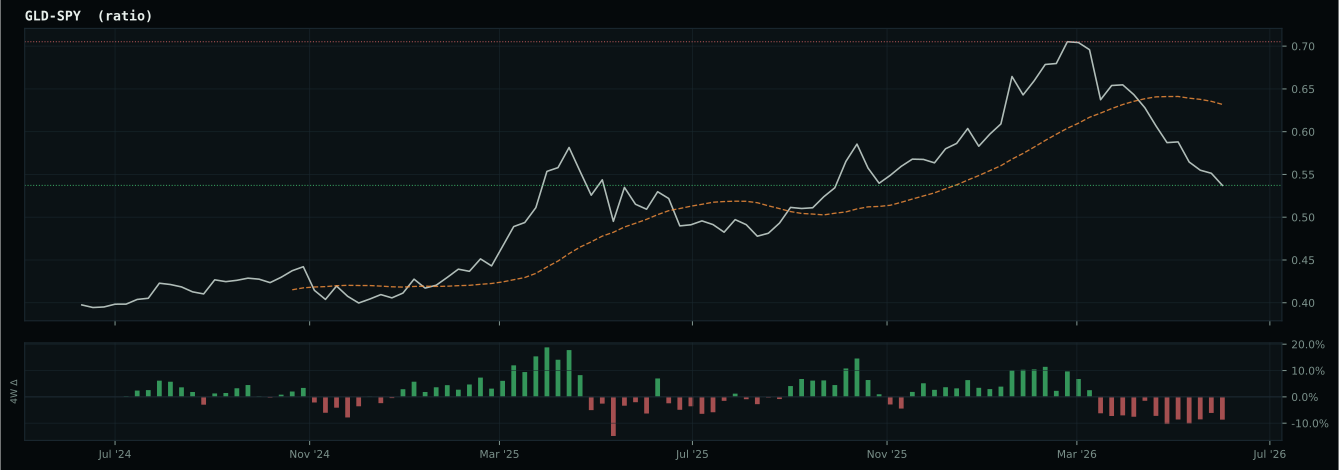
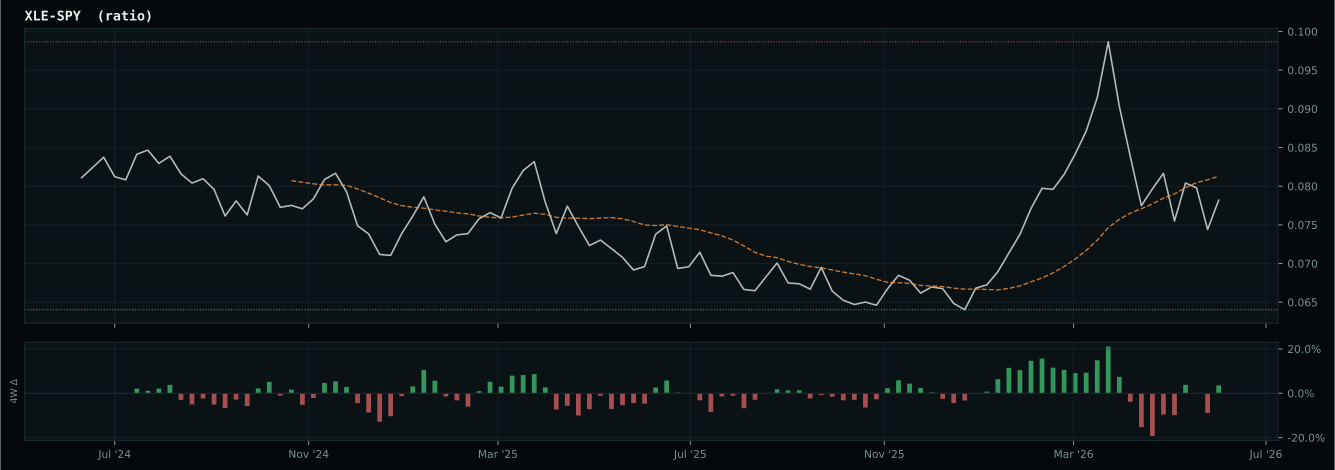
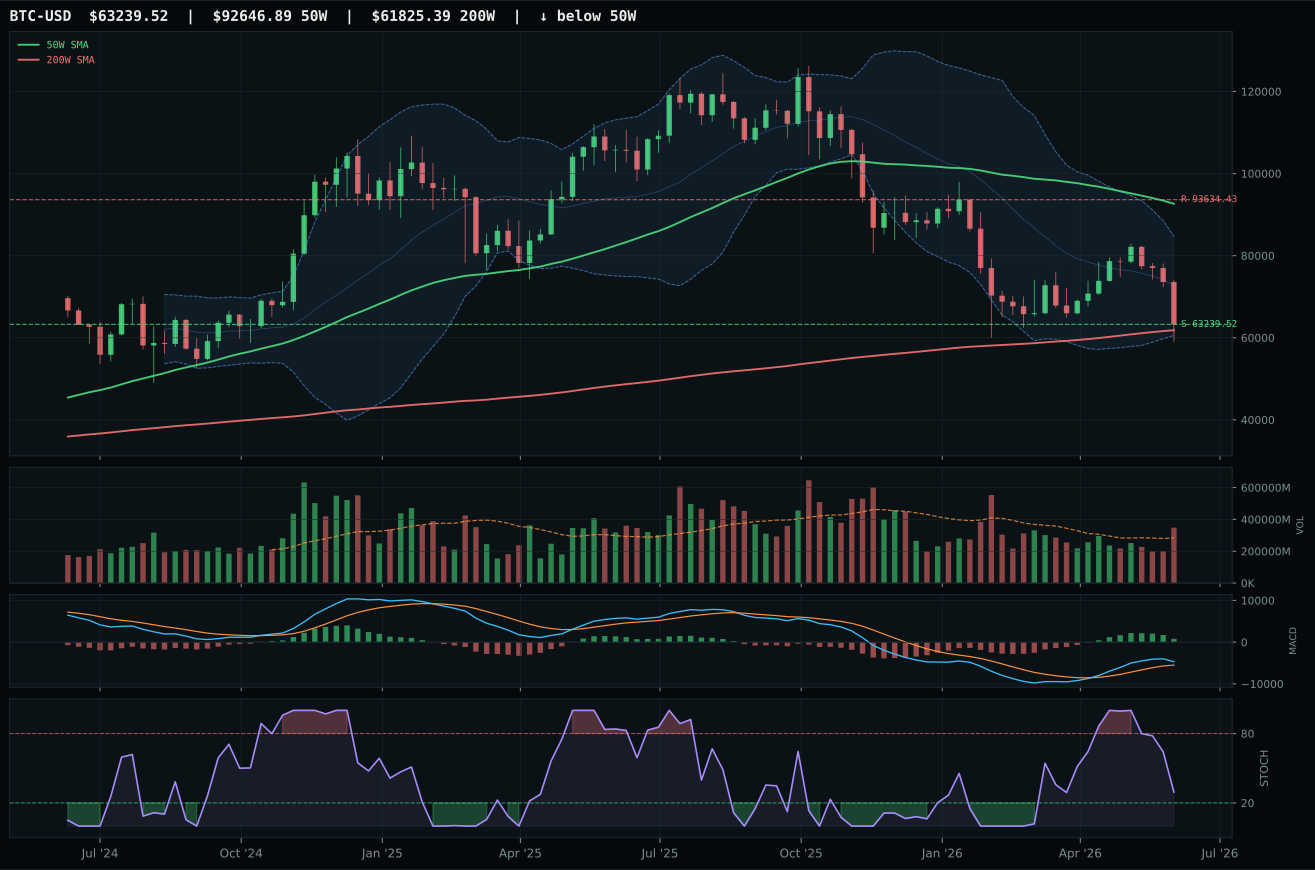
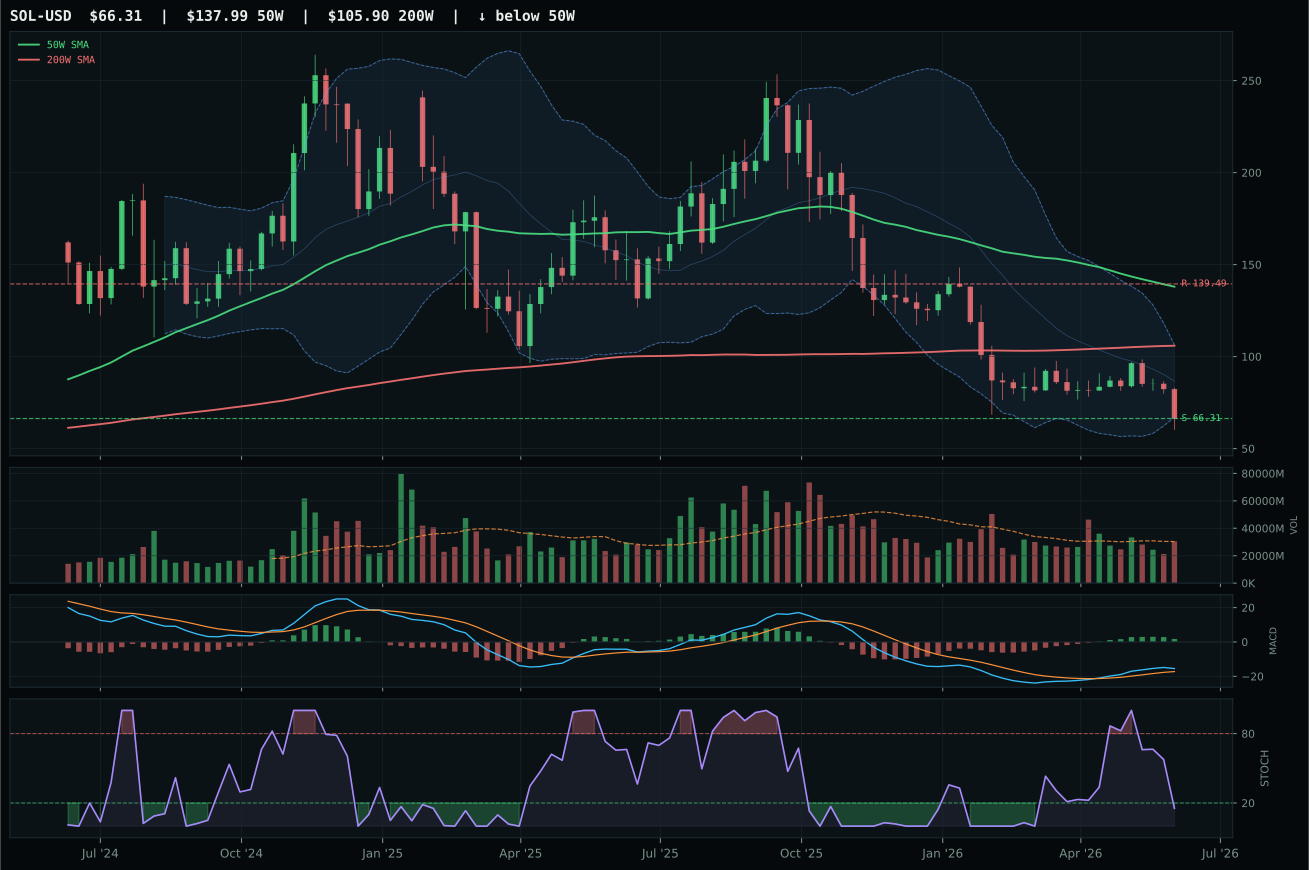
Crypto Regime — NoCrypto
ValueBTC armed; waiting for 50W reclaim, decisive close above post-touch range resistance by 3%
TrendBTC not confirmed
one or more available conditions failed
Category Rankings
| Rank | Category | Winner | Score | Alloc | 4W Ret | Peers (4W) |
|---|---|---|---|---|---|---|
| 1 | Technology | CIBR | 61.3 | 20% | +3.94% | XLK -1.4% · IGV -3.8% |
| 2 | AI | SMH | 54.1 | 20% | +1.65% | AIQ -2.1% · BOTZ -1.8% |
| 3 | Defense & Aerospace | ITA | 53.2 | 10% | +8.08% | XAR +4.6% · ROKT -1.6% |
| 4 | Traditional Energy | XLE | 51.2 | 10% | -8.64% | FCG -9.3% · XOP -8.4% |
| 5 | Industrial Metals | COPX | 47.2 | 10% | -4.92% | PICK -6.9% · REMX -4.2% |
| 6 | Agriculture & Livestock | MOO | 47.0 | 10% | +2.76% | VEGI +0.9% · WEAT +2.1% |
| 7 | Utilities & Infrastructure | XLU | 40.9 | 10% | +3.14% | PAVE +0.3% · IGF +1.0% |
| 8 | Emerging Markets | ILF | 40.1 | 10% | +1.68% | IEMG +1.5% · INDA +4.5% |
| 9 | Nuclear Energy | NLR | 37.6 | 0% | -7.37% | URA -6.2% · URNM -5.8% |
| 10 | Precious Metals | GLD | 32.9 | 0% | -4.35% | SLV -10.1% · GDX +0.2% |
Technology — CIBR
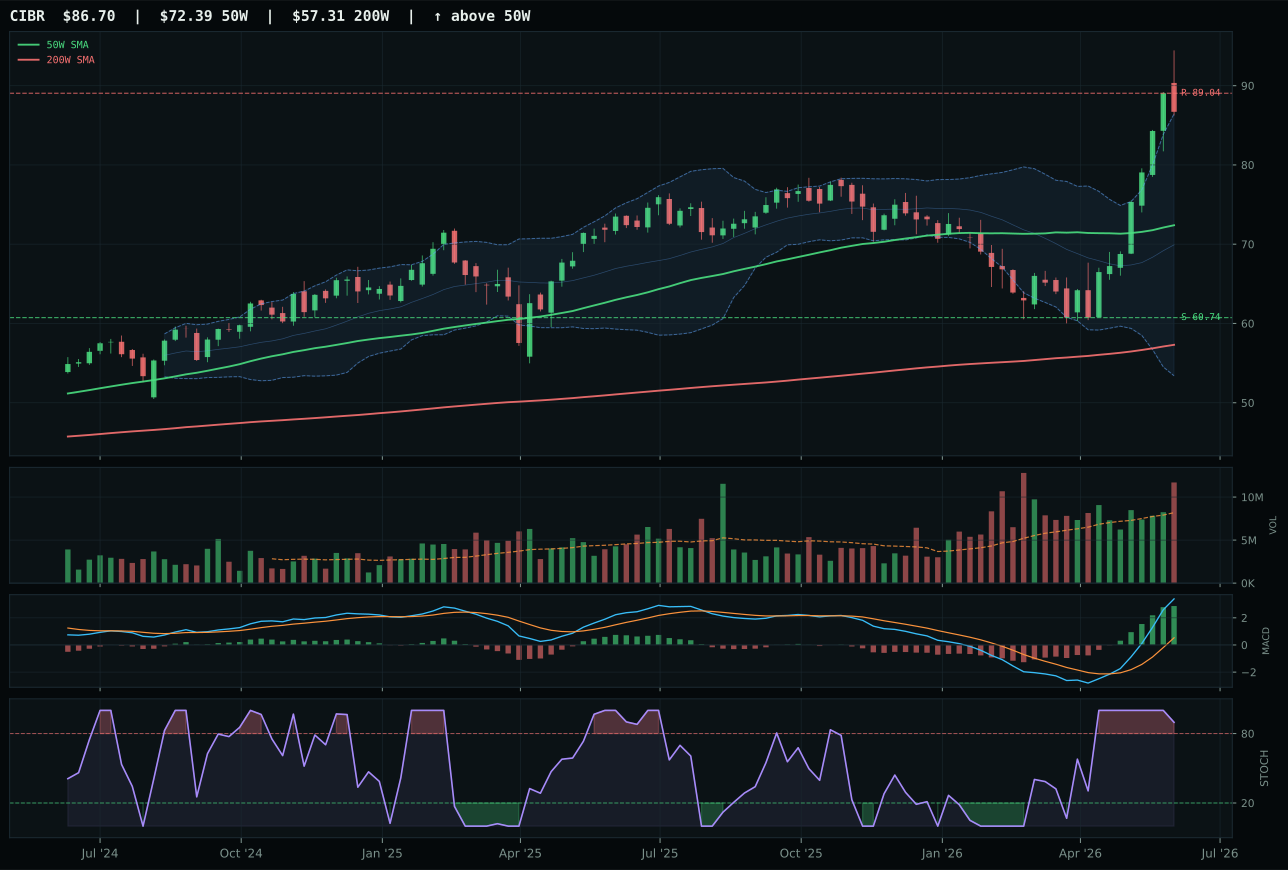
CIBR has a vertical extension profile with 21.7% 13-week relative strength versus SPY.
A failed hold above support would weaken the setup.
Actionable but governed by invalidation levels.
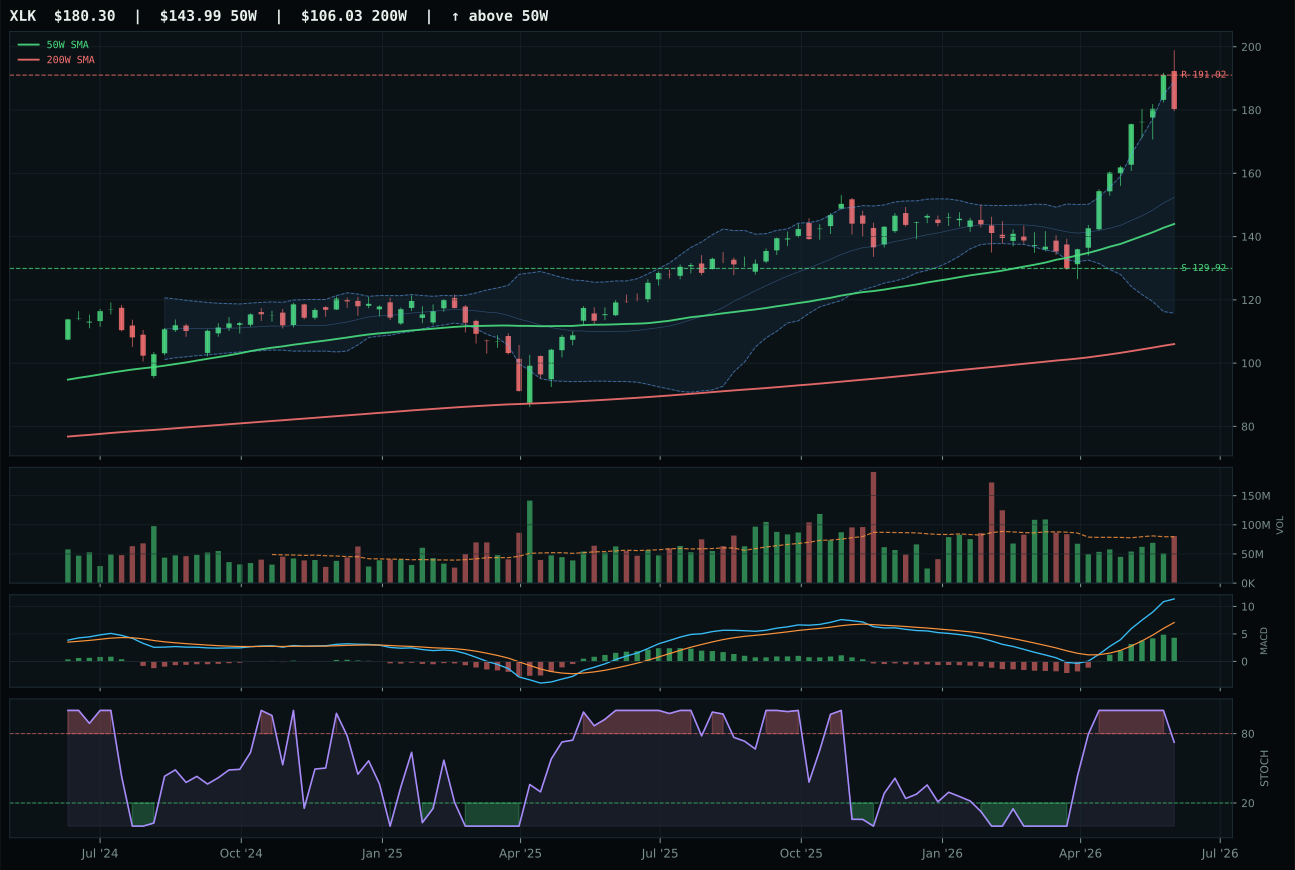
XLK has a vertical extension profile with 21.6% 13-week relative strength versus SPY.
A failed hold above support would weaken the setup.
Actionable but governed by invalidation levels.
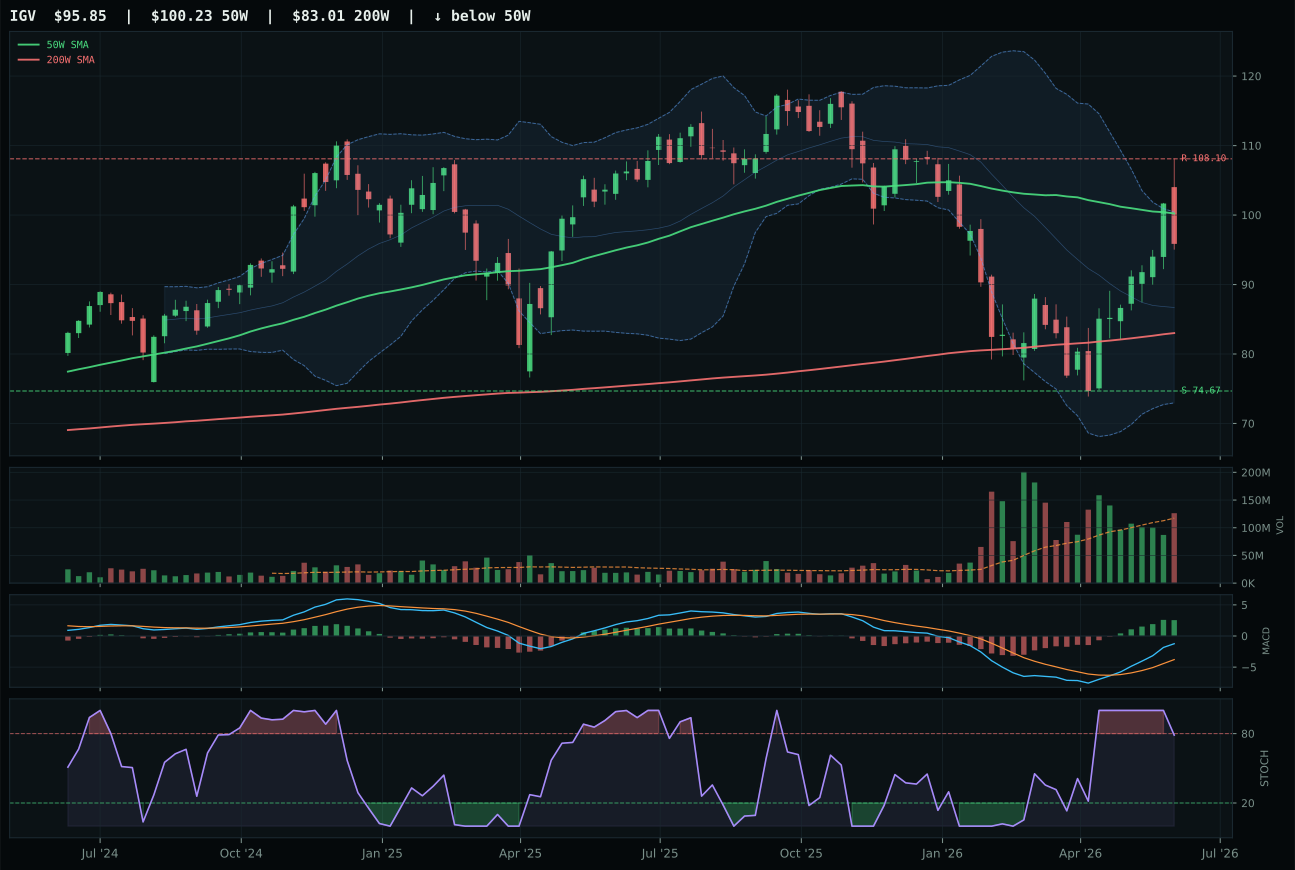
IGV has a neutral structure profile with -0.7% 13-week relative strength versus SPY.
A failed hold above support would weaken the setup.
Actionable but governed by invalidation levels.
CIBR wins the Technology category because it delivers the cleanest combination of trend strength and volume sponsorship among its peers. The 31.4% thirteen-week return sits atop a 21.7% relative strength advantage versus SPY, with MACD bullish and improving while stochastic RSI rolls over from overbought territory—a textbook sign that early accumulation has given way to late profit-taking. Above-average volume participation at 1.43x the twenty-week average confirms institutional buying rather than retail chase; this matters because XLK's runner-up technical evidence scored 71.6 versus CIBR's 78.4, yet XLK stumbled on neutral volume and a 25.2% extension from the 50W mean compared to CIBR's 19.8%. The vertical extension setup is penalizing both names for timing risk, but CIBR's superior volume-price confirmation (69.1 versus 74 for XLK) tips the category decision decisively.
Technology earned top-2 status and 20% allocation weight because the category scored 61.3, placing it among the two highest-ranking opportunity sets available this week in a Transition/Mixed macro regime. The cybersecurity-focused positioning of CIBR within the broader tech theme offers genuine diversification from the AI-compute thesis dominating allocation flows, while the 54.0% macro fit score reflects genuine sponsorship from active credit-stress concerns that justify defensive technology exposure. Risk appetite remains positive in the regime, but the +2 credit-stress signal is material enough to reward the steadier tech subtheme over broad profitable technology leadership. Entry risk is elevated—the 67% extension above the 50W means new money is paying a full price—but the category's 62% weighting toward technical evidence versus 38% macro fit ensures the allocation reflects genuine chart strength rather than macro narrative drift.
AI — SMH
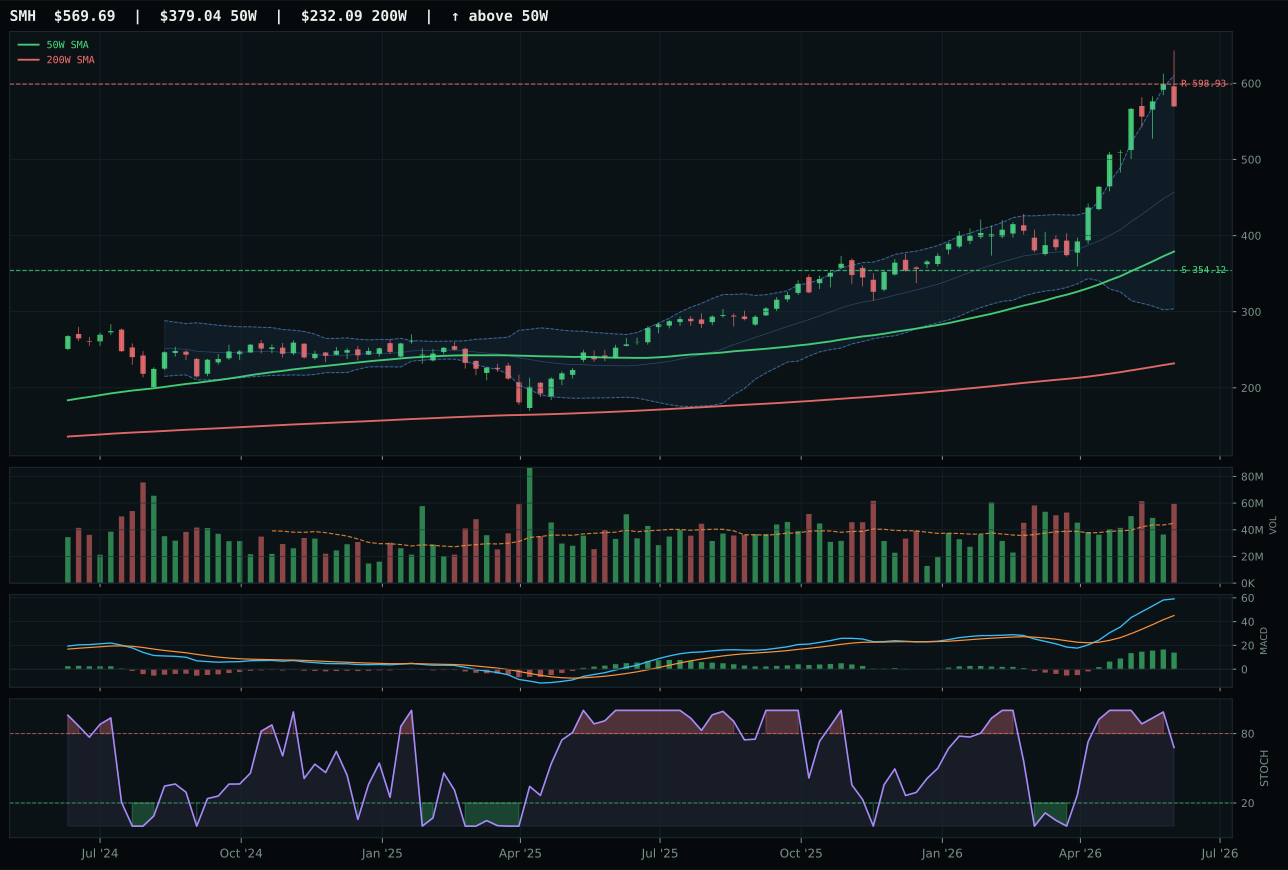
SMH has a vertical extension profile with 40.0% 13-week relative strength versus SPY.
A failed hold above support would weaken the setup.
Actionable but governed by invalidation levels.
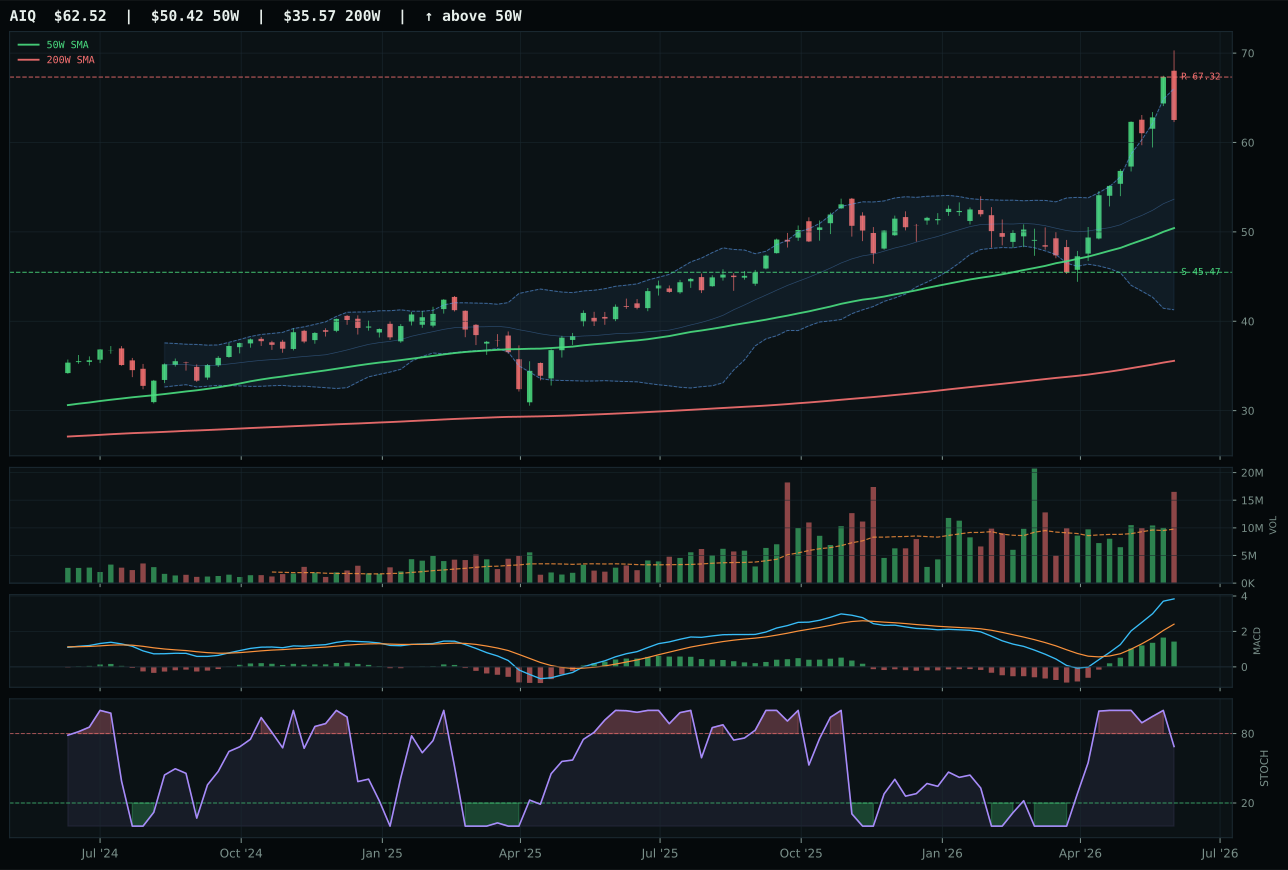
AIQ has a vertical extension profile with 17.6% 13-week relative strength versus SPY.
A failed hold above support would weaken the setup.
Actionable but governed by invalidation levels.
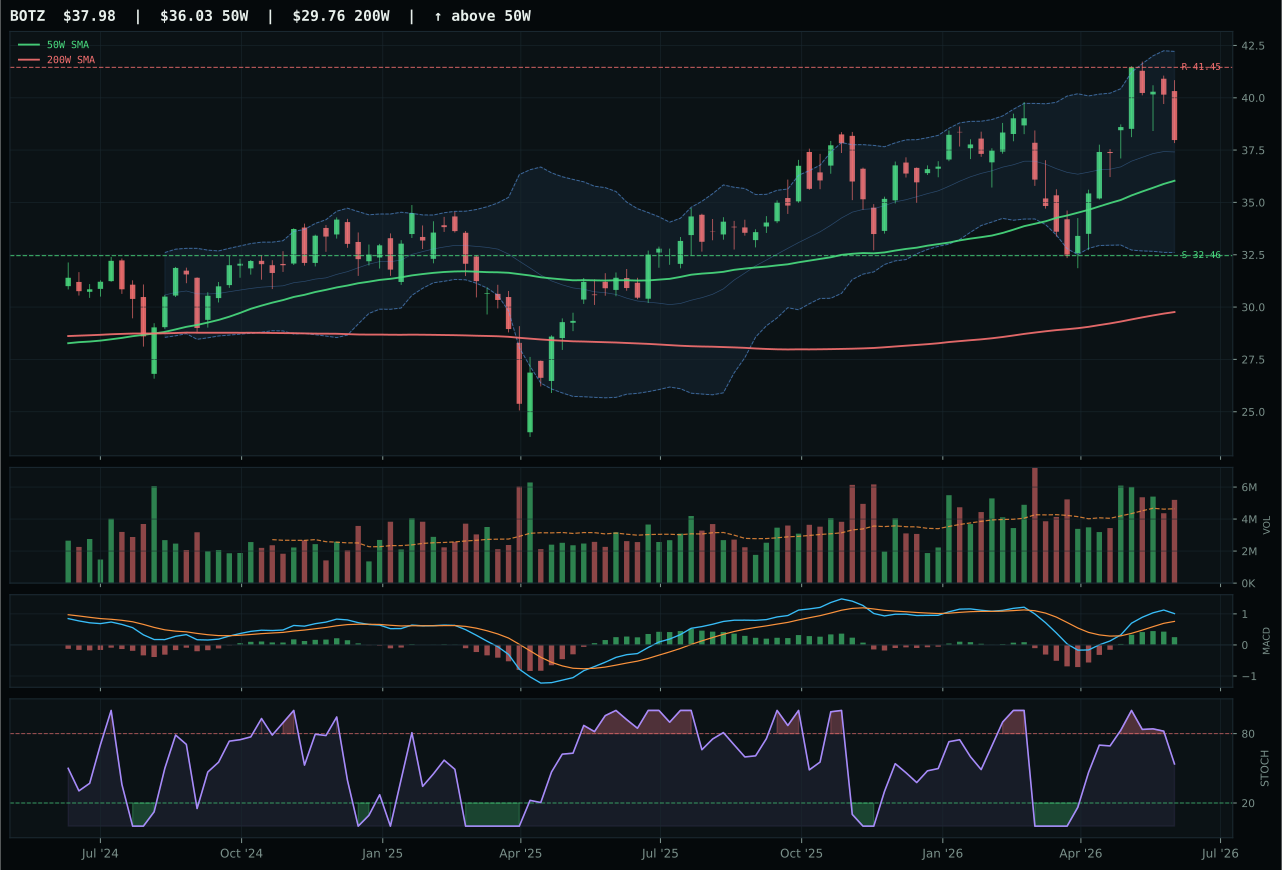
BOTZ has a neutral structure profile with -4.5% 13-week relative strength versus SPY.
A failed hold above support would weaken the setup.
Actionable but governed by invalidation levels.
SMH dominates the AI category with a 49.7% thirteen-week return and a 40.0% relative strength edge versus SPY, more than double AIQ's 17.6% SPY-relative performance. The semiconductor compute thesis benefits from both AI-growth sponsorship (+14) and genuine volume confirmation: 1.32x average participation shows institutions are accumulating the extended position rather than rotating away. Crucially, SMH demonstrates 22.4% category-relative strength—it's winning inside its own three-ETF basket—while AIQ shows 0.0%, a critical differentiator when all names feature vertical extension setups and bullish-improving MACD signals. AIQ's distribution-pressure volume profile exposes the theoretical strength in its 27.3% thirteen-week return as consensus-driven rather than conviction-driven, whereas SMH's above-average participation, perfect 100.0 persistence score, and 90.4 volume-price confirmation suggest the move has institutional staying power despite the 50.3% extension from the 50W.
AI earned the second top-2 slot and 20% allocation because it scored 54.1, qualifying it as one of the two most attractive categories available, powered by a 66.0% macro fit score that heavily weights AI-growth sponsorship at +14 points. The Transition/Mixed regime paradoxically favors risk-on posturing in SMH because emerging AI infrastructure spending remains unaffected by mixed-regime signals; energy scarcity, supply shortages, and computing demand create positive feedback loops independent of credit cycles. The technical evidence at 90.6 for SMH is exceptional and dominates the 62% technical weight in the final category score, while the macro contribution at 68.0 reflects genuine regime alignment rather than stretched narrative leverage. Timing risk is real—50.3% above the 50W is not defensible for new entrants—but the category's total score reflects that SMH is accumulating strength with confirmation, not chasing price. This allocation rewards the genuine breadth and institutional confidence in the AI-compute theme.
Defense & Aerospace — ITA
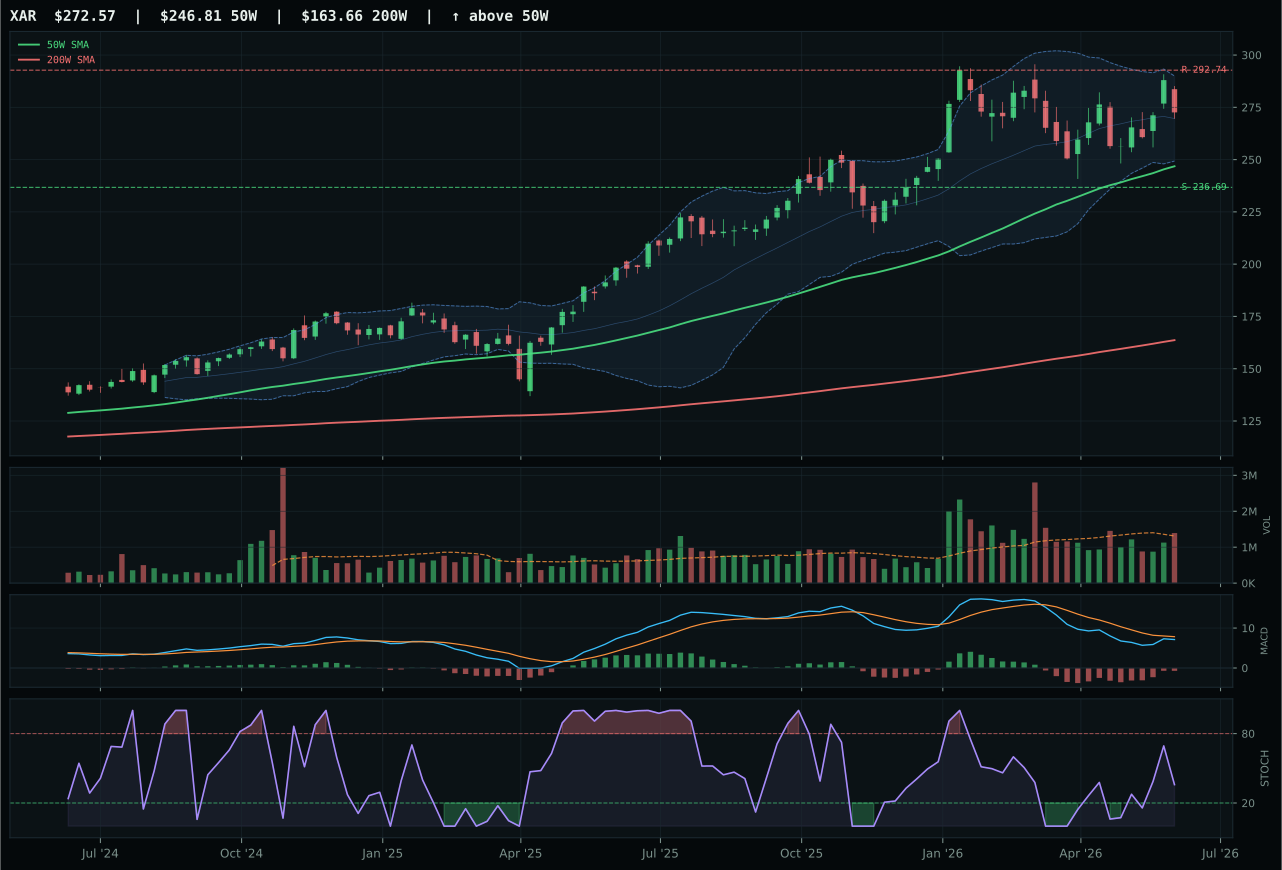
XAR has a neutral structure profile with -12.1% 13-week relative strength versus SPY.
A failed hold above support would weaken the setup.
Actionable but governed by invalidation levels.
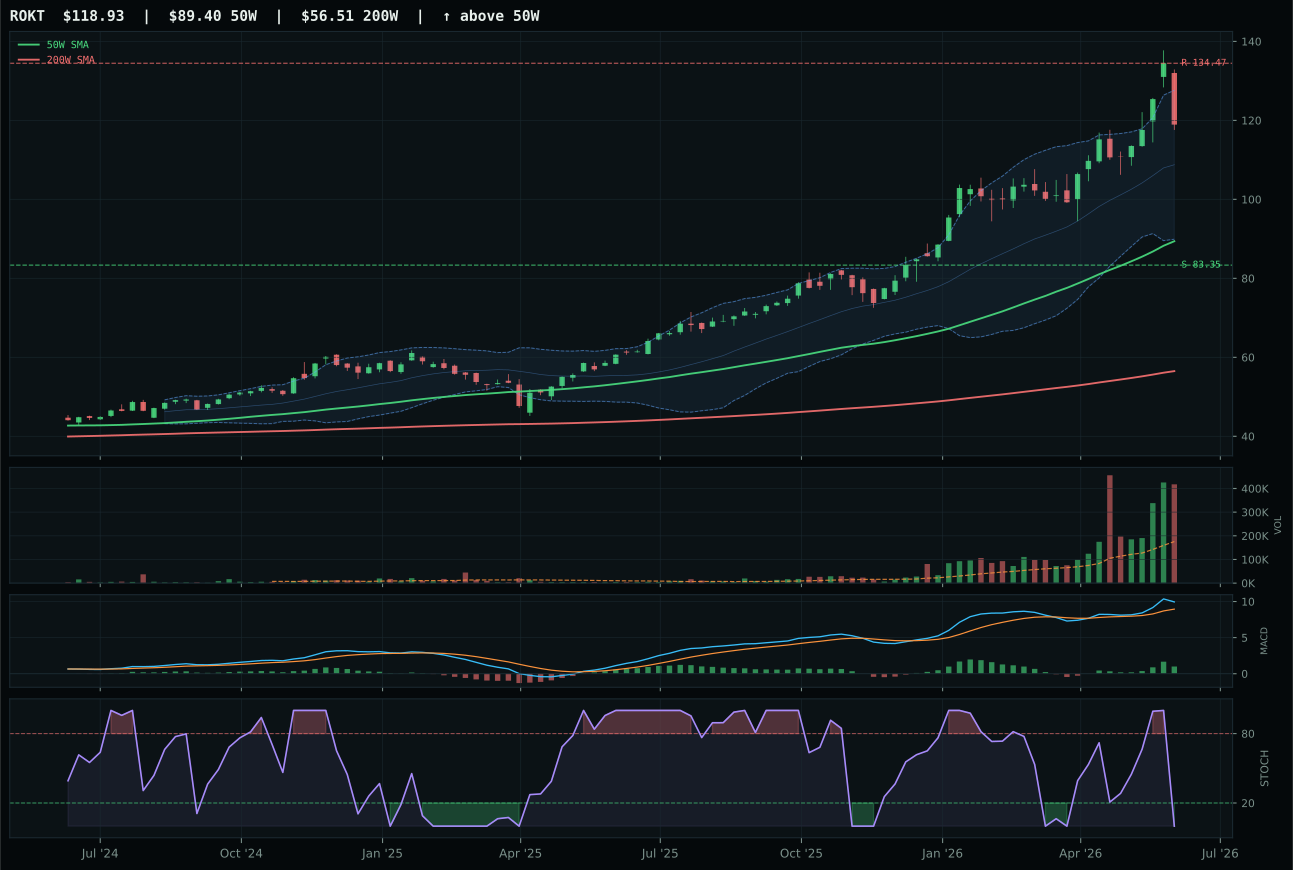
ROKT has a vertical extension profile with 6.6% 13-week relative strength versus SPY.
A failed hold above support would weaken the setup.
Actionable but governed by invalidation levels.
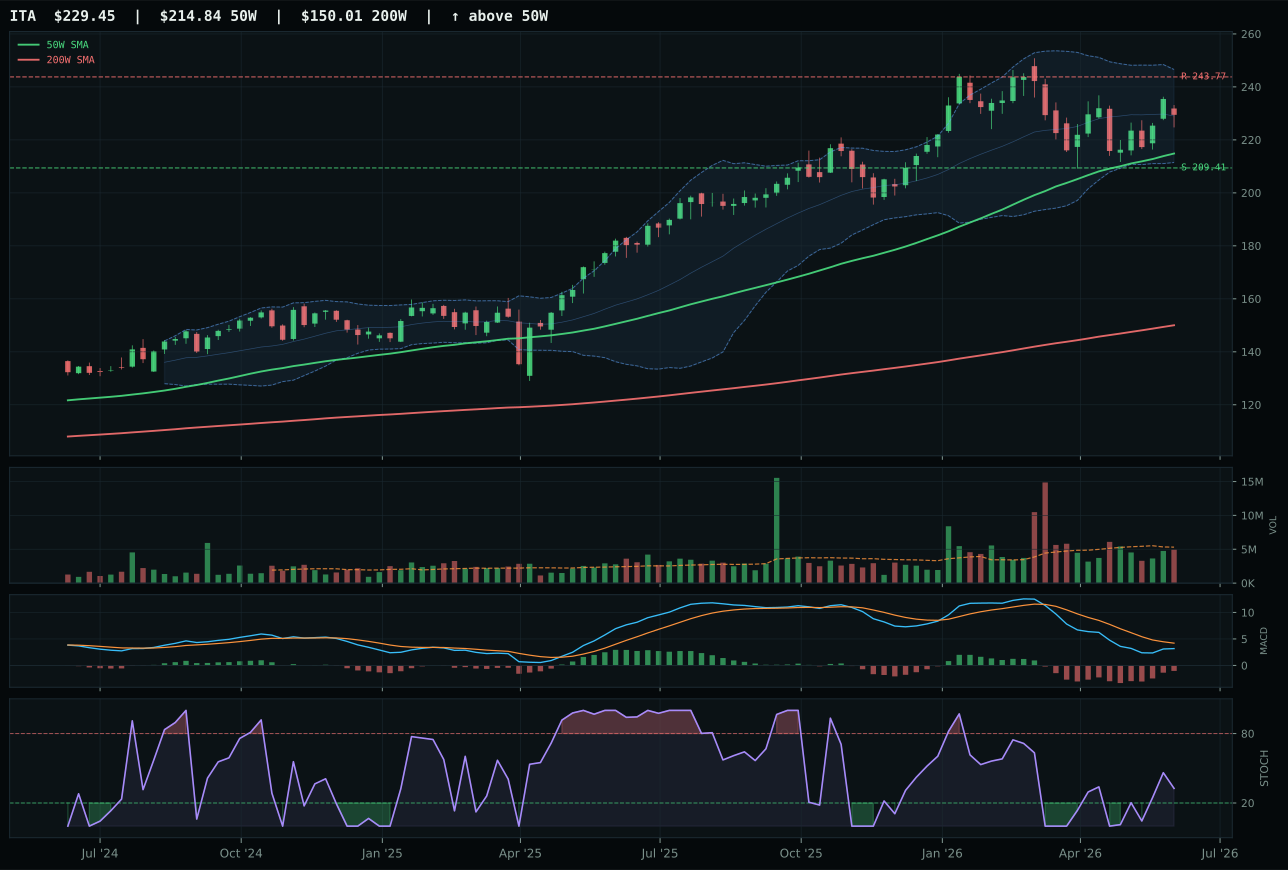
ITA has a neutral structure profile with -15.0% 13-week relative strength versus SPY.
A failed hold above support would weaken the setup.
Actionable but governed by invalidation levels.
ITA edges XAR in a close 53.2-category decision despite losing to it in the reasoned ETF proof order (XAR 57.6 versus ITA 54.9), a signal that the category reasoner's final test against macro state and setup quality tipped the decision toward the representative with better risk/reward geometry. ITA's 56.0 risk/reward score beats XAR's 53.2 because the chart sits only 6.8% above the 50W with tight support at 209.41 and resistance at 243.77, creating an asymmetric payoff where downside risk is 9.6% versus upside potential limited to 5.9%. Both names are momentum-depleted with negative thirteen-week returns and weak category-relative strength, but ITA's superior timing score (83.0 versus XAR's 83.0, but with cleaner compression and 72.5 structure versus XAR's 68.8) gives portfolio managers a better-defined invalidation area if the thesis fails. This is a low-conviction category decision made entirely on technical merit; macro fit is neutral, and neither ETF brings conviction to the regime.
Defense & Aerospace received 10% allocation despite a 53.2 score because it qualified as eligible and ranked above several alternatives, but it sits in the lower half of the category stack for a reason: the category-level technical evidence of 55.9 for the representative is weak, and the macro fit at 50.0 offers zero conviction either direction. Transition/Mixed helps marginally at +3, and credit stress adds +2, suggesting defensive mandates are receiving slight portfolio attention, but the negative thirteen-week return of -5.3% and -15.0% SPY-relative weakness tell the real story—momentum and participation are both lacking. This allocation is structural rather than tactical; it serves as portfolio ballast in a regime where growth and real assets are dominating capital flows. Upgrading this to 20% would require either a sharp technical reversal with volume confirmation or a shift in regime signals toward explicit credit stress or geopolitical escalation. Until then, it earns its 10% slot as a diversifying satellite exposure.
Traditional Energy — XLE
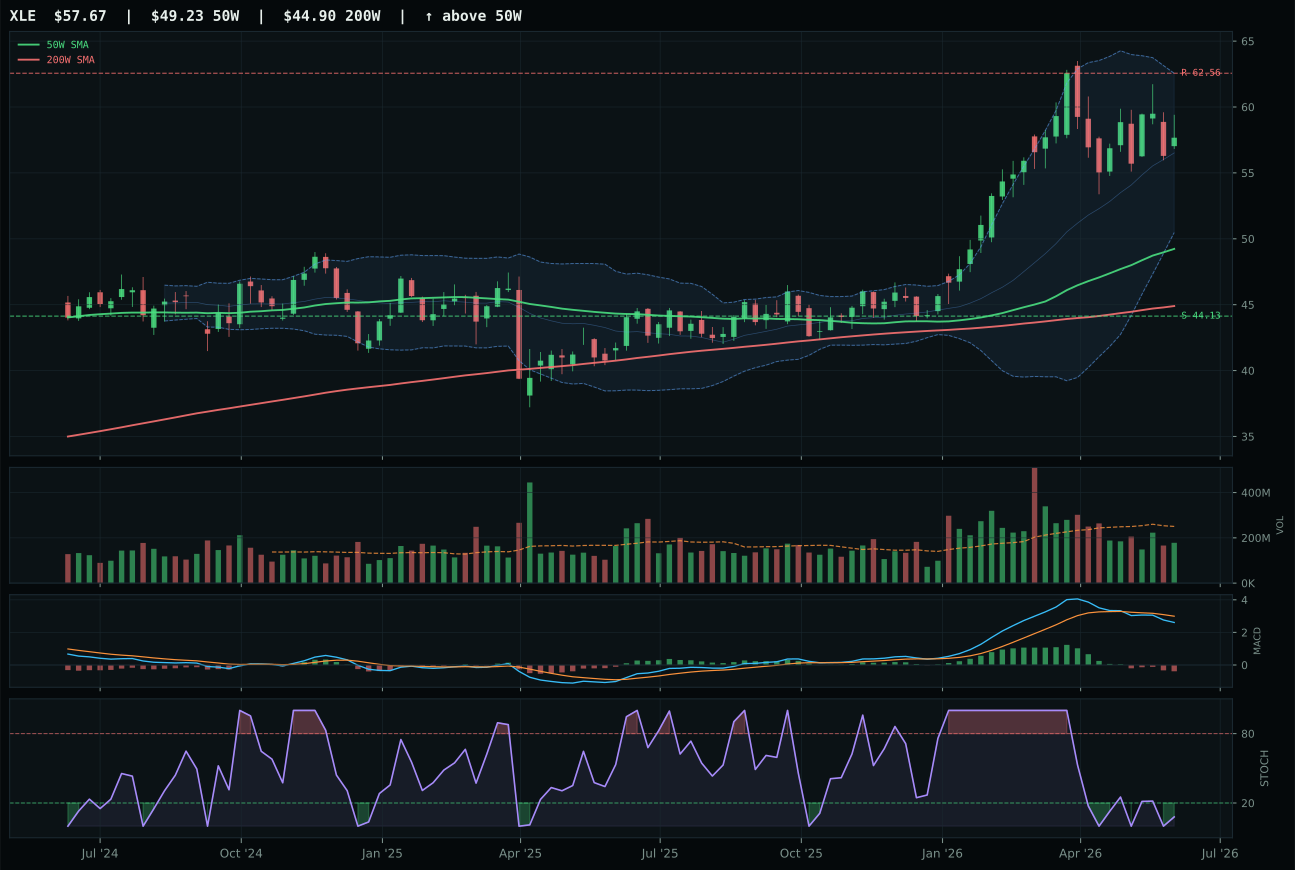
XLE has a vertical extension profile with -7.7% 13-week relative strength versus SPY.
A failed hold above support would weaken the setup.
Actionable but governed by invalidation levels.
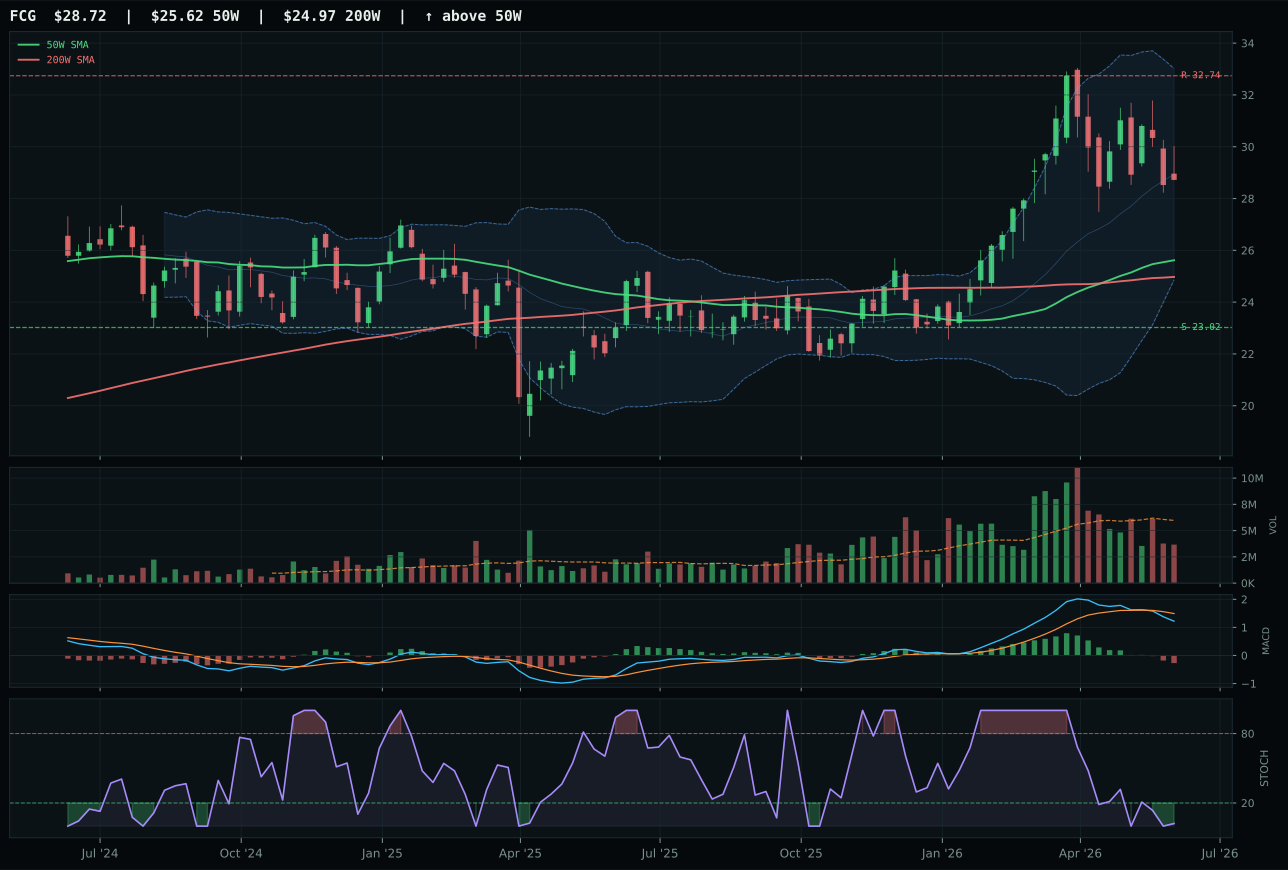
FCG has a neutral structure profile with -10.9% 13-week relative strength versus SPY.
A failed hold above support would weaken the setup.
Actionable but governed by invalidation levels.
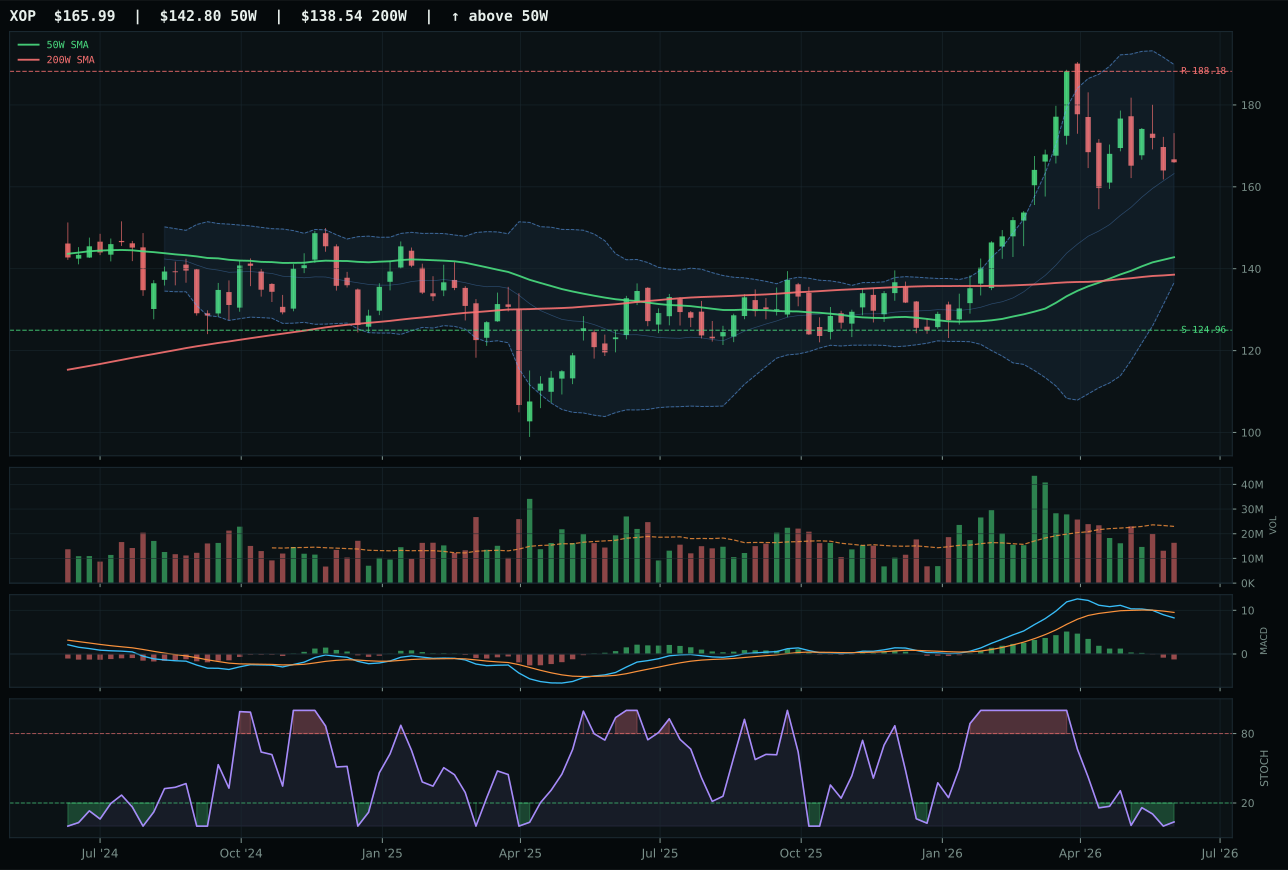
XOP has a vertical extension profile with -8.6% 13-week relative strength versus SPY.
A failed hold above support would weaken the setup.
Actionable but governed by invalidation levels.
XLE wins Traditional Energy on technical positioning despite losing the macro fit battle; COPX scores stronger on macro evidence, but XLE's chart framework beats both FCG and XOP on timing and risk/reward geometry. Extended 17.1% above the 50W with support at 44.13 and resistance at 62.56, XLE offers 30.7% downside cushion to support versus only 7.8% upside to resistance—a profile that discourages chasing breakouts but rewards patient capital on weakness. Bearish/weakening MACD and oversold stochastic RSI at 0.08 signal that momentum buyers have exhausted themselves, and thin participation at 0.71x average confirms that volume sponsorship is absent despite the uptrend. FCG's 77.0 timing score and superior 62.0 risk/reward structure appear stronger, but FCG's neutral volume and weaker category-relative strength at -2.4% expose it as a lagging play; XLE's +0.8% category-relative strength indicates it's holding leadership position within the energy theme. Both are momentum-depleted with negative momentum confirmation, but XLE's vertical-extension structure versus FCG's neutral setup gives XLE better invalidation clarity.
Traditional Energy earned 10% allocation on a 51.2 category score driven entirely by macro conviction: the 85.0% macro fit is the strongest in the entire portfolio, powered by energy scarcity (+16), inflation pressure (+10), supply shortage (+9), and real-asset sponsorship (+7). Technical evidence for XLE at 26.7 is weak—momentum is zero, volume is thin, and the thirteen-week return of 1.9% reflects sideways consolidation—but this allocation is macro-driven not chart-driven. In Transition/Mixed conditions, energy supply constraints and scarcity narratives are moving from tail-risk concepts to operational realities, justifying structural exposure despite poor technicals. The bearish MACD and oversold stochastic suggest the setup is vulnerable to intermediate weakness, but the macro tailwinds are strong enough to ignore short-term noise. This allocation rewards regime rotation into real assets and supply-constraint hedges; it explicitly accepts current technical weakness in exchange for positioning ahead of macro acceleration in energy-scarcity signals. Upgrading would require either volume participation to expand or headline evidence of supply disruptions that would validate the macro case.
Industrial Metals — COPX
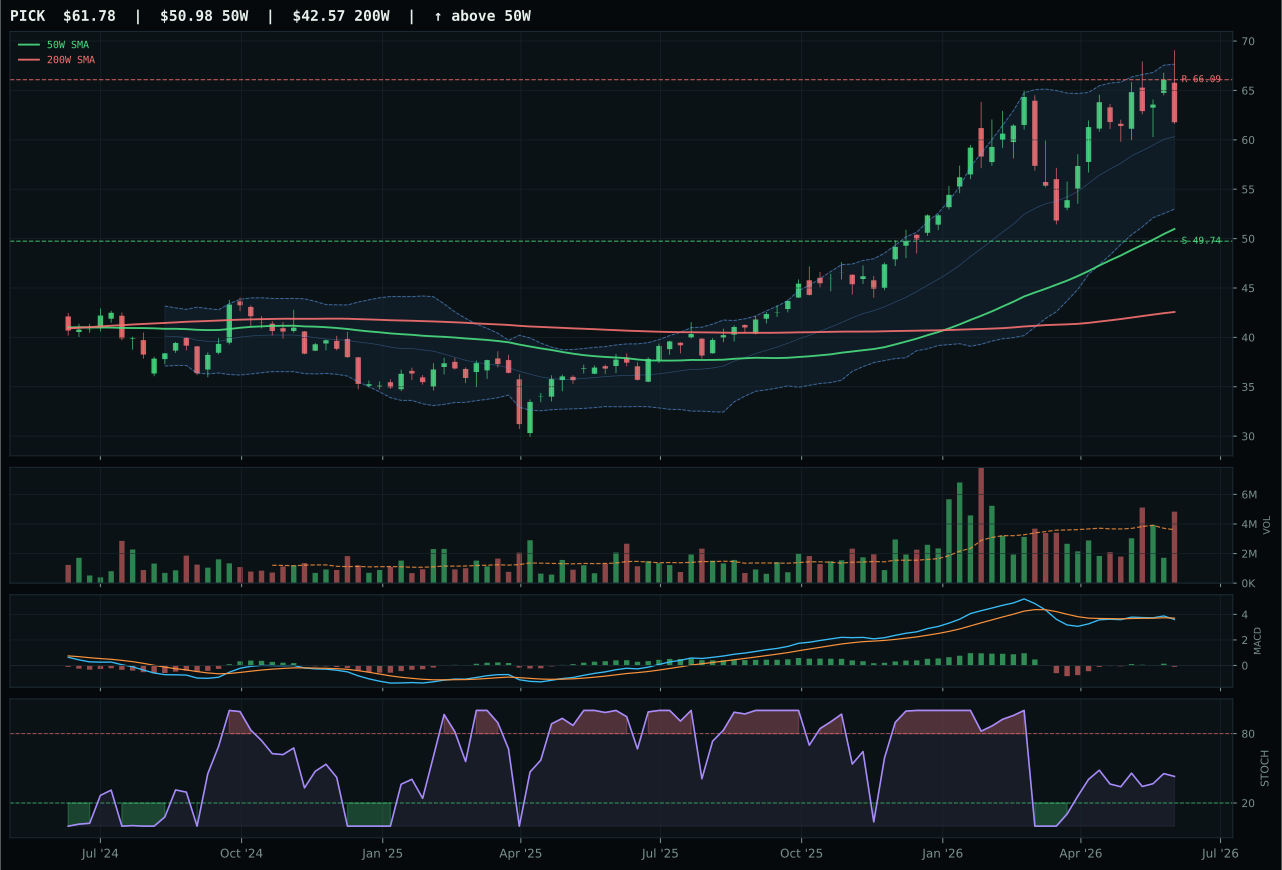
PICK has a vertical extension profile with -2.0% 13-week relative strength versus SPY.
A failed hold above support would weaken the setup.
Actionable but governed by invalidation levels.
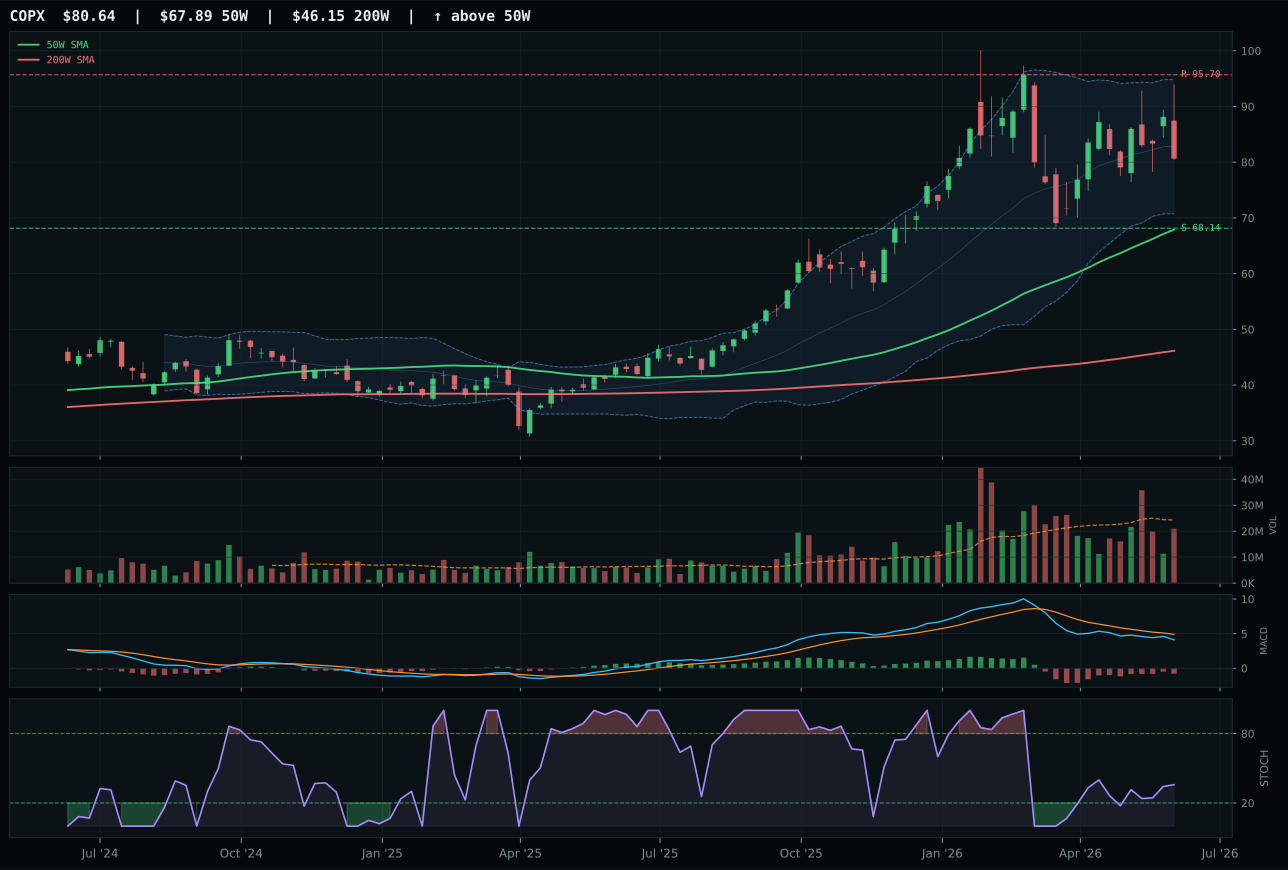
COPX has a vertical extension profile with -8.8% 13-week relative strength versus SPY.
A failed hold above support would weaken the setup.
Actionable but governed by invalidation levels.
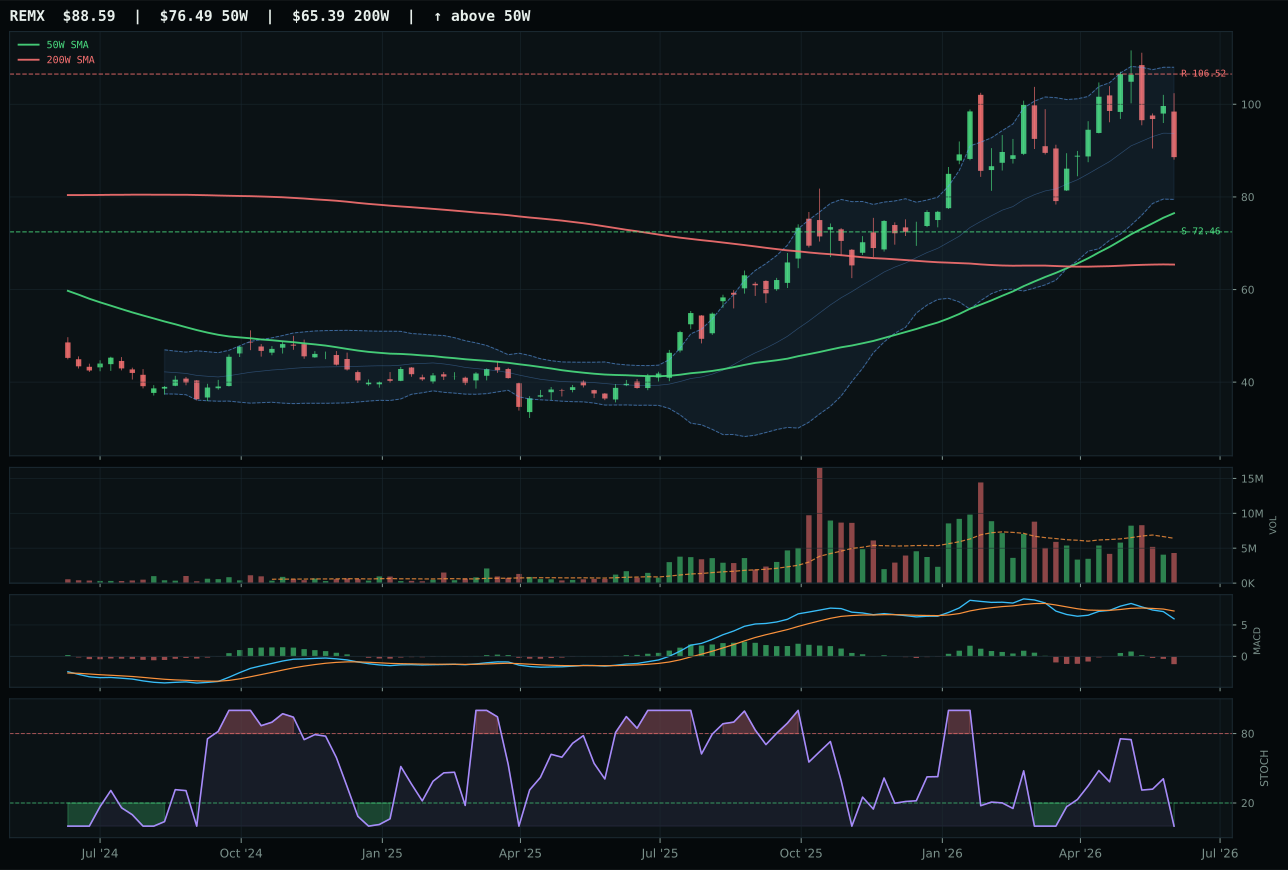
REMX has a vertical extension profile with -14.0% 13-week relative strength versus SPY.
A failed hold above support would weaken the setup.
Actionable but governed by invalidation levels.
COPX wins Industrial Metals despite losing to PICK in the reasoned ETF proof order (PICK 52.7 versus COPX 48.5) because the category reasoner's final test weighted timing and setup quality in its decision—COPX's 61.0 timing score beats PICK's 56.0, and COPX's cleaner structure (66.4 versus PICK's broader compression) provides better trade geometry. Extended 18.8% above the 50W, COPX trades at upper retracement zone near Fibonacci 0.382 with rising-mid-zone stochastic RSI and bearish-but-improving MACD, signaling that weakness is slowing even though upside momentum has stalled. PICK's above-average 1.43x volume participation and positive 7.7% thirteen-week return appear stronger on paper, but the bearish/weakening MACD and lack of timing conviction—its stochastic is rising mid-zone but not confirming breakout—suggest PICK is treading water rather than accumulating. The critical difference: COPX's 0.0% category-relative strength matches PICK's, but COPX's timing framework at 61.0 is superior, indicating copper-scarcity positioning offers better entry asymmetry than diversified mining breadth.
Industrial Metals earned 10% allocation on a 47.2 category score because the macro fit at 73.0 is the strongest argument for the position, driven by metals scarcity (+14), commodity breadth positive (+10), and real-asset sponsorship (+6). In Transition/Mixed conditions, this macro profile is genuinely active and material, justifying capital deployment despite weak technical evidence of 38.8 for COPX. The category reasoner's final test recognized that the macro environment is shifting toward supply-constraint narratives independent of credit cycles, making this a structural allocation rather than a technical entry. Timing risk is material—18.8% above the 50W leaves little room for new entrants—but patient allocation into technical weakness when macro sponsors are turning positive is the regime's playbook. Volume is neutral, momentum is weak, and the thirteen-week return of 0.9% reflects sideways consolidation, suggesting this allocation is a bet that copper and industrial metals will break out once macro sponsors (energy scarcity, inflation pressure, supply shortage) move from conceptual to realized price impact. Upgrading would require volume participation to expand or a meaningful supply-disruption headline.
Agriculture & Livestock — MOO
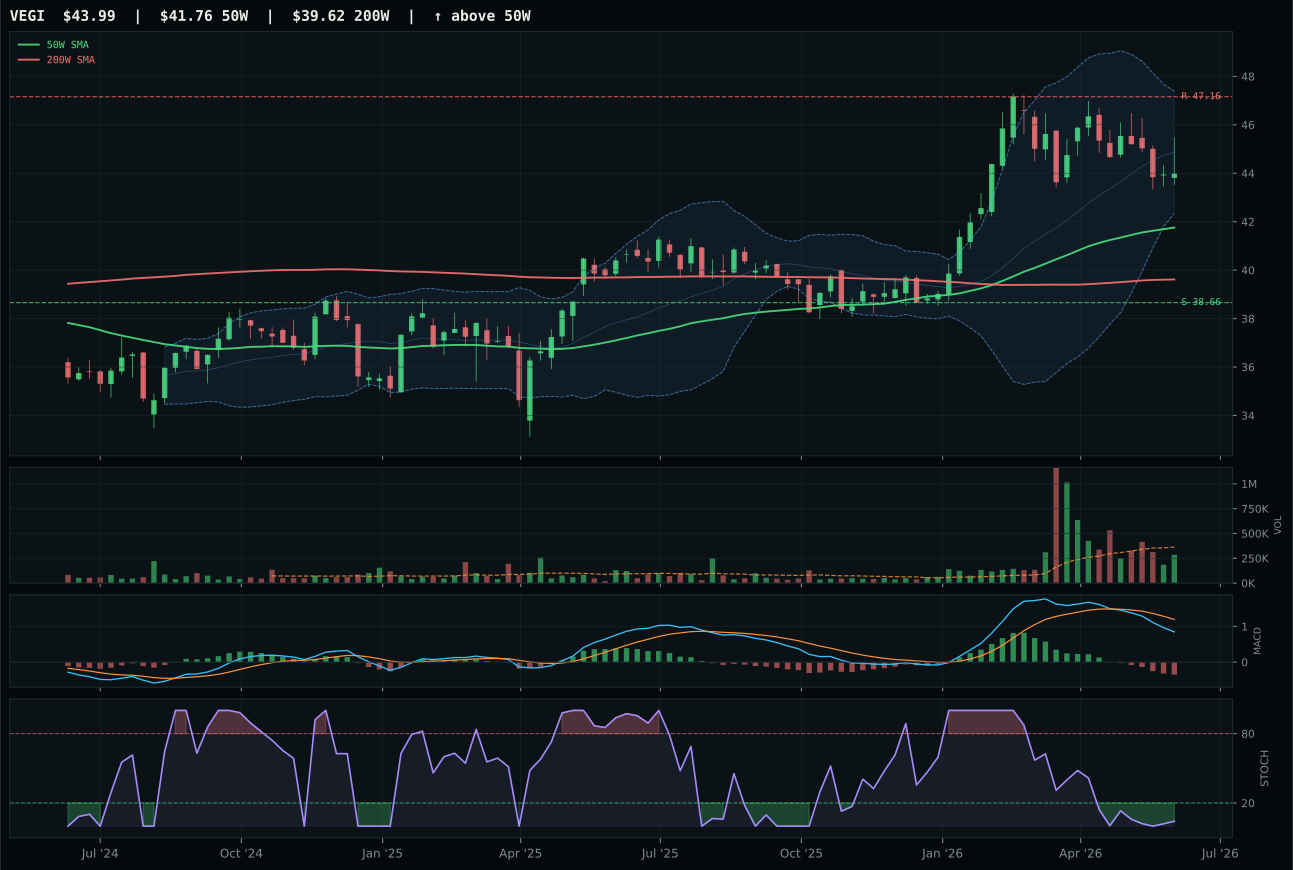
VEGI has a neutral structure profile with -12.0% 13-week relative strength versus SPY.
A failed hold above support would weaken the setup.
Actionable but governed by invalidation levels.
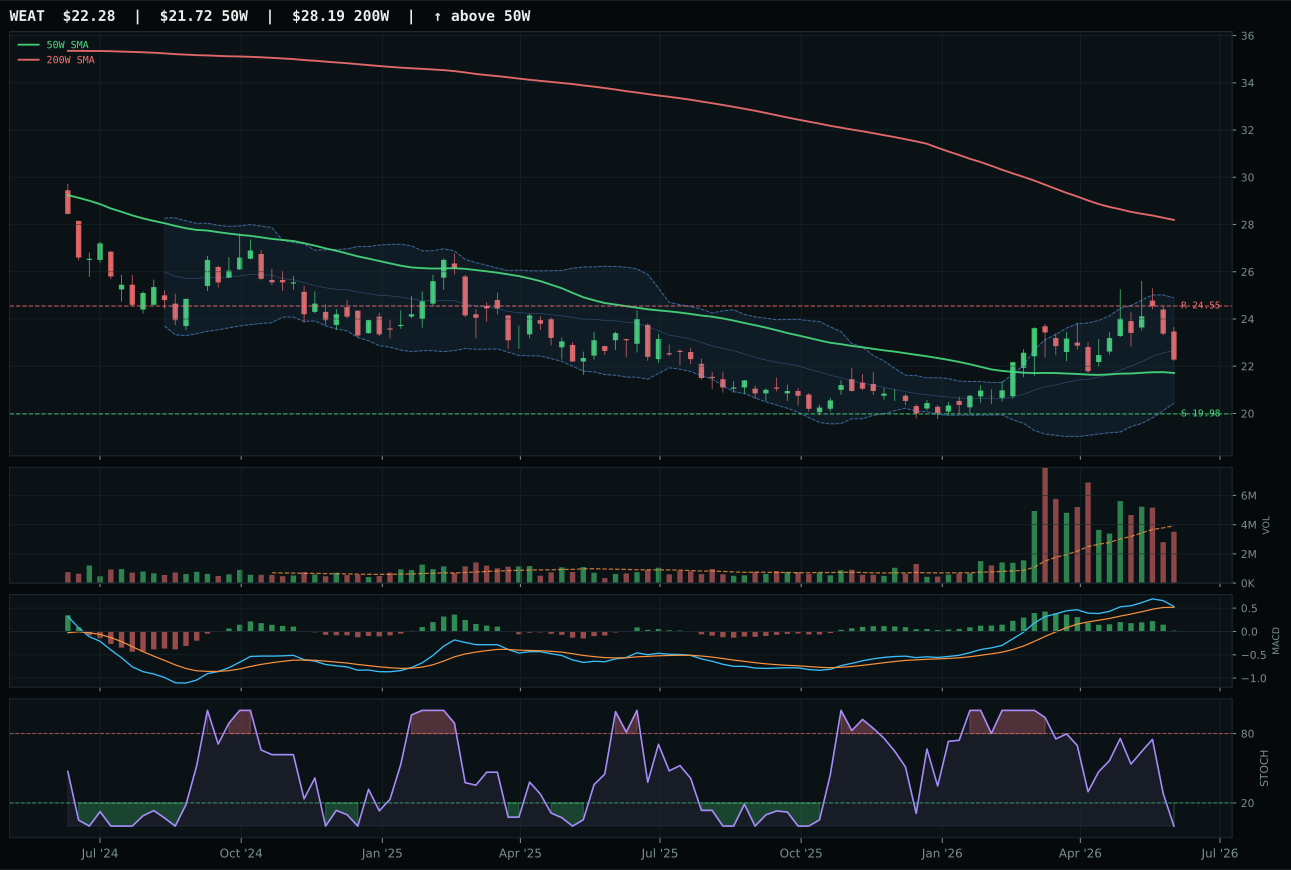
WEAT has a compression near 50W profile with -15.3% 13-week relative strength versus SPY.
A failed hold above support would weaken the setup.
Actionable but governed by invalidation levels.
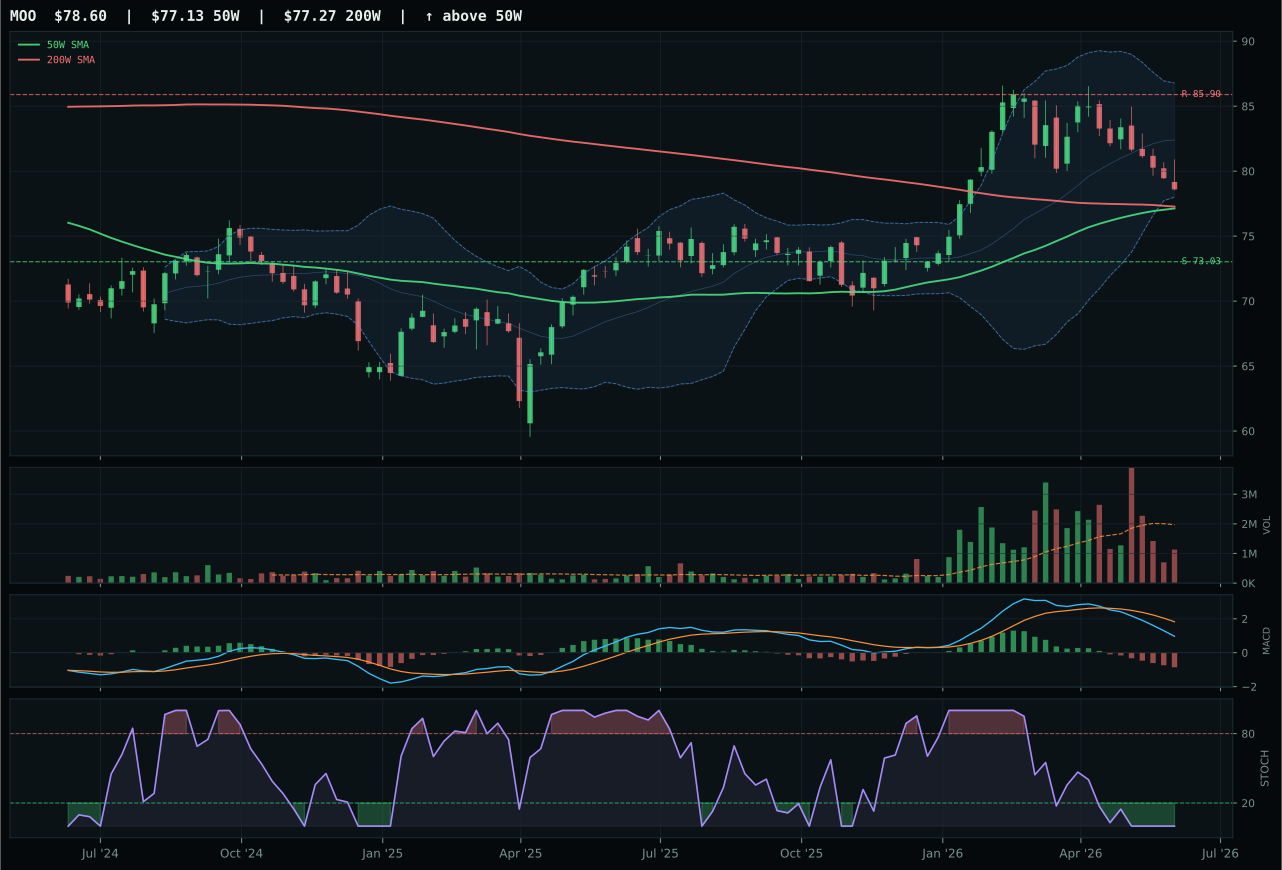
MOO has a compression near 50W profile with -13.9% 13-week relative strength versus SPY.
A failed hold above support would weaken the setup.
Actionable but governed by invalidation levels.
MOO wins Agriculture & Livestock by posting a perfect 100.0 timing score—price sits just 1.9% above the 50W, MACD is weakening, and stochastic RSI is oversold at 0.00 near the Fibonacci 0.50 level—a setup that offers genuine mean-reversion potential if buyers can defend the 50W compression. Risk/reward at 73.1 is substantially higher than VEGI's 53.8 because the downside cushion to support at 73.03 is only 7.6% while resistance sits at 85.90, offering an 8.5% upside cap but with much better entry-risk geometry. However, the momentum confirmation score of 0.0 and persistence of 29.2 expose the core weakness: thirteen-week performance is negative at -4.2%, MACD is bearish/weakening, and volume participation is thin at 0.57x average, meaning any recovery will require fresh accumulation rather than continuation of existing trend. VEGI's higher technical evidence at 36.4 versus MOO's 30.3 underscores that MOO is a timing bet, not a conviction trade; macro sponsorship from supply shortage (+8) and inflation pressure (+7) keeps the category alive, but technical weakness prevents true conviction.
Agriculture & Livestock earned 10% allocation despite its weak 47.0 category score because the macro fit was exceptionally strong at 86.0—supply shortage (+13), inflation pressure (+10), and real-asset sponsorship (+8) collectively create a regime tailwind that justifies holding a thin technical setup. In Transition/Mixed macro conditions, real assets and commodity breadth are beginning to show support independent of growth or credit-cycle signals, making this category a natural hedge against inflation-pressure intensification. The 62% technical weight versus 38% macro weight means the low technical evidence of 30.3 drags the final score, but the category reasoner's decision to allocate reflects a bet that the technical weakness—negative momentum, thin volume, bearish MACD—represents a setup for reversal rather than continuation of decline. This is a patient allocation; it does not expect immediate upside but protects the portfolio against a scenario where supply-driven inflation accelerates and agricultural prices gap sharply higher. Upgrading would require either volume participation to expand or a meaningful macro acceleration signal.
Utilities & Infrastructure — XLU
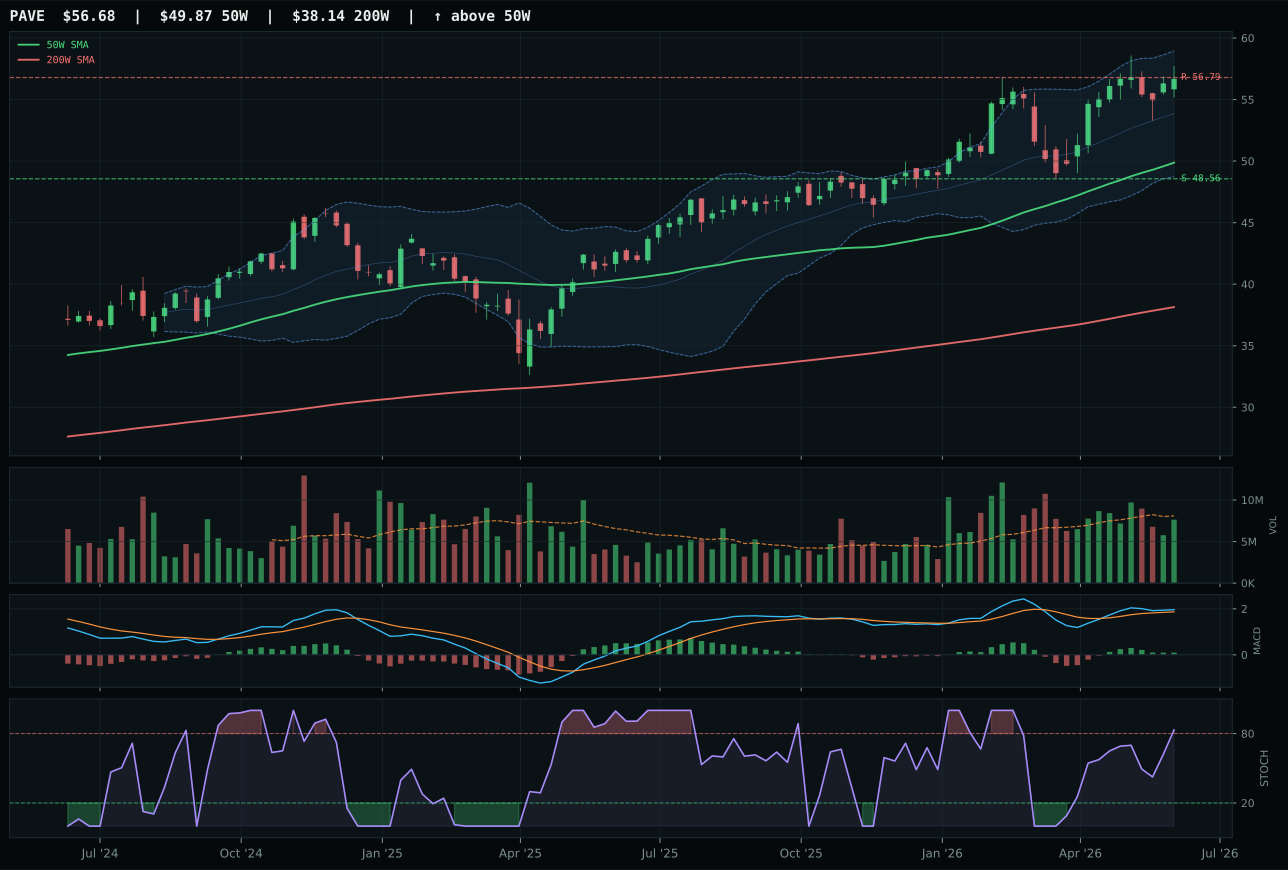
PAVE has a neutral structure profile with 0.2% 13-week relative strength versus SPY.
A failed hold above support would weaken the setup.
Actionable but governed by invalidation levels.
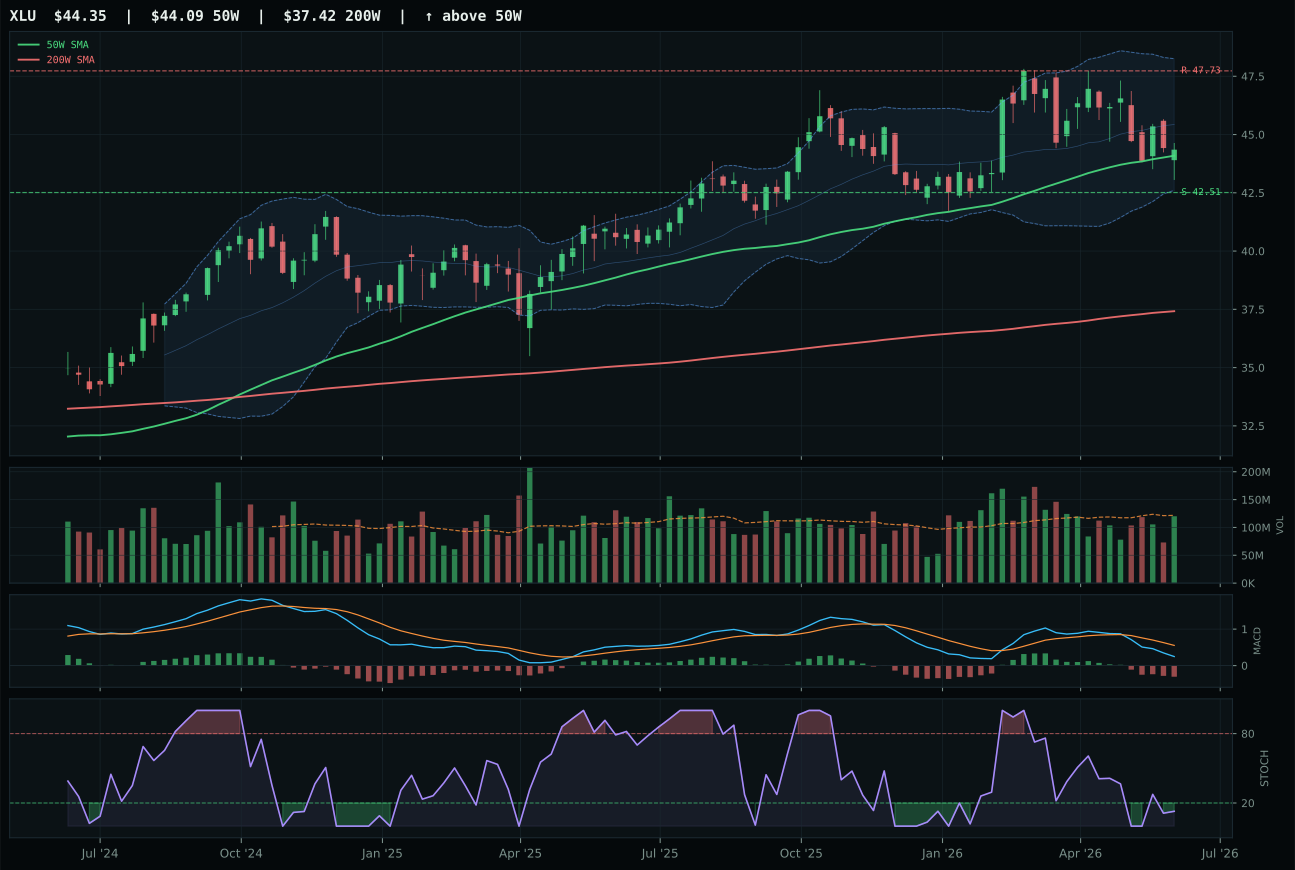
XLU has a pullback into support profile with -14.8% 13-week relative strength versus SPY.
A failed hold above support would weaken the setup.
Actionable but governed by invalidation levels.
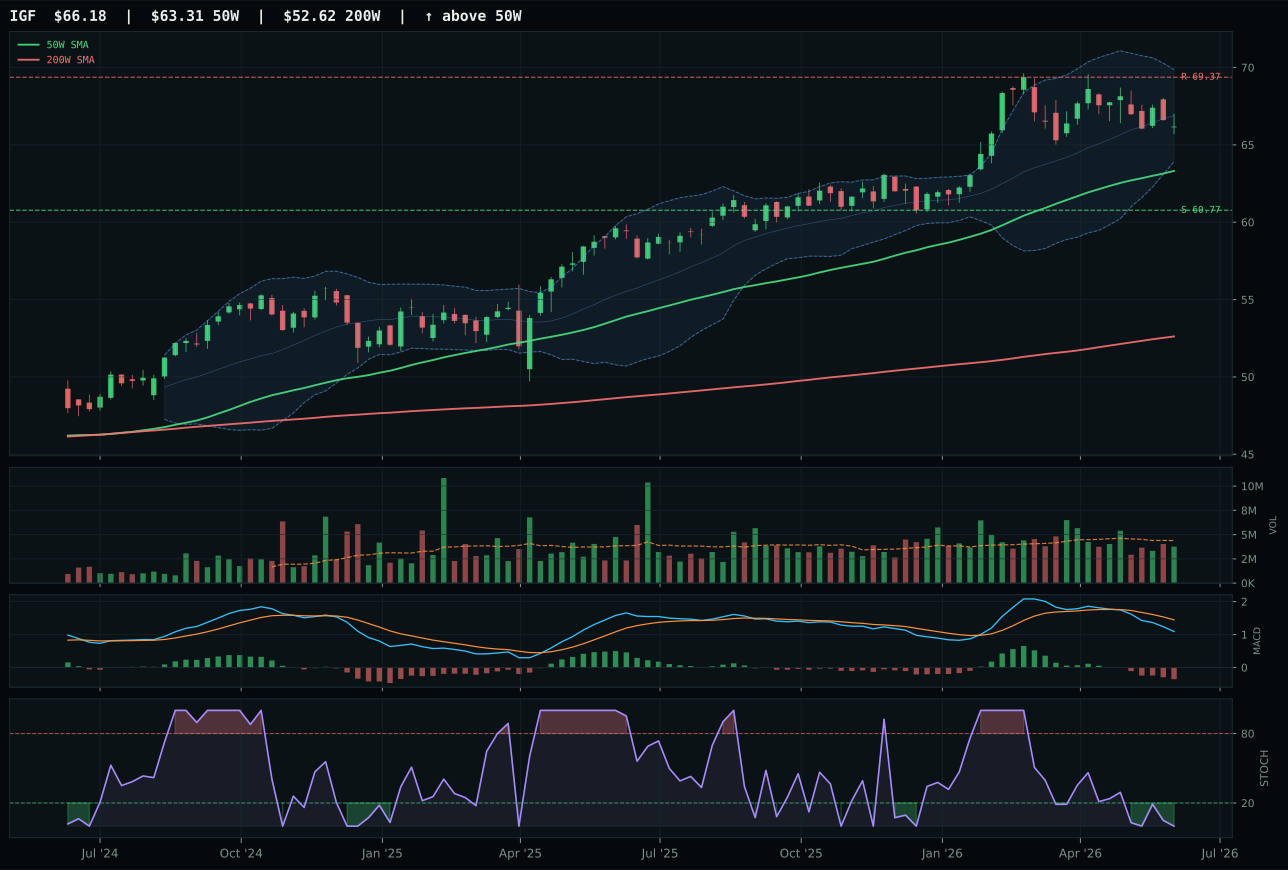
IGF has a neutral structure profile with -11.1% 13-week relative strength versus SPY.
A failed hold above support would weaken the setup.
Actionable but governed by invalidation levels.
XLU wins Utilities & Infrastructure not because it offers superior technical strength—PAVE scores 76.0 composite versus XLU's 71.0—but because its timing framework at 100.0 beats PAVE's 62.0 decisively, and its 82.5 risk/reward outmuscles PAVE's 45.2. Price sits just 0.6% above the 50W at the precise edge of the 50W mean, with support at 42.51 offering 4.3% downside cushion and resistance at 47.73 capping upside at 7.1%—a setup that rewards patient entry but punishes chasing. PAVE's 13.7% extension above the 50W with overbought stochastic momentum and bullish-but-flattening MACD signals that early buyers have already booked gains; the 9.9% thirteen-week return comes with overbought technicals that increase rotation risk. XLU's -5.1% thirteen-week return and oversold-turn-up stochastic RSI at 0.13 indicate capitulation has created a defined entry point where downside risk is capped and reversal potential is increasing. Both names feature bearish/weakening MACD with weak category-relative strength, but XLU's superior timing and support definition win the allocation decision.
Utilities & Infrastructure earned 10% allocation on a 40.9 category score despite weak macro fit at 41.0—inflation pressure penalizes defensives at -6, risk appetite positive at -2—because the Transition/Mixed regime does offer marginal support at +4, and the technical framework in XLU creates an attractive mean-reversion entry point. This allocation is structural hedging rather than conviction positioning; it reflects that defensive utility exposure becomes valuable if credit stress accelerates or risk appetite turns negative, and the currently oversold positioning creates favorable entry geometry. Technical evidence for the category is weak at 30.0, and momentum confirmation is barely positive at 4.1, signaling that utilities are out of favor in the current regime. However, the tight 0.6% positioning above the 50W with clean support at 42.51 and defined resistance creates a controlled-risk framework that allows the allocator to hold a defensive hedge without overpaying. The allocation succeeds if the macro regime shifts toward explicit credit stress or if inflation pressures abate enough to remove the -6 penalty; until then, it serves as a volatility-reducing satellite. Upgrading would require either a sharp credit-stress signal or evidence of institutional accumulation into this oversold setup.
Emerging Markets — ILF
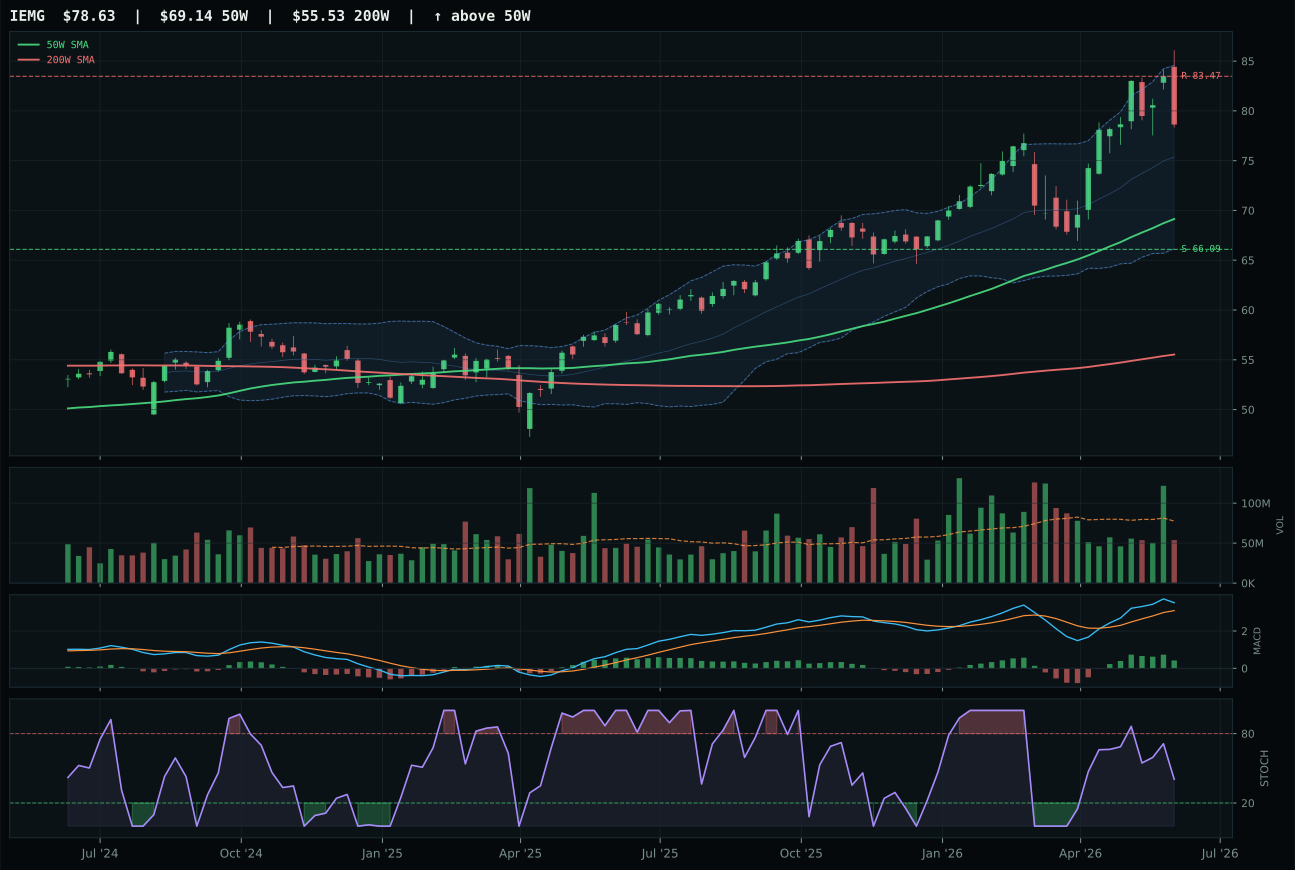
IEMG has a neutral structure profile with 1.9% 13-week relative strength versus SPY.
A failed hold above support would weaken the setup.
Actionable but governed by invalidation levels.
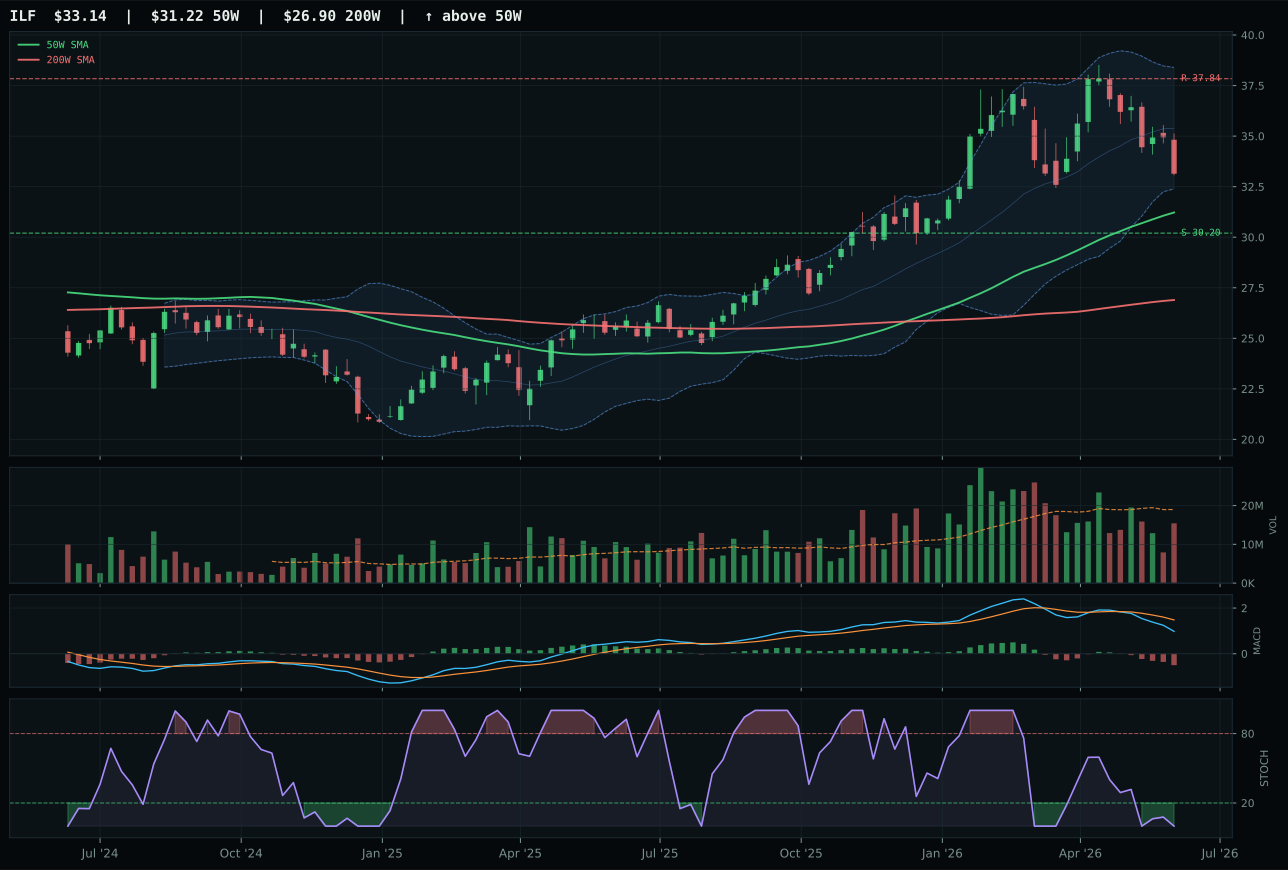
ILF has a neutral structure profile with -11.7% 13-week relative strength versus SPY.
A failed hold above support would weaken the setup.
Actionable but governed by invalidation levels.
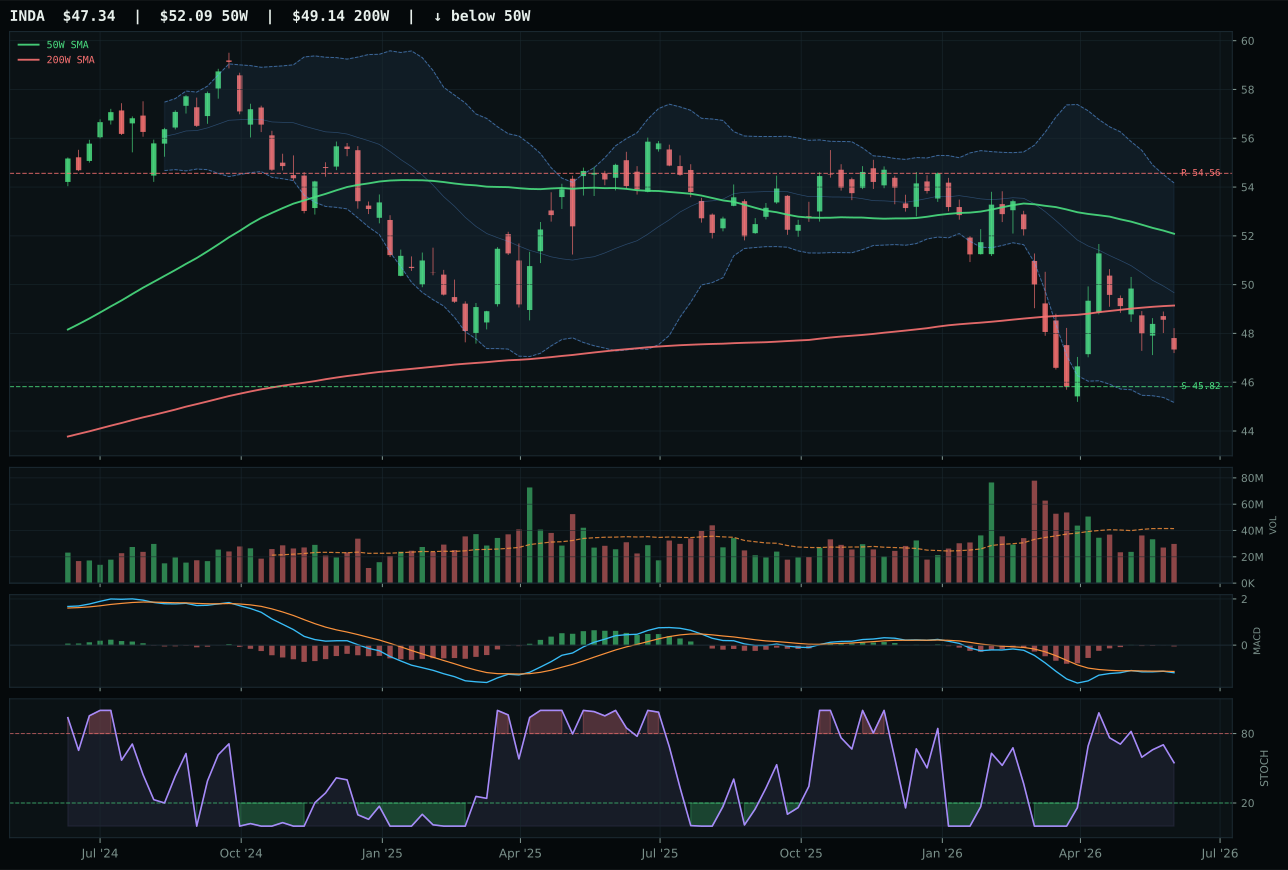
INDA has a pullback into support profile with -15.0% 13-week relative strength versus SPY.
A failed hold above support would weaken the setup.
Actionable but governed by invalidation levels.
ILF wins Emerging Markets despite massive technical disadvantage because the category reasoner's final test weighted the risk/reward framework and macro fit over pure momentum evidence—ILF's 76.0 risk/reward beats IEMG's 50.5, and ILF's 77.0 timing score beats IEMG's 70.0, despite IEMG showing 11.5% thirteen-week return versus ILF's -2.0%. The deciding factor is positioning: IEMG is extended 13.7% above the 50W with thin participation, sitting near overbought momentum with bullish-but-flattening MACD—a profile that signals late-cycle accumulation into extension. ILF sits just 6.1% above the 50W with oversold stochastic at 0.00 and bearish/weakening MACD, offering Latin America commodity and value exposure at a mean-reversion entry point. Category-relative strength tells the story: IEMG's 13.5% strength versus the category median reflects consensus buying into the broadest emerging-market theme, while ILF's 0.0% relative strength indicates contrarian positioning in a commodity-driven Latin America thesis. Macro sponsorship for EM liquidity support favors IEMG, but ILF's superior risk/reward geometry wins the allocation decision.
Emerging Markets earned 10% allocation on a 40.1 category score that reflects genuine macro support from EM-liquidity sponsorship (+14) and risk appetite positive (+8), though credit stress penalizes the category at -10. The decision to represent the category with ILF rather than IEMG signals the allocator's regime conviction: ILF's commodity and value beta offers protection against inflation and real-asset demand, while IEMG's broad EM exposure is vulnerable to credit-stress contagion. In Transition/Mixed conditions, narrowing the allocation to Latin America commodity linkages hedges against the scenario where broad emerging-market enthusiasm reverts if credit stress activates. Technical weakness across the category—ILF -2.0%, IEMG 11.5% but from stretched positioning—suggests this allocation is macro-driven and patient, not chasing momentum. The 62.0% macro fit drives the allocation decision despite weak technical evidence at 32.9 for ILF, reflecting a bet that commodity breadth and supply-shortage narratives will support Latin America equity performance independent of near-term technical strength. Upgrading would require either a shift in regime toward explicit credit stress or evidence of institutional accumulation into the oversold setup.
Nuclear Energy — NLR
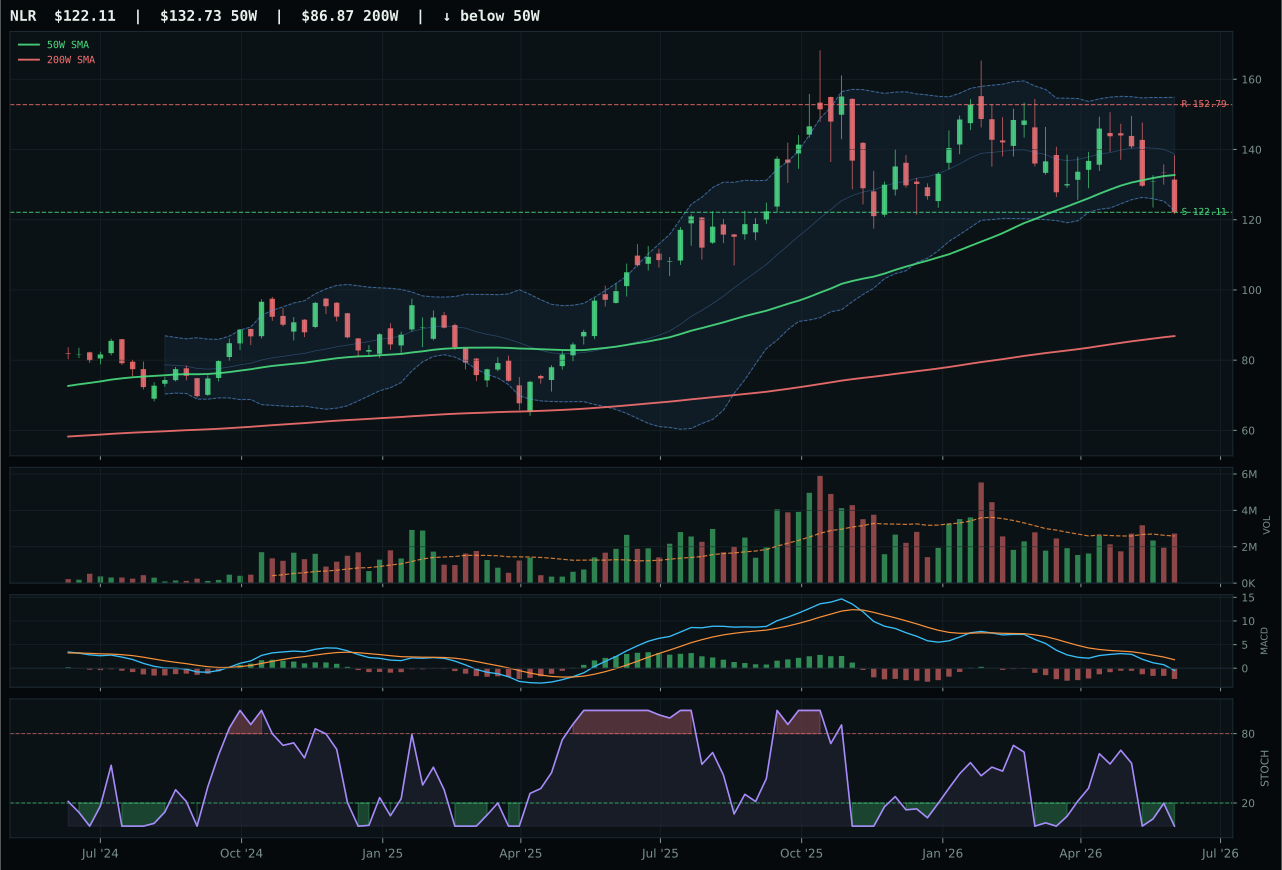
NLR has a pullback into support profile with -19.9% 13-week relative strength versus SPY.
A failed hold above support would weaken the setup.
Actionable but governed by invalidation levels.
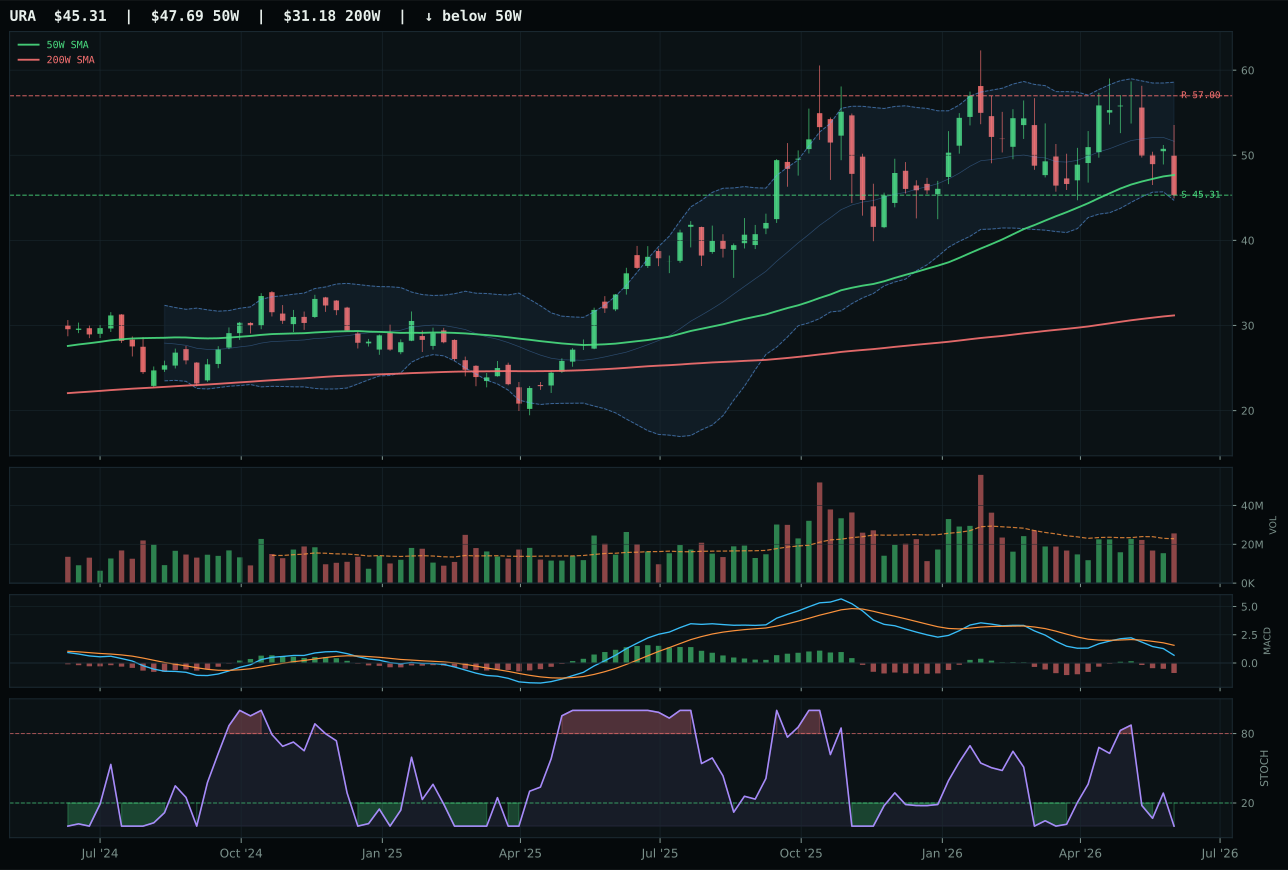
URA has a pullback into support profile with -16.8% 13-week relative strength versus SPY.
A failed hold above support would weaken the setup.
Actionable but governed by invalidation levels.
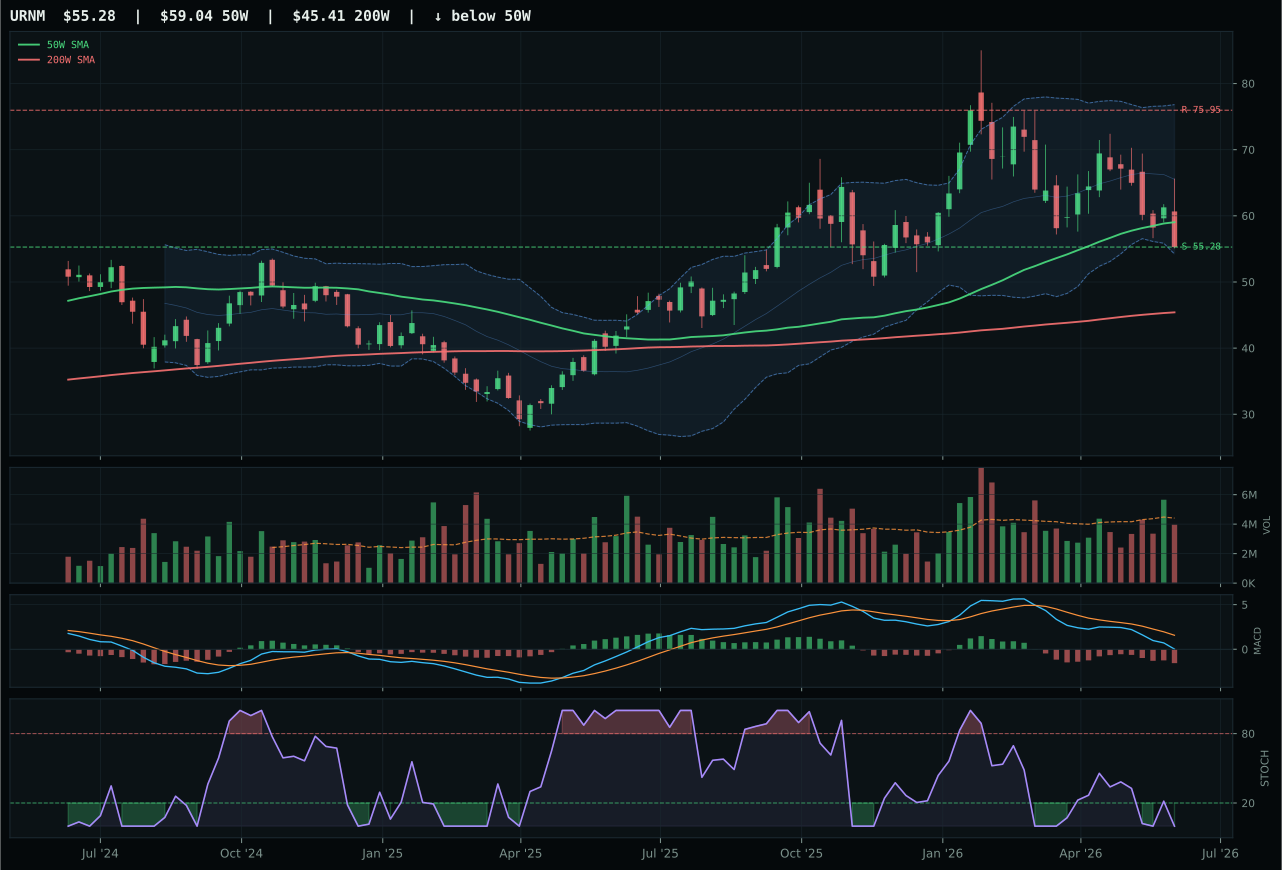
URNM has a pullback into support profile with -23.3% 13-week relative strength versus SPY.
A failed hold above support would weaken the setup.
Actionable but governed by invalidation levels.
NLR wins Nuclear Energy in a tight decision against URA because its pullback-into-support setup at 122.11 offers superior risk/reward geometry despite both names being plagued by negative momentum and thin volume participation. NLR's 83.0 risk/reward score reflects an asymmetric payoff: downside to support is only 0.0% (right at the edge), while upside to resistance at 152.79 offers 20.1% potential—a setup that rewards patience and punishes immediate chasing. URA's timing score of 100.0 beats NLR's 87.0, but URA trades 13.1% below support, creating deeper oversold readings that paradoxically increase downside risk if institutional support fails; NLR's tighter structure at support creates a clearer invalidation line. Both names feature bearish/weakening MACD, oversold stochastic, and negative thirteen-week returns (NLR -10.2%, URA -7.1%), making this a mean-reversion bet rather than a conviction trade. The deciding factor: NLR's 67.3 structure score beats URA's 64.6, providing cleaner compression and support definition that gives portfolio managers a defined risk boundary.
Nuclear Energy is excluded from allocation at 0%, ranked 9th or 10th, because the category earns only 37.6 final score and the technical evidence is dismal at 19.5/100 for NLR. Despite macro support from energy scarcity (+9) and real asset sponsorship (+7), the category-level macro fit of 69.0/100 is strong, yet it cannot overcome the fact that both NLR and URA are completely orphaned by price action: zero momentum confirmation across the board, fully oversold stochastic, and bearish MACD structure. The -19.9% relative weakness of NLR versus SPY is severe. While nuclear energy has structural long-term tailwinds from AI data-center power demand and energy scarcity fears, neither NLR nor URA is showing any current accumulation by institutional buyers. Both are value traps until volume confirmation rises above 1.2x average and stochastic RSI breaks above 30 on a weekly close. For this category to earn allocation, the system would require (a) energy scarcity descriptor to remain active and strengthen in weighting, (b) volume participation to flip from neutral to above-average on both ETFs, and (c) relative strength to turn positive versus SPY. Until then, this is a tactical short-term reversal setup at best, not a portfolio-worthy allocation.
Precious Metals — GLD
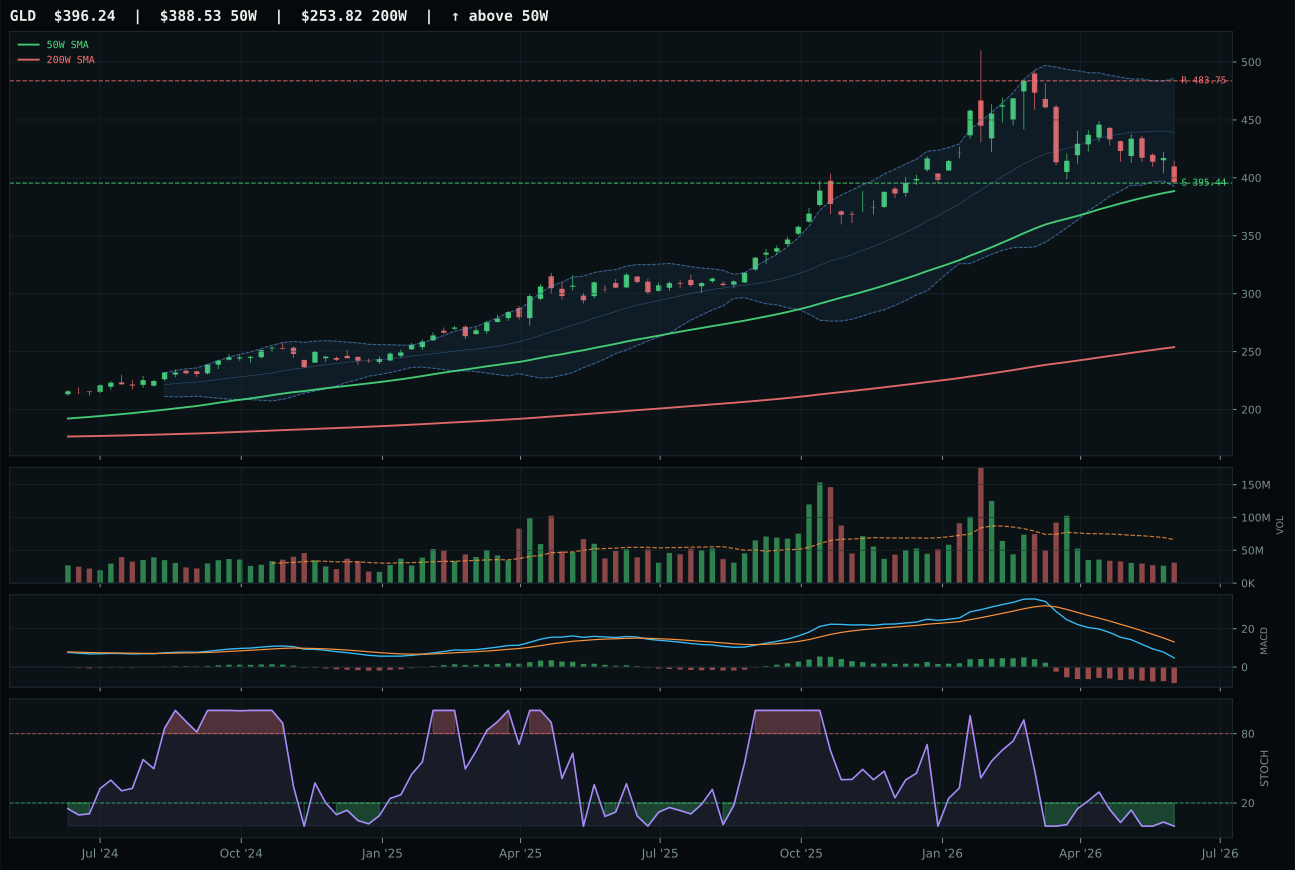
GLD has a pullback into support profile with -26.0% 13-week relative strength versus SPY.
A failed hold above support would weaken the setup.
Actionable but governed by invalidation levels.
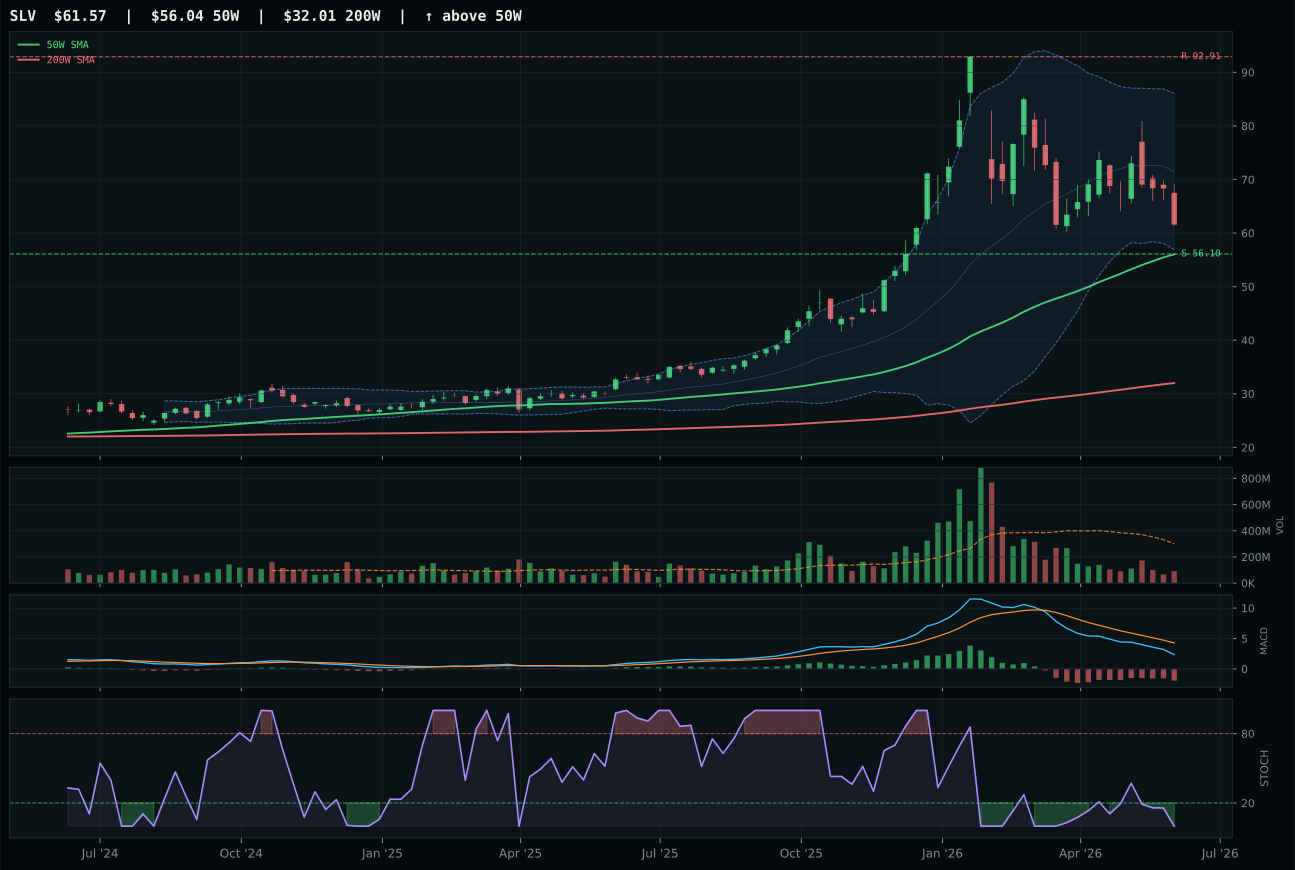
SLV has a neutral structure profile with -28.6% 13-week relative strength versus SPY.
A failed hold above support would weaken the setup.
Actionable but governed by invalidation levels.
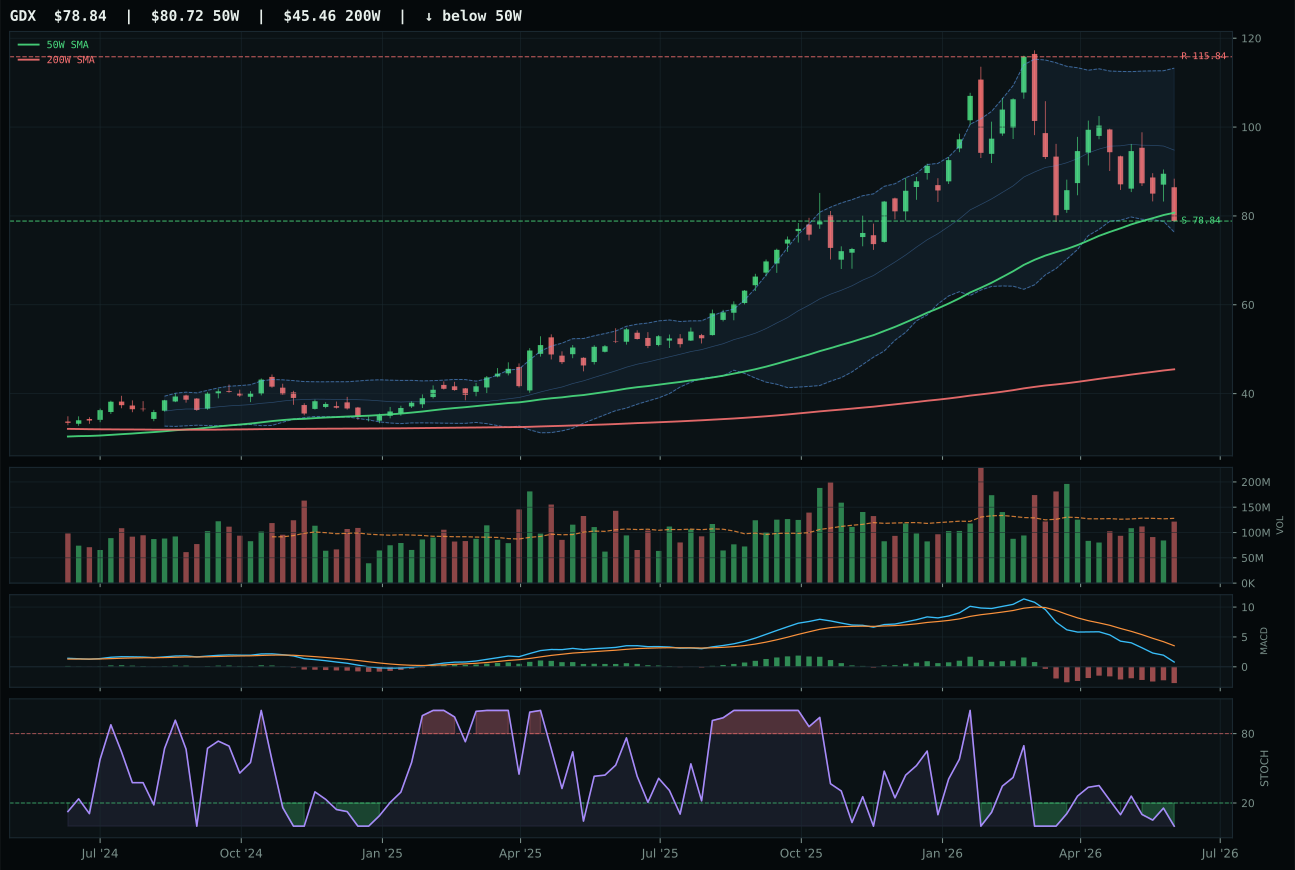
GDX has a pullback into support profile with -31.9% 13-week relative strength versus SPY.
A failed hold above support would weaken the setup.
Actionable but governed by invalidation levels.
GLD defeats SLV and GDX in Precious Metals not because it offers conviction, but because it offers the most favorable risk/reward framework for a mean-reversion trade at the worst possible time. The 98.0 risk/reward score is driven by an asymmetric setup: price sits just 2.0% above the 50W with support defined at 395.44 offering only 0.2% downside protection, while resistance at 483.75 sits 18.1% away—a setup where the mathematical payoff ratio favors patient capital waiting for the inevitable test of support. MACD is bearish/weakening, stochastic RSI is oversold at 0.00, and thirteen-week performance is -16.3%, making this purely a timing and mean-reversion play rather than a directional conviction. SLV's lower timing score (77.0 versus 100.0) and weaker structure (57.5 versus 67.8) reflect its 9.9% stretch from the 50W and deeper oversold positioning, which means SLV is cheaper but also facing further downside risk before buyers enter. Neither setup has volume sponsorship; thin participation at 0.47x average signals capitulation rather than conviction, and momentum confirmation is 0.0 across the category.
Precious Metals is excluded from allocation this week, earning 0% despite GLD's 36.4 reasoned ETF score, because the category ranks 9th or 10th among all ten categories and the macro environment is actively hostile. The category-level macro fit is just 46.0/100, and the only active descriptor driving it is a negative one: risk appetite positive is penalizing metals at -4 weighting. Gold and silver are inversely correlated to risk appetite and inflation expectations; in a Transition / Mixed regime where risk appetite is still broadly positive, precious metals lack sponsorship. GLD's 100/100 timing score (pullback into support) is tactically interesting, but it is not enough to overcome zero momentum confirmation, -26.0% relative weakness versus SPY, and the absence of any macro tailwind. For allocation to return to precious metals, the system would need to see either (a) risk appetite positive descriptor flip to negative, (b) credit stress descriptor increase its weighting materially, or (c) GLD or SLV show positive weekly volume confirmation above 1.2x average. Until then, this is a tactical short-term bounceability setup, not a portfolio allocation.