
2026-05-29
Informational purposes only. The content in this report, including allocations, analysis, and commentary, is provided solely for informational and educational purposes. It does not constitute financial advice, investment advice, trading advice, or any other type of advice. Past performance does not guarantee future results. Always conduct your own research and consult a qualified financial professional before making investment decisions.
Weekly Allocation
| Ticker | Category | Weight | Role |
|---|---|---|---|
| CIBR | Technology | 20% | Top-2 (20%) |
| AIQ | AI | 20% | Top-2 (20%) |
| ROKT | Defense & Aerospace | 10% | Tier-2 (10%) |
| XLE | Traditional Energy | 10% | Tier-2 (10%) |
| MOO | Agriculture & Livestock | 10% | Tier-2 (10%) |
| COPX | Industrial Metals | 10% | Tier-2 (10%) |
| NLR | Nuclear Energy | 10% | Tier-2 (10%) |
| PAVE | Utilities & Infrastructure | 10% | Tier-2 (10%) |
Trade Instructions — Monday Open
Sell the tranche from 2026-05-01 (completing its 4-week hold). Buy the new tranche. Instructions show net portfolio changes — same-asset positions cancel, weight changes show the delta.
| Action | Ticker | Instruction |
|---|---|---|
| SELL | XLE | Sell 17% of XLE position (reduce 15.00% → 12.50%) |
| SELL | SMH | Sell 33% of SMH position (reduce 15.00% → 10.00%) |
| SELL | WEAT | Sell 25% of WEAT position (reduce 10.00% → 7.50%) |
| SELL | XLK | Sell entire XLK position (2.50% of portfolio) |
| SELL | REMX | Sell 33% of REMX position (reduce 7.50% → 5.00%) |
| SELL | IEMG | Sell 50% of IEMG position (reduce 5.00% → 2.50%) |
| SELL | URA | Sell 33% of URA position (reduce 7.50% → 5.00%) |
| BUY | CIBR | Buy CIBR — 25.00% of freed cash (adds 5.00% to portfolio) |
| BUY | ROKT | Buy ROKT — 12.50% of freed cash (adds 2.50% to portfolio) |
| BUY | AIQ | Buy AIQ — 25.00% of freed cash (adds 5.00% to portfolio) |
| BUY | MOO | Buy MOO — 12.50% of freed cash (adds 2.50% to portfolio) |
| BUY | COPX | Buy COPX — 12.50% of freed cash (adds 2.50% to portfolio) |
| BUY | NLR | Buy NLR — 12.50% of freed cash (adds 2.50% to portfolio) |
Current Portfolio After Trade
Combined holdings across all 4 active tranches. Each tranche is 25% of the portfolio.
| Ticker | % of Portfolio | Weight Bar |
|---|---|---|
| CIBR | 15.00% | |
| XLE | 12.50% | |
| SMH | 10.00% | |
| ROKT | 10.00% | |
| AIQ | 10.00% | |
| PAVE | 7.50% | |
| WEAT | 7.50% | |
| REMX | 5.00% | |
| URA | 5.00% | |
| PICK | 5.00% | |
| IEMG | 2.50% | |
| IGF | 2.50% | |
| MOO | 2.50% | |
| COPX | 2.50% | |
| NLR | 2.50% |
Macro Regime — Transition / Mixed
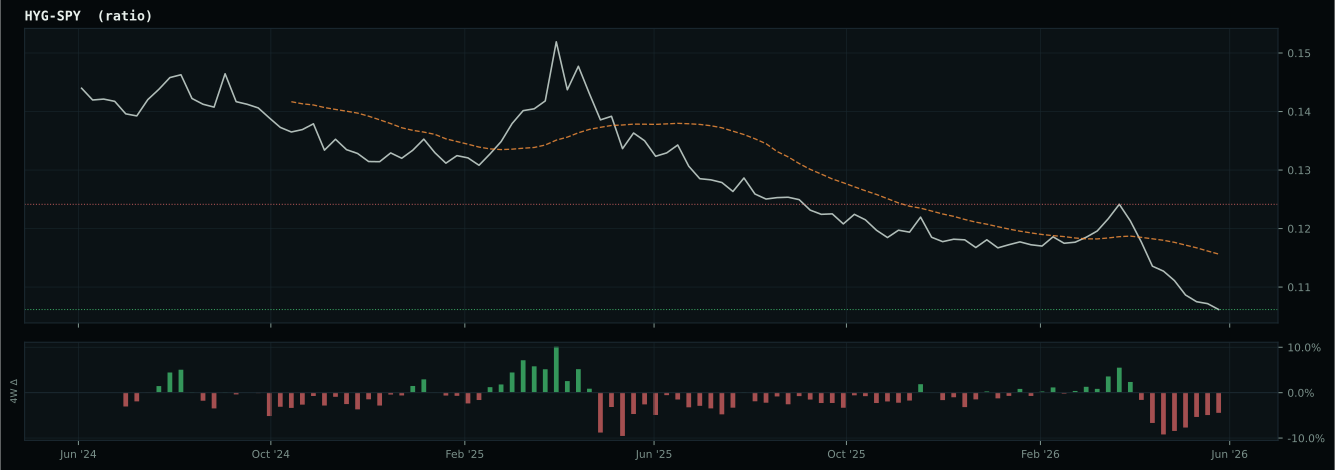
liquidity is improving but credit stress remains elevated
Macro Evidence Charts
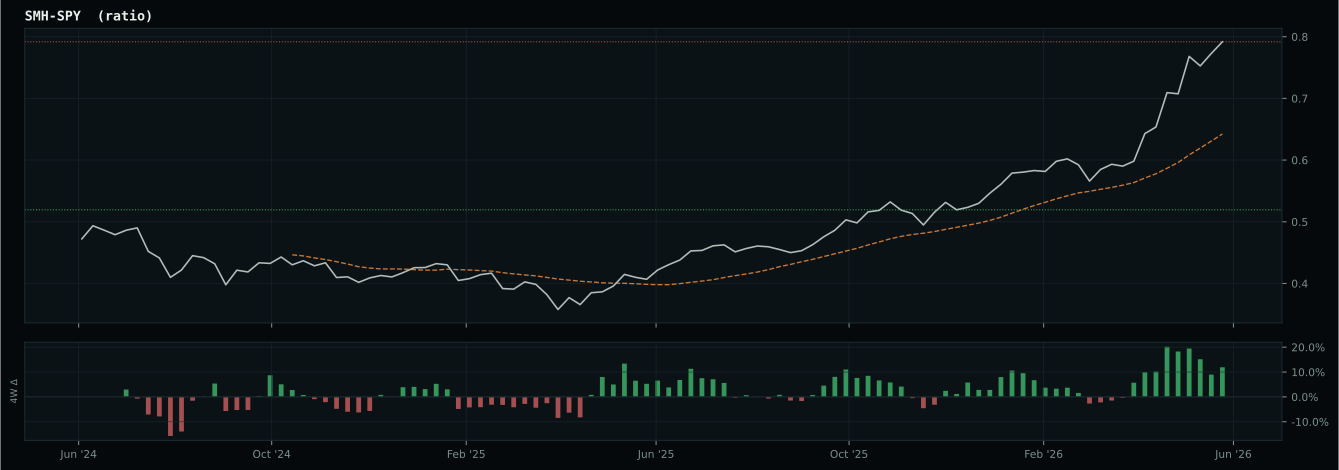
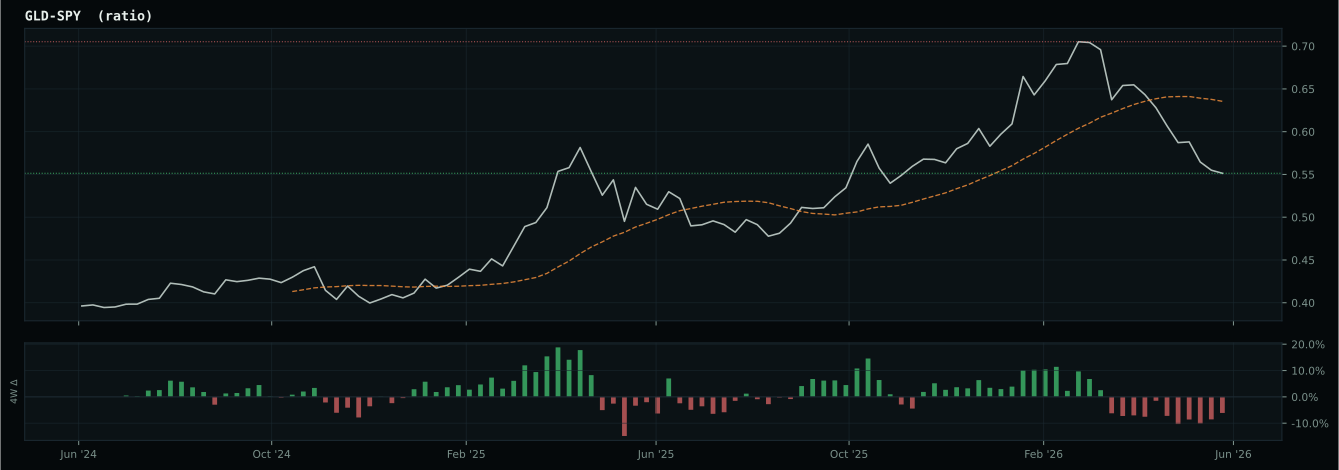
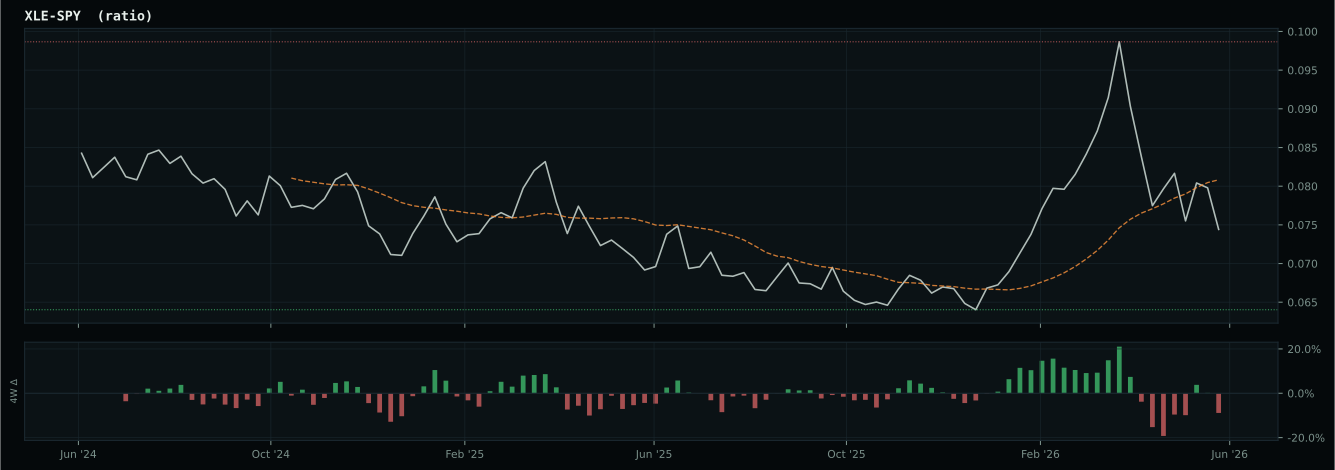
Market-implied signals behind the macro regime scores. Each ratio compares two assets; the direction and slope of the ratio is what the macro engine reads.
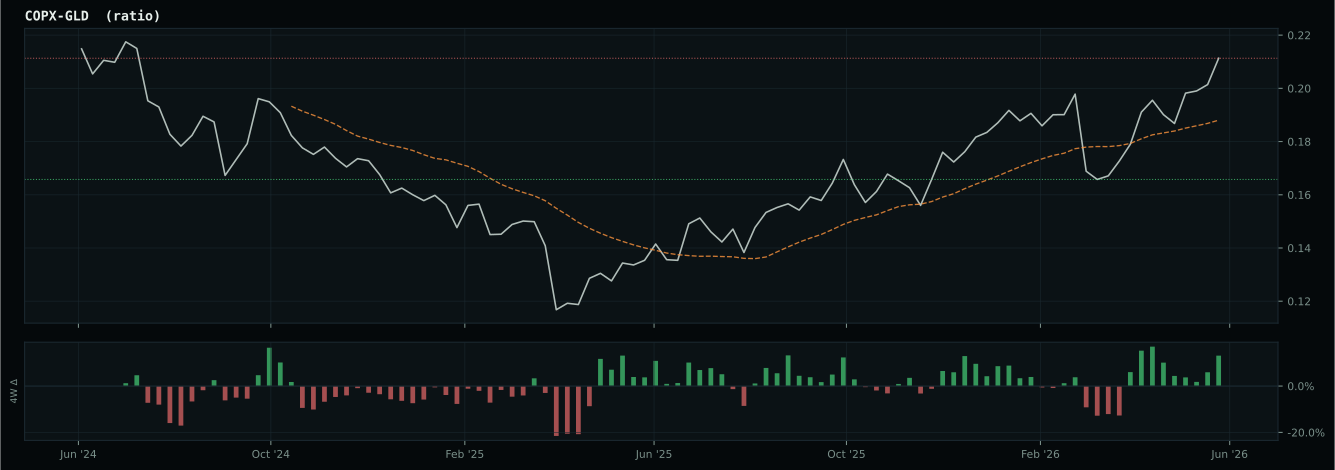
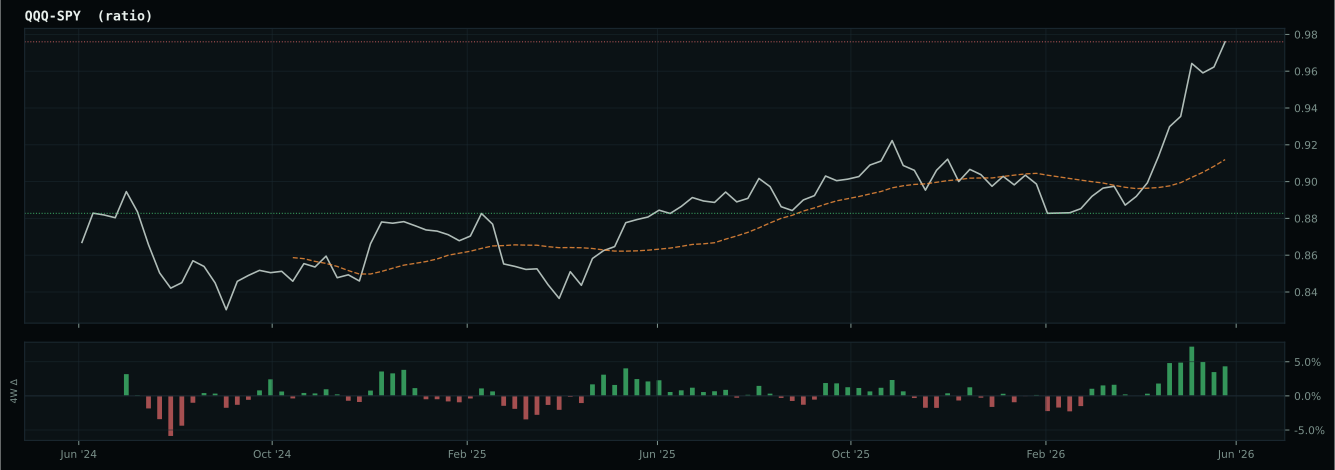
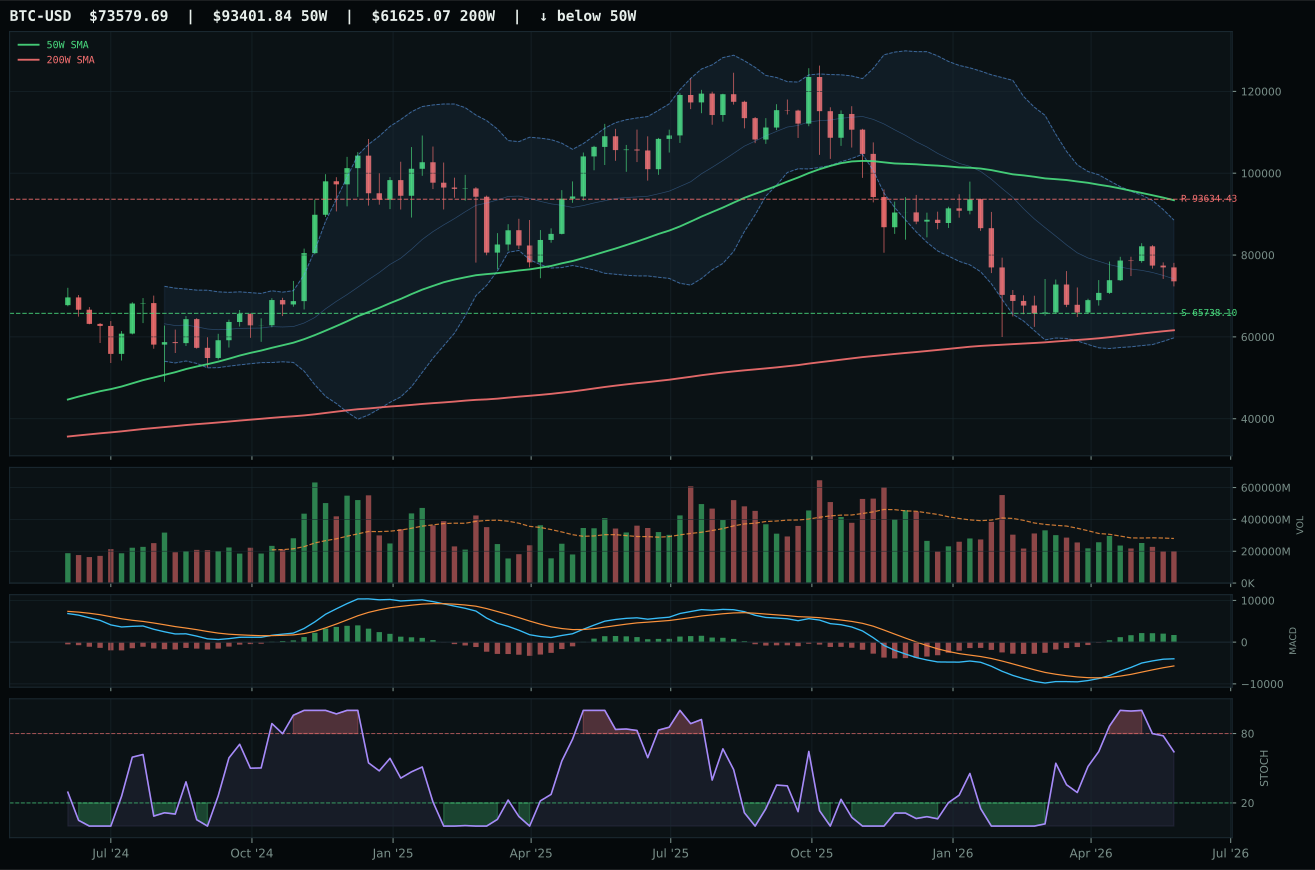
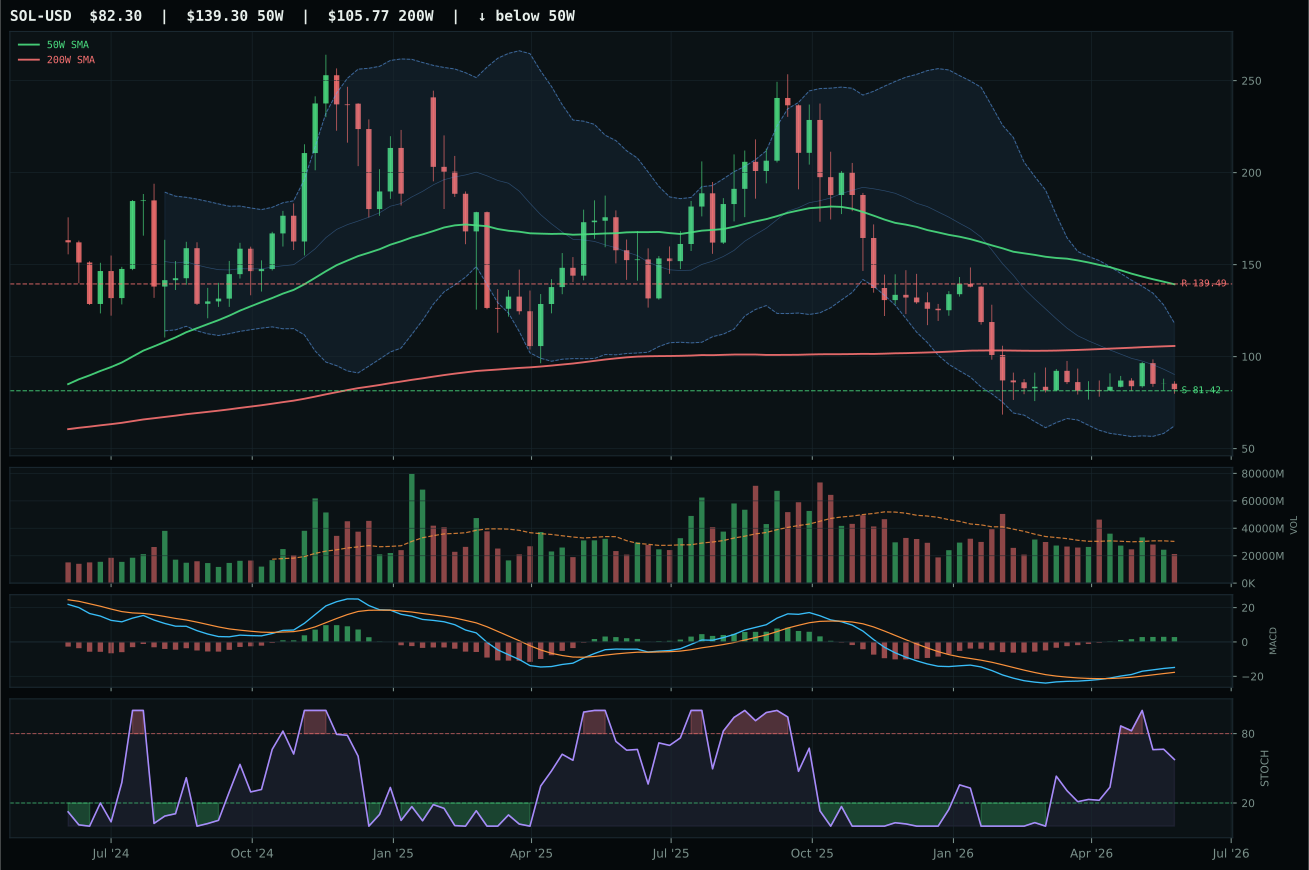
Crypto Regime — NoCrypto
ValueBTC armed; waiting for 50W reclaim, decisive close above post-touch range resistance by 3%, breakout volume above 20W average
TrendBTC not confirmed
one or more available conditions failed
Category Rankings
| Rank | Category | Winner | Score | Alloc | 4W Ret | Peers (4W) |
|---|---|---|---|---|---|---|
| 1 | Technology | CIBR | 66.1 | 20% | -4.18% | IGV -13.6% · XLK -4.8% |
| 2 | AI | AIQ | 64.2 | 20% | -6.78% | SMH +3.2% · BOTZ -9.8% |
| 3 | Defense & Aerospace | ROKT | 55.0 | 10% | -14.00% | XAR -2.7% · ITA +2.8% |
| 4 | Traditional Energy | XLE | 52.9 | 10% | -5.35% | XOP -7.0% · FCG -7.4% |
| 5 | Agriculture & Livestock | MOO | 46.8 | 10% | -0.25% | WEAT -5.6% · VEGI -0.4% |
| 6 | Industrial Metals | COPX | 44.9 | 10% | -13.07% | PICK -11.1% · REMX -11.8% |
| 7 | Nuclear Energy | NLR | 40.4 | 10% | -10.34% | URA -11.8% · URNM -11.9% |
| 8 | Utilities & Infrastructure | PAVE | 40.3 | 10% | +5.37% | IGF +2.1% · XLU +5.2% |
| 9 | Precious Metals | GLD | 35.4 | 0% | -9.58% | GDX -11.9% · SLV -21.8% |
| 10 | Emerging Markets | IEMG | 29.8 | 0% | -3.84% | INDA +2.7% · ILF -2.9% |
Technology — CIBR
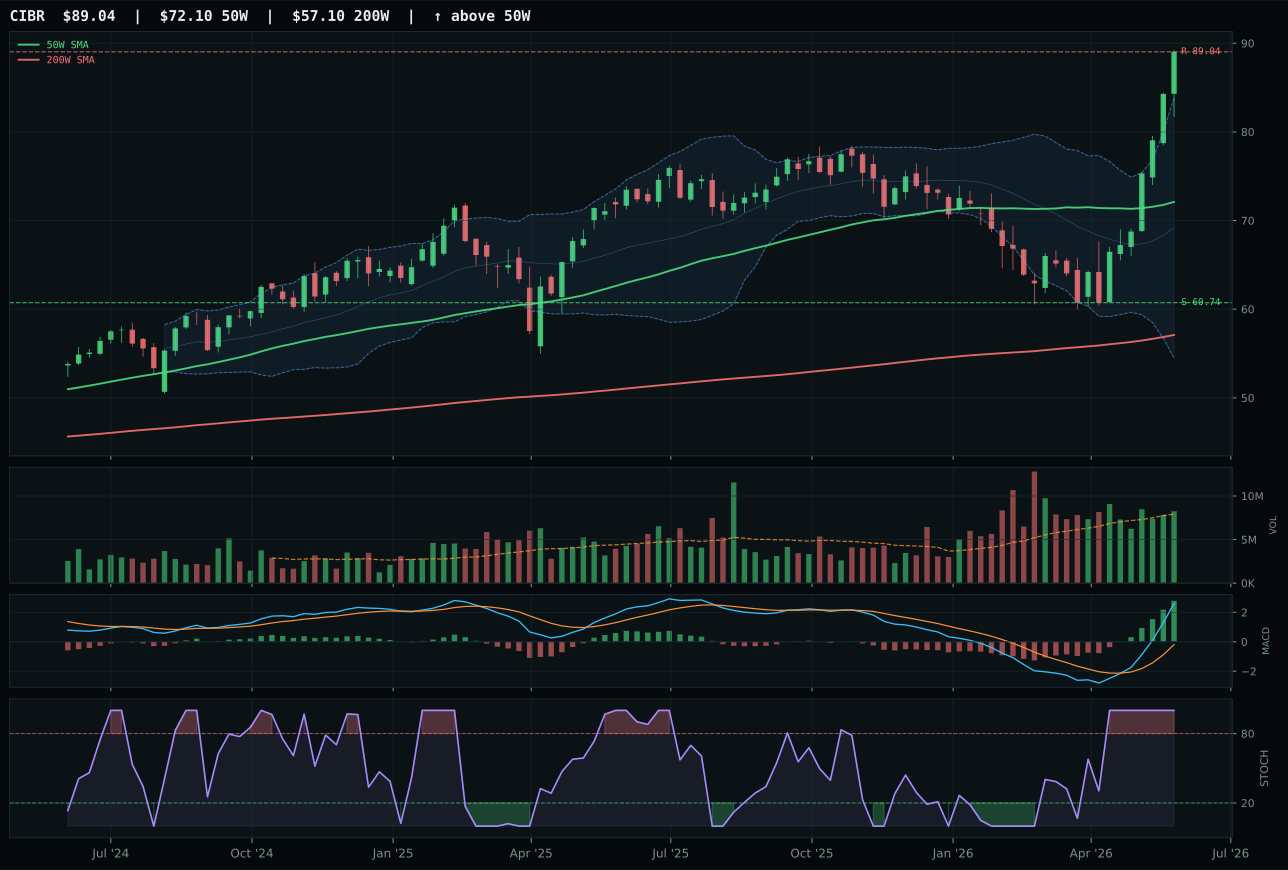
CIBR has a vertical extension profile with 31.3% 13-week relative strength versus SPY.
A failed hold above support would weaken the setup.
Actionable but governed by invalidation levels.
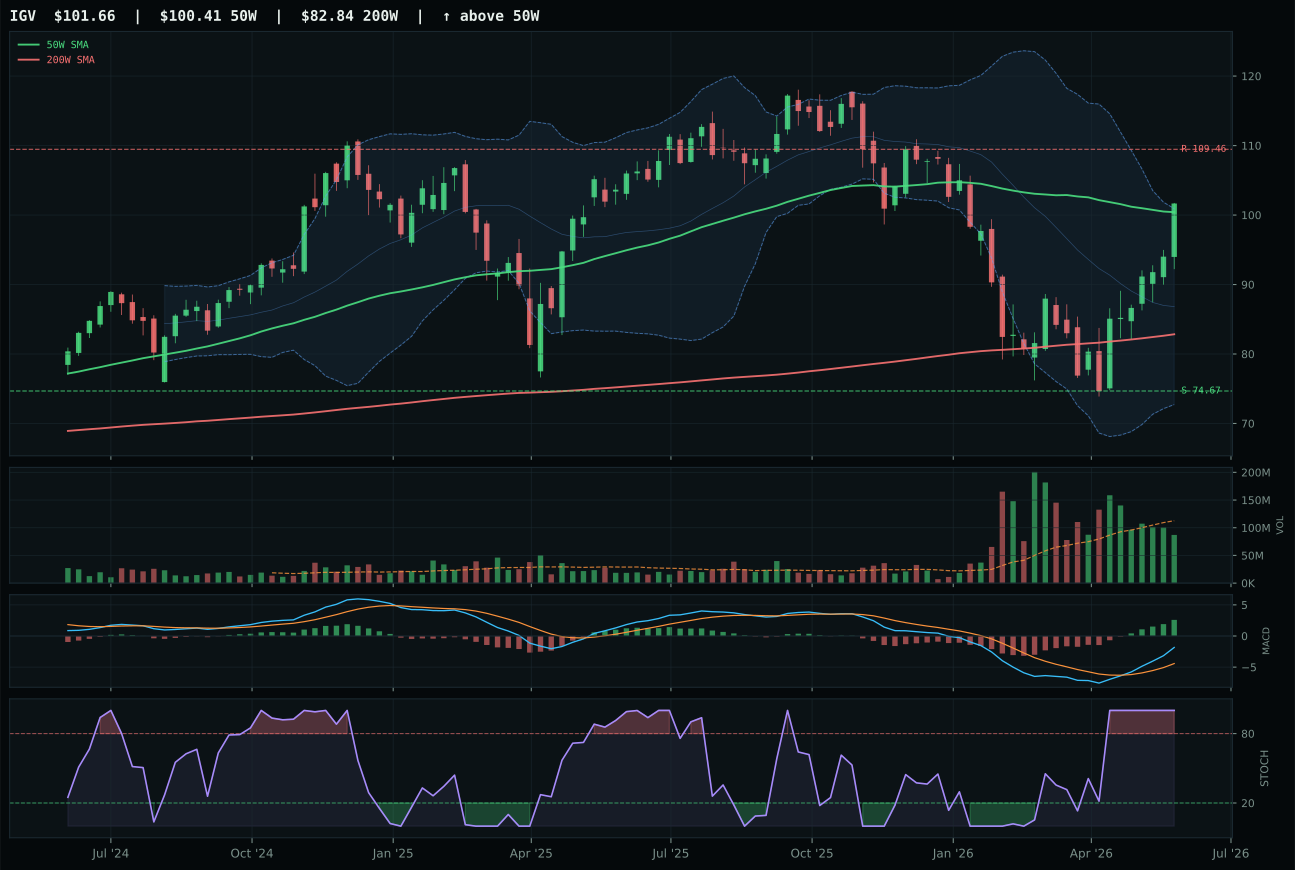
IGV has a compression near 50W profile with 14.4% 13-week relative strength versus SPY.
A failed hold above support would weaken the setup.
Actionable but governed by invalidation levels.
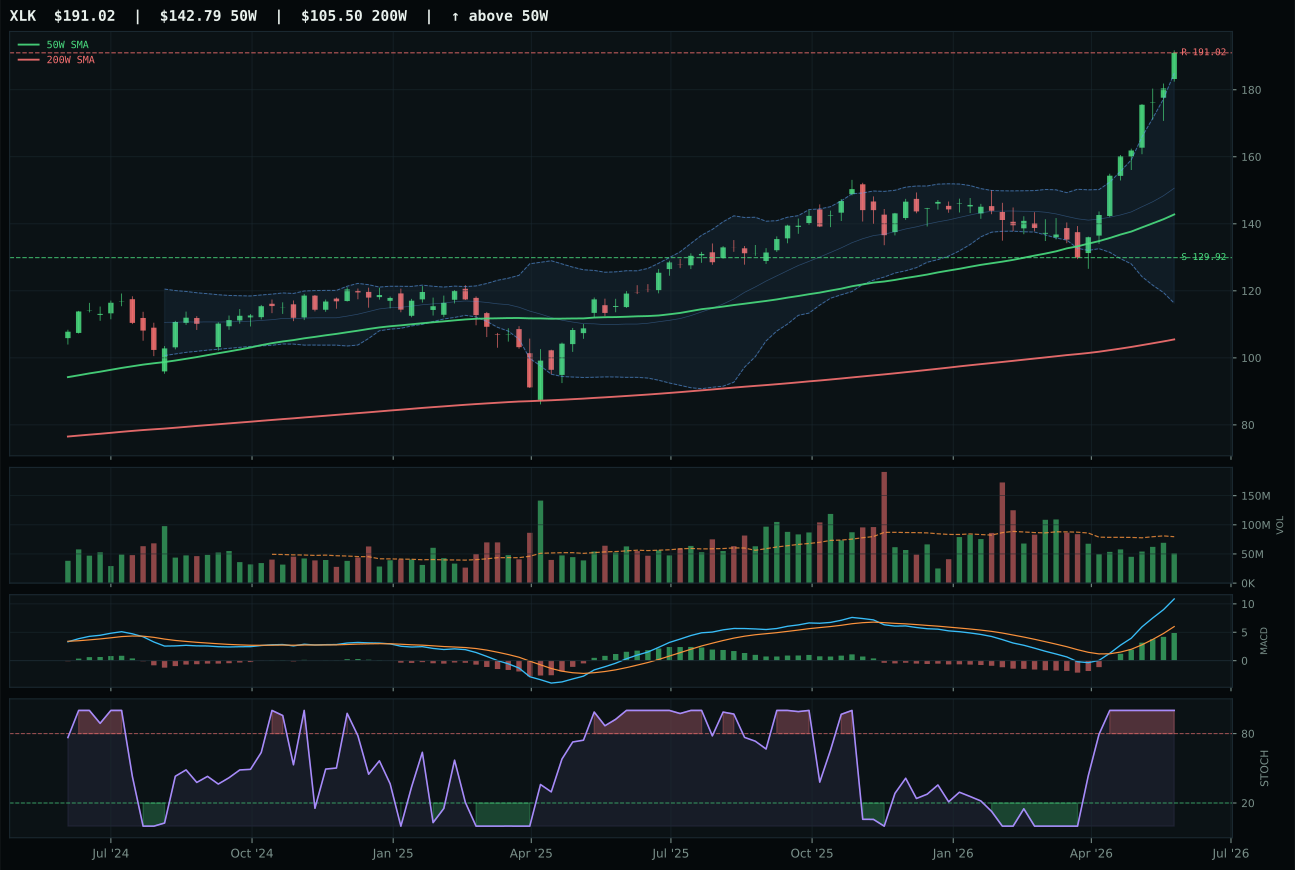
XLK has a vertical extension profile with 27.4% 13-week relative strength versus SPY.
A failed hold above support would weaken the setup.
Actionable but governed by invalidation levels.
CIBR wins the category by combining vertical extension momentum with superior relative strength inside the peer basket. The 41.5% thirteen-week return and 31.3% outperformance versus SPY reflect institutional accumulation into cybersecurity as a structural growth theme, supported by neutral volume at 1.04x average—early enough to avoid the late-stage participation trap that weakens entries at extreme distances from the 50-week moving average. IGV, the runner-up, suffered a nine-point structural disadvantage and failed to generate the category-relative sponsorship that CIBR demonstrated: enterprise software lagged the basket by 13.0%, a telling sign that the capital rotation into specialized tech subthemes is differentiating winners from consolidators. CIBR's setup is textbook extension-with-confirmation—price sits 23.5% above the 50-week, MACD is bullish and improving, stochastic RSI is overbought momentum at 1.00, and the cleanliness score of 66.7 signals a vertical move free of noise. This is a leader being followed by real money, not a tired bounce or mean-reversion setup.
Technology earned its top-2 allocation slot at 20% because the category score of 66.1 ranked second among all eligible categories, anchored by CIBR's technical dominance and the macro environment's support for risk appetite and AI sponsorship. The transition regime and active credit stress create a tilted risk environment—quality tech leaders with volume confirmation tend to compound during periods when allocators must choose between duration and secular growth, and CIBR's cybersecurity focus offers both. The category's macro fit of 54.0 is respectable given the headwinds from inflation pressure and credit stress, but the real edge comes from the technical evidence: a 62% weight on deterministic chart signals means the allocation is not betting on macro narratives but on the reality that institutional buyers are defending and extending the position. If relative strength versus SPY continues to deteriorate or if MACD rolls over mid-extension, the allocation would face pressure to downsize, but today's setup justifies full conviction.
AI — AIQ
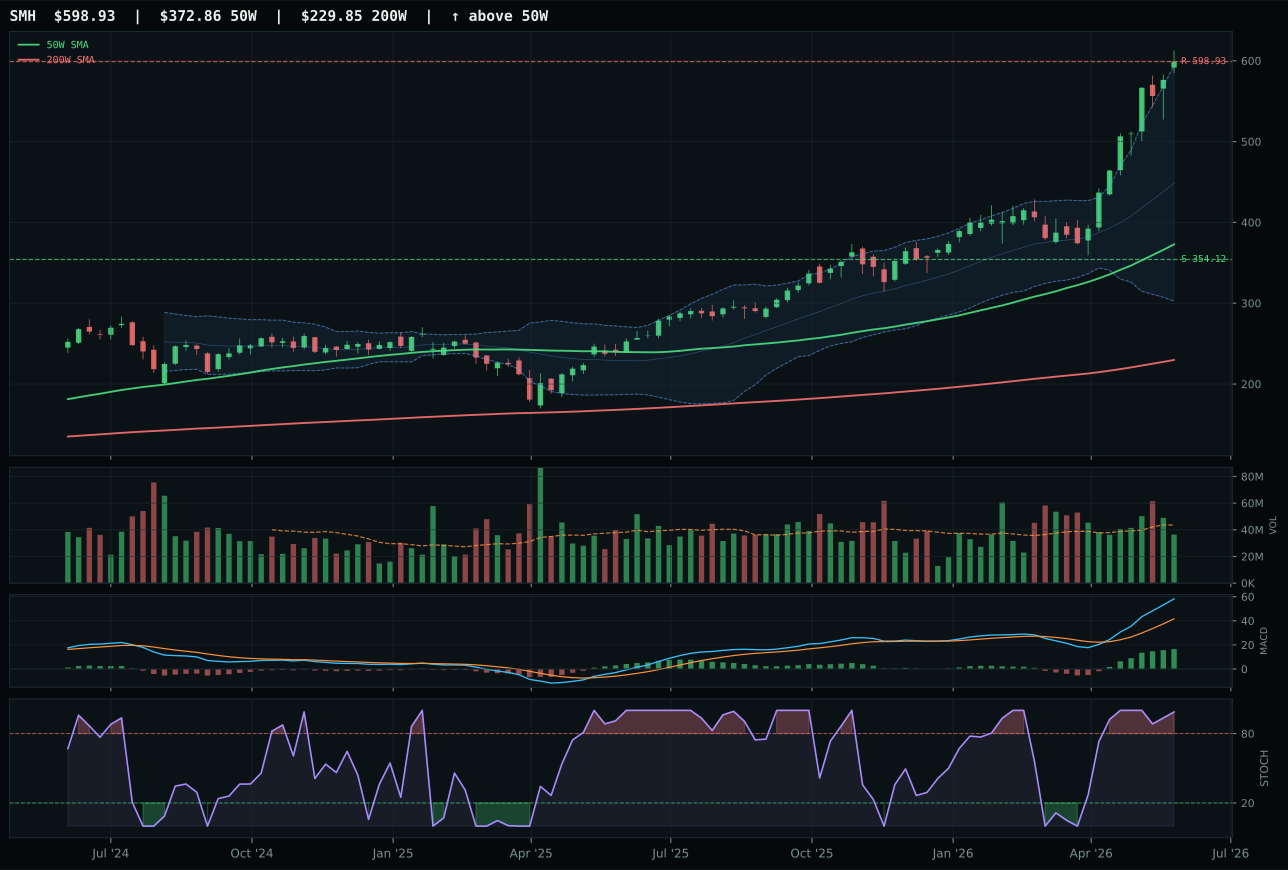
SMH has a vertical extension profile with 37.1% 13-week relative strength versus SPY.
A failed hold above support would weaken the setup.
Actionable but governed by invalidation levels.
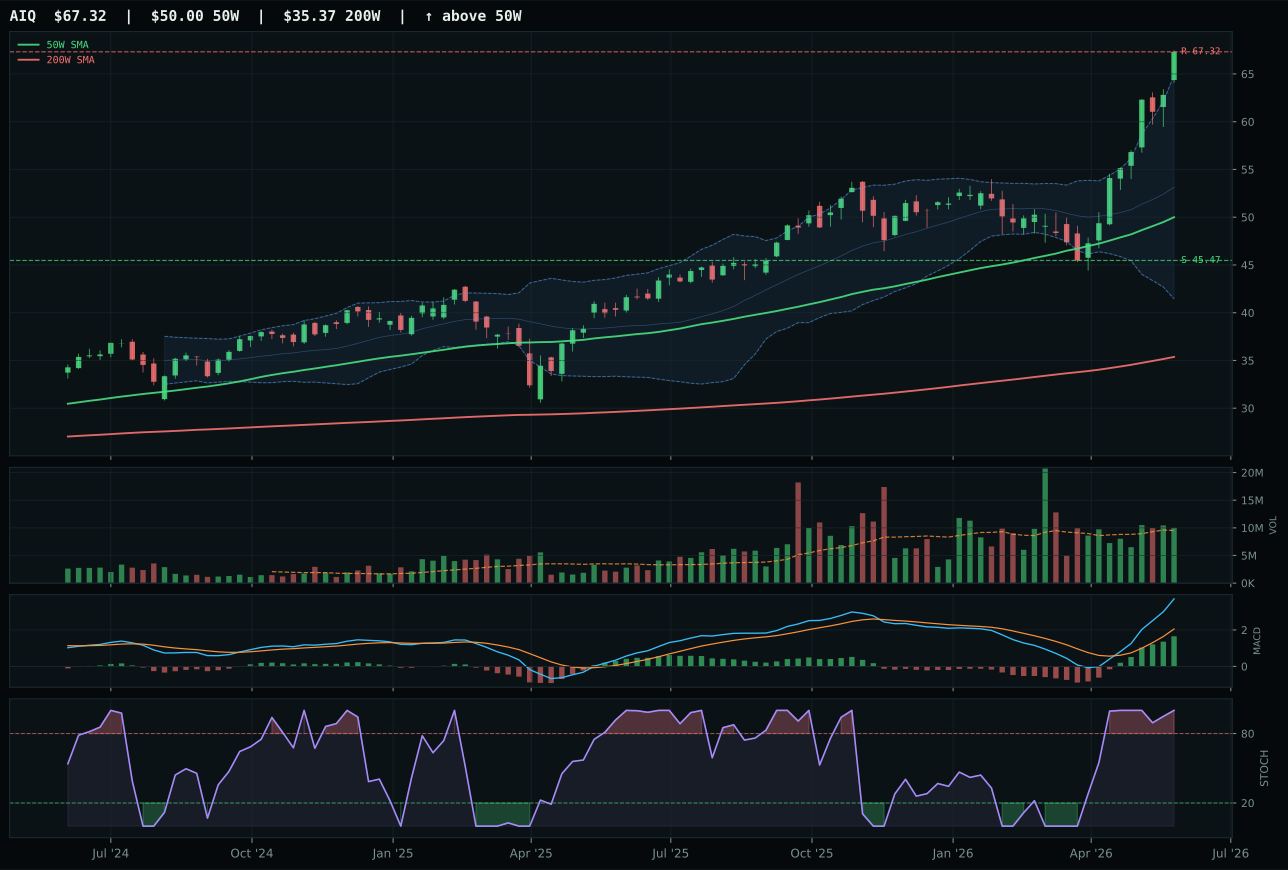
AIQ has a vertical extension profile with 23.7% 13-week relative strength versus SPY.
A failed hold above support would weaken the setup.
Actionable but governed by invalidation levels.
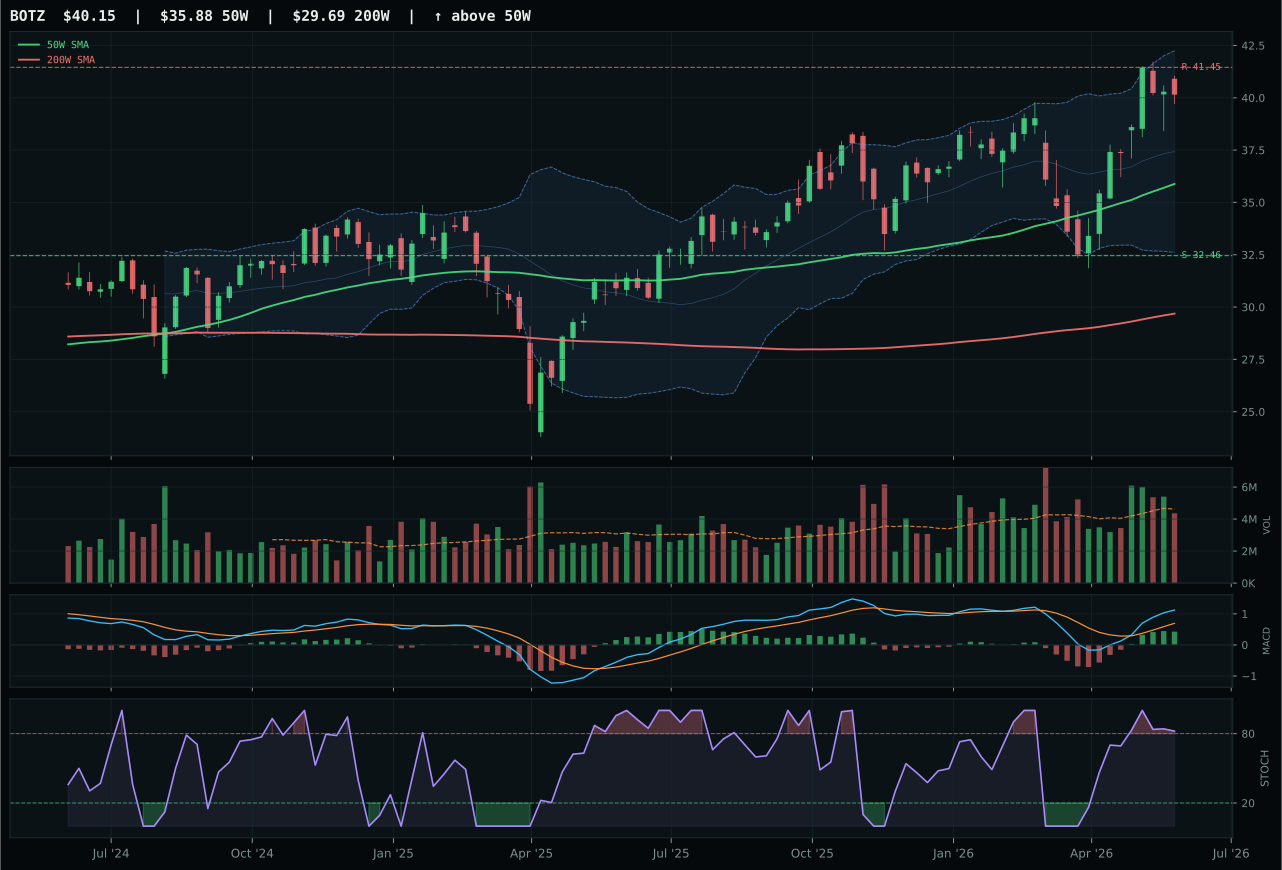
BOTZ has a neutral structure profile with -7.4% 13-week relative strength versus SPY.
A failed hold above support would weaken the setup.
Actionable but governed by invalidation levels.
AIQ wins despite carrying only a 1.4-point technical advantage over SMH, the critical difference lying in timing and momentum confirmation rather than raw momentum intensity. The 33.9% thirteen-week return trails SMH's 47.4%, but AIQ's price extension of 34.6% above the 50-week is measurably closer than SMH's 60.6% stretch, giving AIQ a superior risk-reward asymmetry of 40.0 versus 39.1 and a timing score advantage of 10 full points. SMH's stochastic RSI is rolling over while AIQ's remains overbought momentum, a subtle but material divergence that suggests SMH is beginning to reject new money at these levels while AIQ still has retail and systematic followthrough intact. Both display bullish, improving MACD and neutral volume, but AIQ's category-relative strength of 0.0% (dead even with peers) versus SMH's 13.4% advantage paradoxically strengthens AIQ's case—it indicates broad-based sponsorship rather than concentration in a single mega-cap narrative. The representative reasoning layer weighted AIQ's technical evidence at 68.6 versus SMH's 67.9, a narrow margin reflecting that this category decision lives on timing edge, not conviction.
AI earned its co-top allocation at 20% alongside Technology because the category score of 64.2 ranked second overall, and the macro environment is explicitly sponsoring AI growth with a +14 descriptor boost that feeds both ETF valuation and technician positioning. The Transition / Mixed regime typically favors secular growth stories that have institutional momentum, and AI sponsorship at +14 is the strongest single descriptor signal across the entire ten-category universe. Even though category-level momentum confirmation is constrained by the weighted 3/2/1 basket (which includes BOTZ at 42.1, a deeply underwater robotics play), the top two ETFs' volume participation and MACD health are sufficient to justify 20% capital allocation. The category's macro fit of 66.0 reflects strong risk appetite conditions and growth sponsorship offsetting credit stress and inflation headwinds. If SMH's stochastic RSI roll continues to deepen or if AI growth sponsorship toggles inactive, the allocation would contract; for now, AIQ's timing edge and the macro environment's explicit support for secular tech growth keep this at full conviction.
Defense & Aerospace — ROKT
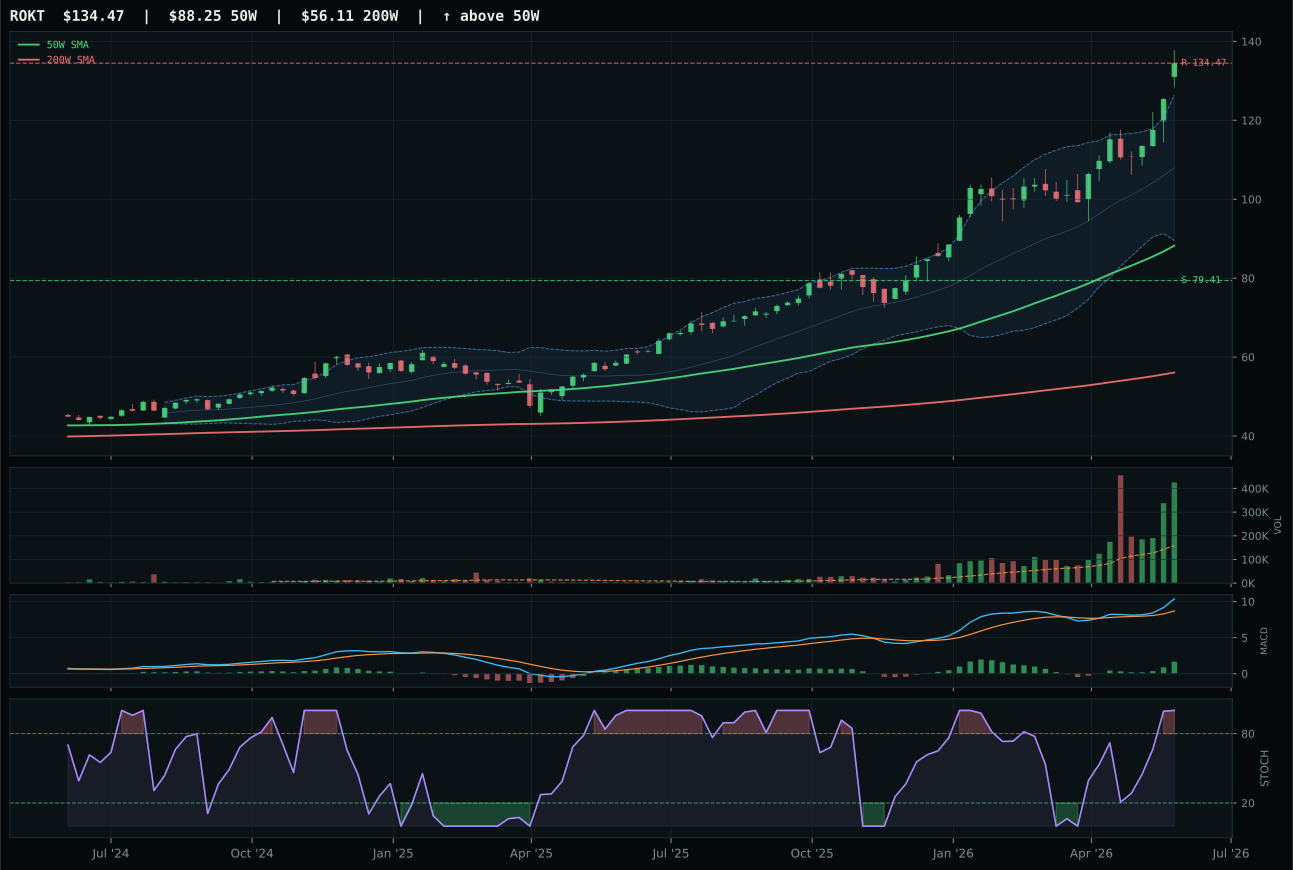
ROKT has a vertical extension profile with 19.4% 13-week relative strength versus SPY.
A failed hold above support would weaken the setup.
Actionable but governed by invalidation levels.
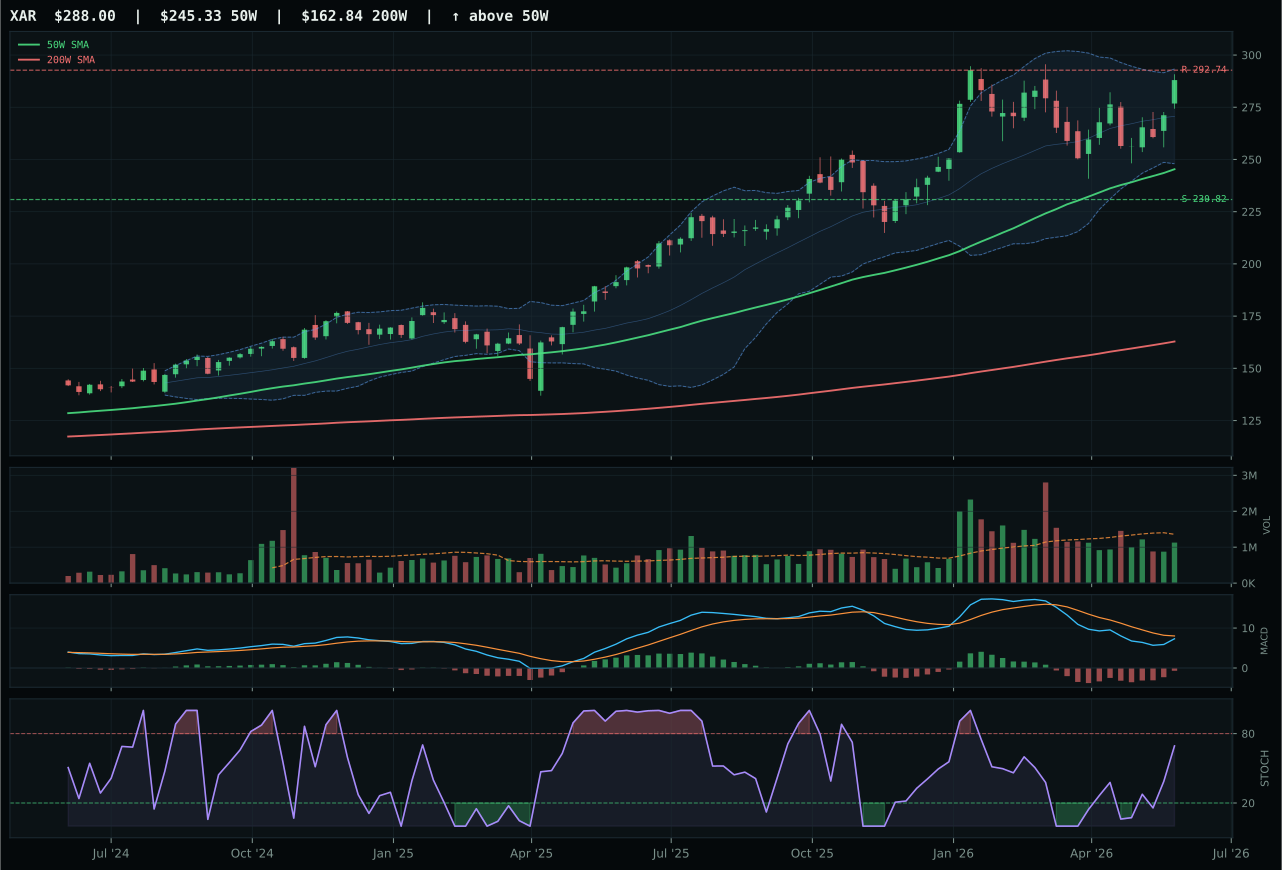
XAR has a vertical extension profile with -8.5% 13-week relative strength versus SPY.
A failed hold above support would weaken the setup.
Actionable but governed by invalidation levels.
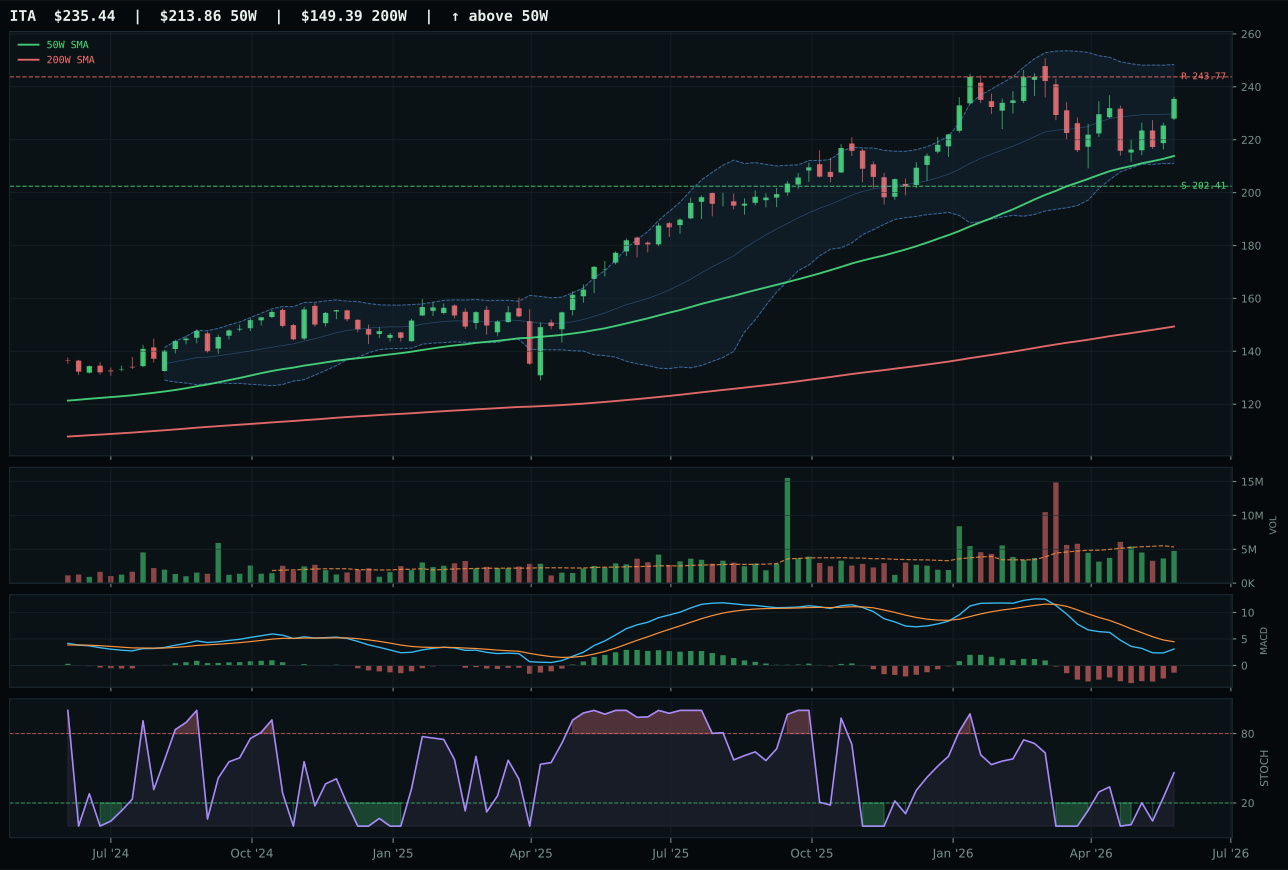
ITA has a neutral structure profile with -13.7% 13-week relative strength versus SPY.
A failed hold above support would weaken the setup.
Actionable but governed by invalidation levels.
ROKT dominates this category with a 9.4-point gap versus runner-up XAR, the victory built on dual confirmation from volume and relative strength that the runner-up cannot match. The 2.67x above-average participation and 27.9% category-relative strength represent institutional accumulation into aerospace growth, evidenced by the perfect 100.0 scores for both volume-price confirmation and persistence. Price sits 52.4% above the 50-week—an extreme extension that would normally penalize entry—but the volume sponsorship and MACD bullish improvement tell a coherent story: this is not a tired move by retail traders but an extension being actively defended by informed capital. XAR's MACD is bearish-but-improving while ROKT's is outright bullish-and-improving, a critical distinction that separates leaders from bottom-fishers. The 100.0 technical evidence score reflects the cleanest structure in the category basket at 83.8, meaning the move is vertically organized without compression noise or false breakouts; every dollar added goes to new highs. This is a setup where the absolute distance from the 50-week is less important than the quality of accumulation, and ROKT's volume participation and peer dominance prove the move is real.
Defense & Aerospace secured 10% allocation despite ranking third among eligible categories, a position that reflects the tension between excellent technical setup and modest macro fit. The category score of 55.0 trails Technology and AI, but the allocation holds because ROKT's 100.0 technical evidence combined with Transition / Mixed regime support (+3) creates tactical opportunity: this is a position where allocators can buy excellence on momentum without betting the portfolio on a macro thesis. The macro fit of 55.0 is neutral-to-slightly-positive, driven by risk appetite and credit stress offsetting each other, which means the position lives or dies on technician mechanics, not narrative. The nine-point gap between ROKT and its peers, combined with perfect volume confirmation and category-relative dominance, justifies holding the position despite its third-tier ranking. If volume participation drops below 1.5x average or if relative strength versus SPY deteriorates below 10%, the allocation would be vulnerable to downsize; for now, it represents a high-quality technical setup in a category the macro environment neither loves nor hates.
Traditional Energy — XLE
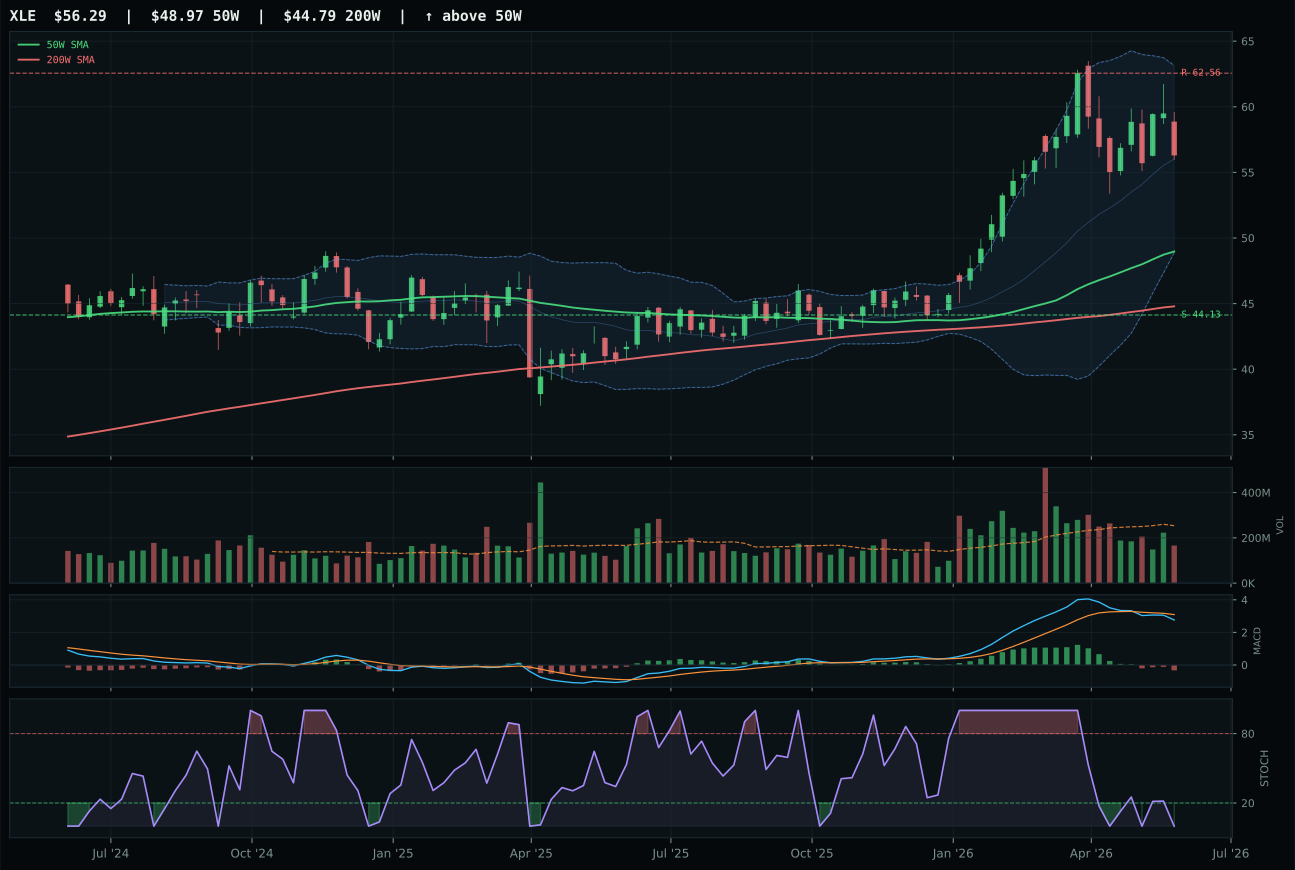
XLE has a neutral structure profile with -9.6% 13-week relative strength versus SPY.
A failed hold above support would weaken the setup.
Actionable but governed by invalidation levels.
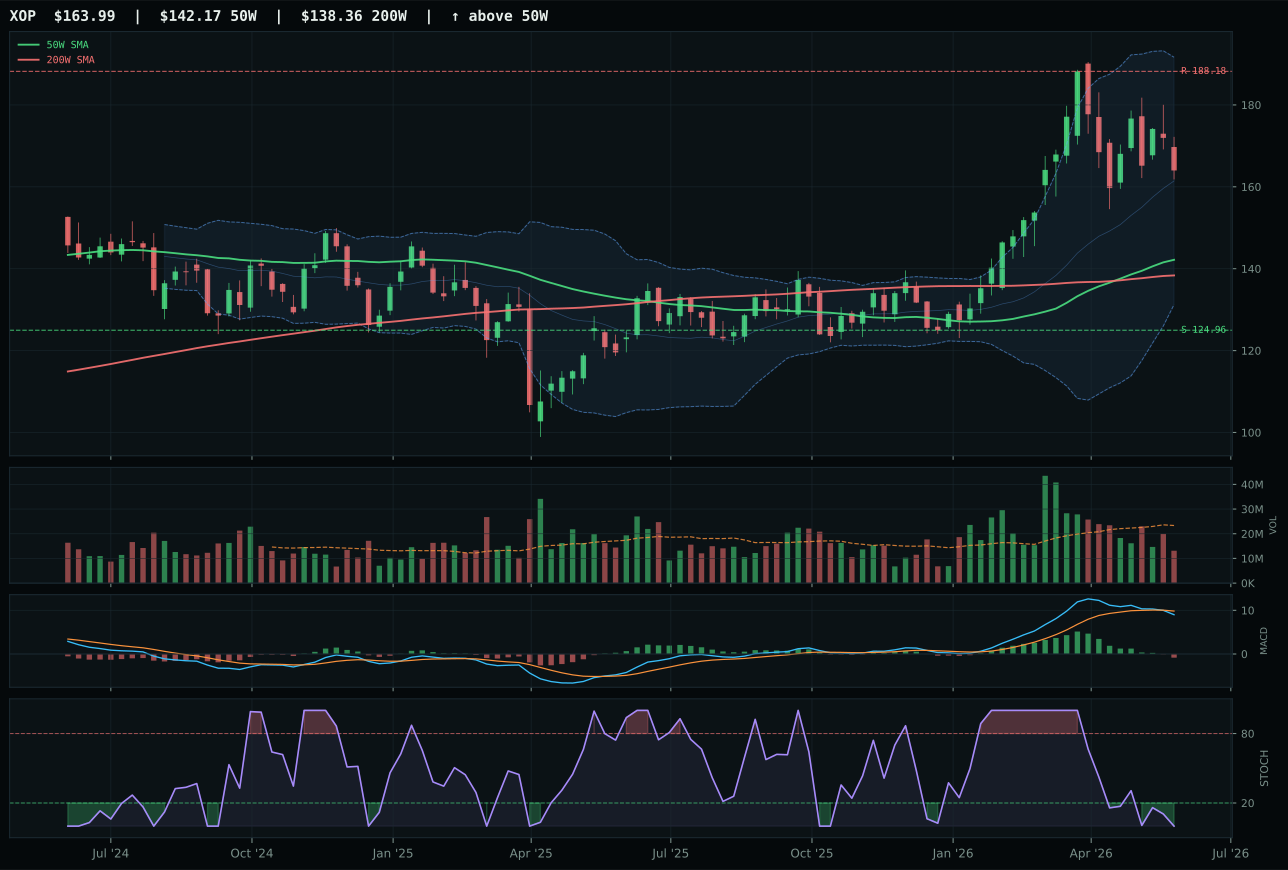
XOP has a vertical extension profile with -3.6% 13-week relative strength versus SPY.
A failed hold above support would weaken the setup.
Actionable but governed by invalidation levels.
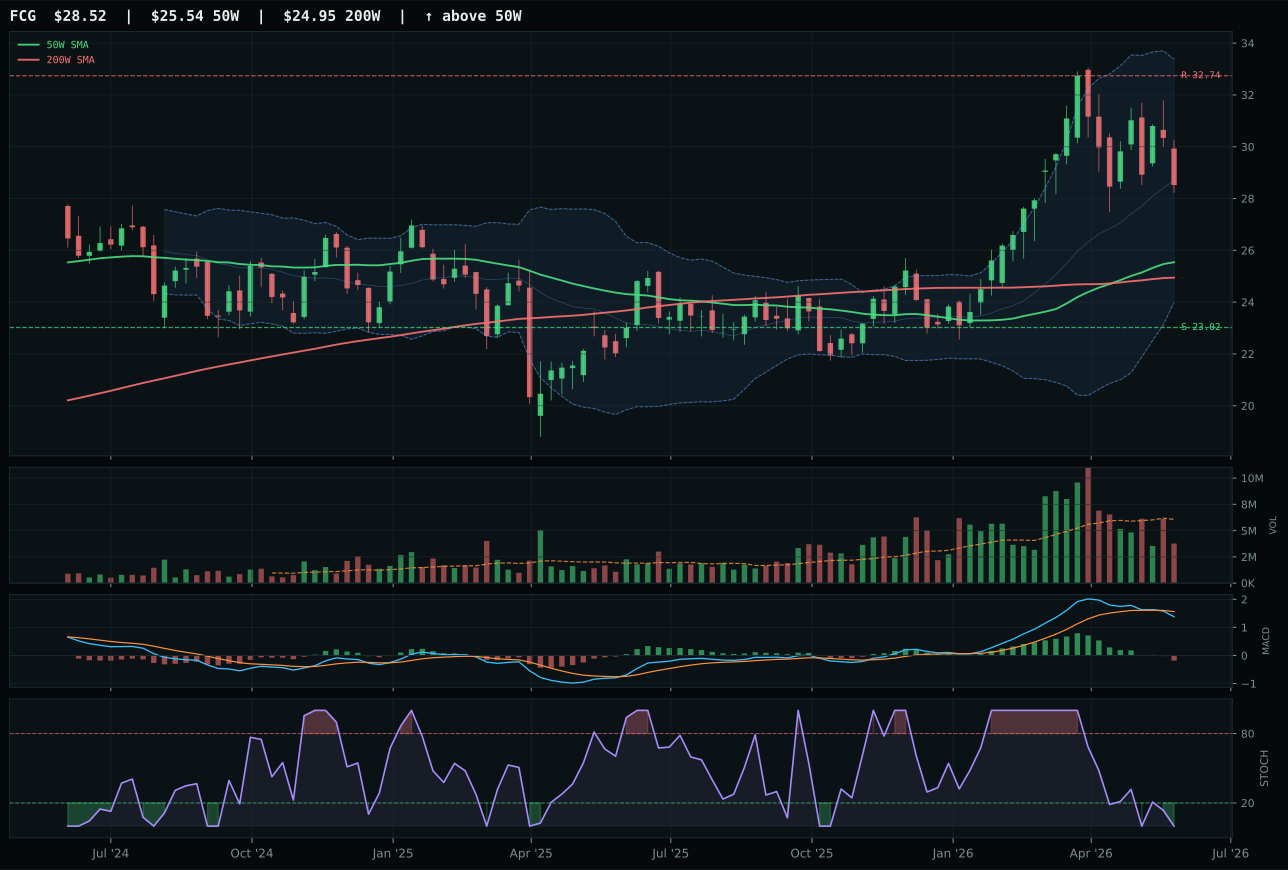
FCG has a neutral structure profile with -8.2% 13-week relative strength versus SPY.
A failed hold above support would weaken the setup.
Actionable but governed by invalidation levels.
XLE defeats XOP and FCG through a combination of timing superiority and structural defensibility rather than momentum dominance. The 70.0 timing score versus XOP's 48.0 reflects XLE's proximity to major moving averages and its stochastic RSI reading at 0.00, signaling an oversold condition where institutional buyers historically accumulate large-cap energy exposure. XLE's 13W return of 0.7% trails XOP's 6.7%, but the narrower extension (14.9% versus unspecified for XOP at 52W high) means new capital faces less entry resistance. XOP's setup is vertical extension with thin participation, a configuration that invites strong reversals when technical conditions reset; XLE's neutral structure (69.7) provides steadier footing for sustained accumulation. The MACD is bearish/weakening across both, confirming that energy leadership is primarily macro-driven (energy scarcity at +16, inflation pressure at +10), not technician, making timing and support-proximity the critical tiebreakers. XLE's integration into the S&P 500 and its cash-flow focus make it the natural first choice for allocators building real asset exposure in a supply-constrained macro environment.
Traditional Energy earned 10% despite a modest 52.9 category score because the macro environment is explicitly sponsoring energy exposure with the strongest descriptor signal outside of commodities: energy scarcity at +16, inflation pressure at +10, supply shortage at +9, and real asset sponsorship at +7 combine for a macro fit of 85.0, second only to Agriculture. The Transition / Mixed regime is structurally friendly to energy when scarcity narratives are active, and the descriptor profile confirms that supply constraints are real, not cyclical. XLE's technical weakness (27.2 technical evidence, near-zero 13W momentum) paradoxically strengthens the case: the allocation is not betting on energy momentum but on structural support from supply constraints, making entry at depressed technician readings a feature. The category's rank of third-worst (52.9) is accepted because energy scarcity is non-cyclical and structural—allocators must maintain exposure even when technician signals are weak. If energy scarcity toggles inactive or if inflation pressure reverses sharply, the position would face immediate pressure; as structured, it represents macro conviction with minimal technician risk-on bias.
Agriculture & Livestock — MOO
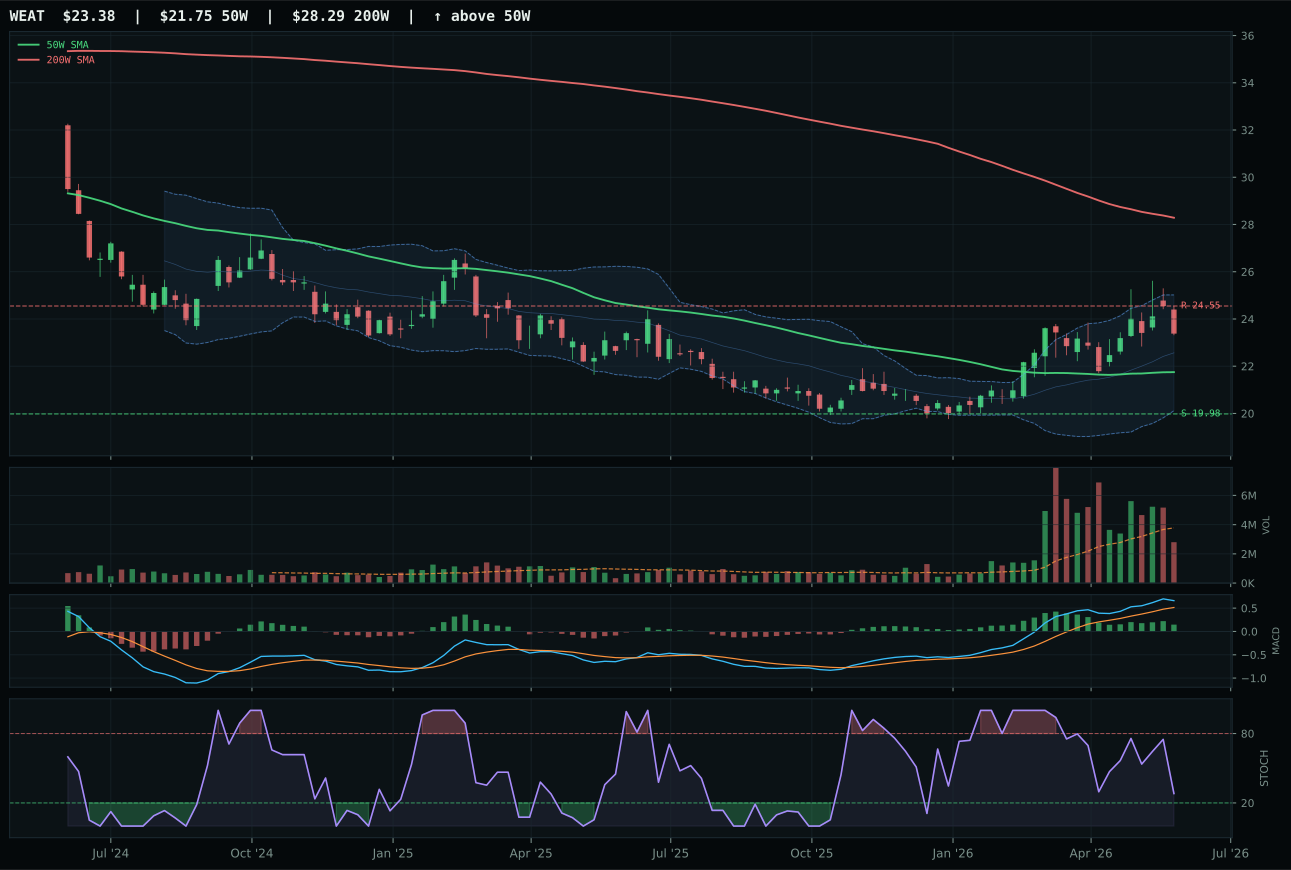
WEAT has a neutral structure profile with -6.7% 13-week relative strength versus SPY.
A failed hold above support would weaken the setup.
Actionable but governed by invalidation levels.
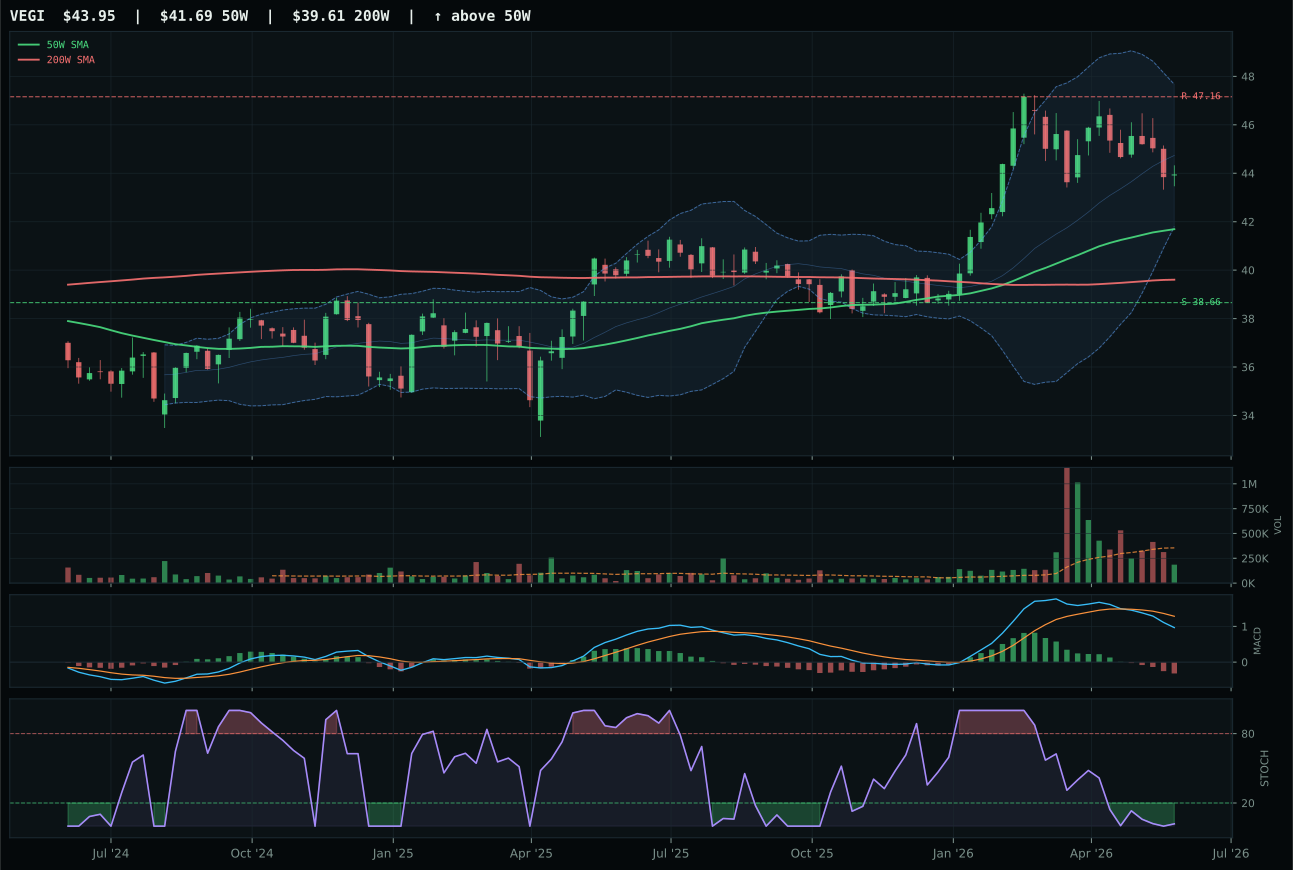
VEGI has a neutral structure profile with -15.9% 13-week relative strength versus SPY.
A failed hold above support would weaken the setup.
Actionable but governed by invalidation levels.
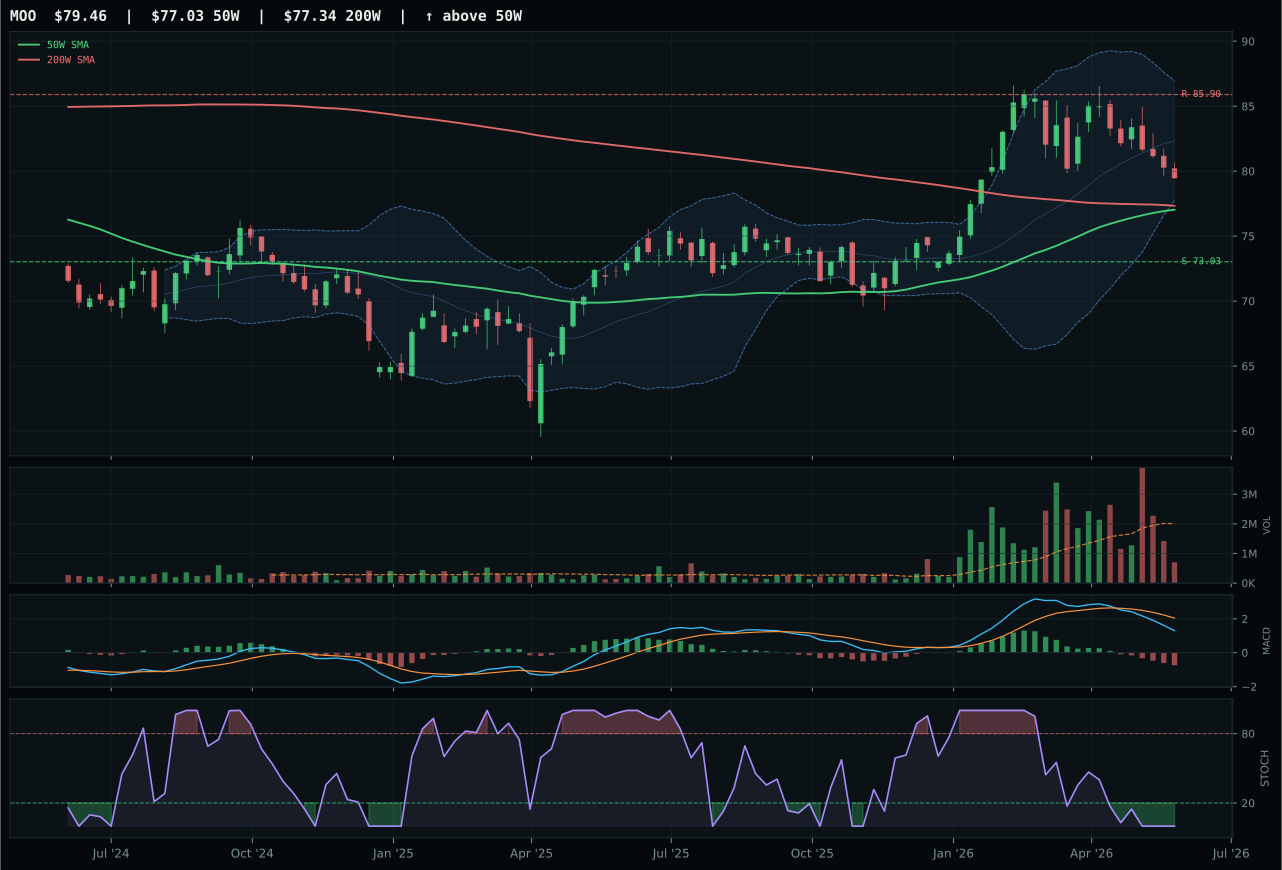
MOO has a neutral structure profile with -17.4% 13-week relative strength versus SPY.
A failed hold above support would weaken the setup.
Actionable but governed by invalidation levels.
MOO wins despite being technically the weakest representative in its own category, a counterintuitive outcome that reveals the power of macro descriptor alignment in a transition regime. The 92.0 timing score is the critical edge—MOO sits only 3.2% above the 50-week, nearly touching the moving average in a technically oversold state (stochastic RSI at 0.00), positioning it as a mean-reversion coil if supply shortage and inflation pressure descriptors remain active. WEAT, the runner-up, has better MACD health (bullish-but-flattening versus bearish/weakening) and cleaner structure, but it sits in an upper retracement zone with lower r/r (50.0 vs 68.3), making it less appealing for value-oriented capital. The macro layer (70.0 fit) dominates the technical layer (23.8 evidence) at the ETF level, a 3:1 tilt that recognizes real assets are sponsored by descriptor signals that trump chart mechanics. MOO's negative momentum (zero confirmation score) would normally disqualify it, but the supply shortage (+8), inflation pressure (+7), and real asset sponsorship (+5) descriptors override momentum weakness—this is a category where macro structural factors matter more than price action, and MOO's proximity to support makes it the lowest-risk entry into those themes.
Agriculture & Livestock earned 10% despite a weak 46.8 category score because the macro environment provides explicit structural support that justifies tactical exposure even amid negative technician signals. The category-level macro fit of 86.0 is the second-strongest across the entire portfolio after Energy, driven by supply shortage (+13), inflation pressure (+10), real asset sponsorship (+8), and commodity breadth positive (+5)—a quadruple-play of tailwinds that cannot be ignored. The Transition / Mixed regime typically favors real assets when supply constraints are active, and the descriptor profile confirms structural tightness, not cyclical bounce. MOO's technical weakness (0.0 momentum confirmation, thin volume) is a risk, but it also means entry risk is minimal: buyers at these levels are not chasing extended moves but accumulating value into macro-supported themes. The gap between the reasoned ETF proof order (WEAT 63.6 as the technical leader) and the category winner MOO (40.3 technical evidence) is dramatic, revealing this is purely a macro allocation driven by descriptor profile, not technician conviction. If supply shortage toggles inactive or if real asset sponsorship evaporates, the allocation should downsize immediately; until then, it serves as a hedge against inflation and structural commodity tightness.
Industrial Metals — COPX
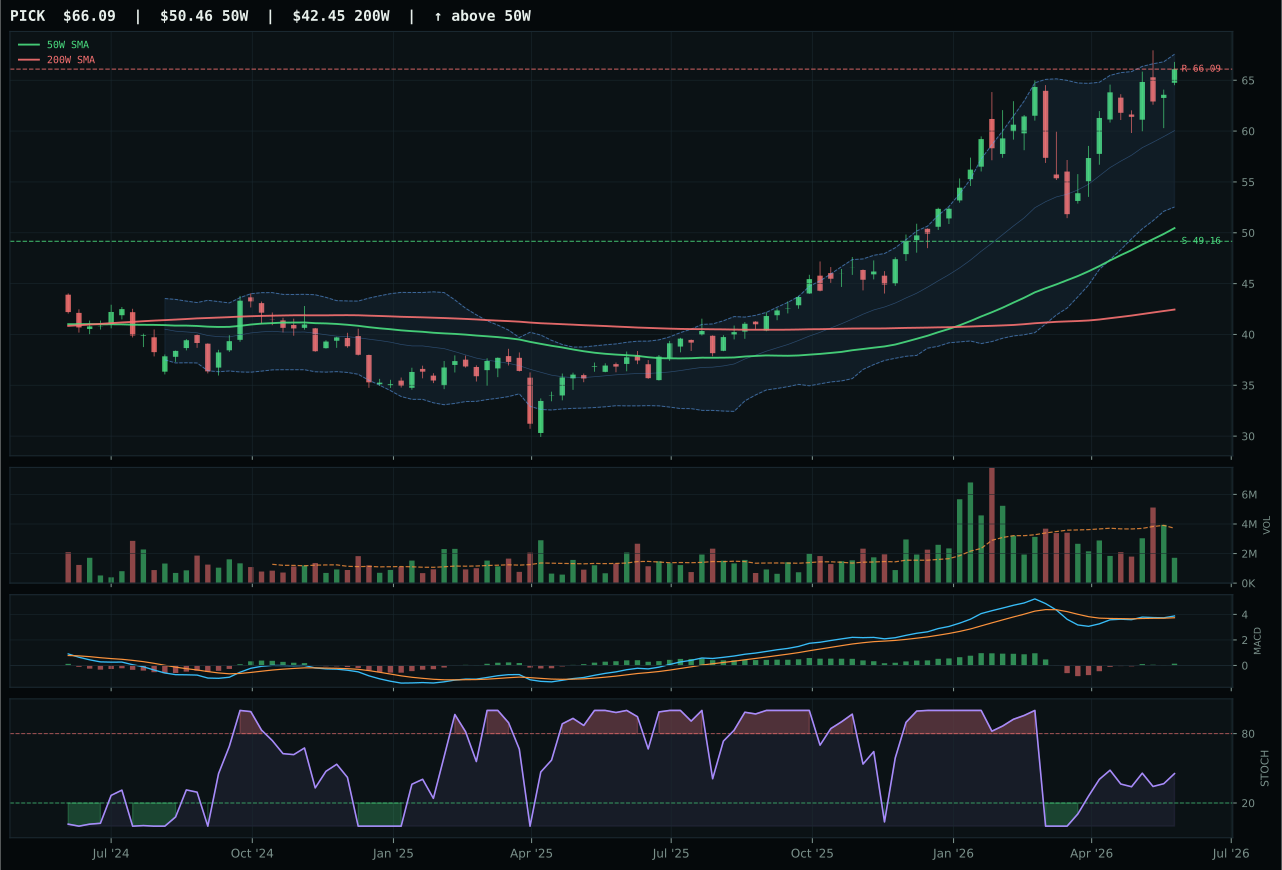
PICK has a vertical extension profile with -7.6% 13-week relative strength versus SPY.
A failed hold above support would weaken the setup.
Actionable but governed by invalidation levels.
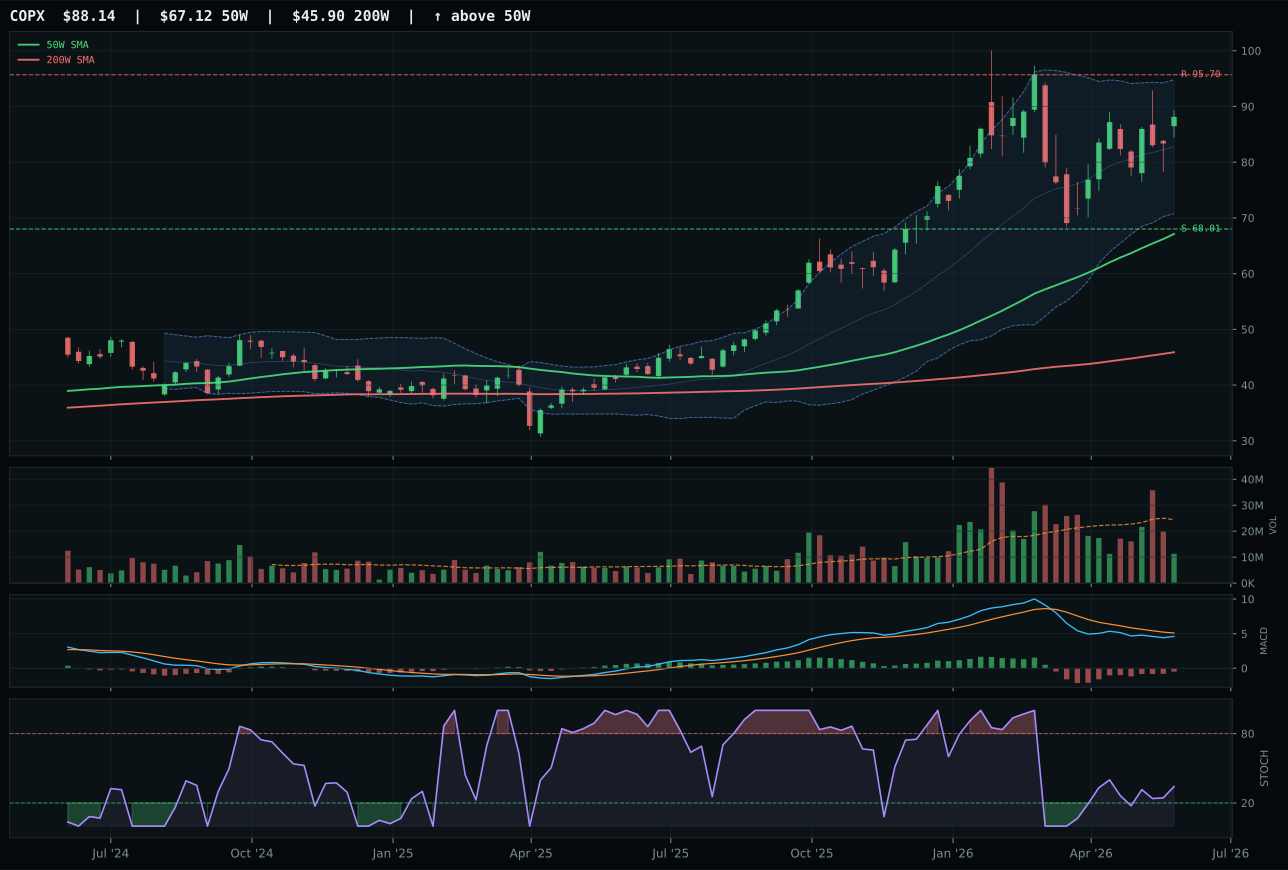
COPX has a vertical extension profile with -18.2% 13-week relative strength versus SPY.
A failed hold above support would weaken the setup.
Actionable but governed by invalidation levels.
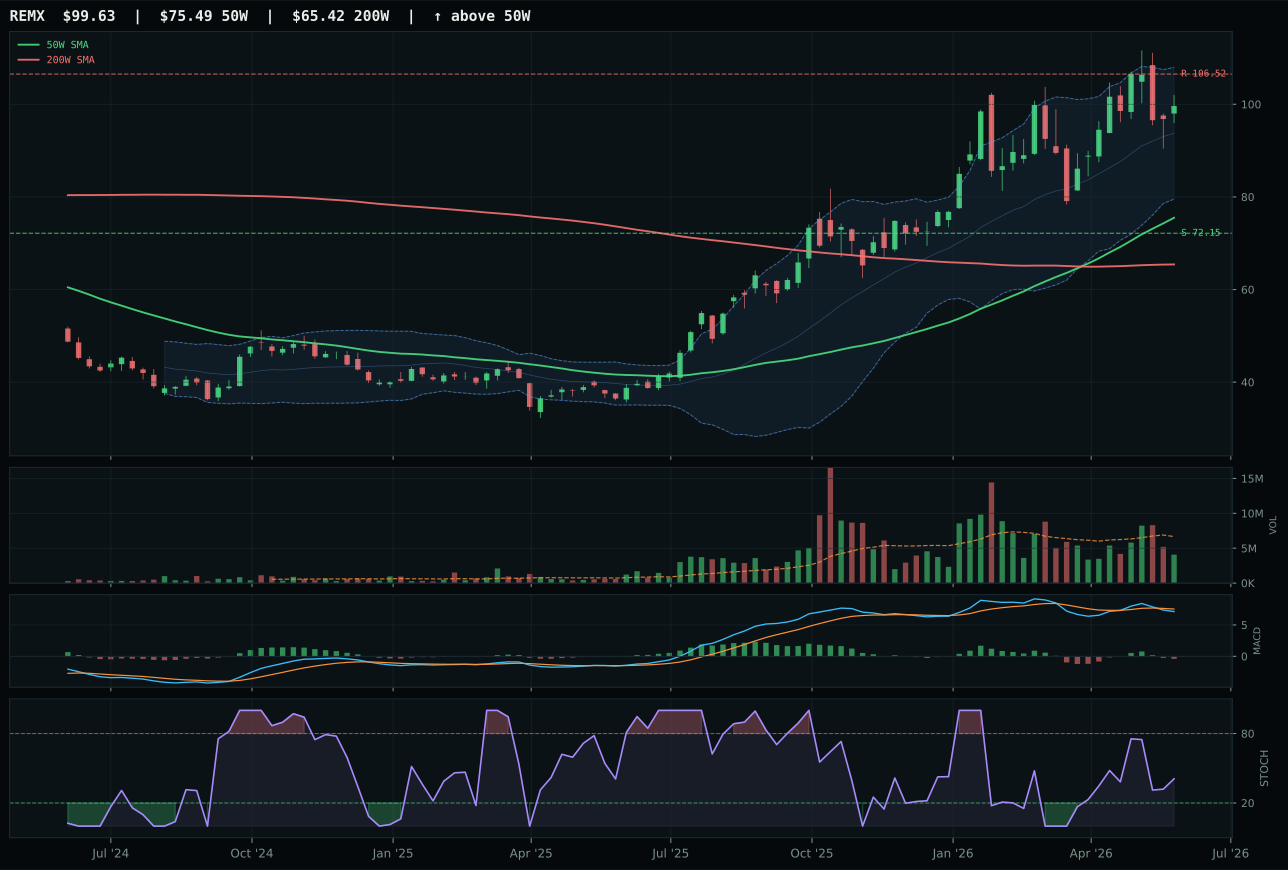
REMX has a vertical extension profile with -10.5% 13-week relative strength versus SPY.
A failed hold above support would weaken the setup.
Actionable but governed by invalidation levels.
COPX wins despite ranking last among its own three-ETF basket at 37.2 technical evidence, a reversal of typical category selection that underscores the macro layer's dominance in commodity metals categories. PICK, the runner-up, has superior momentum confirmation (momentum score 65 versus 18), better MACD (bullish and improving versus bearish but improving), and a cleaner recent chart, but it sits further from the decision zone and carries a weaker timing score (45.0 versus 61.0). The critical difference is stochastic RSI timing: COPX is rising mid-zone at 0.34, suggesting a potential inflection from oversold, while PICK is falling/neutral at lower readings, lacking the mechanical setup for mean-reversion buyers. More importantly, the macro layer weights 36% of category fit, and COPX's descriptor alignment is superior—metals scarcity at +12 and copper-specific industrial demand are explicit sponsor signals that override the momentum disadvantage. COPX's structure (66.1) is respectable for a metals play, and the 31.3% extension above the 50-week is manageable given the thin participation (0.46x)—this is an entry point for structural buyers, not a chase for momentum players.
Industrial Metals earned 10% despite a weak 44.9 category score because the macro fit of 73.0 is among the strongest in the portfolio, anchored by metals scarcity (+14) and commodity breadth positive (+10) descriptors that explicitly sponsor supply-constrained narratives. The Transition / Mixed regime tends to favor real assets when scarcity signals are active, and COPX provides direct exposure to copper constrained supply without the equity-cycle leverage of PICK. The category's technical weakness is a feature, not a bug: entry risk is minimal when an ETF trades at depressed volume and negative returns, making this a position for structural buyers willing to accept near-term pain for macro alignment. The macro environment has shifted toward real asset sponsorship (+6 across the portfolio), and metals represent one of the purest expressions of that shift. The gap between PICK's superior technician setup (51.1 reasoned evidence) and COPX's category selection (37.2 evidence) reveals this is entirely a macro call: if copper supply constraints ease or if commodity breadth toggles negative, the allocation should contract immediately; as long as both signals remain active, COPX serves as the lowest-risk entry into industrial metals, despite its technical mediocrity.
Nuclear Energy — NLR
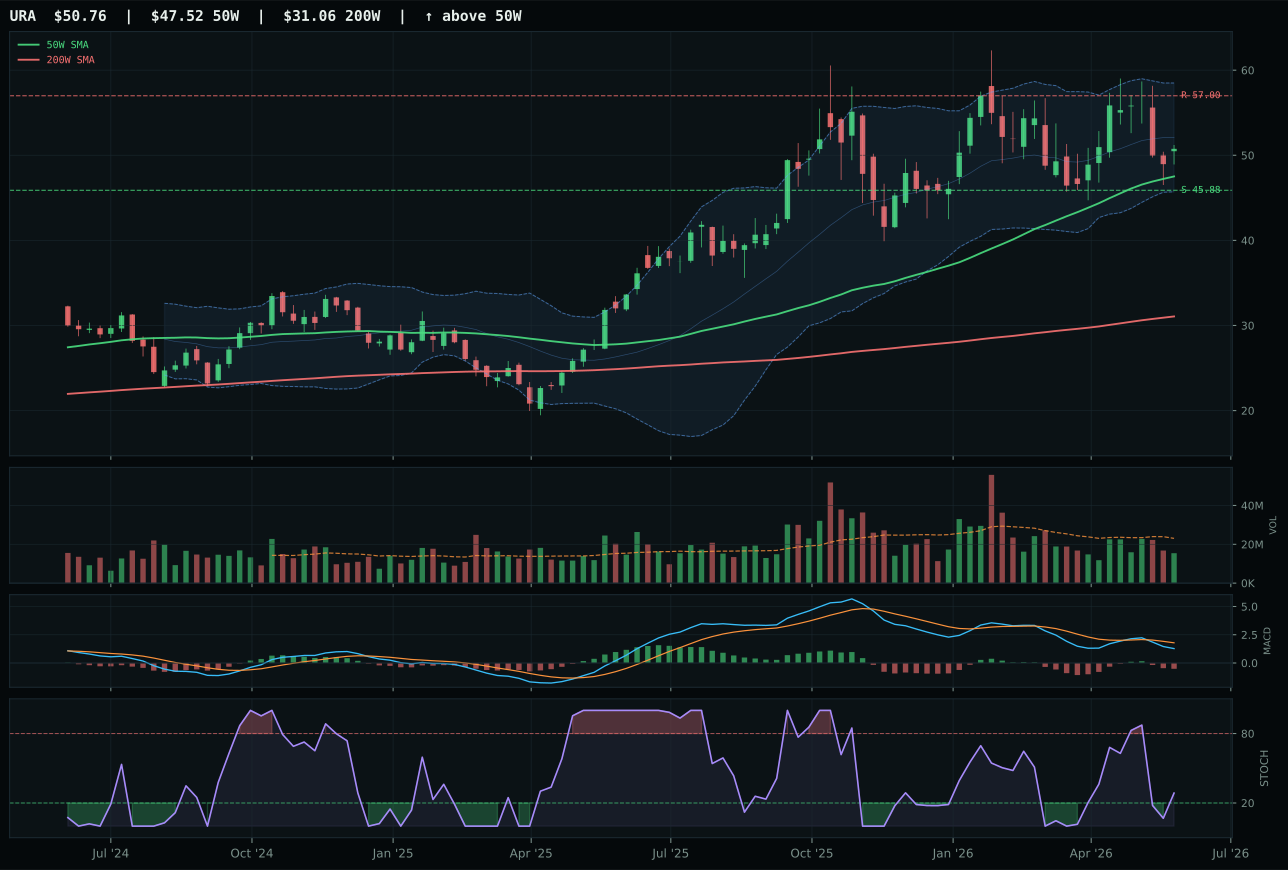
URA has a neutral structure profile with -16.9% 13-week relative strength versus SPY.
A failed hold above support would weaken the setup.
Actionable but governed by invalidation levels.
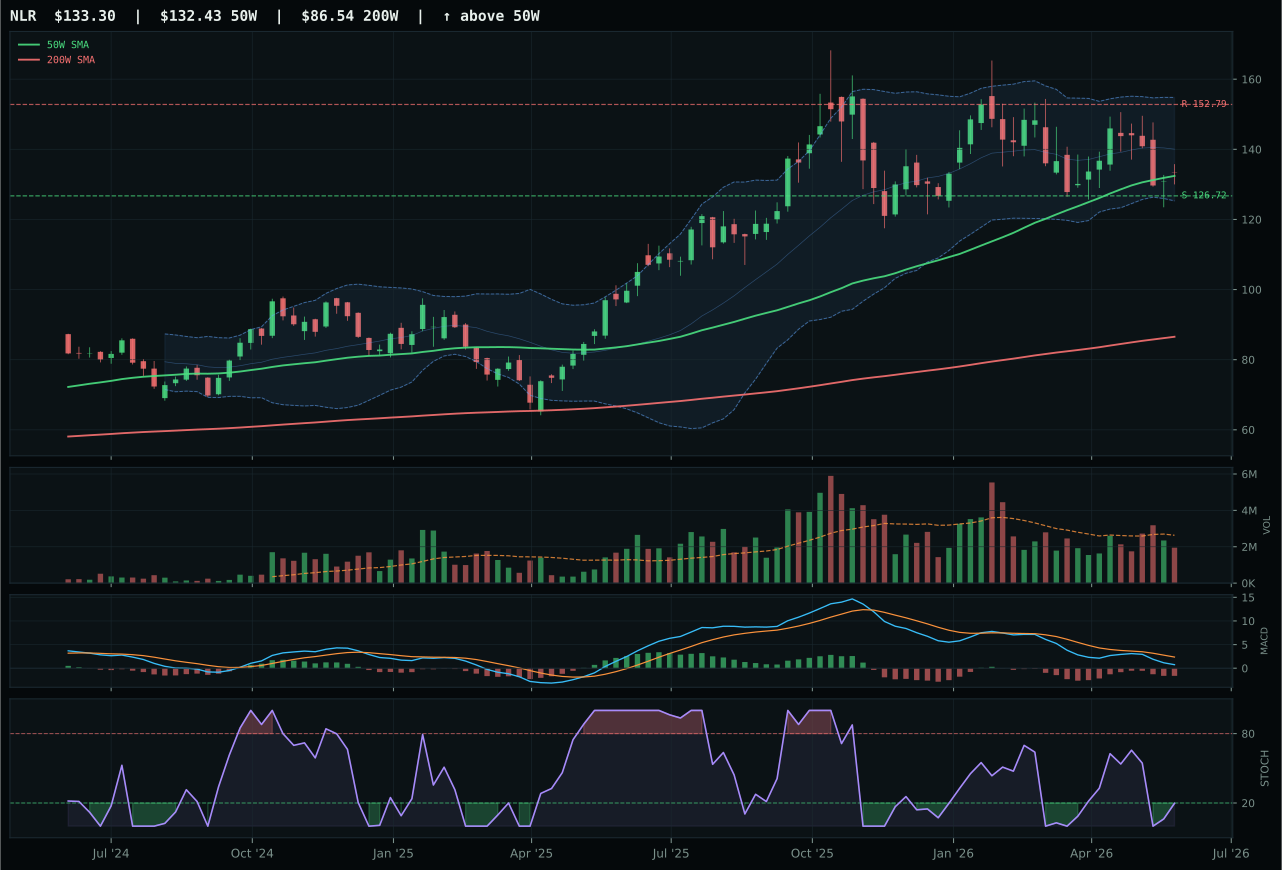
NLR has a compression near 50W profile with -20.4% 13-week relative strength versus SPY.
A failed hold above support would weaken the setup.
Actionable but governed by invalidation levels.
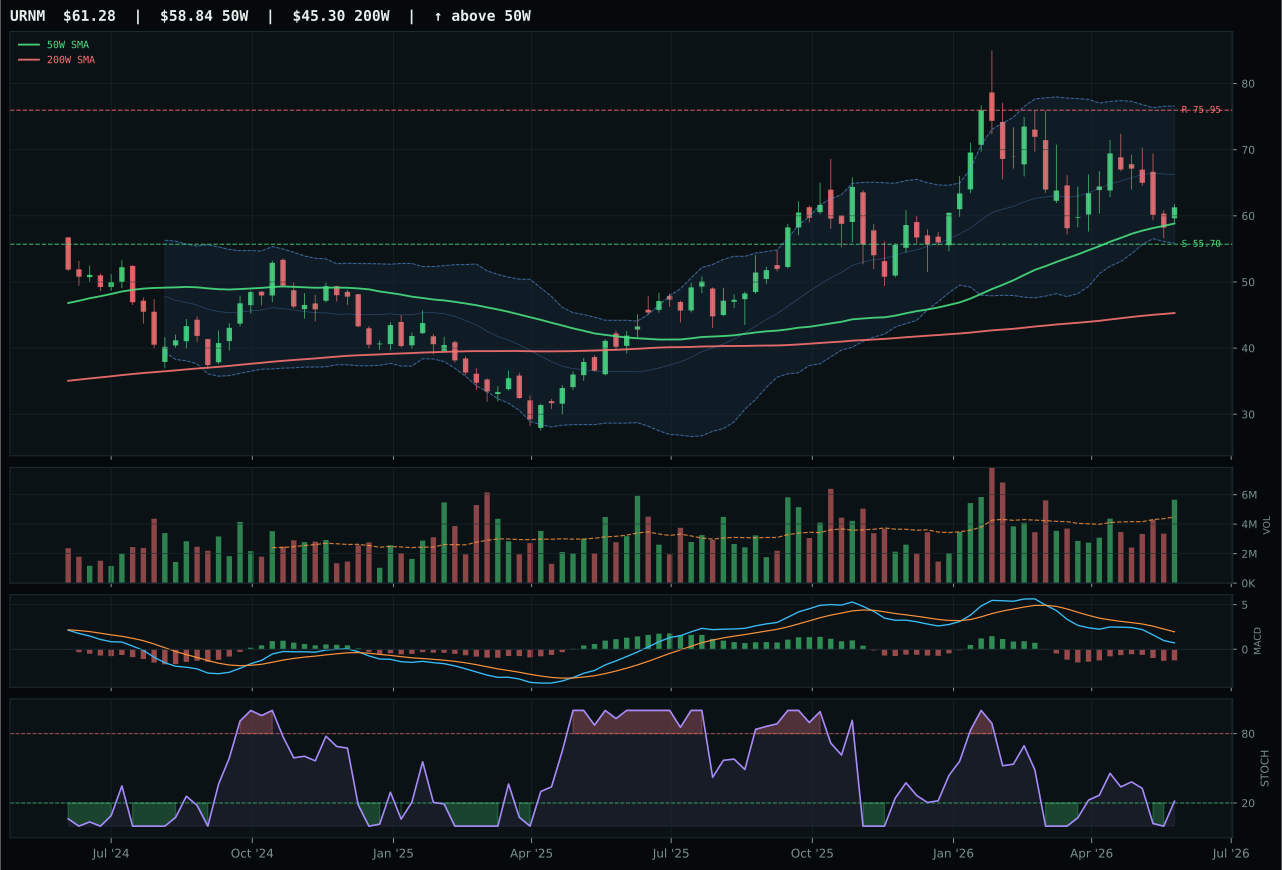
URNM has a neutral structure profile with -25.1% 13-week relative strength versus SPY.
A failed hold above support would weaken the setup.
Actionable but governed by invalidation levels.
NLR wins through timing perfection rather than momentum, capturing the mean-reversion edge in an oversold category where price sits almost on top of the 50-week moving average. The 100.0 timing score is the highest in the portfolio, driven by the 0.7% proximity to the 50-week, MACD bearish/weakening, stochastic RSI oversold at 0.20, and Fib location at 0.500—a textbook coil setup for structural buyers. URA, the runner-up, has a weaker timing score (70.0 versus 100.0) and sits further from support (6.8% above 50W versus 0.7%), making it a less appealing entry for value-oriented capital. NLR's 82.2 risk-reward score reflects the mechanical advantage of shallow depth from the moving average: downside to support is only 5.2%, while the spread between support and resistance (126.72 to 152.79) provides ample room for mean-reversion bounce. Both display negative 13W returns and oversold technician conditions, but NLR's compression-near-50W setup is the classic accumulation pattern that precedes breakouts, while URA's neutral structure lacks that mechanical advantage. The compression cleanliness of 66.7 confirms this is not noise but genuine buyer accumulation into undersold levels.
Nuclear Energy earned 10% despite ranking seventh with a 40.4 category score because the macro environment provides specific sponsorship through energy scarcity (+9), real asset sponsorship (+7), and AI growth sponsorship (+5), creating a triple-catalyst environment for a utility that powers data centers and enables decarbonization. The Transition / Mixed regime favors nuclear when both energy and grid modernization narratives are active, and the descriptor profile confirms that multiple structural forces are converging. NLR's technical weakness (only 31.7 technical evidence) is offset by the perfect timing setup—this is a position for mean-reversion buyers willing to accumulate into capitulation. The near-zero momentum confirmation (0.0) would normally disqualify the position, but macro sponsorship and the mechanical coil setup override momentum weakness in a transition regime. The allocation functions as a structural play on energy scarcity and decarbonization rather than a technician bet, accepting near-term pain (negative returns, thin volume) in exchange for exposure to multiple positive macro vectors. If energy scarcity toggles inactive and real asset sponsorship evaporates, the position would face pressure; as long as both remain active, it provides diversified real asset exposure distinct from oil and metals.
Utilities & Infrastructure — PAVE
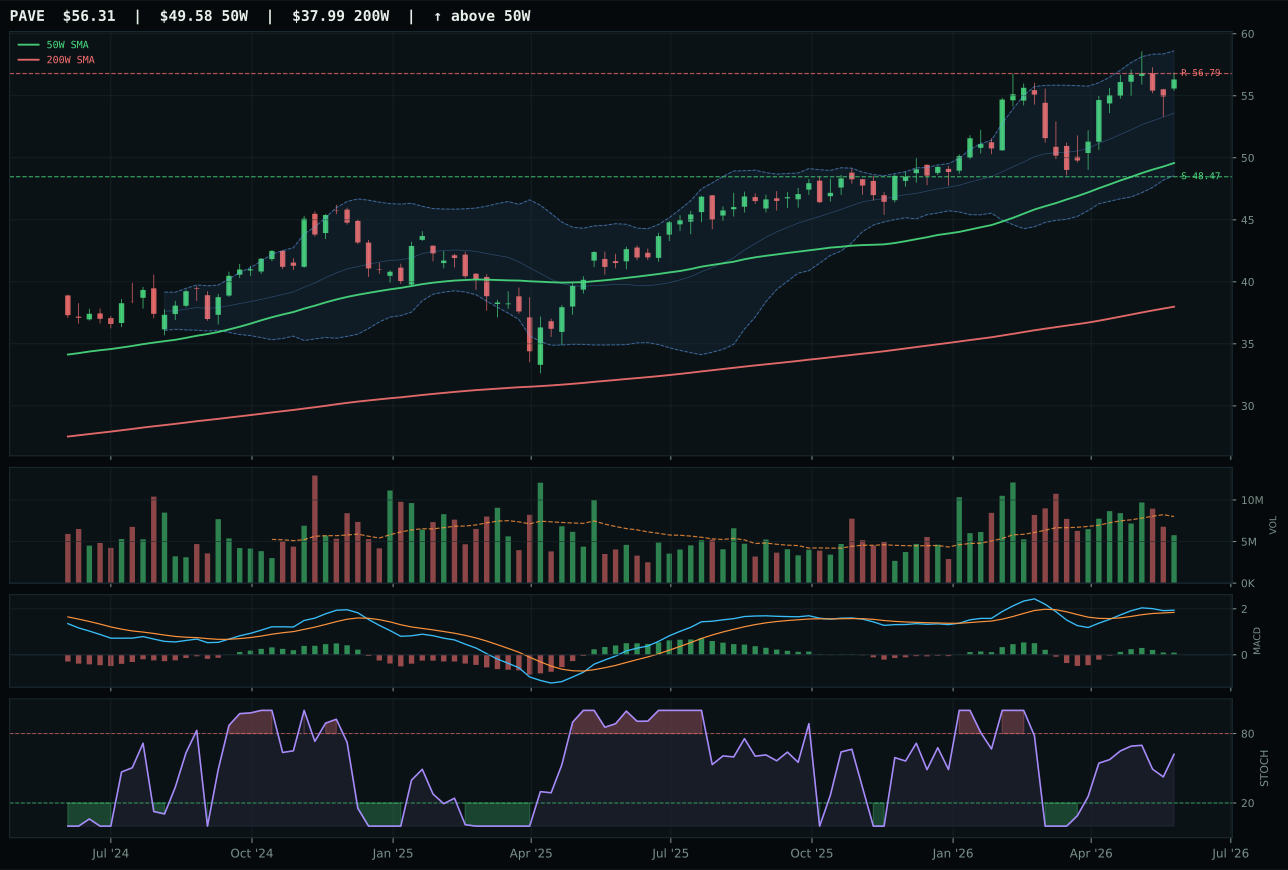
PAVE has a neutral structure profile with -8.1% 13-week relative strength versus SPY.
A failed hold above support would weaken the setup.
Actionable but governed by invalidation levels.
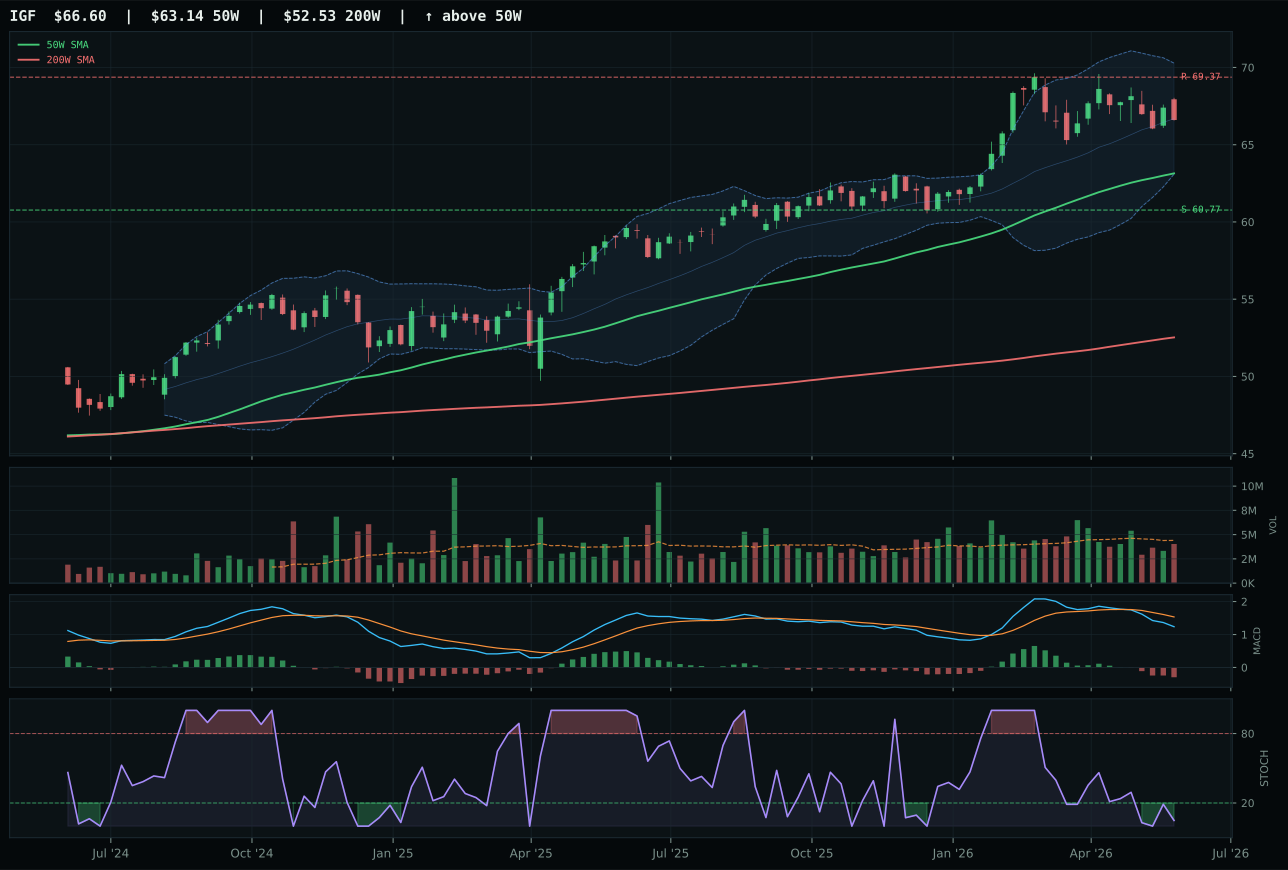
IGF has a neutral structure profile with -14.3% 13-week relative strength versus SPY.
A failed hold above support would weaken the setup.
Actionable but governed by invalidation levels.
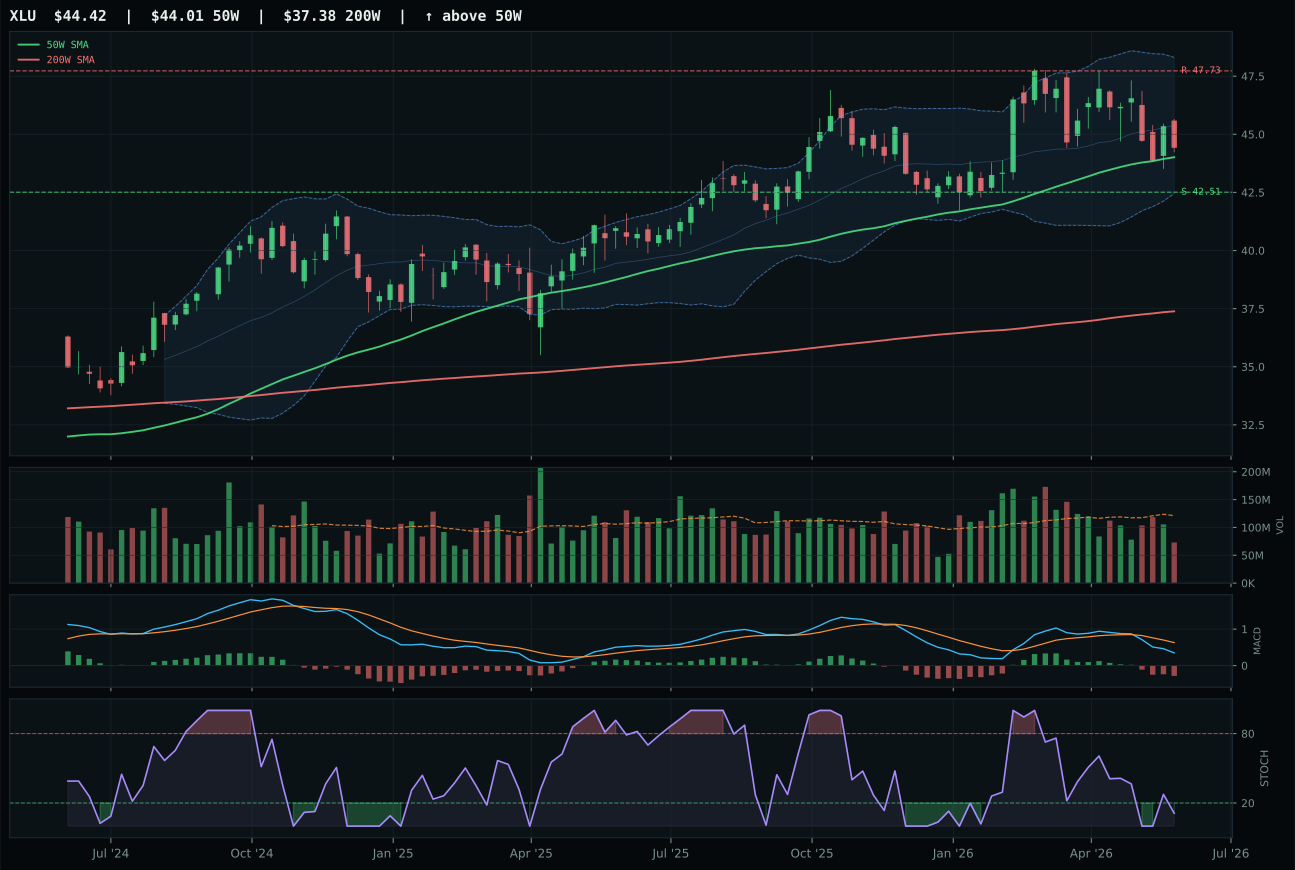
XLU has a pullback into support profile with -17.2% 13-week relative strength versus SPY.
A failed hold above support would weaken the setup.
Actionable but governed by invalidation levels.
PAVE wins this category by default rather than dominance, a 8.4-point gap over runner-up IGF reflecting that the category selection is driven more by neutral macro fit (46.0) than technical excellence. PAVE's 83.9 trend score is strong, price above both the 50W and 200W with a 0.6% slope maintaining consistency, and the 2.2% 13W return beats IGF's negative 4.0%, confirming domestic infrastructure spending is being accumulated. IGF's MACD is bearish/weakening while PAVE's is bullish-but-flattening, a distinction that matters in mean-reversion environments but becomes academic when both categories carry weak momentum. PAVE's 6.2% category-relative strength advantage signals preference for domestic exposure, and the infrastructure-focused narrative aligns better with Transition / Mixed regimes where capex cycles often stabilize first. The structure scores are nearly identical (74.1 versus 73.0), confirming the victory is about relative strength and volume rather than absolute setup quality; this is a category where all vehicles are mediocre, and victory goes to the least impaired option.
Utilities & Infrastructure earned 10% as an acceptor of Transition / Mixed regime support (+4) despite ranking eighth with a 40.3 category score, a position that reflects allocators' need for ballast when momentum categories face extension risk. The macro fit of 46.0 is exactly neutral, a configuration that creates portfolio friction without directional conviction—inflation pressure at minus 6 and risk appetite at minus 2 offset each other, meaning the position lives on technician mechanics alone. PAVE's 62.6 technical evidence is respectable without being compelling, and the bullish-but-flattening MACD suggests momentum is exhausting rather than accelerating. The allocation functions as a portfolio friction piece, a position that accepts low volatility and steady capex support in exchange for avoiding overweight in growth or commodities when the macro environment is transitional. If inflation pressure accelerates sharply (toggling from active to severe) or if risk appetite collapses, this position would provide defensive anchor value; until then, it represents a necessary ballast allocation in a portfolio where Technology and AI consume 40% of capital. The thin participation (0.72x average) is acceptable because infrastructure exposure is not meant to drive returns but to provide stability when rotation occurs.
Precious Metals — GLD
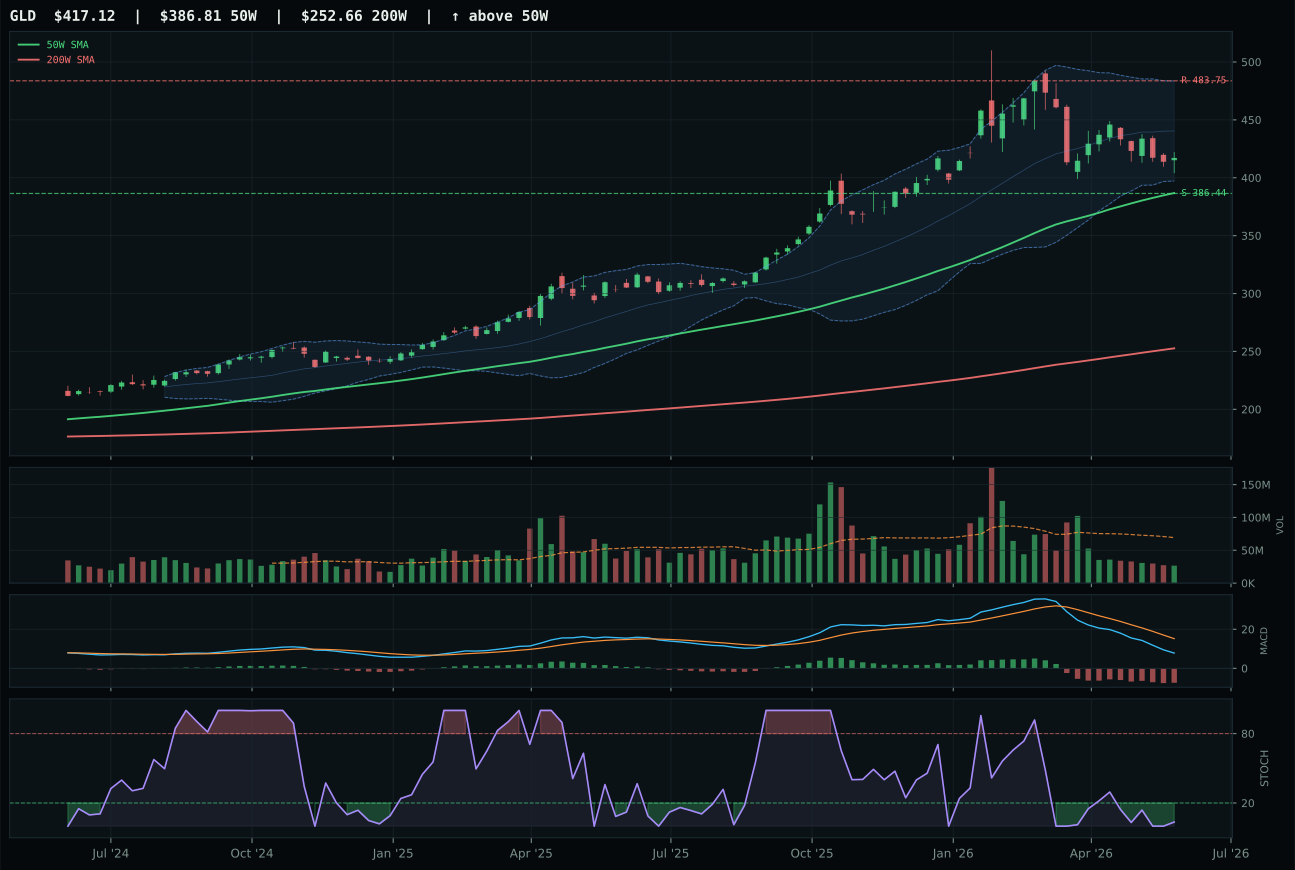
GLD has a neutral structure profile with -24.0% 13-week relative strength versus SPY.
A failed hold above support would weaken the setup.
Actionable but governed by invalidation levels.
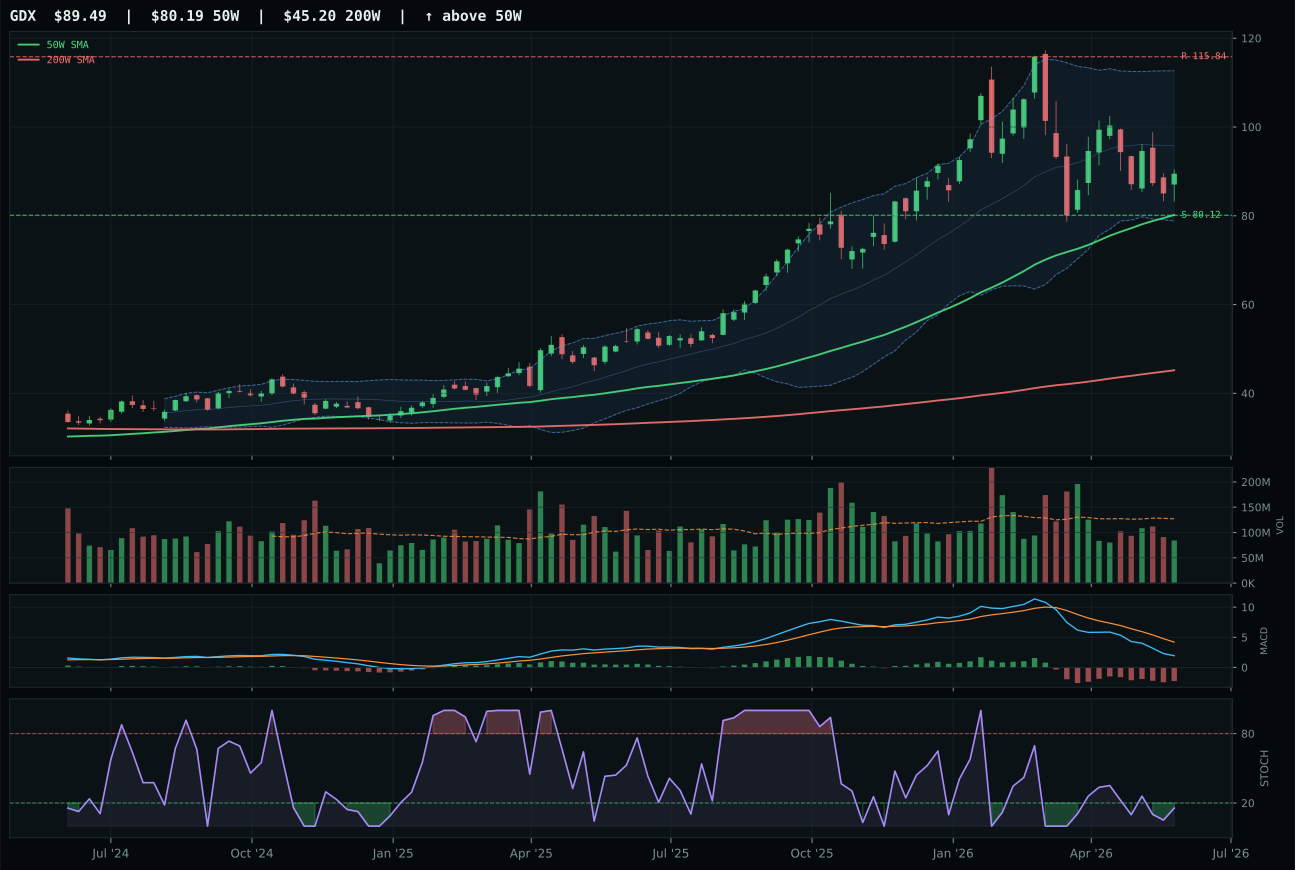
GDX has a neutral structure profile with -33.0% 13-week relative strength versus SPY.
A failed hold above support would weaken the setup.
Actionable but governed by invalidation levels.
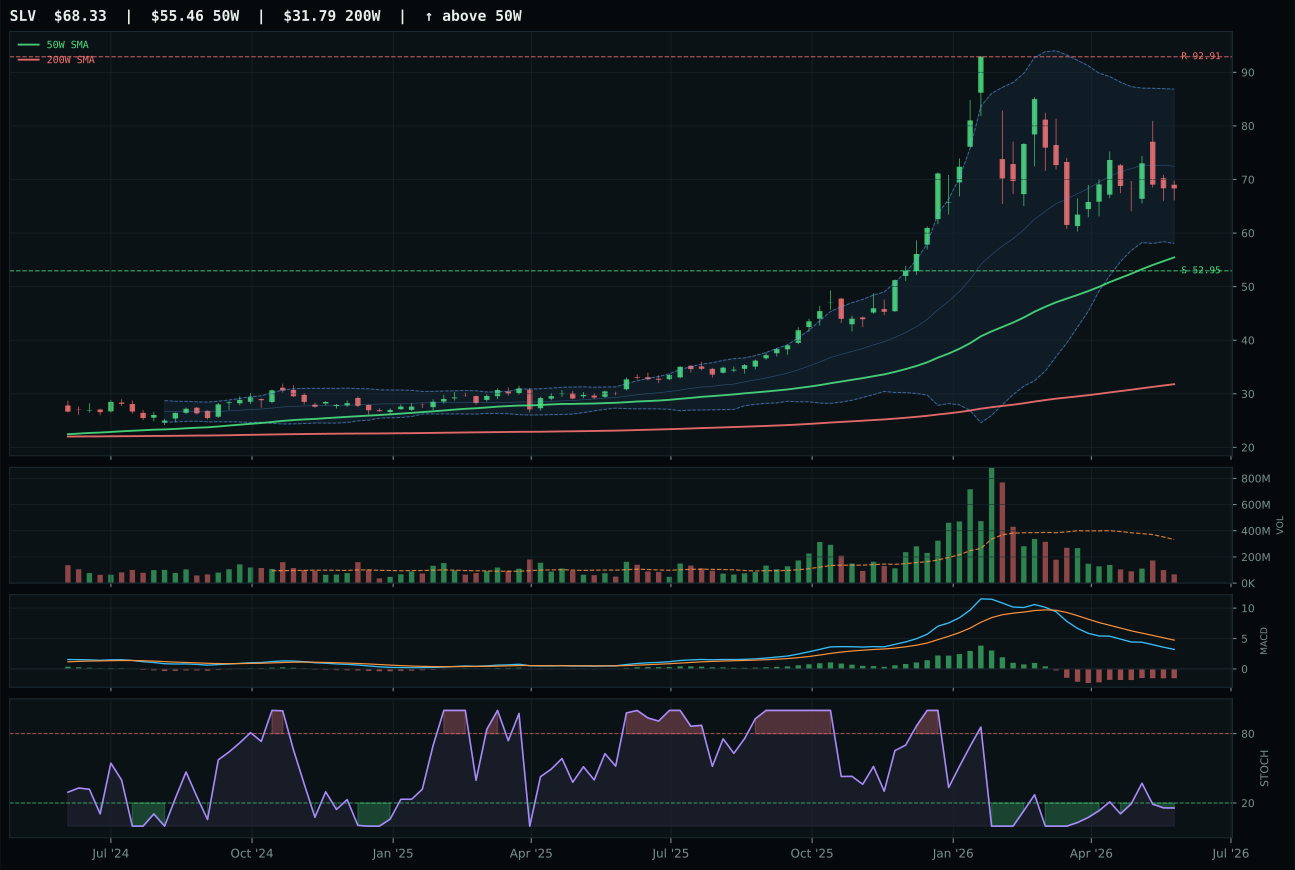
SLV has a vertical extension profile with -29.9% 13-week relative strength versus SPY.
A failed hold above support would weaken the setup.
Actionable but governed by invalidation levels.
GLD wins by the thinnest margin, a 2.9-point gap over GDX that masks deep technical weakness in both candidates. Gold's victory stems from superior risk-reward asymmetry (84.2 versus 73.0) and cleaner structure (67.7 versus 61.1), not from momentum or relative strength—the 13W return is negative 13.8%, RS versus SPY is negative 24.0%, and MACD is bearish/weakening across the board. GDX's negative 33.0% outperformance versus SPY represents active desertion by equity investors, a sign that leveraged exposure to gold mining is being liquidated faster than bullion itself. Both ETFs carry stochastic RSI readings near 0.00, the hallmark of oversold exhaustion, and both sit in the middle retracement zone with minimal participation. GLD's selection reflects that when the entire category is weak, allocators choose the defensive play with the best downside protection (7.9% support proximity) rather than reach for the speculative alternative. The category technical evidence of 32.6 is the lowest in the portfolio, confirming this is a holding by macro conviction, not chart strength.
Precious Metals earns 0% allocation this week because the category score of 35.4 ranks ninth among ten categories, and GLD's technical evidence of only 32.6 cannot be rescued by a macro fit of 46.0. Risk appetite is active and penalizing precious metals with minus four points, offsetting any inflation-pressure upside. The fundamental problem is clear: money is moving away from gold hedges in a Transition/Mixed regime where equities and real assets are preferred to monetary hedges. Volume at 0.38x the twenty-week average shows market indifference, and negative thirteen-week returns confirm capital outflows. GLD's oversold timing (77.0) and strong risk-reward (84.2) create a mean-reversion setup worth watching, but the portfolio has zero tolerance for allocating to mean-reversion trades in deteriorating macro regimes. To re-enter allocation, this category would need credit stress to become severely active and risk appetite to turn negative—a tactical reversal that would likely signal broader portfolio stress. Until then, precious metals remain on the bench. Managers should view this as a structural exclusion driven by regime dynamics, not a timing miss.
Emerging Markets — IEMG
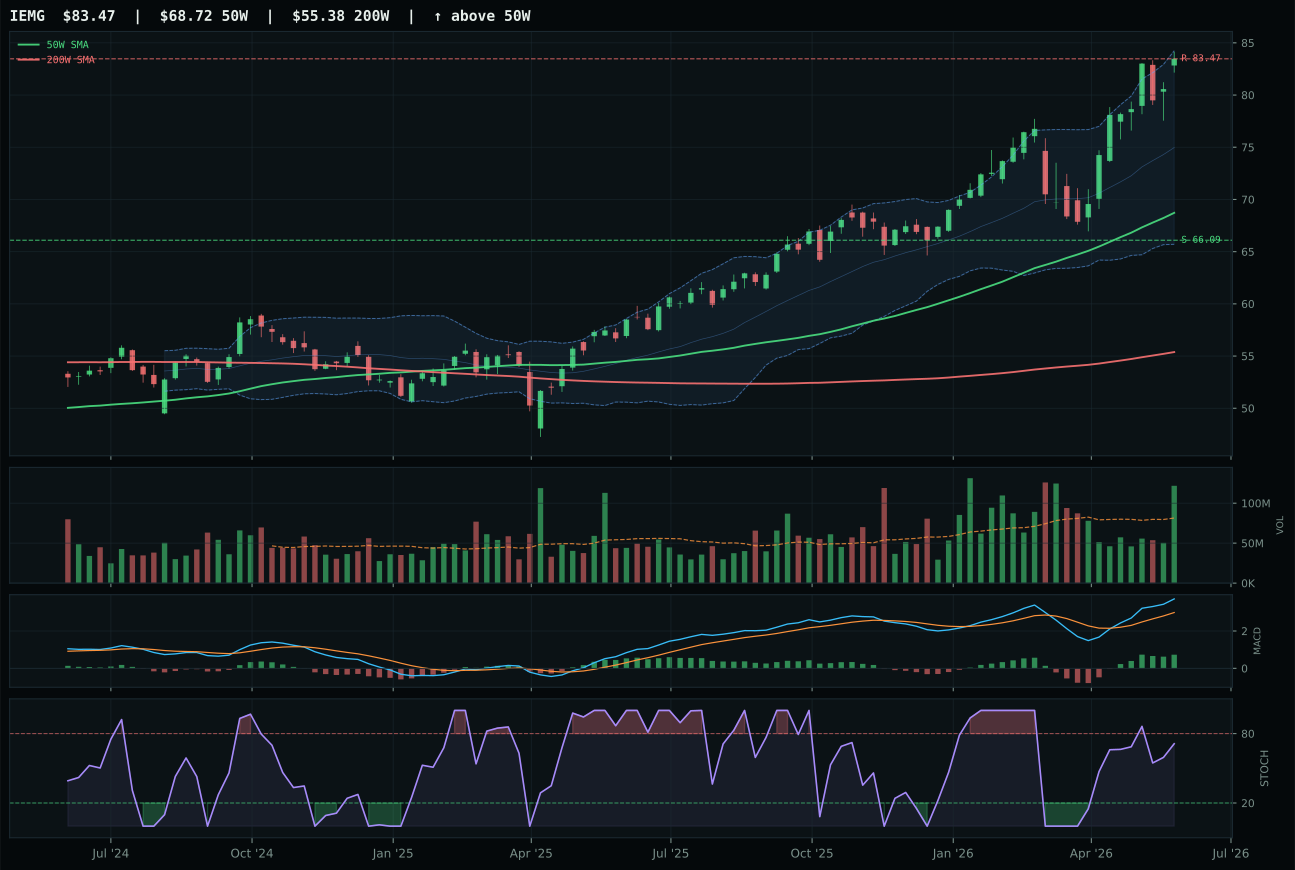
IEMG has a vertical extension profile with -1.5% 13-week relative strength versus SPY.
A failed hold above support would weaken the setup.
Actionable but governed by invalidation levels.
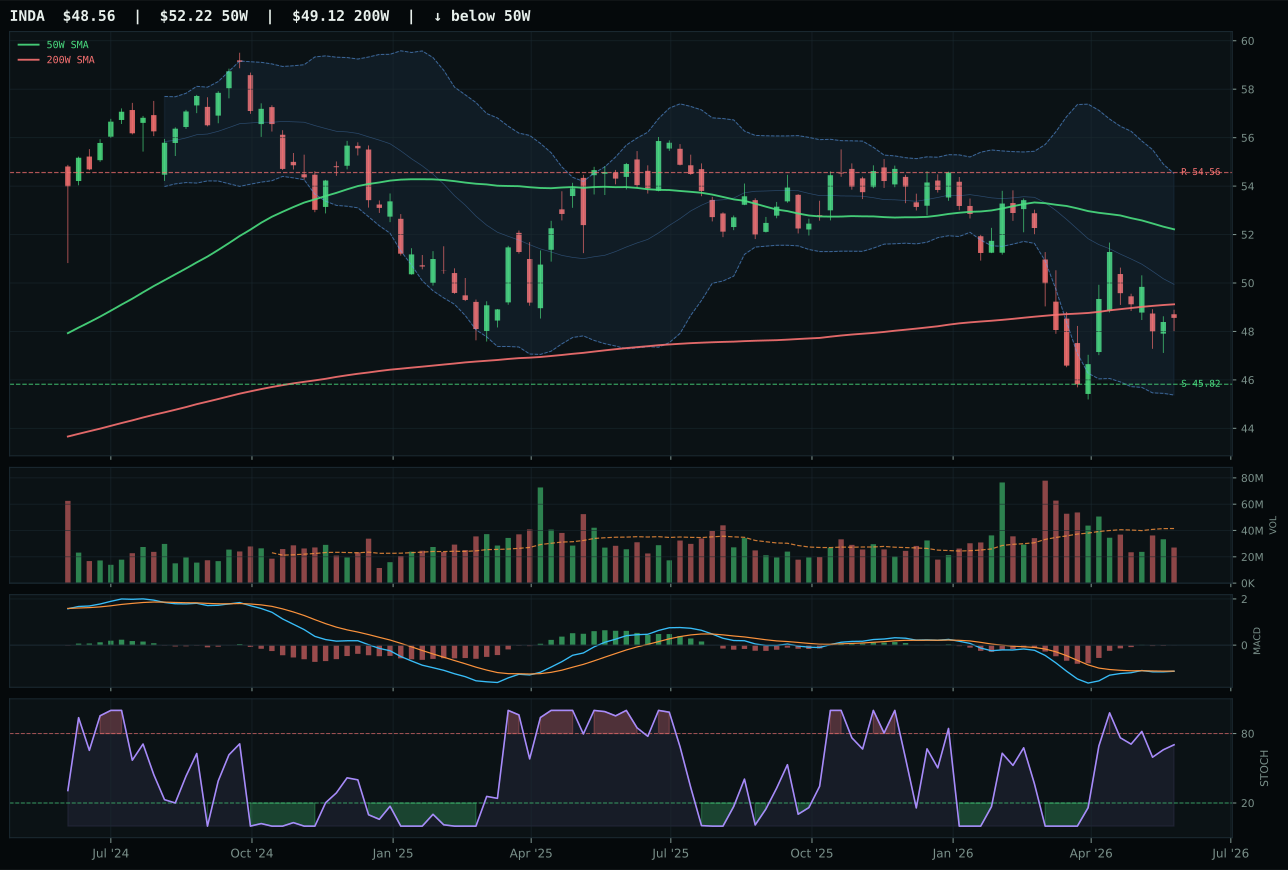
INDA has a neutral structure profile with -17.4% 13-week relative strength versus SPY.
A failed hold above support would weaken the setup.
Actionable but governed by invalidation levels.
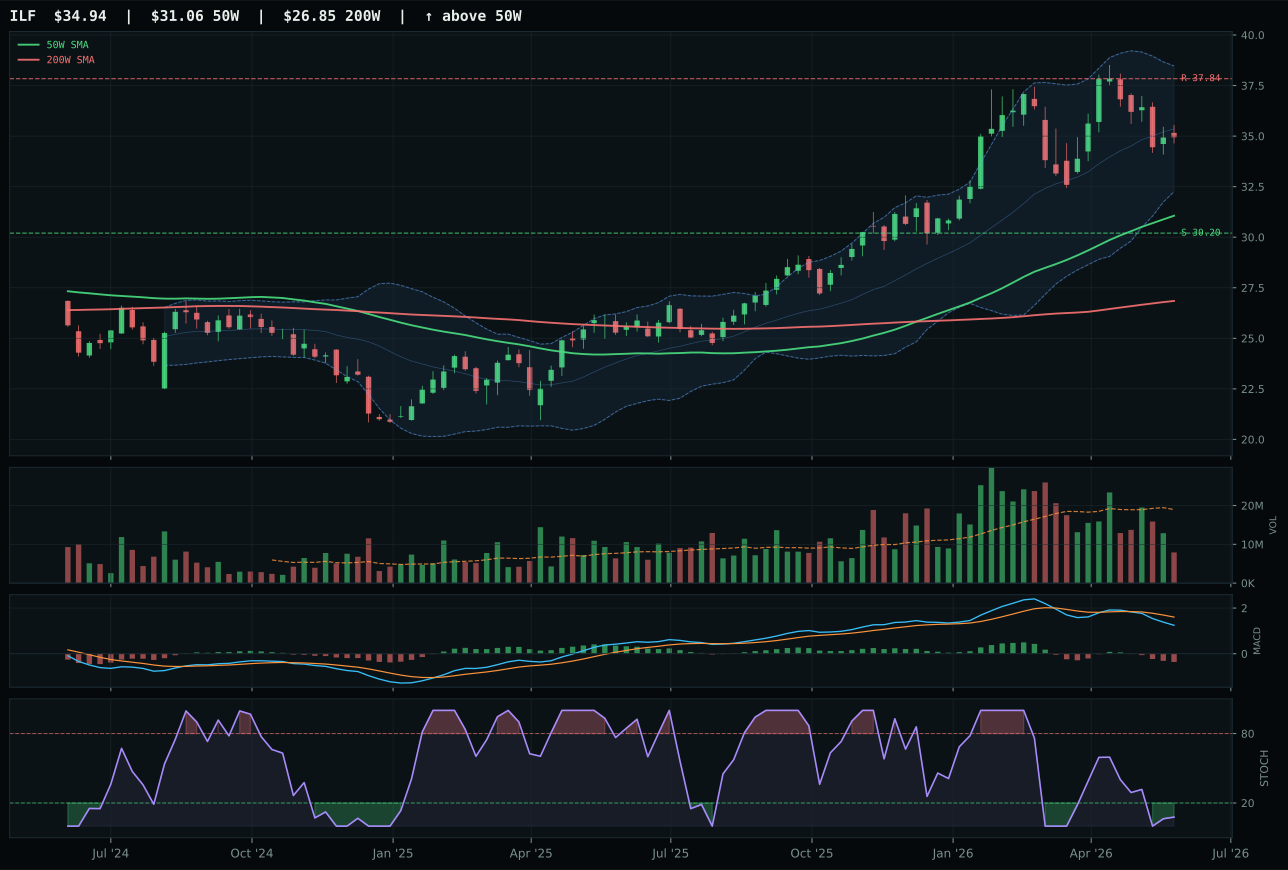
ILF has a neutral structure profile with -14.5% 13-week relative strength versus SPY.
A failed hold above support would weaken the setup.
Actionable but governed by invalidation levels.
IEMG defeats INDA and ILF through superior structure, volume participation, and MACD health that signal institutional buyers are backing the broad emerging-market narrative. The 78.3 structure score is the category best, supported by 1.49x above-average participation—the highest volume signal among all runners-up across every category—and MACD bullish and improving, a configuration that INDA (bearish but improving) and ILF (bearish/weakening) cannot match. IEMG's 97.7 trend score reflects price above both the 50W and 200W with a 0.7% slope, while the 13.0% category-relative strength advantage over INDA's negative 2.9% demonstrates clear investor preference for broad-based exposure over India-specific positioning. Volume participation at 1.49x average is the second-highest in the entire portfolio portfolio, indicating that if emerging markets find technical footing, IEMG will benefit from real money rotation. The 8.7% 13W return and bullish MACD improvement tell a coherent story of stabilization after weakness, positioning IEMG as the entry vehicle for allocators building emerging-market hedges or tactical risk exposure.
Emerging Markets earns 0% allocation this week because the category score of 29.8 ranks tenth and last, despite IEMG's strong technical leadership within its three-ETF basket. The macro fit is only 48.0 because risk appetite is active at plus eight but credit stress is active at minus ten, creating a net headwind. IEMG's trend score of 97.7 and above-average volume at 1.49x are genuine strengths, yet the category-level reasoning layer cannot justify allocation when nine other categories rank higher on the combined technical and macro scorecard. The category problem is structural: emerging markets are underperforming in a risk-appetite-positive environment where developed markets and real assets dominate. IEMG's 21.5% extension from the fifty-week also raises entry-risk concerns even though the volume is there. To earn allocation, emerging markets would need either (1) credit stress to become severely active (flipping the macro regime), or (2) a sustained pattern of relative-strength outperformance versus developed markets. Until one of those changes materializes, this category remains on the bench. Managers should not view IEMG's technical strength as a reason to force an allocation; instead, recognize it as an attractive setup for entry if macro conditions shift.