
2026-05-22
Informational purposes only. The content in this report, including allocations, analysis, and commentary, is provided solely for informational and educational purposes. It does not constitute financial advice, investment advice, trading advice, or any other type of advice. Past performance does not guarantee future results. Always conduct your own research and consult a qualified financial professional before making investment decisions.
Weekly Allocation
| Ticker | Category | Weight | Role |
|---|---|---|---|
| AIQ | AI | 20% | Top-2 (20%) |
| CIBR | Technology | 20% | Top-2 (20%) |
| XLE | Traditional Energy | 10% | Tier-2 (10%) |
| ROKT | Defense & Aerospace | 10% | Tier-2 (10%) |
| WEAT | Agriculture & Livestock | 10% | Tier-2 (10%) |
| PICK | Industrial Metals | 10% | Tier-2 (10%) |
| IGF | Utilities & Infrastructure | 10% | Tier-2 (10%) |
| IEMG | Emerging Markets | 10% | Tier-2 (10%) |
Trade Instructions — Monday Open
Sell the tranche from 2026-04-24 (completing its 4-week hold). Buy the new tranche. Instructions show net portfolio changes — same-asset positions cancel, weight changes show the delta.
| Action | Ticker | Instruction |
|---|---|---|
| SELL | XLE | Sell 14% of XLE position (reduce 17.50% → 15.00%) |
| SELL | SMH | Sell 25% of SMH position (reduce 20.00% → 15.00%) |
| SELL | PAVE | Sell 25% of PAVE position (reduce 10.00% → 7.50%) |
| SELL | MOO | Sell entire MOO position (2.50% of portfolio) |
| SELL | COPX | Sell entire COPX position (2.50% of portfolio) |
| SELL | URA | Sell 25% of URA position (reduce 10.00% → 7.50%) |
| SELL | XLK | Sell 50% of XLK position (reduce 5.00% → 2.50%) |
| BUY | WEAT | Buy WEAT — 12.50% of freed cash (adds 2.50% to portfolio) |
| BUY | CIBR | Buy CIBR — 25.00% of freed cash (adds 5.00% to portfolio) |
| BUY | ROKT | Buy ROKT — 12.50% of freed cash (adds 2.50% to portfolio) |
| BUY | PICK | Buy PICK — 12.50% of freed cash (adds 2.50% to portfolio) |
| BUY | AIQ | Buy AIQ — 25.00% of freed cash (adds 5.00% to portfolio) |
| BUY | IGF | Buy IGF — 12.50% of freed cash (adds 2.50% to portfolio) |
Current Portfolio After Trade
Combined holdings across all 4 active tranches. Each tranche is 25% of the portfolio.
| Ticker | % of Portfolio | Weight Bar |
|---|---|---|
| SMH | 15.00% | |
| XLE | 15.00% | |
| WEAT | 10.00% | |
| CIBR | 10.00% | |
| PAVE | 7.50% | |
| URA | 7.50% | |
| REMX | 7.50% | |
| ROKT | 7.50% | |
| IEMG | 5.00% | |
| PICK | 5.00% | |
| AIQ | 5.00% | |
| XLK | 2.50% | |
| IGF | 2.50% |
Macro Regime — Transition / Mixed
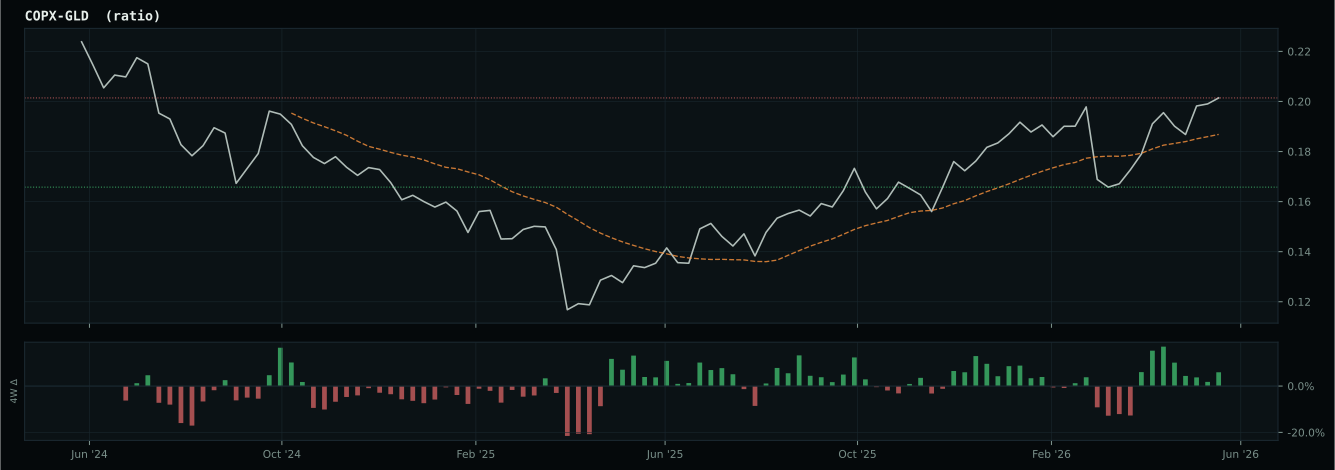
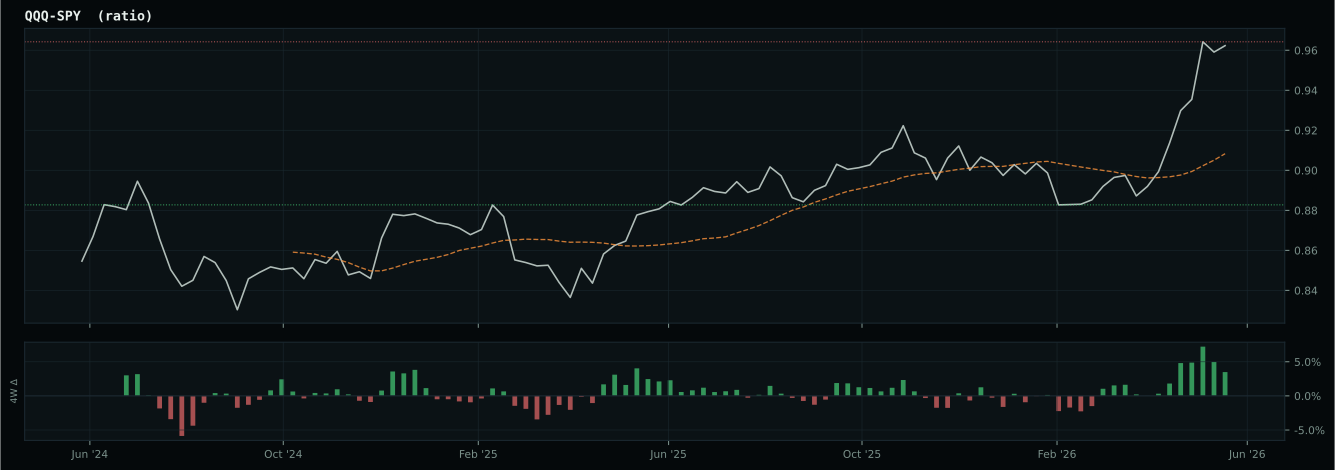
Macro Evidence Charts
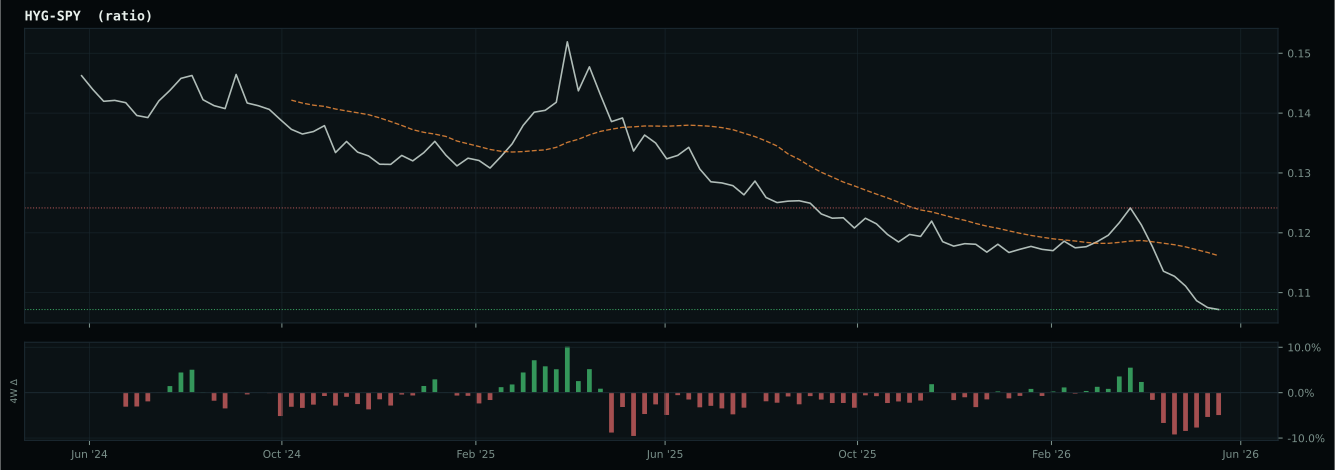
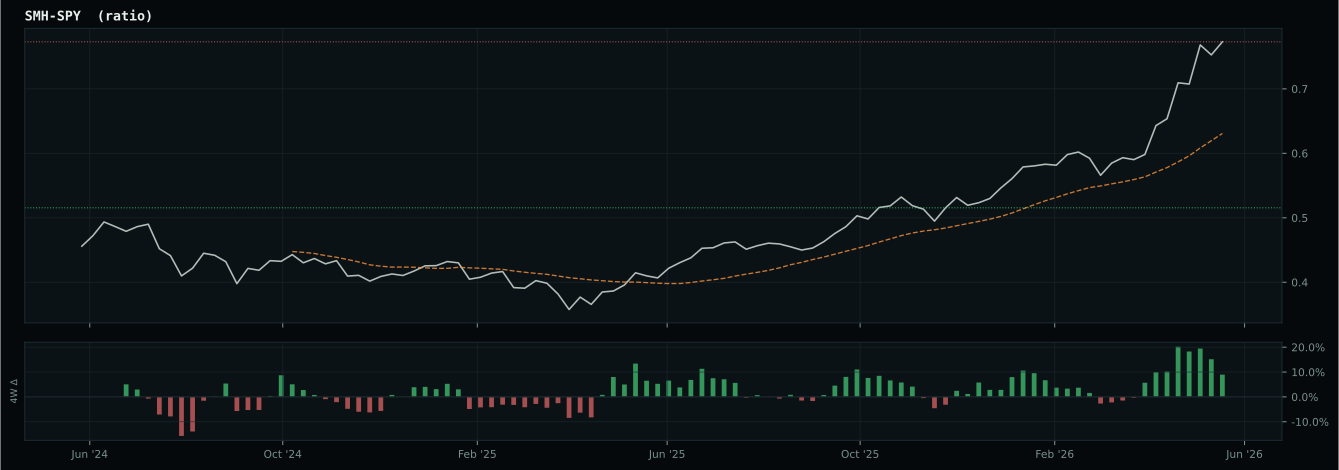
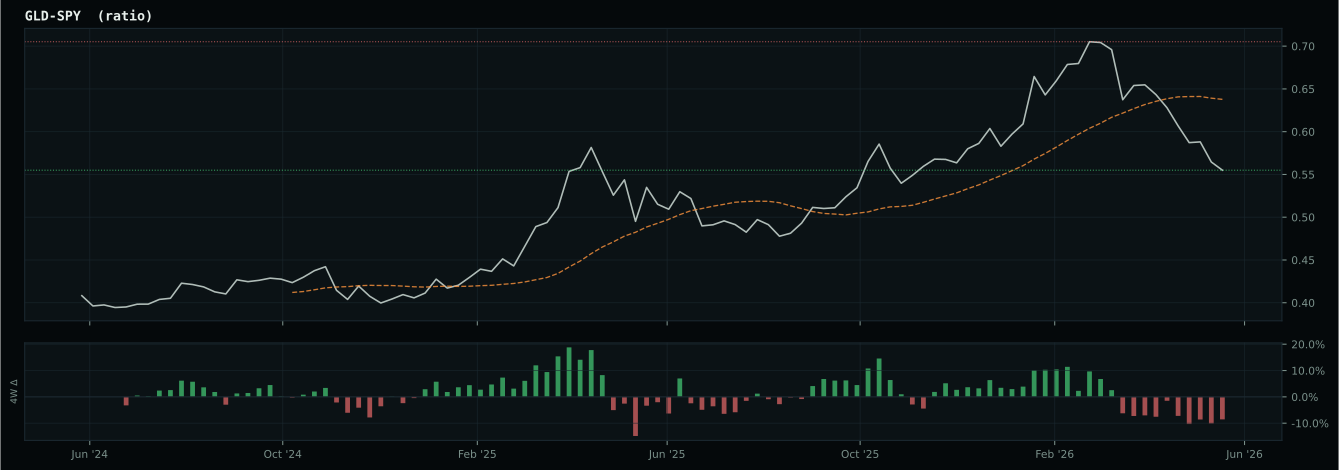
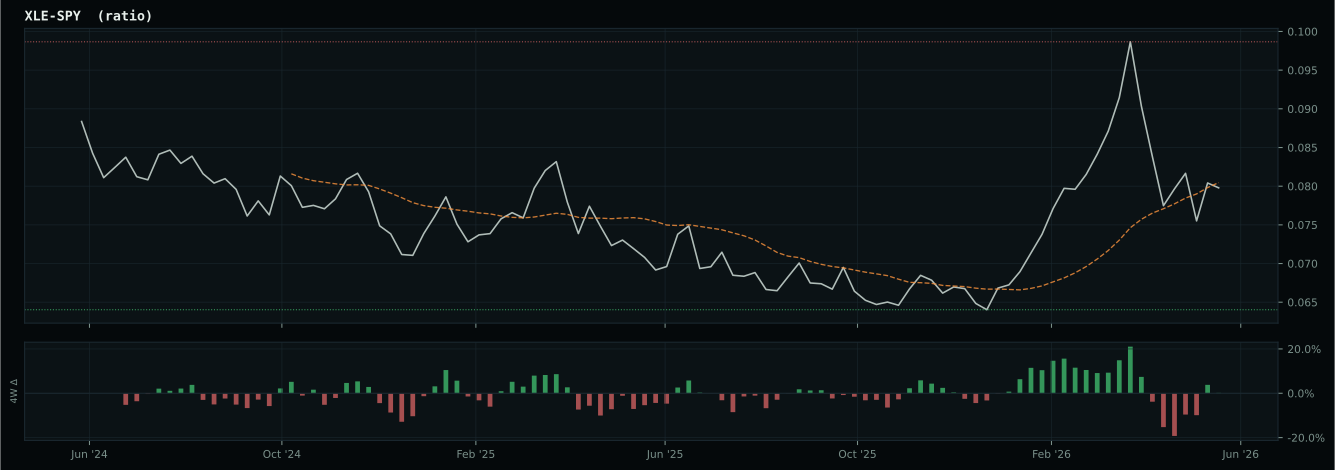
Market-implied signals behind the macro regime scores. Each ratio compares two assets; the direction and slope of the ratio is what the macro engine reads.
Crypto Regime — NoCrypto
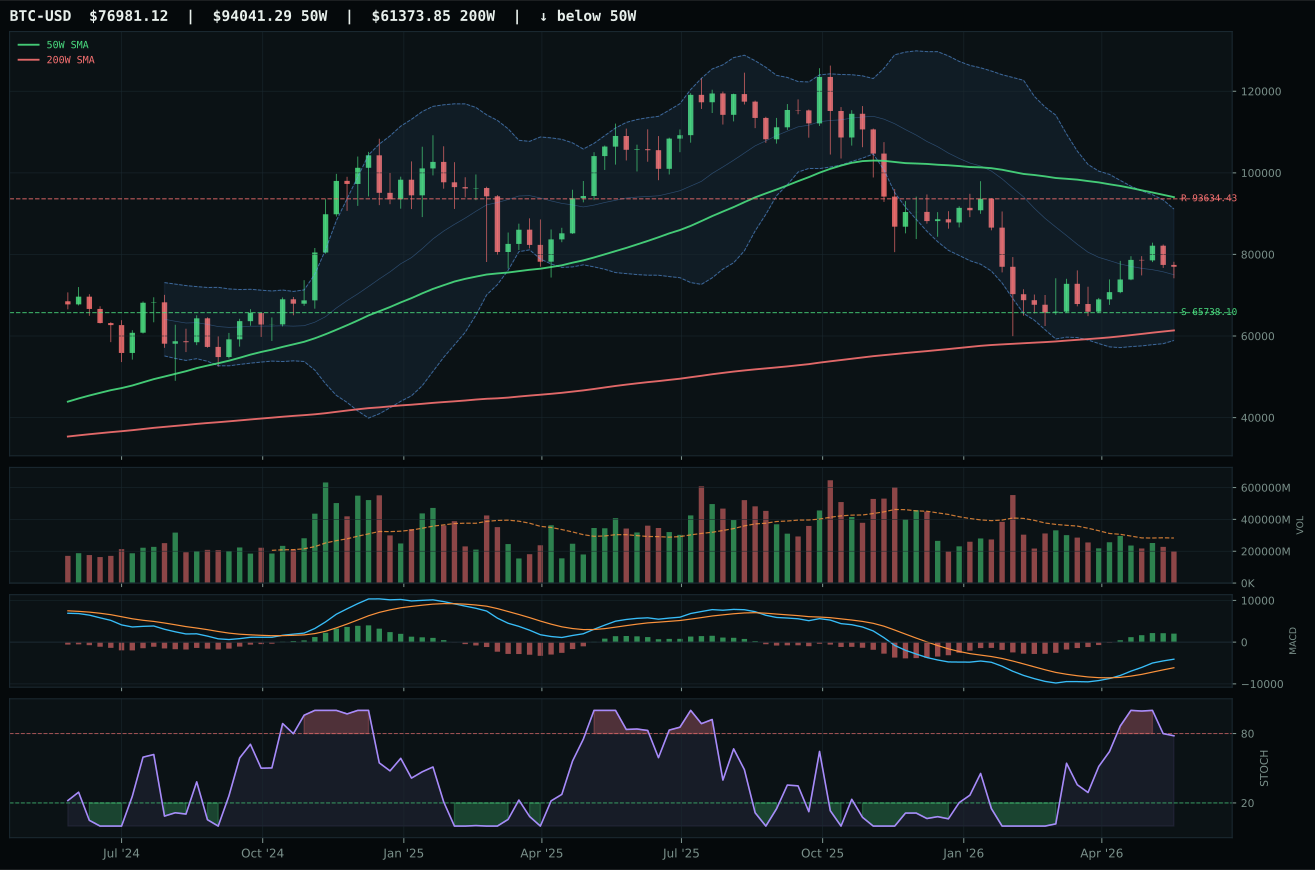
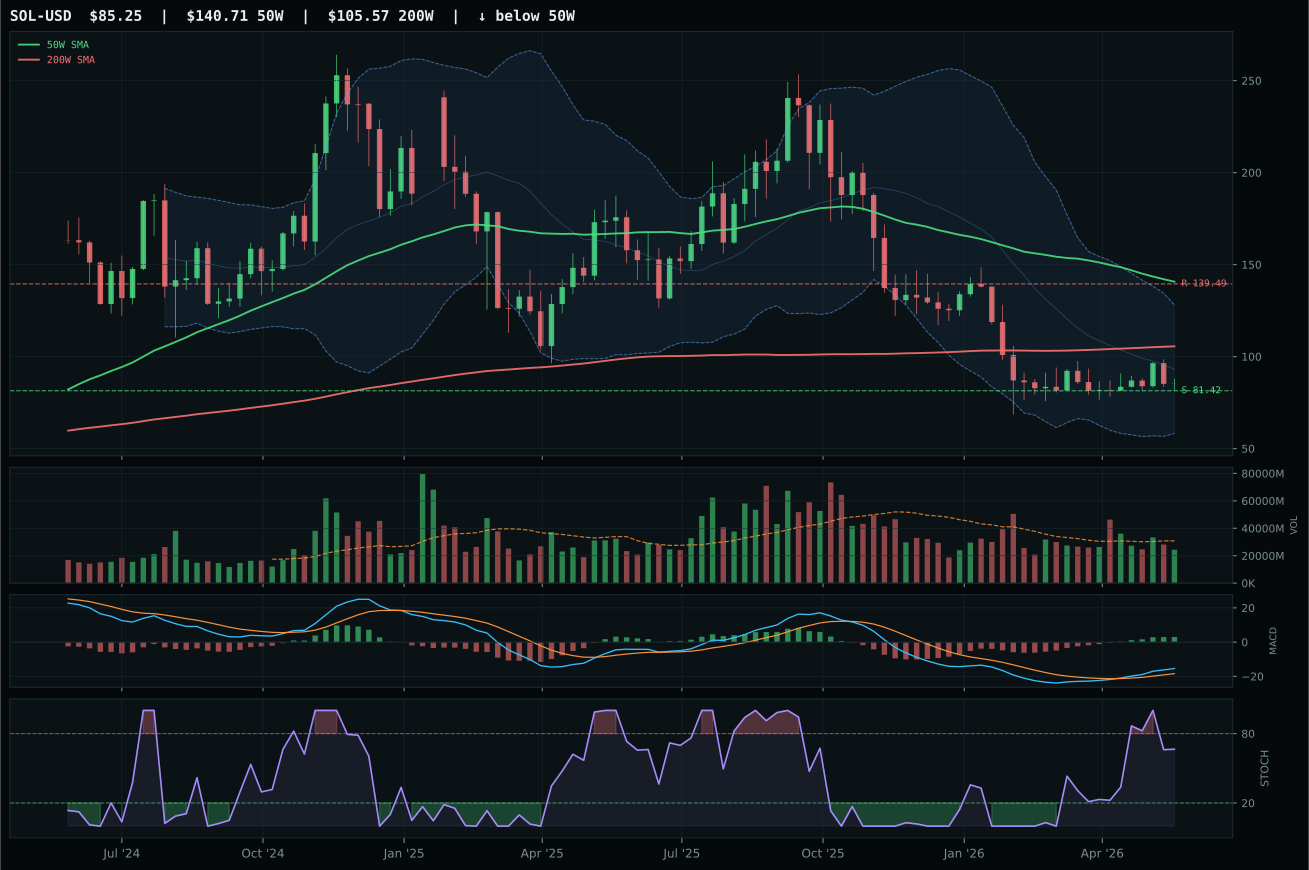
ValueBTC armed; waiting for 50W reclaim, decisive close above post-touch range resistance by 3%, breakout volume above 20W average
TrendBTC not confirmed
one or more available conditions failed
Category Rankings
| Rank | Category | Winner | Score | Alloc | 4W Ret | Peers (4W) |
|---|---|---|---|---|---|---|
| 1 | AI | AIQ | 69.5 | 20% | +4.75% | SMH +13.3% · BOTZ -6.1% |
| 2 | Technology | CIBR | 64.4 | 20% | -0.20% | XLK +5.3% · IGV -6.2% |
| 3 | Traditional Energy | XLE | 58.0 | 10% | -9.07% | XOP -9.6% · FCG -9.4% |
| 4 | Defense & Aerospace | ROKT | 51.0 | 10% | -10.53% | XAR +2.3% · ITA +4.7% |
| 5 | Agriculture & Livestock | WEAT | 50.9 | 10% | -6.56% | MOO -4.2% · VEGI -2.2% |
| 6 | Industrial Metals | PICK | 47.6 | 10% | -3.47% | COPX -1.9% · REMX -0.5% |
| 7 | Utilities & Infrastructure | IGF | 42.4 | 10% | -2.12% | PAVE +5.4% · XLU -2.4% |
| 8 | Emerging Markets | IEMG | 40.9 | 10% | +4.06% | INDA +2.0% · ILF -2.9% |
| 9 | Nuclear Energy | NLR | 38.7 | 0% | -5.20% | URA -6.7% · URNM -4.4% |
| 10 | Precious Metals | GLD | 35.6 | 0% | -7.45% | SLV -12.9% · GDX -7.6% |
AI — AIQ
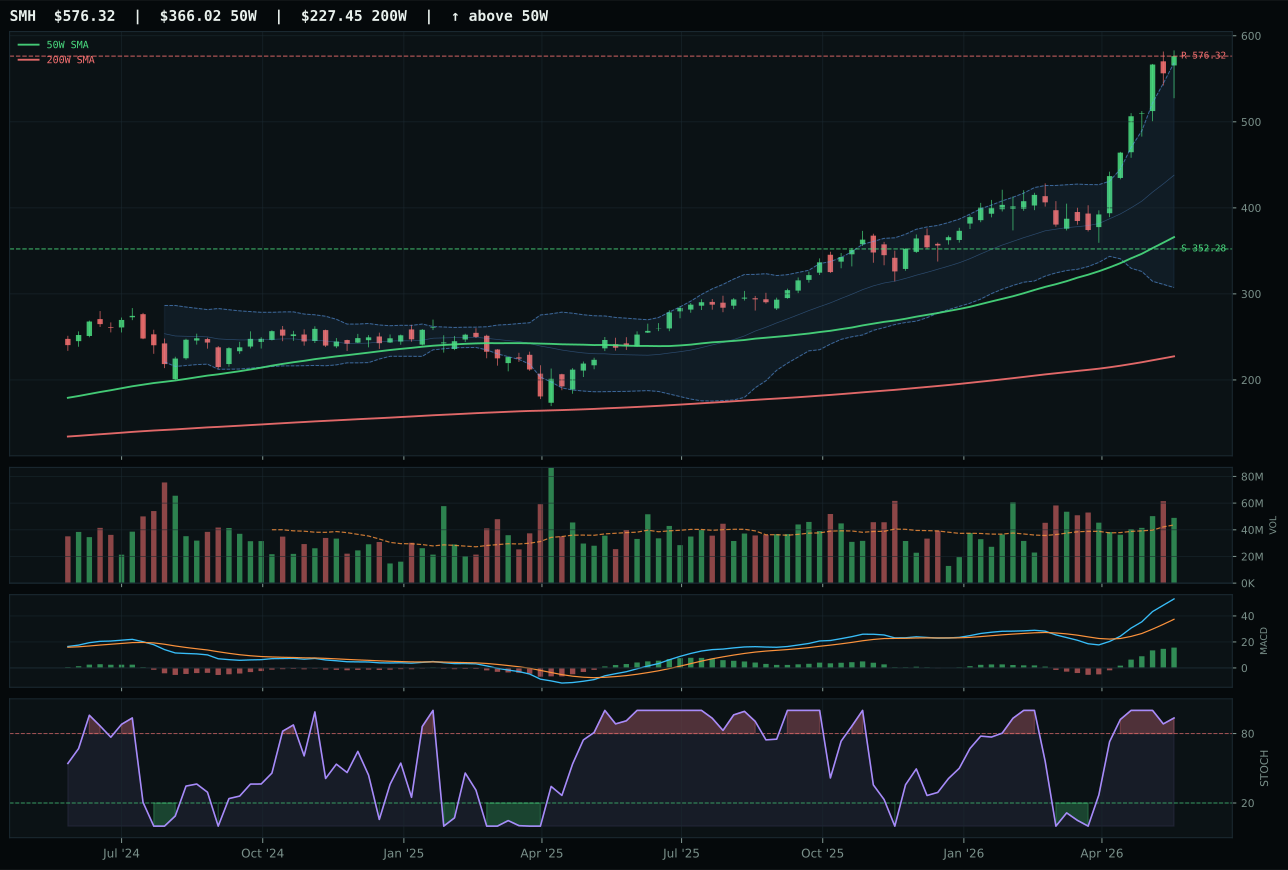
SMH has a vertical extension profile with 30.7% 13-week relative strength versus SPY.
A failed hold above support would weaken the setup.
Actionable but governed by invalidation levels.
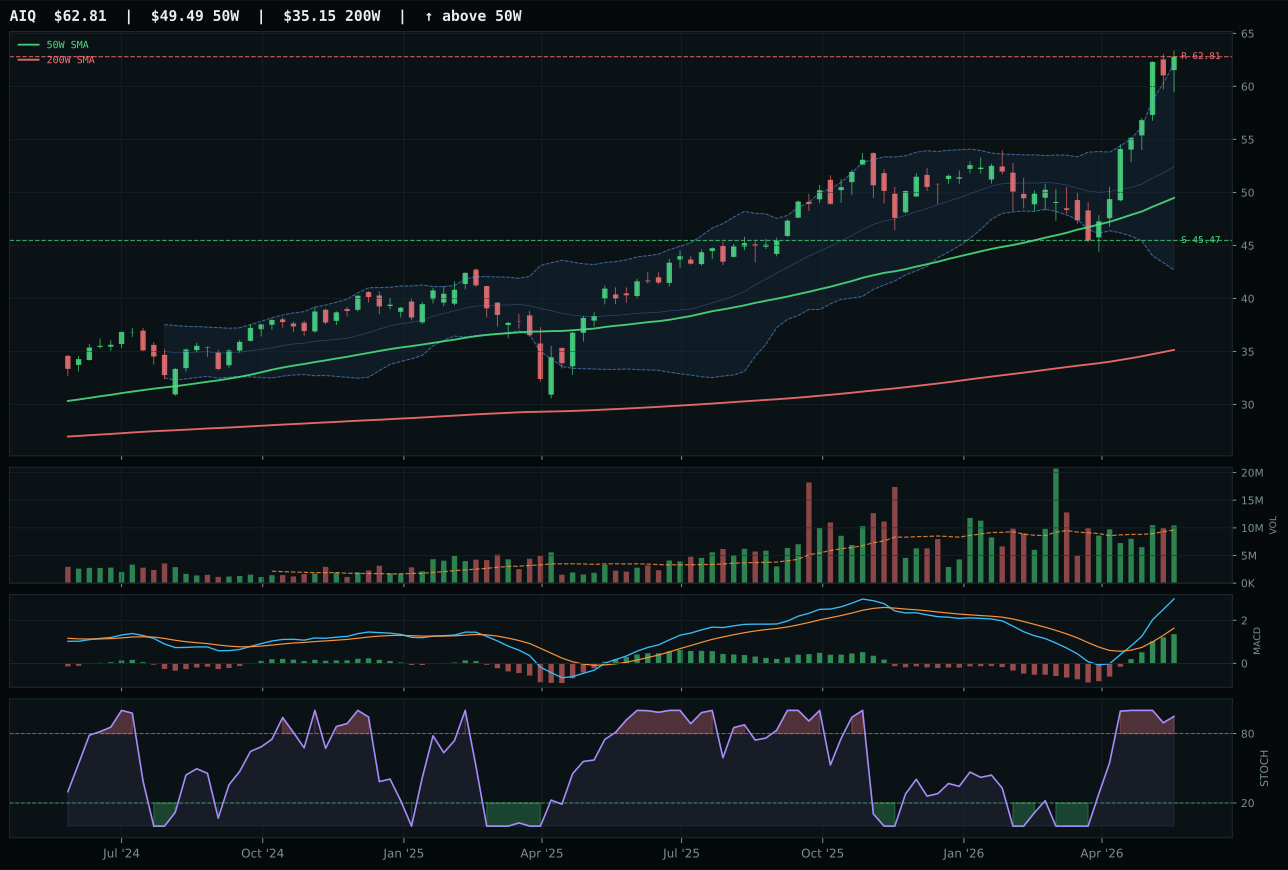
AIQ has a vertical extension profile with 17.8% 13-week relative strength versus SPY.
A failed hold above support would weaken the setup.
Actionable but governed by invalidation levels.
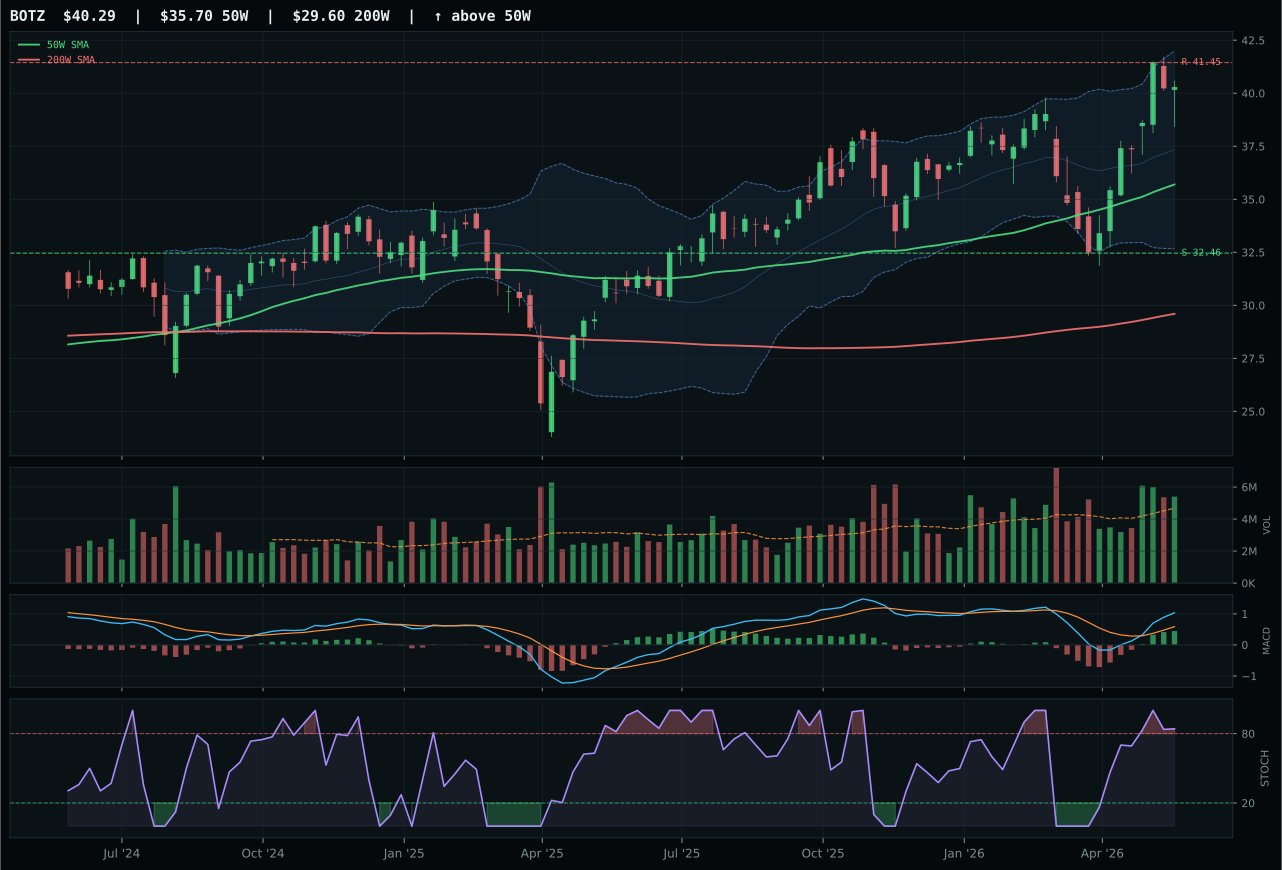
BOTZ has a neutral structure profile with -4.9% 13-week relative strength versus SPY.
A failed hold above support would weaken the setup.
Actionable but governed by invalidation levels.
AIQ claimed the category despite losing on raw technical evidence (56.1 versus SMH's 75.5) because macro fit tilts decisively in its favor at 62.0 versus 68.0, and the system's 62/38 tech-to-macro weighting places category allocation above pure momentum chase. SMH's 30.7% thirteen-week SPY-relative return and 57.5% extension above its 50-week moving average signal that semiconductor compute leadership has run too far too fast; AIQ's softer 17.8% relative strength and 26.9% extension position it as the more conservative AI exposure. Both setups are vertical, both have bullish MACD and overbought stochastic RSI rolling over, but AIQ's volume-price confirmation at 65.2 and persistence at 77.2 indicate steadier accumulation rather than SMH's above-average participation spike, which can signal distribution. The score gap of only 0.5 points reflects how close this decision is and how much the macro tilt—particularly AI growth sponsorship (+10 for AIQ versus +14 for SMH, offset by credit stress bias)—drives the final call.
AI earns 20% allocation as the joint top-2 category with a 69.5 score that ranks among the highest, driven by overwhelming macro support for AI growth sponsorship (+14 unweighted) and risk appetite positivity (+10). The technical evidence is weaker than it appears on the surface: AIQ's 56.1 technical score is well below SMH's 75.5, yet macro fit (62.0 vs 68.0) and the system's assignment of 38% weight to narrative nearly offset that gap. Transition/Mixed regime conditions favor real assets and inflation hedges over pure technology, yet AI remains exempted from that bias due to its supply-side productivity benefits. The timing penalty is real: overbought momentum at 0.95 stochastic RSI and price 26.9% extended above the 50-week mean suggest limited room to the upside before exhaustion. Allocation to 20% reflects confidence that AI growth sponsorship will persist even if the broader macro rotates, but a shift toward credit stress dominance or risk-off conditions could collapse this category's rank quickly.
Technology — CIBR
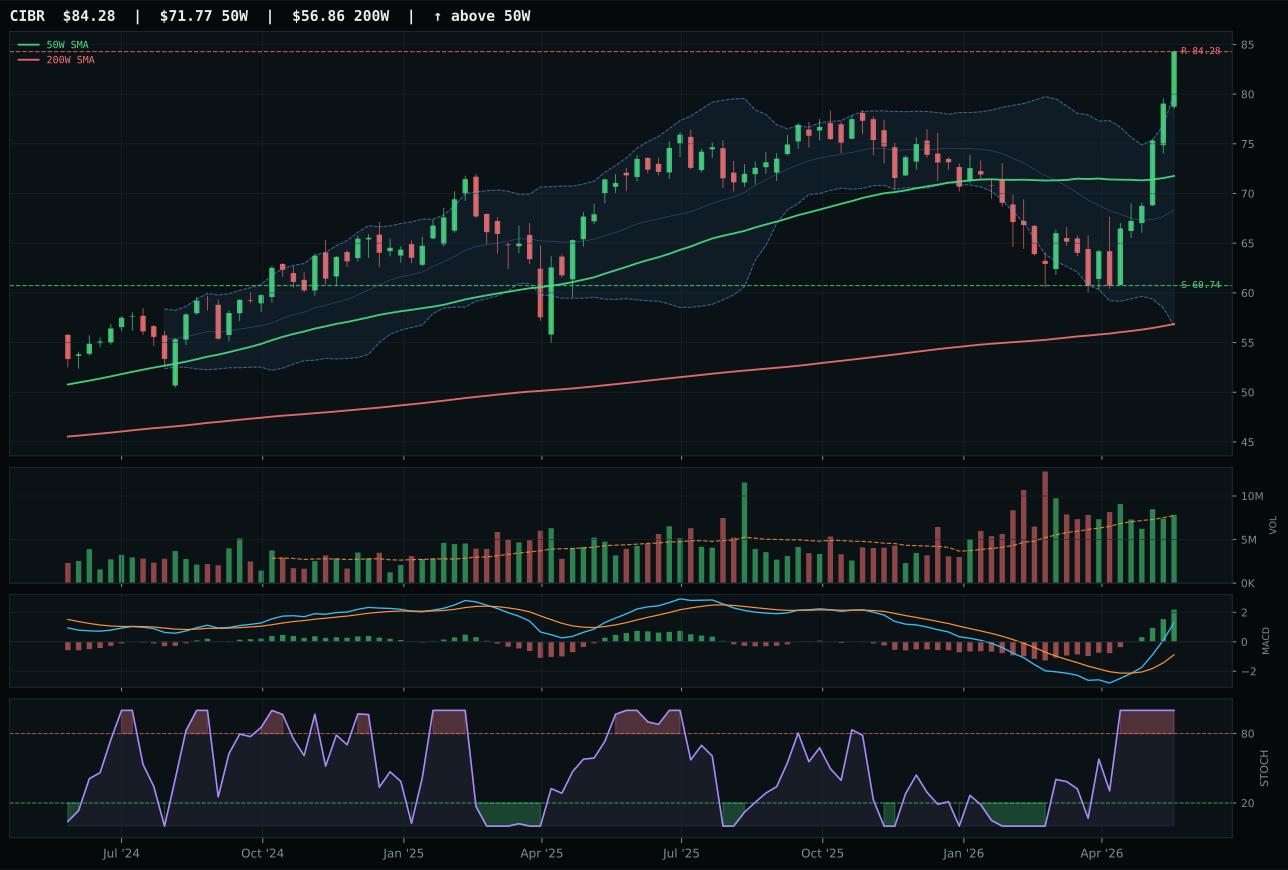
CIBR has a vertical extension profile with 23.7% 13-week relative strength versus SPY.
A failed hold above support would weaken the setup.
Actionable but governed by invalidation levels.
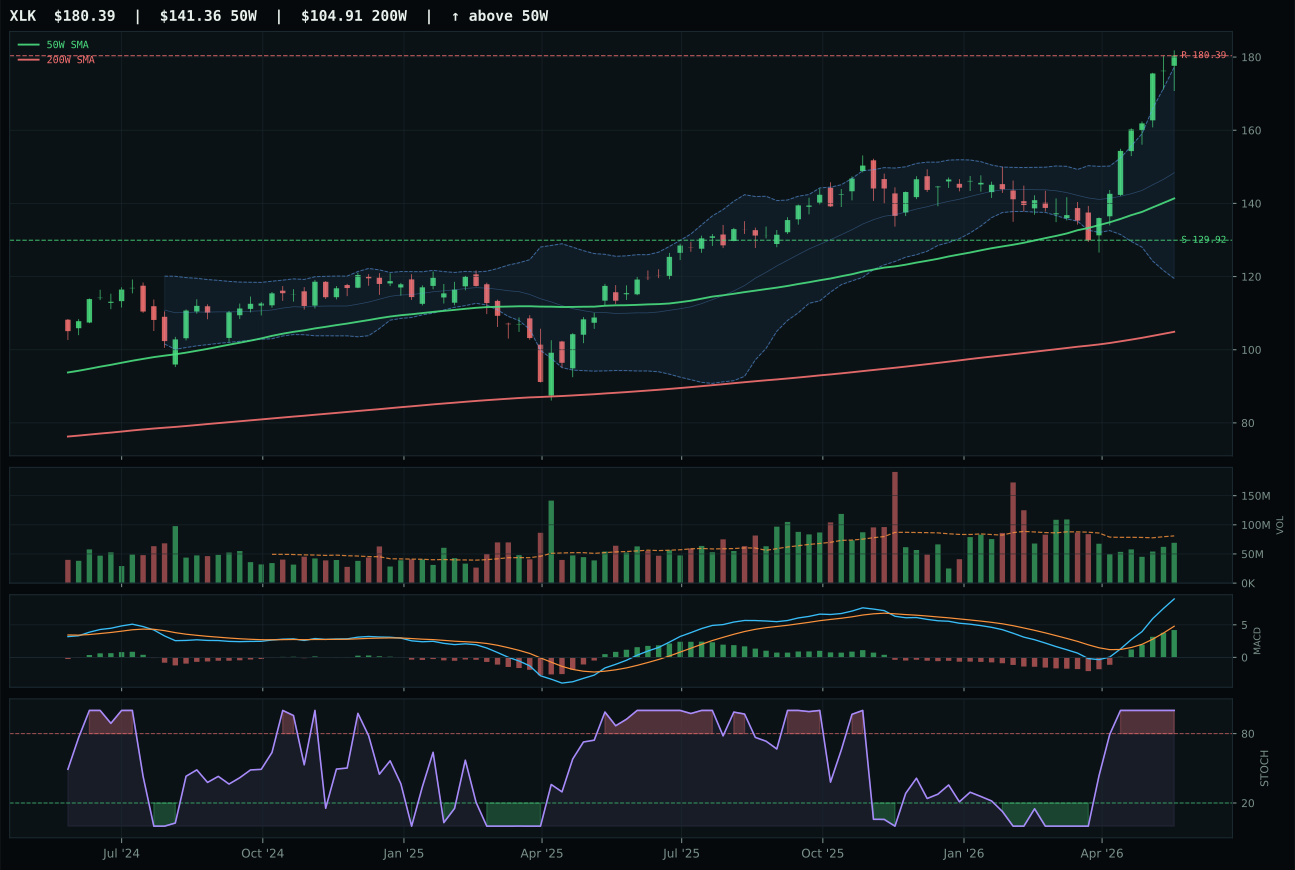
XLK has a vertical extension profile with 19.9% 13-week relative strength versus SPY.
A failed hold above support would weaken the setup.
Actionable but governed by invalidation levels.
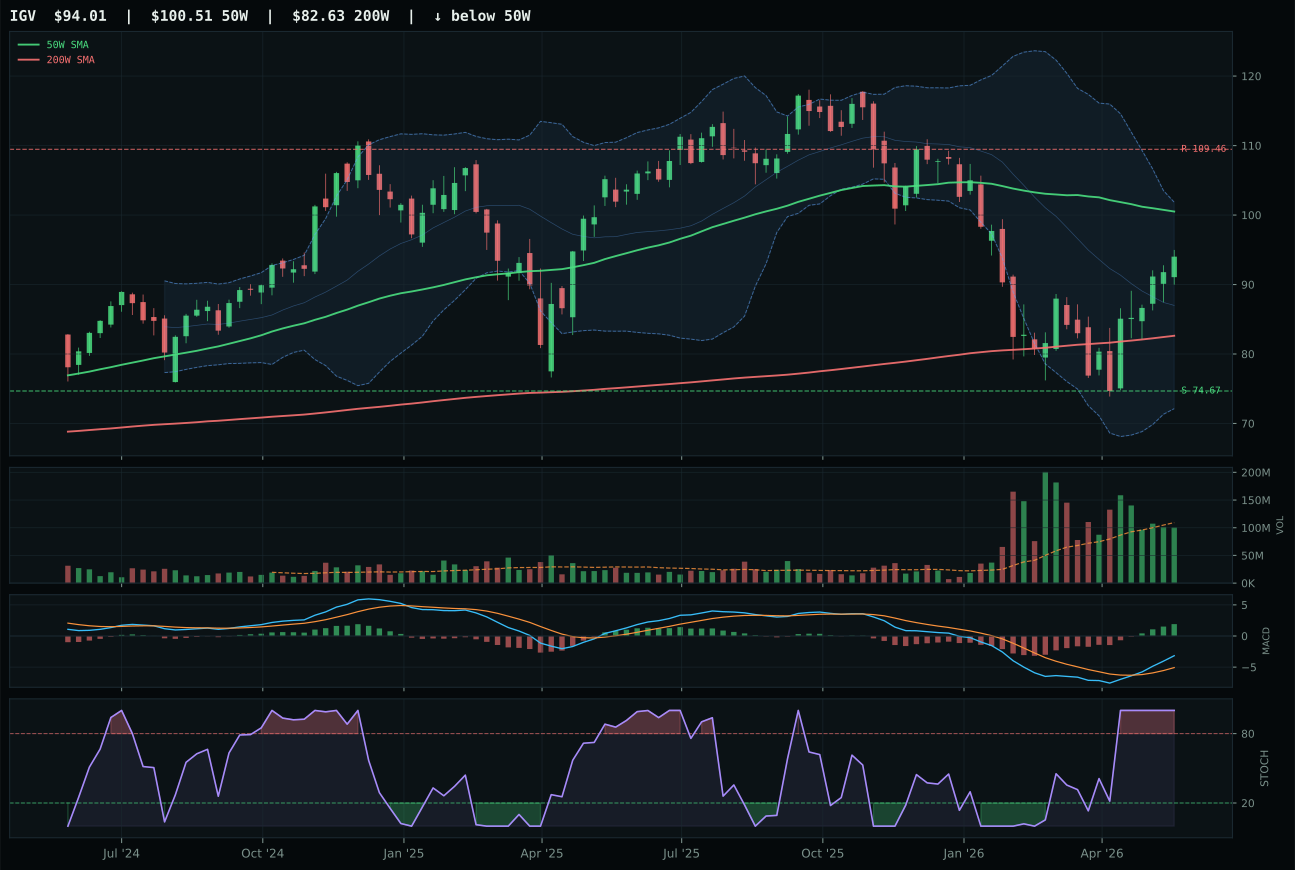
IGV has a neutral structure profile with 8.2% 13-week relative strength versus SPY.
A failed hold above support would weaken the setup.
Actionable but governed by invalidation levels.
CIBR wins decisively on the strength of 23.7% relative outperformance versus SPY and 3.8% category-relative advantage, driven by a clean bullish MACD and improving momentum structure. The 31.9% thirteen-week return confirms real accumulation rather than a mere bounce, and the neutral 1.01x volume confirms the move is being digested rather than rejected. XLK's 6.9-point deficit stems from inferior category positioning (0.0% relative strength) despite identical trend and timing scores, meaning CIBR has genuine institutional sponsorship inside cybersecurity while XLK remains a broader tech expression without the same conviction. The setup is vertical extension—stretched at 17.4% above the 50-week moving average—which penalizes entry timing but confirms that new capital continues to arrive even at elevated prices, a hallmark of genuine supply absorption.
Technology earned its 20% top-2 allocation because the category's 64.4 score reflects a 62% technical weighting that overwhelms the tepid 54.0% macro fit. Credit stress headwinds and inflation pressure are active, yet risk appetite and AI growth sponsorship more than compensate, keeping the macro contribution positive. The setup trades duration for conviction: CIBR's overbought stochastic RSI and 17.4% extension above its 50-week mean that every new buyer is overpaying relative to the prior week's entrants, but volume-price confirmation at 76.0 and persistence at 89.3 say the pain is worthwhile because the move is structural. If macro conditions worsen or credit stress deepens further, this category could lose its top-2 claim quickly; the allocation rests entirely on the assumption that risk appetite remains the dominant regime weight.
Traditional Energy — XLE
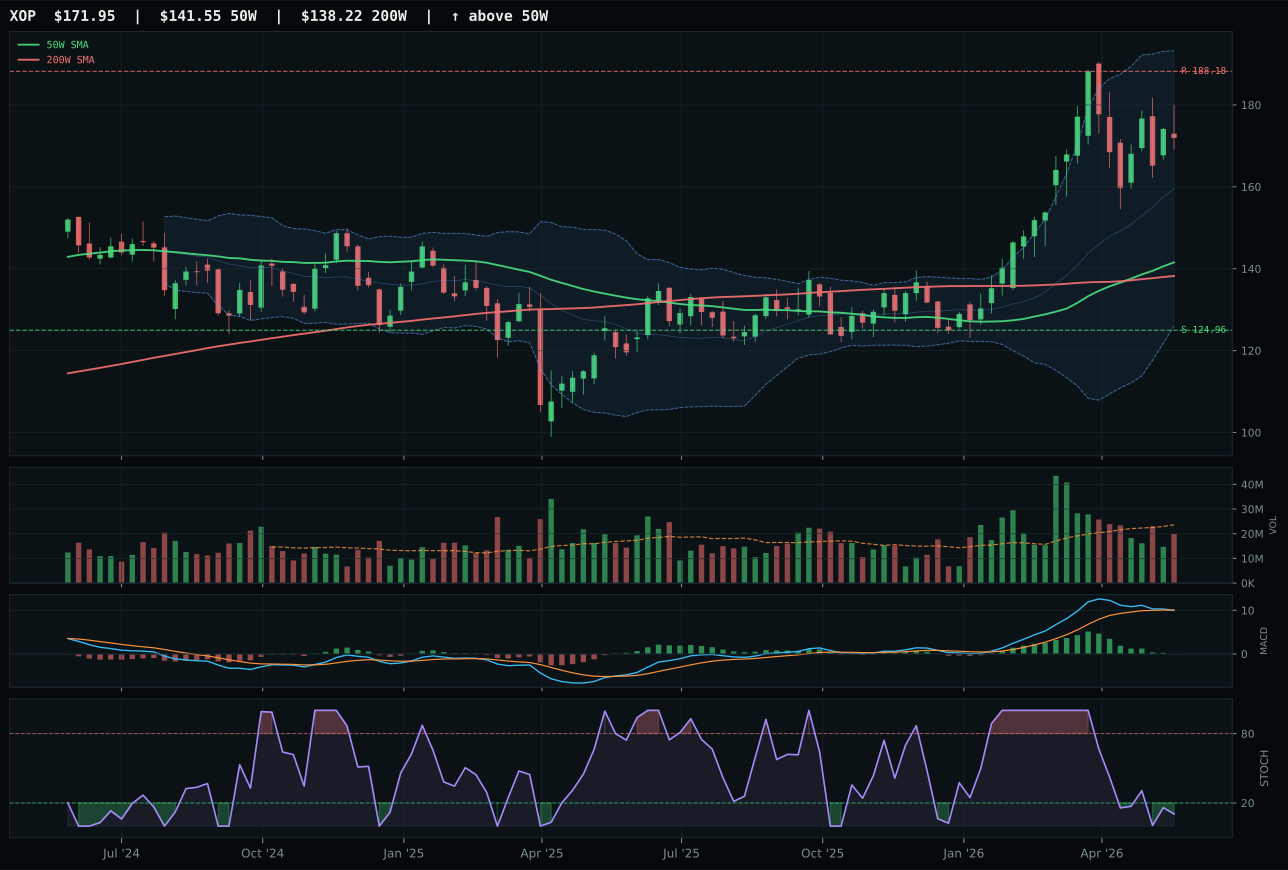
XOP has a vertical extension profile with 5.1% 13-week relative strength versus SPY.
A failed hold above support would weaken the setup.
Actionable but governed by invalidation levels.
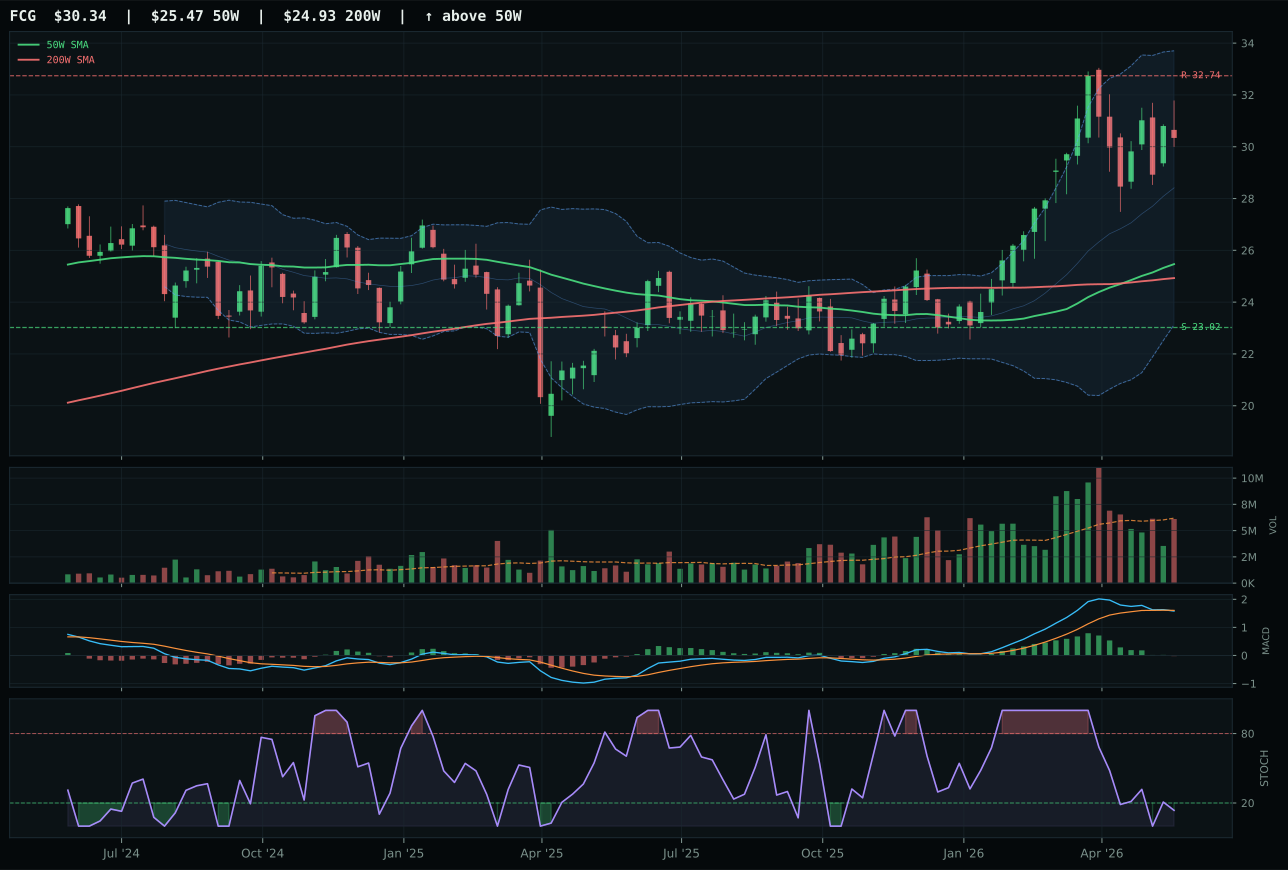
FCG has a vertical extension profile with 1.7% 13-week relative strength versus SPY.
A failed hold above support would weaken the setup.
Actionable but governed by invalidation levels.
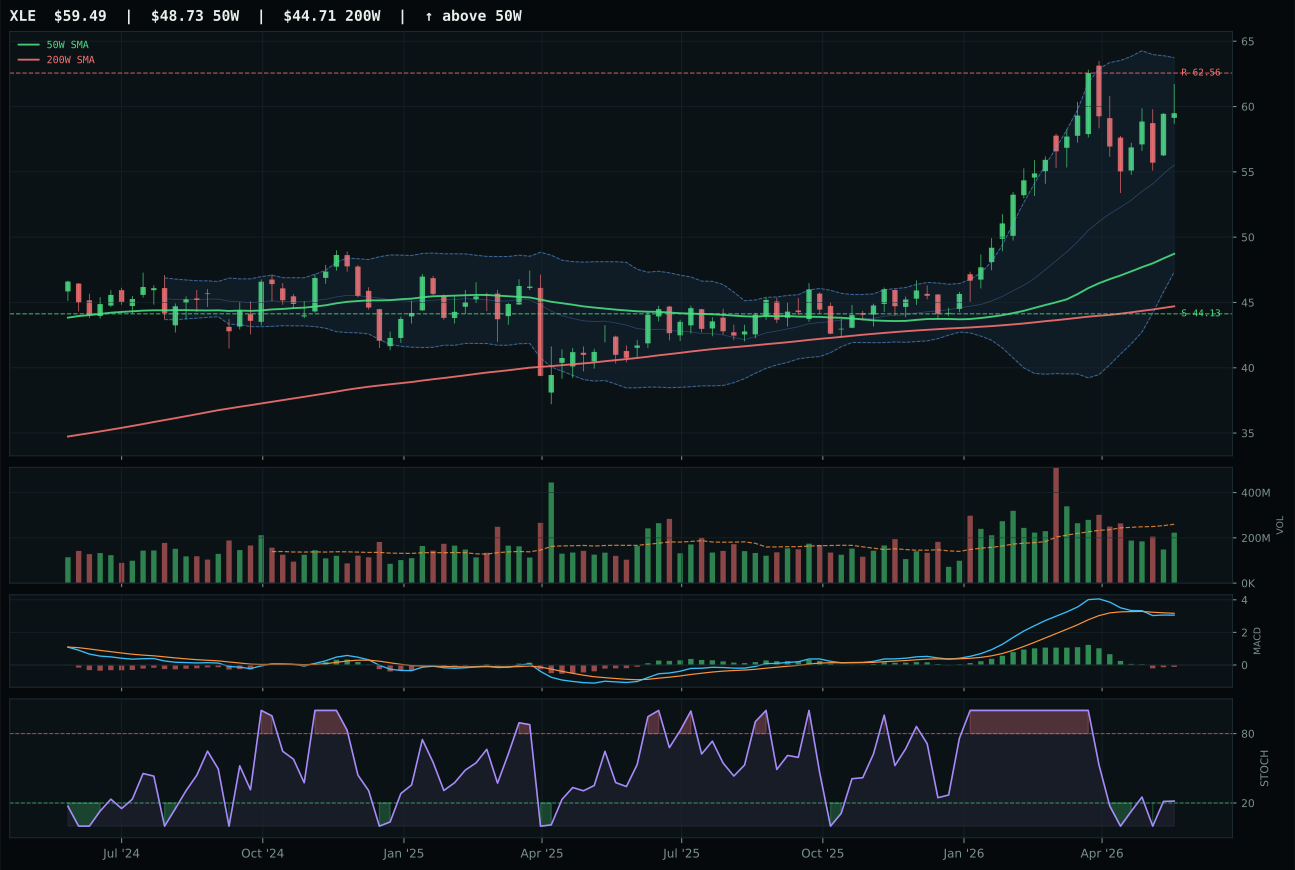
XLE has a vertical extension profile with 0.2% 13-week relative strength versus SPY.
A failed hold above support would weaken the setup.
Actionable but governed by invalidation levels.
XLE wins Traditional Energy despite a−4.1 point disadvantage to XOP because of superior structure (74.5 versus 69.9), allowing the system to weight MACD confirmation and risk/reward more fairly. Both faces show bearish/weakening MACD and extended setups (22.1% for XLE, higher for XOP), but XLE's 74.5 structure score reflects cleaner compression and support/resistance definition, essential when momentum is negative. XLE's integrated energy cash-flow model is more defensive than XOP's exploration beta; in a transition regime where risk appetite is mixed, the steadier total-return expression (dividends + capital preservation) ranks above higher-beta production upside. The 0.2% thirteen-week SPY-relative return on XLE is nearly flat, confirming energy is being rotated into for macro reasons (scarcity, inflation) rather than momentum, a setup that rewards steady ownership over volatility chasing. Volume at 0.86x neutral means neither competition nor rejection is intense; buyers are steady rather than desperate.
Traditional Energy earned 10% allocation despite not ranking in top-2 because the category score of 58.0 reflects overwhelming macro support: energy scarcity (+16), inflation pressure (+10), supply shortage (+9), and real asset sponsorship (+7) sum to a 85.0% category-level macro fit. The technical evidence is weak at 30.2, heavily penalized by bearish MACD across all three ETFs (XOP, XLE, FCG) and near-zero momentum, yet macro weighting at 38% makes the allocation rational. This is a pure energy-inflation hedge: oil prices are sticky, geopolitical risk persists, and supply constraints remain real despite weak technical confirmation. Entry timing is awkward—the chart is extended and momentum is rolling over—but macro regime strength justifies the allocation despite poor timing. The 10% position will persist only if energy scarcity and inflation pressure remain active; a sustained rally in long-duration bonds or a collapse in oil demand would immediately threaten this category's relevance.
Defense & Aerospace — ROKT
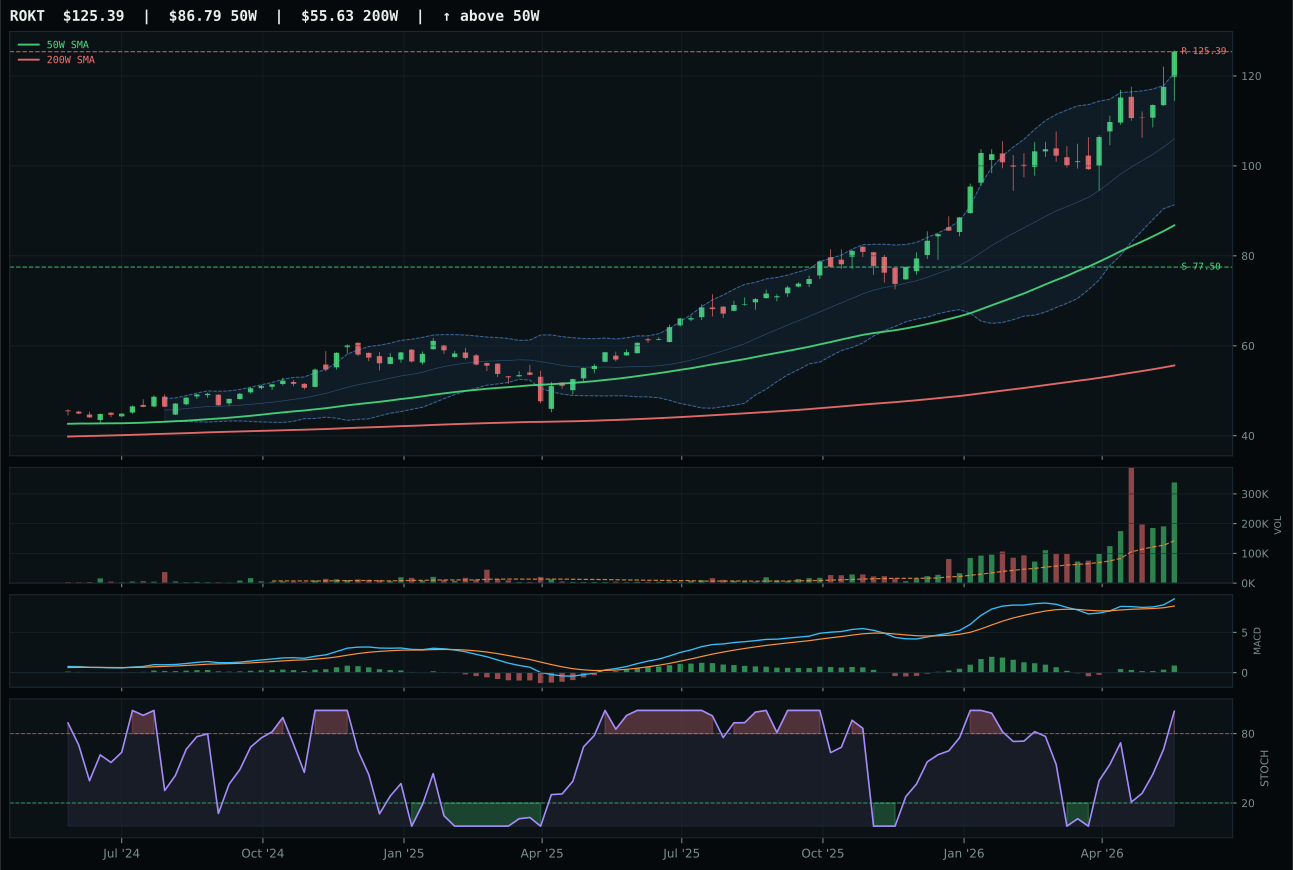
ROKT has a vertical extension profile with 13.3% 13-week relative strength versus SPY.
A failed hold above support would weaken the setup.
Actionable but governed by invalidation levels.
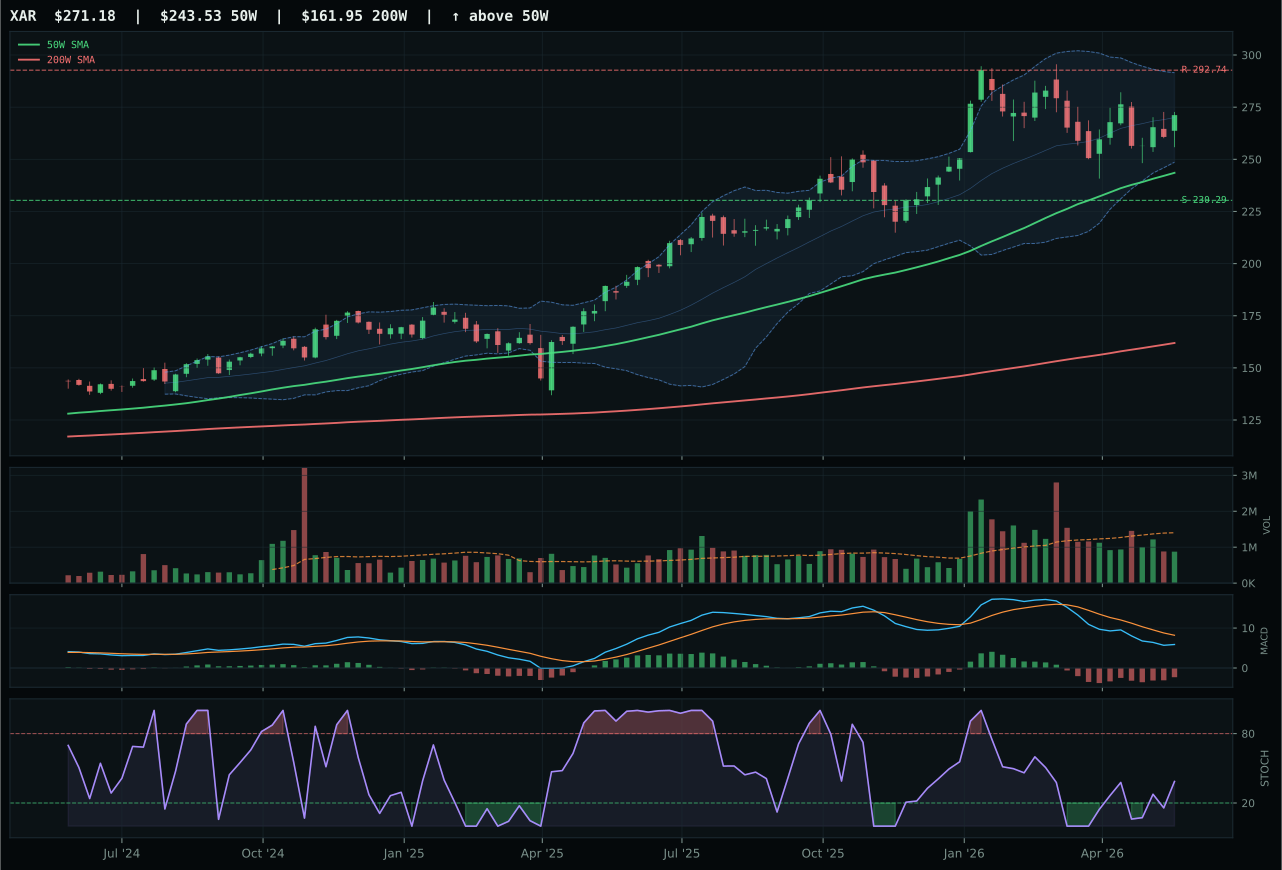
XAR has a neutral structure profile with -12.0% 13-week relative strength versus SPY.
A failed hold above support would weaken the setup.
Actionable but governed by invalidation levels.
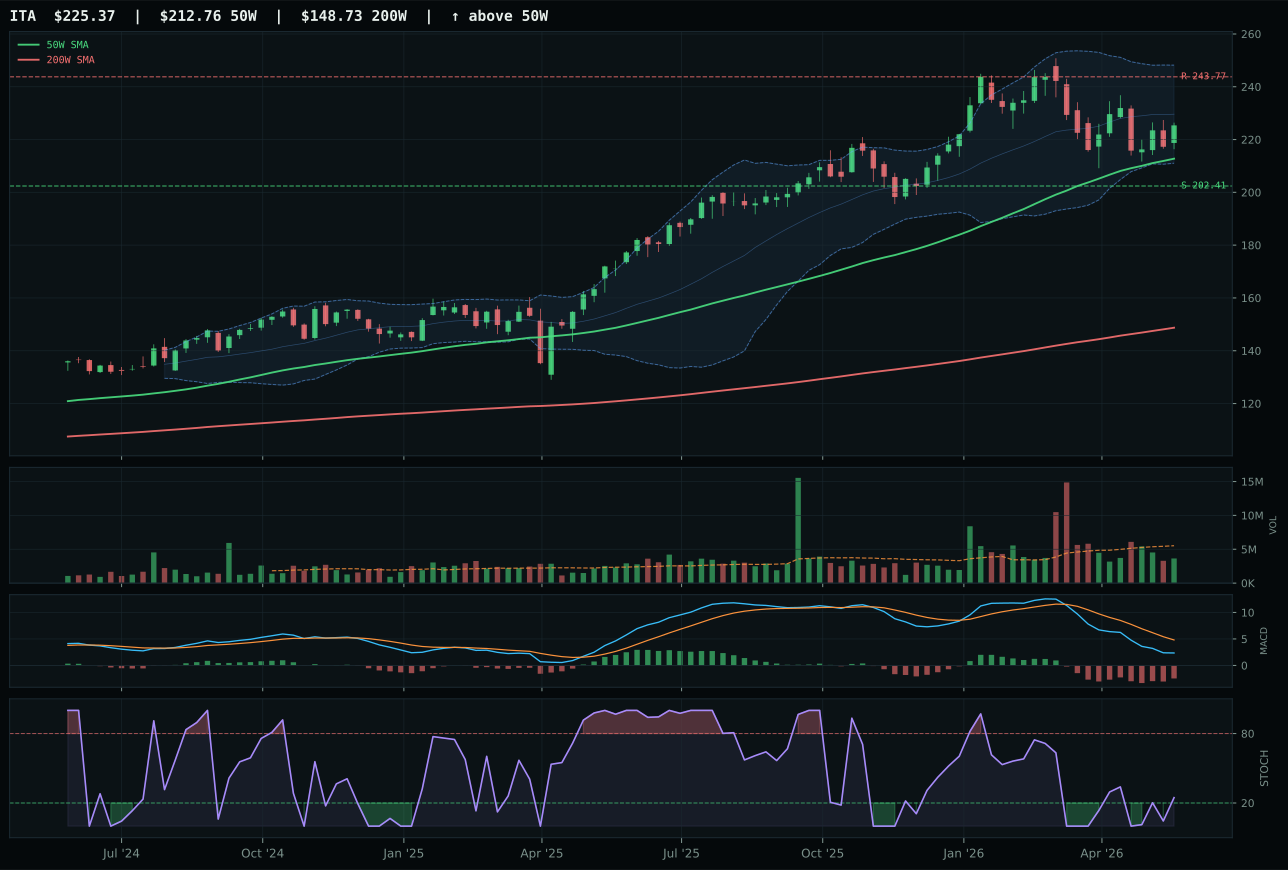
ITA has a neutral structure profile with -15.7% 13-week relative strength versus SPY.
A failed hold above support would weaken the setup.
Actionable but governed by invalidation levels.
ROKT dominated Defense & Aerospace with a category-relative strength of 25.3% and a technical evidence score of 99.8—the highest in the entire portfolio—anchored on perfect volume-price confirmation at 99.4 and persistence at 100.0. The 2.37x volume accumulation at the price move is uncommon and powerful; major institutions are buying into a 44.5% extension above the 50-week moving average, which normally signals exhaustion but here signals supply shortage and genuine scarcity value in space-related assets. XAR's neutral MACD structure and bearish technical profile (−12.0% thirteen-week SPY-relative, thin participation) confirm that the aerospace theme is bifurcating: ROKT's growth narrative in commercial space is pulling capital while traditional defense plays lag. The 1.1-point margin over XAR is closer than the technical dominance suggests, indicating that macro regime—risk appetite and credit stress both active—affects both names, but ROKT's breadth and momentum confirmation overwhelm XAR's cautious setup.
Defense & Aerospace received 10% allocation despite a category score of only 51.0 because ROKT's exceptional technical evidence (99.8) and category leadership (25.3% relative strength) justified holding the position even though top-2 eligibility requires higher overall category scores. The macro fit is modest at 51.0, supported mainly by risk appetite (+7) and neutral credit stress (+2), but the technical execution is so clean that it overrides macro weakness. The allocation reflects a tactical hold rather than strategic conviction: the setup is extended, momentum is rolling over (stochastic RSI at 0.99), and macro tailwinds are real but not overwhelming. This category would need stronger macro support—either a credit-stress decline or explicit geopolitical risk premiums—to justify upgrading from 10% to 20%. For now, ROKT's leadership keeps the category in the portfolio as a satellite position, with the understanding that valuation risk is asymmetric at current extension levels.
Agriculture & Livestock — WEAT
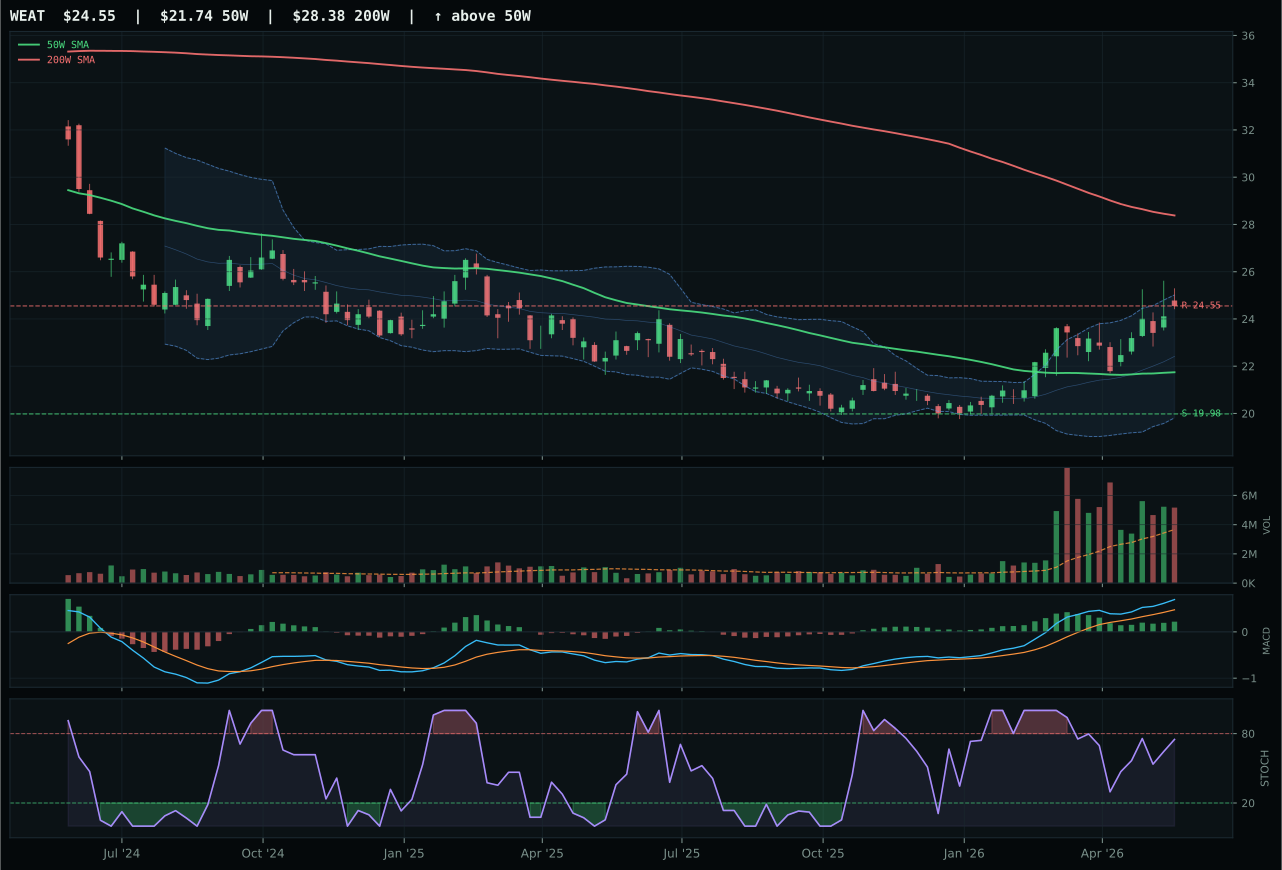
WEAT has a neutral structure profile with 2.6% 13-week relative strength versus SPY.
A failed hold above support would weaken the setup.
Actionable but governed by invalidation levels.
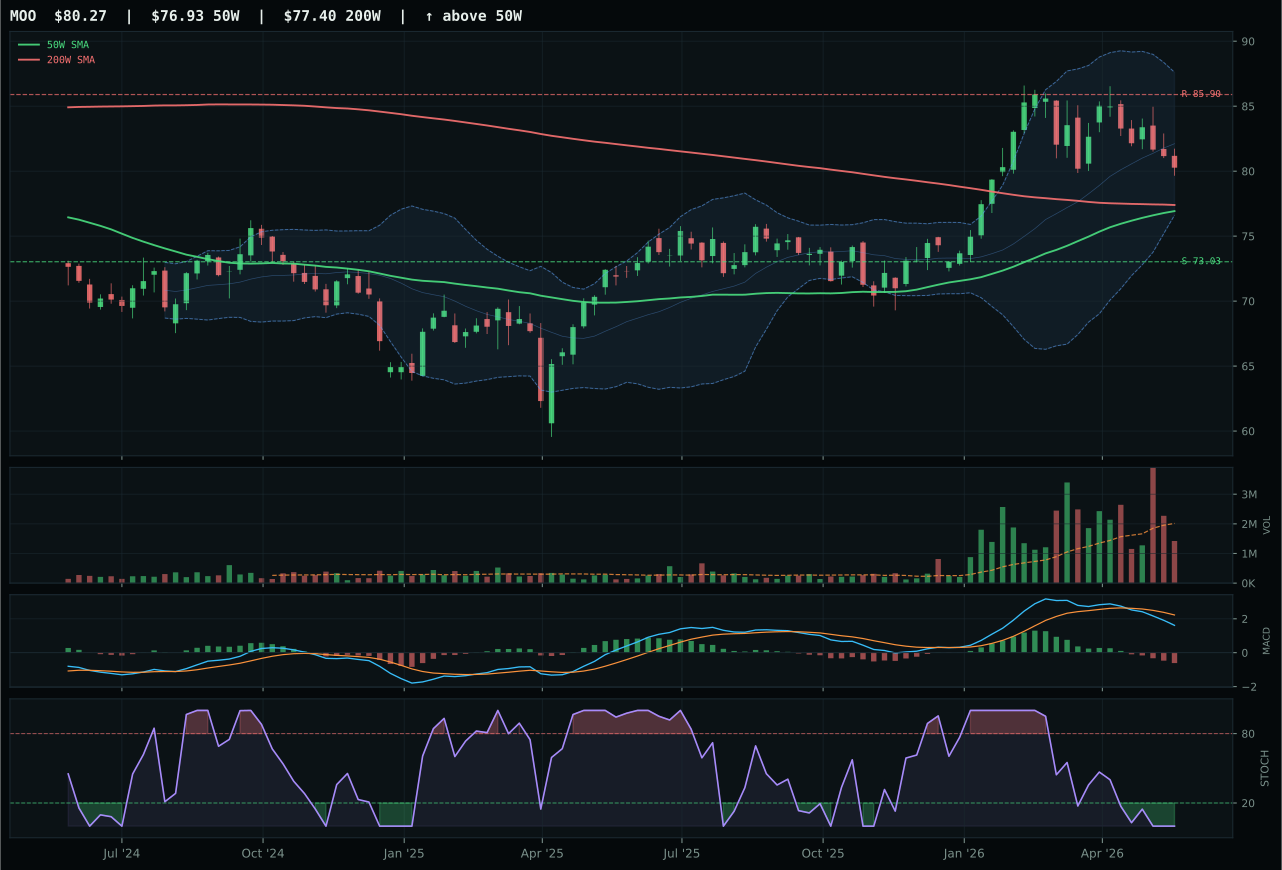
MOO has a neutral structure profile with -14.7% 13-week relative strength versus SPY.
A failed hold above support would weaken the setup.
Actionable but governed by invalidation levels.
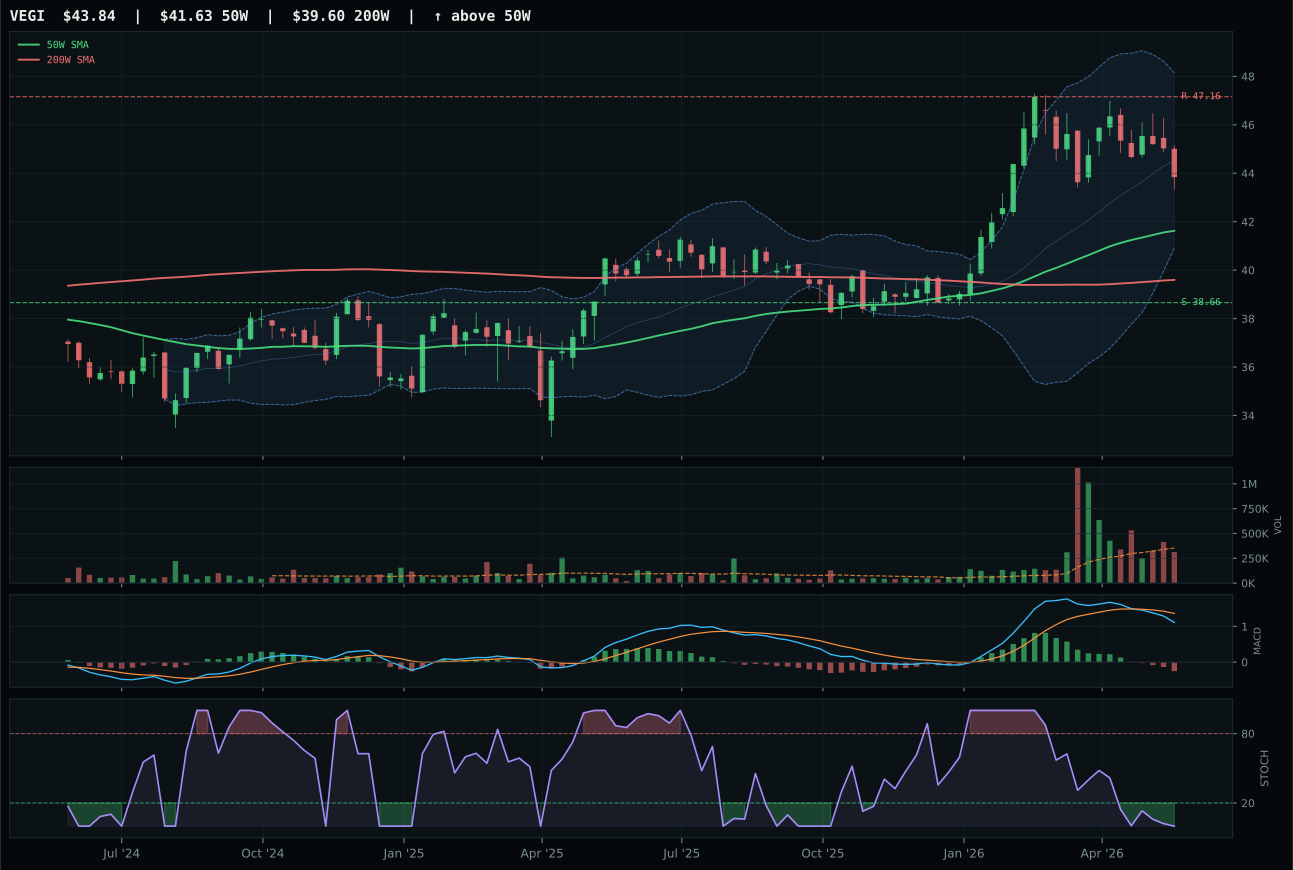
VEGI has a neutral structure profile with -15.2% 13-week relative strength versus SPY.
A failed hold above support would weaken the setup.
Actionable but governed by invalidation levels.
WEAT wins Agriculture & Livestock with a commanding 23.0-point gap over MOO, driven by superior structure (74.9 versus 65.2), bullish MACD confirmation versus MOO's bearish/weakening profile, and above-average volume participation (1.41x) confirming that real capital is accumulating in wheat. The 17.3% category-relative strength indicates WEAT is the only grain exposure in favor, while both MOO and VEGI languish in oversold stochastic RSI and deteriorating momentum. WEAT's 13W return of 10.7% is modest—SPY-relative strength is just 2.6%—but the setup is cleaner because the chart sits in neutral structure with bullish MACD improving, meaning the move is early-stage rather than extended. Support holds at 19.98 with upside to 24.55 resistance, giving a tight risk/reward profile of 51.3 that trades upside room for defined downside, appropriate for a commodity grappling with supply shortage macro headlines.
Agriculture & Livestock earned 10% despite a weak category score of 50.9 because the macro regime strongly favors this exposure: supply shortage, inflation pressure, real asset sponsorship, and commodity breadth are all active, yielding an 86.0% category-level macro fit. The technical side is uneven—WEAT's 92.7 technical evidence is stellar, but that drags the category average higher because MOO (28.8 technical) and VEGI (similar) are badly broken—yet macro weighting at 38% keeps the category afloat. The macro case is durable: supply constraints are structural, not cyclical, and inflation pressures will likely persist through the transition. Timing is reasonable because WEAT is early in a neutral structure (not yet extended) and has room to run if supply concerns intensify. The 10% allocation reflects a macro conviction play that accepts weaker technical breadth for the sake of regime exposure; if commodity breadth turns neutral or inflation pressure relaxes, this category's rank will erode rapidly.
Industrial Metals — PICK
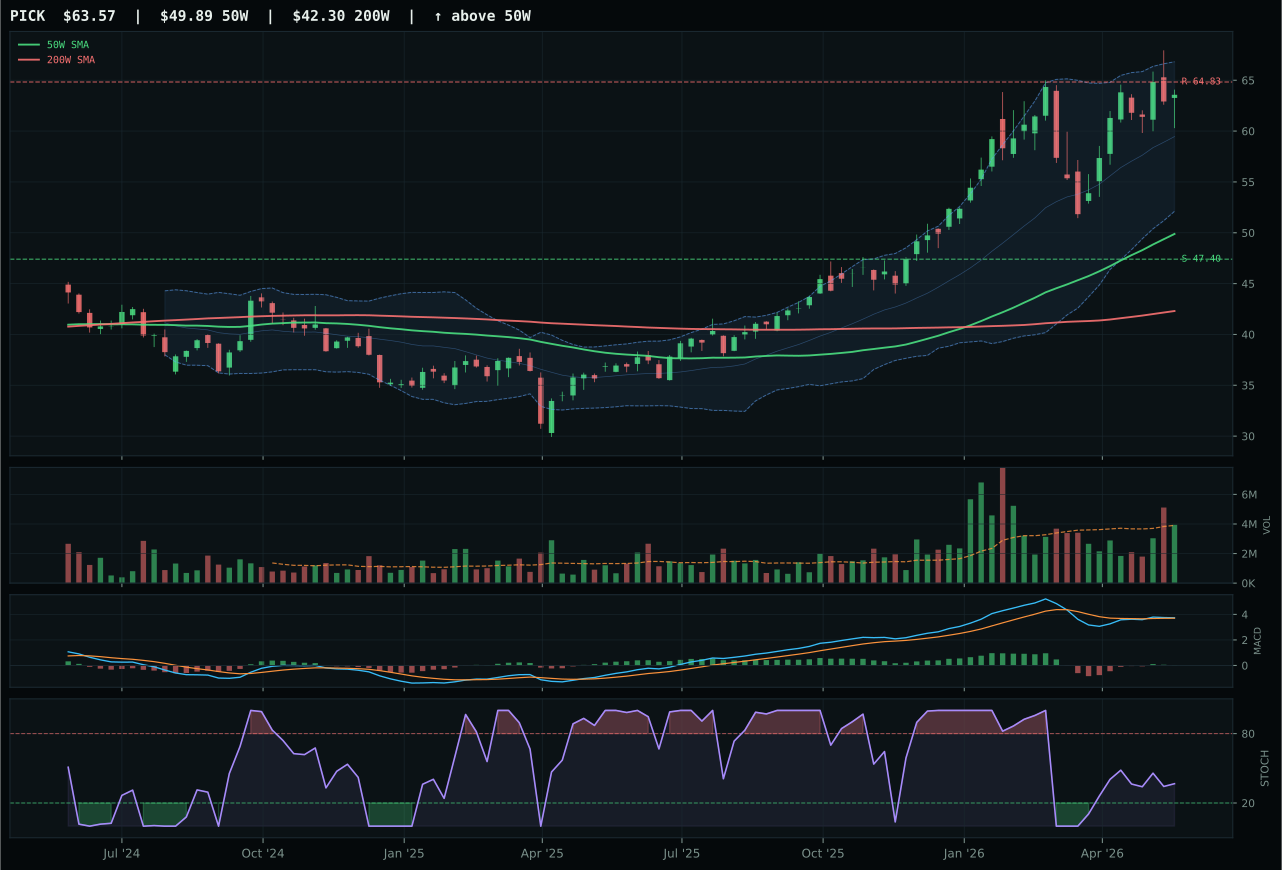
PICK has a vertical extension profile with -4.7% 13-week relative strength versus SPY.
A failed hold above support would weaken the setup.
Actionable but governed by invalidation levels.
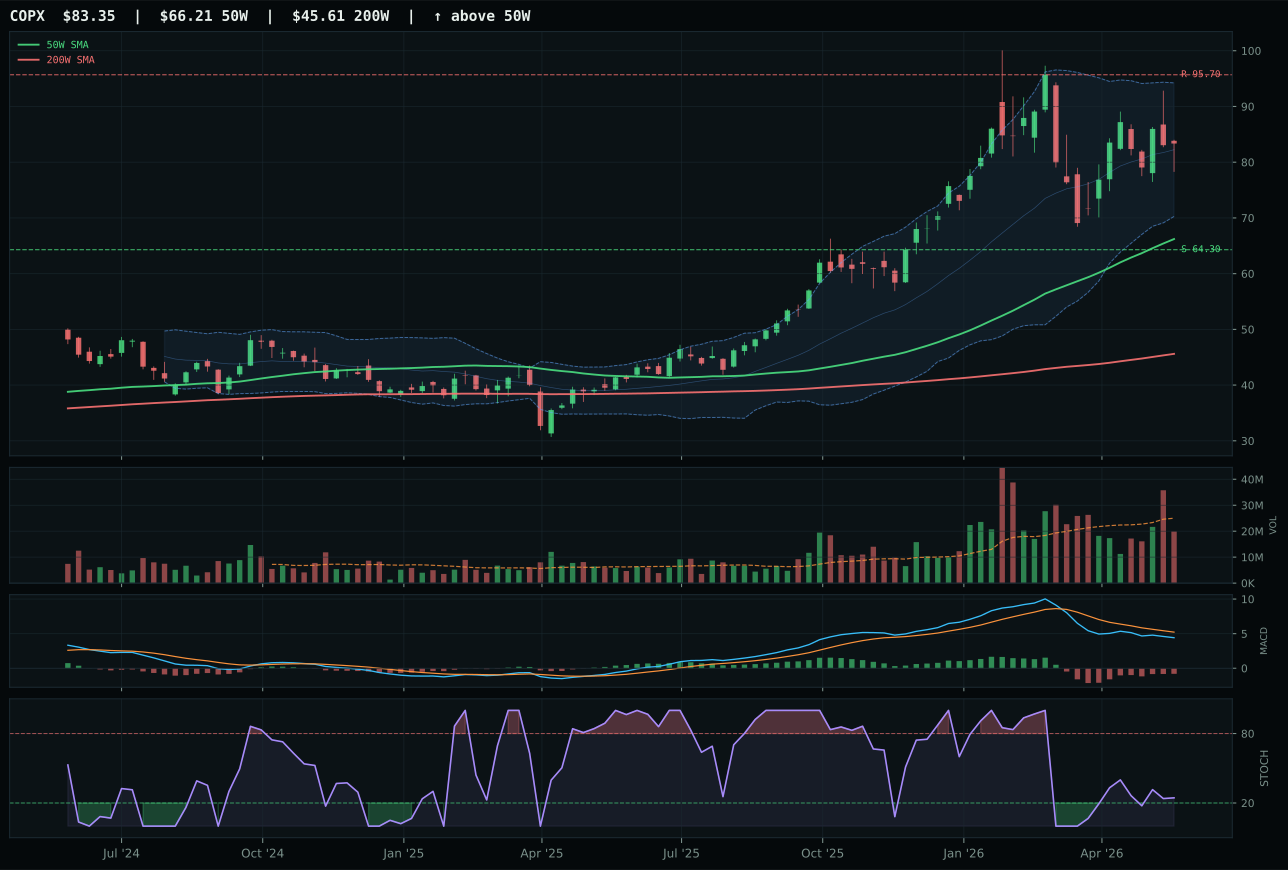
COPX has a vertical extension profile with -14.6% 13-week relative strength versus SPY.
A failed hold above support would weaken the setup.
Actionable but governed by invalidation levels.
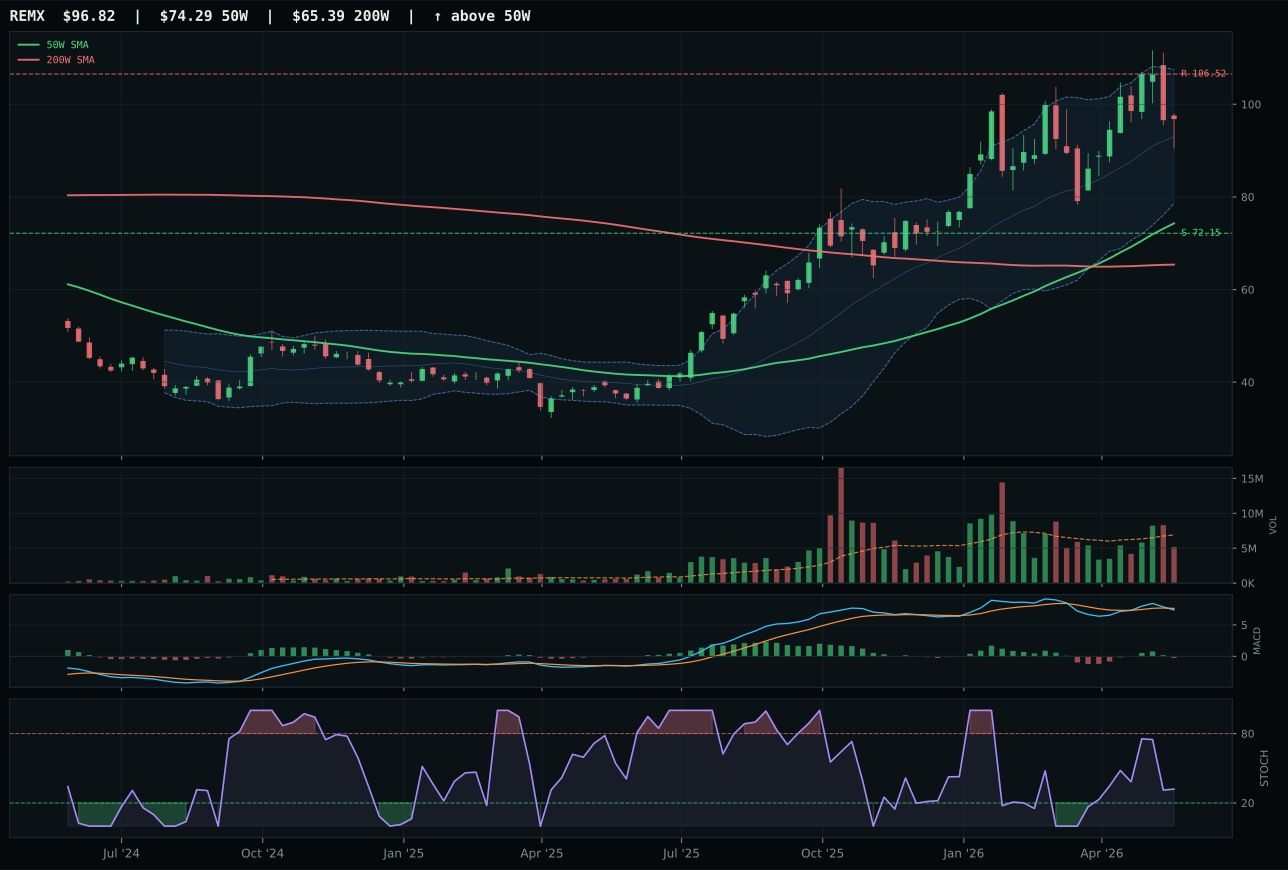
REMX has a vertical extension profile with 0.6% 13-week relative strength versus SPY.
A failed hold above support would weaken the setup.
Actionable but governed by invalidation levels.
PICK wins Industrial Metals with a decisive 14.7-point gap over COPX by combining superior structure (68.3 versus 64.7), bullish MACD confirmation versus COPX's bearish profile, and category-relative strength at parity (0.0%) while COPX lags at−9.9%. Both setups are vertical extension, but PICK's vertical move sits in upper retracement/momentum zone with rising stochastic RSI at 0.37, indicating early-stage upside momentum, whereas COPX's stochastic is also rising but the MACD is deteriorating, suggesting the move is exhausting. PICK's 41.5% twenty-six-week return confirms real breadth beneath the surface; the category as a whole is weak (3.5% thirteen-week return), but mining diversification captures upside that copper-specific plays miss. The 1.01x neutral volume on PICK allows room for institutional accumulation without the thin participation that plagues both competitors, important for a category-level macro score (73.0) that is driven by metals scarcity rather than momentum.
Industrial Metals earned 10% allocation on the strength of a 73.0% category-level macro fit driven by metals scarcity (+14), commodity breadth positive (+10), and real asset sponsorship (+6), sufficient to justify holding despite a weak technical category score of 47.6. The gap between macro fit (73.0) and category score (47.6) is the largest in the portfolio, indicating that this allocation is purely a macro regime bet: the system believes in supply constraints and real asset inflation more than it trusts the charts. PICK's technical evidence at 59.3 carries the category, while COPX (22.6) and REMX (near that range) drag it down, yet macro weighting at 38% of the category decision keeps the category in portfolio. Timing is reasonable because the setup is early (rising stochastic, upper retracement zone) and volume is neutral, leaving room for accumulation before extension becomes exhaustion. The allocation will face pressure if commodity breadth turns neutral or if credit stress deepens sufficiently to offset supply scarcity; this is a classic inflation-hedge play with cyclical downside risk.
Utilities & Infrastructure — IGF
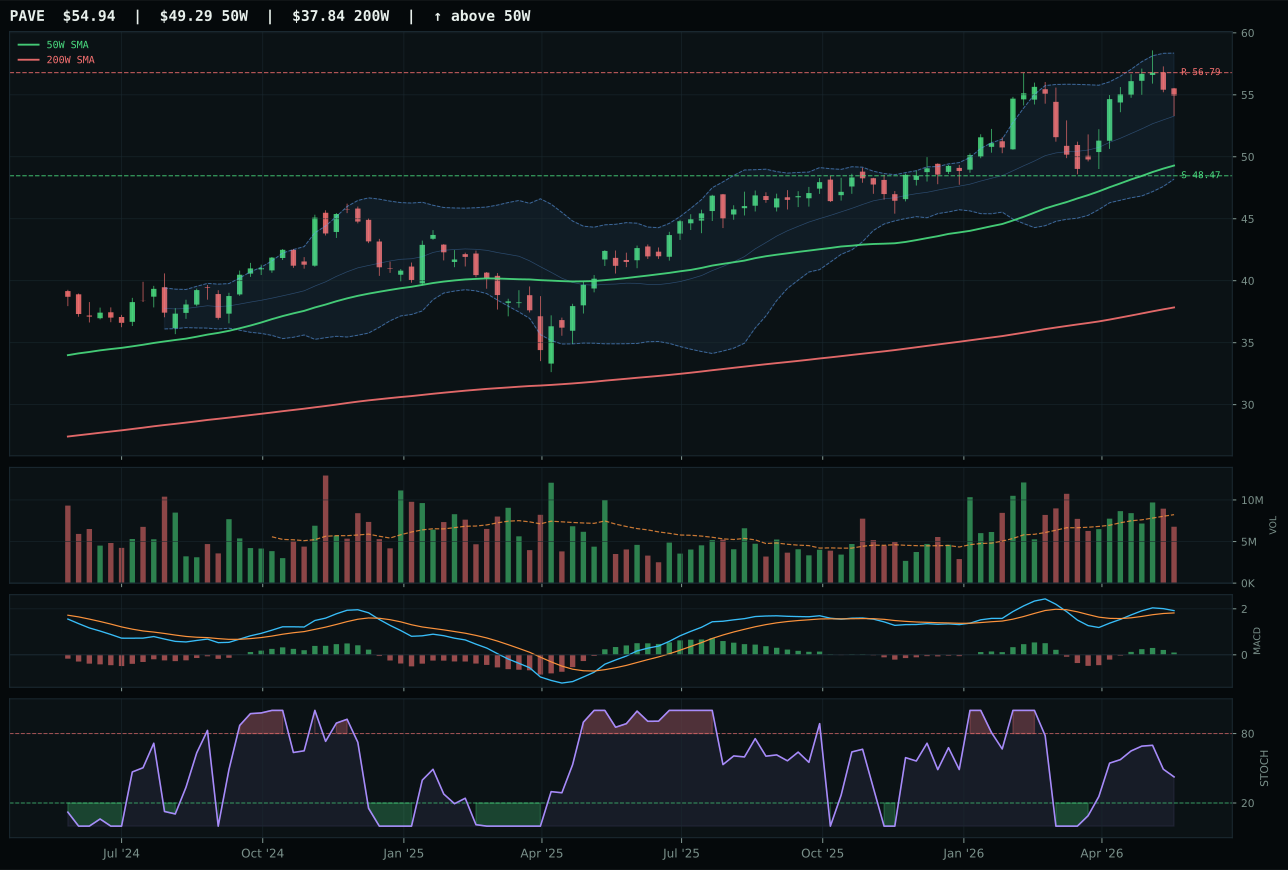
PAVE has a neutral structure profile with -9.4% 13-week relative strength versus SPY.
A failed hold above support would weaken the setup.
Actionable but governed by invalidation levels.
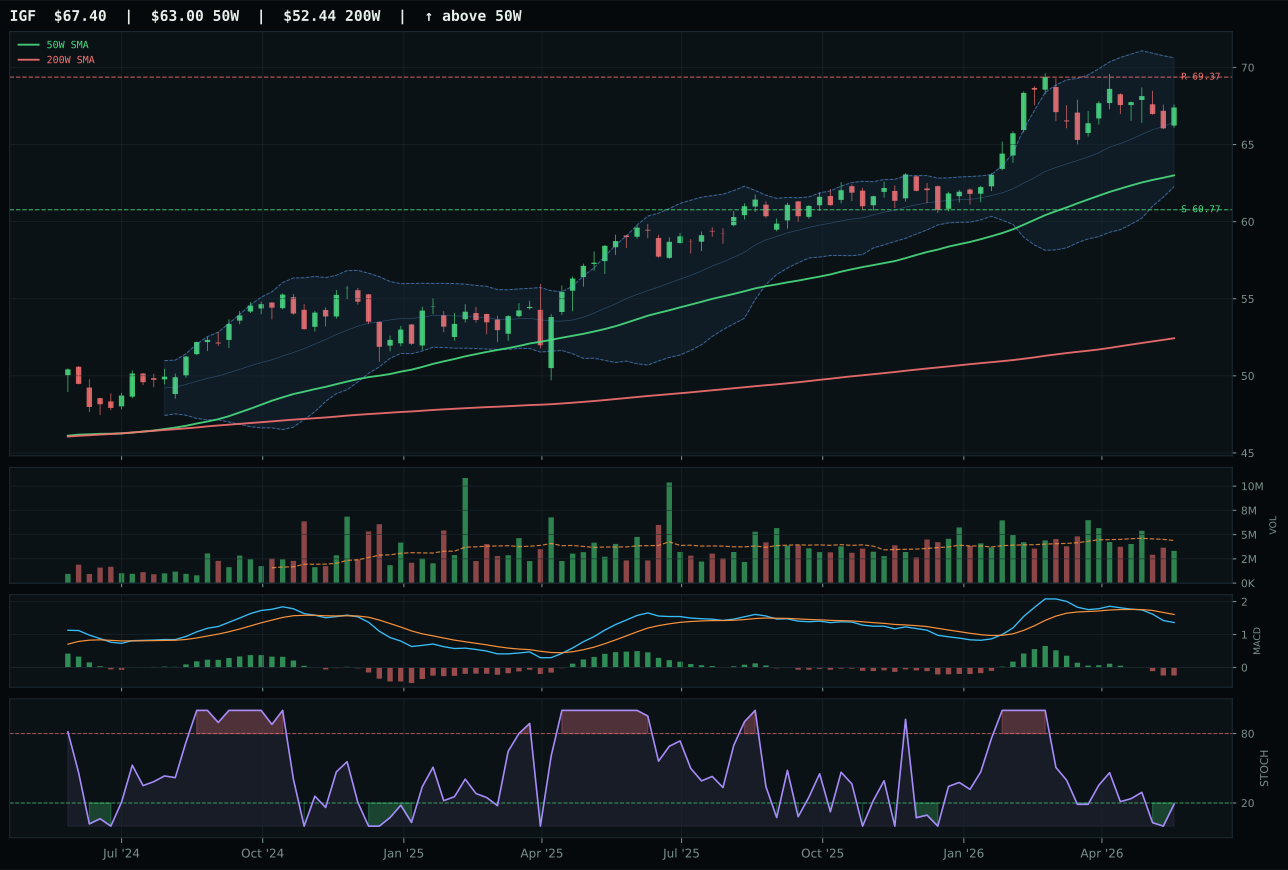
IGF has a neutral structure profile with -9.8% 13-week relative strength versus SPY.
A failed hold above support would weaken the setup.
Actionable but governed by invalidation levels.
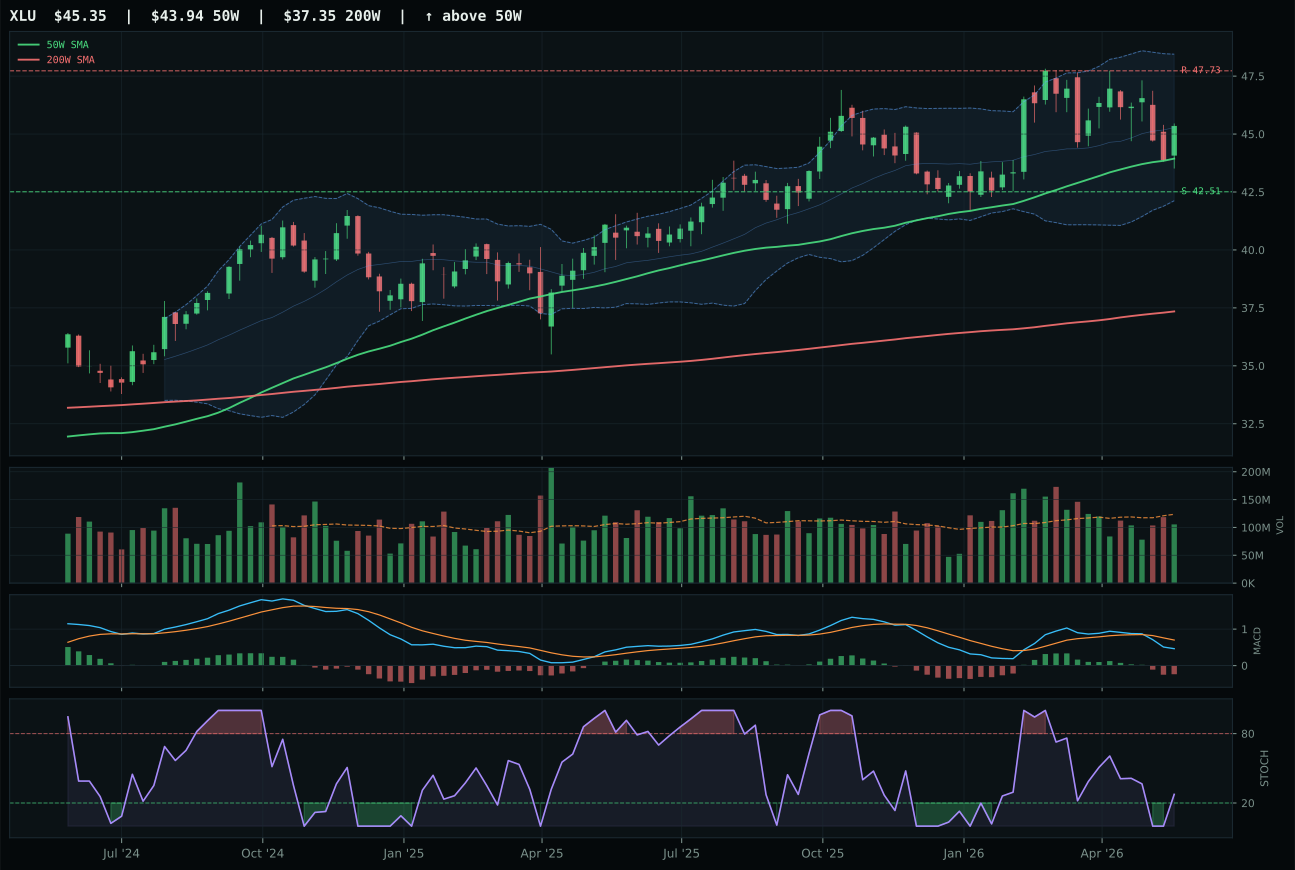
XLU has a neutral structure profile with -10.3% 13-week relative strength versus SPY.
A failed hold above support would weaken the setup.
Actionable but governed by invalidation levels.
IGF wins Utilities & Infrastructure despite losing on technical evidence (34.6 versus PAVE's 57.7) because the system's macro-weighting structure (38% weight to narrative) allows IGF's global infrastructure income expression to compete on macro fit (46.0 versus PAVE's 53.0). Both setups are neutral structure with similar sentiment (slightly bearish flattening on both), but IGF's oversold stochastic RSI (0.19) versus PAVE's falling/neutral (higher value) gives IGF the timing edge for a capitulation reversal setup. The 7.0% distance from the 50-week moving average places IGF at price support, whereas PAVE sits in upper retracement/momentum zone, creating timing asymmetry despite PAVE's superior breadth. The 1.7% thirteen-week return on IGF and−1.3% on PAVE show both are stalled; the choice between them hinges on whether global infrastructure is preferable to domestic capex in a transition regime, a macro judgment that slightly favors IGF's international diversification.
Utilities & Infrastructure received 10% allocation despite a weak category score of 42.4, reflecting a deteriorating macro fit of 46.0 that is penalized by inflation pressure (−6) and slight risk-appetite headwind (−2). The transition regime nominally supports infrastructure (capex and real asset positioning), but the active macro descriptors are not broadly supportive; this category is held defensively as a ballast position rather than as a conviction allocation. IGF's technical evidence at 34.6 is weak—momentum confirmation at 16.8 reflects−1.7% thirteen-week return and no category-relative strength—yet the category's low correlation to equities and inflation-hedging properties justify a satellite position. Timing is reasonable because both PAVE and IGF sit near support with oversold momentum, offering entries that reward patience rather than urgency. This allocation is vulnerable: if credit stress intensifies or if inflation pressure becomes the dominant macro descriptor, utilities will likely underperform because rising rates and cost pressures override their dividend safety. The 10% position persists only as long as transition-regime assumptions hold; acceleration toward credit stress or persistent inflation would justify reduction to 5% or elimination.
Emerging Markets — IEMG
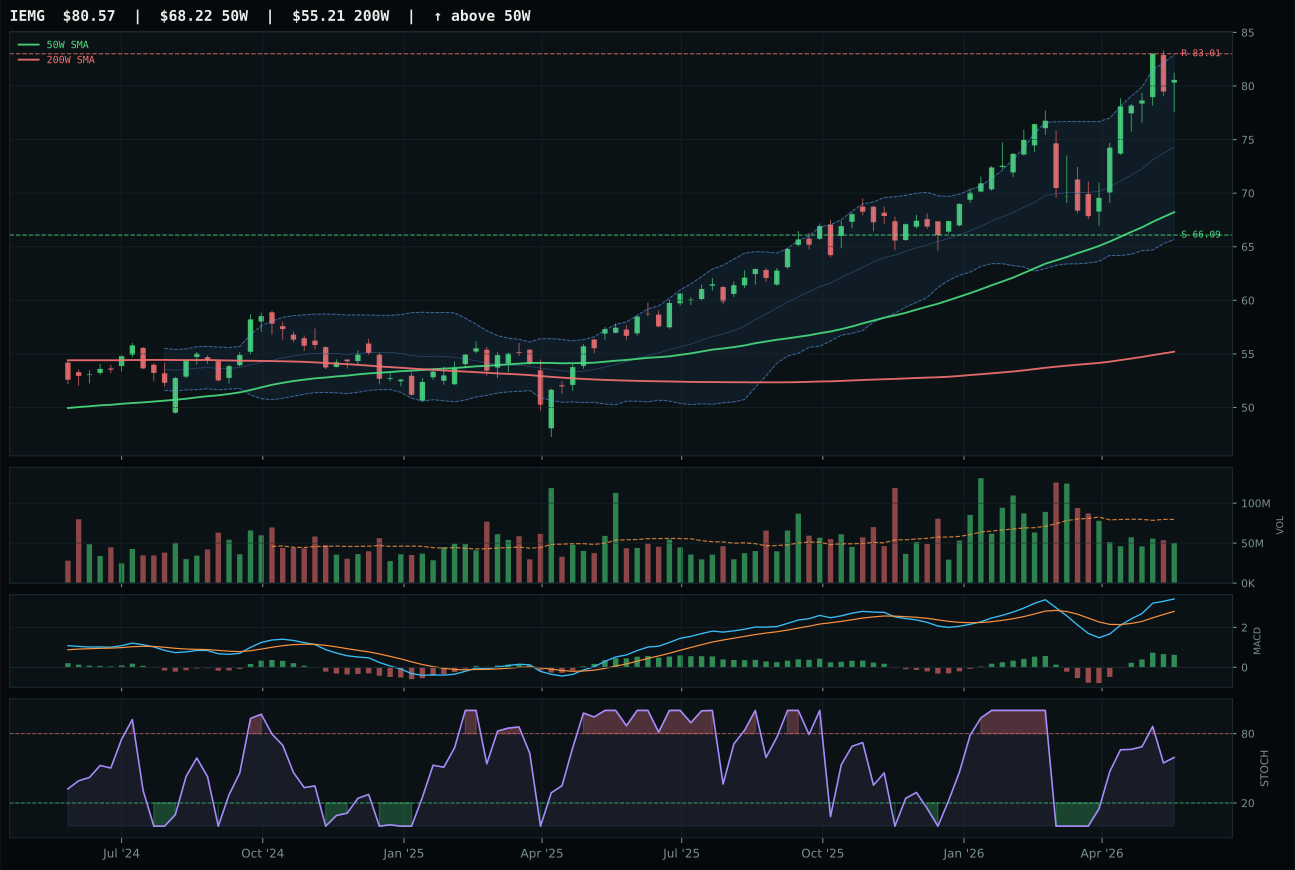
IEMG has a vertical extension profile with -2.8% 13-week relative strength versus SPY.
A failed hold above support would weaken the setup.
Actionable but governed by invalidation levels.
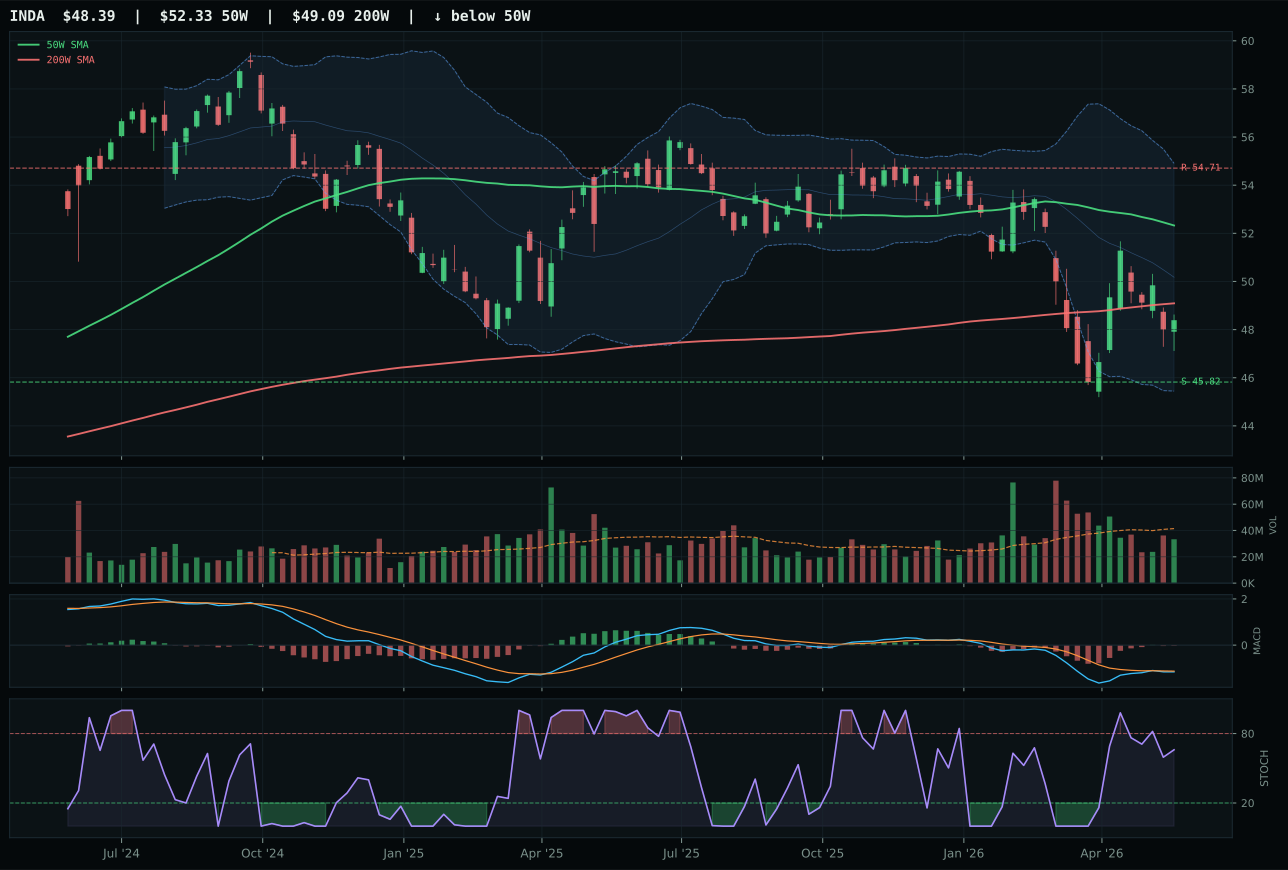
INDA has a neutral structure profile with -17.6% 13-week relative strength versus SPY.
A failed hold above support would weaken the setup.
Actionable but governed by invalidation levels.
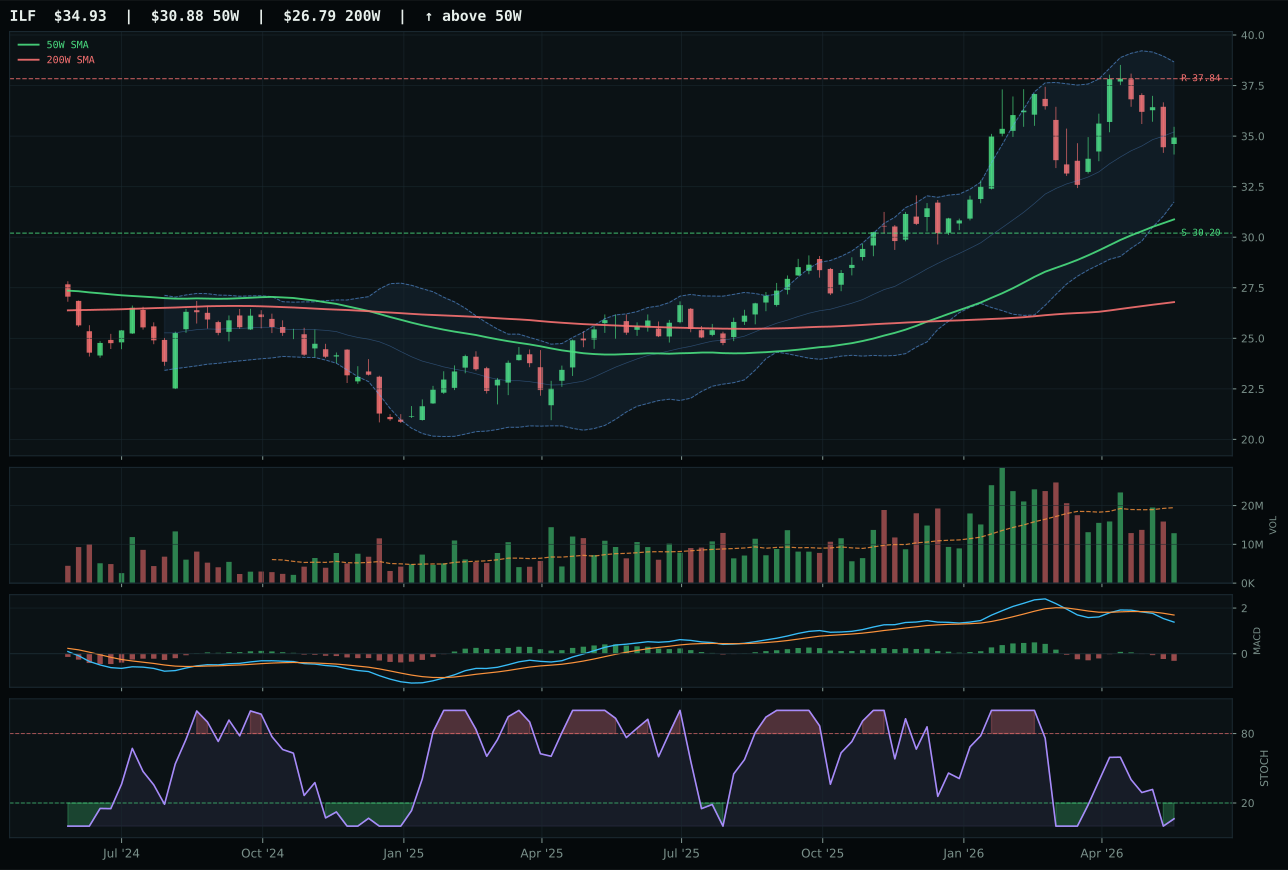
ILF has a neutral structure profile with -14.0% 13-week relative strength versus SPY.
A failed hold above support would weaken the setup.
Actionable but governed by invalidation levels.
IEMG wins Emerging Markets by a 25.2-point gulf over INDA, combining superior trend (95.9 versus 33), bullish MACD improving versus INDA's bearish profile, and category-relative strength of 11.2% that places IEMG as the only positive beta within EM. Both setups are stretched into upper retracement/momentum zone (IEMG at 18.1%, INDA at much deeper level), but IEMG's vertical extension with improving MACD and falling stochastic RSI (0.59) indicate early-stage upside momentum, while INDA's oversold conditions and bearish MACD suggest exhaustion rather than revival. The 5.4% thirteen-week return on IEMG is weak—SPY-relative is−2.8%—but EM liquidity support macro descriptor (+14) is exclusive to broad-based plays like IEMG; India-specific moves have lost conviction and are now dead money. Volume on IEMG is thin (0.63x) but confirming; thin participation on a clean chart is less concerning than thin participation on a broken one.
Emerging Markets earned 10% allocation on the back of a 62.0% category-level macro fit, driven by EM liquidity support (+14), risk appetite positive (+8), and offsetting credit stress (−10). The 40.9 category score is weak, ranking outside top-2, yet the macro narrative is genuine: emerging-market assets are benefiting from rebalancing flows and currency support in a transition regime. IEMG's technical evidence at 70.5 is the sole strength; momentum confirmation at 79.5 reflects category-relative outperformance (11.2%) even as absolute returns remain muted. The setup is early (18.1% extension, falling stochastic at 0.59, upper retracement zone) with room to extend if risk appetite strengthens. This allocation is a second-order macro play: not a core conviction but a natural byproduct of risk-on positioning and EM liquidity support in a transition regime. It will shrink or exit if credit stress intensifies or if EM liquidity support becomes a false signal; for now, it represents defensive diversification rather than offensive positioning.
Nuclear Energy — NLR
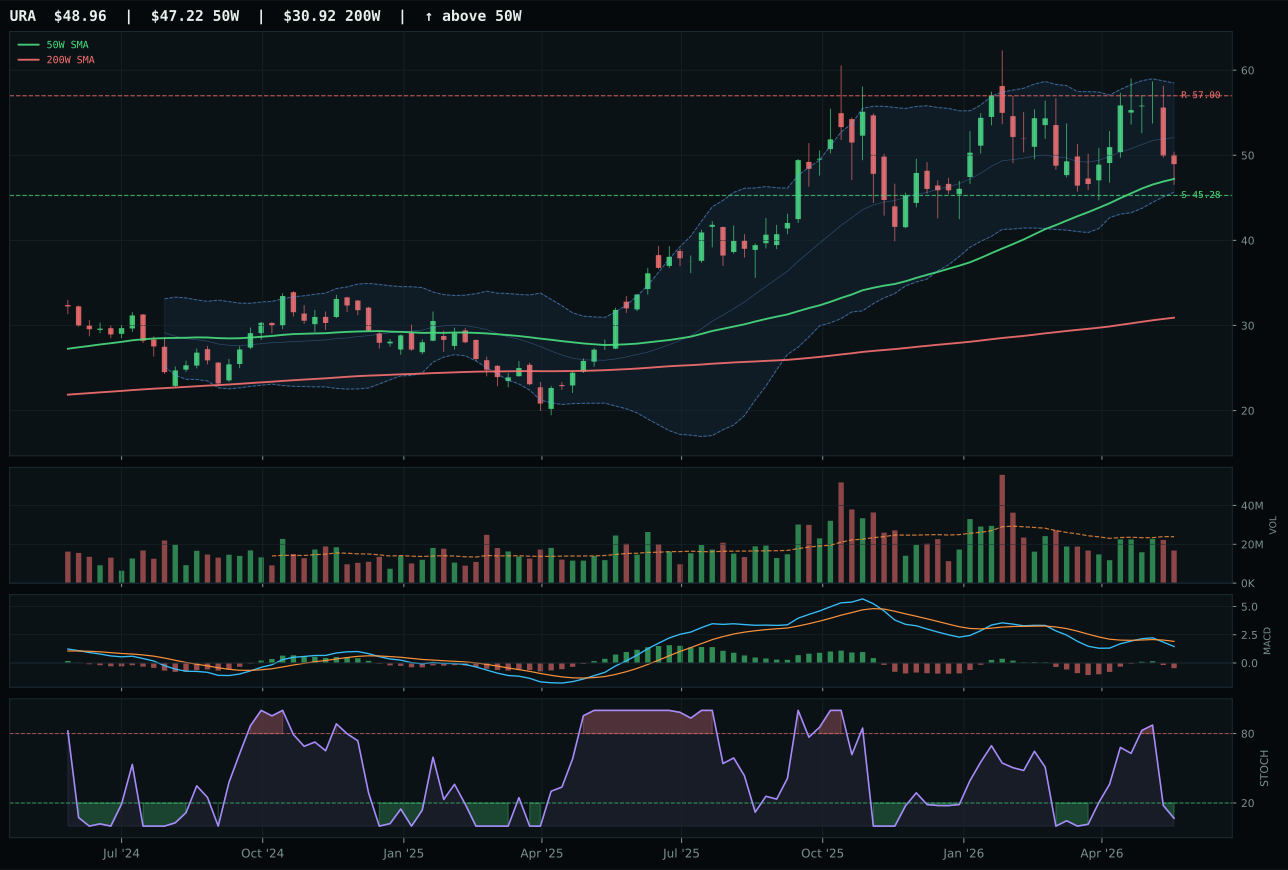
URA has a neutral structure profile with -18.1% 13-week relative strength versus SPY.
A failed hold above support would weaken the setup.
Actionable but governed by invalidation levels.
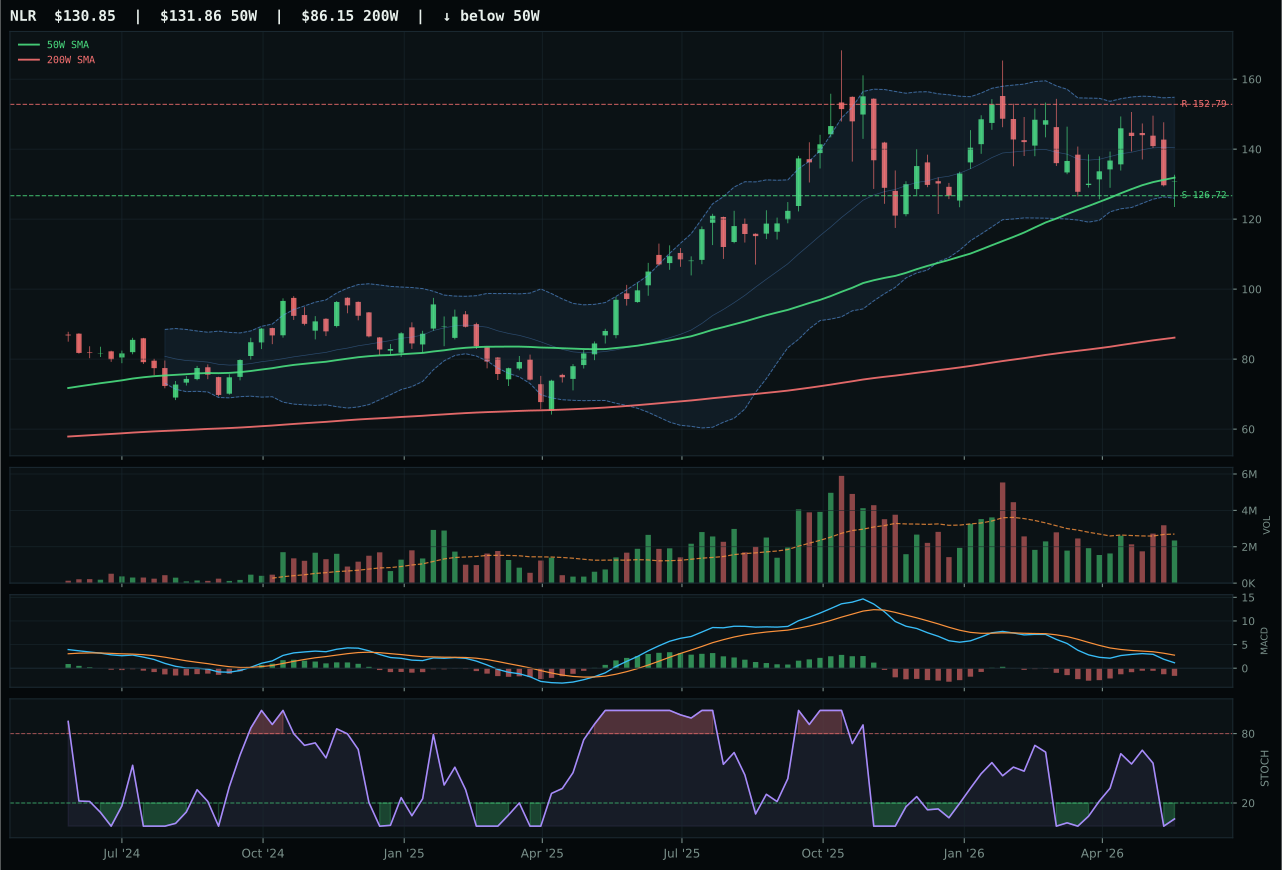
NLR has a pullback into support profile with -20.0% 13-week relative strength versus SPY.
A failed hold above support would weaken the setup.
Actionable but governed by invalidation levels.
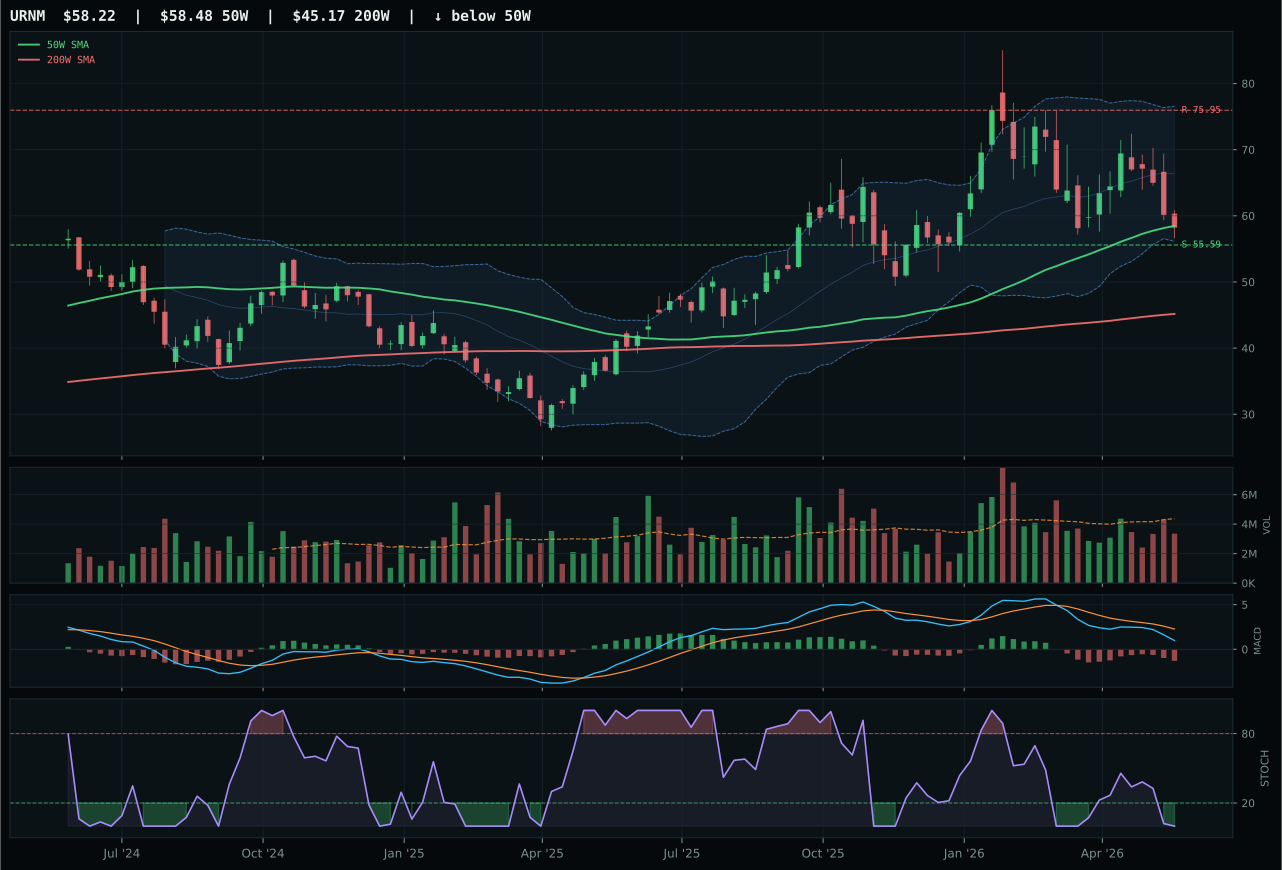
URNM has a pullback into support profile with -28.9% 13-week relative strength versus SPY.
A failed hold above support would weaken the setup.
Actionable but governed by invalidation levels.
NLR wins Nuclear Energy with a 2.2-point margin over URA by offering superior risk/reward (83.0 versus 61.2) and perfect timing: price sits at the 50-week moving average (−0.8% distance) in a pullback-into-support setup at 126.72, creating defined downside and asymmetric upside. Both faces show bearish/weakening MACD and oversold stochastic RSI, but NLR's pullback structure at the key moving average is a textbook reversal setup, whereas URA's neutral structure (61.2 cleanliness) lacks that tactical advantage. NLR scores 100.0 on timing because the oversold stochastic RSI combined with price support creates maximum risk-off entry conditions; new capital arriving here has a clear invalidation point (below 126.72) and defined profit targets above. The 13W return of−11.8% and−20.0% SPY-relative weakness indicate that nuclear has been abandoned, but that abandonment has created the opportunity: volume at 0.87x confirms thin participation, ideal for early accumulation before institutional re-entry.
Nuclear Energy ranks 10th at 38.7 with 0% allocation because technical evidence is too weak (29.0 for NLR, well below allocation thresholds) and momentum confirmation is completely absent (0/100 across all names), despite macro tailwinds from energy scarcity (+9), real asset sponsorship (+7), and AI growth sponsorship (+5) that push category-level macro fit to 69.0. The reasoned ETF proof order shows NLR at 39.0 barely above category floor, and the 3/2/1 basket only reaches 34.3 before filters; this is a category that is macro-attractive but technically uninvestable. Nuclear would regain allocation only if NLR reversed its MACD above zero while volume surged above 1.5x average and stochastic RSI broke above 50, proving that energy-security buyers were accumulating into the support zone; at present, the category is lower-ranked than Precious Metals and significantly below the cutoff for any portfolio position. The macro case for nuclear is intellectually sound (AI compute power demands, energy scarcity), but the technical setup requires evidence of institutional buying before allocation is justified.
Precious Metals — GLD
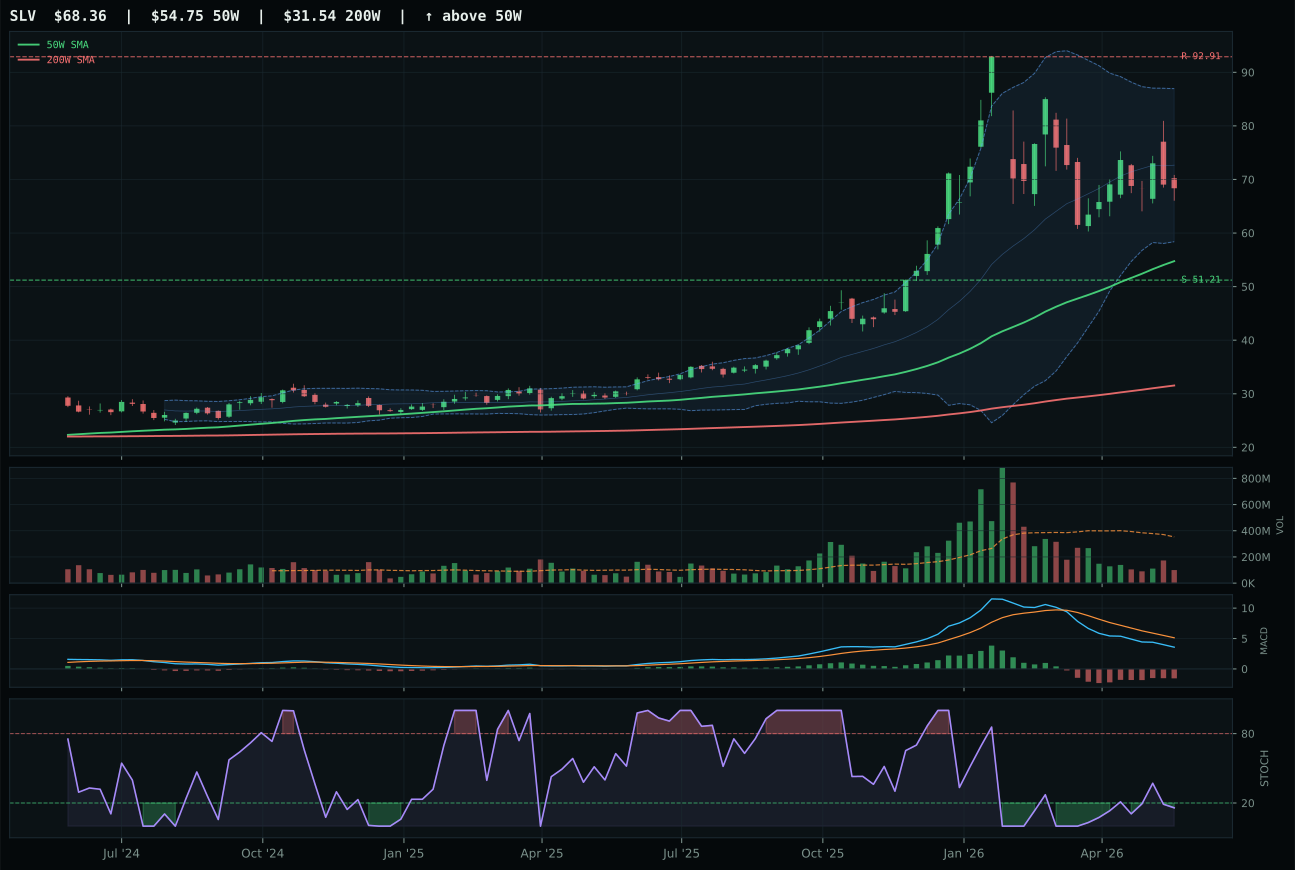
SLV has a vertical extension profile with -18.9% 13-week relative strength versus SPY.
A failed hold above support would weaken the setup.
Actionable but governed by invalidation levels.
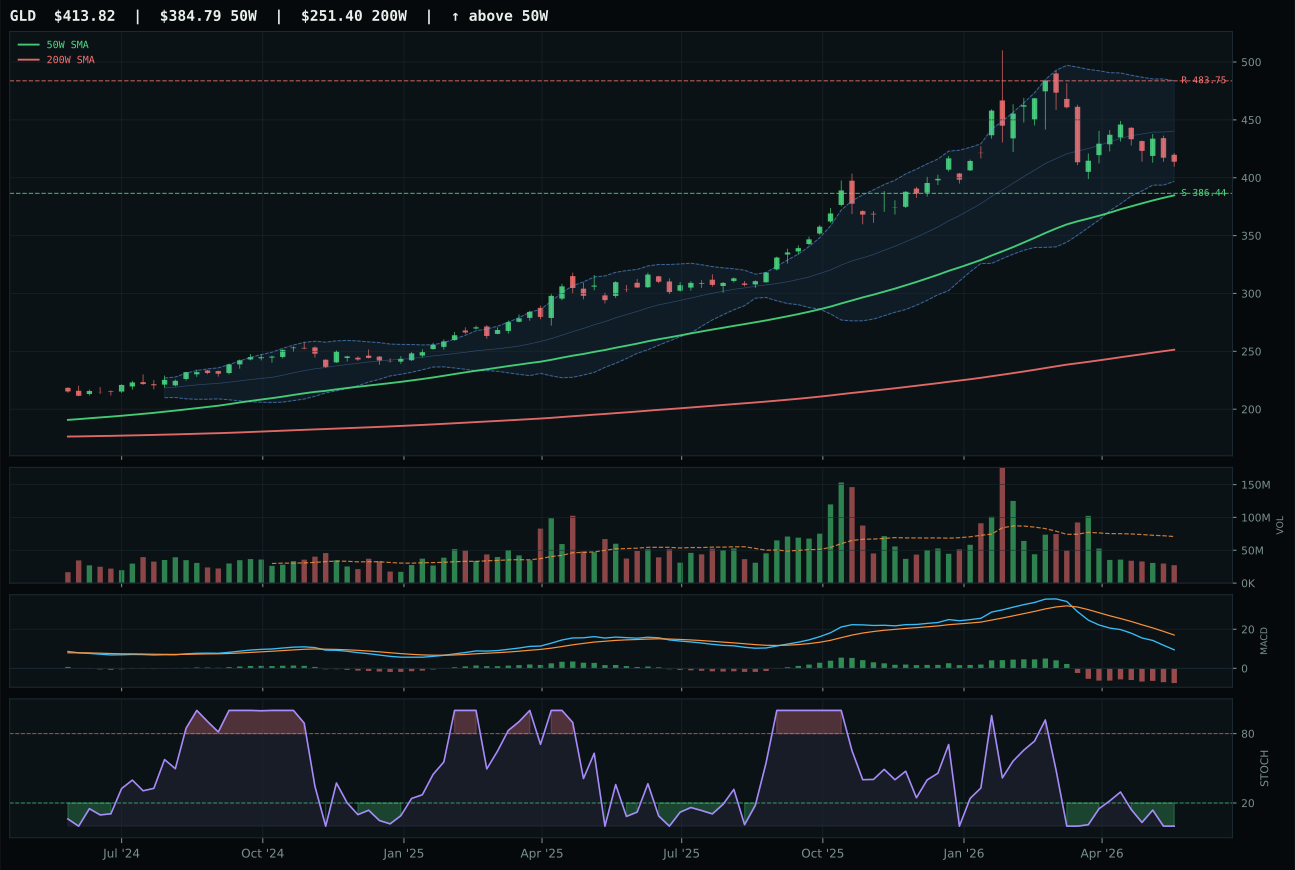
GLD has a neutral structure profile with -19.8% 13-week relative strength versus SPY.
A failed hold above support would weaken the setup.
Actionable but governed by invalidation levels.
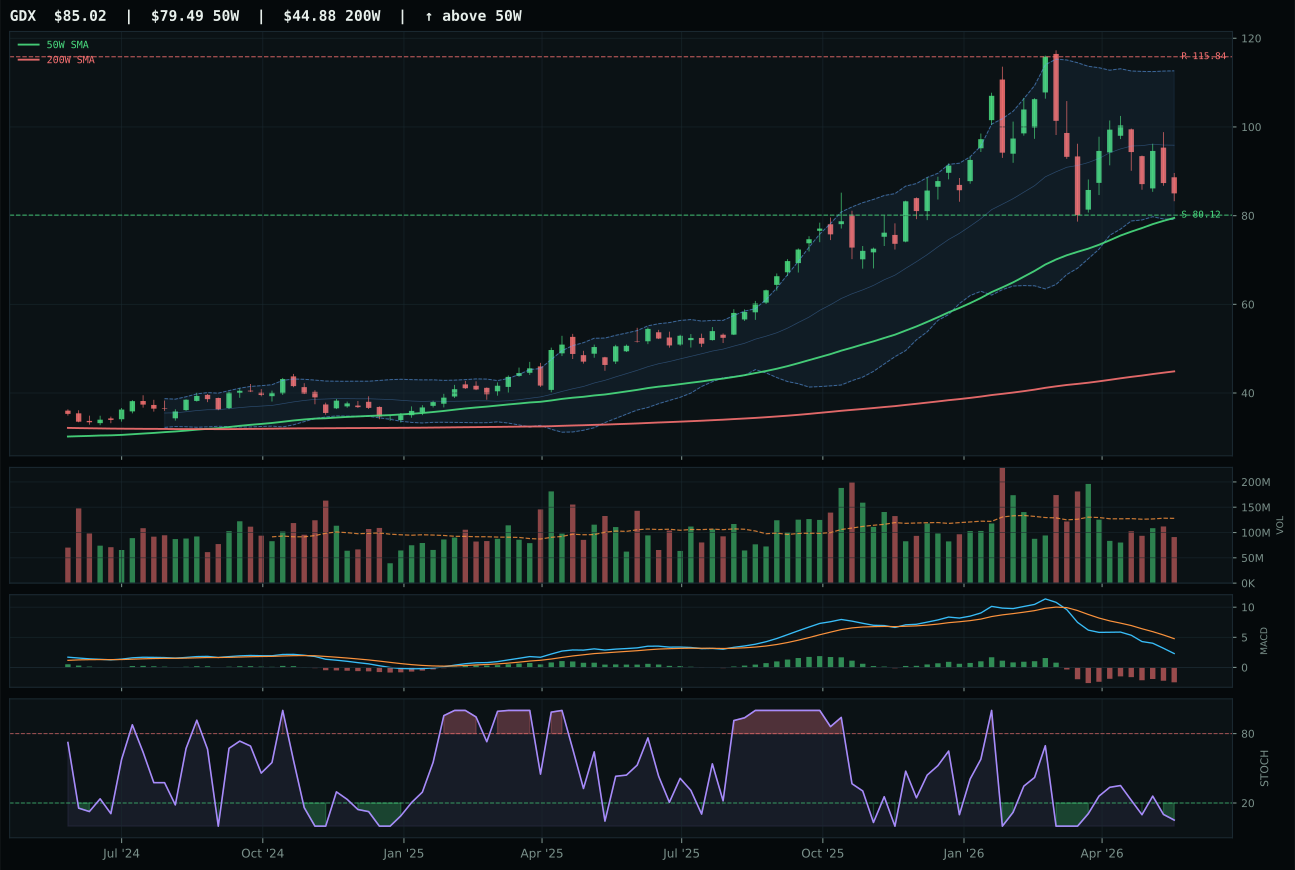
GDX has a neutral structure profile with -28.1% 13-week relative strength versus SPY.
A failed hold above support would weaken the setup.
Actionable but governed by invalidation levels.
GLD wins Precious Metals with a 5.2-point margin over SLV by offering superior timing: price sits at neutral distance (7.5%) from the 50-week moving average at the middle retracement/decision zone (Fib 0.500), whereas SLV is 24.9% extended into vertical territory and showing weaker risk/reward (52.2 versus 89.7). Both are technically broken—GLD shows 0.0% thirteen-week momentum with bearish/weakening MACD and oversold stochastic RSI—but GLD's risk/reward advantage of 89.7 is crucial: upside to resistance is−14.5% while downside to support is only 7.1%, creating an asymmetric setup where the downside is defined and small. SLV's spread is worse at 52.2 because upside is constrained and downside risk is larger. Volume is thin across both (0.38x and neutral participation), confirming that gold and silver lack institutional accumulation; the category is held defensively rather than offensively, appropriate for a transition regime where risk appetite is mixed.
Precious Metals ranks 9th at 35.6 with 0% allocation this week because the category-level technical evidence collapsed to 30.4% for GLD and 27.9% for SLV, while macro fit of 46.0 cannot overcome the absence of any meaningful momentum confirmation. The reasoned ETF proof order shows SLV at 35.5 and GLD at 35.0, meaning the entire category is operating below the threshold for active positioning; both ETFs show 0/100 momentum confirmation from negative 13-week returns, weak relative strength, and bearish MACD. Risk appetite descriptor is actively working against metals (marked -4), and while inflation pressure and supply shortage are active, they're insufficient to justify capital allocation when the technicals offer zero sponsorship for ownership. The category would regain allocation if GLD reversed its MACD above the zero line while stochastic rose above 20, signaling institutional re-entry; until then, Precious Metals is simply outside the portfolio, ranking below Nuclear Energy (38.7) and Utilities (42.4). This is a clean exclusion based on lack of technical confirmation, not a macro forecasting call.