
2026-05-15
Informational purposes only. The content in this report, including allocations, analysis, and commentary, is provided solely for informational and educational purposes. It does not constitute financial advice, investment advice, trading advice, or any other type of advice. Past performance does not guarantee future results. Always conduct your own research and consult a qualified financial professional before making investment decisions.
Weekly Allocation
| Ticker | Category | Weight | Role |
|---|---|---|---|
| XLE | Traditional Energy | 20% | Top-2 (20%) |
| SMH | AI | 20% | Top-2 (20%) |
| CIBR | Technology | 10% | Tier-2 (10%) |
| WEAT | Agriculture & Livestock | 10% | Tier-2 (10%) |
| PICK | Industrial Metals | 10% | Tier-2 (10%) |
| URA | Nuclear Energy | 10% | Tier-2 (10%) |
| ROKT | Defense & Aerospace | 10% | Tier-2 (10%) |
| PAVE | Utilities & Infrastructure | 10% | Tier-2 (10%) |
Trade Instructions — Monday Open
Sell the tranche from 2026-04-17 (completing its 4-week hold). Buy the new tranche. Instructions show net portfolio changes — same-asset positions cancel, weight changes show the delta.
| Action | Ticker | Instruction |
|---|---|---|
| SELL | MOO | Sell 67% of MOO position (reduce 7.50% → 2.50%) |
| SELL | ILF | Sell entire ILF position (2.50% of portfolio) |
| SELL | REMX | Sell 25% of REMX position (reduce 10.00% → 7.50%) |
| SELL | XLK | Sell 33% of XLK position (reduce 7.50% → 5.00%) |
| BUY | SMH | Buy SMH — 20.00% of freed cash (adds 2.50% to portfolio) |
| BUY | WEAT | Buy WEAT — 20.00% of freed cash (adds 2.50% to portfolio) |
| BUY | CIBR | Buy CIBR — 20.00% of freed cash (adds 2.50% to portfolio) |
| BUY | ROKT | Buy ROKT — 20.00% of freed cash (adds 2.50% to portfolio) |
| BUY | PICK | Buy PICK — 20.00% of freed cash (adds 2.50% to portfolio) |
Current Portfolio After Trade
Combined holdings across all 4 active tranches. Each tranche is 25% of the portfolio.
| Ticker | % of Portfolio | Weight Bar |
|---|---|---|
| SMH | 20.00% | |
| XLE | 17.50% | |
| PAVE | 10.00% | |
| URA | 10.00% | |
| REMX | 7.50% | |
| WEAT | 7.50% | |
| XLK | 5.00% | |
| IEMG | 5.00% | |
| CIBR | 5.00% | |
| ROKT | 5.00% | |
| MOO | 2.50% | |
| COPX | 2.50% | |
| PICK | 2.50% |
Macro Regime — Transition / Mixed
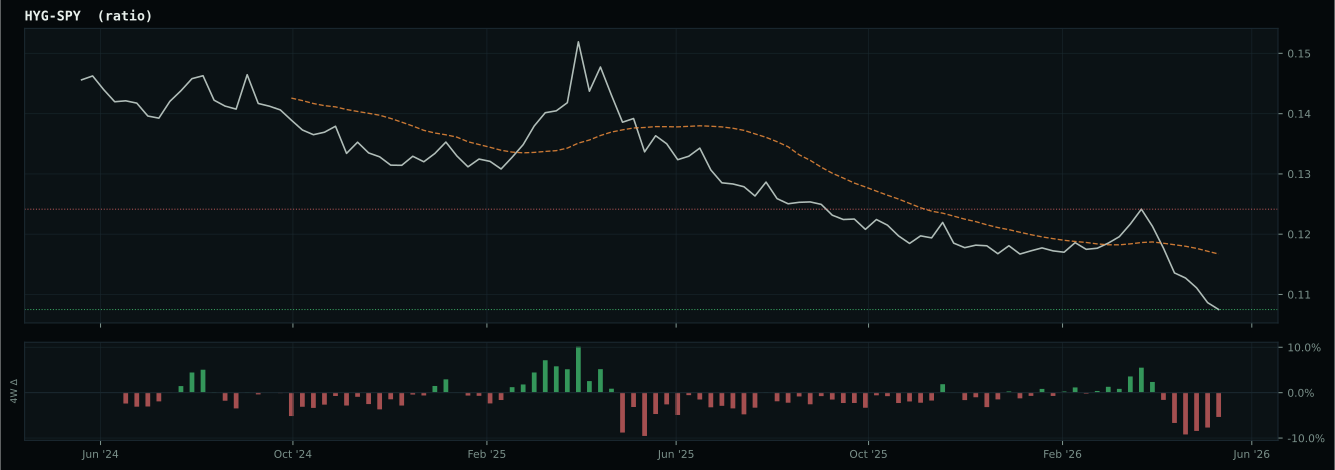
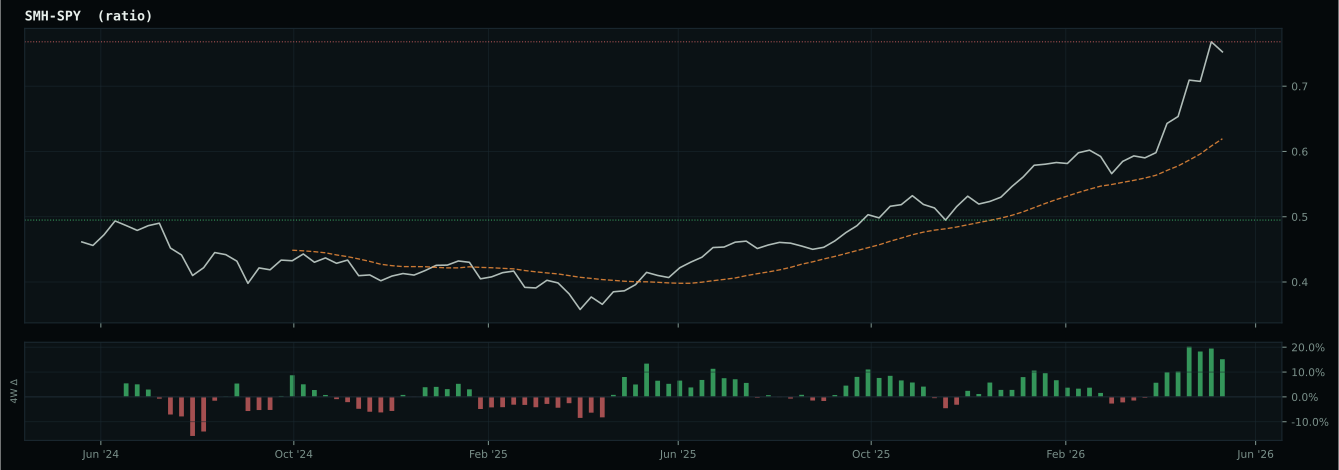
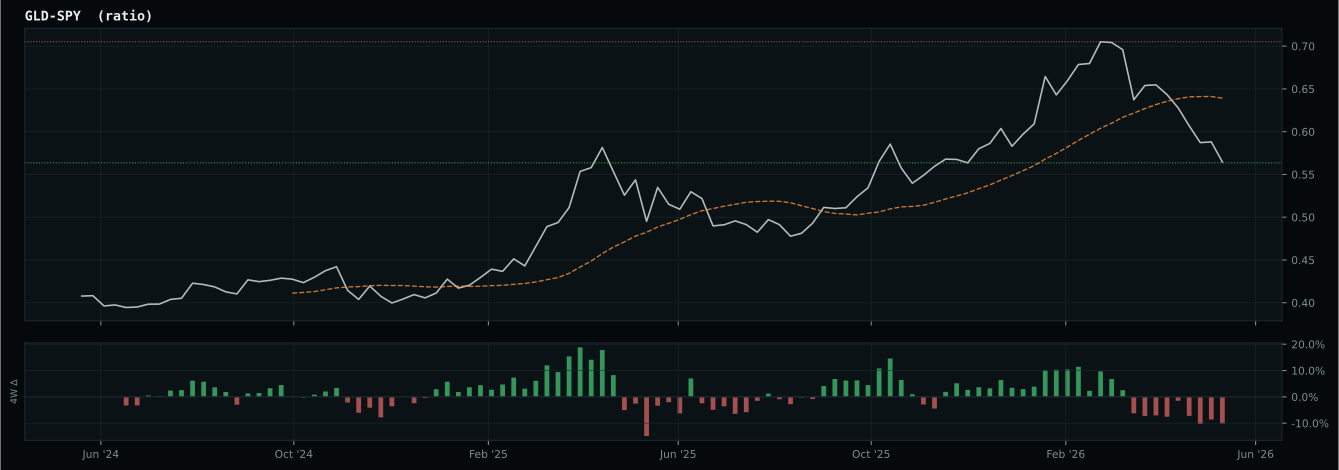
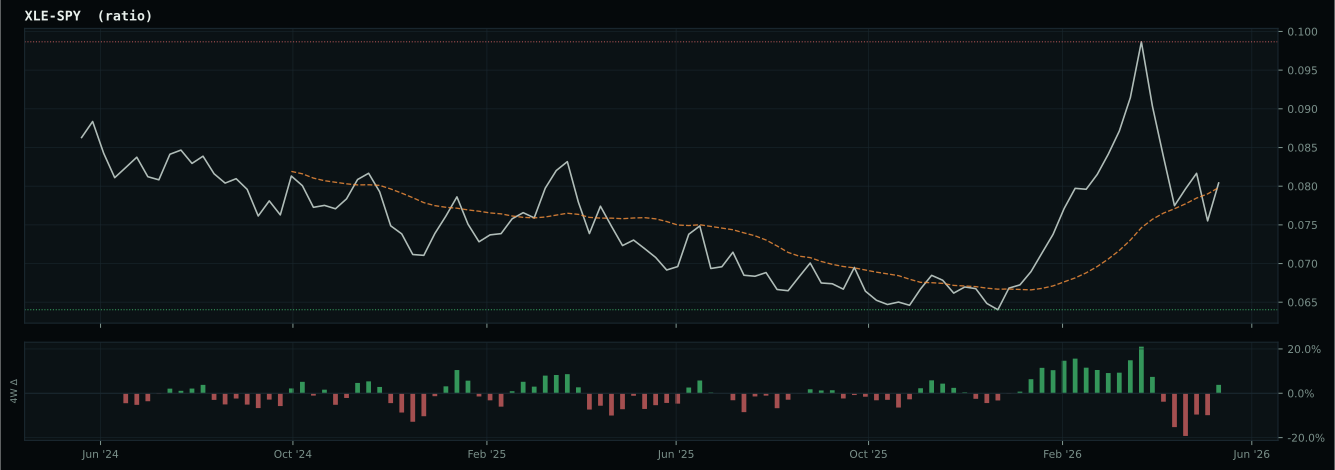
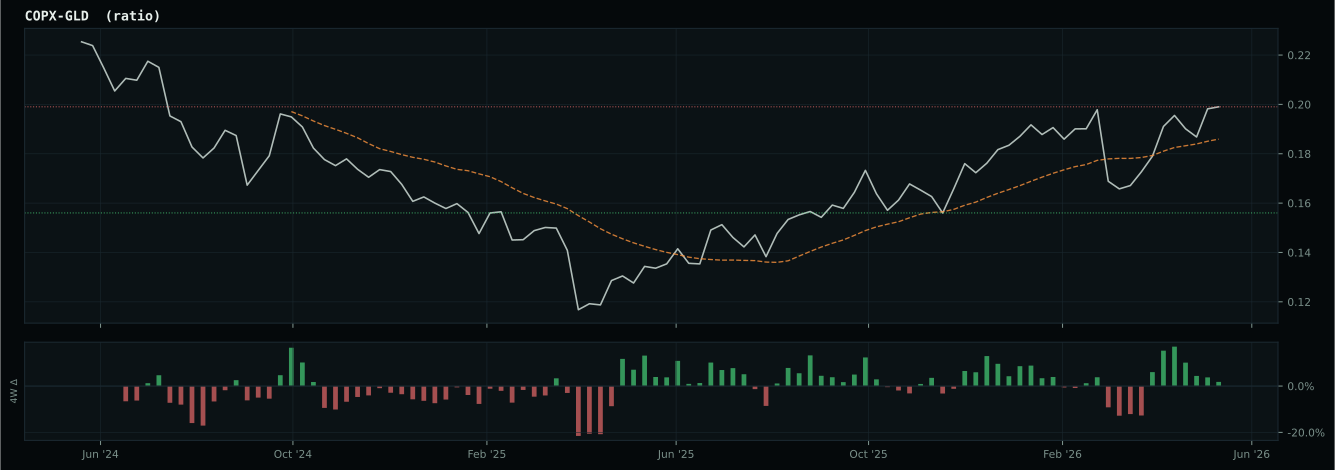
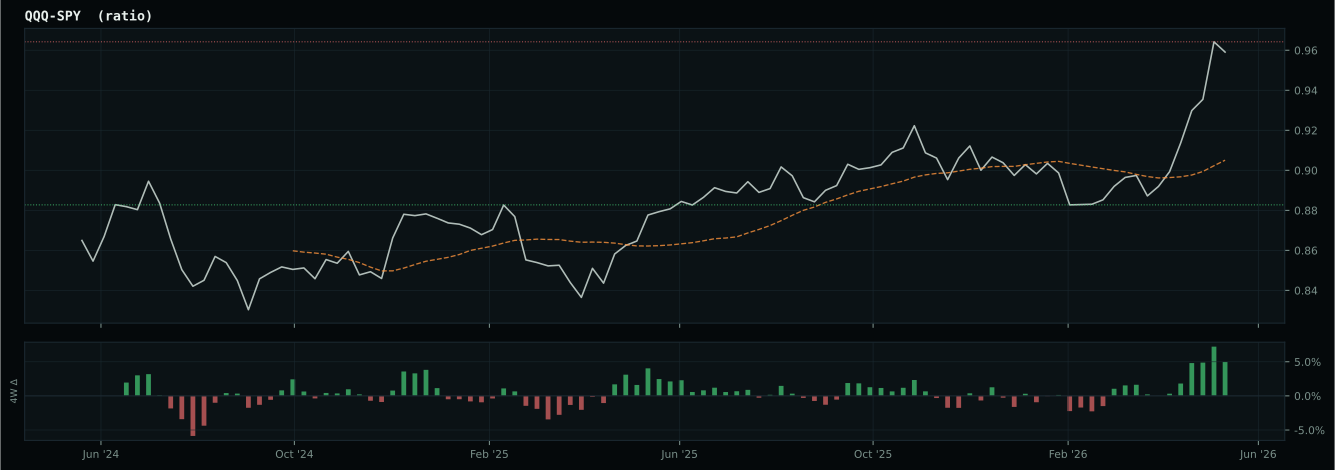
Macro Evidence Charts
Market-implied signals behind the macro regime scores. Each ratio compares two assets; the direction and slope of the ratio is what the macro engine reads.
Crypto Regime — NoCrypto
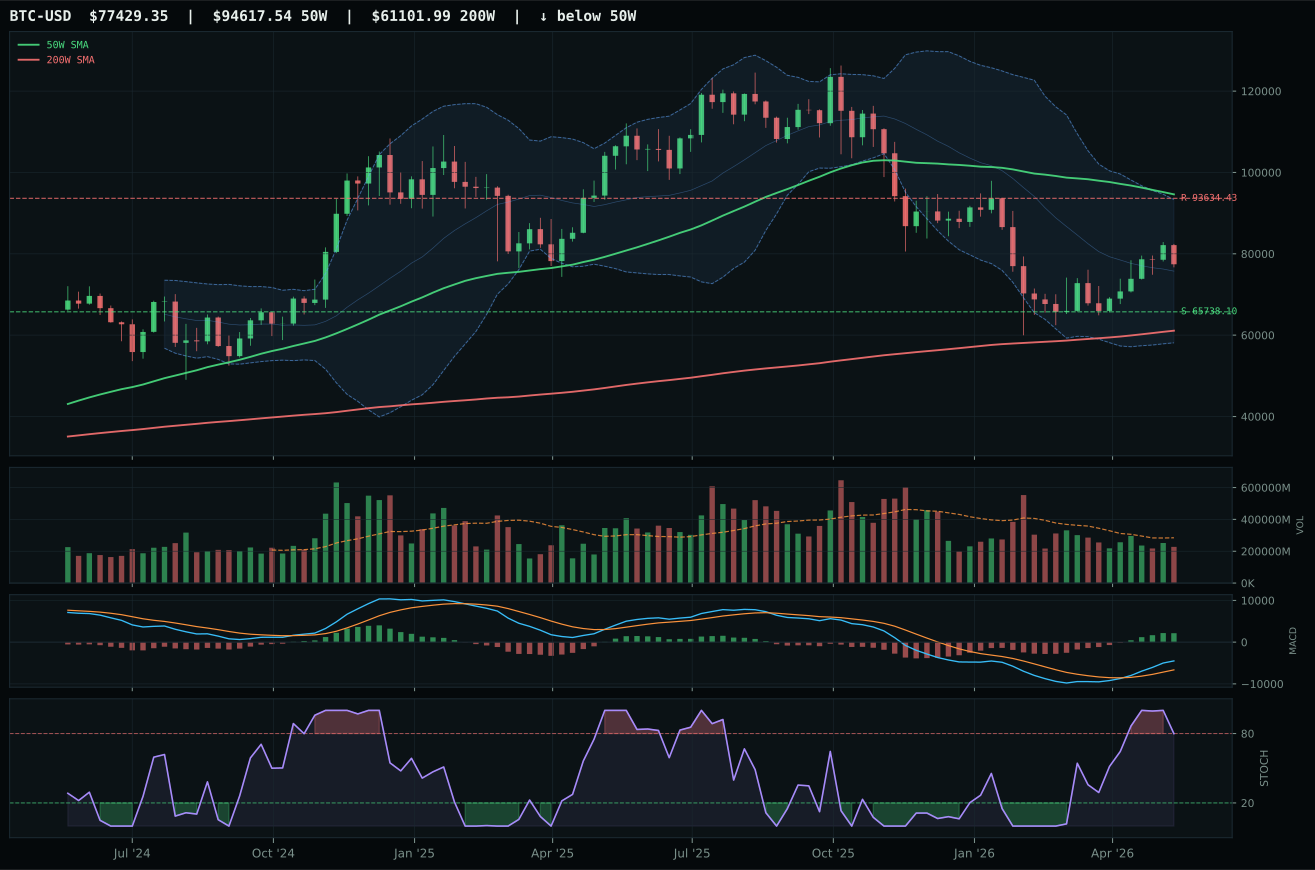
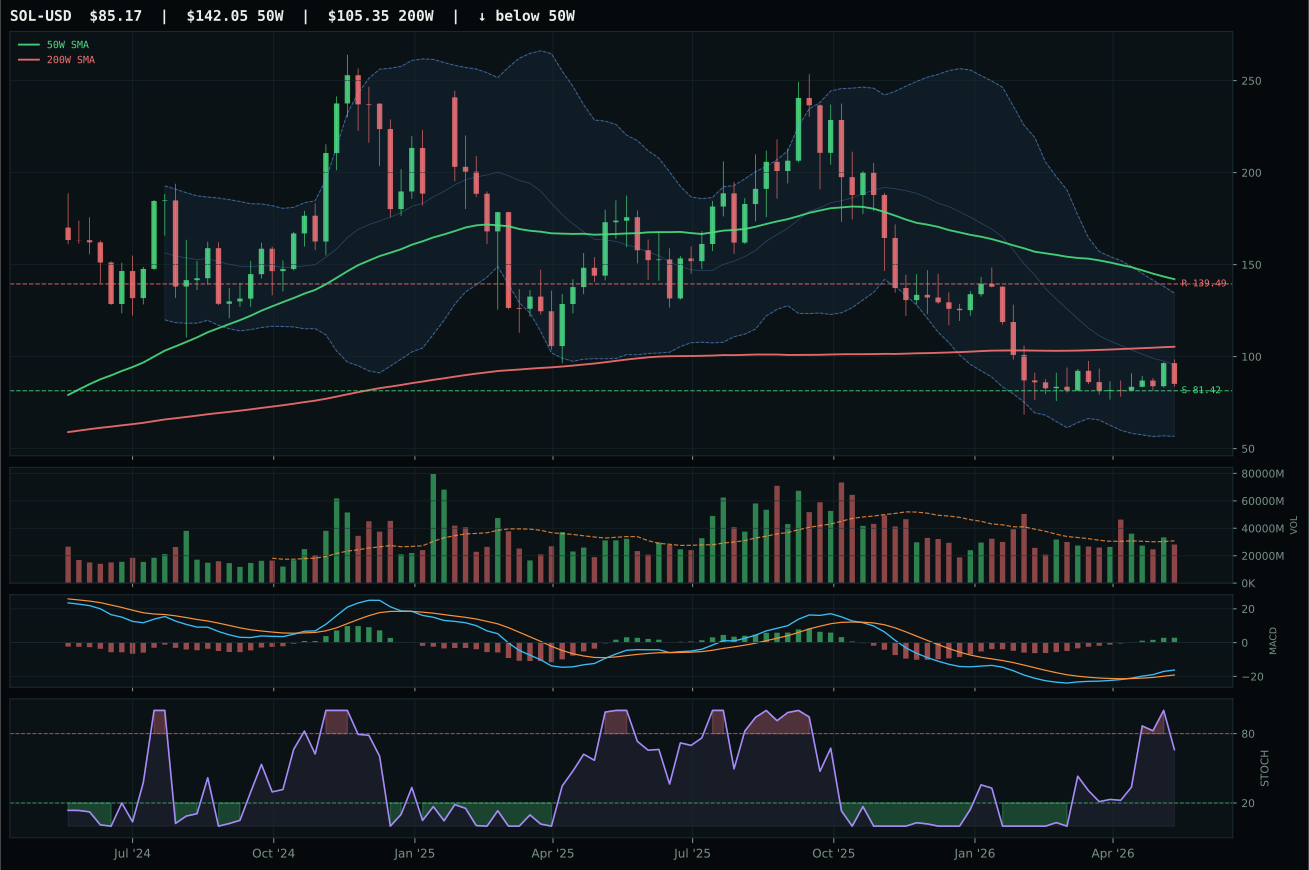
ValueBTC armed; waiting for 50W reclaim, decisive close above post-touch range resistance by 3%, breakout volume above 20W average
TrendBTC not confirmed
one or more available conditions failed
Category Rankings
| Rank | Category | Winner | Score | Alloc | 4W Ret | Peers (4W) |
|---|---|---|---|---|---|---|
| 1 | Traditional Energy | XLE | 68.1 | 20% | -6.65% | XOP -8.9% · FCG -9.9% |
| 2 | AI | SMH | 62.6 | 20% | +13.80% | AIQ +7.4% · BOTZ -4.8% |
| 3 | Technology | CIBR | 61.3 | 10% | +9.75% | XLK +7.2% · IGV +1.2% |
| 4 | Agriculture & Livestock | WEAT | 53.4 | 10% | -11.46% | VEGI -2.9% · MOO -2.9% |
| 5 | Industrial Metals | PICK | 49.8 | 10% | +4.44% | REMX +1.0% · COPX +7.7% |
| 6 | Nuclear Energy | URA | 45.4 | 10% | -5.07% | NLR -4.0% · URNM -5.3% |
| 7 | Defense & Aerospace | ROKT | 42.0 | 10% | +1.73% | XAR +8.1% · ITA +8.3% |
| 8 | Utilities & Infrastructure | PAVE | 41.2 | 10% | +5.75% | IGF +0.4% · XLU +0.9% |
| 9 | Precious Metals | GLD | 38.5 | 0% | -4.84% | SLV -8.5% · GDX -3.6% |
| 10 | Emerging Markets | IEMG | 11.4 | 0% | +4.98% | ILF +1.0% · INDA +2.9% |
Traditional Energy — XLE
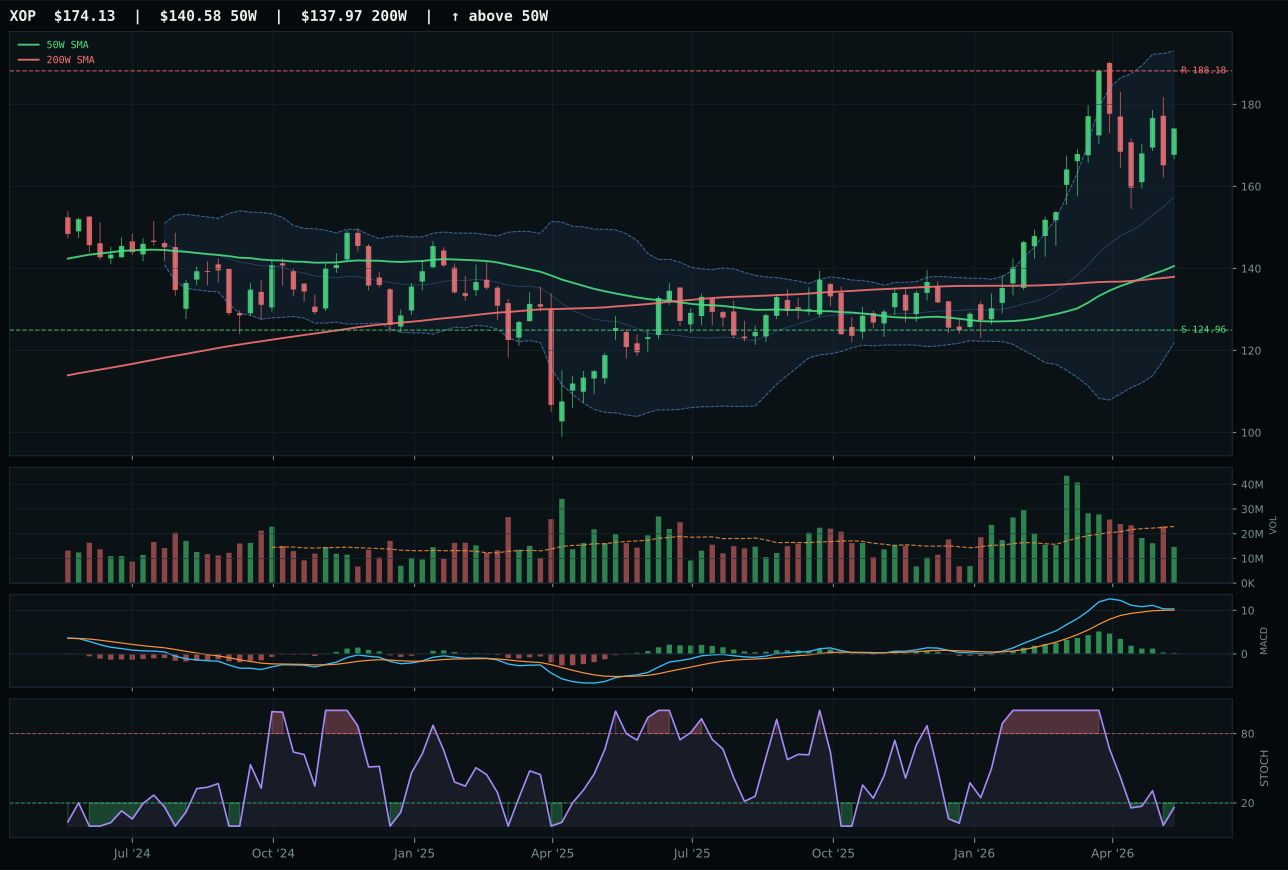
XOP has a vertical extension profile with 9.3% 13-week relative strength versus SPY.
A failed hold above support would weaken the setup.
Actionable but governed by invalidation levels.
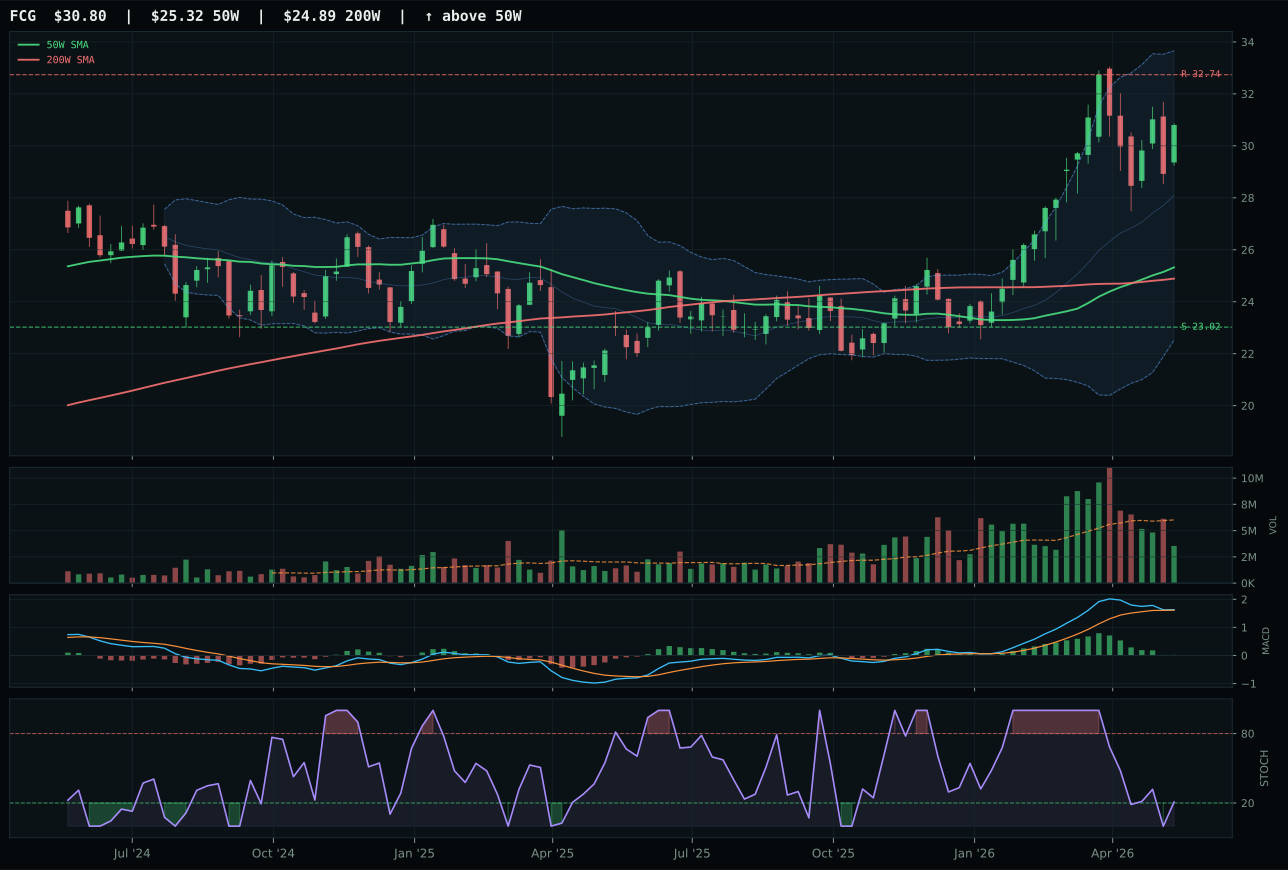
FCG has a vertical extension profile with 7.4% 13-week relative strength versus SPY.
A failed hold above support would weaken the setup.
Actionable but governed by invalidation levels.
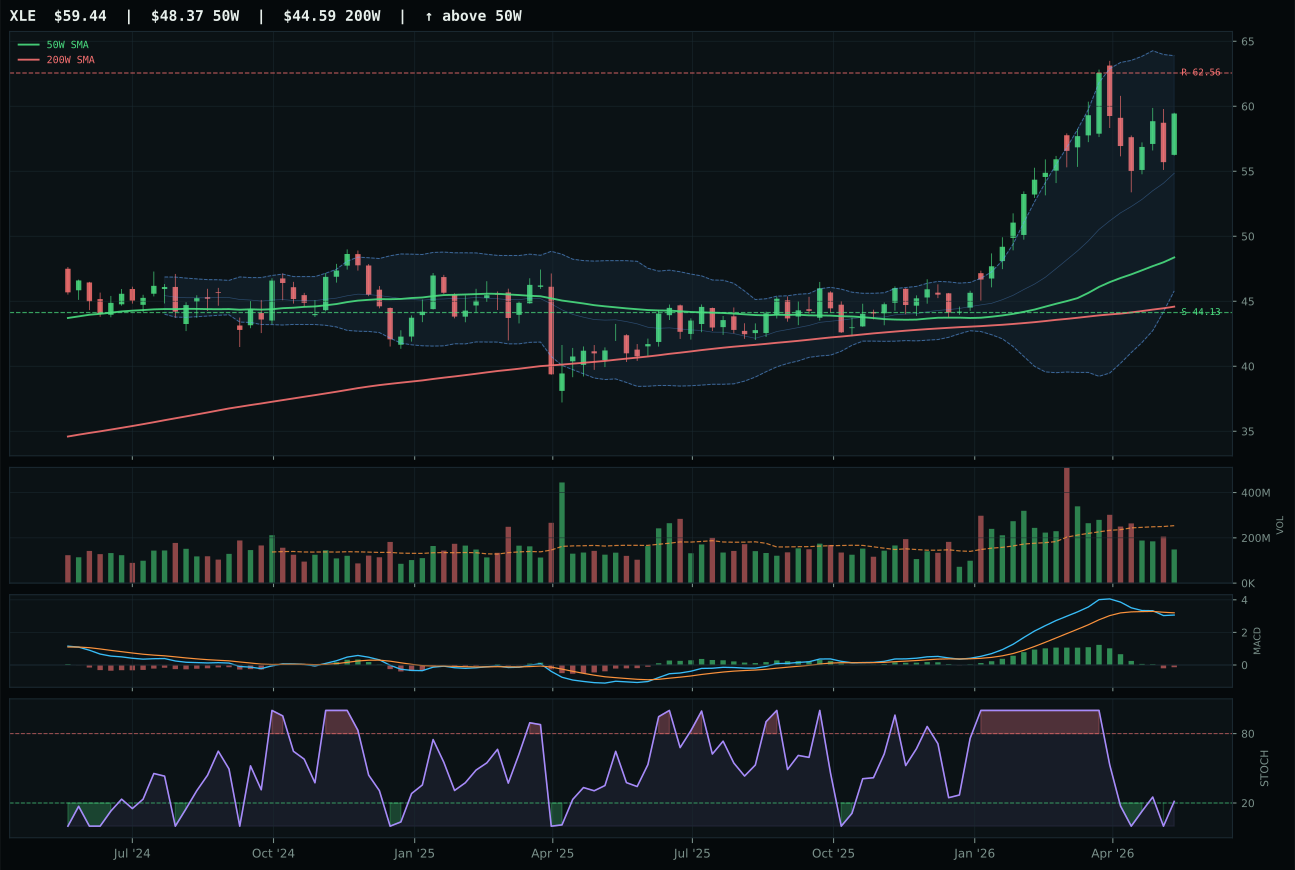
XLE has a vertical extension profile with 0.9% 13-week relative strength versus SPY.
A failed hold above support would weaken the setup.
Actionable but governed by invalidation levels.
XLE won the energy category through macro narrative dominance that overwhelmed unfavorable technical positioning, earning 20% top-2 allocation despite inferior chart action relative to runner-up XOP. XLE's technical evidence scored only 22.6/100—the weakest among three energy peers—yet macro/narrative fit of 86.0 carried the day, driven by energy scarcity active descriptor at +14, inflation pressure at +10, and supply shortage at +7. XOP actually delivered superior technical setup: 100.0 trend score versus XLE's 83.4, bullish/flattening MACD versus XLE's bearish/weakening deterioration, and superior 17.7% thirteen-week return versus XLE's 9.4%. However, XOP's timing score suffered (48.0 vs 56.0) due to oversold stochastic positioning that suggested exhaustion rather than accumulation. XLE's category-relative strength of -6.5% reveals it is underperforming peers, yet the integrated energy narrative of cash-flow defense across commodity cycles justifies portfolio commitment when energy scarcity signals are this strong. The allocation decision reflects macro regime dominance over pure technical merit.
Traditional Energy earned 20% top-2 allocation status because the Transition / Mixed macro regime has crystallized an energy scarcity bias that transcends normal technical selection. Category-level macro fit of 85.0 is the highest score across all ten categories, driven by +16 energy scarcity weighting, +10 inflation pressure, +9 supply shortage, and +7 real asset sponsorship—creating a +42 macro momentum that overwhelms XLE's weak technical evidence. The portfolio allocation prioritizes macro thematic strength over individual ETF momentum; XLE's bearish/weakening MACD and thin 0.59x volume participation would normally disqualify a top-2 position, yet the combination of energy supply concerns, inflation persistence, and real-asset sponsorship makes this category the highest-conviction macro call in this week's regime. Energy's 20% allocation is paired with AI semiconductors' 20% to create a barbell: energy captures inflation and scarcity hedges while semiconductors capture growth and AI infrastructure bets. For this allocation to deteriorate, energy scarcity signals would need to reverse—specifically, a return to OPEC production increases and inventory builds would trigger category-level rerating, but current signals point toward sustained supply tension.
AI — SMH
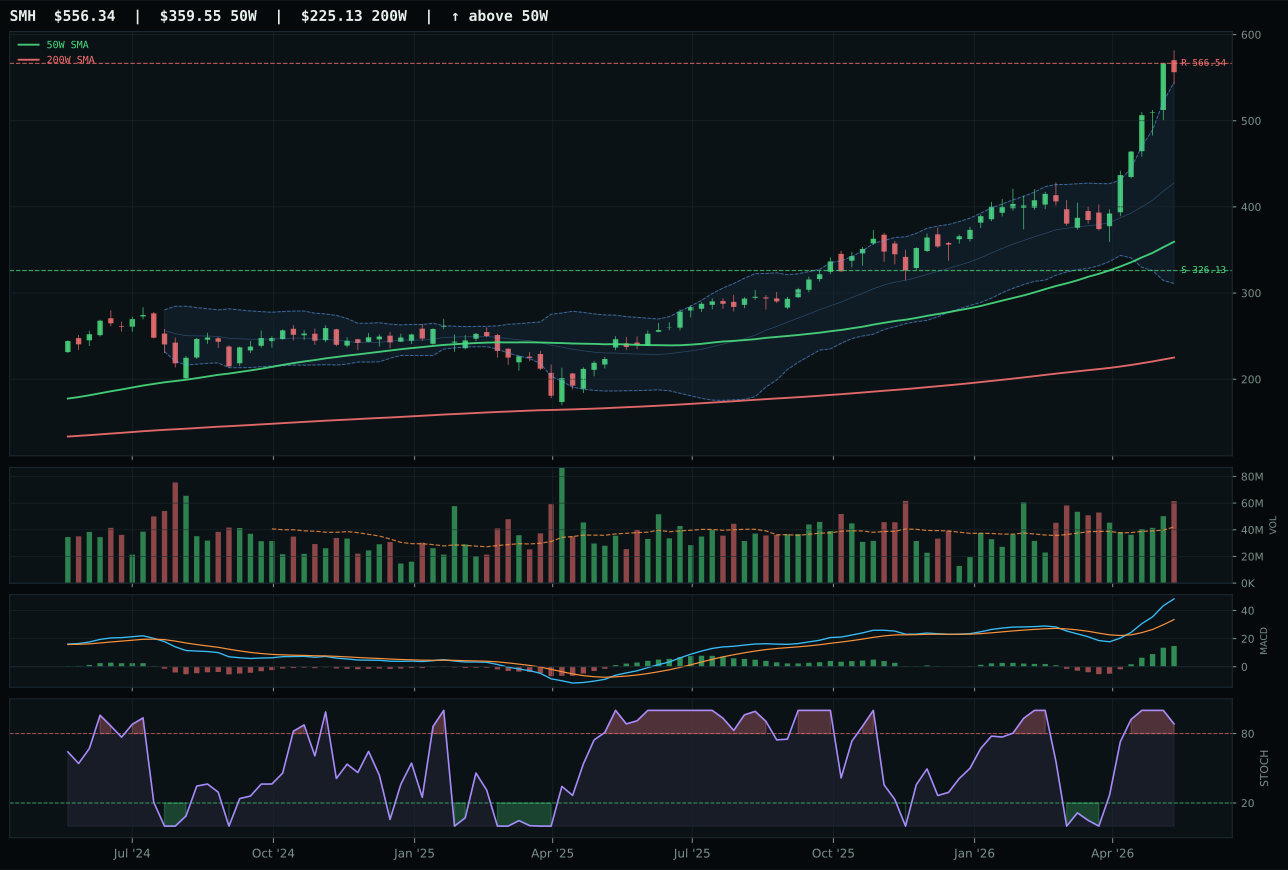
SMH has a vertical extension profile with 28.0% 13-week relative strength versus SPY.
A failed hold above support would weaken the setup.
Actionable but governed by invalidation levels.
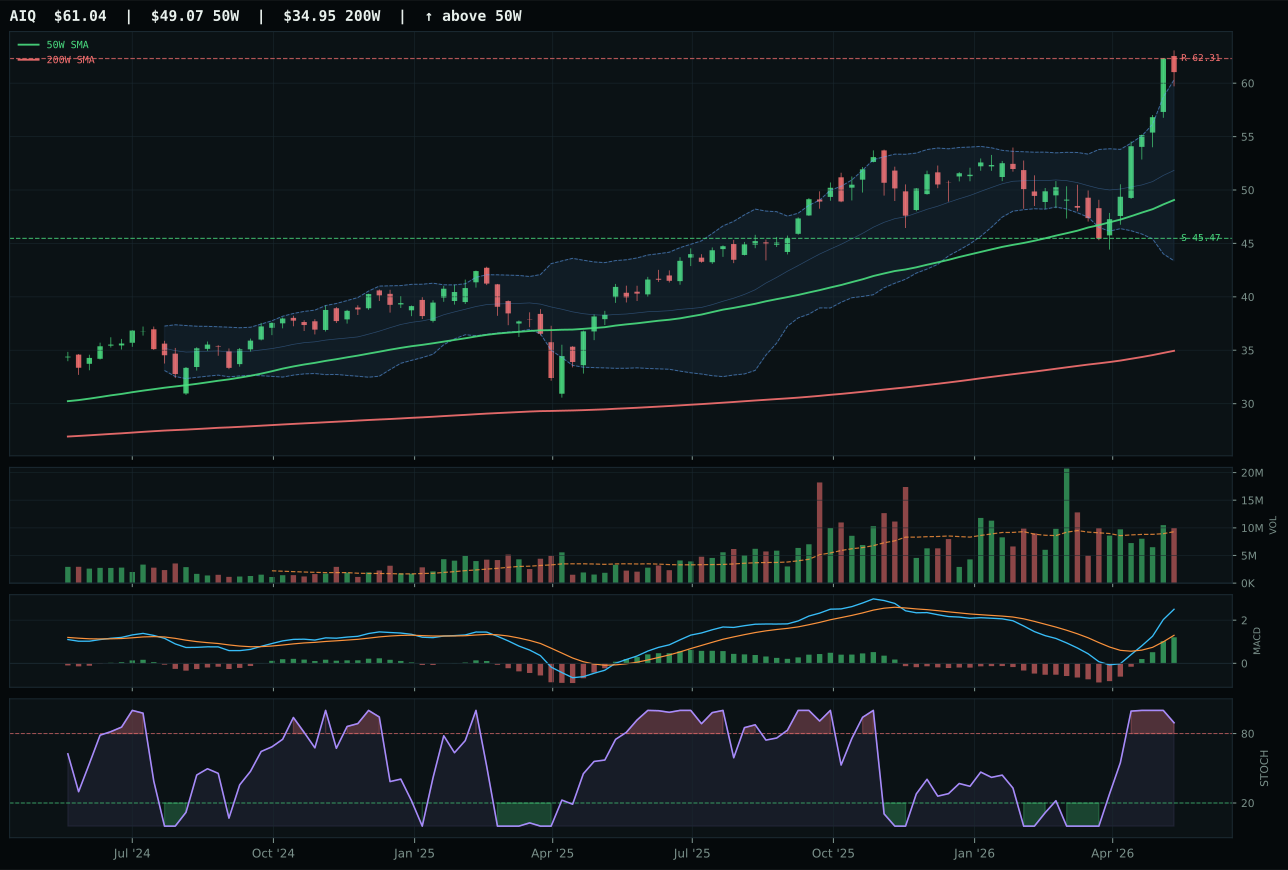
AIQ has a vertical extension profile with 15.0% 13-week relative strength versus SPY.
A failed hold above support would weaken the setup.
Actionable but governed by invalidation levels.
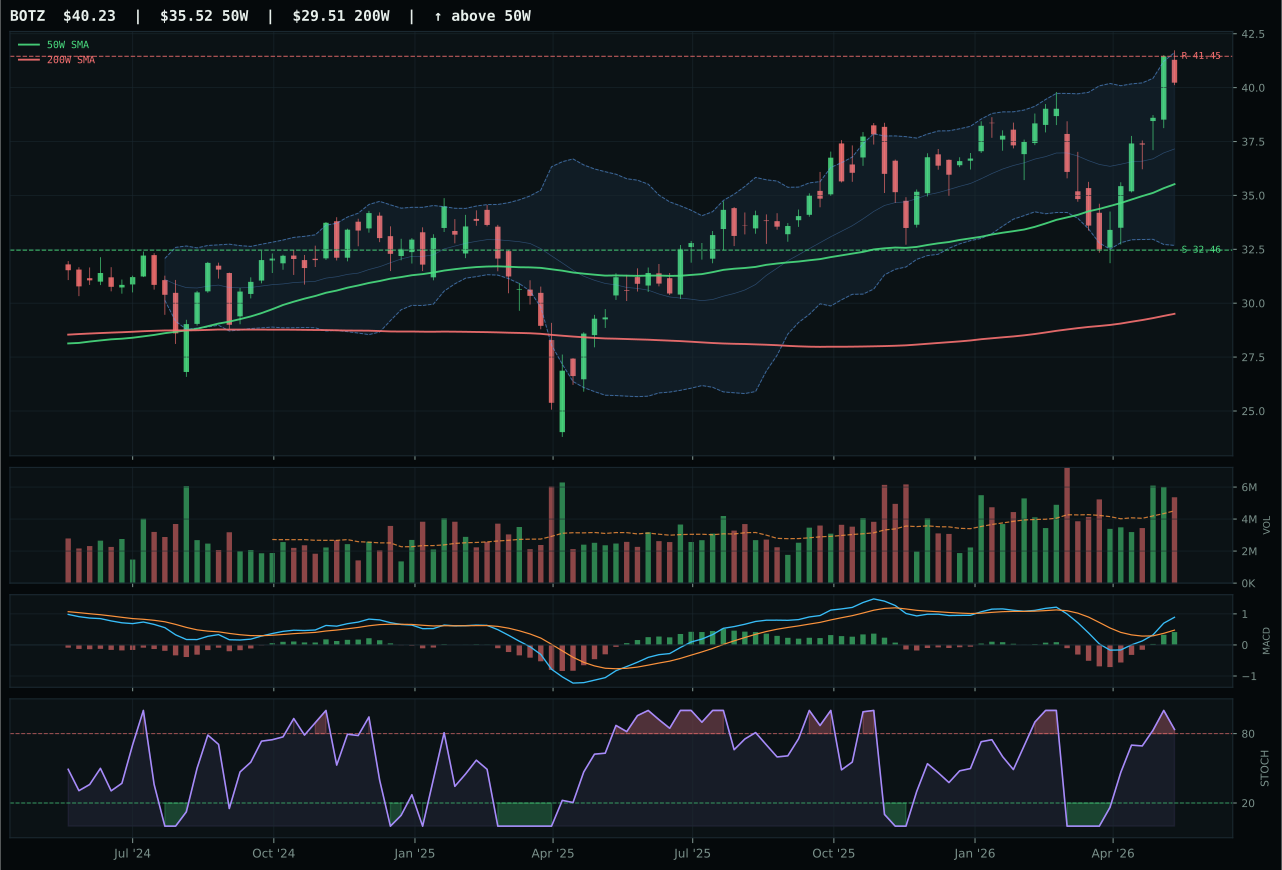
BOTZ has a neutral structure profile with -3.5% 13-week relative strength versus SPY.
A failed hold above support would weaken the setup.
Actionable but governed by invalidation levels.
SMH won the AI category because it combined superior momentum sponsorship with above-average volume participation, two drivers that XLK and AIQ could not match simultaneously. The semiconductor leader posted 28.0% relative strength versus SPY—nearly double AIQ's 15.0%—while maintaining 1.46x average volume confirmation, proving institutional demand is present and active. SMH's 13-week return of 36.5% sits atop AIQ's 23.4%, establishing hierarchy in actual capital flows rather than theoretical momentum. The vertical extension setup at 54.7% above the 50-week moving average triggered timing compression (27.0 score), penalizing SMH for valuation risk, yet the stochastic RSI rolling over from overbought rather than grinding higher suggests smart money is taking profits, not panic selling—classic accumulation behavior in late-stage moves. AIQ's neutral volume and lagging category-relative strength of 0.0% reveal it has exhausted peer sponsorship; buyers have rotated to SMH's compute thesis, leaving broad AI software exposure as yesterday's leader.
AI earned 20% allocation as the portfolio's second-largest commitment because the 62.6 final score reflects robust technical evidence (74.7/100) paired with the cycle's dominant macro narrative. AI growth sponsorship adds +14 to category reasoning, and risk appetite remains active at +10, creating tailwinds that overcome credit stress headwinds (-8). SMH's extended chart and thin volume participation would normally disqualify a position for larger allocation, but the semiconductor supply-scarcity narrative—especially for chips serving AI inference and training—makes this position defensible in a Transition / Mixed regime. The portfolio allocates here despite timing risk because energy, the top-ranked category, offers superior real-asset inflation protection while still retaining strong momentum; AI provides upside participation in a scenario where economic growth and risk appetite stabilize. This dual weighting balances deflation hedges (energy commodities) against inflation and growth bets (semiconductor compute), creating macro insurance within a single allocation decision.
Technology — CIBR
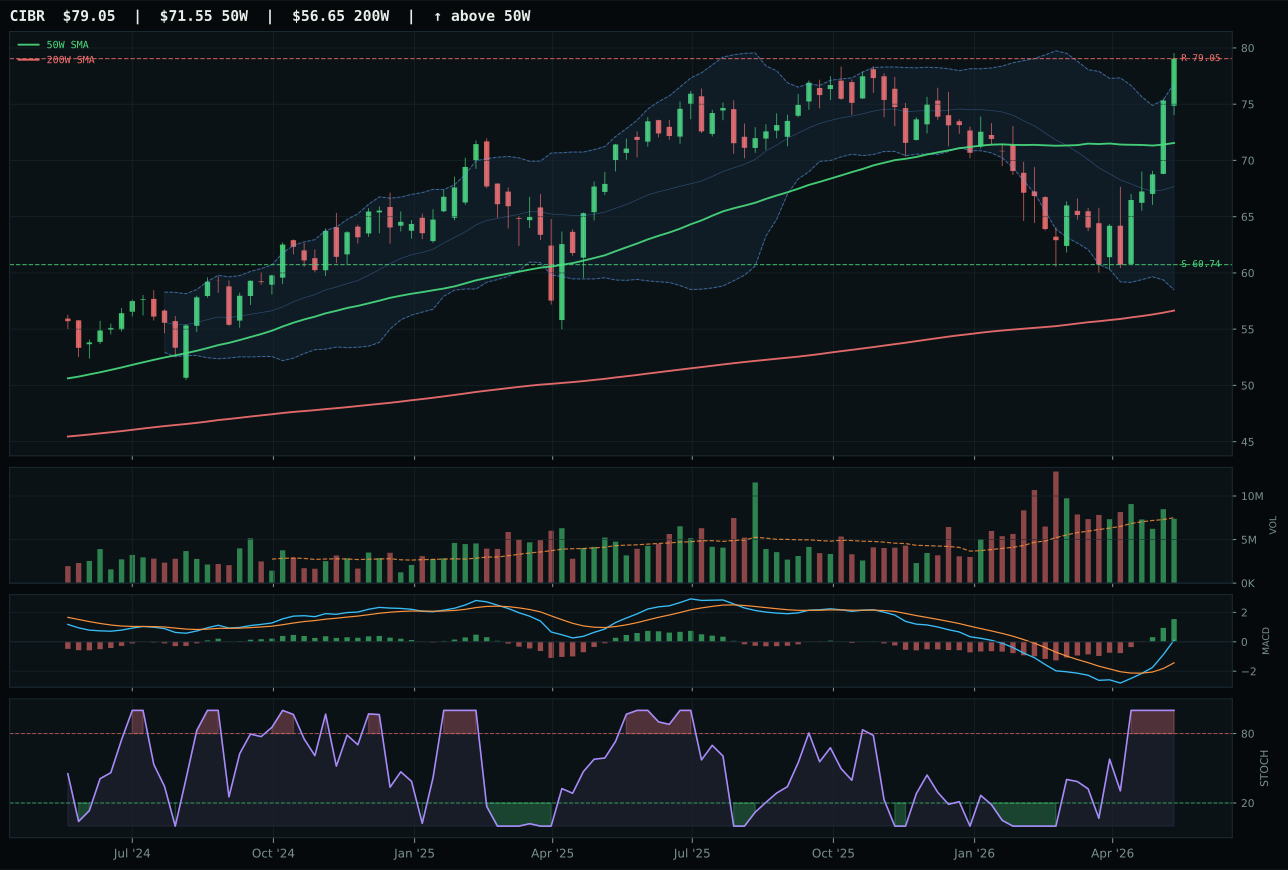
CIBR has a neutral structure profile with 9.9% 13-week relative strength versus SPY.
A failed hold above support would weaken the setup.
Actionable but governed by invalidation levels.
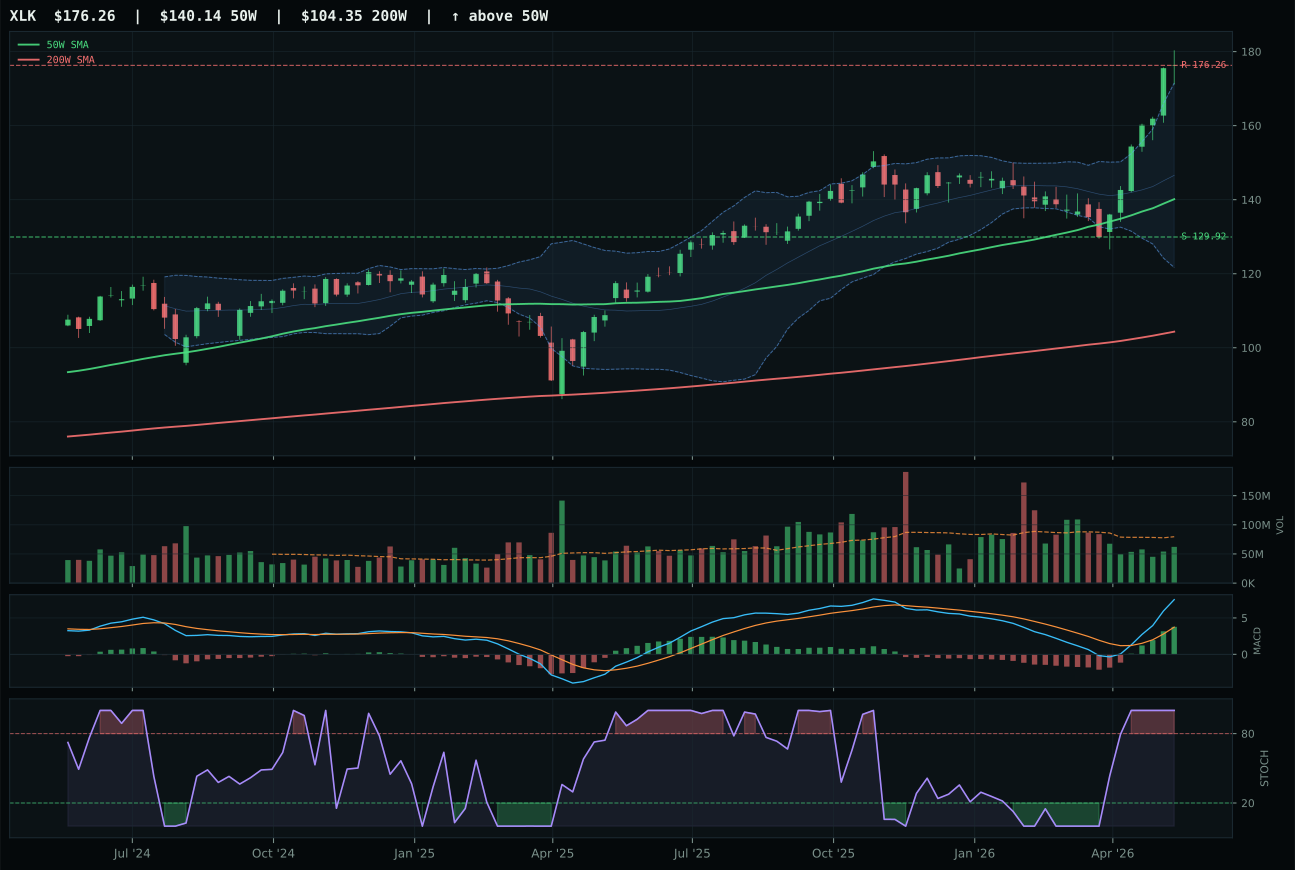
XLK has a vertical extension profile with 17.9% 13-week relative strength versus SPY.
A failed hold above support would weaken the setup.
Actionable but governed by invalidation levels.
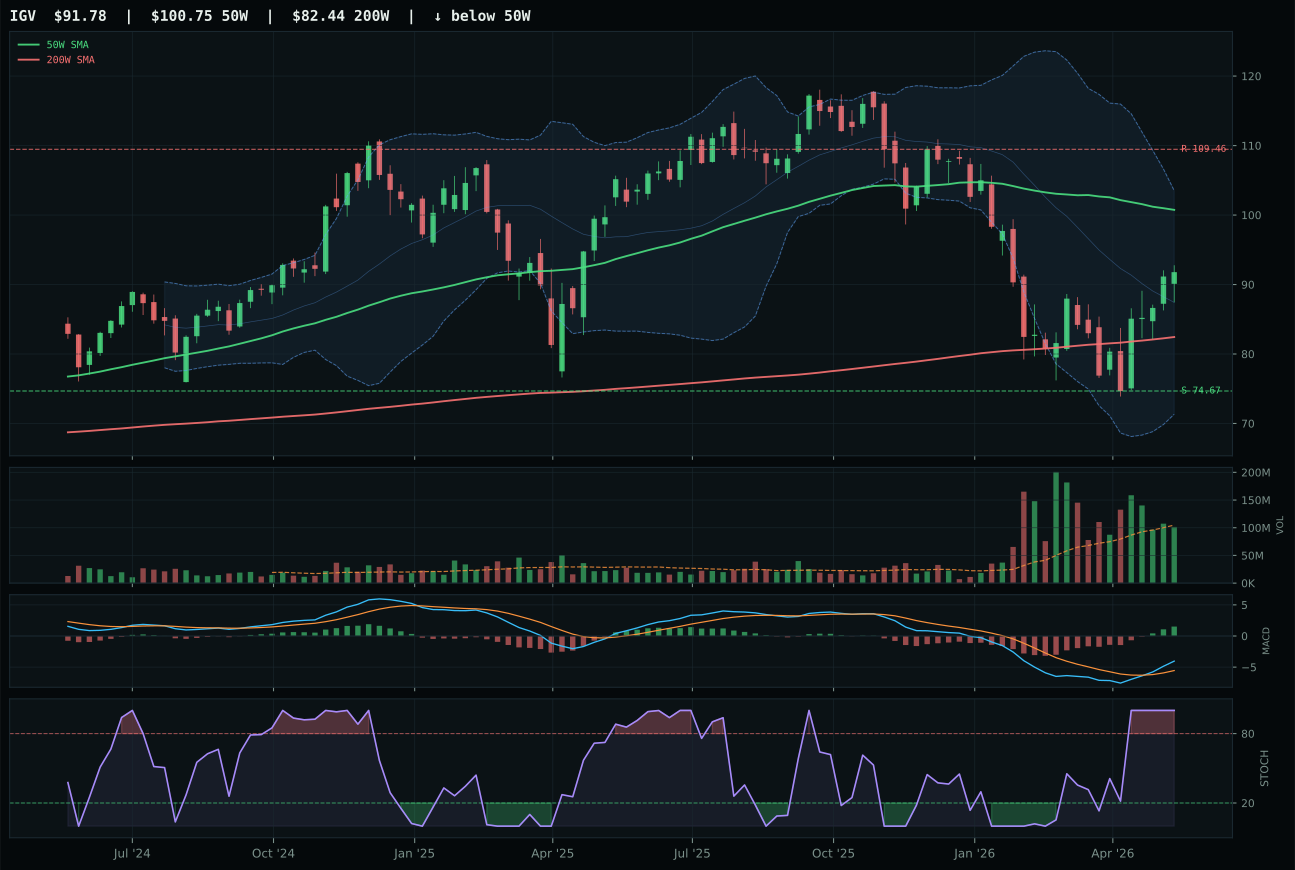
IGV has a neutral structure profile with 2.5% 13-week relative strength versus SPY.
A failed hold above support would weaken the setup.
Actionable but governed by invalidation levels.
CIBR defeated XLK by maintaining tighter timing control and preserving capital flexibility. While XLK pushed 25.8% above its 50-week moving average with a vertical extension setup, CIBR held just 10.5% away from trend, allowing the allocation system to accumulate on remaining strength without overpaying for entry. CIBR's neutral structure and balanced 9.9% relative strength versus SPY translated to real advantage over XLK's 17.9% SPY-relative move, which signals late-stage buyer exhaustion rather than new institutional demand. MACD remains bullish and improving for both, but CIBR's stochastic RSI reading at the overbought ceiling with inventory intact suggests the chart still has sponsorship, whereas XLK's similar momentum reading at extreme extension means every new buyer is paying maximum premium. The 17.2-point score gap reflects CIBR's cybersecurity focus as a steadier technology narrative during a transition regime where broad AI euphoria—favoring XLK—collides with lingering credit stress.
Technology earned 10% allocation rather than top-2 status because the category's 61.3 final score lagged both energy and semiconductors in risk-adjusted merit. The macro regime shift to Transition / Mixed penalizes pure software and compute exposure; while AI growth sponsorship adds +6 to the category reasoning, active credit stress subtracts -7, creating neutral-to-negative net tailwinds. CIBR's setup is clean and timed well, but the broader category lacks the real-asset inflation hedge and supply-scarcity narratives fueling energy and metals higher. What would push Technology to top-2 status is either a reset in credit risk indicators or confirmation that CIBR can hold above its 50W without rolling over into its 72.4 support level—that inflection would signal conviction from large buyers that cybersecurity infrastructure spending persists regardless of macro uncertainty.
Agriculture & Livestock — WEAT
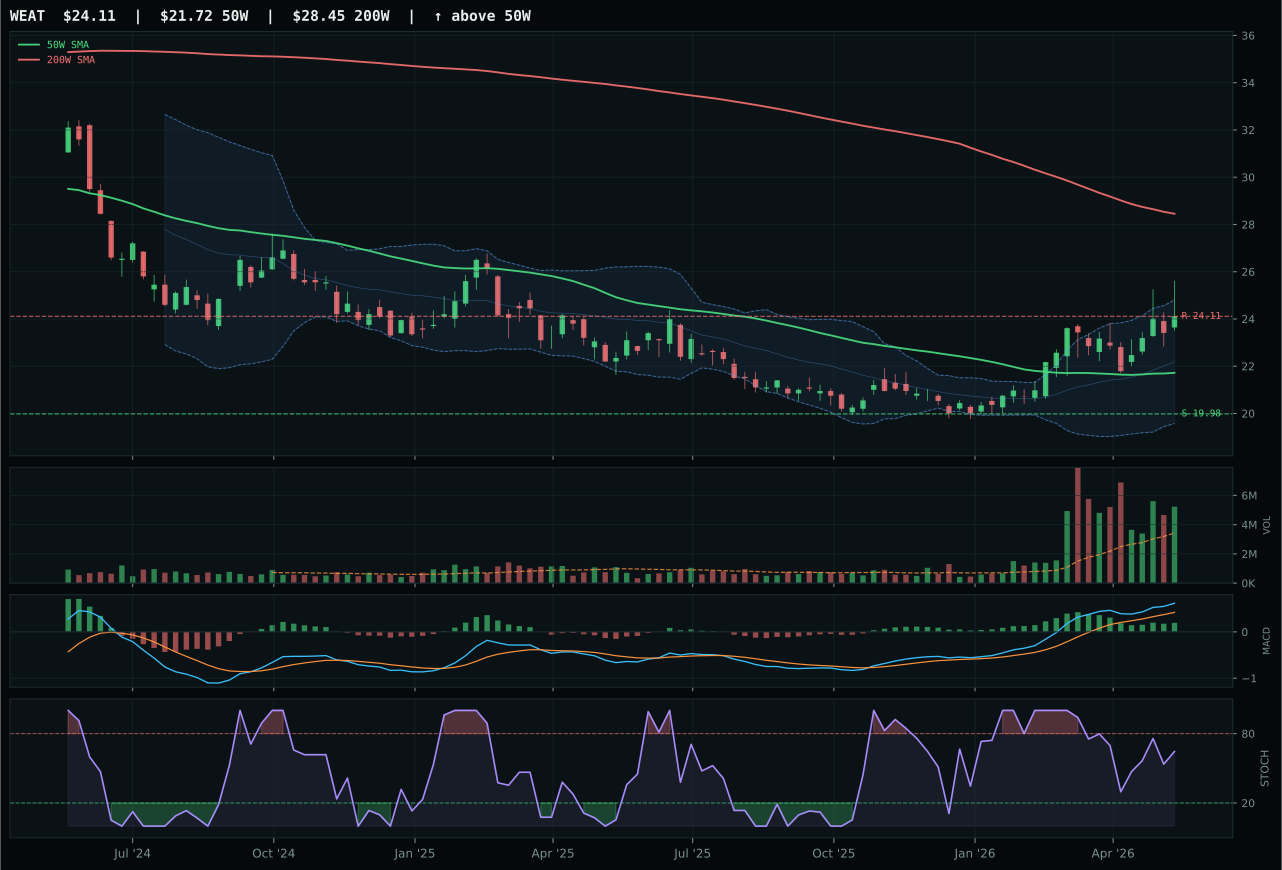
WEAT has a neutral structure profile with 6.5% 13-week relative strength versus SPY.
A failed hold above support would weaken the setup.
Actionable but governed by invalidation levels.
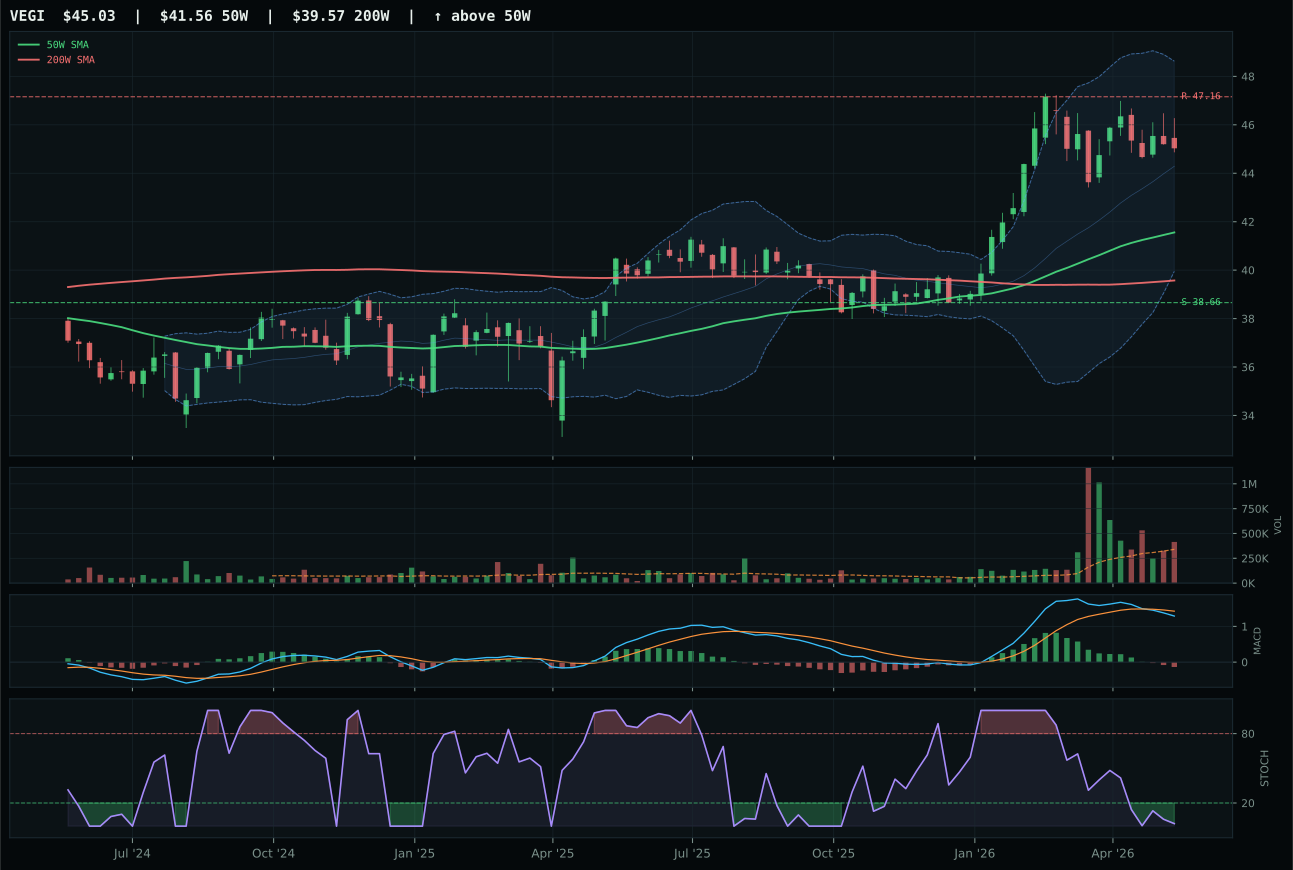
VEGI has a neutral structure profile with -10.2% 13-week relative strength versus SPY.
A failed hold above support would weaken the setup.
Actionable but governed by invalidation levels.
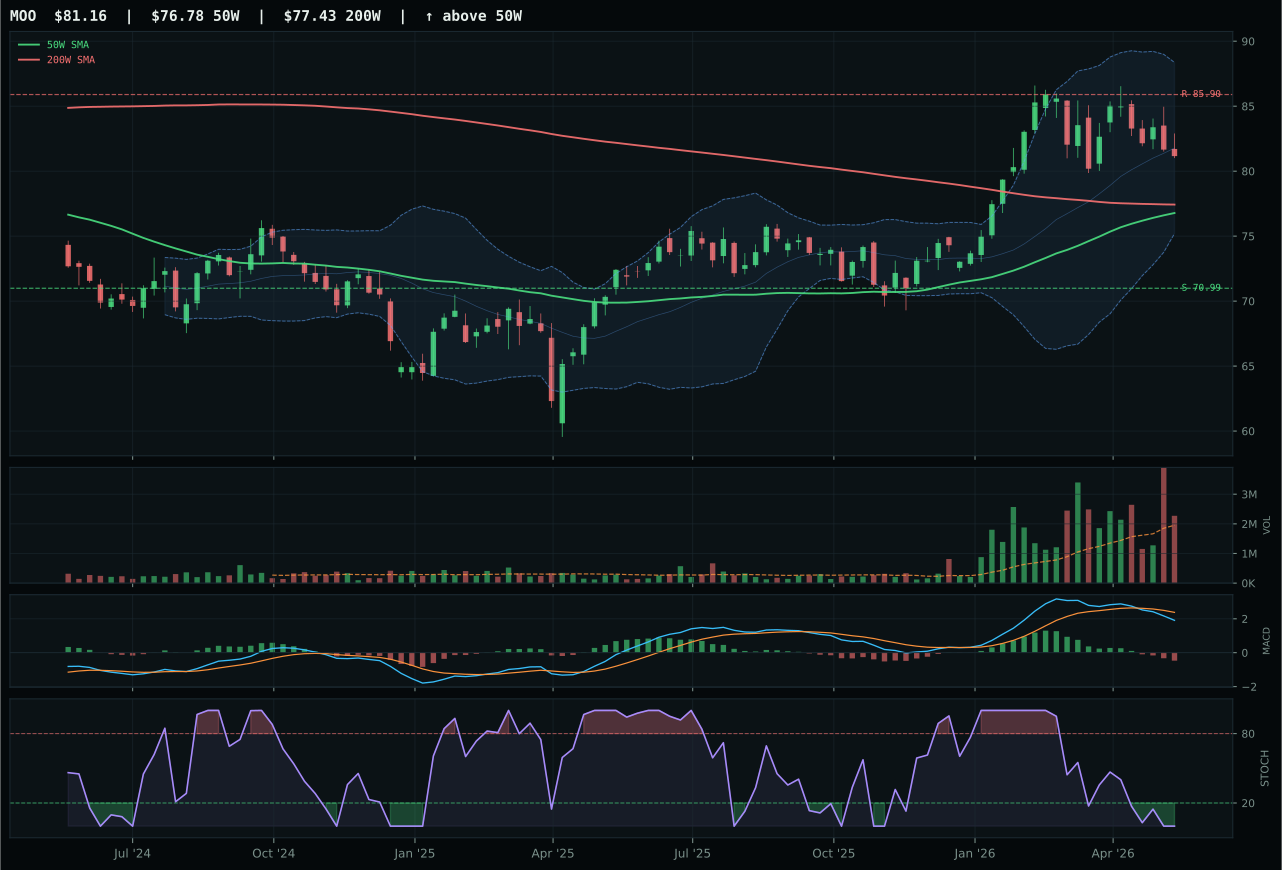
MOO has a neutral structure profile with -13.3% 13-week relative strength versus SPY.
A failed hold above support would weaken the setup.
Actionable but governed by invalidation levels.
WEAT triumphed over VEGI by delivering pristine volume-price confirmation—97.9/100 volume-price confirmation score and 93.6/100 persistence—that proved institutional demand for agricultural commodities is genuine and accumulating, not speculative. WEAT's 16.7% category-relative strength versus VEGI's flat 0.0% reveals sharp buyer preference for the pure-play wheat story over diversified agriculture producers. Both charts sit above their 50-week moving averages, but WEAT's neutral structure with MACD bullish and improving contrasts sharply with VEGI's bearish/weakening deterioration and oversold stochastic RSI reading. WEAT's distance from the 50W (11.0%) allows room for accumulation without stretched valuation, while VEGI has already extended 27.0% beyond trend, leaving little room for new money to enter. The 20.6-point score gap is driven equally by timing advantage and momentum confirmation, with WEAT's 100.0 momentum score reflecting genuine commodity demand, not just technical bounce-back.
Agriculture earned 10% allocation despite a middling 53.4 final score because macro supply-shortage signals dominate the category scoring at a +13 weighting for active supply shortage descriptor, with inflation pressure adding another +10. Real asset sponsorship contributes +8, creating a 31-point tailwind just from macro descriptors, outweighing technical evidence that shows deteriorating breadth outside the WEAT winner. The allocation here is a supply-inflation hedge that complements energy exposure; where energy represents broad commodity scarcity, agriculture captures the specific risk of harvest disruption and input cost inflation. WEAT's technical setup remains clean with 100.0 momentum confirmation and above-average volume, but the category overall depends on sustained macro pressure rather than breakout technical formations. For agriculture to move to top-2 allocation, WEAT would need to generate fresh highs above 24.11 resistance on accumulating volume, signaling that supply fears are intensifying rather than merely stabilizing—that inflection would warrant doubling the position as a macro bet, not just a defensive hedge.
Industrial Metals — PICK
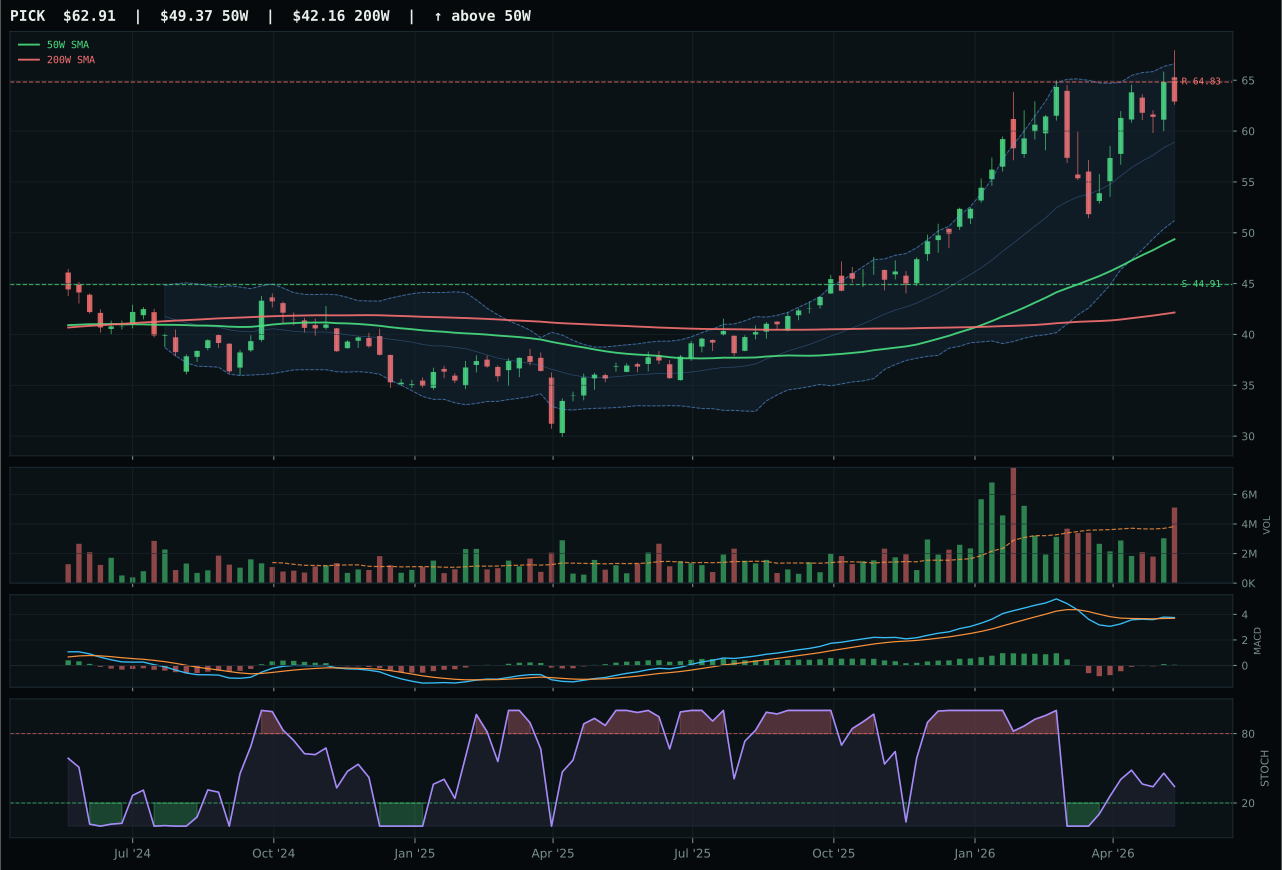
PICK has a vertical extension profile with -4.7% 13-week relative strength versus SPY.
A failed hold above support would weaken the setup.
Actionable but governed by invalidation levels.
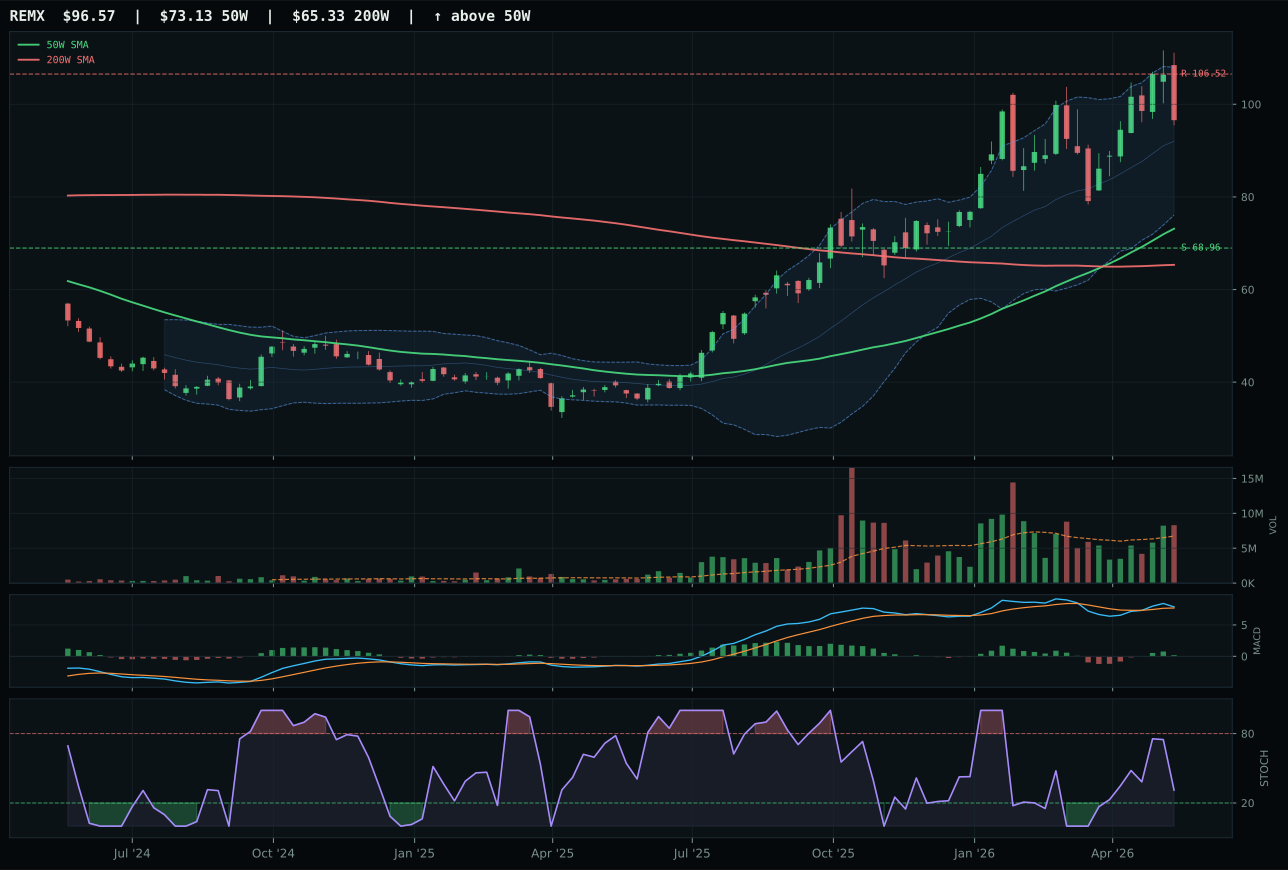
REMX has a vertical extension profile with -0.8% 13-week relative strength versus SPY.
A failed hold above support would weaken the setup.
Actionable but governed by invalidation levels.
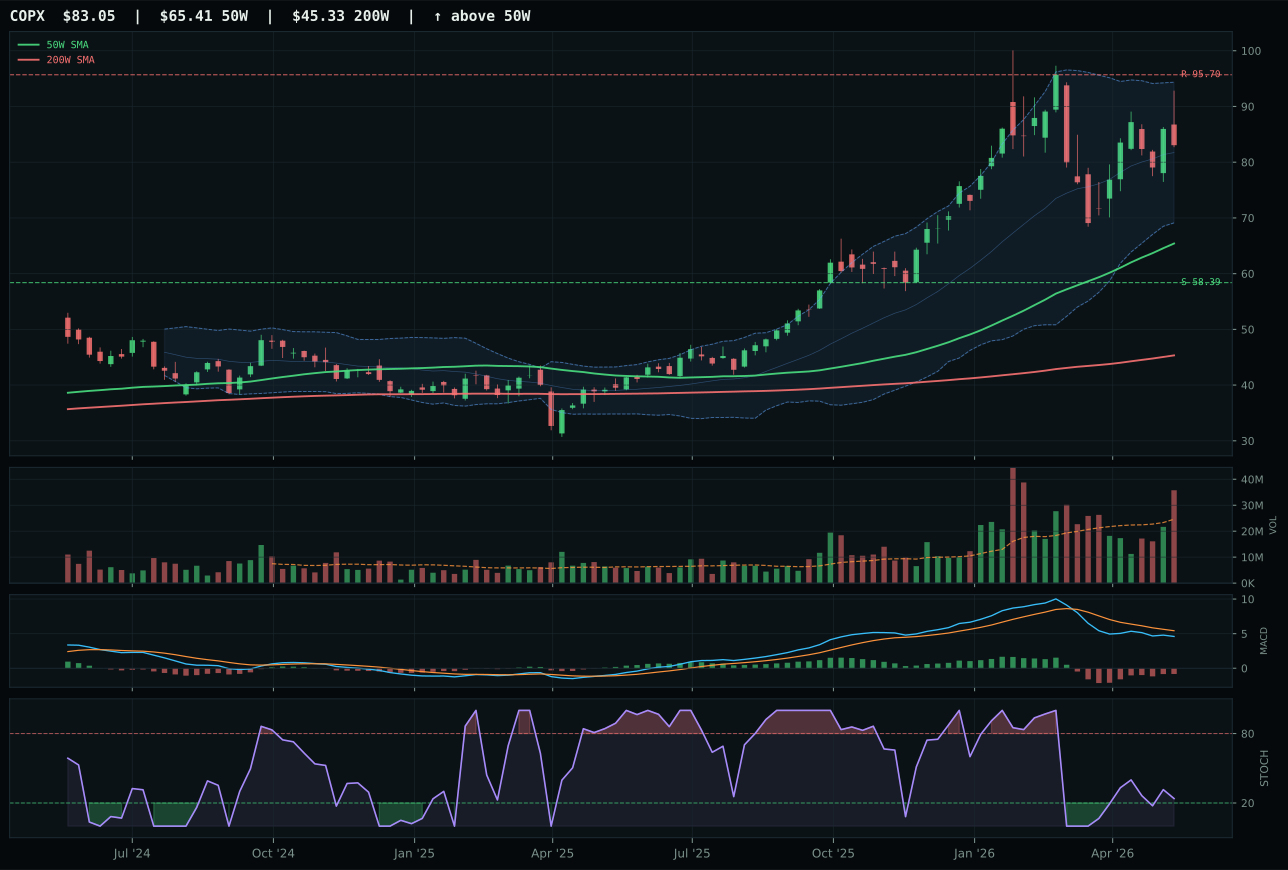
COPX has a vertical extension profile with -14.0% 13-week relative strength versus SPY.
A failed hold above support would weaken the setup.
Actionable but governed by invalidation levels.
PICK narrowly defeated REMX by -0.9 points in what the category reasoning process defines as "a close category decision," indicating separation by technical margin rather than narrative conviction. PICK's advantage rests entirely on superior risk/reward calculation (46.3 vs 34.2) and marginally cleaner structure (70.9 vs 67.4); both charts sit extended above the 50-week moving average in vertical formations with above-average volume confirmation and identical 53.0 timing scores. REMX actually posted stronger headline metrics: 7.7% thirteen-week return versus PICK's 3.8%, and 99.0 trend score versus PICK's 93.0, yet the rare-earth scarcity narrative embedded in REMX's higher macro fit (64.0 vs 54.0) could not overcome the timing penalty from aggressive upside exhaustion. Both MACD readings remain bullish and improving, and stochastic RSI falling/neutral readings suggest late-stage consolidation rather than exhaustion. The real winner here is the Industrial Metals category itself, where commodity-breadth positive (+10) and metals-scarcity signals (+14) are driving allocation independent of individual ETF technicals.
Industrial Metals earned 10% allocation based on macro tailwinds rather than technical leadership, a positioning framework evident in the 49.8 final score that reflects category-level macro fit of 66.0 against weaker technical evidence. Metals scarcity active descriptor contributes +14, commodity breadth positive adds +10, and real asset sponsorship contributes +6, creating +30 macro bias that offsets category-level technical evidence of only 57.5/100 for the winner. Credit stress (-7) and dollar pressure (-7) create headwinds, yet the net macro case remains constructive. This allocation sits between true conviction positions (energy at 20%, semiconductors at 20%) and satellite hedges (agriculture at 10%), functioning as a specialized inflation bet that captures industrial demand from infrastructure capex and AI-adjacent supply-chain bottlenecks. PICK would need to break above 64.83 resistance with volume confirmation to justify upgrading to 10% allocation; until that setup confirms, this position remains a structural hedge against continued commodity scarcity and real-asset inflation rather than a cyclical momentum bet.
Nuclear Energy — URA
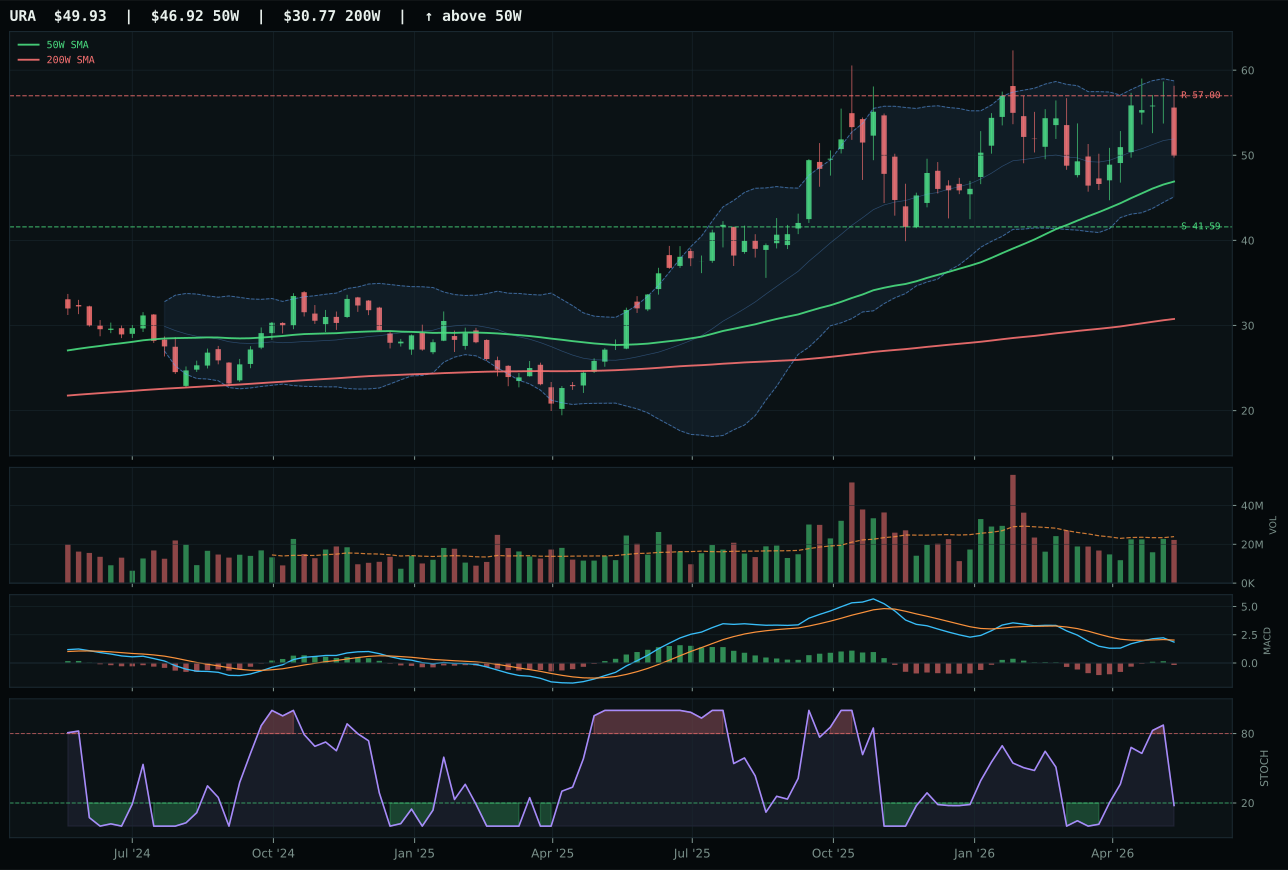
URA has a neutral structure profile with -12.2% 13-week relative strength versus SPY.
A failed hold above support would weaken the setup.
Actionable but governed by invalidation levels.
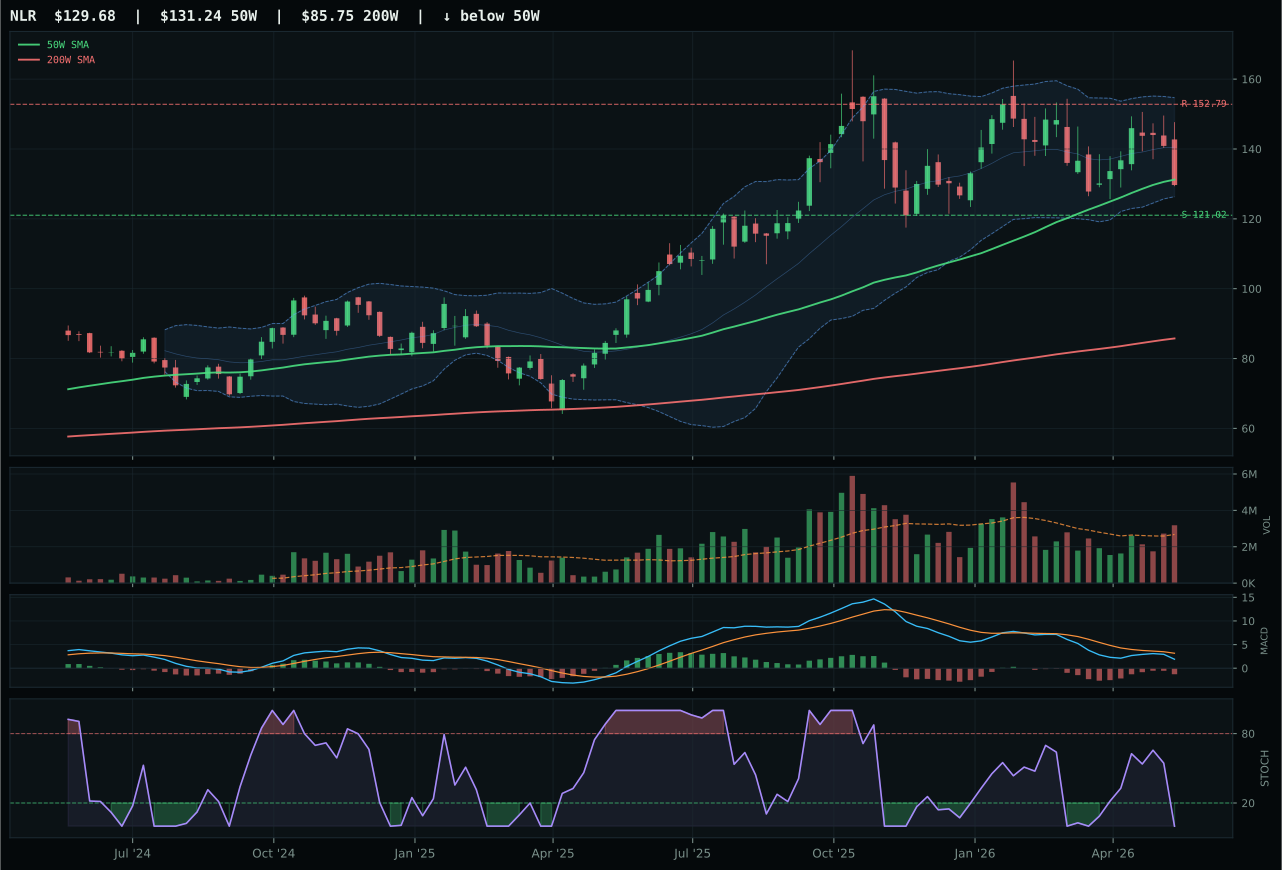
NLR has a compression near 50W profile with -17.1% 13-week relative strength versus SPY.
A failed hold above support would weaken the setup.
Actionable but governed by invalidation levels.
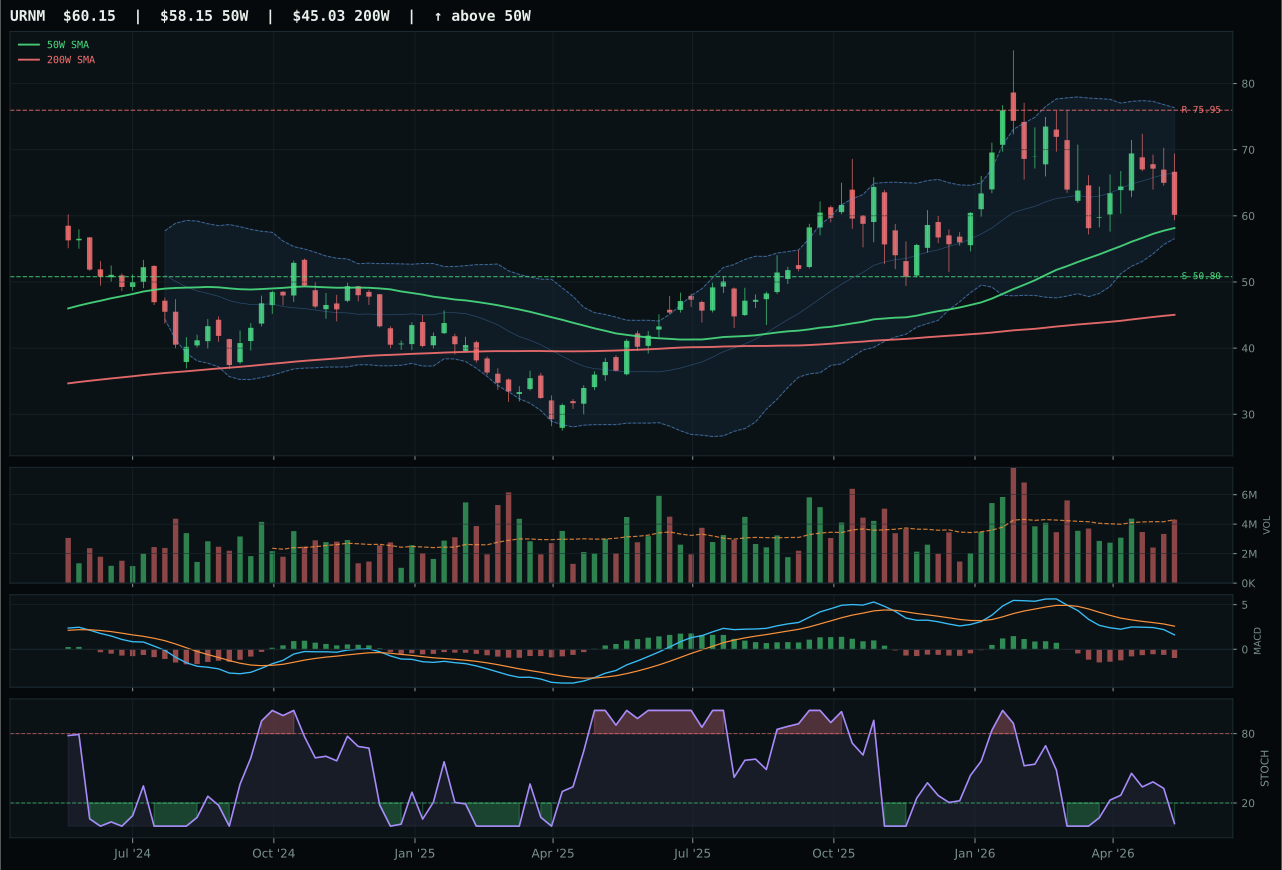
URNM has a neutral structure profile with -21.2% 13-week relative strength versus SPY.
A failed hold above support would weaken the setup.
Actionable but governed by invalidation levels.
URA edged NLR by the narrowest margin in this week's analysis: only 4.7 points separated the uranium play from the nuclear utilities exposure, underscoring a category where conviction is structurally weak across all three options. URA's victory rested on category-relative strength of 4.9% versus NLR's flat 0.0%, a marginal differentiation reflecting modest buyer preference for uranium equities over utility regulatory frameworks. Both charts sit above 50-week moving averages with bearish/weakening MACD signals, indicating deteriorating momentum despite technical trend structure remaining intact. URA's stochastic RSI reading at 0.18 (oversold) versus NLR's similar oversold setup means both positions are potential reversal candidates rather than continuation bets. Timing scores favored URA (75.0 vs 100.0 for NLR), a contradiction that reflects NLR's compression near the 50W—technically perfect for rebound trades but lacking distance for accumulation. The category decision itself signals deep weakness: neither ETF commands above-average volume, and momentum confirmation is virtually absent across all three peers, suggesting nuclear exposure remains a passive-indexing drag rather than active capital rotation.
Nuclear Energy earned 10% allocation despite the lowest technical category score (45.4) because energy scarcity descriptors extend beyond traditional fossil fuels into uranium supply narratives. Category-level macro fit of 69.0 reflects +9 energy scarcity weighting, +7 real asset sponsorship, and +5 AI growth sponsorship (data center power demands), creating macro tailwinds that justify holding despite weak chart technicals. Broad market bear sentiment adds +3, and the Transition / Mixed regime itself supports real-asset inflation hedges. The allocation is structural rather than tactical: URA's -3.8% thirteen-week return and -12.2% SPY-relative performance indicate this position is pure macro optionality, not momentum. Nuclear would merit 10% allocation only if uranium supply shocks materialize (Kazakhstan production disruptions, strategic inventory builds) or if AI data center power demands trigger a visible rerating in earnings expectations. Until those catalysts surface, this remains a satellite hedge that captures the tail risk of extended energy disruptions without committing meaningful capital, allowing resources to flow toward higher-conviction energy and commodity bets.
Defense & Aerospace — ROKT
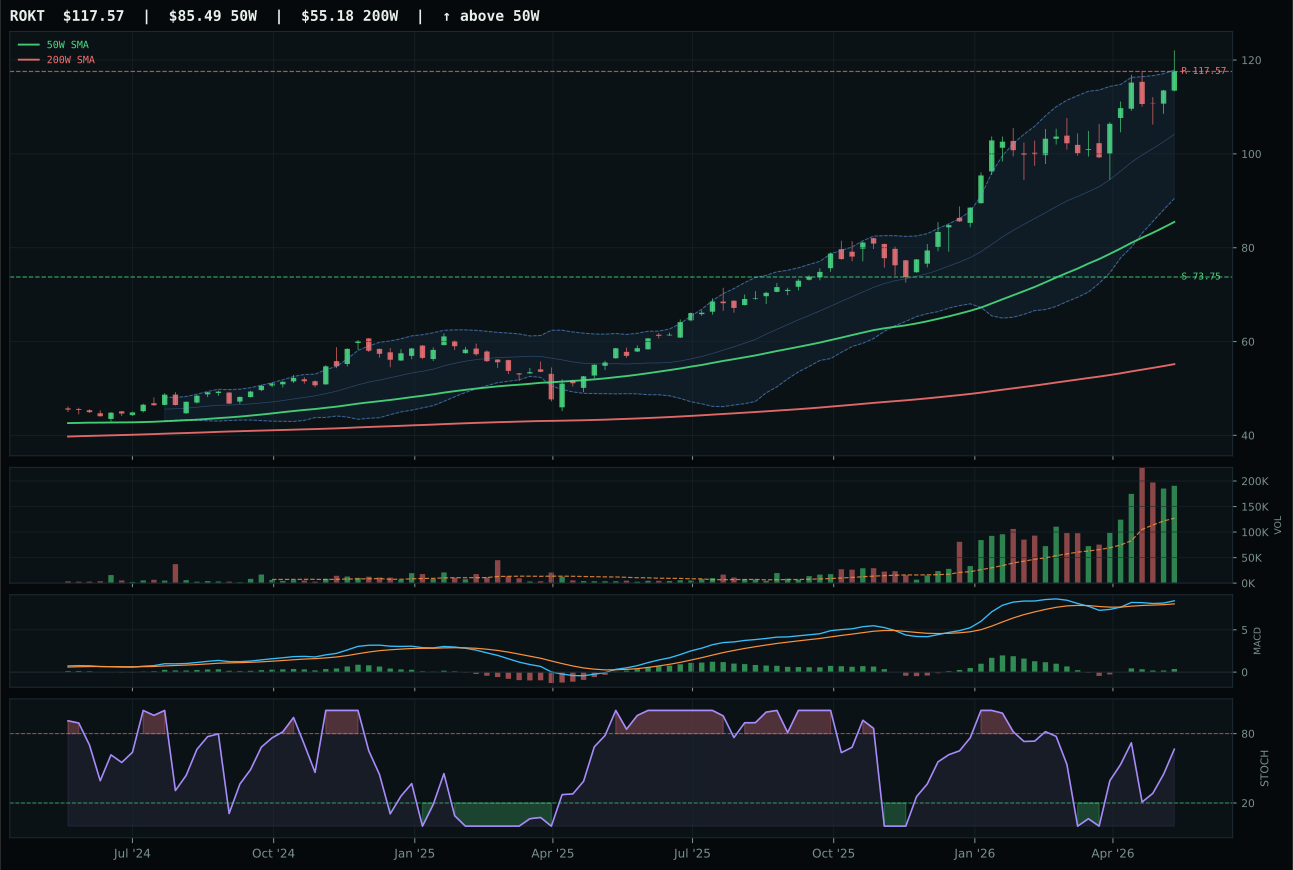
ROKT has a vertical extension profile with 9.2% 13-week relative strength versus SPY.
A failed hold above support would weaken the setup.
Actionable but governed by invalidation levels.
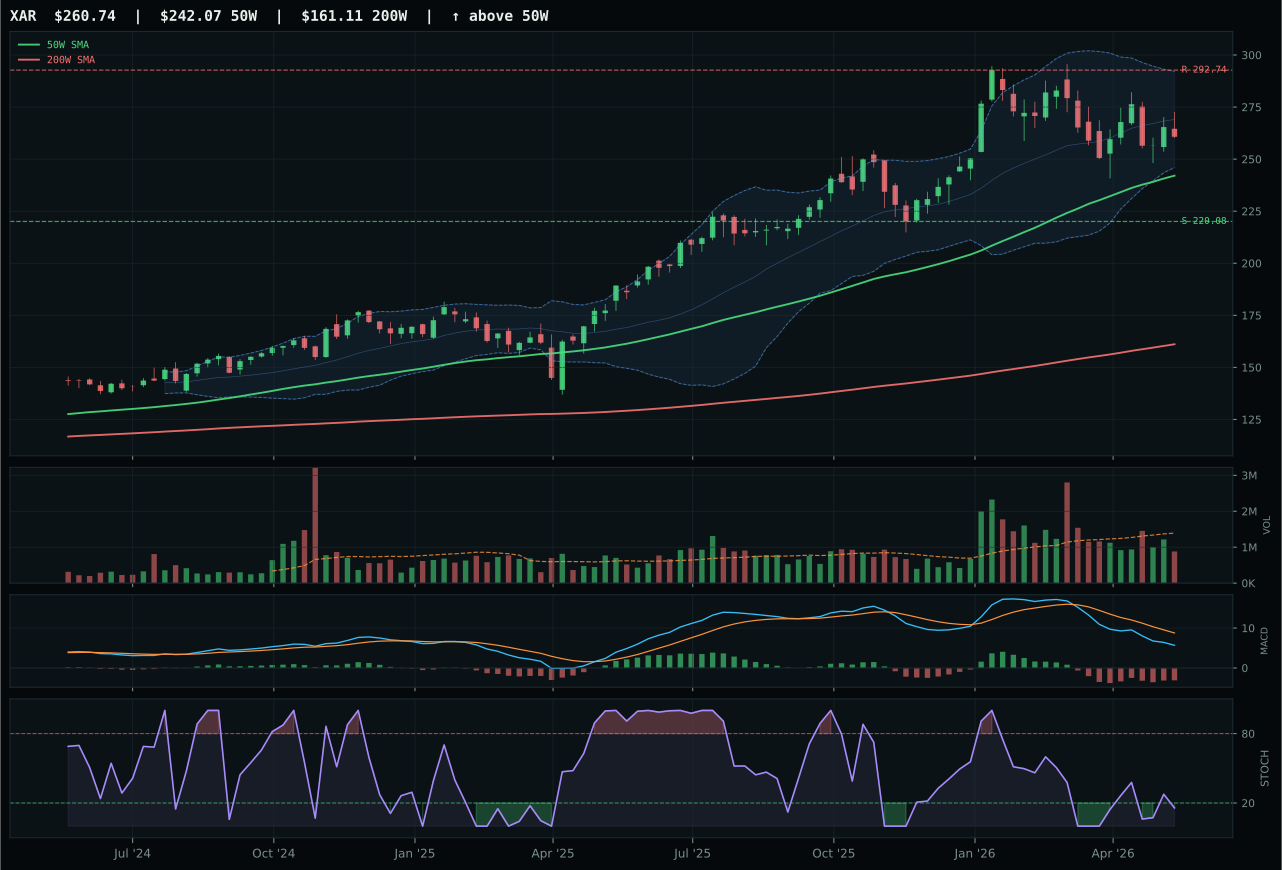
XAR has a neutral structure profile with -12.1% 13-week relative strength versus SPY.
A failed hold above support would weaken the setup.
Actionable but governed by invalidation levels.
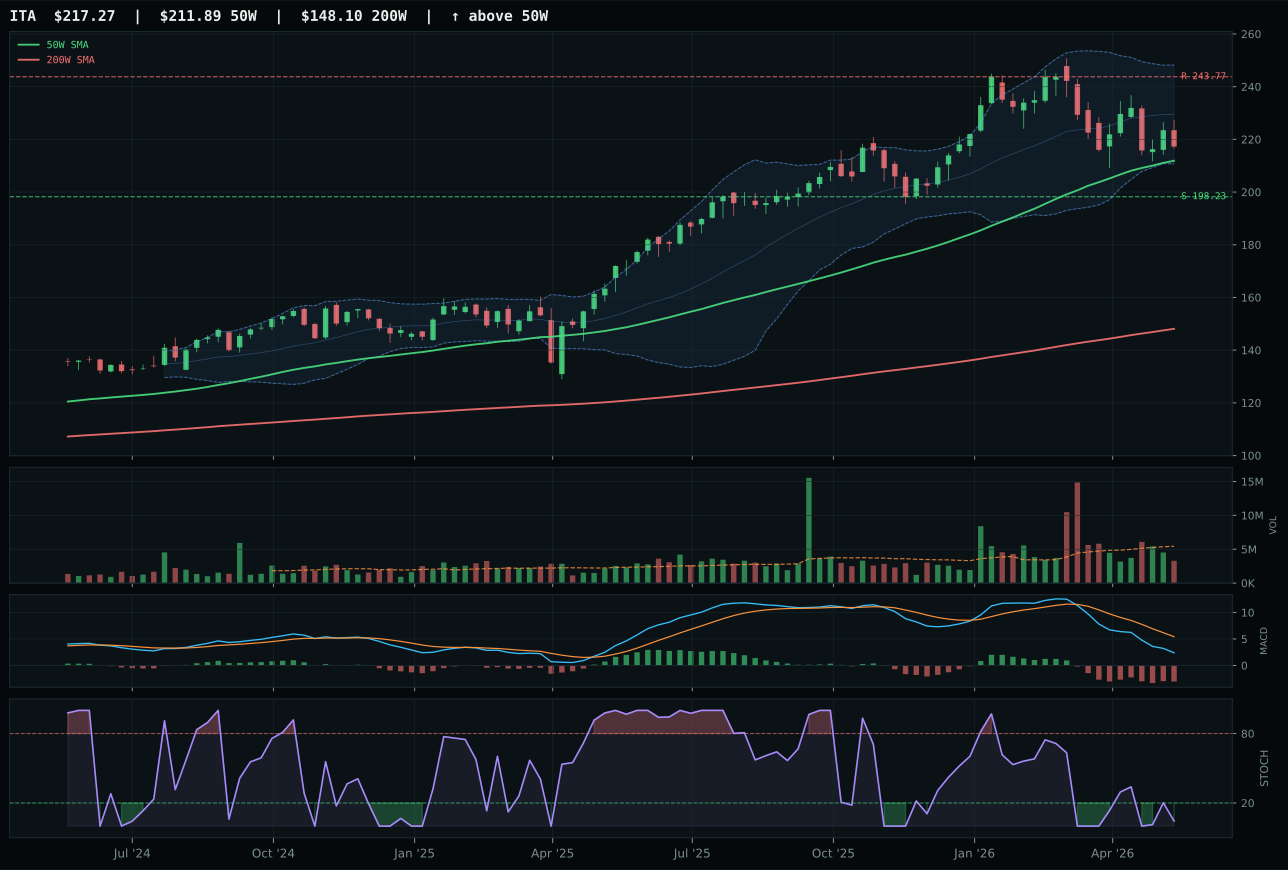
ITA has a compression near 50W profile with -15.9% 13-week relative strength versus SPY.
A failed hold above support would weaken the setup.
Actionable but governed by invalidation levels.
ROKT prevailed over XAR through demonstrable technical sponsorship and superior category-relative performance. Both charts occupy the extended zone above 50-week moving averages, yet ROKT's 21.3% category-relative strength versus XAR's flat 0.0% shows institutional flows are rotating into space and aerospace growth, not traditional defense. ROKT's MACD remains bullish albeit flattening, while XAR's bearish/weakening signal marks a real deterioration in buyer conviction. Volume confirms the gap: ROKT trades at 1.50x average participation with above-average accumulation, whereas XAR sits in thin participation—a classic distribution signal. Stochastic RSI tells the same story: ROKT's reading in the rising mid-zone (0.66) suggests early-stage momentum building toward potential resistance, while XAR's oversold turn-up is a bounce within a downtrend, not a reversal. The 14.7-point score gap reflects ROKT's cleaner structure (77.6 vs 64.5) and MACD confirmation, making this category decision unambiguous despite both ETFs sitting near 52-week highs.
Defense & Aerospace earned 10% allocation despite a weak 42.0 final score because geopolitical risk and energy-security narratives have begun supporting aerospace beta in ways that traditional defense metrics do not capture. Broad market bear sentiment adds +6 to category reasoning, and dollar pressure contributes +3, both factors that should hurt risk assets; instead, they are being offset by category-level macro fit of 64.0, driven by the Transition / Mixed regime itself. The allocation here is defensive optionality: as credit conditions remain under scrutiny (broad market bear active), ROKT's space economy growth thesis provides a non-correlated bid that does not depend on pure equity risk appetite. For this position to merit top-2 status, ROKT would need to break above 117.57 resistance with volume confirmation and hold there, signaling that aerospace capex spending is truly insulated from credit stress. Until that setup materializes, this remains a 10% satellite position that hedges the portfolio against unexpected defense/infrastructure spending announcements or escalating geopolitical tensions.
Utilities & Infrastructure — PAVE
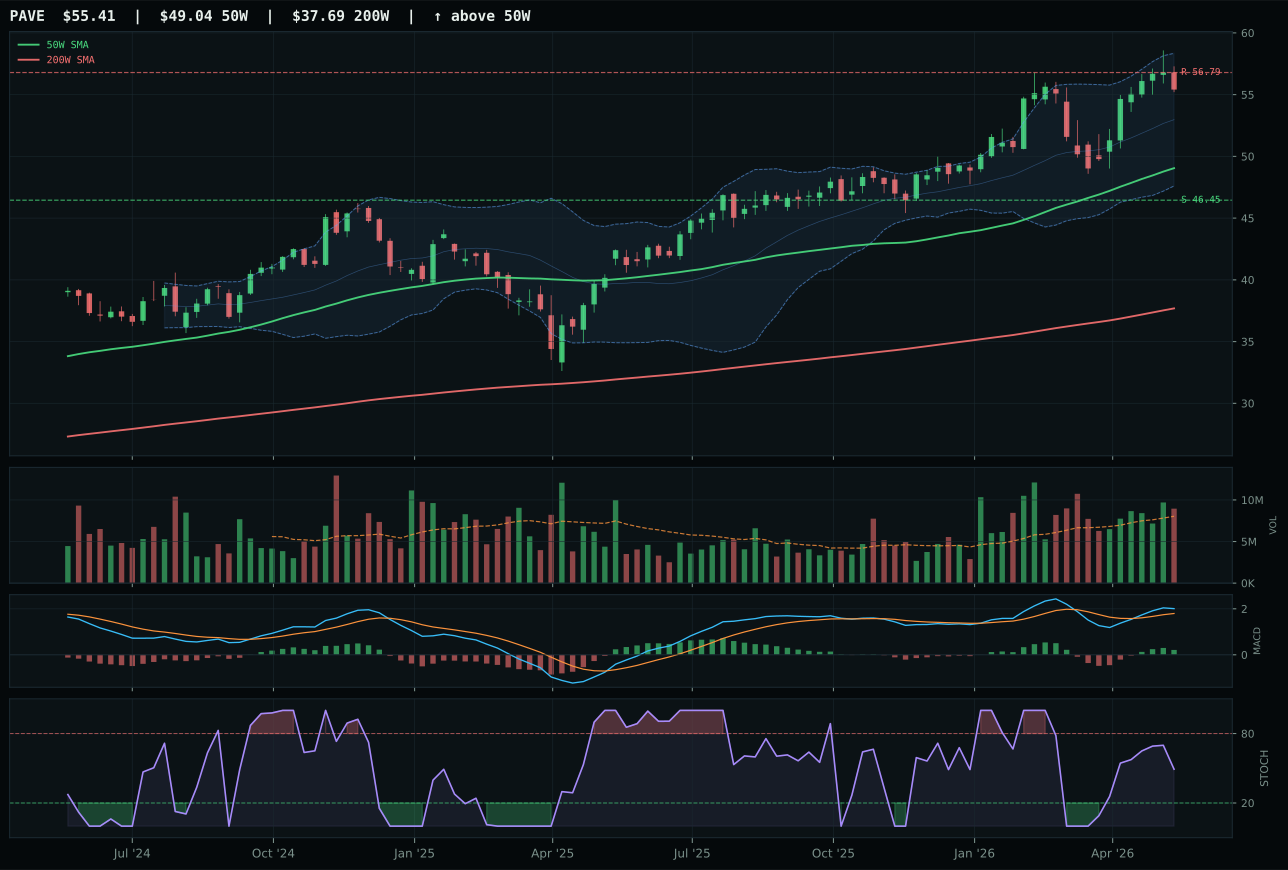
PAVE has a neutral structure profile with -7.9% 13-week relative strength versus SPY.
A failed hold above support would weaken the setup.
Actionable but governed by invalidation levels.
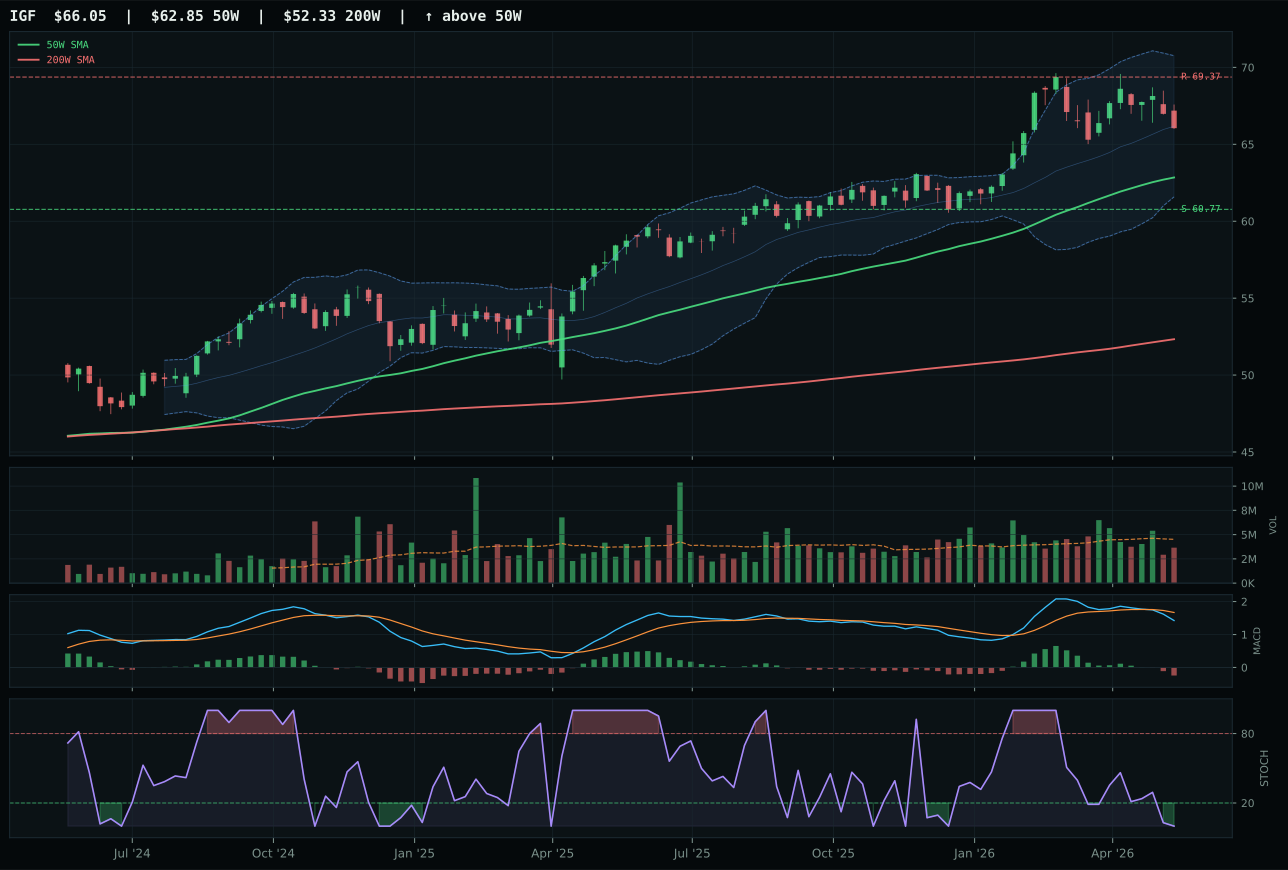
IGF has a neutral structure profile with -11.8% 13-week relative strength versus SPY.
A failed hold above support would weaken the setup.
Actionable but governed by invalidation levels.
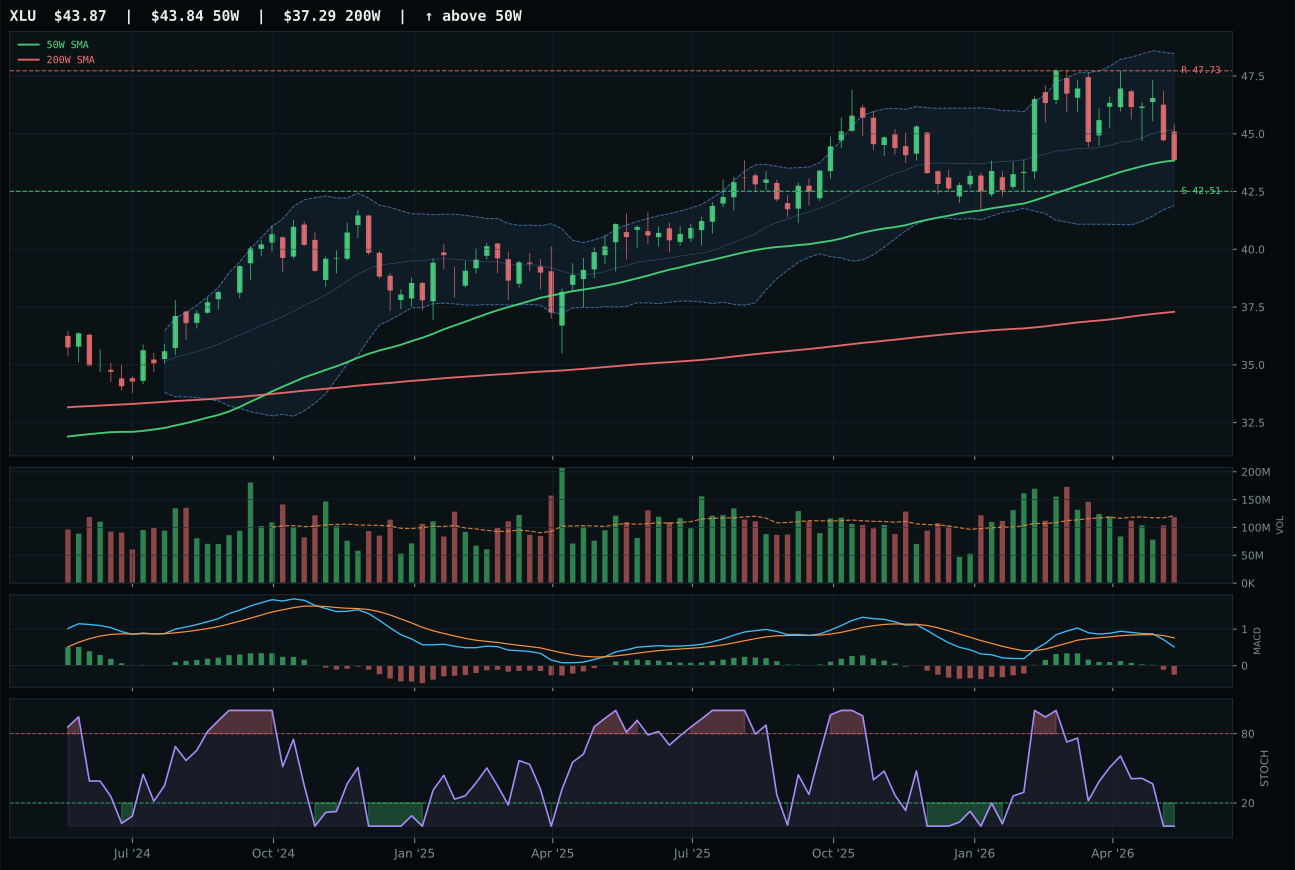
XLU has a pullback into support profile with -14.1% 13-week relative strength versus SPY.
A failed hold above support would weaken the setup.
Actionable but governed by invalidation levels.
PAVE won the utilities category by delivering superior timing and volume confirmation relative to structural peers, earning 10% allocation despite category-wide technical weakness. PAVE's advantage over runner-up IGF rests on timing superiority (75.0 vs 70.0), cleaner structure (76.0 vs 72.9), and bullish/improving MACD confirmation versus IGF's bearish/weakening deterioration. Both charts sit above 50-week moving averages in neutral structures with extensions above 10%, yet PAVE maintains above-average volume at 1.11x participation while IGF trades in neutral participation zones. PAVE's stochastic RSI falling/neutral reading at 0.49 suggests consolidated, healthy momentum, whereas IGF's oversold reading signals potential bounce risk rather than sustained accumulation. Distance from trend slightly favors PAVE (13.0% vs 12.5%), and category-relative strength of 3.9% versus IGF's flat 0.0% indicates infrastructure capex narratives are rotating toward domestic construction and maintenance (PAVE) rather than global dividend yield (IGF). The win margin of 14.6 points is substantial given category-wide weakness, establishing PAVE as the clear infrastructure representative.
Utilities & Infrastructure earned 10% allocation as the portfolio's cyclical infrastructure bet despite a weak 41.2 final category score, a decision rooted in Transition / Mixed regime support for capex-focused narratives. The regime itself contributes +4 to category reasoning, and broad market bear adds another +4, suggesting infrastructure protection demand during uncertainty. PAVE's 0.5% thirteen-week return is essentially flat, and -7.9% SPY-relative performance indicates cyclical underperformance in a multi-asset regime dominated by energy and semiconductors. However, infrastructure capex narratives remain structurally intact: roads, bridges, and grid modernization represent inflation-indexed revenue streams that provide real-asset exposure without commodity price leverage. This allocation is defensive positioning rather than offensive upside capture; for PAVE to merit 20% status, the category would need to generate both technical breakout (above 56.79 resistance) and improving macro indicators toward risk-appetite strength. Currently, utilities and infrastructure function as dampening assets in a volatile Transition / Mixed regime, preserving capital while allowing core allocations (energy and AI) to drive returns. The 10% weighting acknowledges macro headwinds while maintaining optionality for rotation if geopolitical or credit conditions deteriorate.
Precious Metals — GLD
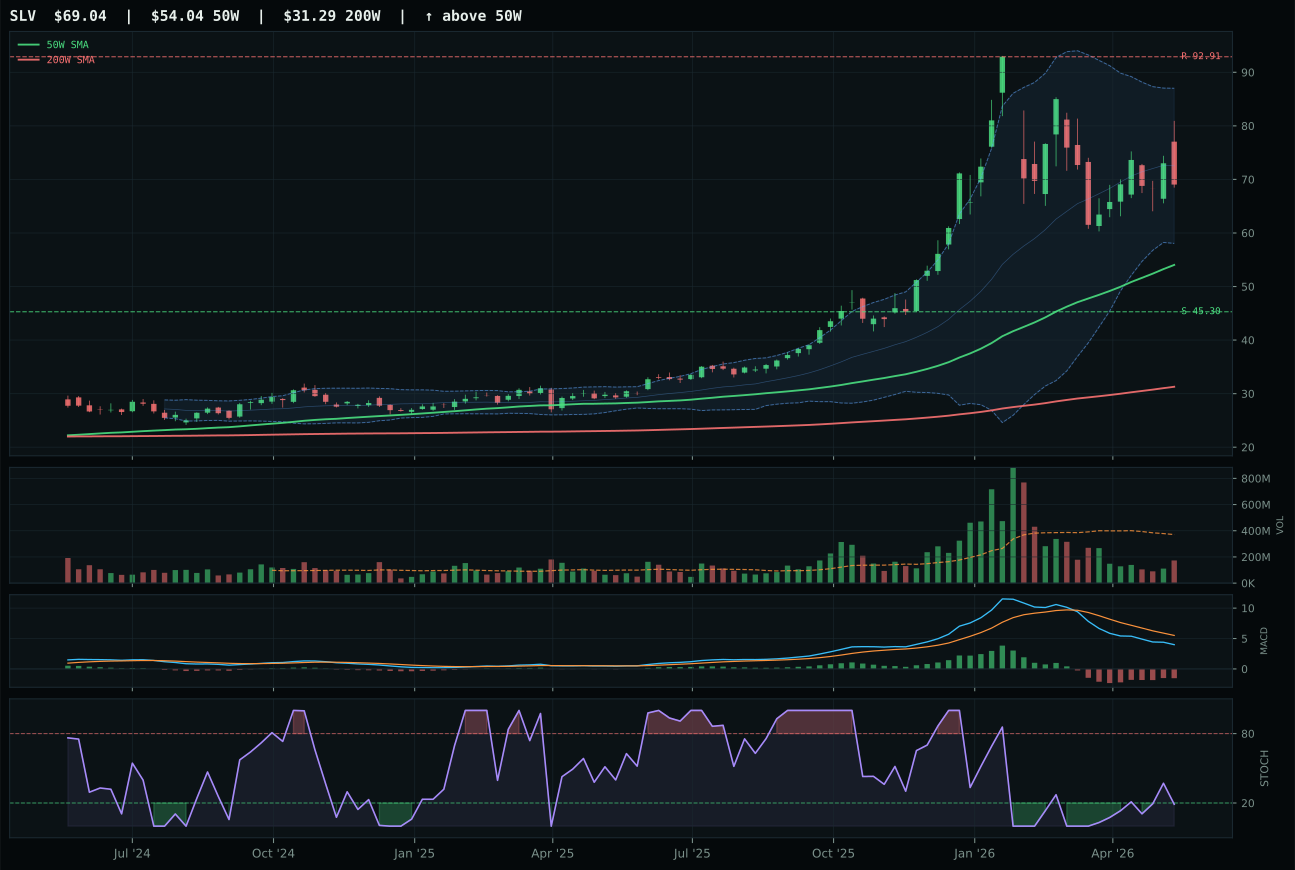
SLV has a vertical extension profile with -9.4% 13-week relative strength versus SPY.
A failed hold above support would weaken the setup.
Actionable but governed by invalidation levels.
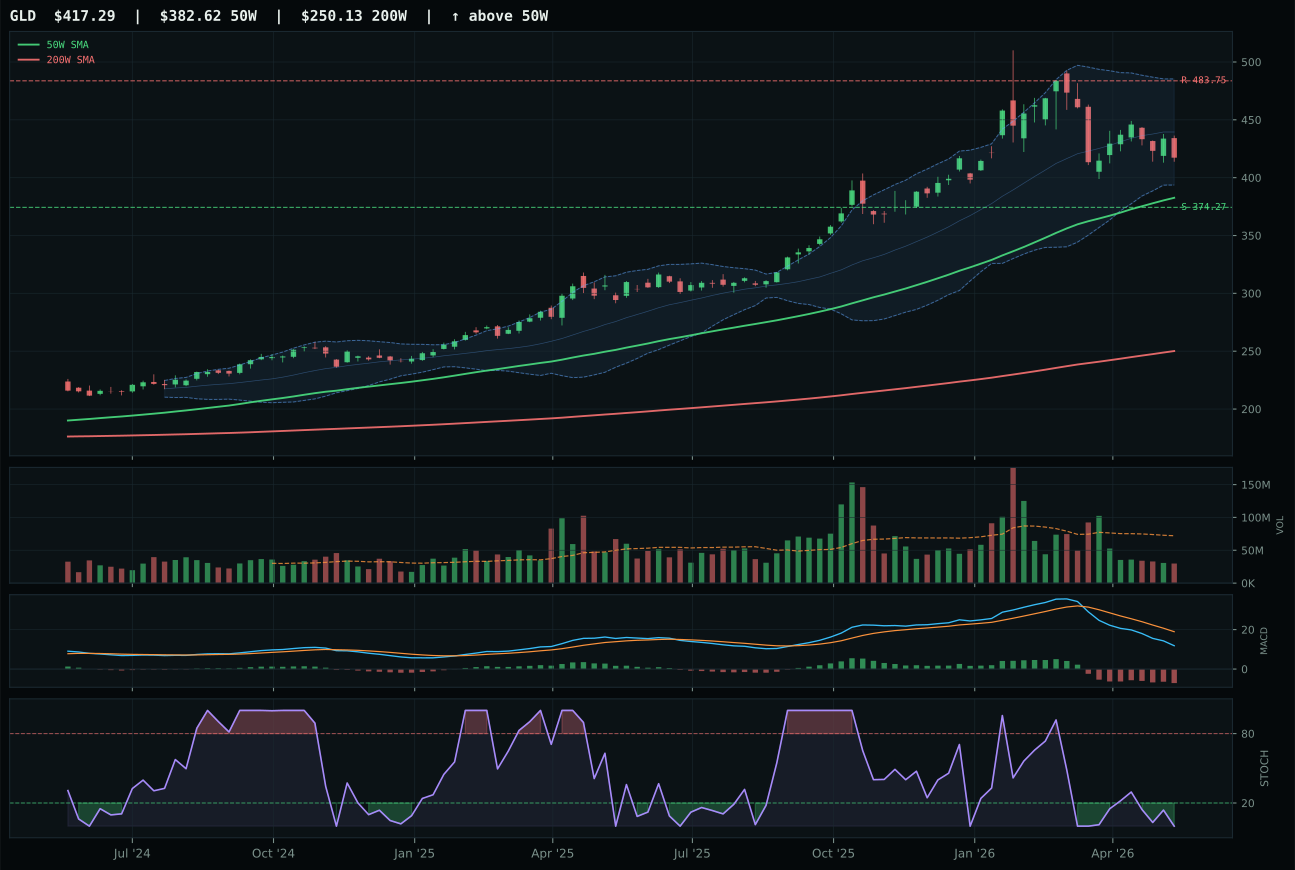
GLD has a neutral structure profile with -18.2% 13-week relative strength versus SPY.
A failed hold above support would weaken the setup.
Actionable but governed by invalidation levels.
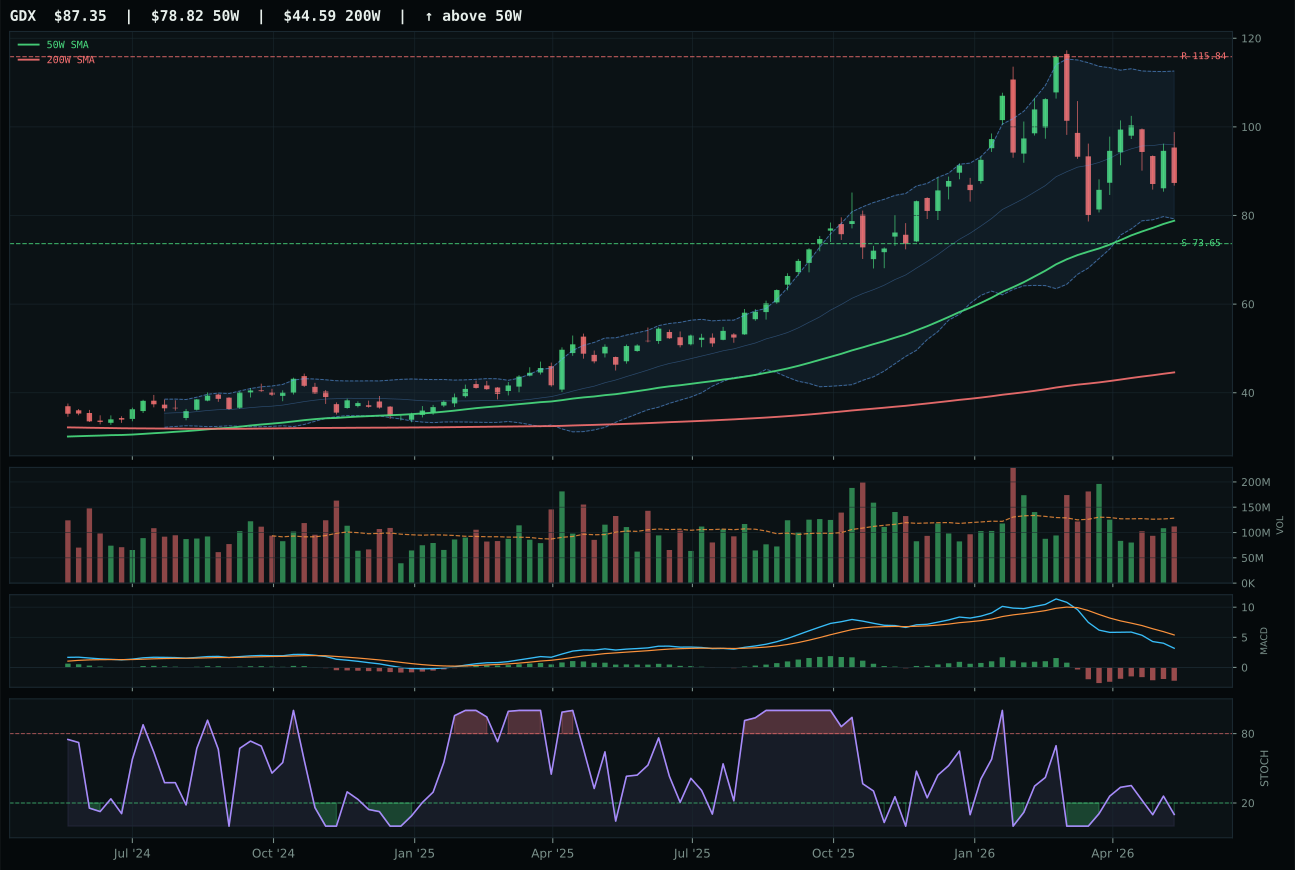
GDX has a neutral structure profile with -24.4% 13-week relative strength versus SPY.
A failed hold above support would weaken the setup.
Actionable but governed by invalidation levels.
GLD won the precious metals category by default rather than conviction, a distinction that defines this weak allocation. Against runner-up SLV, GLD preserved better risk/reward (74.5 vs 46.8) and cleaner structure (67.5 vs 59.5) by staying closer to trend—just 9.1% above the 50-week moving average versus SLV's aggressive 27.8%. The timing advantage is marginal; both MACD signals are deteriorating, and both stochastic RSI readings sit oversold. GLD's 0.0 momentum confirmation score reflects -9.8% thirteen-week return, which is genuine weakness, yet the gold narrative as monetary hedge still carries slight technical superiority over silver's hybrid monetary-industrial thesis when credit stress fears dominate. The score gap versus SLV is only 10.7 points, indicating a category with limited sponsorship overall—neither ETF shows volume-price confirmation above 50.0, and both sit in thin participation zones where retail and systematic selling create gaps rather than accumulation.
Precious Metals earned 0% allocation this week because its 38.5 category score ranks 9th or 10th among ten categories, and the macro regime is actively hostile to it. Dollar pressure is active (+3, which is weak support), and more critically, risk appetite positive is active but working against metals (-4 points). In a transition environment where credit stress persists, capital is choosing AI semiconductors and energy over the monetary hedge story that gold is supposed to tell. Relative weakness of -18.2% versus SPY shows the entire category is being sold to fund winners elsewhere. For Precious Metals to earn even 10% allocation, one of two things must occur: either the dollar must break decisively lower (currently active descriptor working weakly) or credit stress must flip from active to acute, which would trigger panic bid into gold. Until then, GLD at 38.5 category score is mathematically outranked by everything from ROKT (42.0) upward, and holding an underperforming tactical position in a mixed regime is not prudent.
Emerging Markets — IEMG
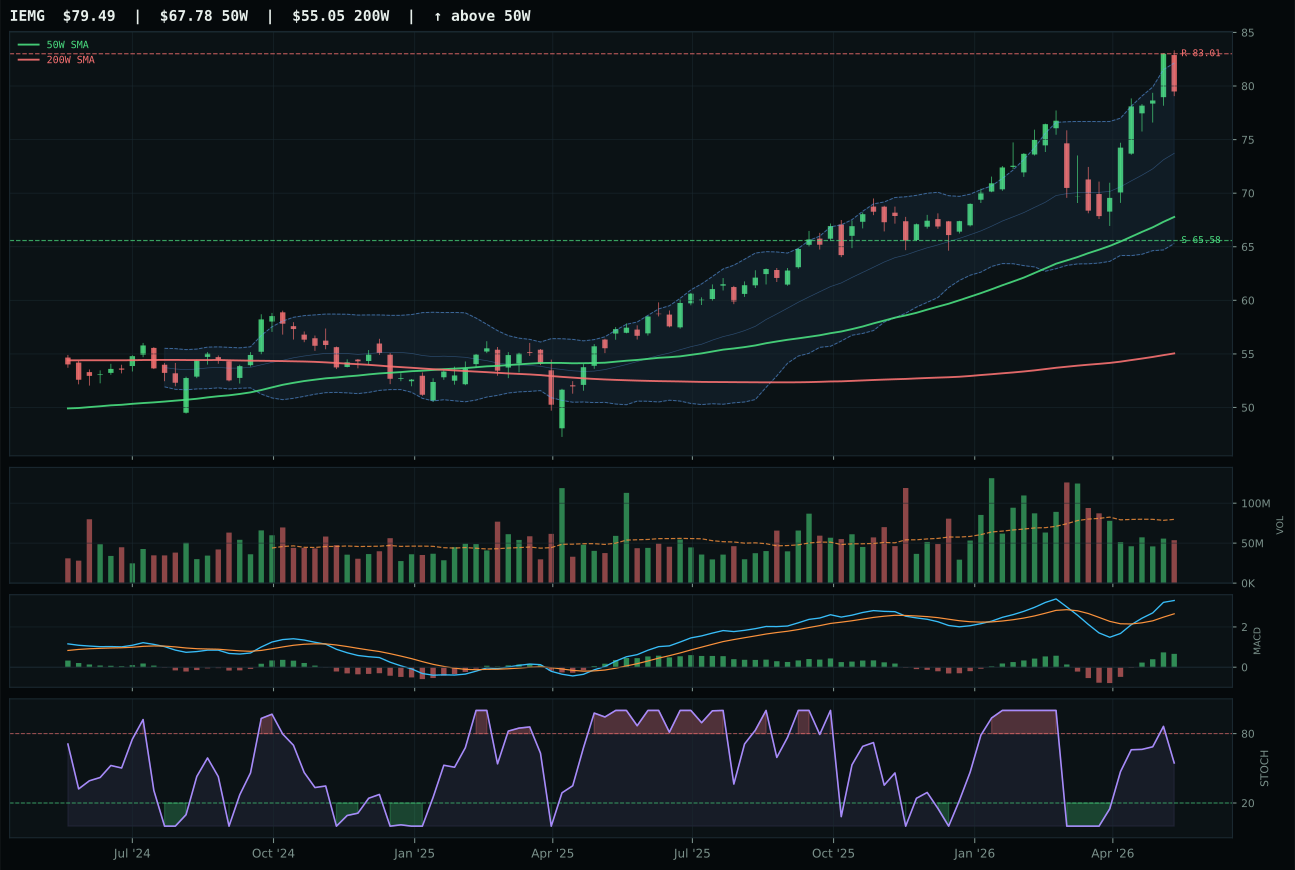
IEMG has a vertical extension profile with -2.4% 13-week relative strength versus SPY.
A failed hold above support would weaken the setup.
Actionable but governed by invalidation levels.
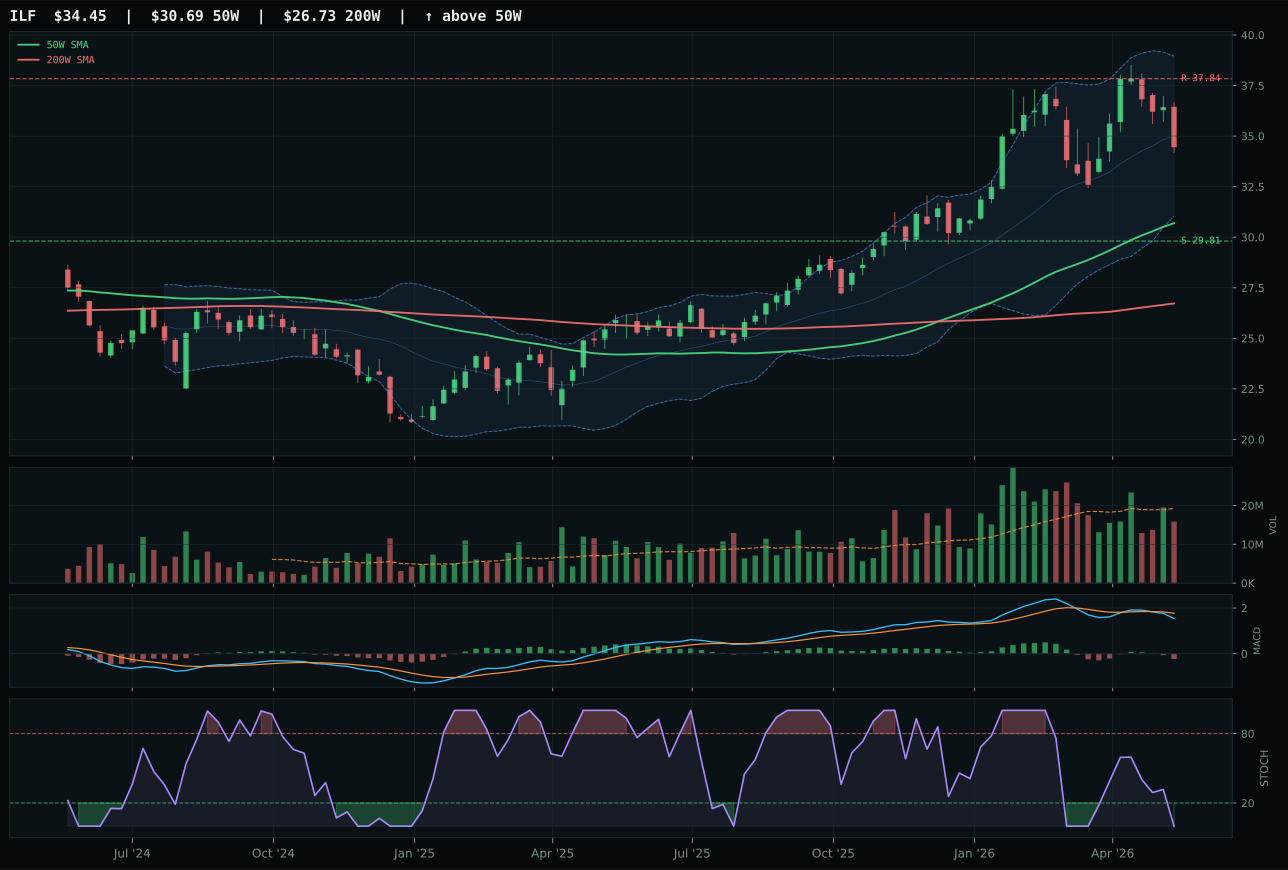
ILF has a neutral structure profile with -13.4% 13-week relative strength versus SPY.
A failed hold above support would weaken the setup.
Actionable but governed by invalidation levels.
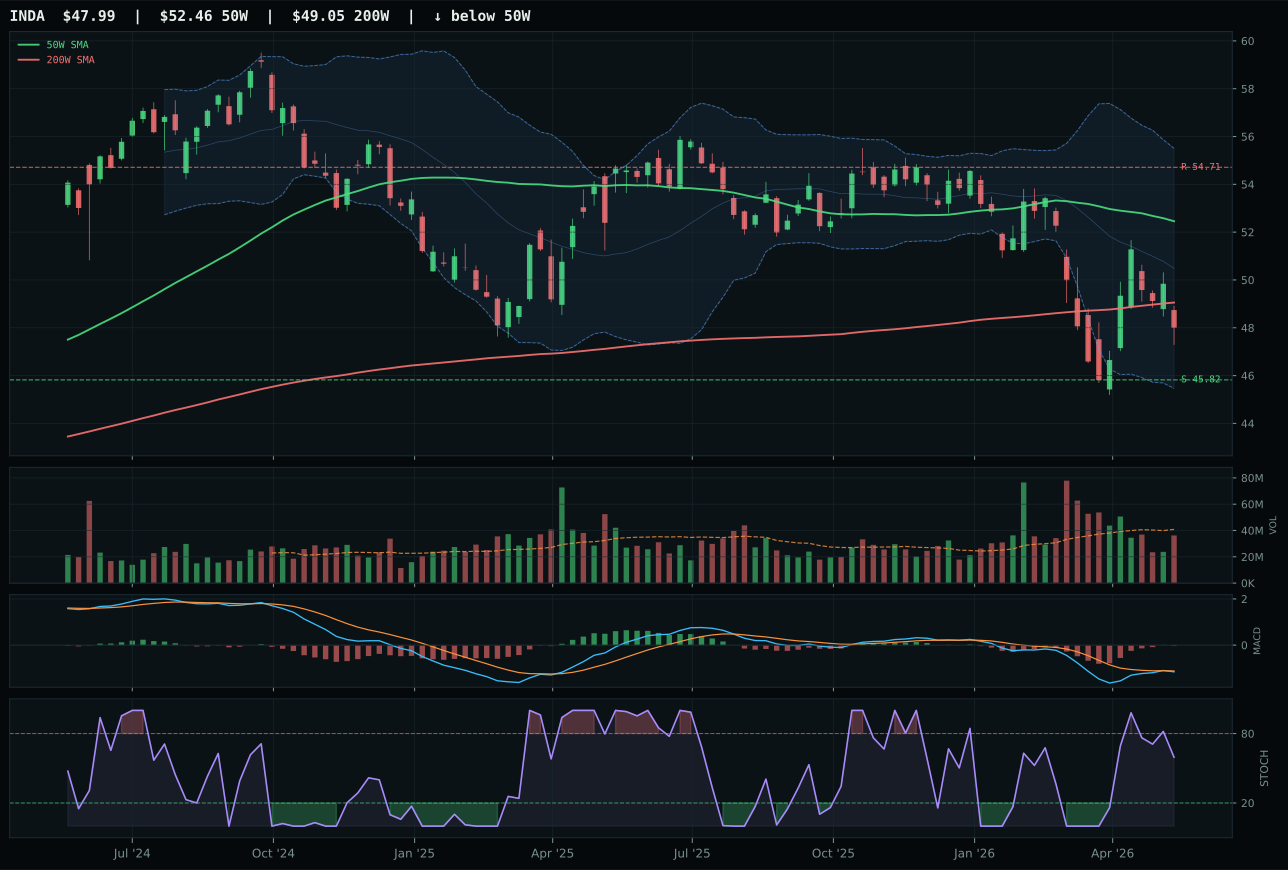
INDA has a pullback into support profile with -17.7% 13-week relative strength versus SPY.
A failed hold above support would weaken the setup.
Actionable but governed by invalidation levels.
IEMG defeated ILF and INDA to win a category where no peer demonstrates conviction-level technical setup, earning selection through relative strength inside the peer group rather than absolute quality. IEMG's 11.0% category-relative strength versus ILF's flat 0.0% reflects modest institutional preference for broad emerging-market beta over Latin America commodity exposure. IEMG's technical evidence scored 70.3/100—the highest in the category—driven by 96.4 trend score and 78.1 momentum confirmation from 6.0% thirteen-week return and improving MACD. Yet the absolute returns remain tepid, volume sits thin at 0.67x average, and the chart sits extended 17.3% above the 50-week moving average, leaving little room for accumulation. ILF's bearish/weakening MACD and -13.4% SPY-relative performance represent outright deterioration, while INDA's pullback-into-support setup theoretically offers better timing discipline. The category win for IEMG is technical hierarchy within weakness rather than emerging-market conviction; dollar pressure active at -14 explains why all three peers struggle to attract institutional flows.
Emerging Markets earned 0% allocation this week because its 11.4 category score ranks last by a wide margin, and the macro regime is actively hostile. Dollar pressure is active and worth -14 points—the single largest headwind to emerging-market returns in a transition environment. Credit stress (-10) and broad market bear (-9) reinforce the narrative that capital is fleeing risk assets in favor of domesticated growth (SMH, XLE). The category-level macro fit is just 25 percent, the lowest score among all ten categories. Even IEMG's bullish setup and positive RS within its basket cannot overcome a regime where the dollar is strengthening, credit conditions are uncertain, and EM assets are structurally underweighted. For Emerging Markets to reclaim 10% allocation, the dollar would need to reverse decisively (from active strength to active weakness) and risk appetite would need to shift from guarded to aggressive. Until then, the capital stays in domesticated energy, semiconductors, and infrastructure.