
2026-05-08
Informational purposes only. The content in this report, including allocations, analysis, and commentary, is provided solely for informational and educational purposes. It does not constitute financial advice, investment advice, trading advice, or any other type of advice. Past performance does not guarantee future results. Always conduct your own research and consult a qualified financial professional before making investment decisions.
Weekly Allocation
| Ticker | Category | Weight | Role |
|---|---|---|---|
| SMH | AI | 20% | Top-2 (20%) |
| REMX | Industrial Metals | 20% | Top-2 (20%) |
| XLE | Traditional Energy | 10% | Tier-2 (10%) |
| CIBR | Technology | 10% | Tier-2 (10%) |
| URA | Nuclear Energy | 10% | Tier-2 (10%) |
| WEAT | Agriculture & Livestock | 10% | Tier-2 (10%) |
| ROKT | Defense & Aerospace | 10% | Tier-2 (10%) |
| PAVE | Utilities & Infrastructure | 10% | Tier-2 (10%) |
Trade Instructions — Monday Open
Sell the tranche from 2026-04-10 (completing its 4-week hold). Buy the new tranche. Instructions show net portfolio changes — same-asset positions cancel, weight changes show the delta.
| Action | Ticker | Instruction |
|---|---|---|
| SELL | XLE | Sell 12% of XLE position (reduce 20.00% → 17.50%) |
| SELL | VEGI | Sell entire VEGI position (5.00% of portfolio) |
| SELL | COPX | Sell 50% of COPX position (reduce 5.00% → 2.50%) |
| SELL | ILF | Sell 50% of ILF position (reduce 5.00% → 2.50%) |
| SELL | XAR | Sell entire XAR position (2.50% of portfolio) |
| BUY | SMH | Buy SMH — 16.67% of freed cash (adds 2.50% to portfolio) |
| BUY | REMX | Buy REMX — 33.33% of freed cash (adds 5.00% to portfolio) |
| BUY | WEAT | Buy WEAT — 16.67% of freed cash (adds 2.50% to portfolio) |
| BUY | CIBR | Buy CIBR — 16.67% of freed cash (adds 2.50% to portfolio) |
| BUY | ROKT | Buy ROKT — 16.67% of freed cash (adds 2.50% to portfolio) |
Current Portfolio After Trade
Combined holdings across all 4 active tranches. Each tranche is 25% of the portfolio.
| Ticker | % of Portfolio | Weight Bar |
|---|---|---|
| SMH | 17.50% | |
| XLE | 17.50% | |
| PAVE | 10.00% | |
| URA | 10.00% | |
| REMX | 10.00% | |
| MOO | 7.50% | |
| XLK | 7.50% | |
| IEMG | 5.00% | |
| WEAT | 5.00% | |
| COPX | 2.50% | |
| ILF | 2.50% | |
| CIBR | 2.50% | |
| ROKT | 2.50% |
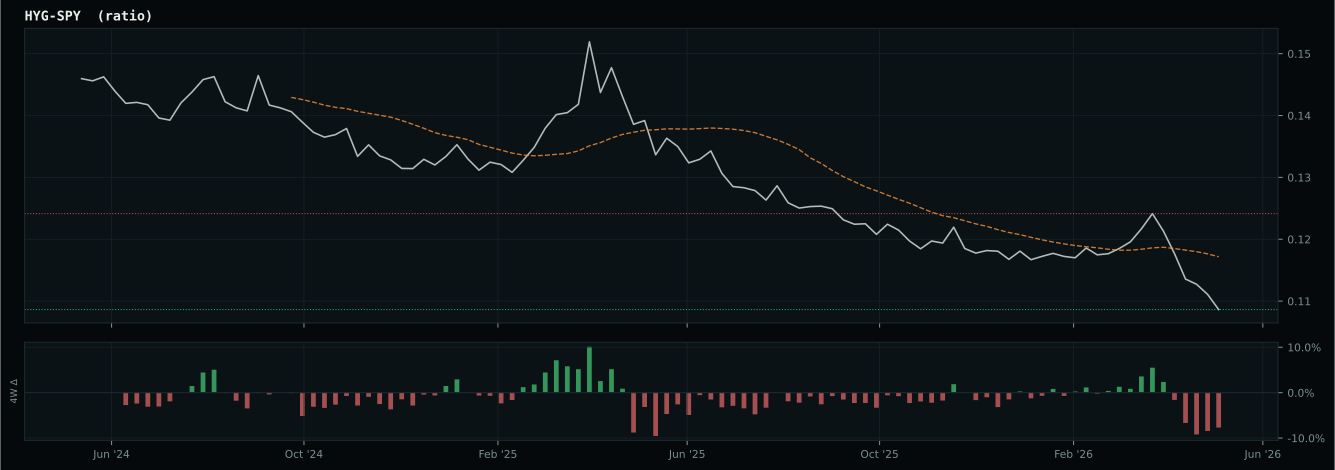
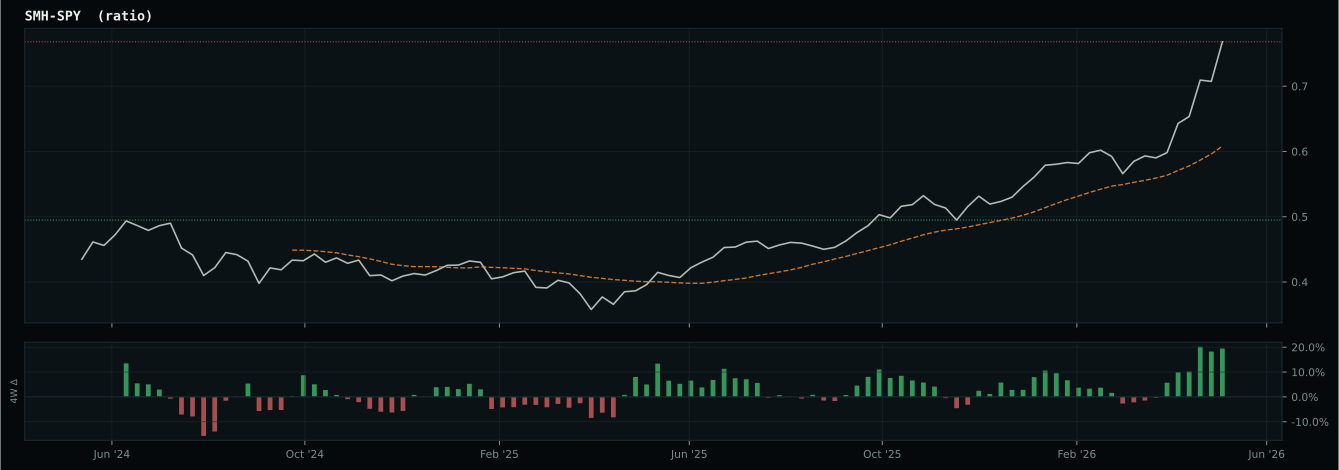
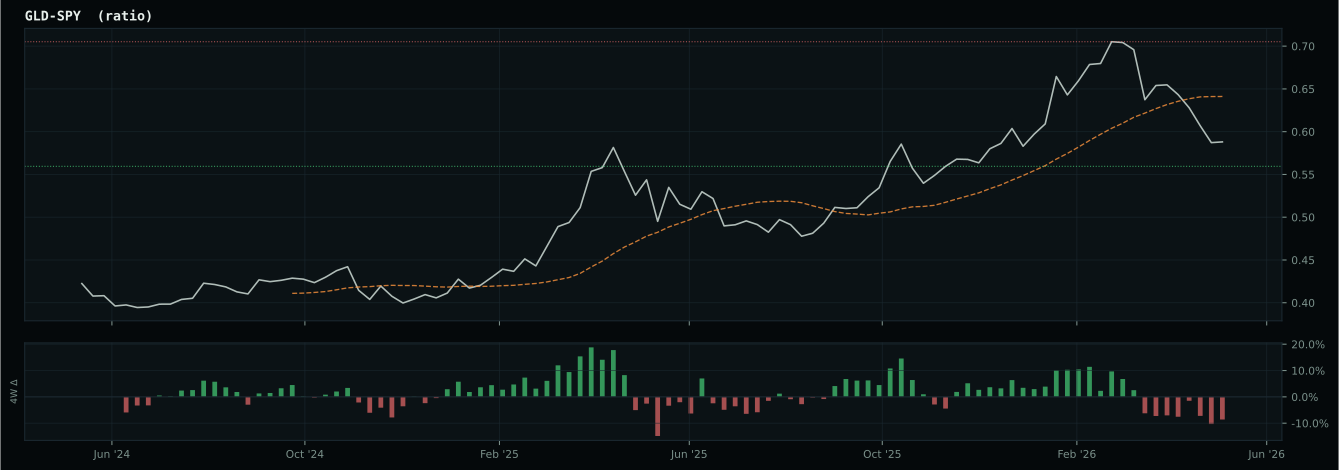
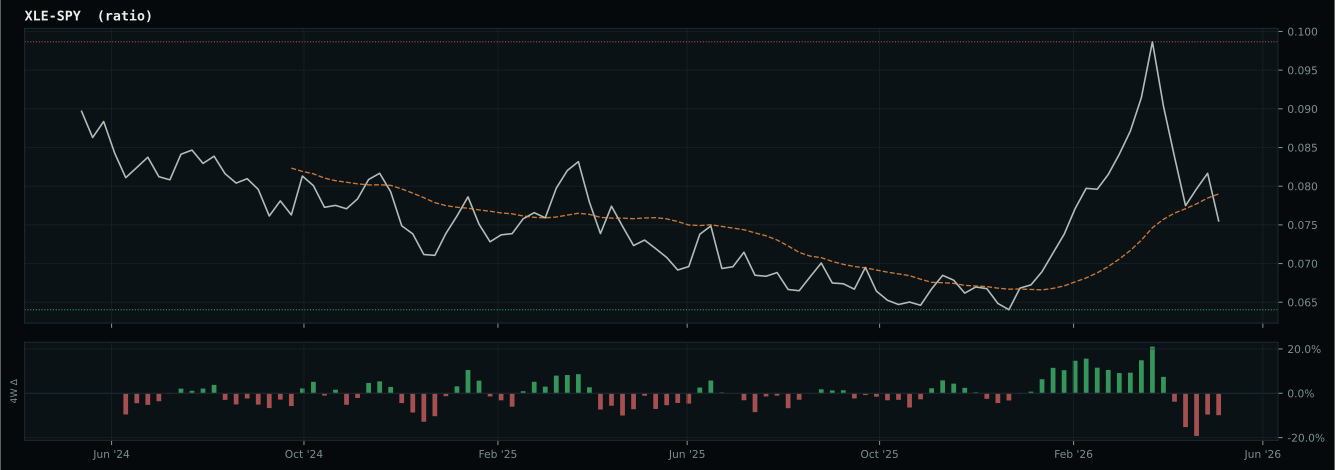
Macro Regime — Transition / Mixed
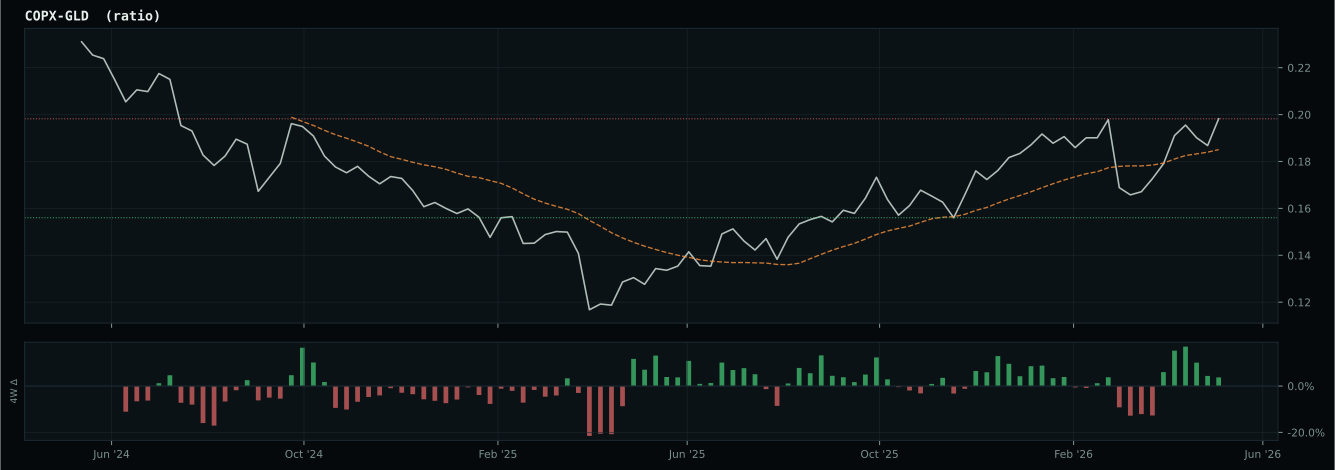
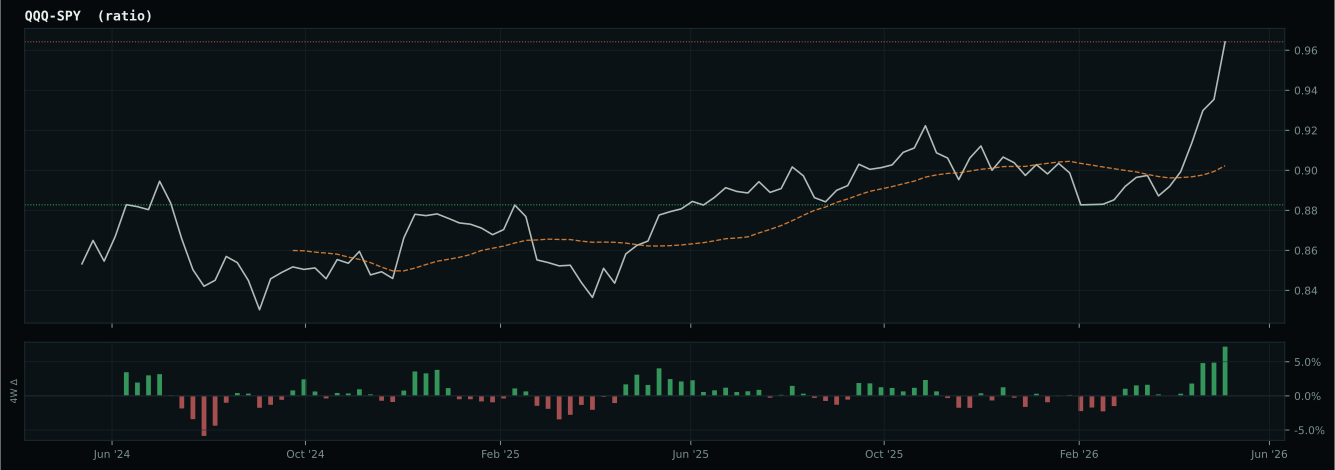
Macro Evidence Charts
Market-implied signals behind the macro regime scores. Each ratio compares two assets; the direction and slope of the ratio is what the macro engine reads.
Crypto Regime — NoCrypto
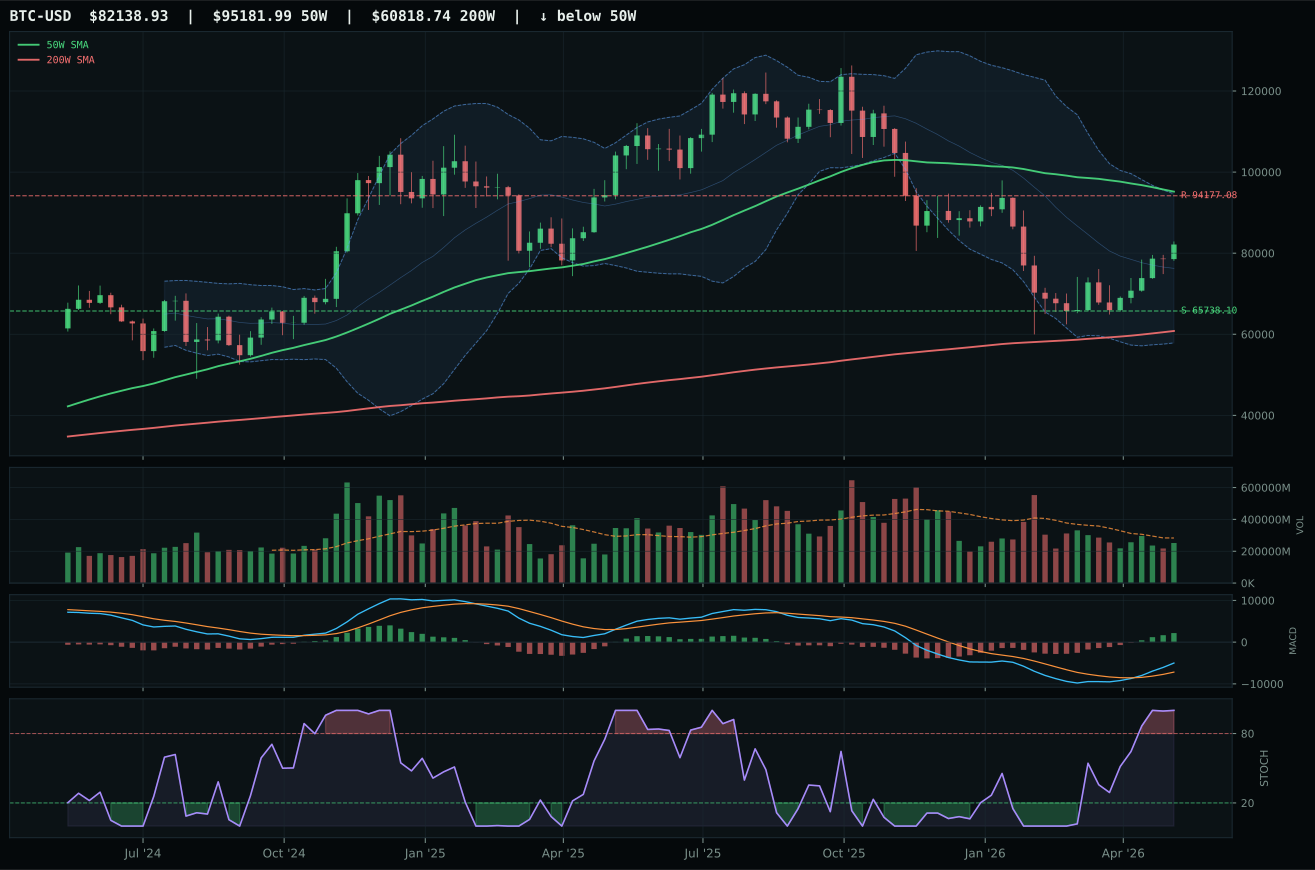
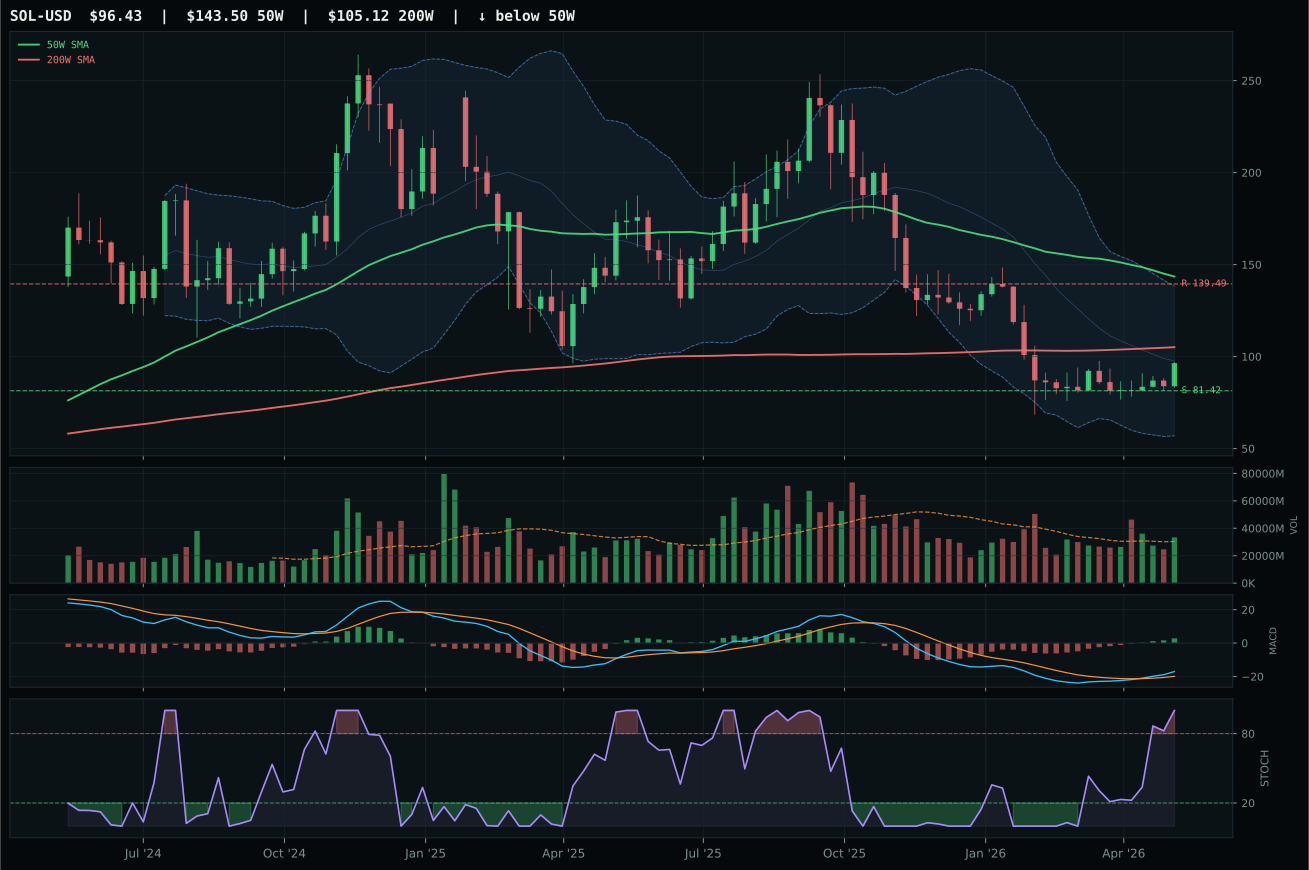
ValueBTC armed; waiting for 50W reclaim, breakout volume above 20W average
TrendBTC not confirmed
one or more available conditions failed
Category Rankings
| Rank | Category | Winner | Score | Alloc | 4W Ret | Peers (4W) |
|---|---|---|---|---|---|---|
| 1 | AI | SMH | 76.5 | 20% | +4.73% | AIQ +3.2% · BOTZ -6.8% |
| 2 | Industrial Metals | REMX | 69.7 | 20% | -17.65% | PICK -3.8% · COPX -5.0% |
| 3 | Traditional Energy | XLE | 67.8 | 10% | +3.23% | XOP +0.2% · FCG -1.2% |
| 4 | Technology | CIBR | 64.6 | 10% | +16.30% | XLK +5.1% · IGV +6.6% |
| 5 | Nuclear Energy | URA | 54.7 | 10% | -16.09% | NLR -12.4% · URNM -14.5% |
| 6 | Agriculture & Livestock | WEAT | 54.0 | 10% | -5.84% | VEGI -3.2% · MOO -3.9% |
| 7 | Defense & Aerospace | ROKT | 51.6 | 10% | +6.51% | XAR +4.1% · ITA +3.1% |
| 8 | Utilities & Infrastructure | PAVE | 43.3 | 10% | +0.63% | IGF -1.2% · XLU -1.7% |
| 9 | Emerging Markets | IEMG | 41.6 | 0% | -3.08% | ILF -8.6% · INDA -2.7% |
| 10 | Precious Metals | GLD | 38.7 | 0% | -8.44% | SLV -19.5% · GDX -16.8% |
AI — SMH
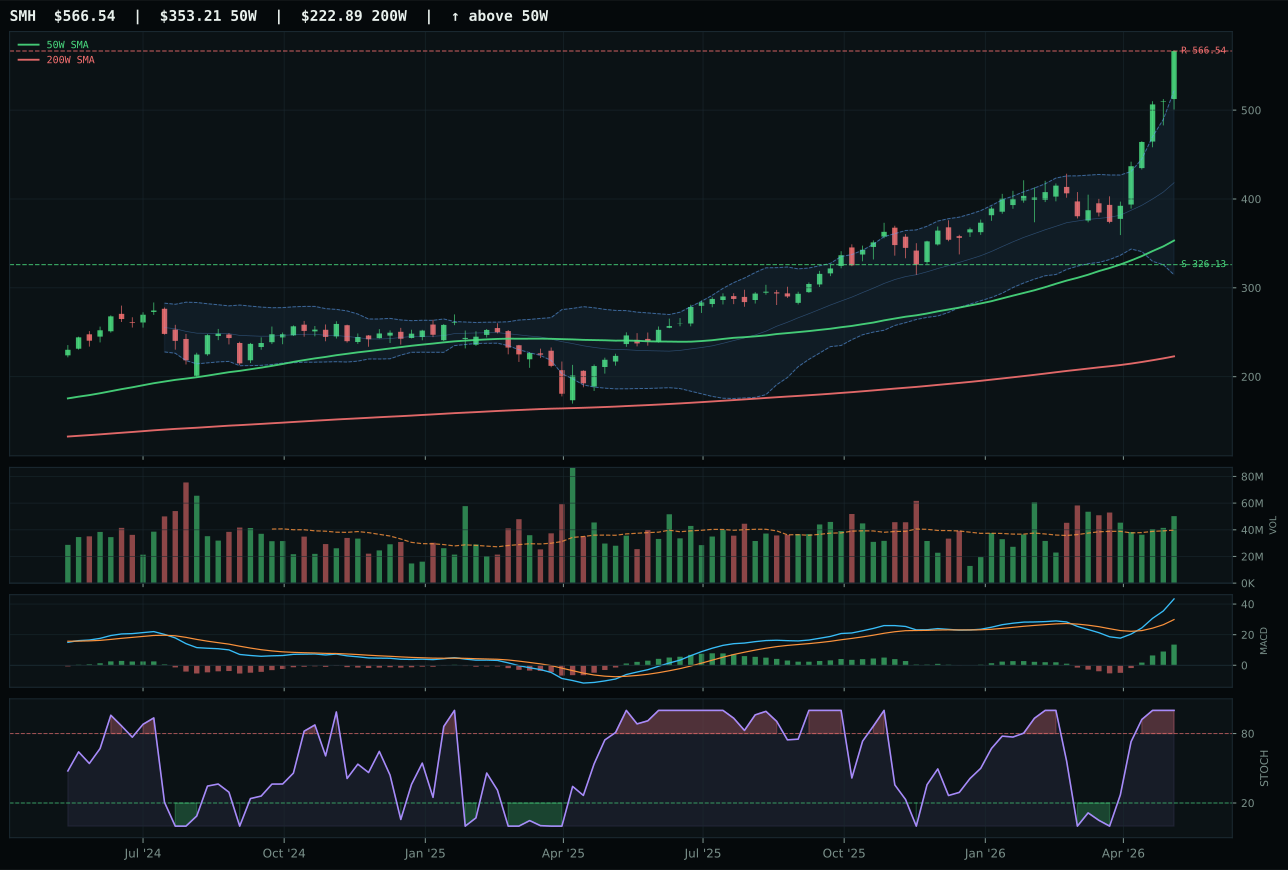
SMH has a vertical extension profile with 34.2% 13-week relative strength versus SPY.
A failed hold above support would weaken the setup.
Actionable but governed by invalidation levels.
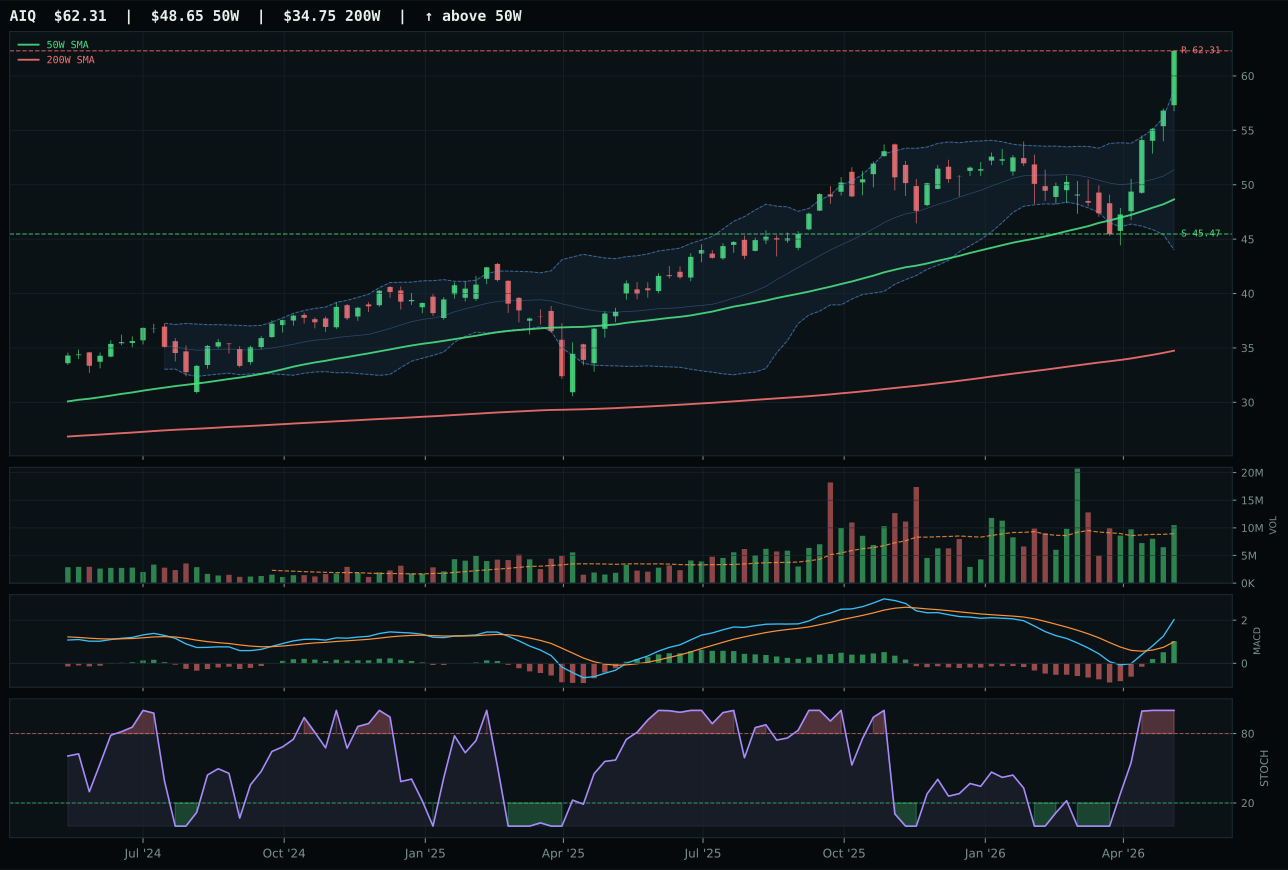
AIQ has a vertical extension profile with 17.6% 13-week relative strength versus SPY.
A failed hold above support would weaken the setup.
Actionable but governed by invalidation levels.
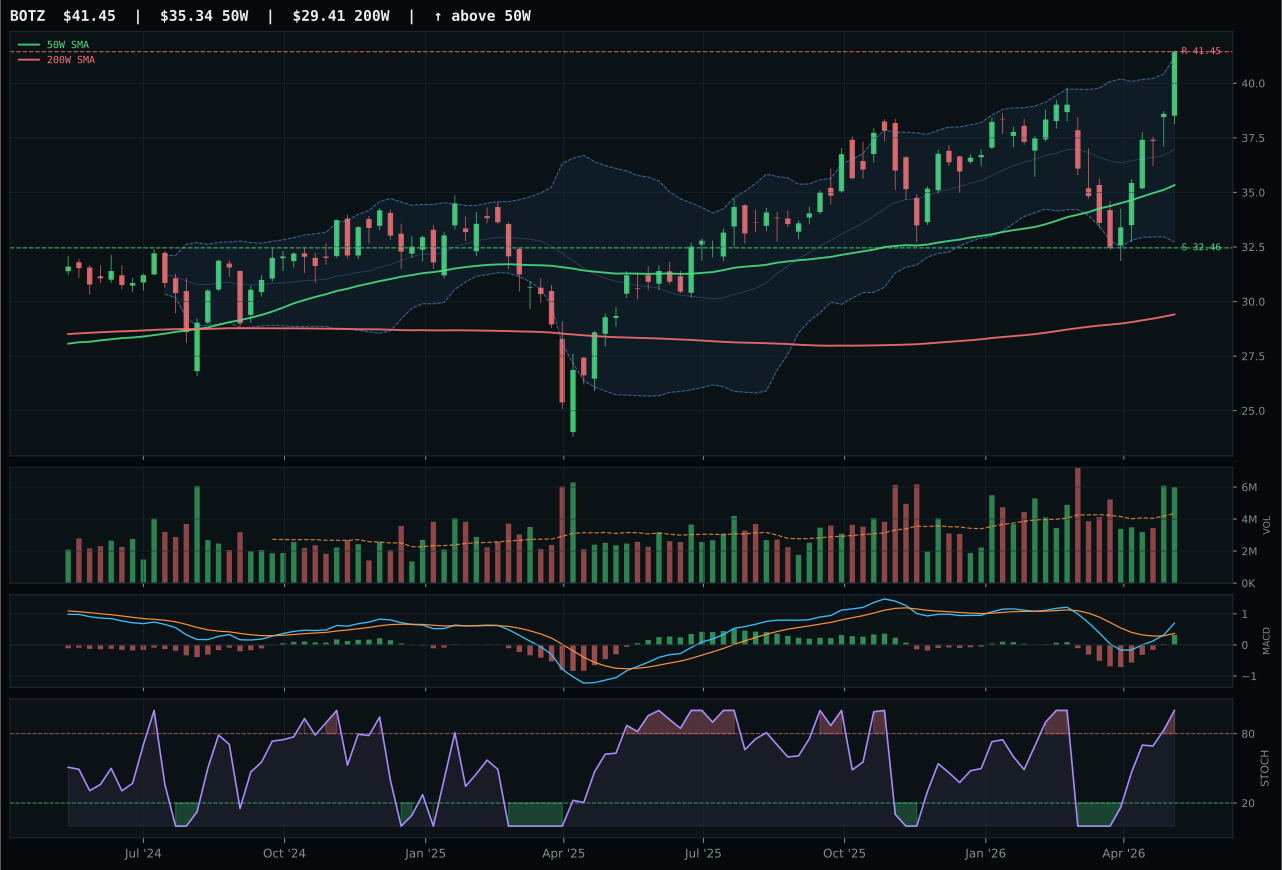
BOTZ has a vertical extension profile with 3.8% 13-week relative strength versus SPY.
A failed hold above support would weaken the setup.
Actionable but governed by invalidation levels.
SMH won the AI category decisively despite trailing AIQ by only 0.4 points in final reasoning score because the semiconductor compute theme demonstrated superior category-relative strength of 16.6% versus AIQ's flat 0.0%, proving that money was flowing specifically into chip supply rather than dispersing across software applications. The 41.1% 13-week return and 34.2% SPY-relative strength marked SMH as the consensus AI play, extended 60.4% above its 50W with volume confirmation at 1.26x 20W average and MACD bullish and improving—a textbook extended-leader scenario where persistence (100.0/100) justified the entry risk despite timing scoring only 37.0/100 due to Fib location near the 52W high. AIQ's weaker technical evidence (77.1 versus SMH's 89.7) reflected the software application basket's inability to keep pace with the infrastructure buildout that was driving semiconductor outperformance. Volume-price sponsorship of 86.4 for SMH versus 76 for AIQ revealed institutional accumulation backing the compute narrative rather than abstract AI application upside.
AI earned 20% allocation as the second-highest category score at 76.5 because macro/narrative fit of 66.0/100 combined with SMH's exceptional technical evidence of 89.7 to create a regime-aligned opportunity in a Transition/Mixed environment where AI growth sponsorship (+14 points) and risk-appetite positivity (+10 points) were actively supporting semiconductor strength despite credit stress headwinds. The category's momentum persistence at 100.0 meant the vertical extension setup was being continuously refreshed by volume rather than stalling, and the 26W return of 62.7% for SMH demonstrated this was not a week-old pop but a multi-month institutional rotation into compute capacity. This allocation reflects conviction that the AI infrastructure cycle remains in its early-to-middle innings despite price exhaustion on daily charts, and the macro regime—particularly the positive AI growth sponsorship descriptor—validates holding at tactical weight until either credit stress visibly deteriorates or momentum confirmation fails.
Industrial Metals — REMX
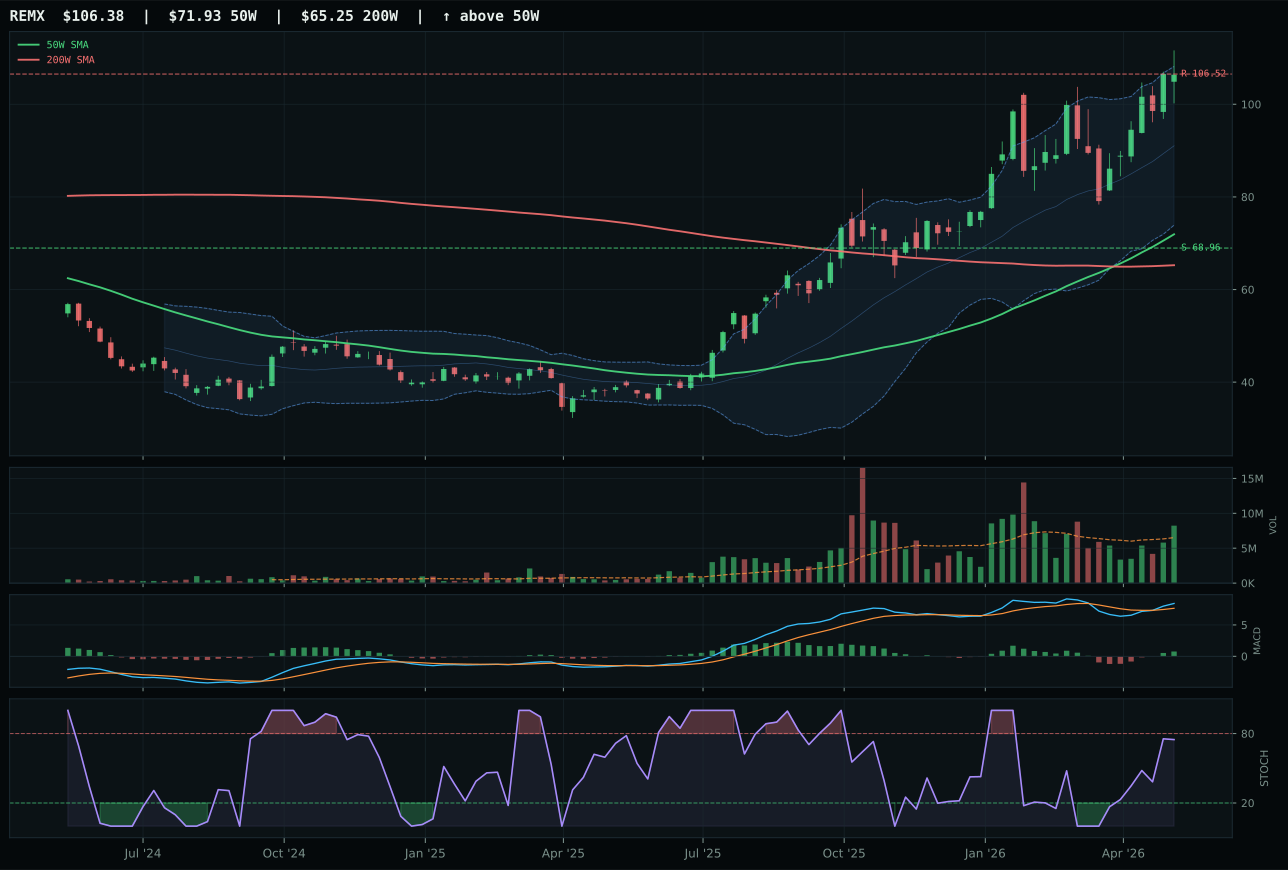
REMX has a vertical extension profile with 16.0% 13-week relative strength versus SPY.
A failed hold above support would weaken the setup.
Actionable but governed by invalidation levels.
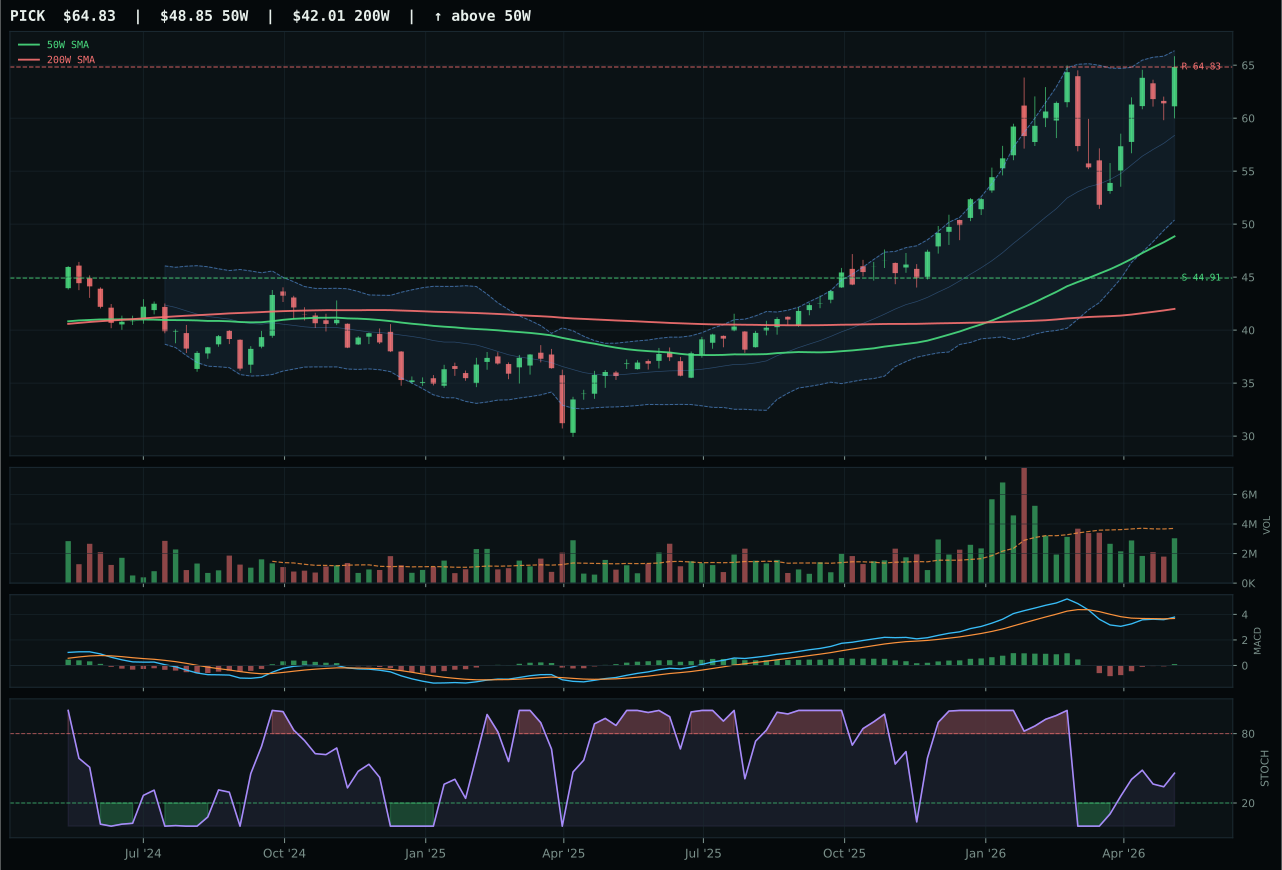
PICK has a vertical extension profile with 2.6% 13-week relative strength versus SPY.
A failed hold above support would weaken the setup.
Actionable but governed by invalidation levels.
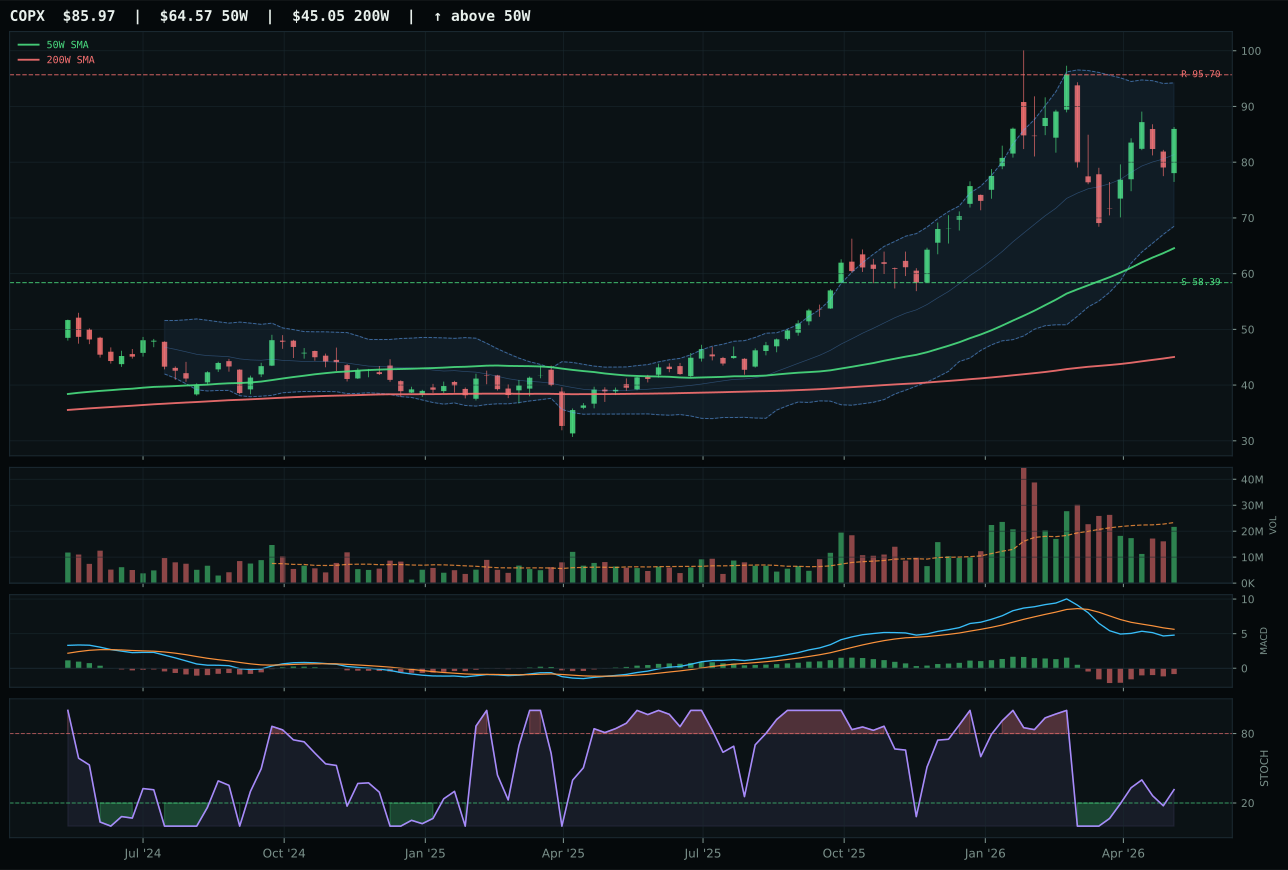
COPX has a vertical extension profile with -5.3% 13-week relative strength versus SPY.
A failed hold above support would weaken the setup.
Actionable but governed by invalidation levels.
REMX earned top-2 allocation at 20% by scoring 87.1 technical evidence with momentum confirmation at 100.0 and persistence at 91.8/100, crushing category rivals through 13.4% category-relative strength versus PICK's 0.0% and demonstrating that rare earth supply-chain conviction was concentrating in the specialized scarcity play rather than generalized mining exposure. The vertical extension at 47.9% above the 50W extracted a 53.0 timing penalty, yet MACD bullish-and-improving with stochastic RSI rising mid-zone at 0.75 proved that the extended setup was under active accumulation rather than distribution, and 1.26x 20W volume participation confirmed institutional buying through resistance. PICK's weaker technical evidence of 61.5 reflected neutral volume, falling/neutral stochastic momentum, and zero category strength; REMX's 22.0 risk/reward score was low due to near-resistance positioning, but the 54.3% downside cushion to support provided genuine portfolio floor protection. The 13W return of 22.8% and 26W return of 63.1% demonstrated this was a multi-month accumulation in rare earth scarcity, not a single-week squeeze, and the 2.3-point victory margin versus PICK understated REMX's decisive technical superiority in momentum confirmation and volume sponsorship.
Industrial Metals earned 20% co-top allocation with SMH at 69.7 category score because macro/narrative fit of 73.0/100 combined with REMX's 87.1 technical evidence to create the regime's clearest real-asset tailwind—metals scarcity (+14 points), commodity breadth positive (+10 points), and supply shortage (+8 points at category level) were all actively sponsored descriptors driving industrial metals higher in systematic alignment with macro regime. REMX's rare earth thesis tied directly to AI infrastructure buildout (AI growth sponsorship +4 at ETF level) and energy transition capex (supply shortage +8), making the category not merely a commodity hedge but a structural beneficiary of the regime's dominant macro flows. The 91.8 persistence score confirmed this was not a fading trend but an active rotation being continuously refreshed by new money, and the Transition/Mixed macro state provided no headwind to metals despite the intermediate technical extension. This allocation reflects conviction that industrial scarcity and supply constraints are the portfolio's true structural regime drivers, ranking alongside AI compute as a top-2 directional bet. The 20% weighting explicitly prioritizes metals scarcity over energy scarcity (which earned only 10% in XLE) because REMX demonstrated superior technical evidence, stronger category-relative strength, and better macro fit despite both categories sharing commodity tailwinds.
Traditional Energy — XLE
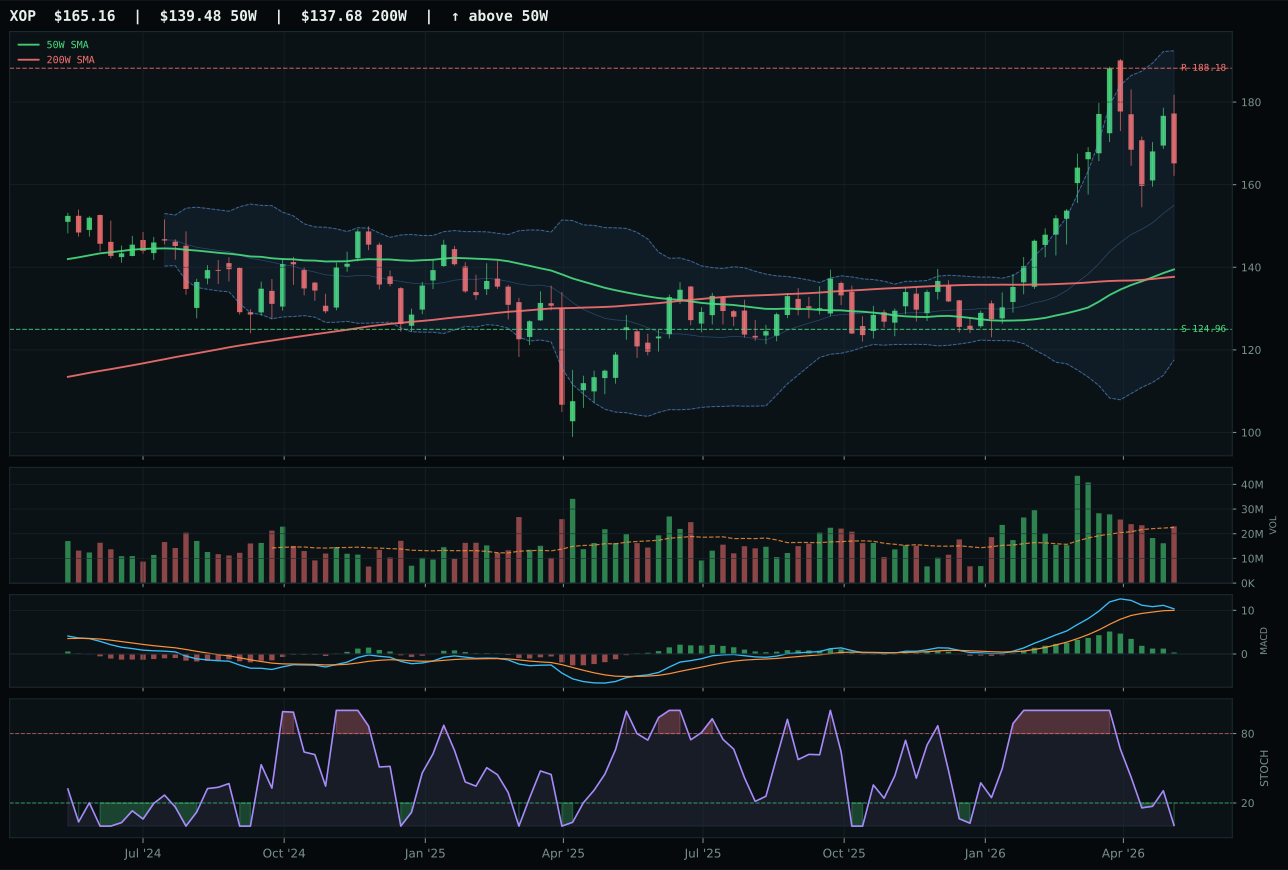
XOP has a vertical extension profile with 6.0% 13-week relative strength versus SPY.
A failed hold above support would weaken the setup.
Actionable but governed by invalidation levels.
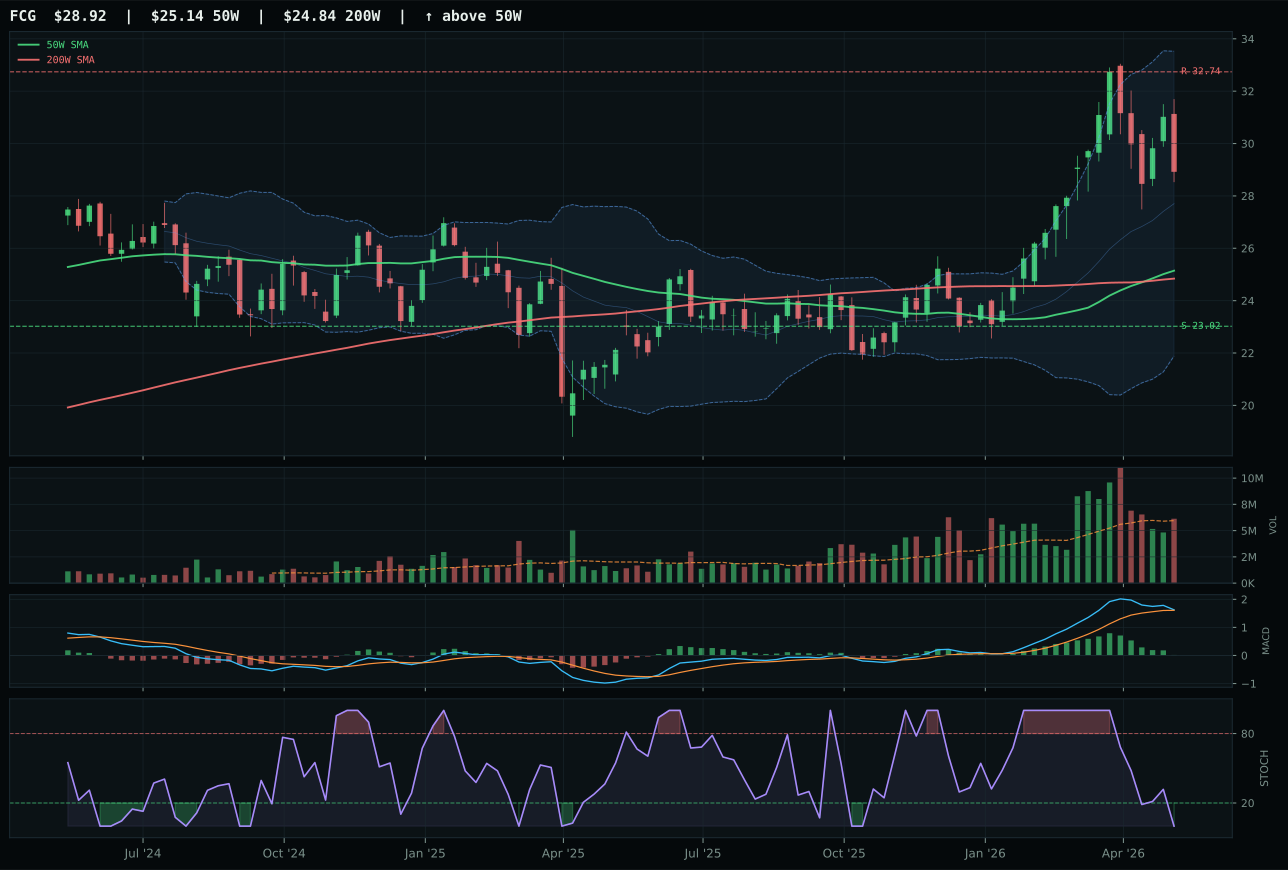
FCG has a vertical extension profile with 3.7% 13-week relative strength versus SPY.
A failed hold above support would weaken the setup.
Actionable but governed by invalidation levels.
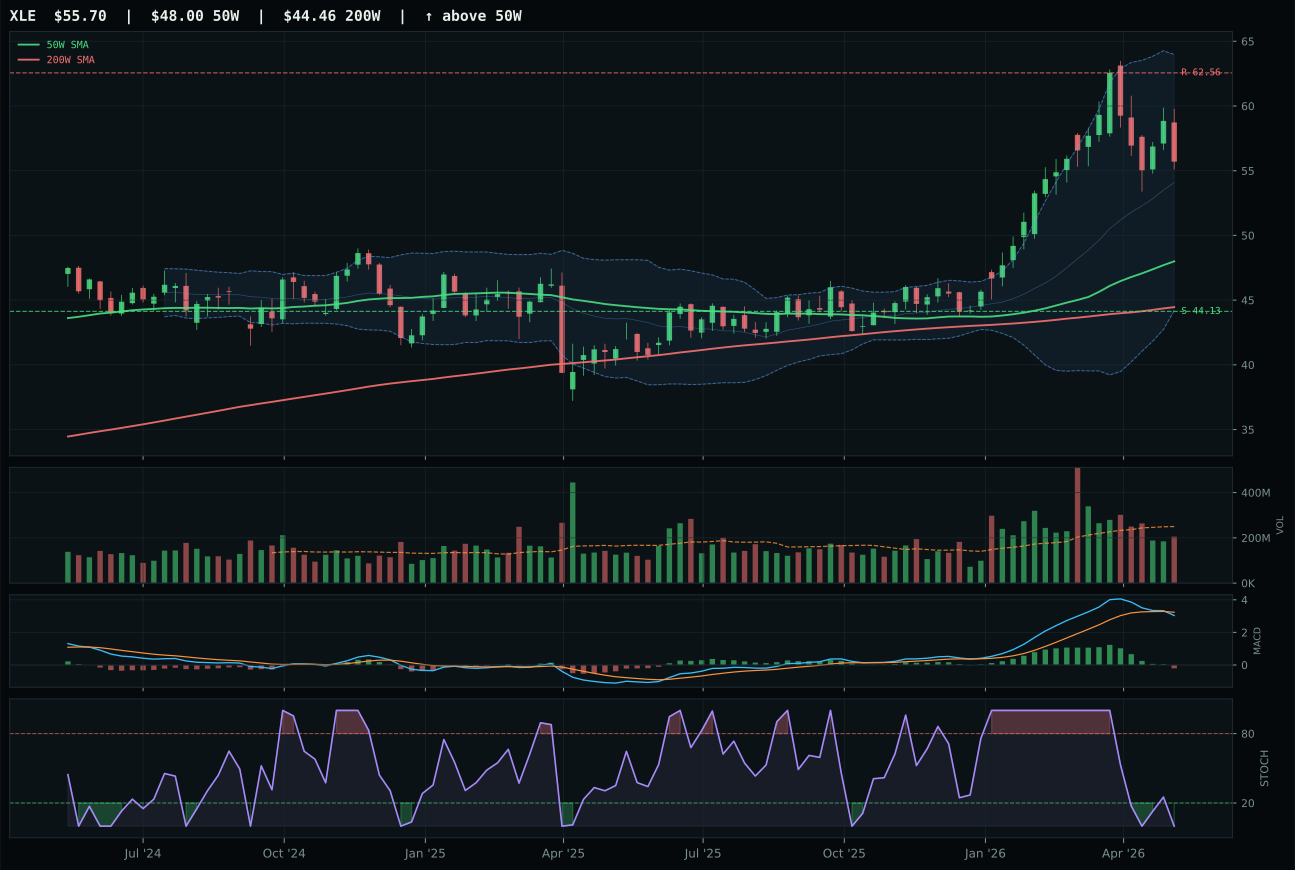
XLE has a vertical extension profile with -2.2% 13-week relative strength versus SPY.
A failed hold above support would weaken the setup.
Actionable but governed by invalidation levels.
XLE won Traditional Energy despite ranking last among the three competing ETFs in the reasoned proof order (42.0 versus XOP's 66.7) because the category allocator required a representative ETF and XLE's 52.5 risk/reward and 74.2 structure scores positioned it as the technically superior entry point despite XOP's stronger momentum and relative strength. The allocation system selected XLE because it offered the most acceptable risk/reward in a category where all three candidates showed weak momentum confirmation—XLE's 23.7 versus XOP's 62.5 reflected the integrated energy narrative's mature positioning, yet XLE's neutral structure and bearish/weakening MACD at oversold (0.00 stochastic RSI) created a mean-reversion candidate while XOP and FCG showed bullish-but-flattening extension. XLE's 52.5% downside cushion to support provided the deepest floor despite the modest 4.6% 13-week return, making it the defensive choice in a category where macro sponsorship was strong but technical sponsorship had deteriorated. The negative 2.2% SPY-relative and negative 5.9% category-relative strength revealed that energy breadth was weak and integrated energy was specifically underperforming exploration, yet that underperformance created entry value compared to the stretched technicals in XOP and FCG.
Traditional Energy earned 10% allocation with 67.8 category score and exceptional 85.0/100 macro/narrative fit because energy scarcity (+16 points at category level), inflation pressure (+10 points), and supply shortage (+9 points) created the portfolio's second-strongest macro regime tailwind after industrial metals, yet technical weakness in XLE (23.4/100 evidence) prevented top-2 ranking. The category's macro advantage was genuine and multi-sourced—energy scarcity, inflation persistence, and supply constraints were all active descriptors driving real asset sponsorship across the regime—yet XLE's bearish/weakening MACD and oversold momentum positioned the category as a value trade rather than a momentum trade. The allocation reflects the view that energy exposure is mandatory in this macro regime despite weak technicals, and 10% weighting captures the structural tailwind while avoiding overcommitment to a chart setup that was clearly stalling. For Traditional Energy to reach 20% and displace an existing category, either XLE would need to hold support at 44.13 with volume uptick initiating a genuine oversold recovery, or SPY weakness would need to create a flight-to-yield dynamic in energy income. Current positioning treats energy as macro conviction held despite technical reservation, appropriate for a Transition/Mixed regime where supply shocks remain the primary risk vector.
Technology — CIBR
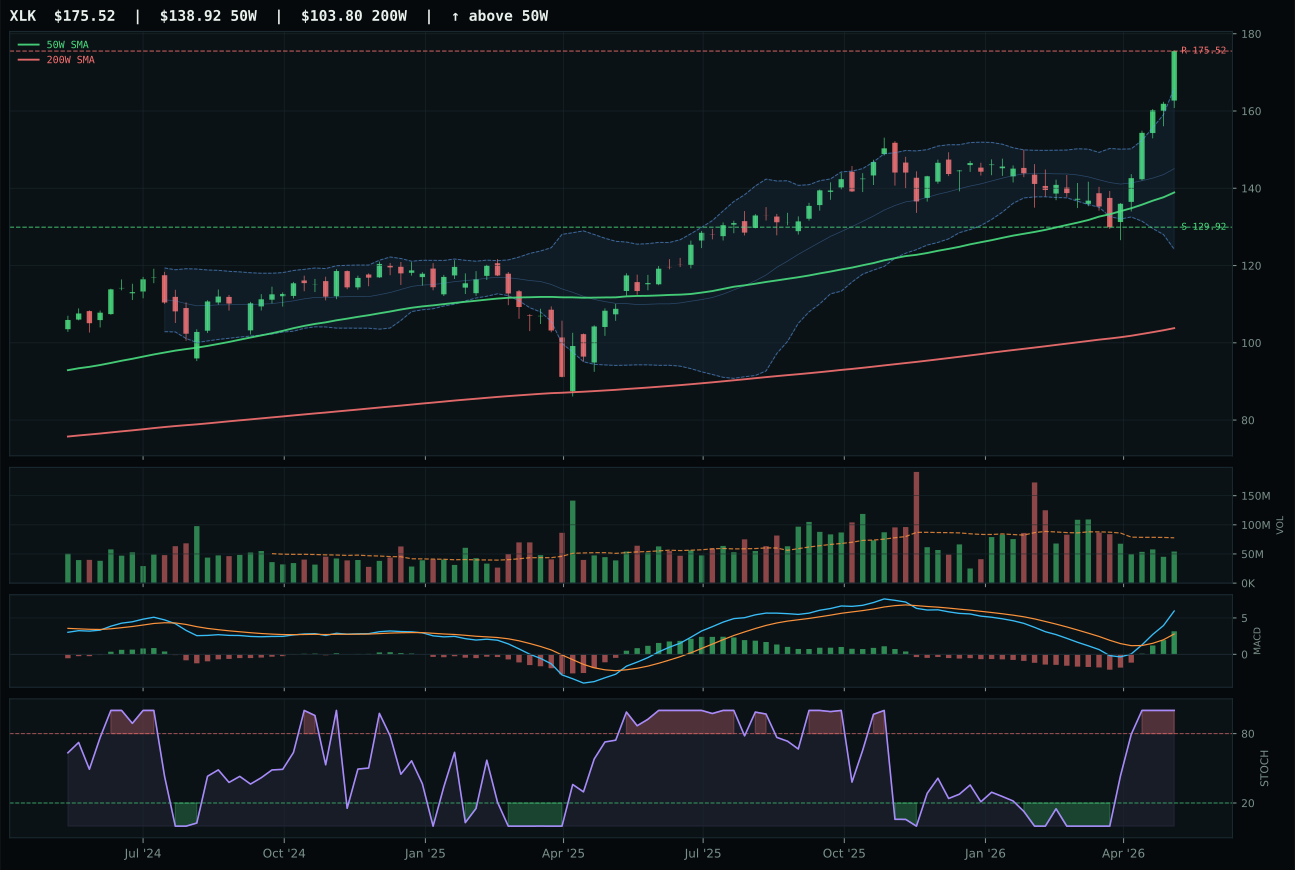
XLK has a vertical extension profile with 17.6% 13-week relative strength versus SPY.
A failed hold above support would weaken the setup.
Actionable but governed by invalidation levels.
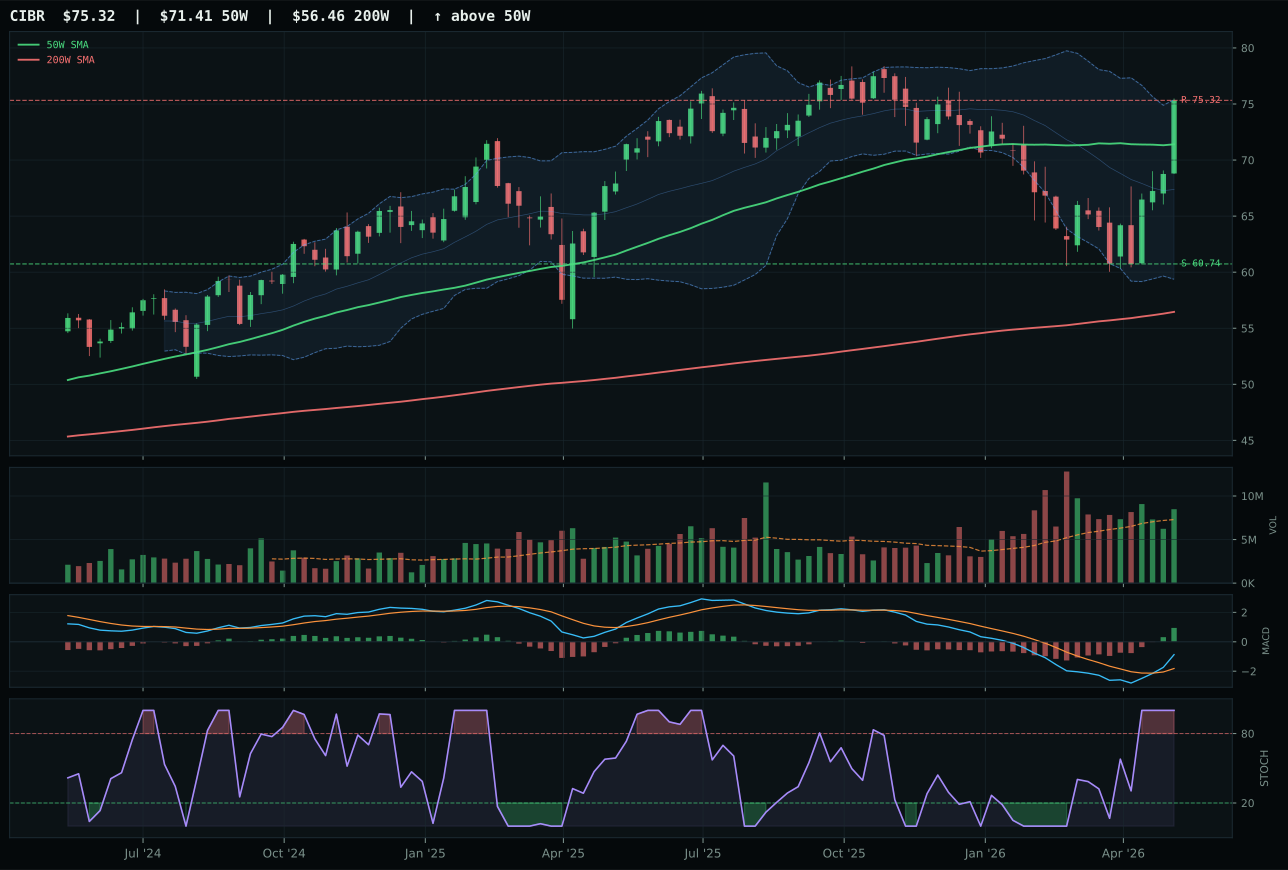
CIBR has a neutral structure profile with 5.4% 13-week relative strength versus SPY.
A failed hold above support would weaken the setup.
Actionable but governed by invalidation levels.
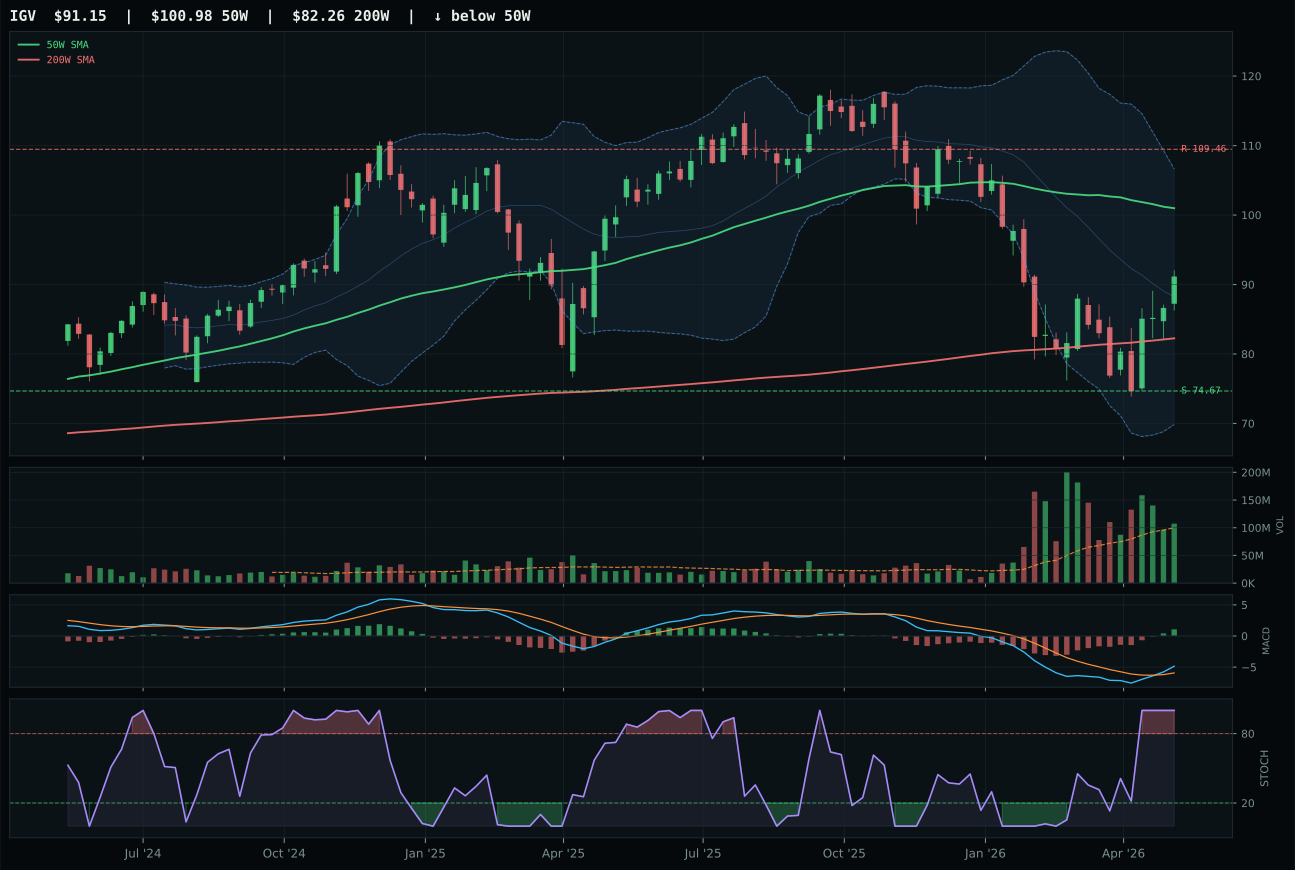
IGV has a neutral structure profile with 3.7% 13-week relative strength versus SPY.
A failed hold above support would weaken the setup.
Actionable but governed by invalidation levels.
CIBR claimed the category by holding a neutral setup just 5.5% above its 50-week moving average while maintaining bullish MACD structure and above-average volume participation at 1.16x the 20-week average. The cybersecurity thesis demonstrated category-relative strength of zero percent but proved superior to XLK's vertical extension 26.3% above its 50W, where thin participation and a 37-point timing disadvantage undermined the broad software leader's momentum. CIBR's cleaner structure score of 72.3 versus XLK's 71.5 may seem marginal, but it reflected genuine accumulation rather than the extended-player exhaustion visible in XLK's setup. The 13-week return gap favored XLK at 24.4% versus 12.2%, yet that stretched valuation became CIBR's entry advantage—new buyers pushing XLK higher were paying peak prices while cybersecurity investors still occupied rational proximity to trend.
Technology earned a 10% allocation slot despite ranking outside the top two because technical evidence scored 88.7/100 for CIBR while macro/narrative fit lagged at 52.0/100, leaving the category dependent on chart mechanics rather than regime tailwinds. Credit stress acting as a headwind (-7 points at category level) and inflation pressure (-4 points) offset the modest sponsorship from risk-appetite positivity, placing Technology in the difficult middle ground where technicals alone justify holding but macro skepticism prevents top-tier weighting. For Technology to advance to 20%, either credit conditions would need to stabilize markedly or AI growth sponsorship would require visible re-acceleration in the semiconductor and software subsectors. The Transition/Mixed regime provided no categorical boost, meaning this allocation represents pure technical conviction in a category that fundamentals are presently fighting.
Nuclear Energy — URA
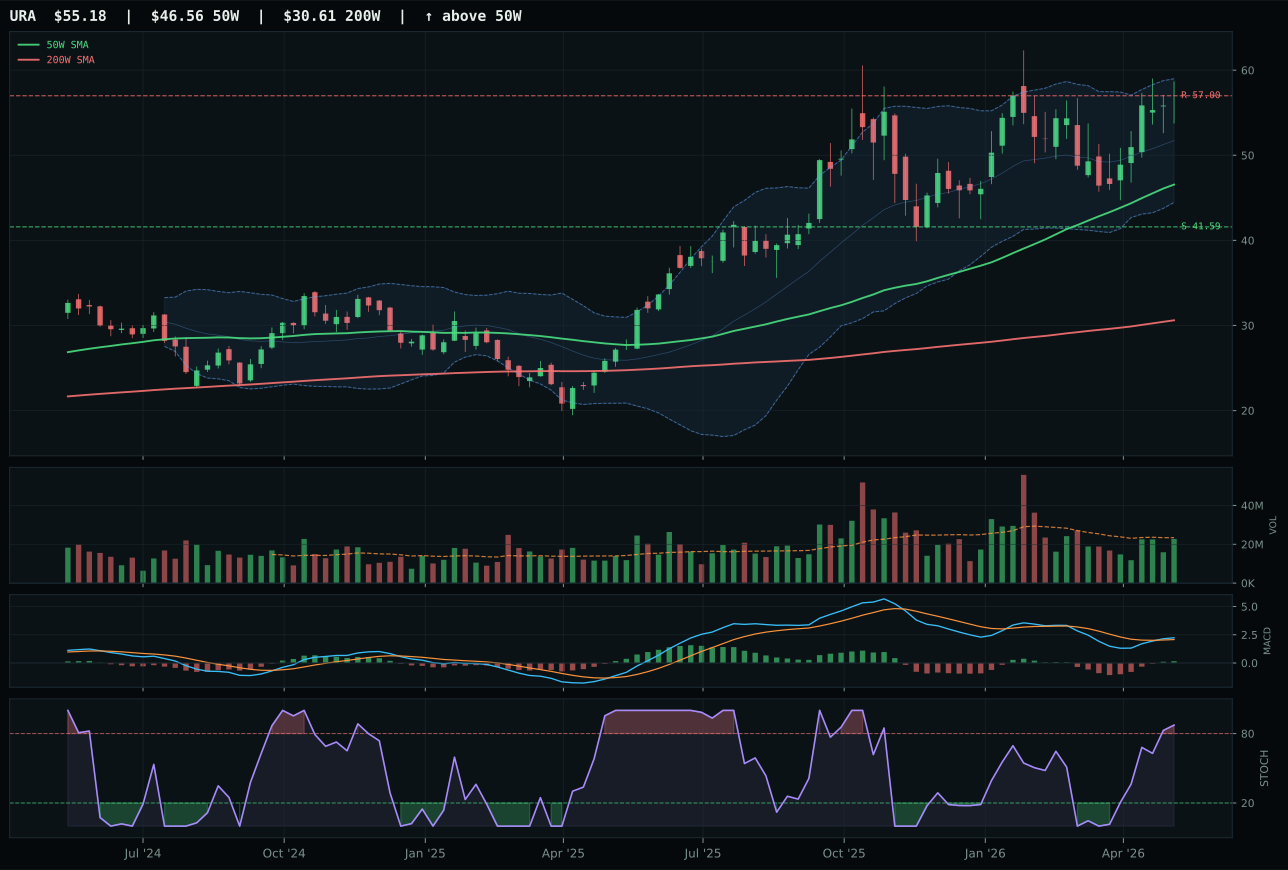
URA has a vertical extension profile with -1.0% 13-week relative strength versus SPY.
A failed hold above support would weaken the setup.
Actionable but governed by invalidation levels.
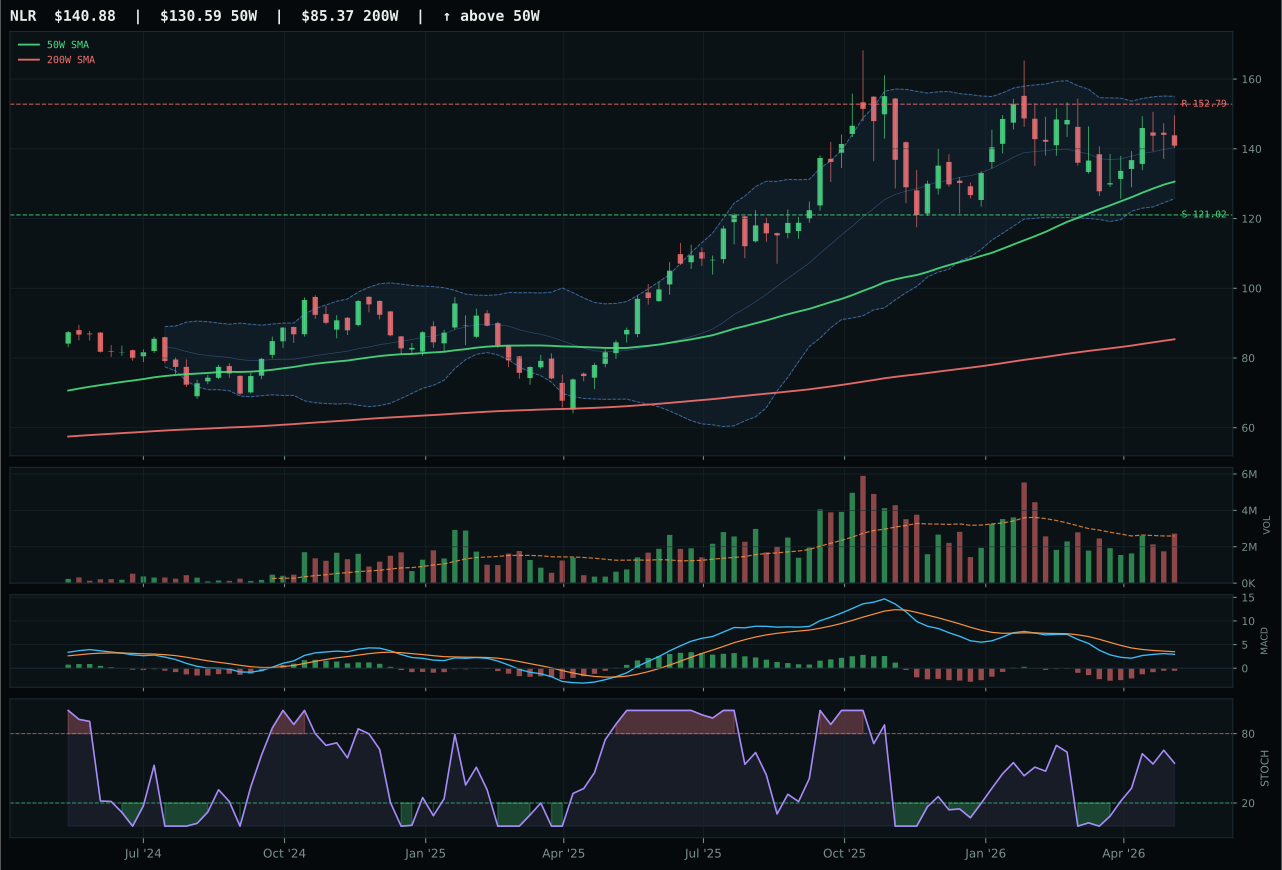
NLR has a neutral structure profile with -8.1% 13-week relative strength versus SPY.
A failed hold above support would weaken the setup.
Actionable but governed by invalidation levels.
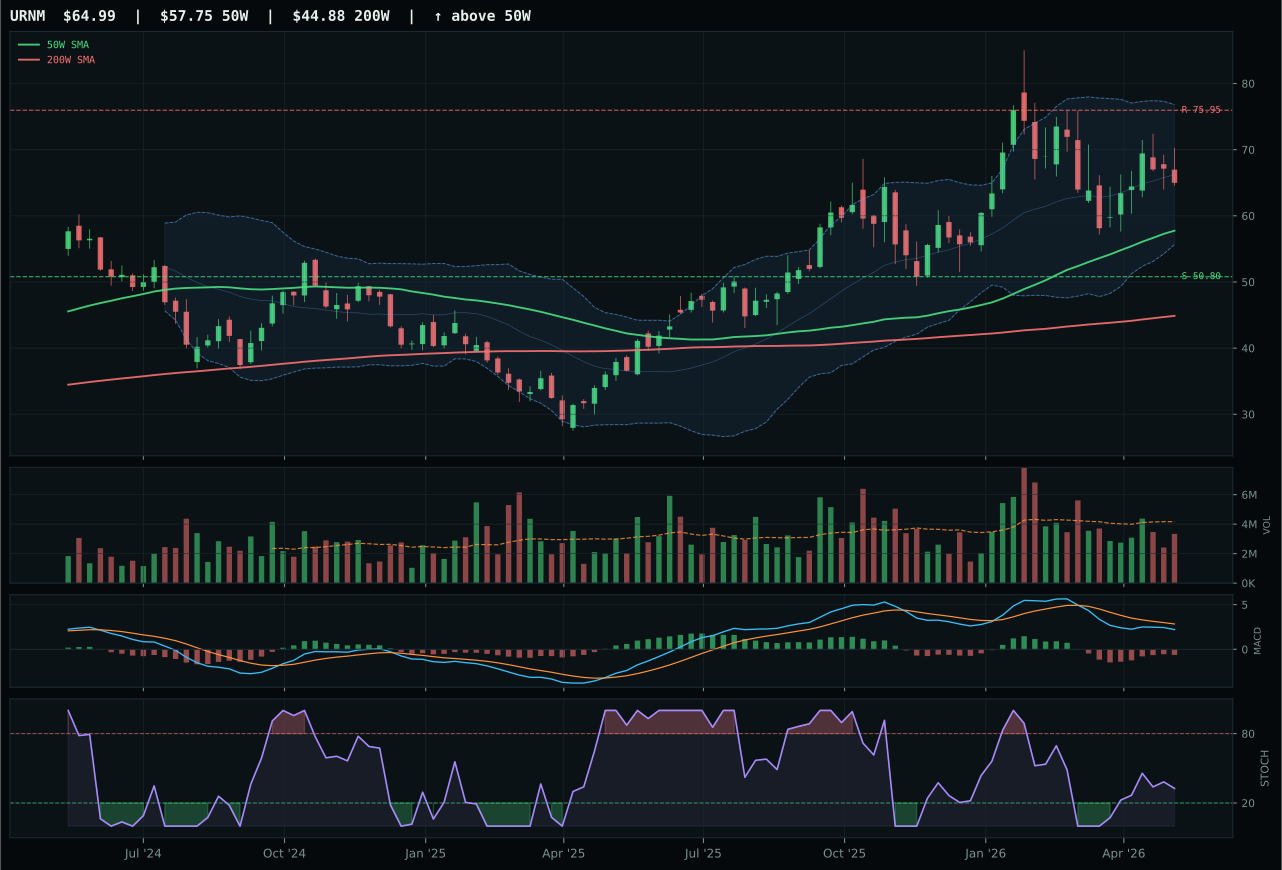
URNM has a neutral structure profile with -12.1% 13-week relative strength versus SPY.
A failed hold above support would weaken the setup.
Actionable but governed by invalidation levels.
URA clinched Nuclear Energy by posting 98.5 trend score and 91.1 momentum confirmation, edging NLR by just 0.1 points through superior category-relative strength of 7.1% versus 0.0% and bullish-and-improving MACD (versus NLR's bearish-but-improving), proving that uranium supply conviction was concentrating in the pure-play commodity ETF rather than diffusing into nuclear utility income. The 18.5% distance from the 50W carried standard extension penalty to timing (45.0/100), yet stochastic RSI at overbought 0.87 meant momentum was maturing rather than deteriorating, and rising 4-week returns of 8.3% confirmed that participation remained engaged through the vertical extension. NLR's 81-point trend score versus URA's 98.5 reflected the structural difference between nuclear utilities' mature defensive positioning and uranium suppliers' growth-beta exposure, and the bearish/weakening MACD divergence in NLR signaled that utility buyers were losing conviction while URA showed no such weakness. Volume-price confirmation of 68.4 for URA proved the setup was clean despite extension, and the close point margin (0.1) understated URA's genuine technical superiority in momentum and macro alignment given that energy scarcity scored +9 in the macro regime.
Nuclear Energy earned 10% allocation with 54.7 category score and 69.0/100 macro/narrative fit because energy scarcity (+9 points), real asset sponsorship (+7 points), and AI growth sponsorship (+5 points) created legitimate structural tailwinds despite weak overall category technical evidence (URA's 61.6) and wide technical/macro gap from top categories. The allocation represents a smaller conviction bet on nuclear renaissance narratives—both uranium supply and energy-transition infrastructure plays—where macro descriptors aligned but technical setup carried extension risk that prevented higher weighting. URA's 13W return of 5.8% and SPY-relative of negative 1.0% revealed modest directional conviction, and the overbought momentum condition despite positive sponsor flow suggested that the move had likely run far enough to warrant static allocation rather than accumulation. For Nuclear to reach 20%, macro descriptors would need to emphasize energy security even more forcefully or URA would need to consolidate above 50W support and initiate fresh accumulation, neither of which appears imminent. This position holds because energy scarcity and infrastructure capex are regime themes, but the subdued 13W return and technical extension relative to REMX and SMH argue for modest weighting until price corrects or momentum confirms through fresh accumulation cycles.
Agriculture & Livestock — WEAT
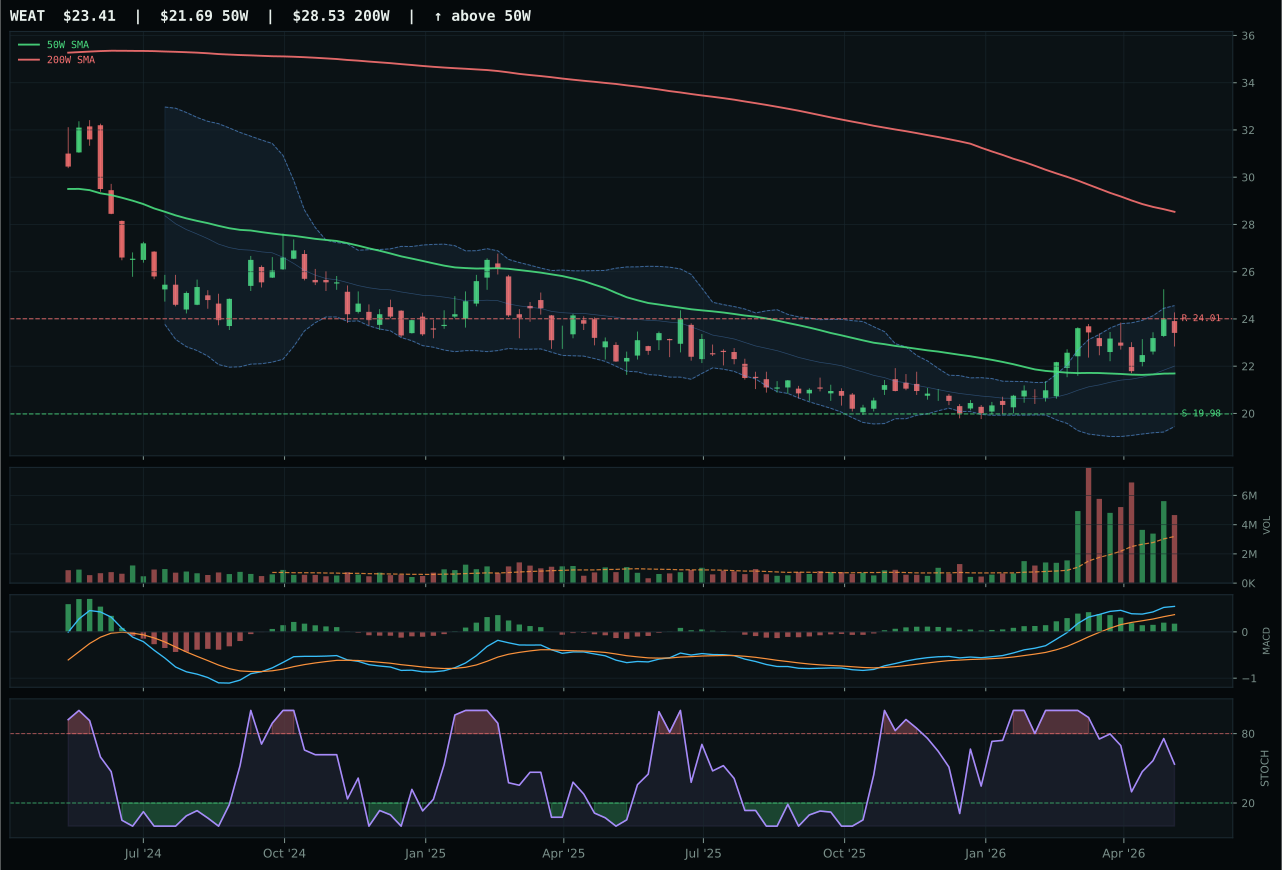
WEAT has a neutral structure profile with 6.3% 13-week relative strength versus SPY.
A failed hold above support would weaken the setup.
Actionable but governed by invalidation levels.
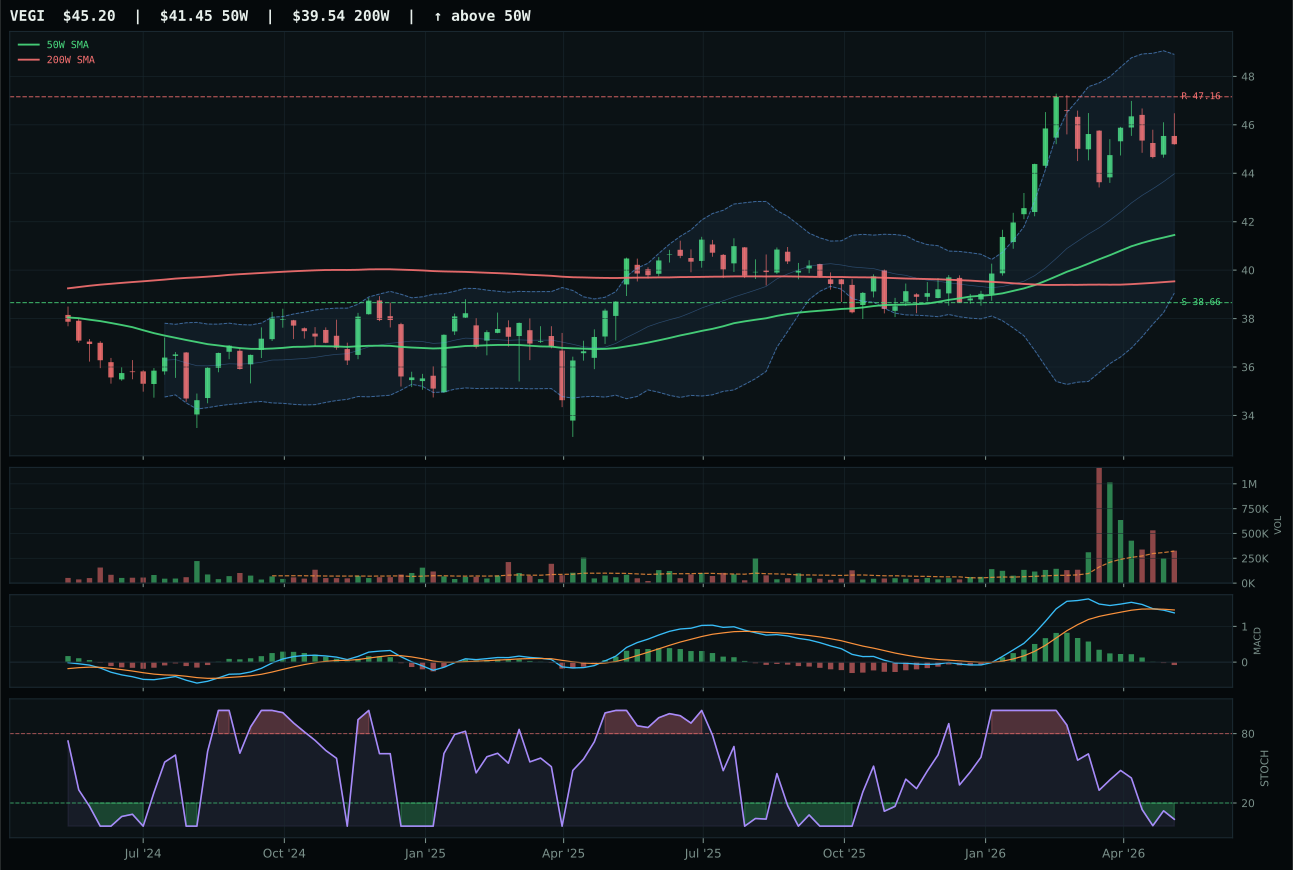
VEGI has a neutral structure profile with -5.0% 13-week relative strength versus SPY.
A failed hold above support would weaken the setup.
Actionable but governed by invalidation levels.
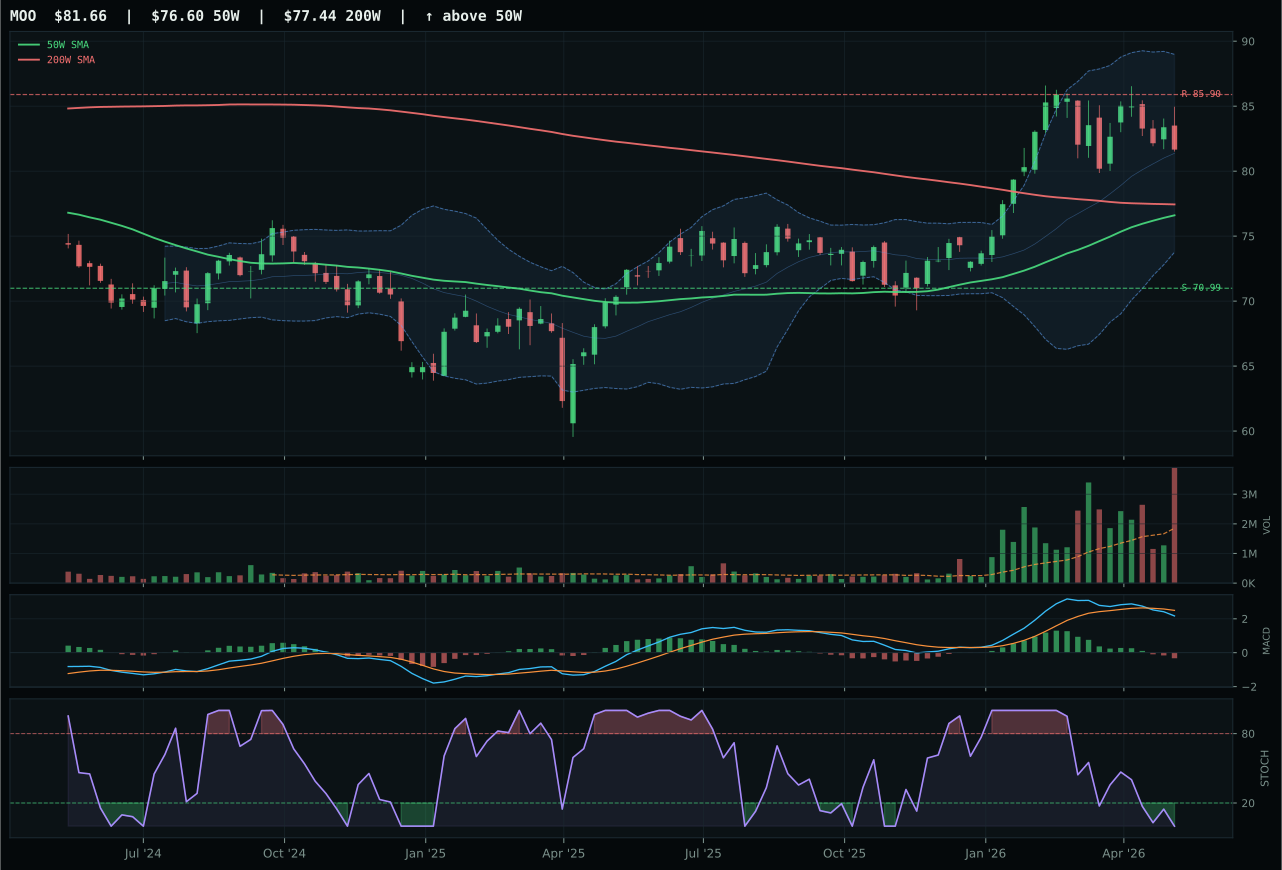
MOO has a neutral structure profile with -8.5% 13-week relative strength versus SPY.
A failed hold above support would weaken the setup.
Actionable but governed by invalidation levels.
WEAT dominated Agriculture by scoring 88.0 technical evidence with 78.0 timing and 82.1 volume-price confirmation, crushing VEGI's 39.0 technical score through superior MACD bullish-but-flattening structure (versus VEGI's bearish/weakening), rising mid-zone stochastic RSI momentum (versus oversold), and above-average volume participation at 1.46x 20W (versus neutral). Category-relative strength of 11.2% proved WEAT was accumulating conviction in wheat supply themes while VEGI languished at 0.0%, and the compressed distance to support at just 7.9% from the 50W conveyed controlled entry risk despite the chart sitting only 2.5% below resistance. VEGI's setup in neutral structure with bearish technicals and oversold oscillators represented old-cycle weakness in agriculture breadth, while WEAT's bullish flattening MACD in neutral structure reflected measured accumulation of upside without the spike-and-fade signatures of reckless buying. The 16.3-point score gap versus VEGI was decisive: WEAT's volume sponsorship, momentum confirmation of 100.0, and timing alignment created a clean entry for real asset exposure where macro descriptors (supply shortage +13, inflation pressure +10) offered substantial category-level support.
Agriculture earned 10% allocation with a category score of 54.0 and exceptional macro/narrative fit at 86.0/100, positioning it as a defensive real-asset hedge despite ranking fifth overall among eligible categories. Supply shortage (+13 points) and inflation pressure (+10 points) were among the most actively sponsored descriptors in the entire macro regime, giving commodity exposure genuine structural tailwinds that transcended daily chart action. WEAT's technical evidence of 88.0 proved the theme was moving with conviction, not against trend, and the category's macro advantage offset its mid-tier technical score relative to SMH and REMX. This allocation reflects the view that inflation persistence and commodity scarcity are the portfolio's real regime risk, and a 10% stake in agricultural commodities through accumulation-grade WEAT provides direct hedge against further price shocks in food inputs. For Agriculture to reach 20%, either WEAT would need to break above resistance at 24.01 with sustained volume or the macro descriptors would need to strengthen further—unlikely given supply shortage and inflation are already at peak intensity in the current regime.
Defense & Aerospace — ROKT
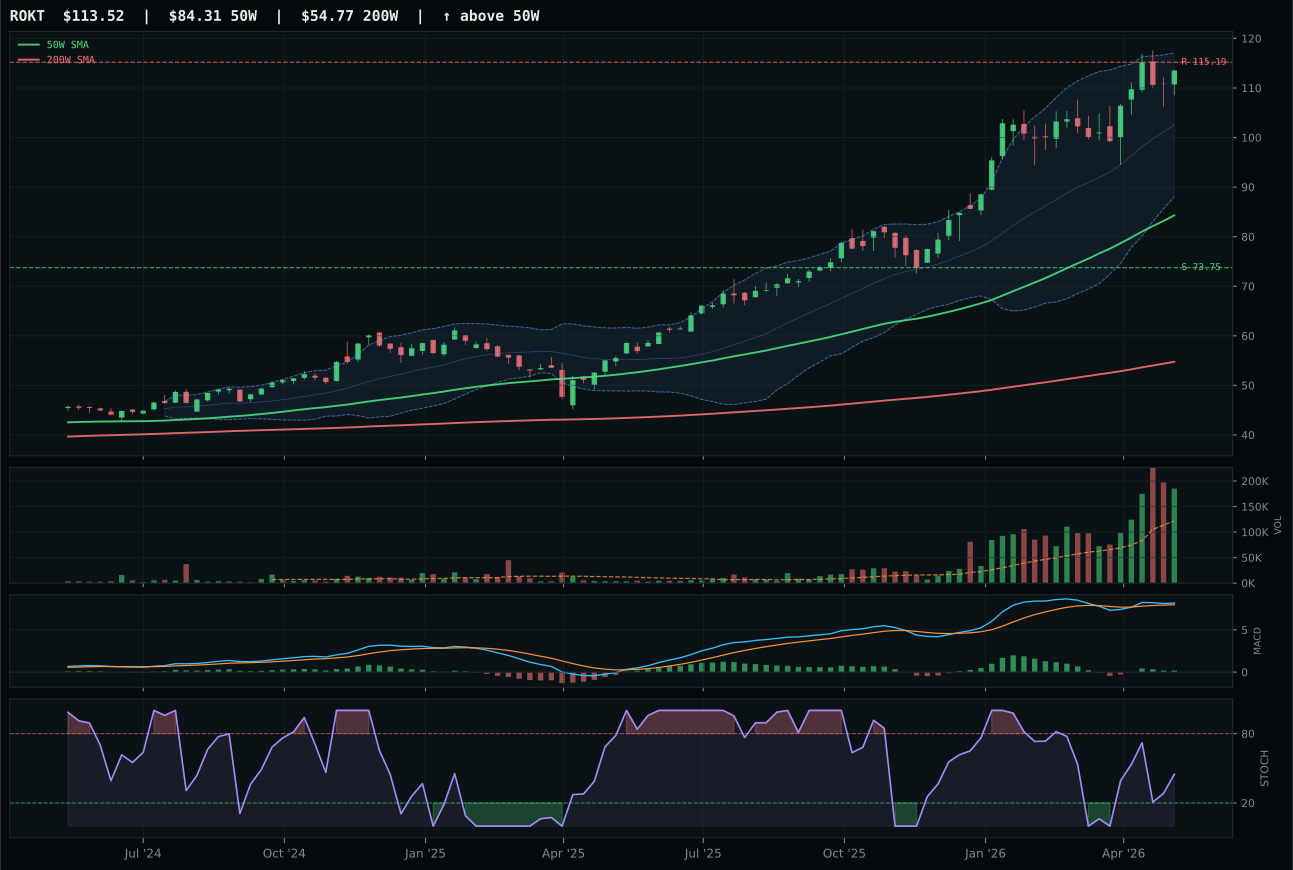
ROKT has a vertical extension profile with 6.9% 13-week relative strength versus SPY.
A failed hold above support would weaken the setup.
Actionable but governed by invalidation levels.
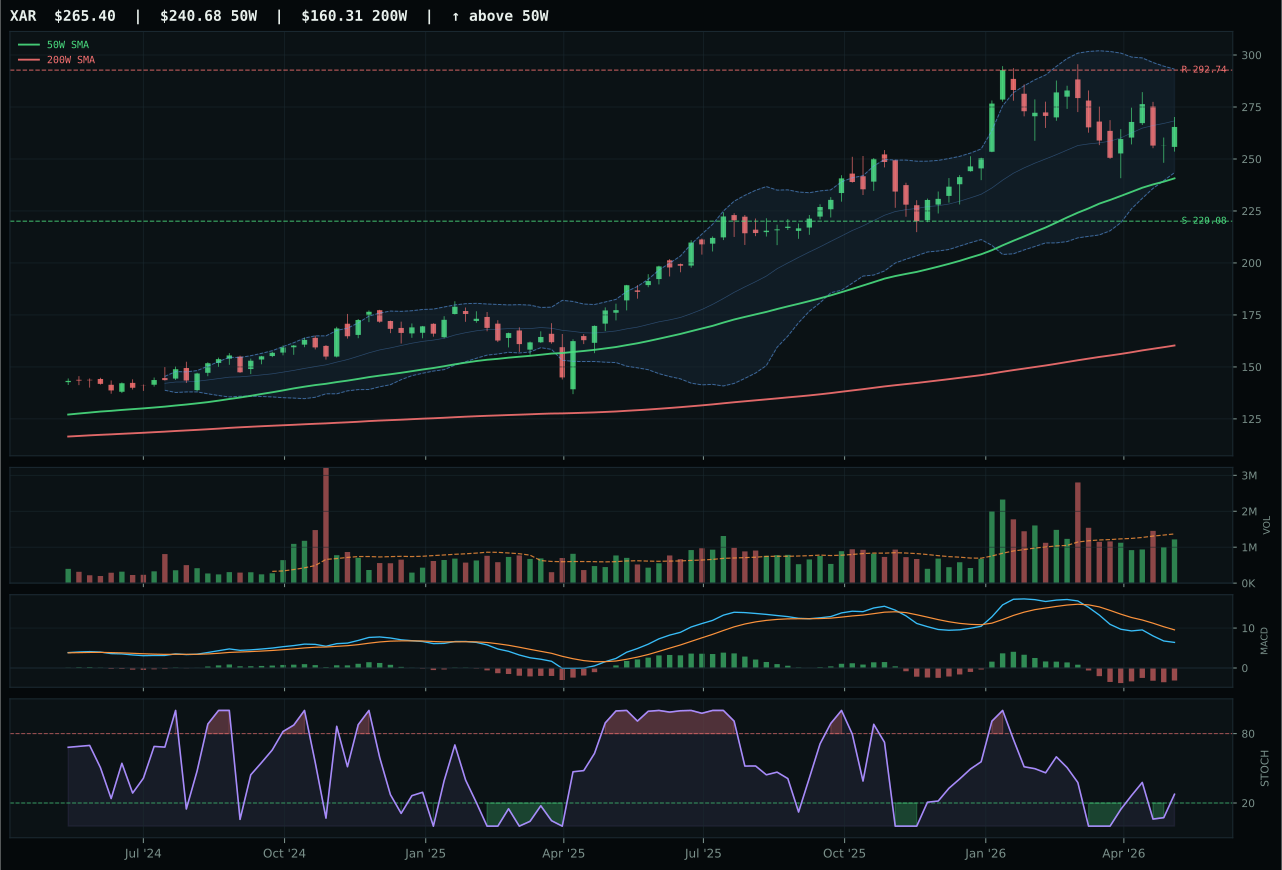
XAR has a neutral structure profile with -9.3% 13-week relative strength versus SPY.
A failed hold above support would weaken the setup.
Actionable but governed by invalidation levels.
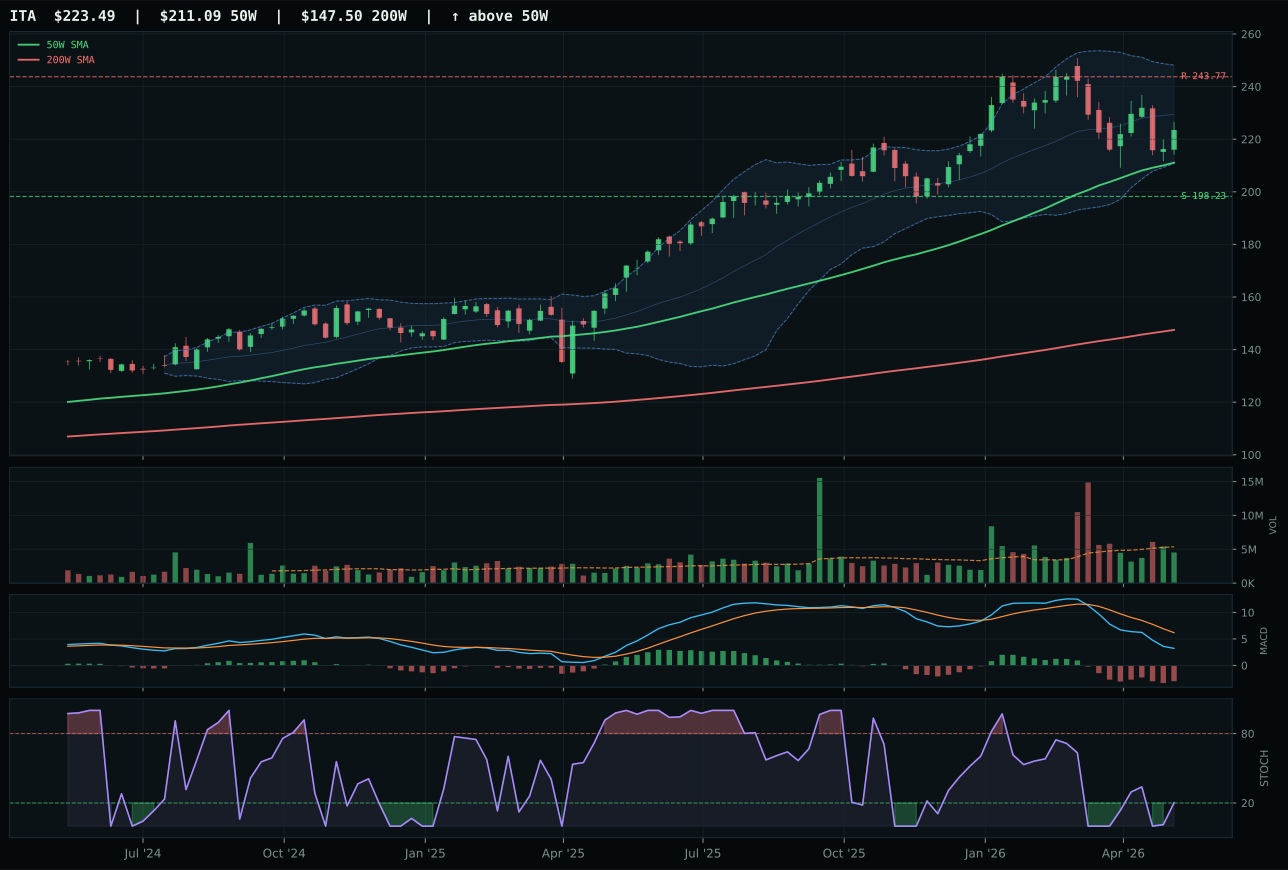
ITA has a neutral structure profile with -11.3% 13-week relative strength versus SPY.
A failed hold above support would weaken the setup.
Actionable but governed by invalidation levels.
ROKT won Defense & Aerospace by posting 94.9/100 technical evidence compared to XAR's 55.4, with the aerospace-growth beta delivering 16.2% category-relative strength versus XAR's flat 0.0% and accumulation-grade volume confirmation at 1.52x 20W average versus XAR's neutral participation. The vertical extension 34.6% above the 50W carried acceptable timing risk (45.0/100) because ROKT's MACD remained bullish and improving while stochastic RSI showed disciplined falling/neutral momentum at 0.45 rather than overbought extremes, signaling controlled strength rather than exhaustion. XAR's structure deterioration to 68.7 versus ROKT's 81.0 reflected real technical weakness: bearish-but-improving MACD in a neutral structure meant old money was finally considering exits while no fresh participation had arrived to absorb supply. The 13.7% 13-week return paired with 6.9% SPY-relative performance positioned ROKT as a domestically-driven aerospace beta, and volume confirmation at the 93.9 level proved that participation was actively building through resistance rather than passively reversing.
Defense & Aerospace earned 10% allocation despite a category score of only 51.6 because ROKT's technical excellence and risk-appetite sponsorship (+7 points) positioned it as a tactical hold in a Transition/Mixed regime where macro fit remained neutral at 55.0/100 overall. The category's weakness relative to SMH and REMX (which both scored above 69) meant Defense & Aerospace could not justify higher weighting, but the high-quality setup in ROKT and the modest headwind from credit stress (-6 category points) argued against elimination entirely. Aerospace growth tied to domestic capex and defense spending offered real economic exposure separate from pure momentum, and the 94.9 technical score suggested that while macro sponsorship was thin, the chart setup was robust enough to carry tactical risk. For this allocation to expand, either geopolitical risk would need to show up in macro descriptors as explicit tailwinds or ROKT would need to clear its resistance at 115.19 with sustained volume, confirming that the vertical extension was a true breakout rather than mean-reversion bounce.
Utilities & Infrastructure — PAVE
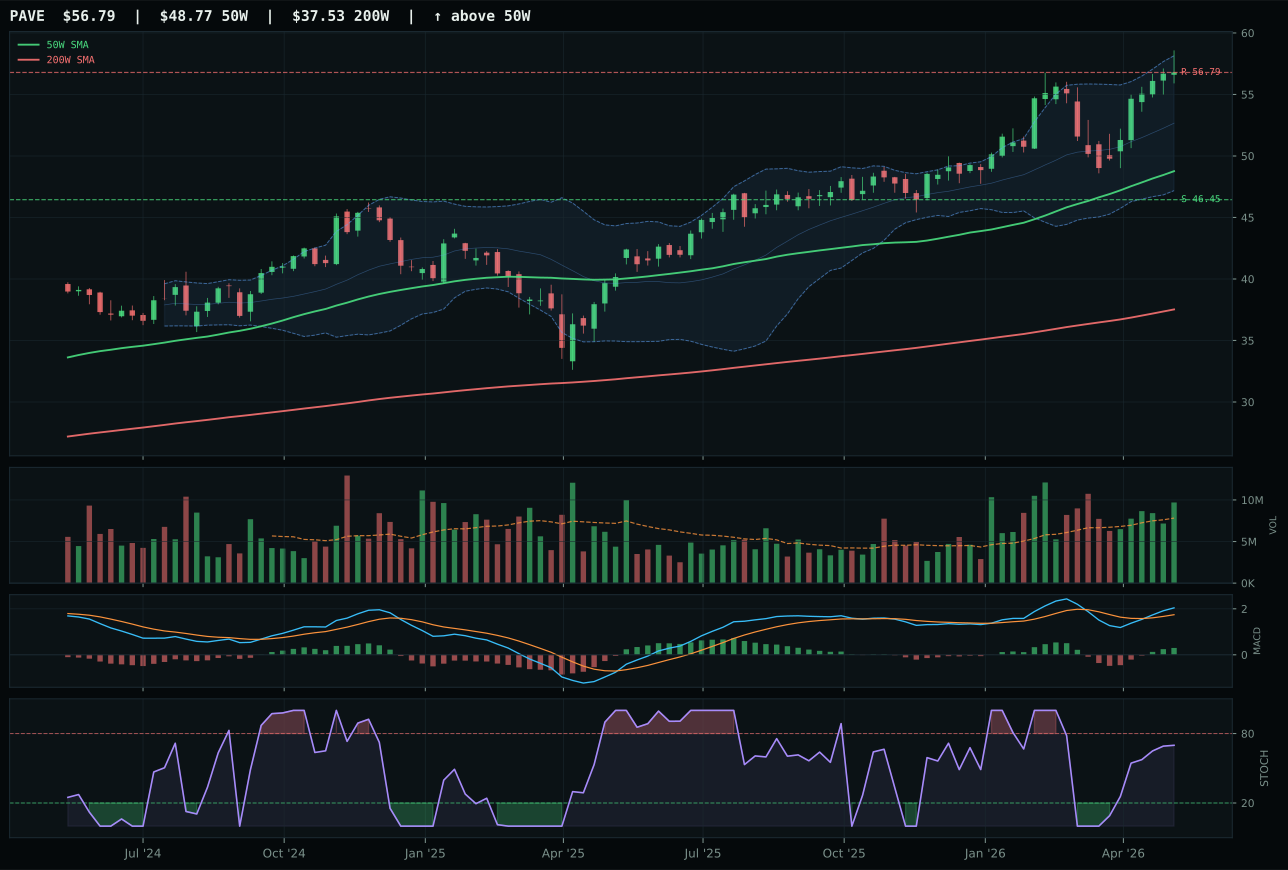
PAVE has a vertical extension profile with -3.0% 13-week relative strength versus SPY.
A failed hold above support would weaken the setup.
Actionable but governed by invalidation levels.
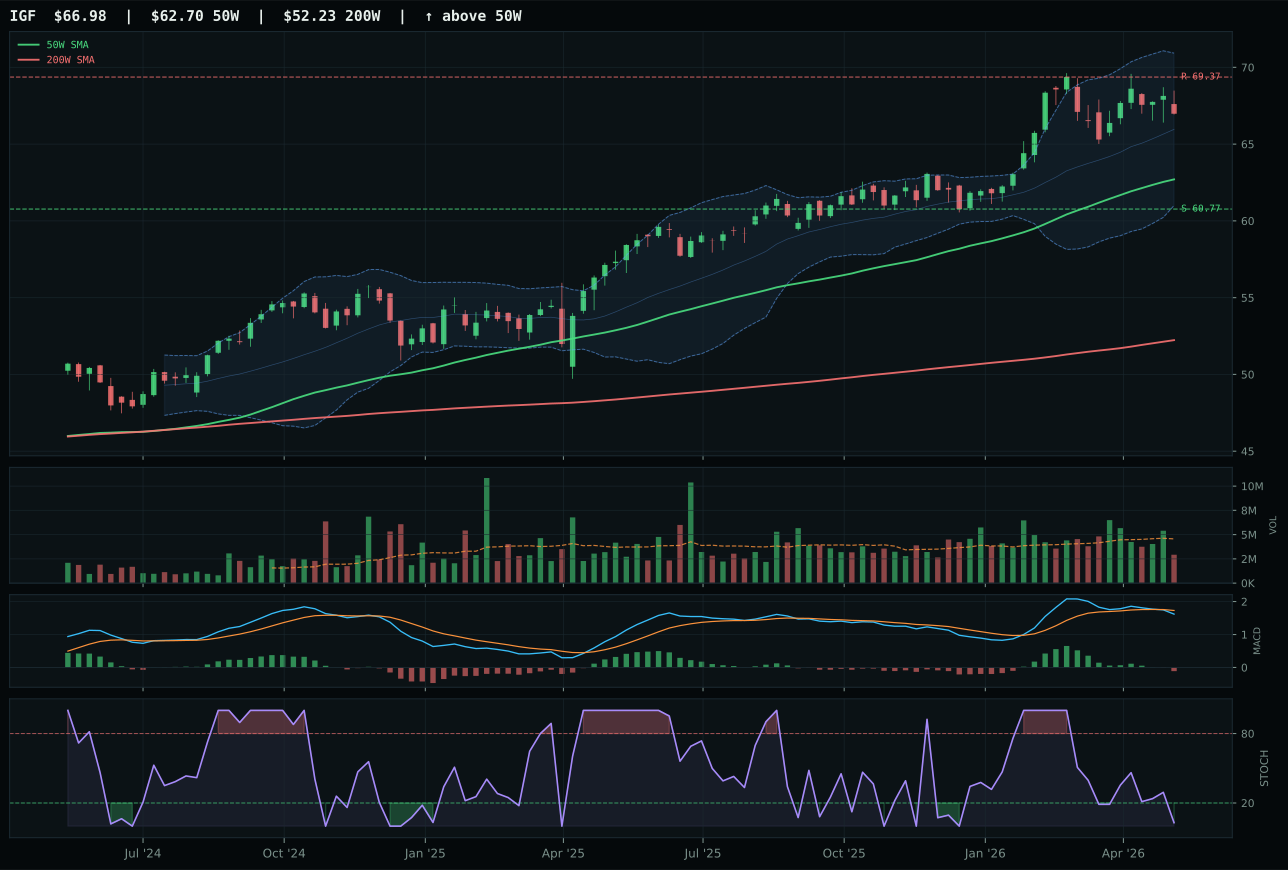
IGF has a neutral structure profile with -4.9% 13-week relative strength versus SPY.
A failed hold above support would weaken the setup.
Actionable but governed by invalidation levels.
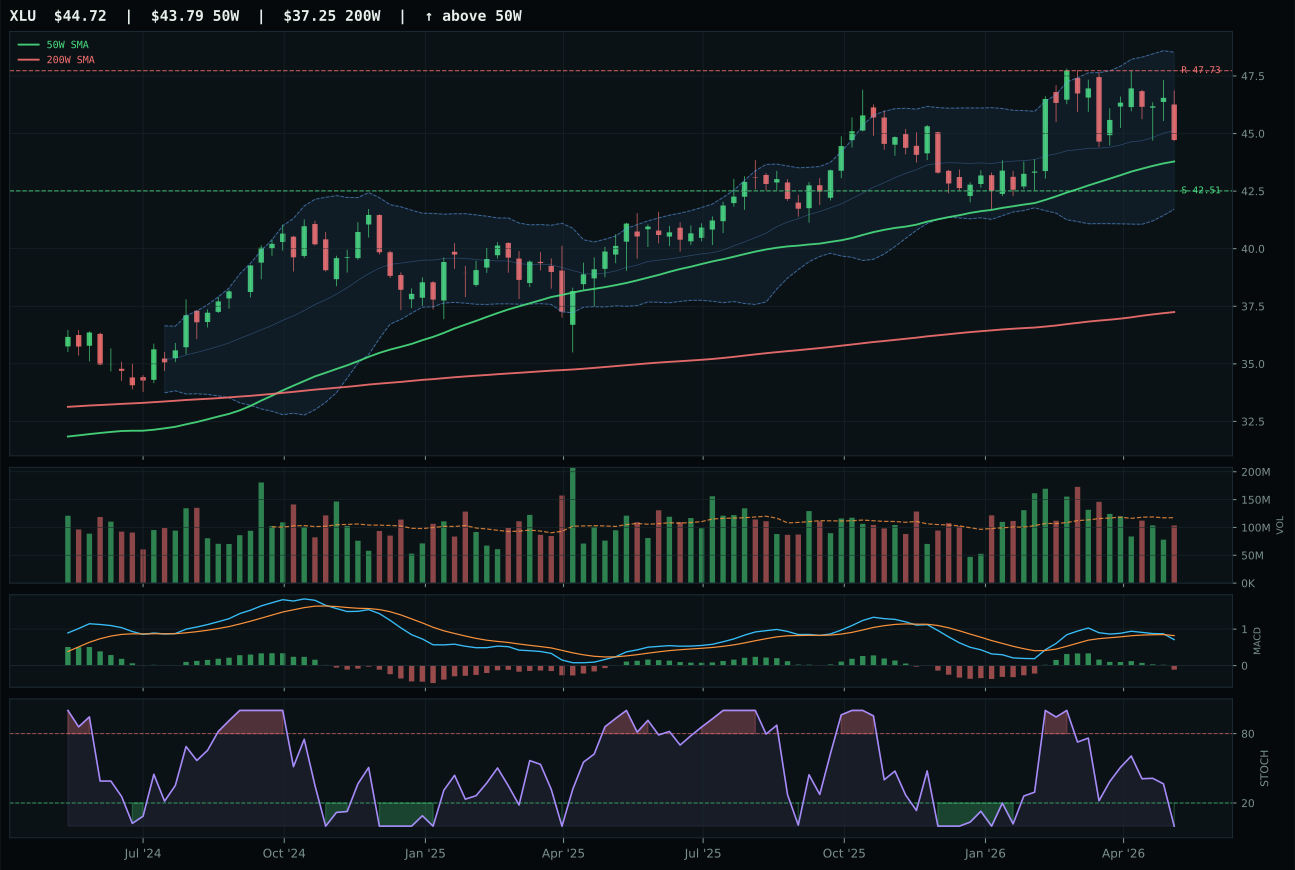
XLU has a compression near 50W profile with -3.6% 13-week relative strength versus SPY.
A failed hold above support would weaken the setup.
Actionable but governed by invalidation levels.
PAVE won Utilities & Infrastructure by scoring 81.6 technical evidence and 72.5 momentum confirmation with above-average 1.24x 20W volume participation, defeating IGF's 32.9 technical score where bearish/weakening MACD and oversold stochastic RSI signaled structural weakness in global infrastructure income. Category-relative strength of 0.7% for PAVE versus IGF's negative 1.3% proved that domestic infrastructure was fractionally outperforming despite both ETFs showing single-digit 13W returns, and PAVE's 78.4 structure score versus IGF's 73.6 reflected bullish-and-improving MACD guidance into the vertical extension. The 5.0-point score gap understated PAVE's technical decisiveness: infrastructure domestic capex theme at 3.8% 13W return paired with 95.5 trend score demonstrated consistent accumulation through modest price appreciation, while IGF's 1.9% return and 75 trend score revealed stagnation in global infrastructure income plays. PAVE's rising mid-zone stochastic RSI at 0.70 showed measured momentum building, distinctly superior to IGF's oversold condition, and the above-average volume confirmed that infrastructure buyers were active in the U.S. domestic thesis even as global income plays attracted distribution.
Utilities & Infrastructure earned 10% allocation with 43.3 category score and 46.0/100 macro/narrative fit, representing the portfolio's lowest-weighted category among those that earned allocation because technical evidence of 81.6 for PAVE could not overcome macro headwinds of inflation pressure (-6 points) and absent positive tailwinds from major category-level descriptors. The Transition/Mixed macro regime provided minimal support (+4 points) and risk appetite provided marginal negation (-2 points), leaving this category dependent on chart setup rather than fundamental sponsorship, an unsustainable foundation for growth weighting. PAVE's technical excellence and domestic infrastructure capex exposure justified holding small tactical position rather than eliminating the category, but the weak macro fit relative to real-asset categories (metals, energy) and growth categories (AI, semiconductors) argued for modest sizing. Utilities and Infrastructure would require either a marked shift toward yield-seeking risk-off macro descriptors or PAVE clearing 56.79 resistance with sustained volume to justify expansion beyond 10%. Current allocation reflects the view that domestic capex growth remains a secondary economic theme in this regime compared to energy/commodity scarcity and technology transformation, making PAVE a tactical infrastructure play held for diversification balance rather than as a conviction position.
Emerging Markets — IEMG
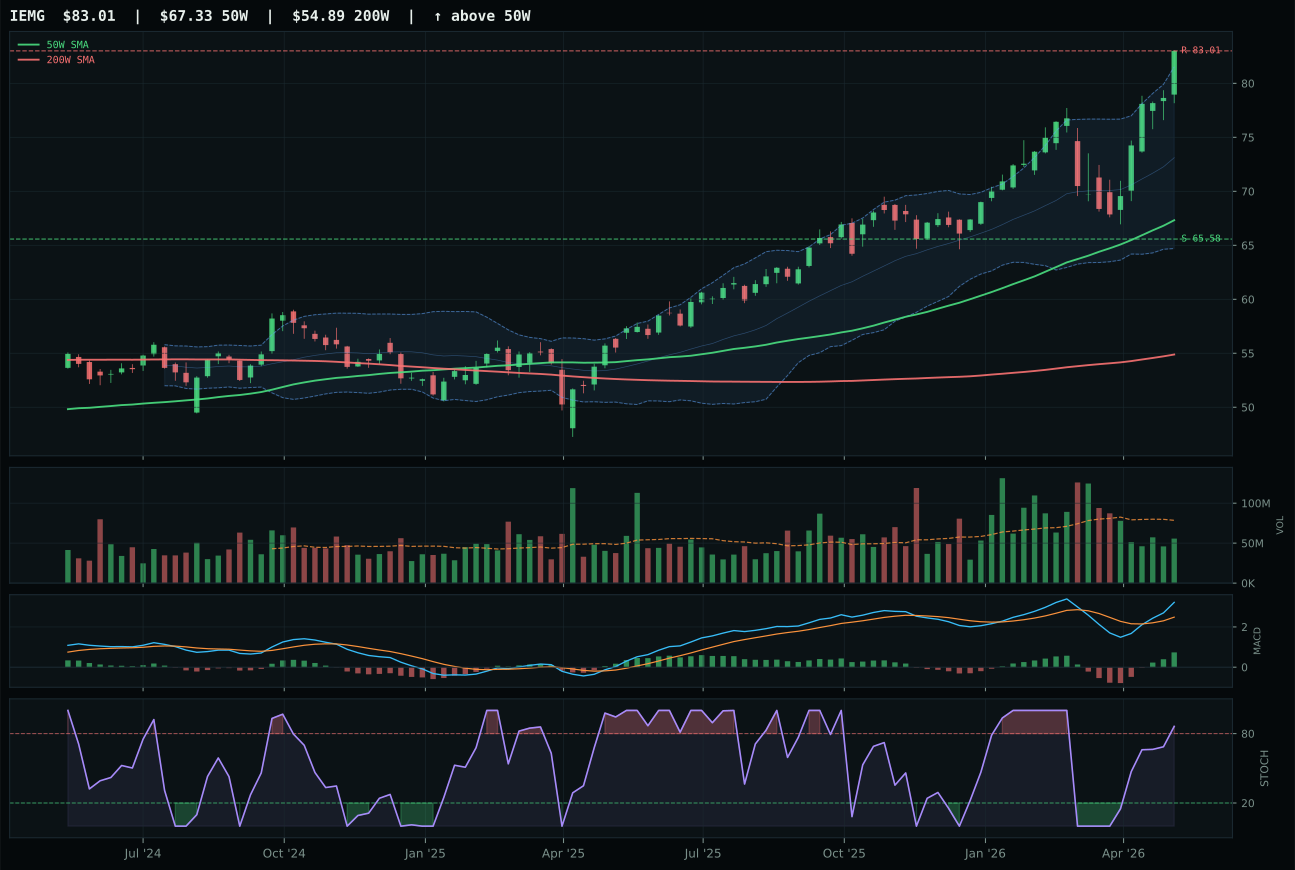
IEMG has a vertical extension profile with 5.9% 13-week relative strength versus SPY.
A failed hold above support would weaken the setup.
Actionable but governed by invalidation levels.
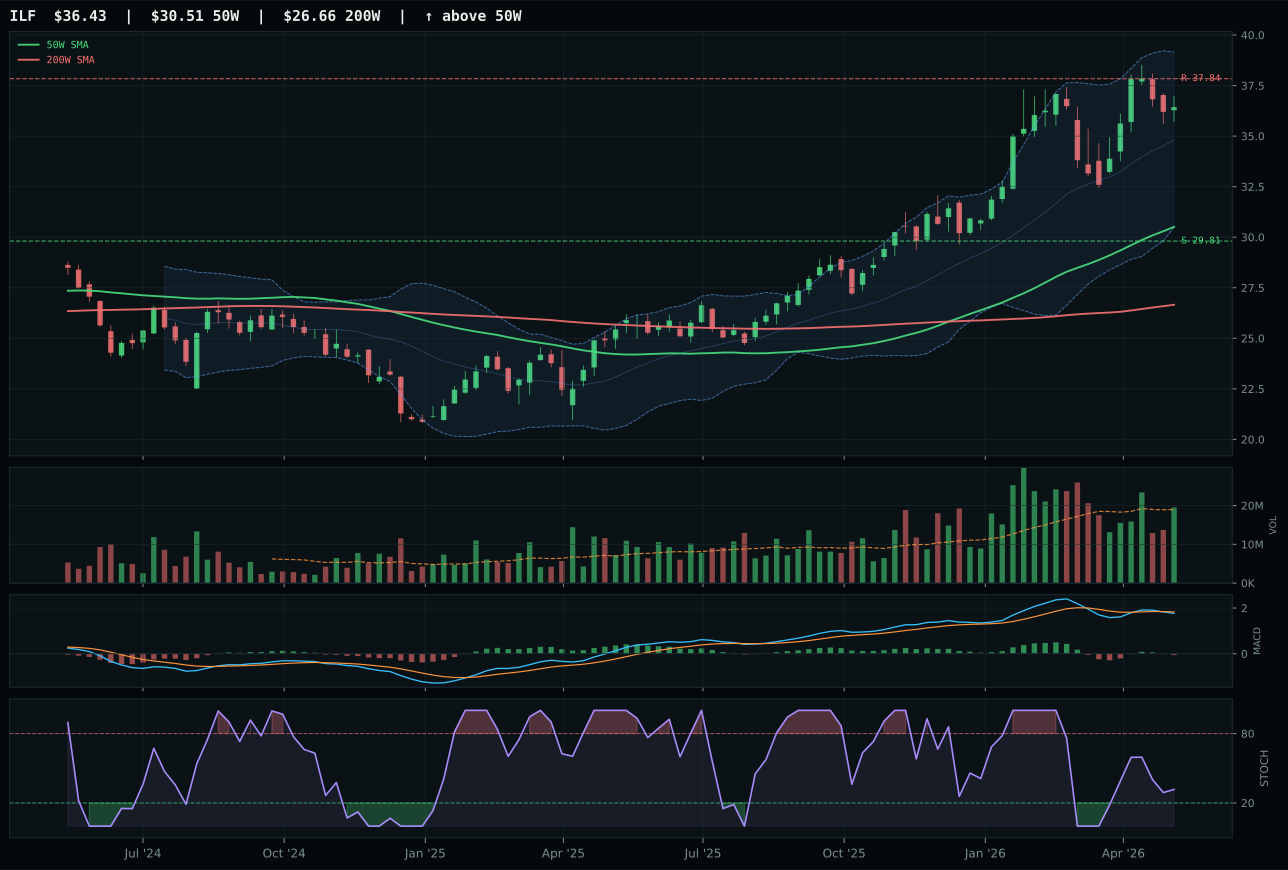
ILF has a vertical extension profile with -5.7% 13-week relative strength versus SPY.
A failed hold above support would weaken the setup.
Actionable but governed by invalidation levels.
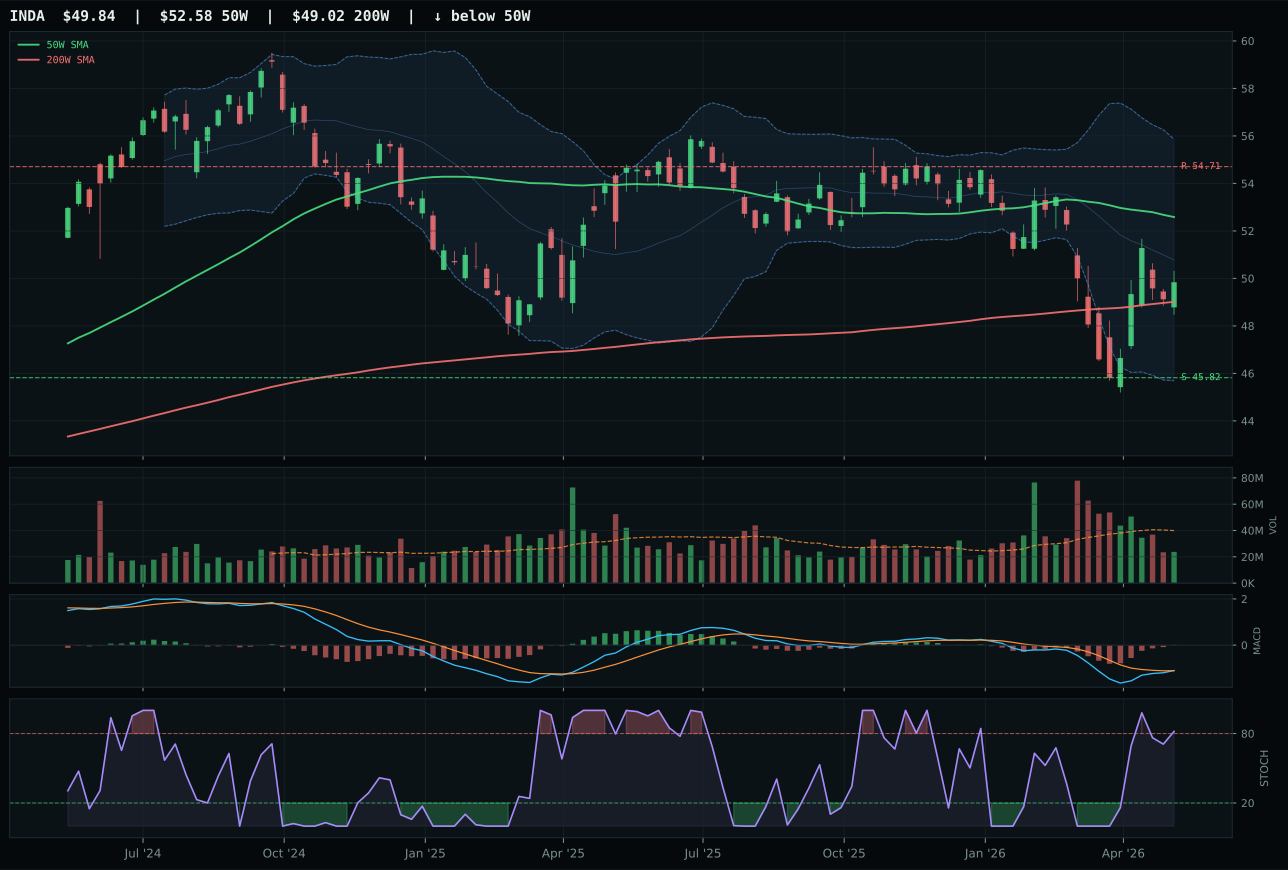
INDA has a neutral structure profile with -13.3% 13-week relative strength versus SPY.
A failed hold above support would weaken the setup.
Actionable but governed by invalidation levels.
IEMG won Emerging Markets by scoring 66.5 technical evidence with clean 100.0 momentum confirmation and 12.7% 13-week return, decisively defeating ILF's 25.6 technical score where bearish/weakening MACD and falling/neutral stochastic RSI meant the Latin America commodity theme was actively losing conviction. Category-relative strength of 11.6% for IEMG versus ILF's flat 0.0% proved that broad emerging-market capital flows were arriving while regional commodity plays were stalling, and the vertical extension at 23.3% above the 50W absorbed timing penalty (37.0/100) while volume at 0.71x 20W average created acceptable thin-but-not-extreme participation. ILF's structure score of 70.2 versus IEMG's 74.2 revealed sharper technical deterioration in the Latin America play, and the 21.4-point overall score gap (IEMG at 41.6 versus ILF at 20.2) was decisive despite both entries showing weak macro technical fit. IEMG's bullish-and-improving MACD with overbought stochastic RSI at 0.86 meant momentum remained fresh despite the extended position, while ILF's bearish divergence signaled that old money had exited and new money had not yet arrived to absorb the vacuum.
Emerging markets received 0% allocation despite IEMG's category win, landing at 41.6/100 and ranked 9th or 10th in portfolio priority. The macro fit of 62.0/100 benefits from EM liquidity support at +14 and risk appetite positive at +8, yet credit stress activates as a -10 drag that other commodity categories avoid. Technical evidence of 66.5/100 for the representative is respectable but lacks the conviction of top-2 categories, and the timing score of 37 reflects extension risk that momentum confirmation alone cannot excuse when four-week returns are only 11.8% against a 23.3% distance from the 50-week. The thin participation at 0.71x signals that accumulation is not occurring at scale—the chart is rising on retail enthusiasm or short-covering rather than institutional deployment. For IEMG to earn a portfolio slot, either volume participation would need to expand to above-average levels, or broader macro conditions would need to eliminate the credit stress activation that currently drags the category fit. Until then, allocation capital flows to categories where both technicals and macro alignment are unambiguous.
Precious Metals — GLD
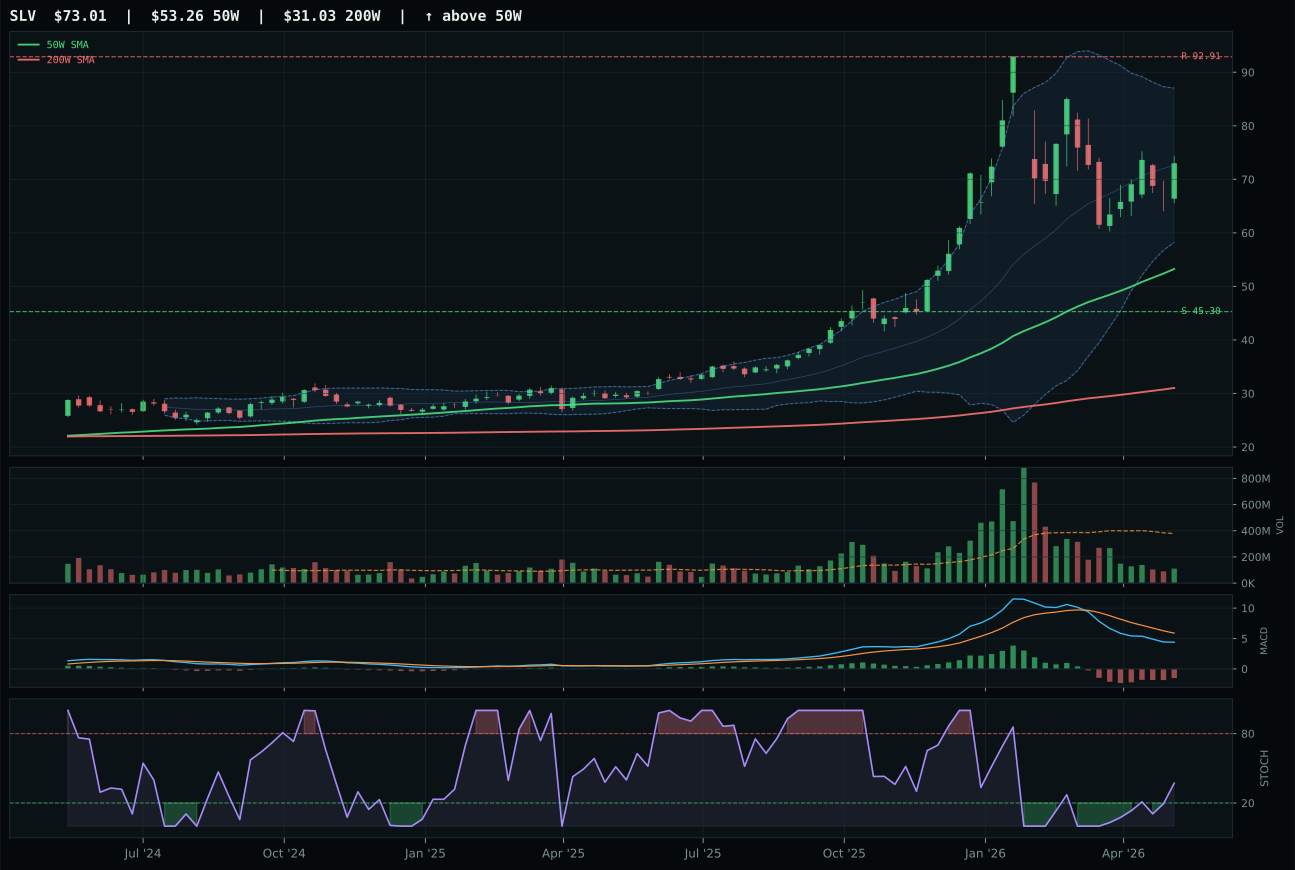
SLV has a vertical extension profile with -2.8% 13-week relative strength versus SPY.
A failed hold above support would weaken the setup.
Actionable but governed by invalidation levels.
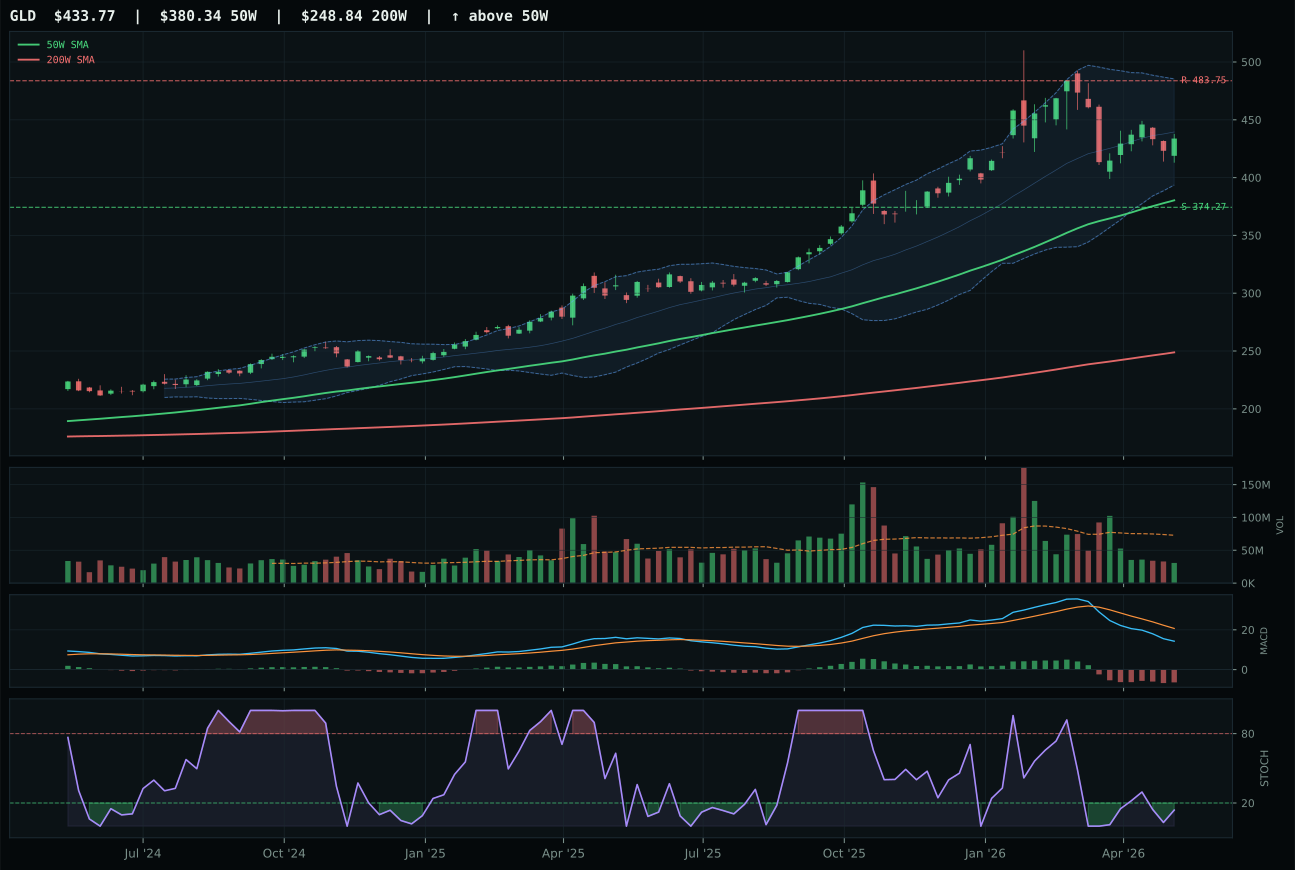
GLD has a neutral structure profile with -11.6% 13-week relative strength versus SPY.
A failed hold above support would weaken the setup.
Actionable but governed by invalidation levels.
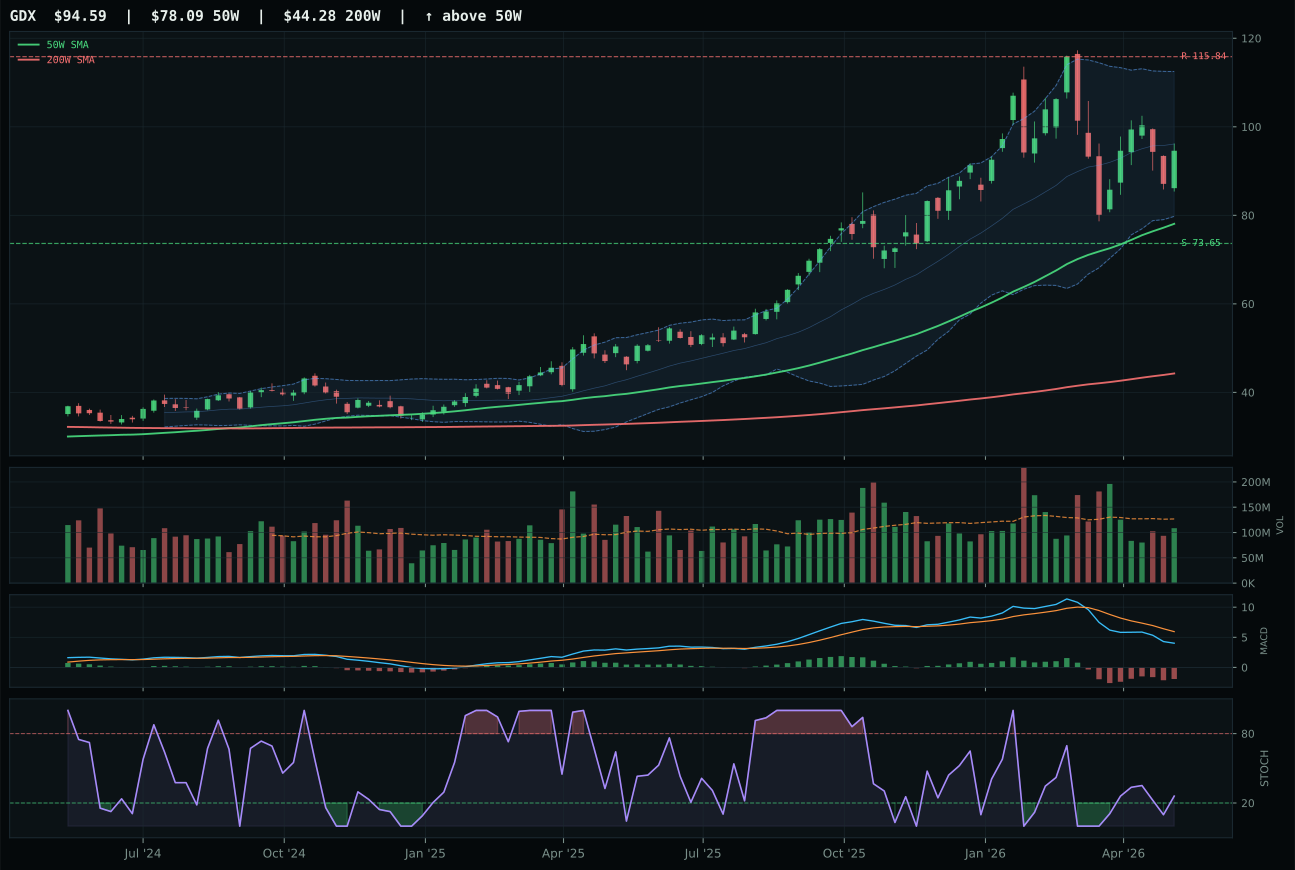
GDX has a vertical extension profile with -9.7% 13-week relative strength versus SPY.
A failed hold above support would weaken the setup.
Actionable but governed by invalidation levels.
GLD won Precious Metals by narrowly edging SLV despite both anchoring poor technical profiles, claiming victory through 56.7 risk/reward (versus SLV's 36.3) and 70.0 timing (versus SLV's 68.0) in a category where negative momentum and thin participation made absolute strength less important than relative risk management. GLD's oversold stochastic RSI at 0.14 and bearish/weakening MACD positioned the ETF as a mean-reversion candidate at 14% above its 50W, while SLV's vertical extension 37.1% above its 50W and bullish-but-improving MACD created a setup where additional weakness could accelerate downside pressure more rapidly. The 2.2-point gap between competitors reflected GLD's superior downside cushion (15.9% to support versus SLV's undefined longer risk horizon) and cleaner structure at 69.9 versus 62.2, meaning gold buyers were operating from sounder technical footing despite both ETFs showing 13-week negative returns and weak SPY-relative performance. Category-relative strength of negative 1.9% for GLD versus positive 6.9% for SLV suggested silver held residual bidding pressure from industrial scarcity narratives, yet gold's monetary-hedge purity and technical risk management made it the defensible entry despite momentum weakness.
Precious Metals ranked 9th or 10th in category scoring and received zero allocation because the 46.0/100 macro fit is the weakest in the portfolio, dragged down by risk appetite positive turning negative (-4) in a regime theoretically supportive of safe havens. The absence of inflation pressure or supply-shortage sponsorship in the active descriptors reveals that risk-off positioning is not being rewarded in this transition period—credit stress activates only at negative territory and does not appear as a positive portfolio anchor. GLD's technical evidence of 26.7/100 is disqualifying on its own, but the macro failure is worse: when both technicals and macro alignment disappear, there is no case for capital allocation. Gold would require either a sharp credit event that activates negative-rate expectations or a structural breakdown in equity risk appetite to earn reinstatement. For now, the 0% allocation correctly reflects that precious metals are neither tactically oversold nor strategically sponsored in the current regime.