
2026-05-01
Informational purposes only. The content in this report, including allocations, analysis, and commentary, is provided solely for informational and educational purposes. It does not constitute financial advice, investment advice, trading advice, or any other type of advice. Past performance does not guarantee future results. Always conduct your own research and consult a qualified financial professional before making investment decisions.
Weekly Allocation
| Ticker | Category | Weight | Role |
|---|---|---|---|
| XLE | Traditional Energy | 20% | Top-2 (20%) |
| SMH | AI | 20% | Top-2 (20%) |
| PAVE | Utilities & Infrastructure | 10% | Tier-2 (10%) |
| WEAT | Agriculture & Livestock | 10% | Tier-2 (10%) |
| XLK | Technology | 10% | Tier-2 (10%) |
| REMX | Industrial Metals | 10% | Tier-2 (10%) |
| IEMG | Emerging Markets | 10% | Tier-2 (10%) |
| URA | Nuclear Energy | 10% | Tier-2 (10%) |
Trade Instructions — Monday Open
Sell the tranche from 2026-04-03 (completing its 4-week hold). Buy the new tranche. Instructions show net portfolio changes — same-asset positions cancel, weight changes show the delta.
| Action | Ticker | Instruction |
|---|---|---|
| SELL | VEGI | Sell 50% of VEGI position (reduce 10.00% → 5.00%) |
| SELL | IGF | Sell entire IGF position (2.50% of portfolio) |
| SELL | COPX | Sell 33% of COPX position (reduce 7.50% → 5.00%) |
| SELL | XAR | Sell 50% of XAR position (reduce 5.00% → 2.50%) |
| SELL | ILF | Sell 33% of ILF position (reduce 7.50% → 5.00%) |
| BUY | SMH | Buy SMH — 16.67% of freed cash (adds 2.50% to portfolio) |
| BUY | PAVE | Buy PAVE — 16.67% of freed cash (adds 2.50% to portfolio) |
| BUY | REMX | Buy REMX — 16.67% of freed cash (adds 2.50% to portfolio) |
| BUY | XLK | Buy XLK — 16.67% of freed cash (adds 2.50% to portfolio) |
| BUY | IEMG | Buy IEMG — 16.67% of freed cash (adds 2.50% to portfolio) |
| BUY | WEAT | Buy WEAT — 16.67% of freed cash (adds 2.50% to portfolio) |
Current Portfolio After Trade
Combined holdings across all 4 active tranches. Each tranche is 25% of the portfolio.
| Ticker | % of Portfolio | Weight Bar |
|---|---|---|
| XLE | 20.00% | |
| SMH | 15.00% | |
| URA | 10.00% | |
| PAVE | 10.00% | |
| MOO | 7.50% | |
| XLK | 7.50% | |
| COPX | 5.00% | |
| ILF | 5.00% | |
| VEGI | 5.00% | |
| REMX | 5.00% | |
| IEMG | 5.00% | |
| XAR | 2.50% | |
| WEAT | 2.50% |
Macro Regime — Transition / Mixed
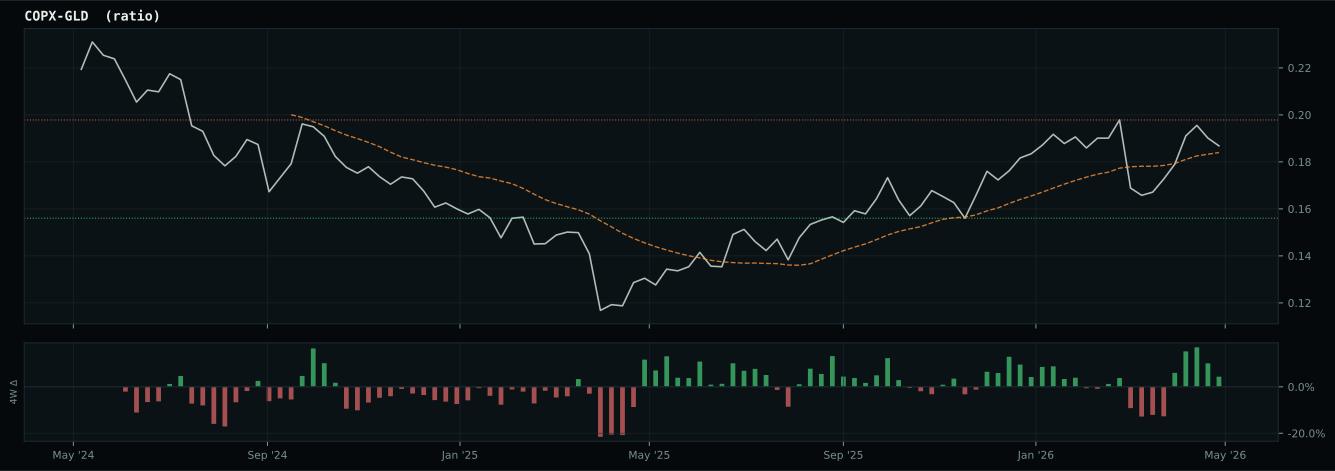
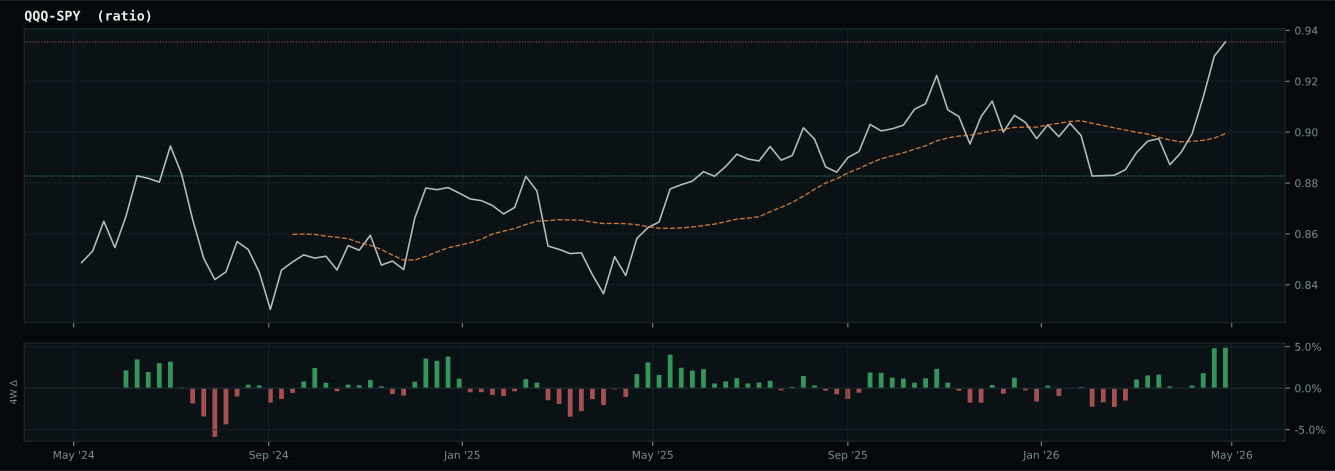
Macro Evidence Charts
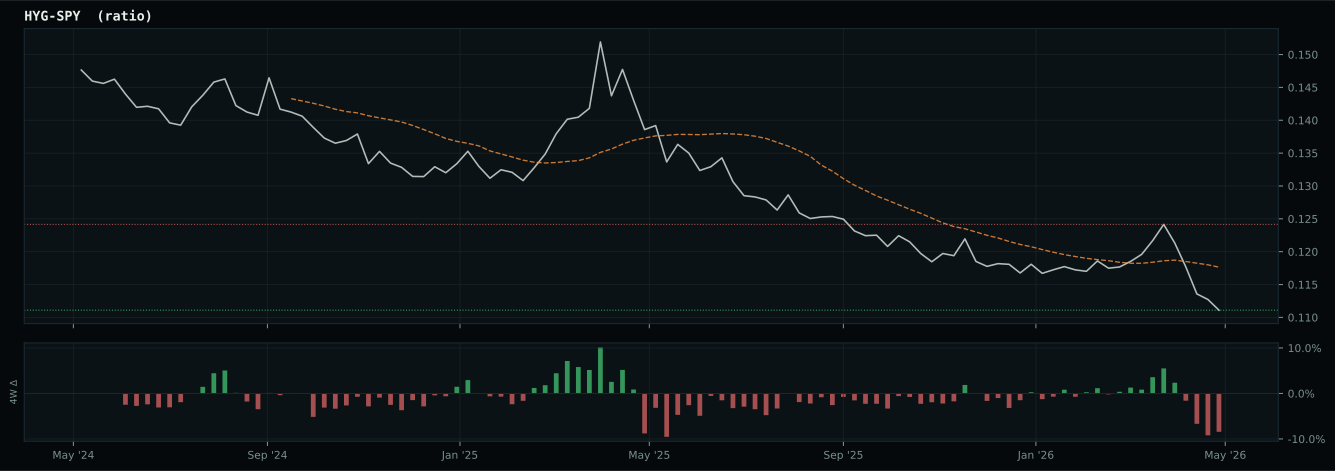
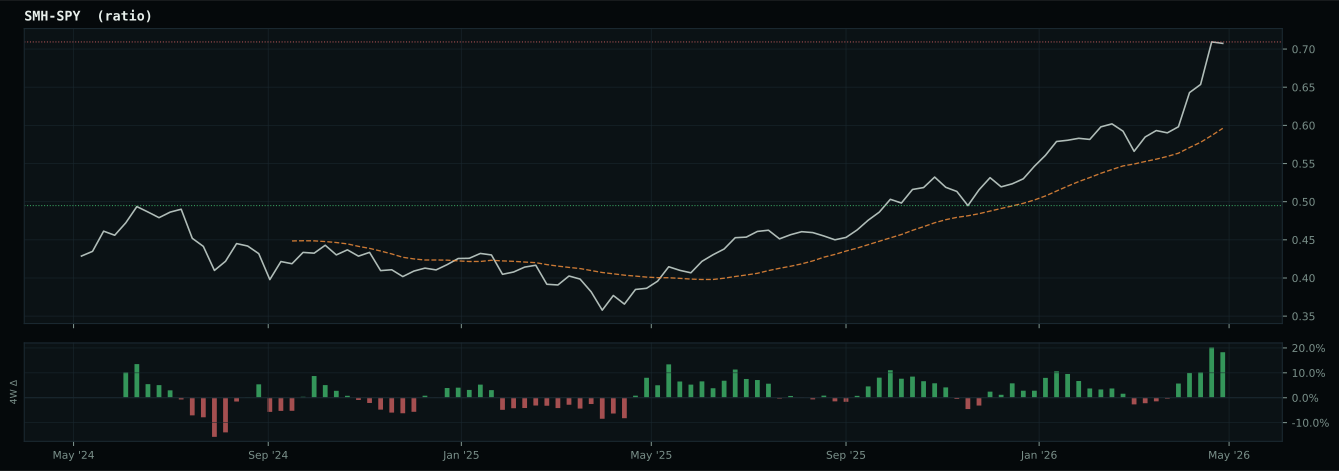
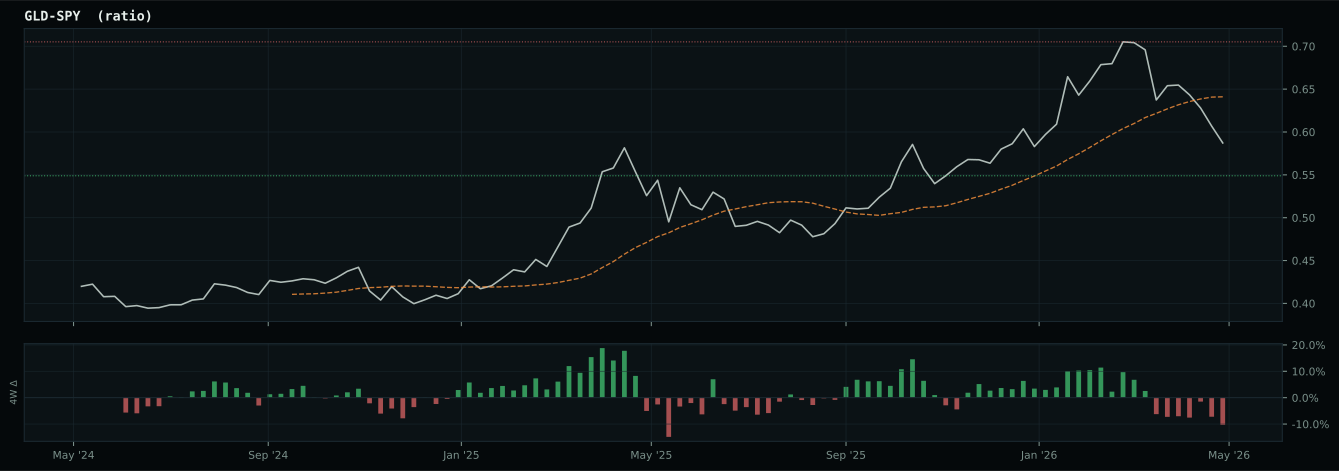
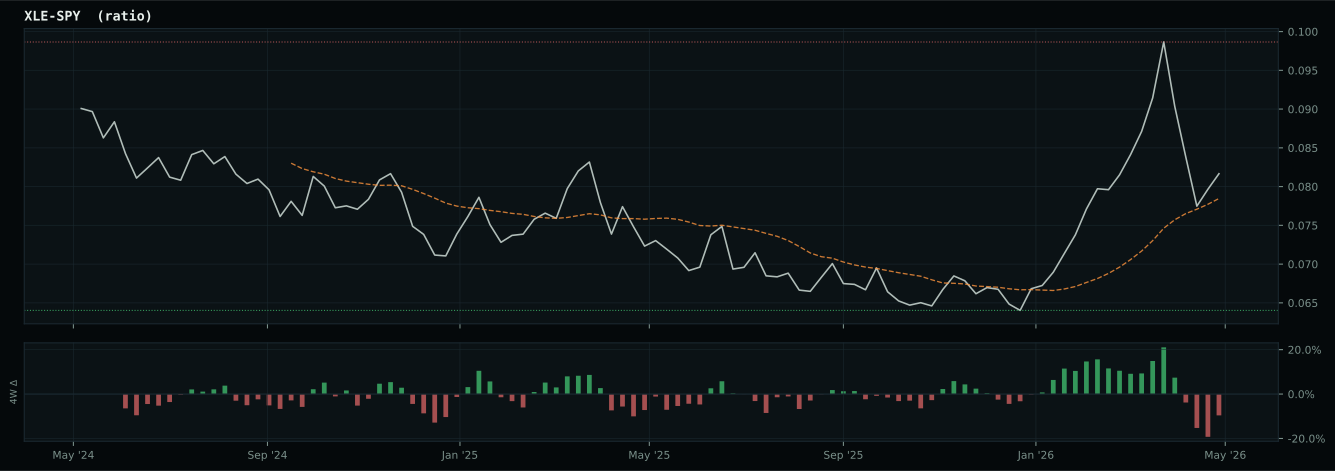
Market-implied signals behind the macro regime scores. Each ratio compares two assets; the direction and slope of the ratio is what the macro engine reads.
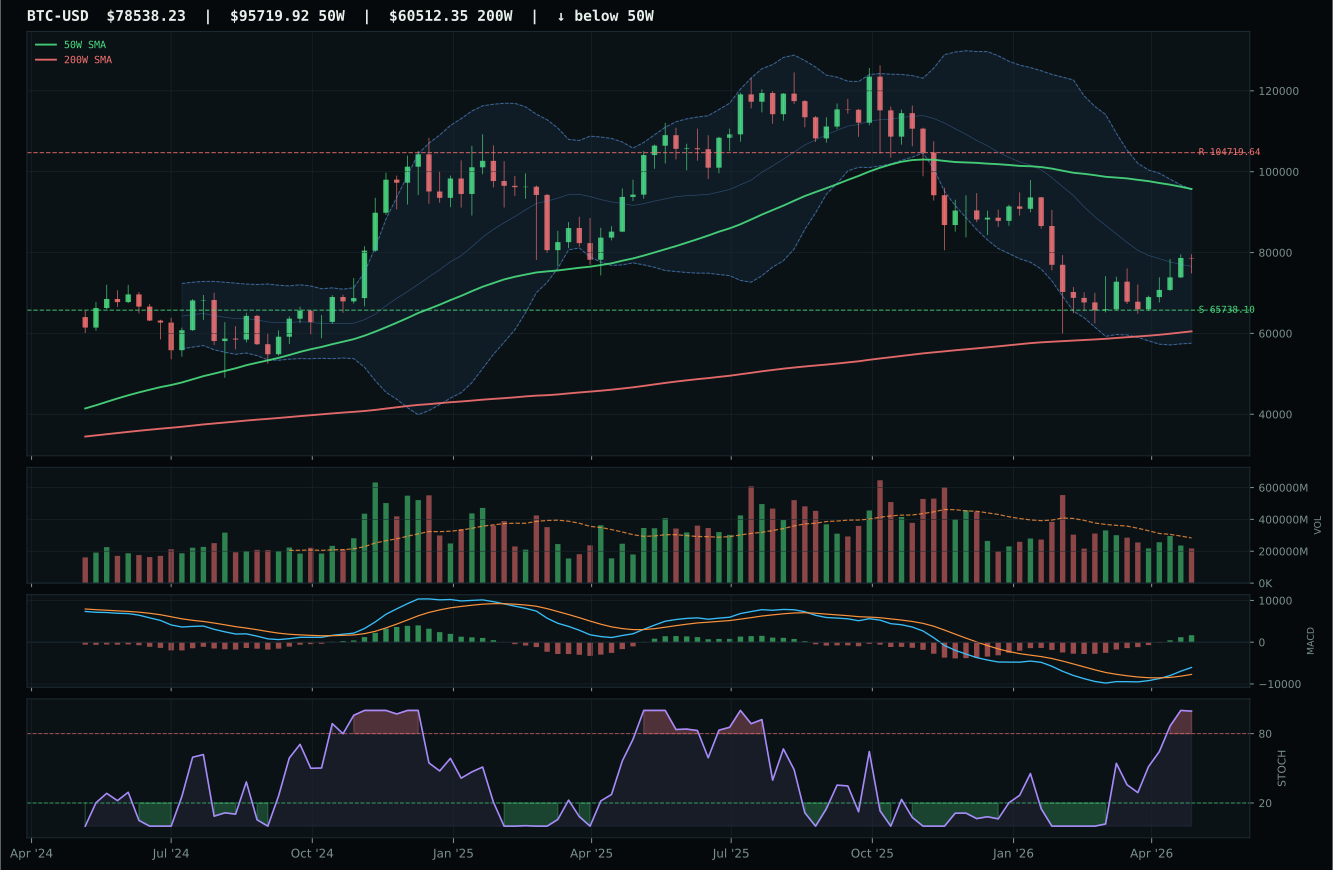
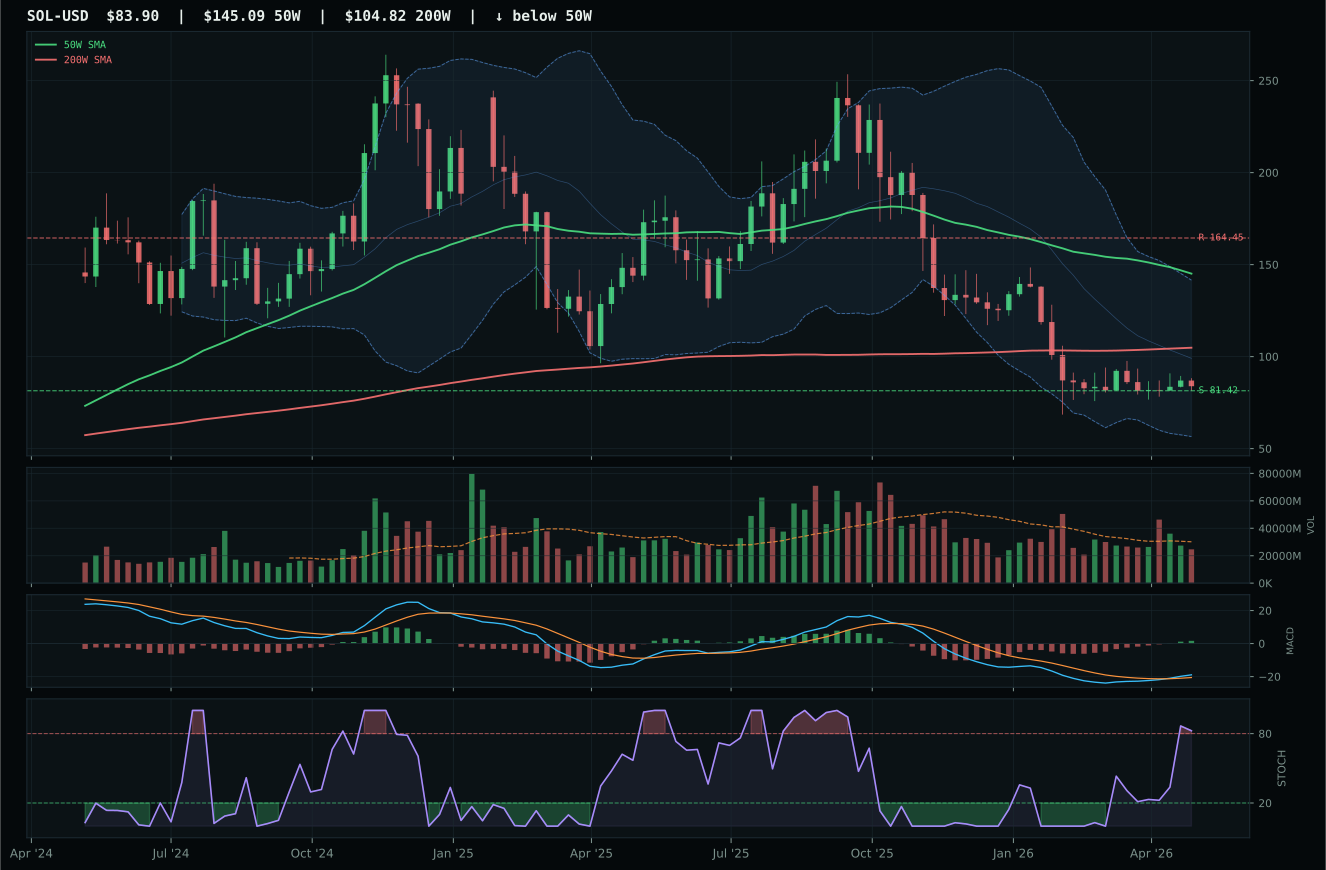
Crypto Regime — NoCrypto
post-touch range has not been tested enough: support tests 7/2, resistance tests 1/2
TrendBTC not confirmed
one or more available conditions failed
Category Rankings
| Rank | Category | Winner | Score | Alloc | 4W Ret | Peers (4W) |
|---|---|---|---|---|---|---|
| 1 | Traditional Energy | XLE | 77.0 | 20% | -2.89% | XOP -5.9% · FCG -7.0% |
| 2 | AI | SMH | 73.0 | 20% | +16.32% | BOTZ +4.7% · AIQ +18.7% |
| 3 | Utilities & Infrastructure | PAVE | 63.9 | 10% | -1.36% | XLU -5.1% · IGF -2.2% |
| 4 | Agriculture & Livestock | WEAT | 60.6 | 10% | -1.84% | VEGI -3.8% · MOO -5.2% |
| 5 | Technology | XLK | 56.0 | 10% | +18.20% | CIBR +31.3% · IGV +19.2% |
| 6 | Industrial Metals | REMX | 52.1 | 10% | -6.14% | PICK +7.6% · COPX +12.1% |
| 7 | Emerging Markets | IEMG | 50.1 | 10% | +6.91% | INDA -2.0% · ILF -4.0% |
| 8 | Nuclear Energy | URA | 49.7 | 10% | -9.42% | NLR -8.6% · URNM -9.4% |
| 9 | Defense & Aerospace | ROKT | 49.5 | 0% | +19.23% | XAR +10.9% · ITA +7.3% |
| 10 | Precious Metals | GLD | 43.9 | 0% | -2.14% | GDX +0.4% · SLV +1.7% |
Traditional Energy — XLE
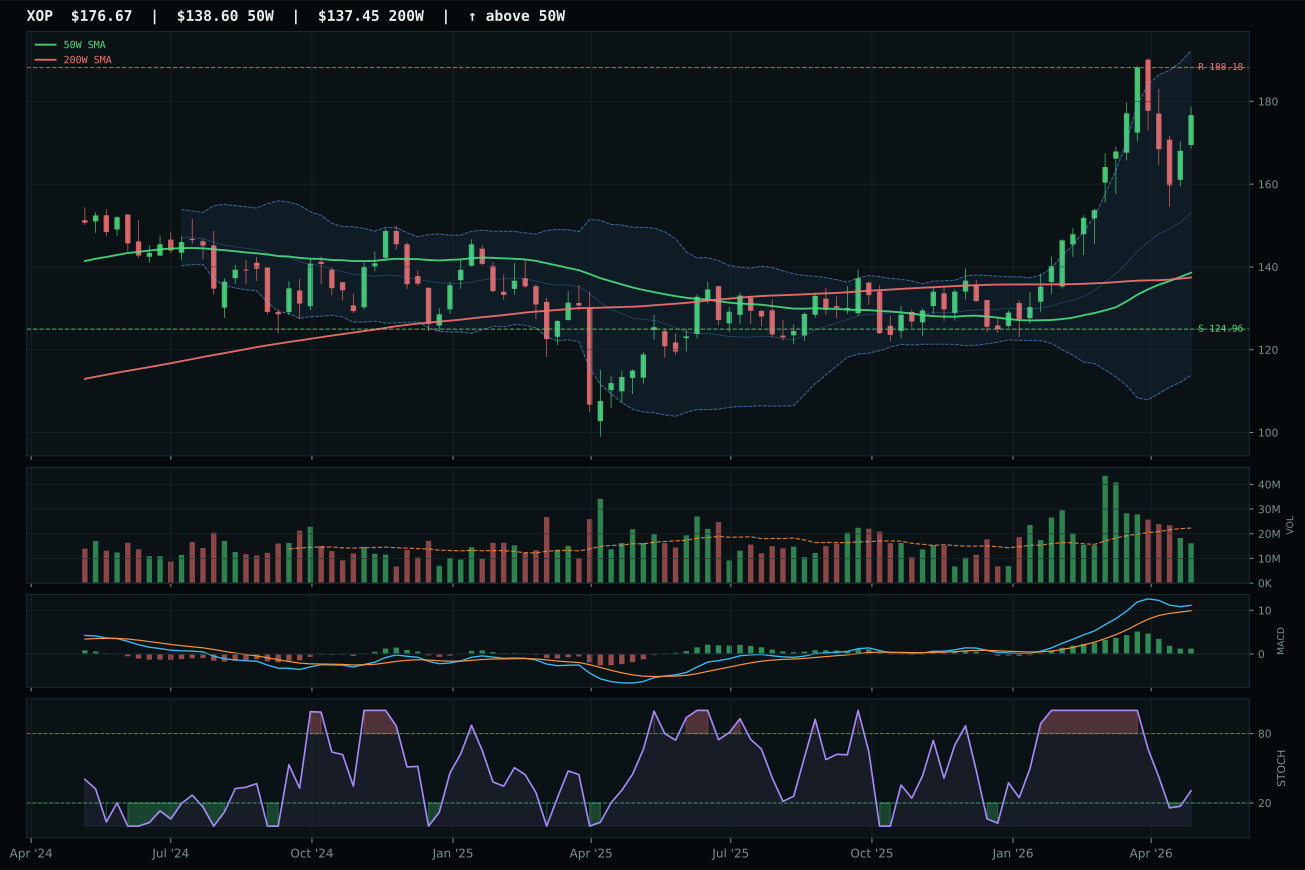
XOP has a vertical extension profile with 21.8% 13-week relative strength versus SPY.
A failed hold above support would weaken the setup.
Actionable but governed by invalidation levels.
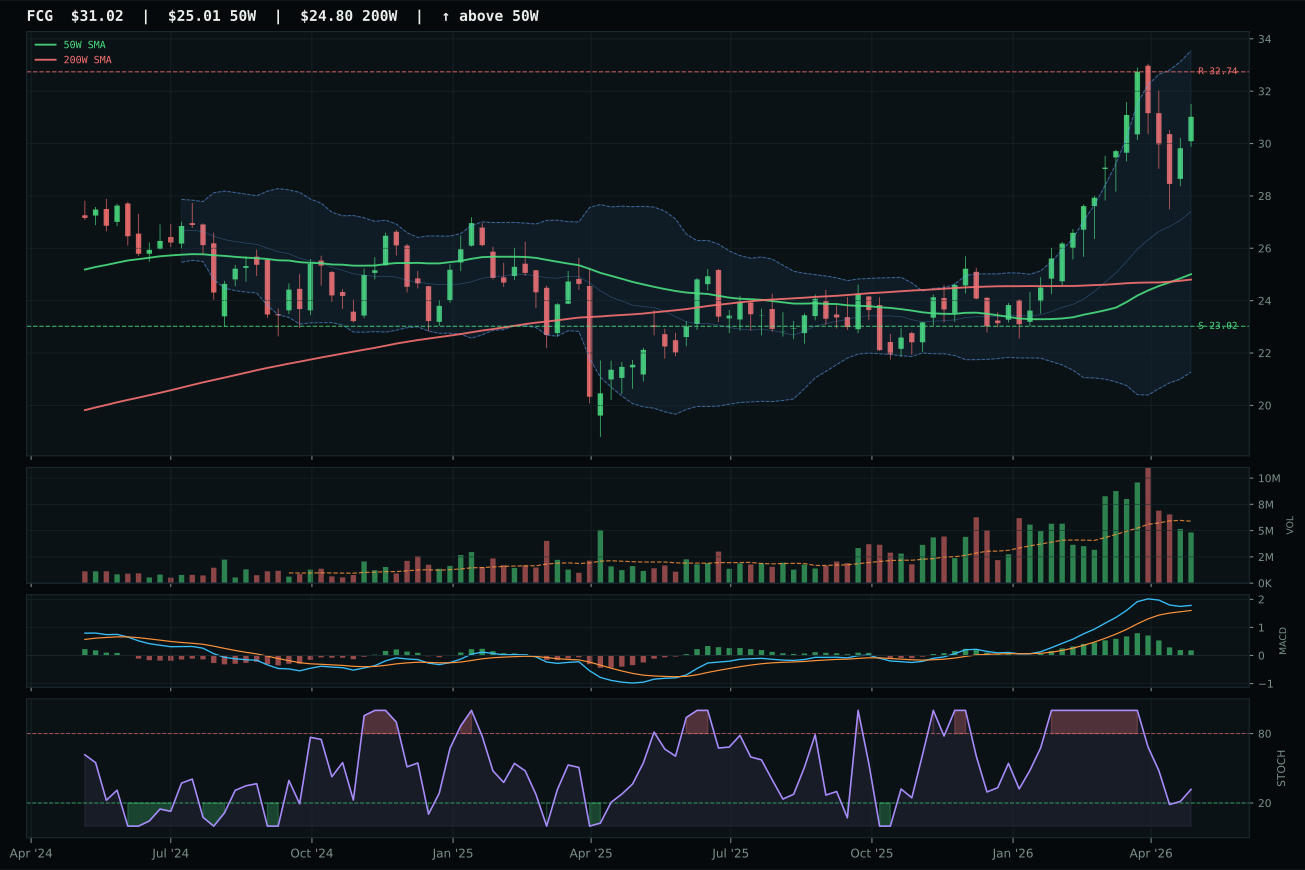
FCG has a vertical extension profile with 17.0% 13-week relative strength versus SPY.
A failed hold above support would weaken the setup.
Actionable but governed by invalidation levels.
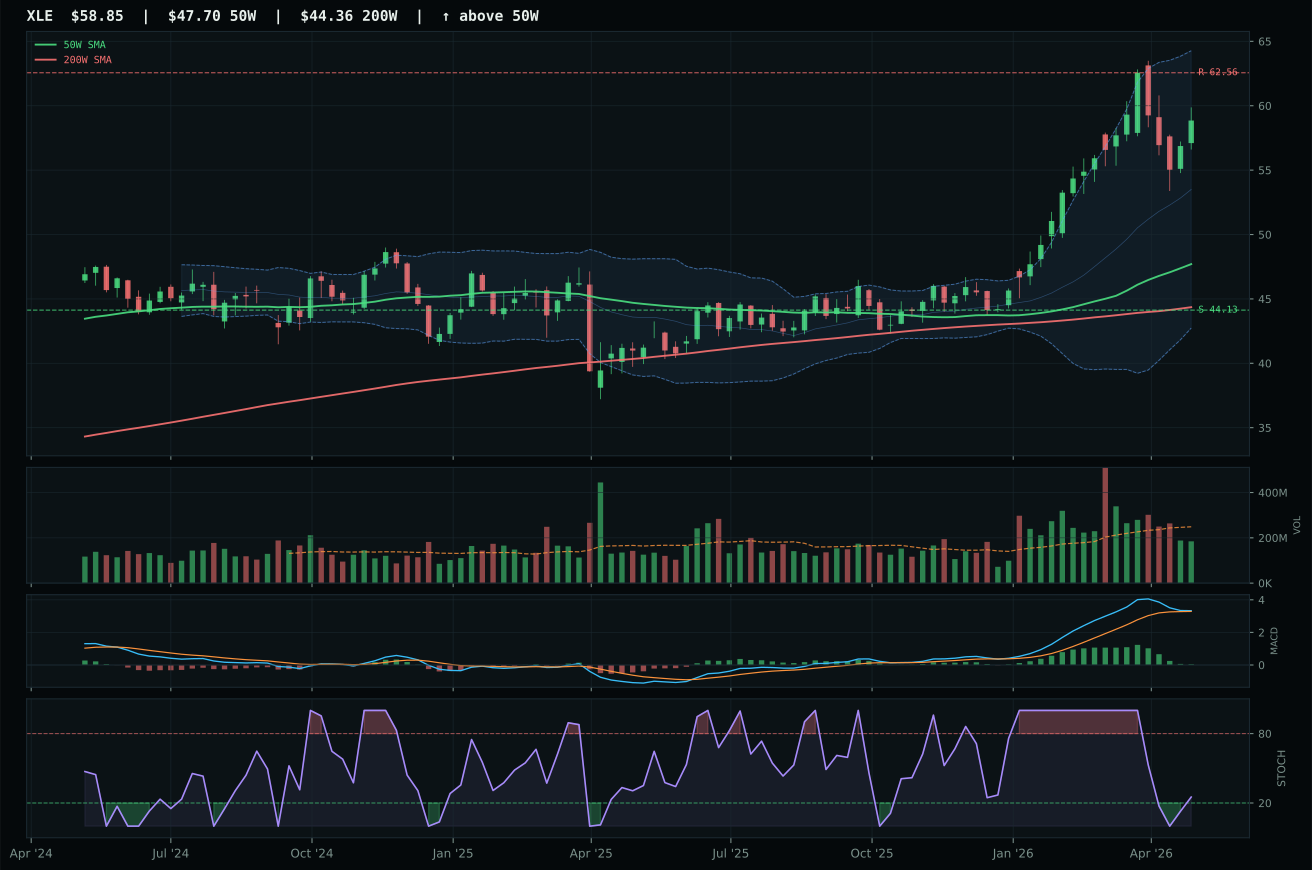
XLE has a vertical extension profile with 11.1% 13-week relative strength versus SPY.
A failed hold above support would weaken the setup.
Actionable but governed by invalidation levels.
XLE secured the energy category and a top-2 allocation slot with 100.0% trend score and 11.1% SPY-relative strength, capturing 15.3% 13-week returns despite 23.4% extension above the 50-week moving average. Volume-price confirmation at 58.9% and persistence at 65.5% reflect neutral liquidity rather than accumulation, yet timing scored 56.0—superior to SMH's 37.0—because stochastic RSI stayed in rising mid-zone (0.25) while MACD remained bullish, just flattening rather than deteriorating. XOP's weaker timing (48.0) and falling neutral stochastic RSI revealed a setup losing momentum confirmation, while its 21.8% SPY-relative return came with category-relative strength of only 4.9%, signaling exploration beta leading core energy rather than the integrated cash-flow story driving the sector.
Traditional Energy earned 20% top-2 allocation at 77.0, the highest category score and second-ranked only to AI's 73.0. The 85.0% category-level macro fit represents the portfolio's strongest macro permission: energy scarcity (+16), inflation pressure (+10), supply shortage (+9), and real asset sponsorship (+7) converge to create a rare multi-descriptor convergence that survives credit stress headwinds (-7). XLE's 63.6% technical evidence paired with 86.0% macro fit generates 73.1% weighted score before category testing, and the 3/2/1 basket averaging yields 77.0 final score. The risk-reward asymmetry of 48.2% with upside flat to resistance but downside to 33.4% below support reflects the regime's commitment to energy participation despite entry extension. In a Transition/Mixed macro state, traditional energy and AI are the two engines; this allocation reflects correct capital deployment.
AI — SMH
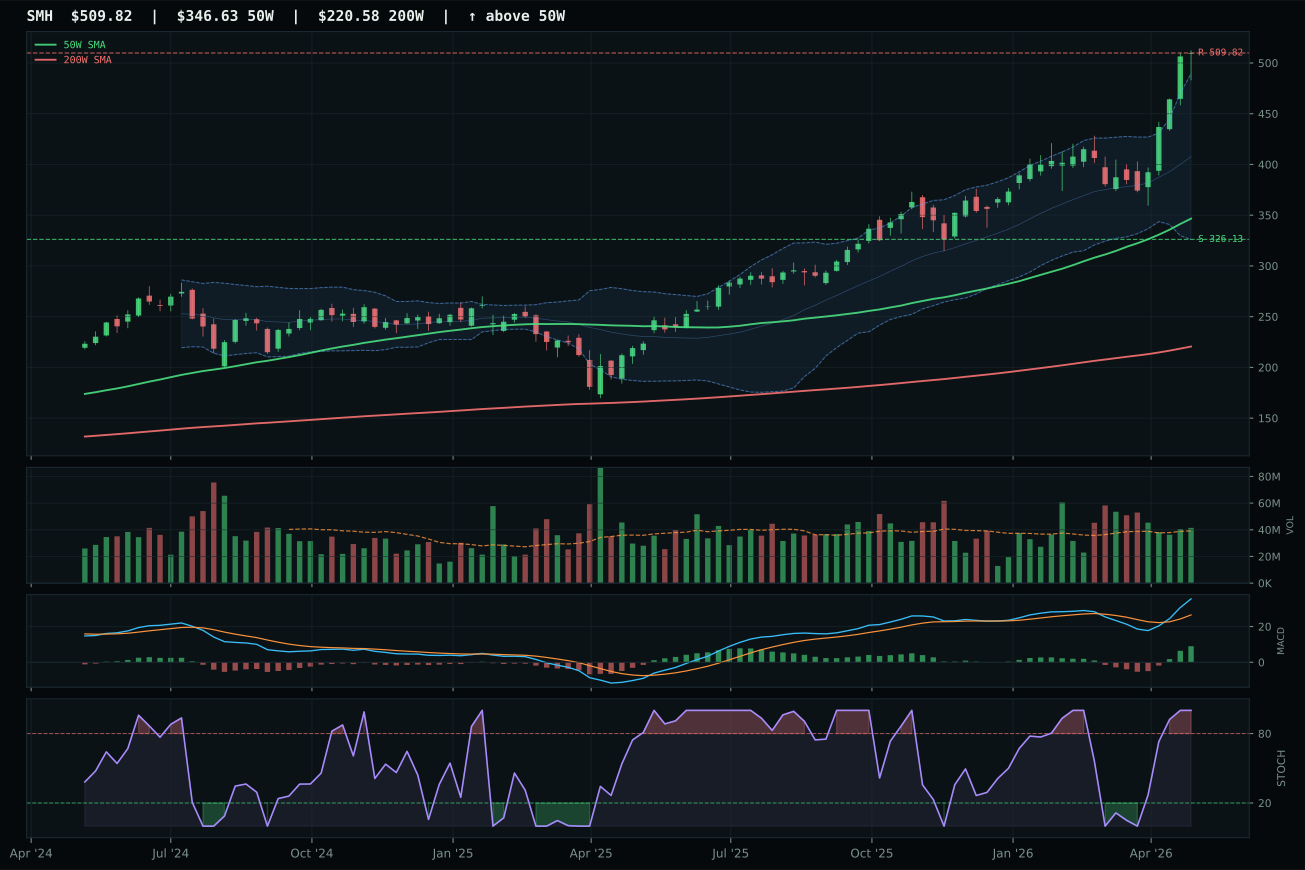
SMH has a vertical extension profile with 22.2% 13-week relative strength versus SPY.
A failed hold above support would weaken the setup.
Actionable but governed by invalidation levels.
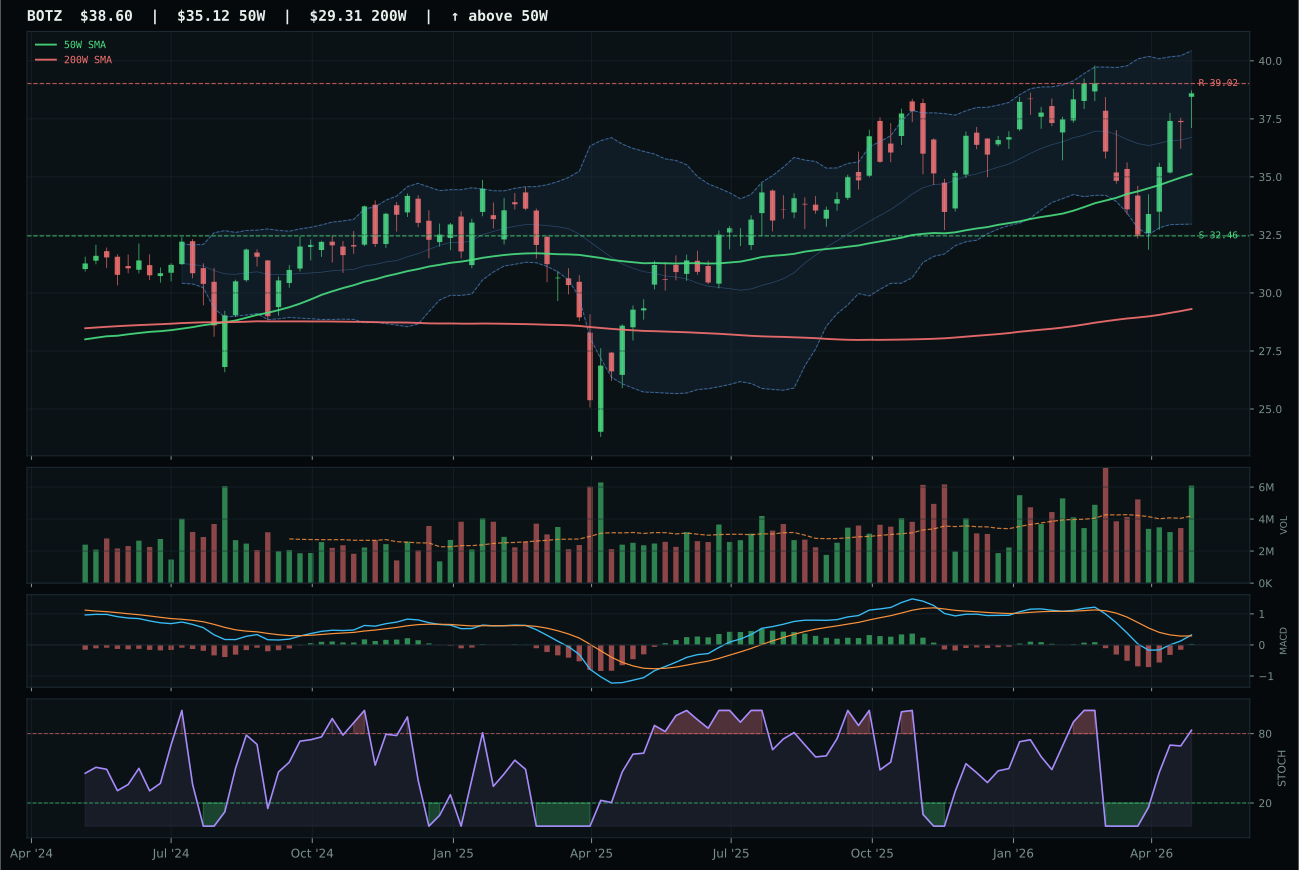
BOTZ has a neutral structure profile with -0.7% 13-week relative strength versus SPY.
A failed hold above support would weaken the setup.
Actionable but governed by invalidation levels.
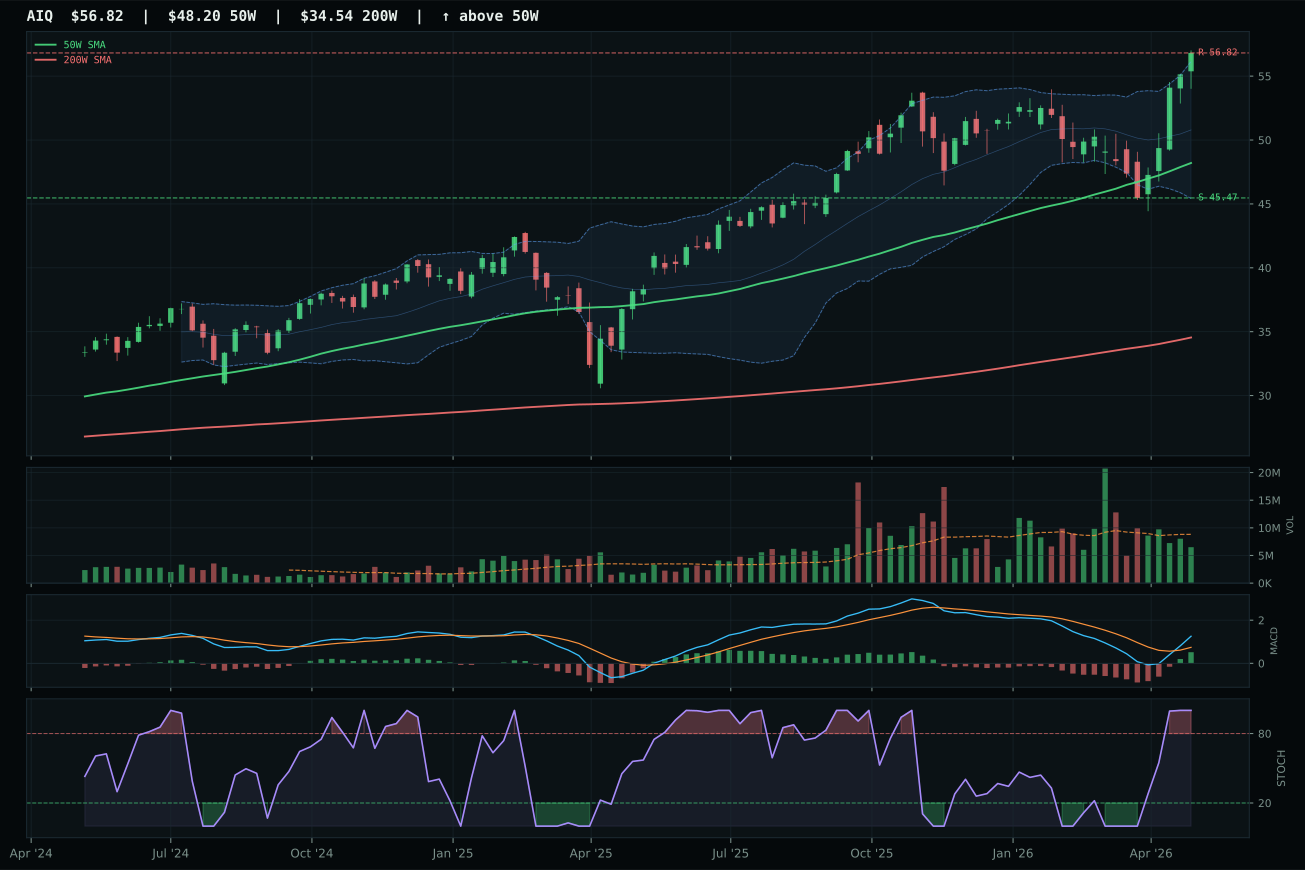
AIQ has a vertical extension profile with 5.2% 13-week relative strength versus SPY.
A failed hold above support would weaken the setup.
Actionable but governed by invalidation levels.
SMH seized the AI category with 22.2% relative strength versus SPY and 17.0% category-relative outperformance, translating a 26.4% 13-week return into decisive proof of momentum leadership. The semiconductor compute thesis drove persistence to 91.7%, meaning SMH's vertical extension 47.1% above the 50-week line carried genuine volume confirmation at 1.06x the 20-week average—neutral liquidity but not rejecting the move. Against BOTZ's mechanical advantage in pure trend and composite technical scores, SMH's category-relative strength gap of 22.9 points (17.0% minus BOTZ's -5.9%) proved dispositive; BOTZ's robotics beta failed to keep pace with the computational hardware acceleration narrative, leaving it with a -0.7% SPY-relative return that undercuts its neutral setup structure.
AI earned its 20% top-2 allocation rank at 73.0, the second-highest category score in the portfolio, reflecting both technical evidence and macro regime fit. The active AI growth sponsorship descriptor (+14 points) combines with positive risk appetite and real-asset sponsorship to generate category-level macro fit of 66.0, a robust floor. SMH's 47.1% extension above the 50-week moving average and stochastic RSI overbought reading (1.00) create entry risk that normally would constrain allocation, but the 81.3% volume-price confirmation and 91.7% persistence rating justify the extended entry in a portfolio framework that weights momentum confirmation at maximum weight. The category's 39.6% risk-reward score signals downside risk to 56.3% below support, but in a Transition/Mixed macro regime where technology and energy are the twin growth engines, bearing that drawdown risk for upside capture remains the optimal capital deployment decision.
Utilities & Infrastructure — PAVE
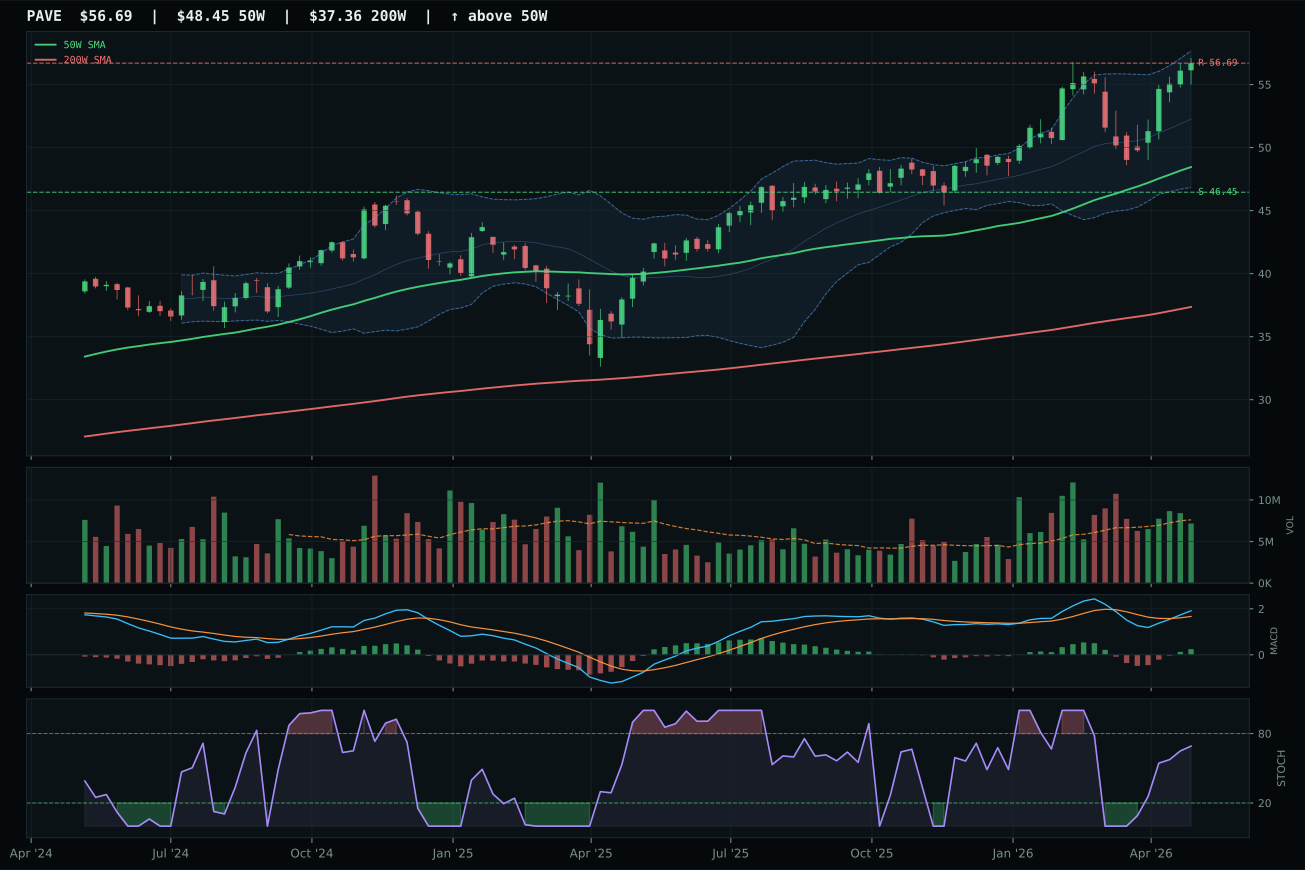
PAVE has a vertical extension profile with 7.6% 13-week relative strength versus SPY.
A failed hold above support would weaken the setup.
Actionable but governed by invalidation levels.
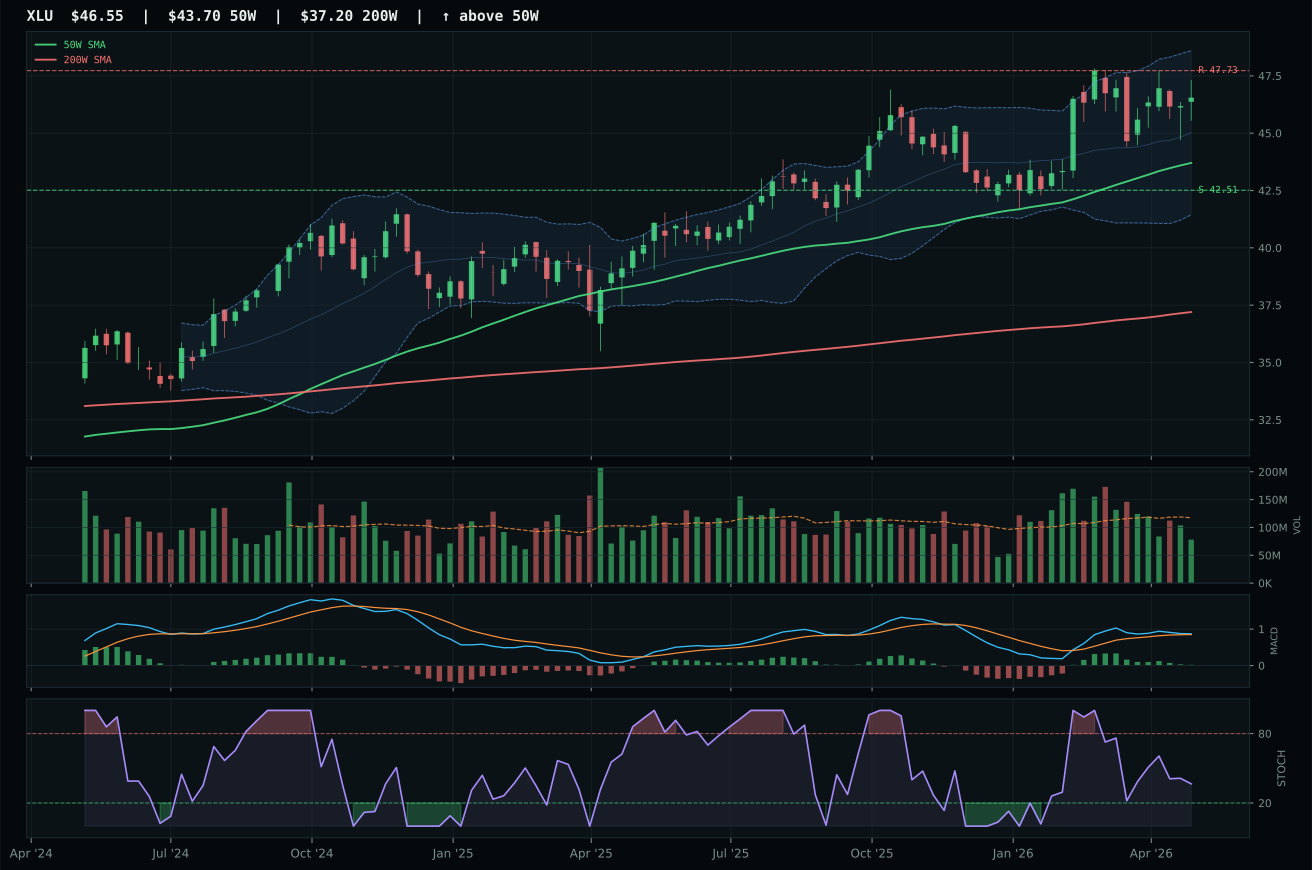
XLU has a neutral structure profile with 3.5% 13-week relative strength versus SPY.
A failed hold above support would weaken the setup.
Actionable but governed by invalidation levels.
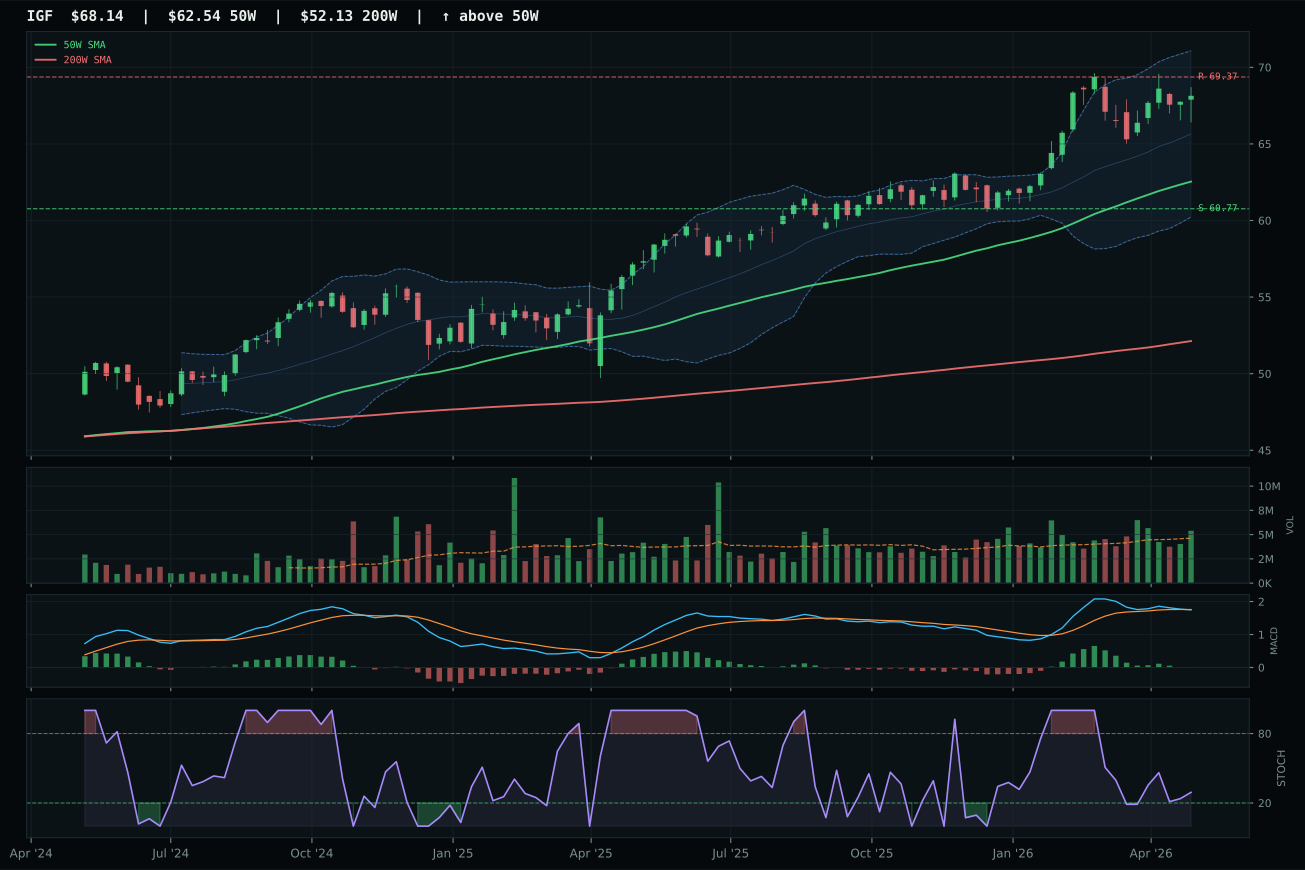
IGF has a neutral structure profile with 1.6% 13-week relative strength versus SPY.
A failed hold above support would weaken the setup.
Actionable but governed by invalidation levels.
PAVE outpointed XLU with superior MACD momentum (bullish and improving versus bullish but flattening) and better stochastic RSI timing (rising mid-zone 0.69 versus falling neutral), translating into 79.3% technical evidence versus XLU's 69.1%. The infrastructure beta captured 11.7% 13-week returns with 7.6% SPY-relative strength and 4.1% category-relative edge, while volume-price confirmation at 72.9% proved this was real accumulation, not mere bounce. Structure integrity favored PAVE (75.8 versus 75.0), and despite both sitting in vertical extension 17.0% above the 50-week average, PAVE's rising momentum indicators suggested coiling strength while XLU's falling stochastic RSI signaled fatigue. The 2.4-point margin reflects genuine technical differentiation between growth-exposed capex beta (PAVE) and regulated utility defense (XLU).
Utilities & Infrastructure ranks third at 63.9, holding 10% allocation in a Transition/Mixed regime where defensive rotation (+12) and category-specific macro fit (58.0) provide solid foundation without creating explosive upside case. PAVE's 79.3% technical evidence combined with 53.0% macro fit yields 70.4% weighted composite before category testing, respectable but trailing Energy and AI decisively. Risk-reward of 43.5% with 22.0% downside to support and zero upside to resistance suggests this is an allocation held for stability and income yield rather than capital appreciation. The category benefits from Transition/Mixed regime designation (+4) and positive risk appetite, yet inflation pressure (-6 points) and credit stress headwinds limit enthusiasm. To escalate to 20%, this category would require either marked deterioration in higher-ranked categories or a credit-stress event that makes defensive infrastructure yields suddenly attractive; under current pricing and regime dynamics, 10% represents appropriate capital allocation for a portfolio already committed 40% to growth.
Agriculture & Livestock — WEAT
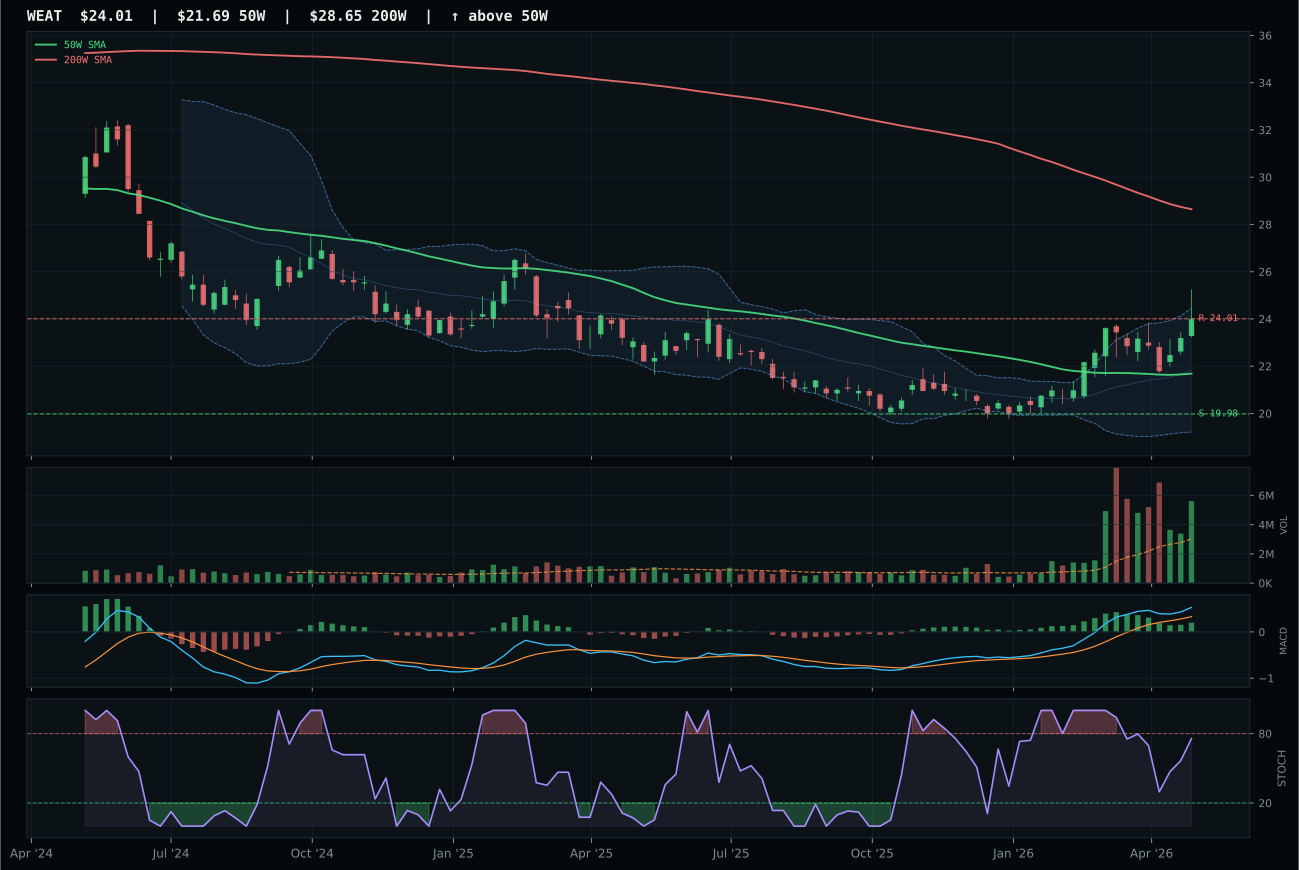
WEAT has a neutral structure profile with 10.4% 13-week relative strength versus SPY.
A failed hold above support would weaken the setup.
Actionable but governed by invalidation levels.
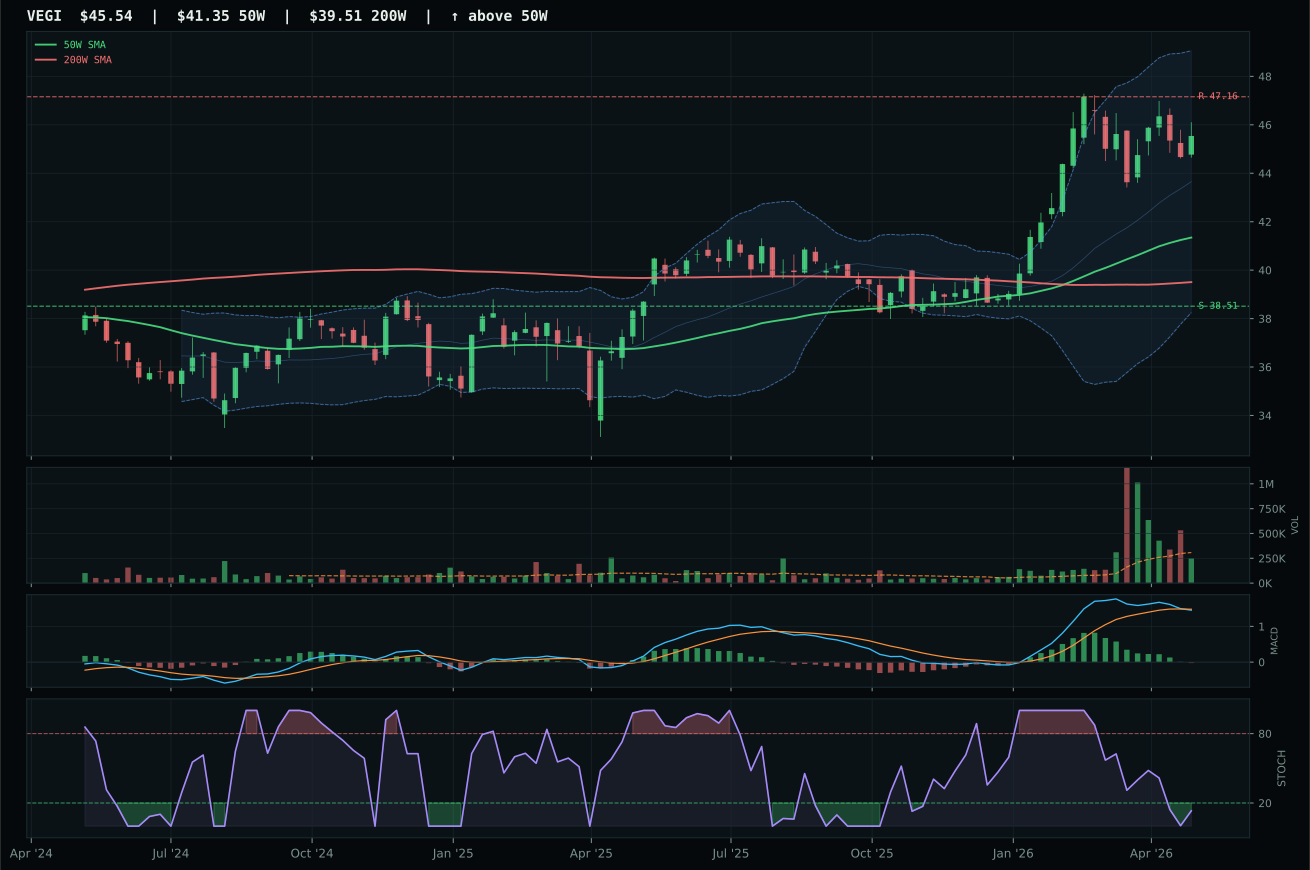
VEGI has a neutral structure profile with 2.9% 13-week relative strength versus SPY.
A failed hold above support would weaken the setup.
Actionable but governed by invalidation levels.
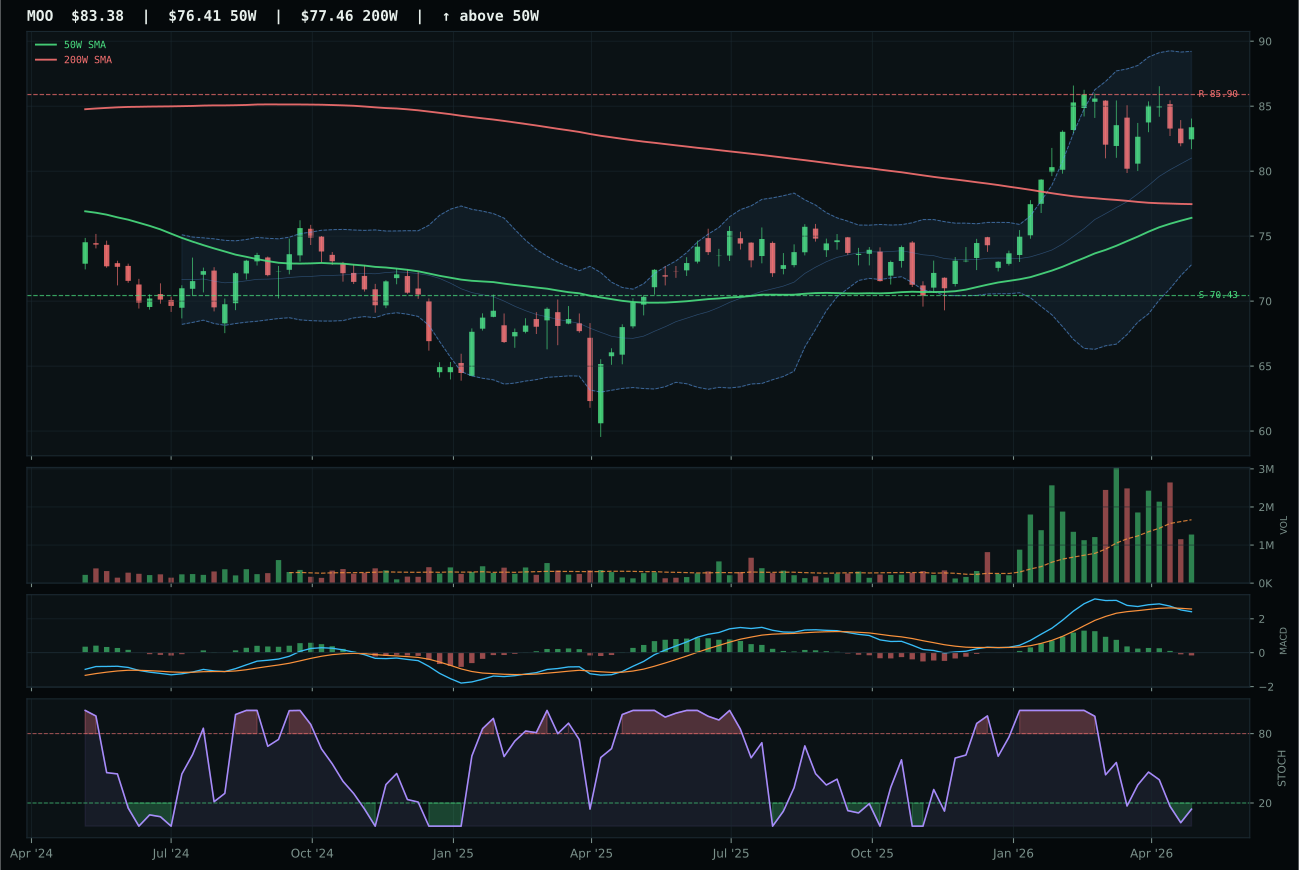
MOO has a neutral structure profile with -0.3% 13-week relative strength versus SPY.
A failed hold above support would weaken the setup.
Actionable but governed by invalidation levels.
WEAT dominated its category with a flawless 100.0% technical evidence score, capturing 14.5% 13-week returns and 7.5% category-relative strength despite sitting below the 200-week moving average. The winner's structure was clinically neutral yet supported by real accumulation: 1.85x the 20-week volume average and 92.7% volume-price confirmation proved this was not a bouncing setup but deliberate buying. Timing scored a robust 78.0, anchored by rising mid-zone stochastic RSI (0.76) and a bullish but flattening MACD that suggested momentum coiling rather than fading. VEGI fell far behind with a 47.5% technical evidence score, bearish weakening MACD, oversold stochastic RSI, and 0.0% category-relative strength, despite stronger macro fit (69.0 vs 50.0); the gap illustrates how decisively current price action and sponsorship override longer-term narrative signals.
Agriculture & Livestock ranks fourth at 60.6, earning a 10% allocation driven by exceptional macro-narrative alignment rather than technical extension. The category-level macro fit of 86.0 stands among the portfolio's highest, anchored by supply shortage (+13), inflation pressure (+10), real asset sponsorship (+8), and commodity breadth positive (+5)—a rare convergence of multiple active descriptors. WEAT's technical score of 100.0 provides conviction foundation, yet the category only holds 10% because XLE and SMH at 77.0 and 73.0 respectively command higher final scores, and both offer better risk-adjusted entry points given their timing scores (56.0 and 37.0 respectively). The risk-reward score of 57.1 offers respectable asymmetry, and persistence at 87.8% indicates genuine accumulation. To graduate to 20%, this category would require either a breakdown in energy prices (reducing its macro overlap with XLE) or a sustained acceleration in commodity breadth positive descriptor, neither probable given current geopolitical and production dynamics.
Technology — XLK
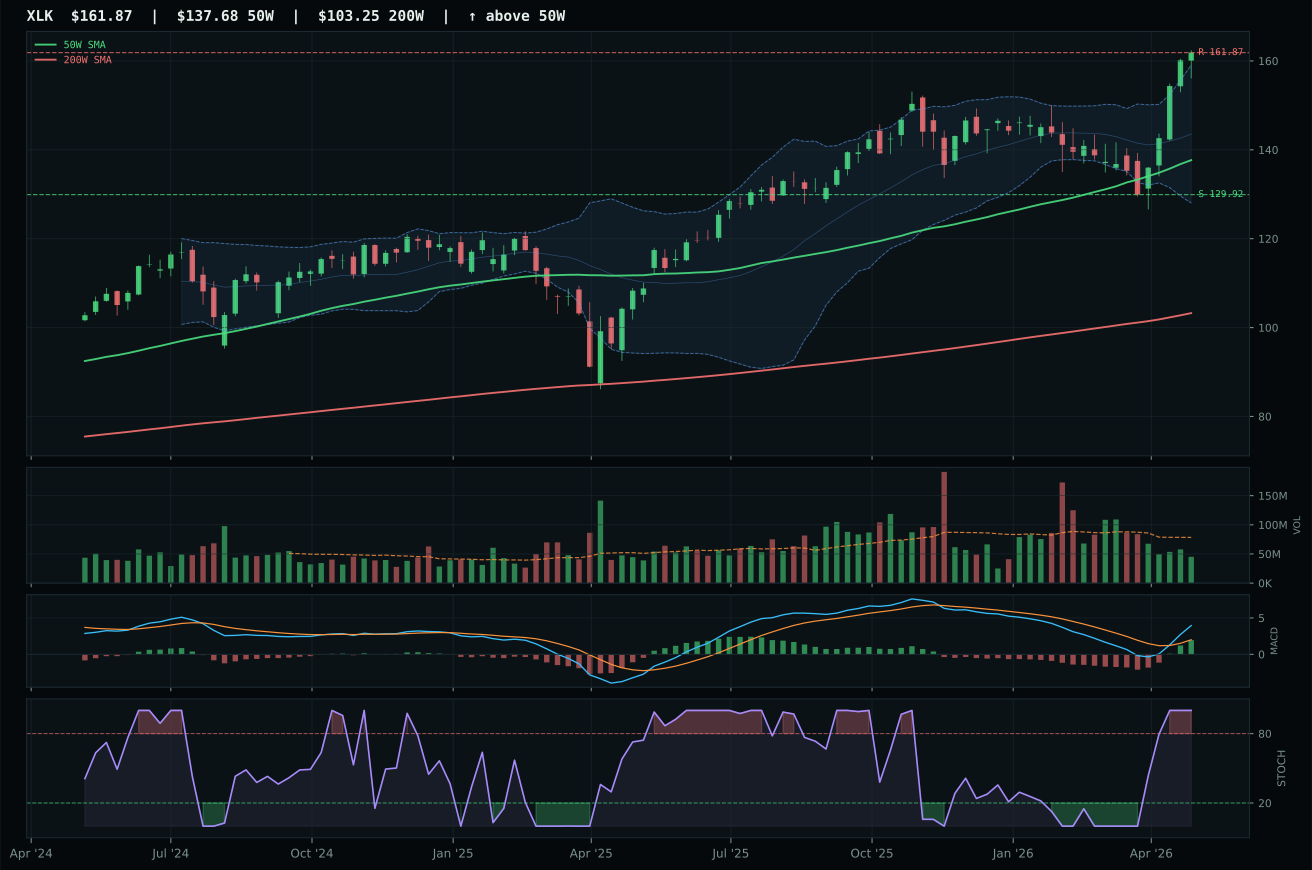
XLK has a vertical extension profile with 8.4% 13-week relative strength versus SPY.
A failed hold above support would weaken the setup.
Actionable but governed by invalidation levels.
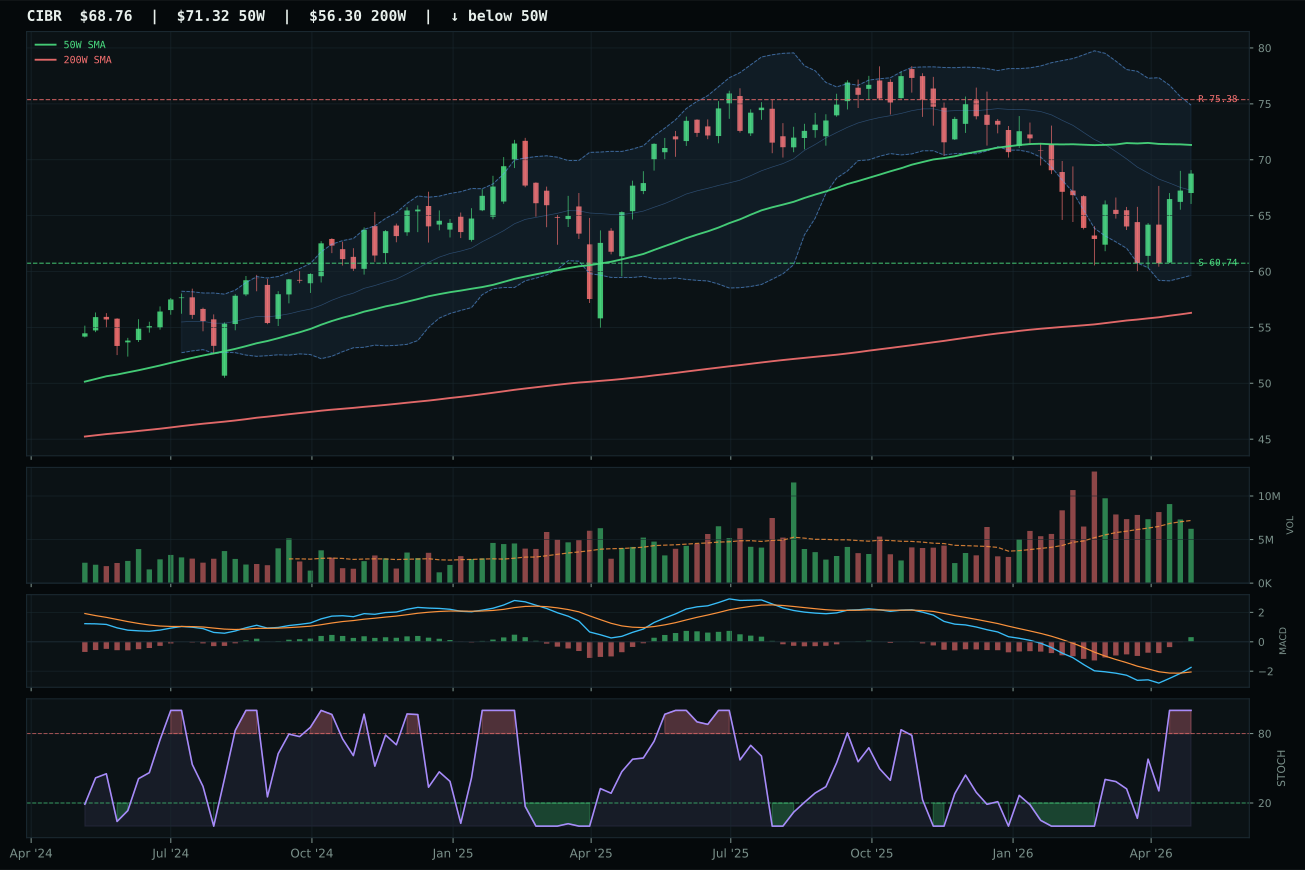
CIBR has a neutral structure profile with -4.6% 13-week relative strength versus SPY.
A failed hold above support would weaken the setup.
Actionable but governed by invalidation levels.
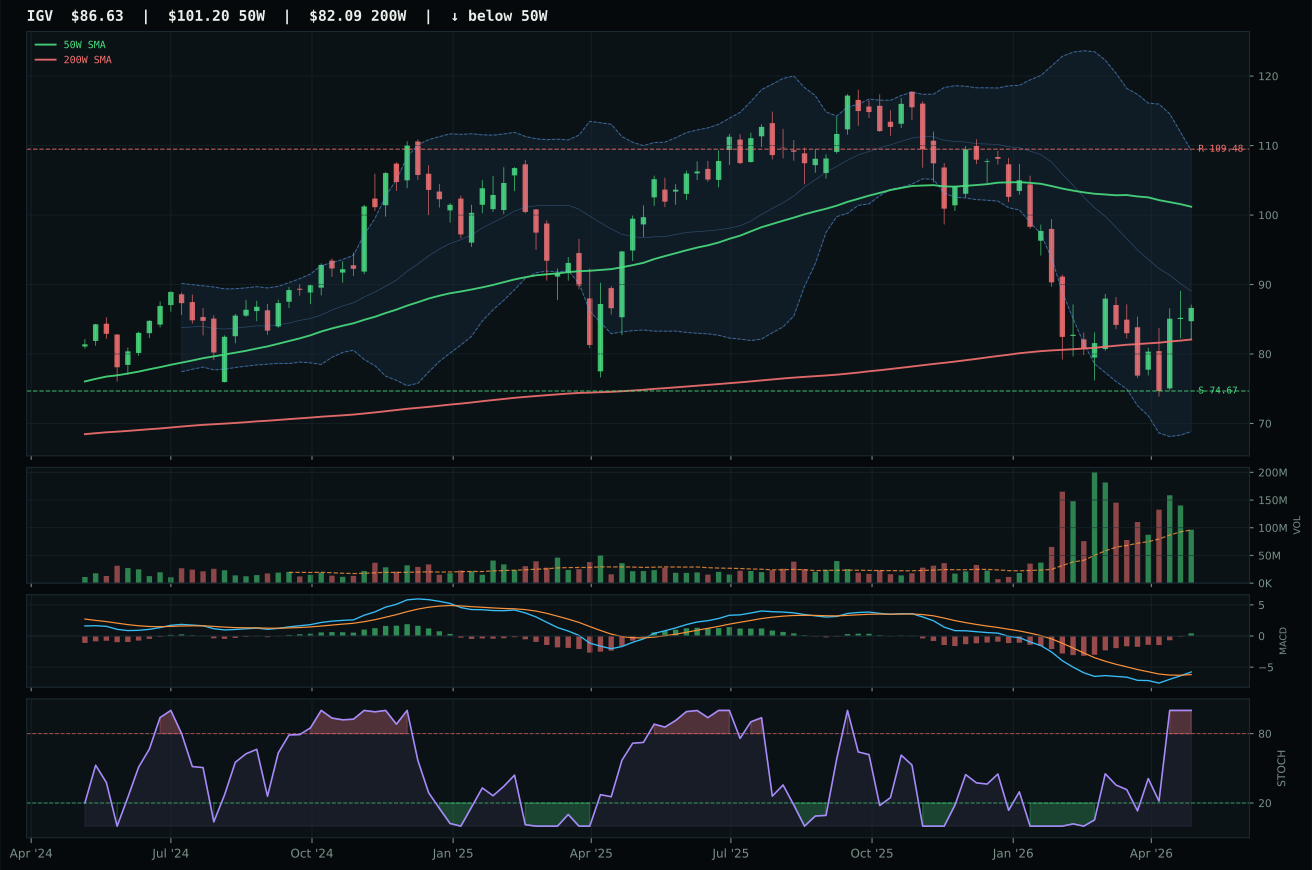
IGV has a neutral structure profile with -8.2% 13-week relative strength versus SPY.
A failed hold above support would weaken the setup.
Actionable but governed by invalidation levels.
XLK prevailed with a 12.9% relative strength advantage over its category median, a decisive edge that CIBR's flat 0.0% category RS could not match. The broad technology leadership captured 12.5% in 13-week returns while momentum confirmation scored a clean 100.0, driven by a bullish, improving MACD and sustained trend strength across all reference periods. Structure integrity scored 68.9 versus CIBR's 66.8, reflecting XLK's superior compression ratio and cleaner support placement at 129.92. Volume participation at 0.58x the 20-week average remains thin, but that constraint penalizes extension risk rather than invalidating the technical case; CIBR's neutral volume profile and deteriorating 13W RS to -0.4% reveal a laggard being pushed by sector tailwinds rather than pulled by accumulation.
Technology ranks sixth among the ten categories at 56.0, holding its 10% allocation slot despite strong macro tailwinds from active AI growth sponsorship and positive risk appetite. The category-level macro fit of 54.0 reflects genuine tension: credit stress headwinds and inflation pressure work against a narrative otherwise buoyed by technology-specific growth narratives and risk-on conditions. XLK's extension 17.6% above the 50-week moving average and thin participation create timing friction that keeps the category from commanding top-2 consideration, even as its momentum confirmation stays pristine. For this allocation to graduate to 20%, the category would need either a fresh, deeper retracement to build better entry risk-reward, or a deterioration in the two higher-ranked categories that currently claim the premium allocation slots.
Industrial Metals — REMX
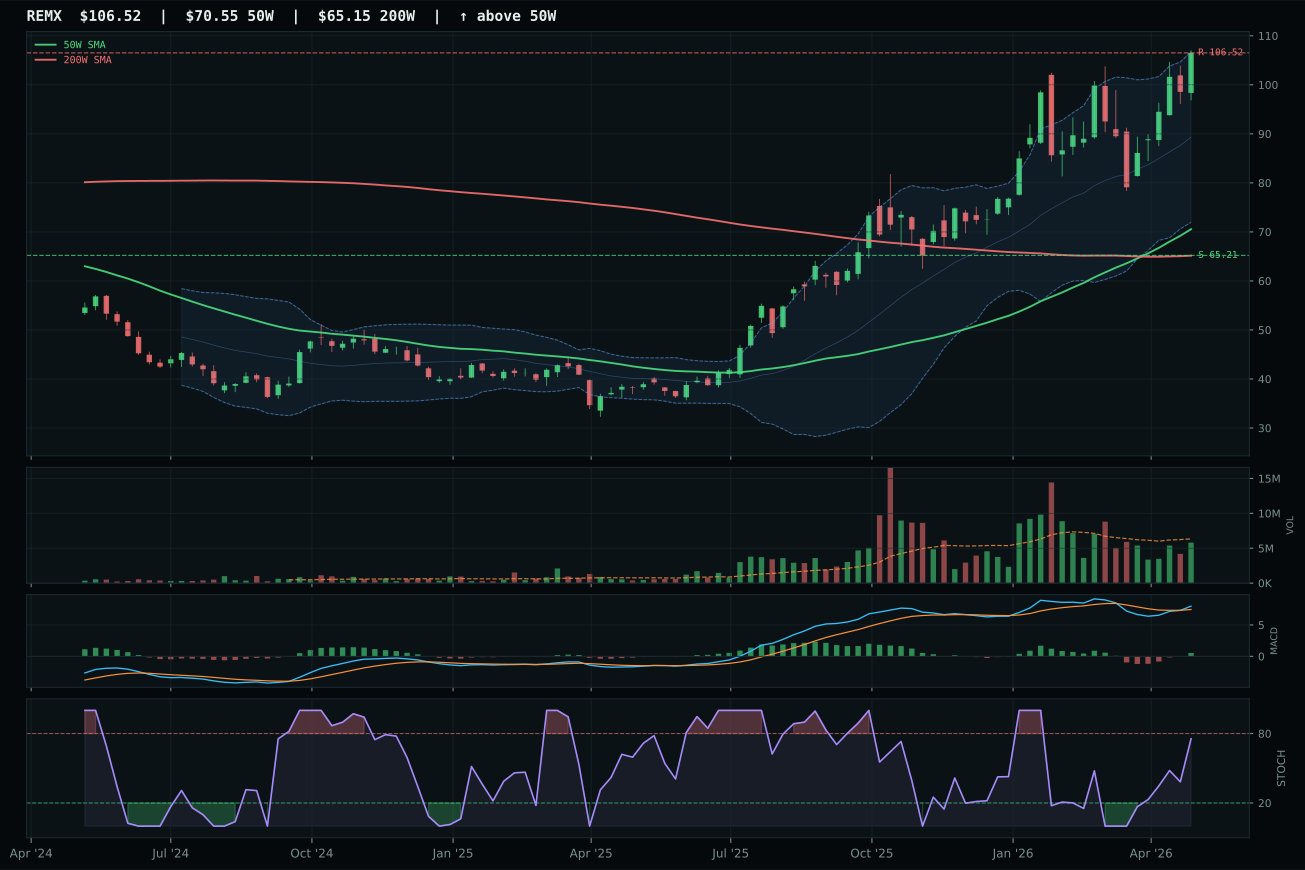
REMX has a vertical extension profile with 20.3% 13-week relative strength versus SPY.
A failed hold above support would weaken the setup.
Actionable but governed by invalidation levels.
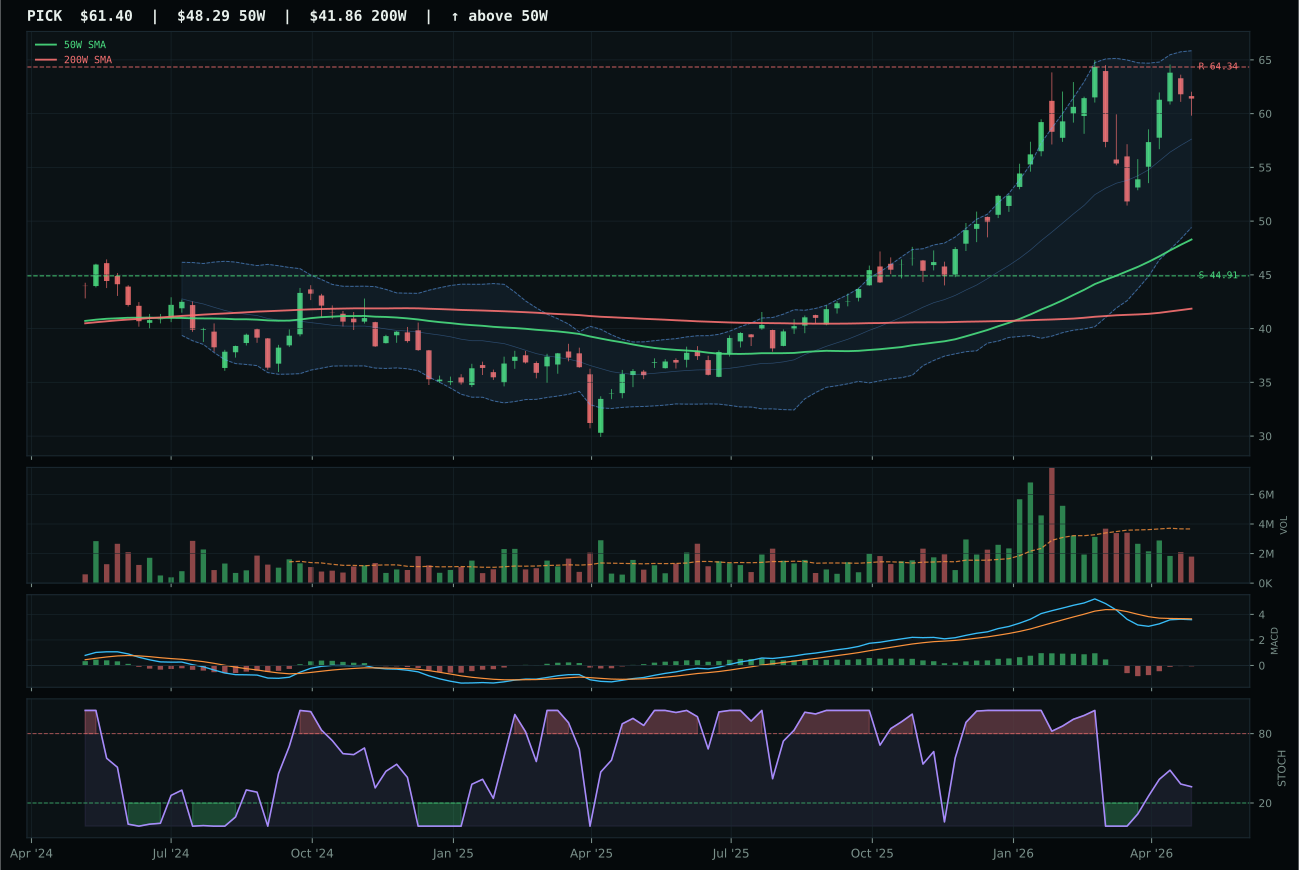
PICK has a vertical extension profile with 1.2% 13-week relative strength versus SPY.
A failed hold above support would weaken the setup.
Actionable but governed by invalidation levels.
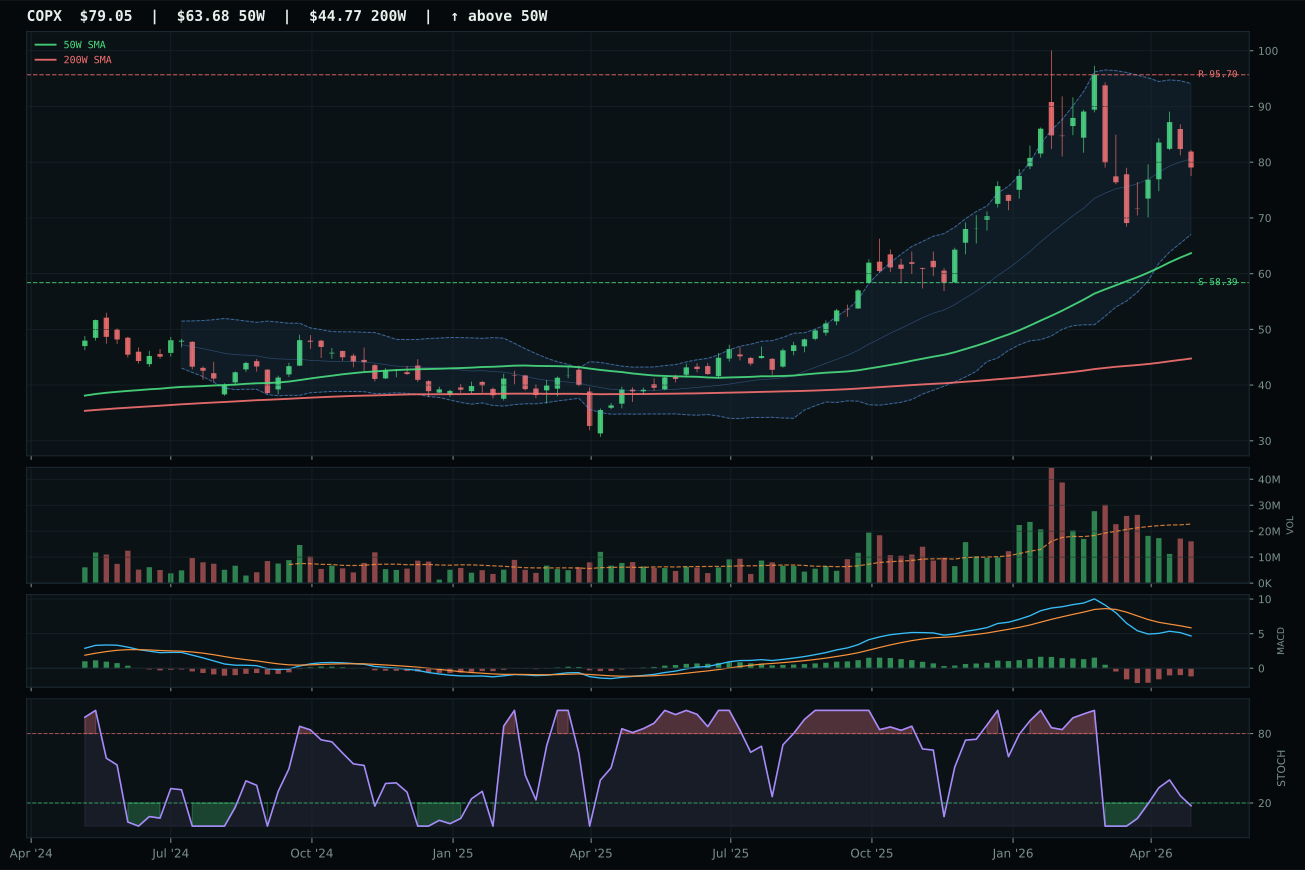
COPX has a vertical extension profile with -10.9% 13-week relative strength versus SPY.
A failed hold above support would weaken the setup.
Actionable but governed by invalidation levels.
REMX capitalized on rare earth supply scarcity narrative with 100.0% momentum confirmation, delivering 24.4% 13-week returns and 20.3% SPY-relative strength despite a punishing 51.0% extension above the 50-week moving average. Stochastic RSI at rising mid-zone (0.75) and bullish, improving MACD combined with volume-price confirmation of 81.9% to signal this extension carried real accumulation, not just momentum exhaustion. Against PICK's bearish but improving MACD, falling neutral stochastic RSI, and thin participation, REMX's technical superiority was absolute: 81.7% technical evidence versus PICK's 39.7%, and 19.1% category-relative strength against 0.0%. The metals scarcity descriptor (+9) and supply shortage (+8) created macro permission for REMX's aggressive extension, turning what would normally be an entry-timing problem into a justified advance.
Industrial Metals ranks fifth at 52.1, holding 10% allocation as a barbell play on supply constraints and capex cycles within a Transition/Mixed regime. Category-level macro fit of 73.0 reflects strong active descriptor support: metals scarcity (+14), commodity breadth positive (+10), real asset sponsorship (+6), and supply shortage active. Yet REMX's 24.3% risk-reward score represents a critical constraint—upside to resistance is flat, while downside to support spans 63.3%, creating severe asymmetry that warrants defensive position-sizing. The 93.7% persistence score and 81.9% volume-price confirmation justify holding rather than liquidating, but the extended entry and poor risk-reward prevent upgrading to 10% allocation. To earn increased weight, this category needs either a sharp retracement to rebuild entry risk-reward, or an escalation in supply-chain disruption fears that would justify holding through the downside risk.
Emerging Markets — IEMG
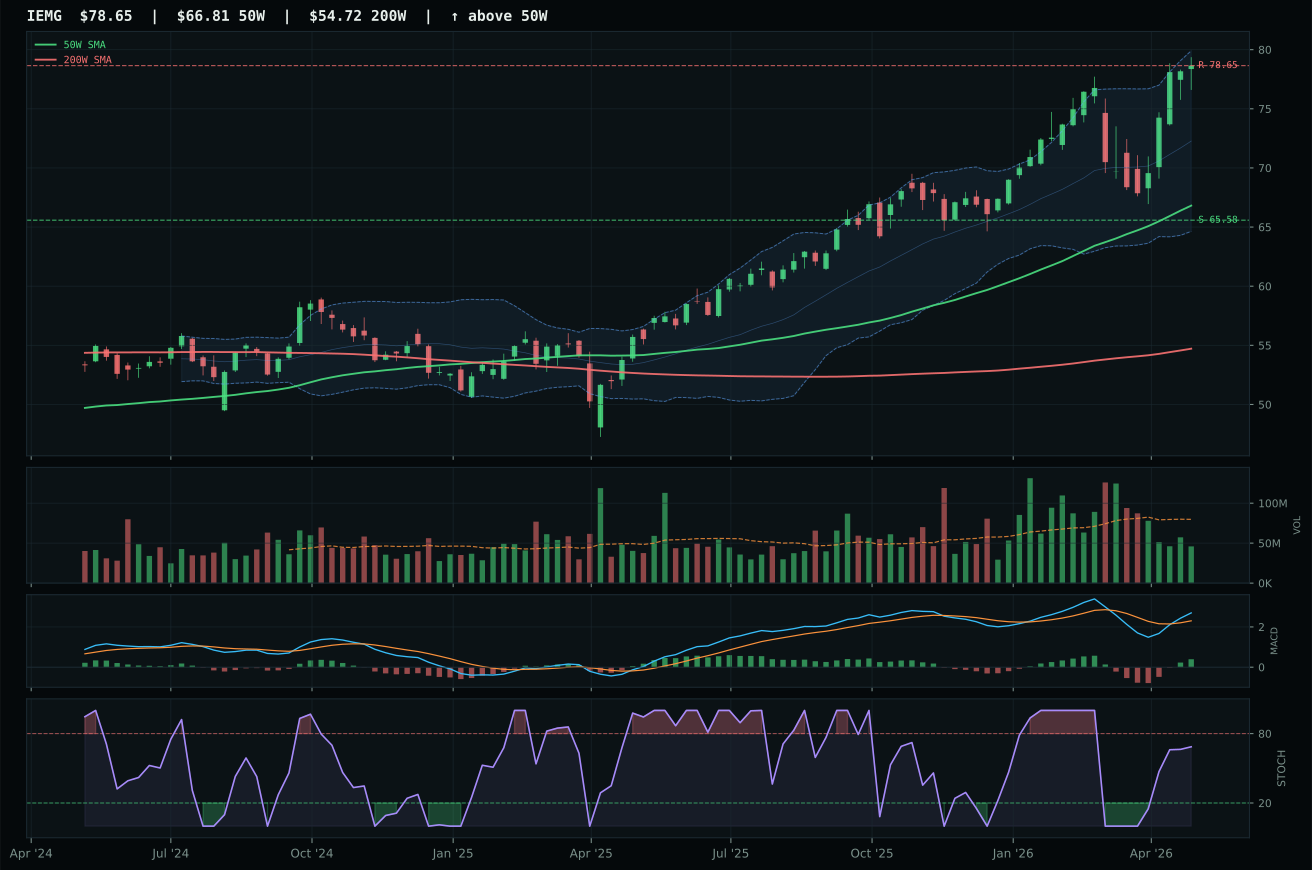
IEMG has a vertical extension profile with 4.2% 13-week relative strength versus SPY.
A failed hold above support would weaken the setup.
Actionable but governed by invalidation levels.
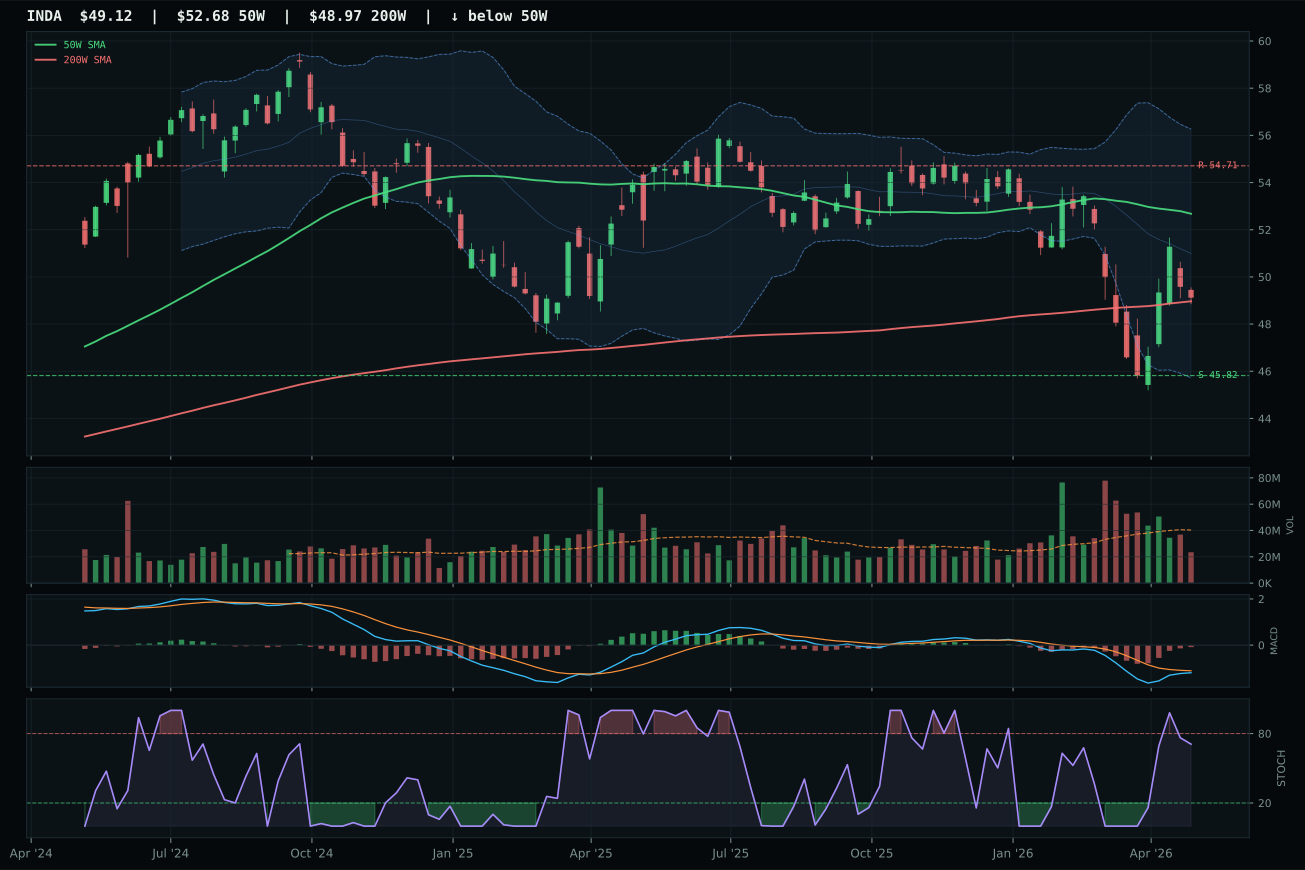
INDA has a neutral structure profile with -9.2% 13-week relative strength versus SPY.
A failed hold above support would weaken the setup.
Actionable but governed by invalidation levels.
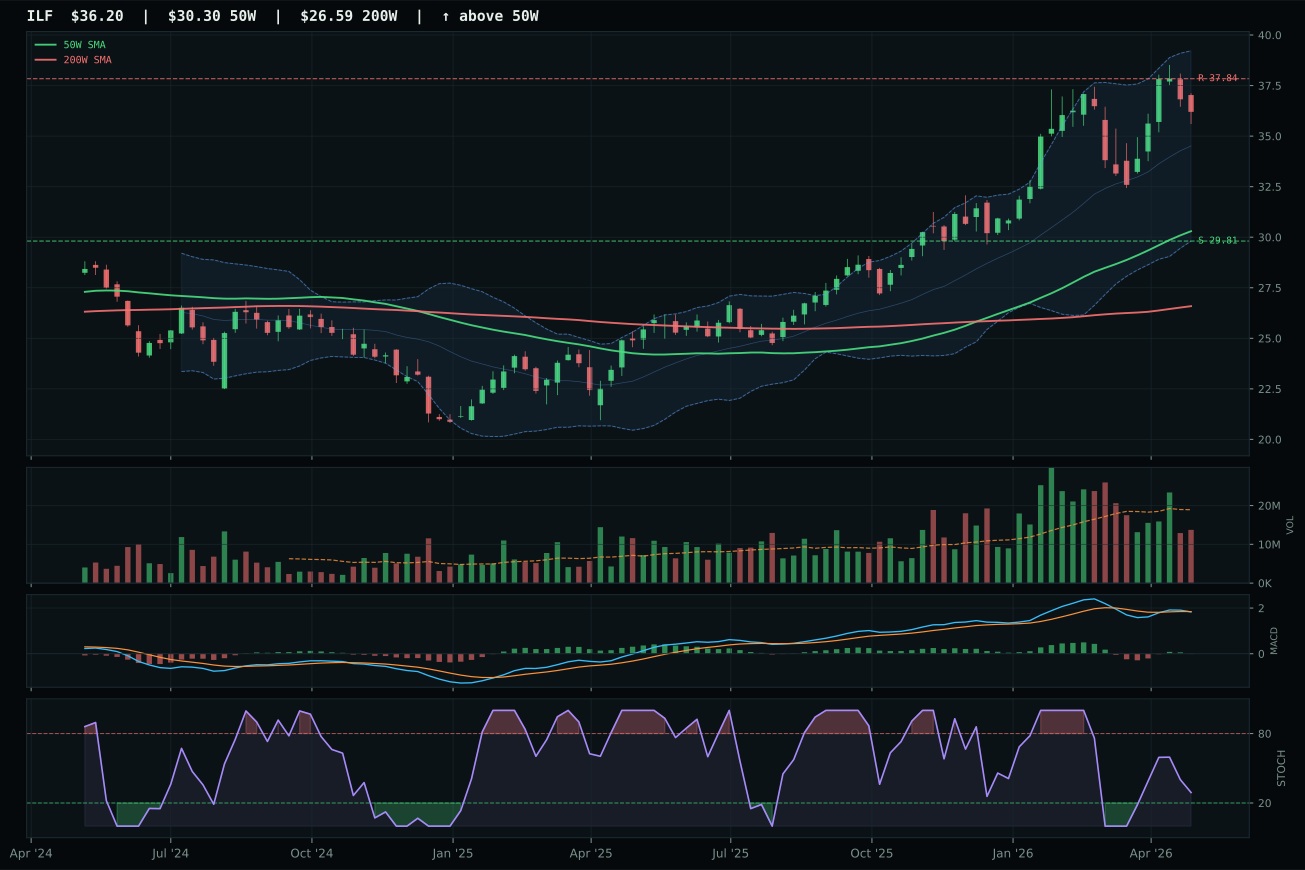
ILF has a vertical extension profile with -1.8% 13-week relative strength versus SPY.
A failed hold above support would weaken the setup.
Actionable but governed by invalidation levels.
IEMG dominated emerging-market selection with 100.0% momentum confirmation, 69.4% technical evidence, and a decisive 6.0% category-relative strength advantage over ILF and a 13.4-point lead over INDA. The broad beta captured 8.4% 13-week returns with volume-price confirmation at 65.5% and persistence at 72.7%, signaling genuine accumulation despite 17.7% extension above the 50-week moving average. Rising mid-zone stochastic RSI (0.69) and bullish, improving MACD combined with clean structure (74.1) to validate entry conviction. INDA's 13.4% category RS gap and bearish but improving MACD revealed a quality-growth story failing to attract capital relative to broad beta, while ILF's 1.8% SPY-relative return and falling neutral stochastic RSI confirmed sector-wide momentum diffusion favoring the highest-conviction leadership.
Emerging Markets ranks ninth at 50.1, holding 10% allocation despite solid technical evidence because category-level macro fit of 62.0 offers only moderate support. EM liquidity support descriptor (+14) and risk appetite positive (+8) are meaningful, yet credit stress (-10) creates meaningful headwind in a Transition/Mixed regime where EM currencies and flows remain vulnerable to Fed policy surprise. IEMG's 44.2% risk-reward score shows modest downside risk (19.9% to support) and upside asymmetry near zero (0.0% to resistance), a profile suited to minimum allocation rather than enlarged exposure. The category's 73-point 13-week momentum (8.4%) lags AI and Energy decisively, and thin participation (0.58x) suggests late-stage retail accumulation rather than institutional commitment. To graduate allocation, this category needs either a credit-stress reset or an explicit policy catalyst favorable to EM growth; absent structural change, it remains a satellite position for diversification only.
Nuclear Energy — URA
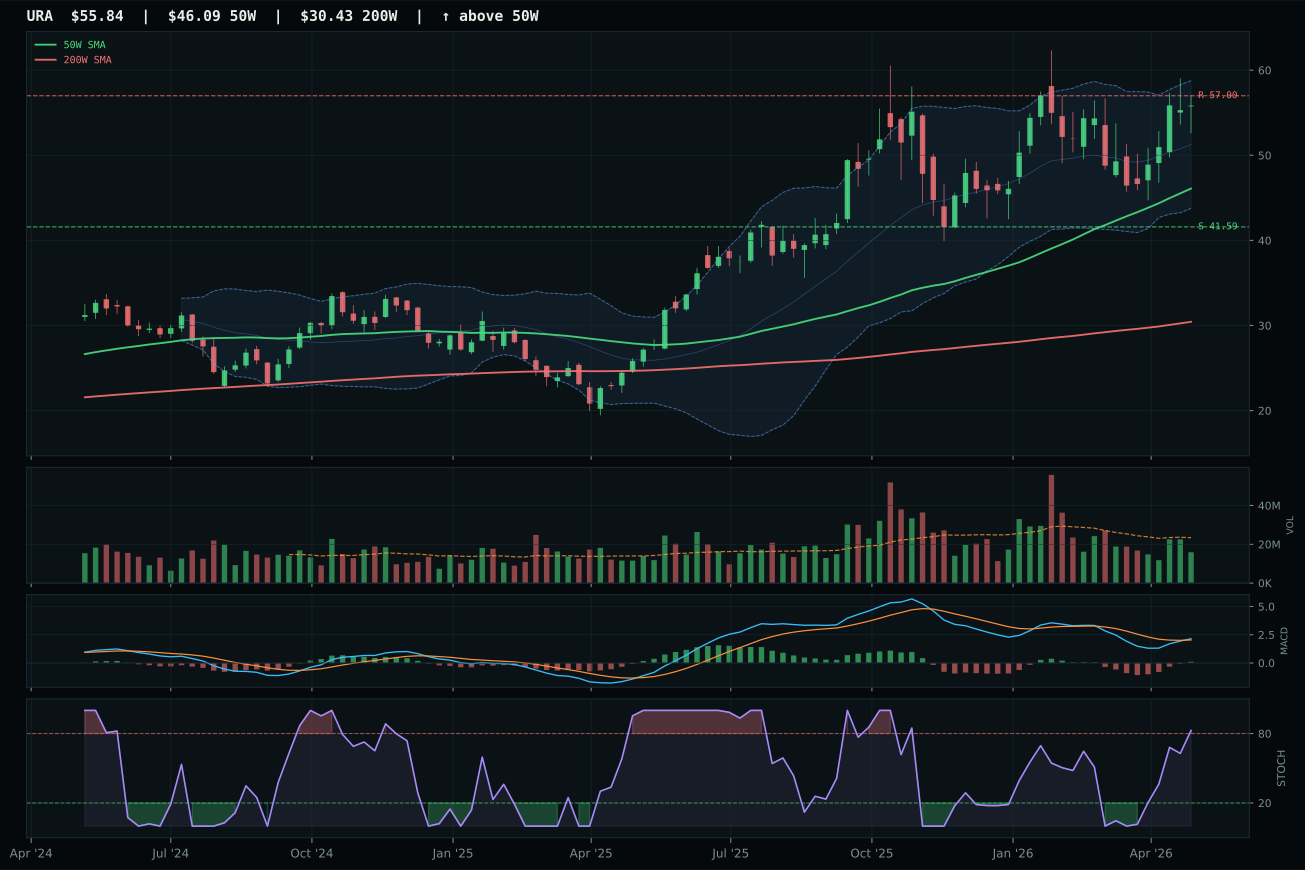
URA has a vertical extension profile with -2.6% 13-week relative strength versus SPY.
A failed hold above support would weaken the setup.
Actionable but governed by invalidation levels.
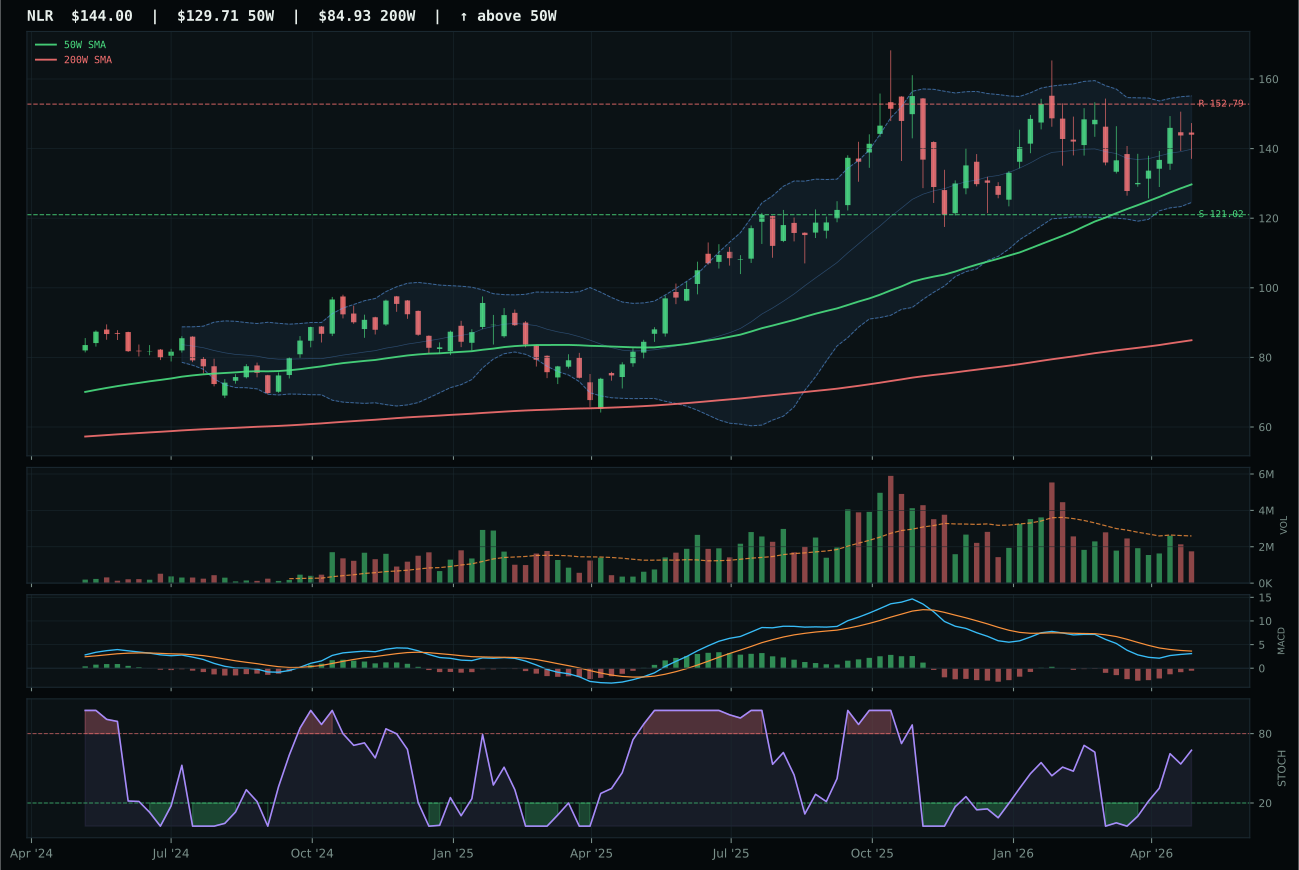
NLR has a neutral structure profile with -7.3% 13-week relative strength versus SPY.
A failed hold above support would weaken the setup.
Actionable but governed by invalidation levels.
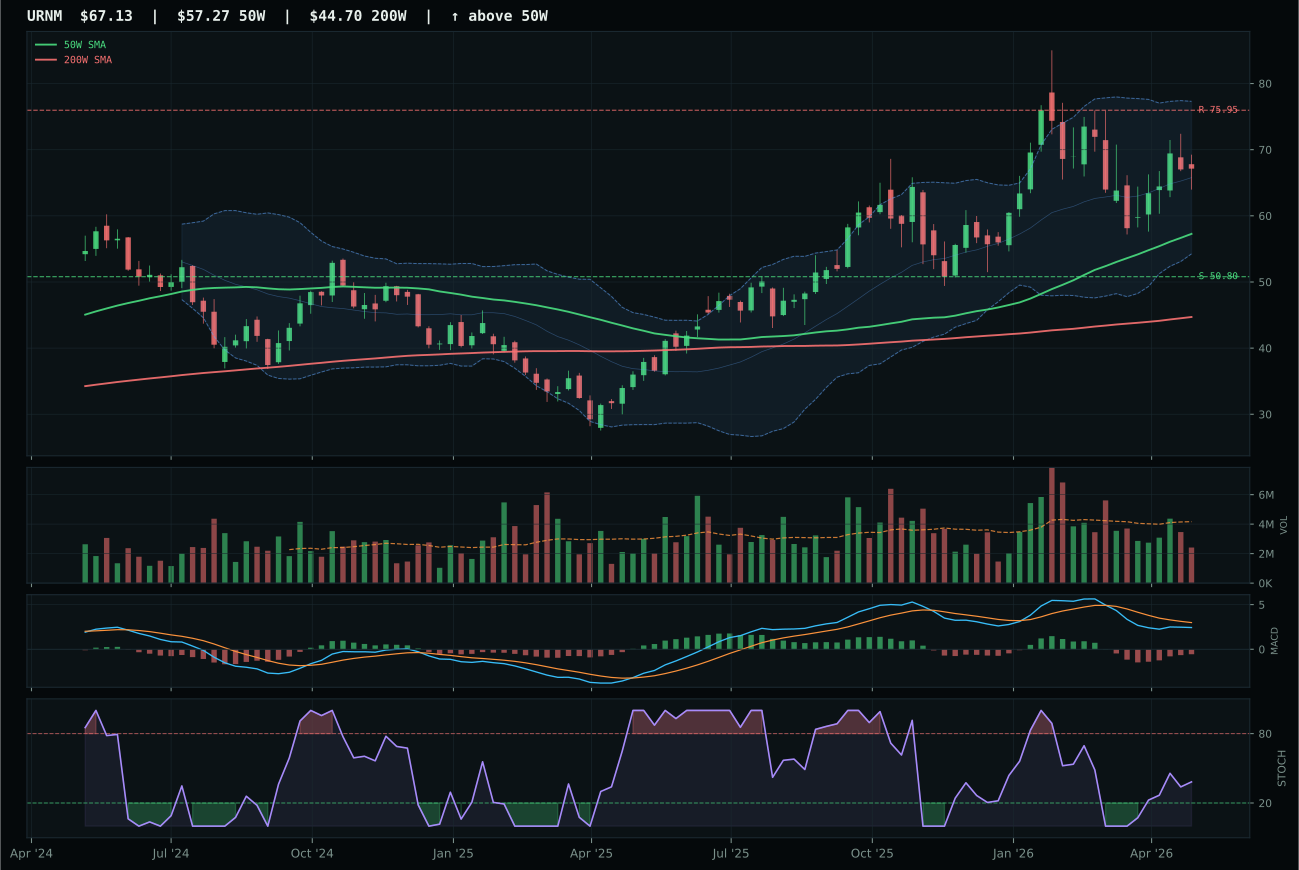
URNM has a vertical extension profile with -13.9% 13-week relative strength versus SPY.
A failed hold above support would weaken the setup.
Actionable but governed by invalidation levels.
URA edged NLR with marginal technical superiority rather than dominant conviction. The uranium ETF captured a 96.1% trend score but only 1.5% 13-week return and -2.6% SPY-relative weakness, surviving on category-relative strength of 4.7% and bullish, improving MACD against NLR's bearish but improving technical setup. Timing scored 45.0 due to 21.1% extension above the 50-week line, and risk-reward of 31.1% remains poor, with -2.0% upside to resistance and 34.3% downside to support. Volume-price confirmation at 57.8% suggests neither sponsorship nor rejection, just equilibrium pricing. This category decision hinges entirely on URA's bullish MACD versus NLR's bearish profile; given the category's macro neutrality and the absence of real momentum, the 3-point winning margin reflects margin of error rather than conviction.
Nuclear Energy ranks eighth at 49.7, securing 10% allocation on energy scarcity narrative (+9) and real asset sponsorship (+7) despite technical weakness across the board. URA's 47.1% technical evidence paired with 50.0% macro fit (neutral because category lacks specific descriptor profile) yields a 48.2% weighted composite before testing. The 69.0% category-level macro fit benefits from energy scarcity and defensive rotation, yet credit stress (-5) and AI growth sponsorship (which competes for the same capex dollar as nuclear build-out) limit upside surprise. The 31.1% risk-reward score is the portfolio's worst, with minimal upside and one-third downside to support, justifying minimum allocation. This category serves as a pure portfolio hedge on energy transition policy acceleration; absent a legislative catalyst or dramatic uranium supply disruption, the allocation should remain at floor.
Defense & Aerospace — ROKT
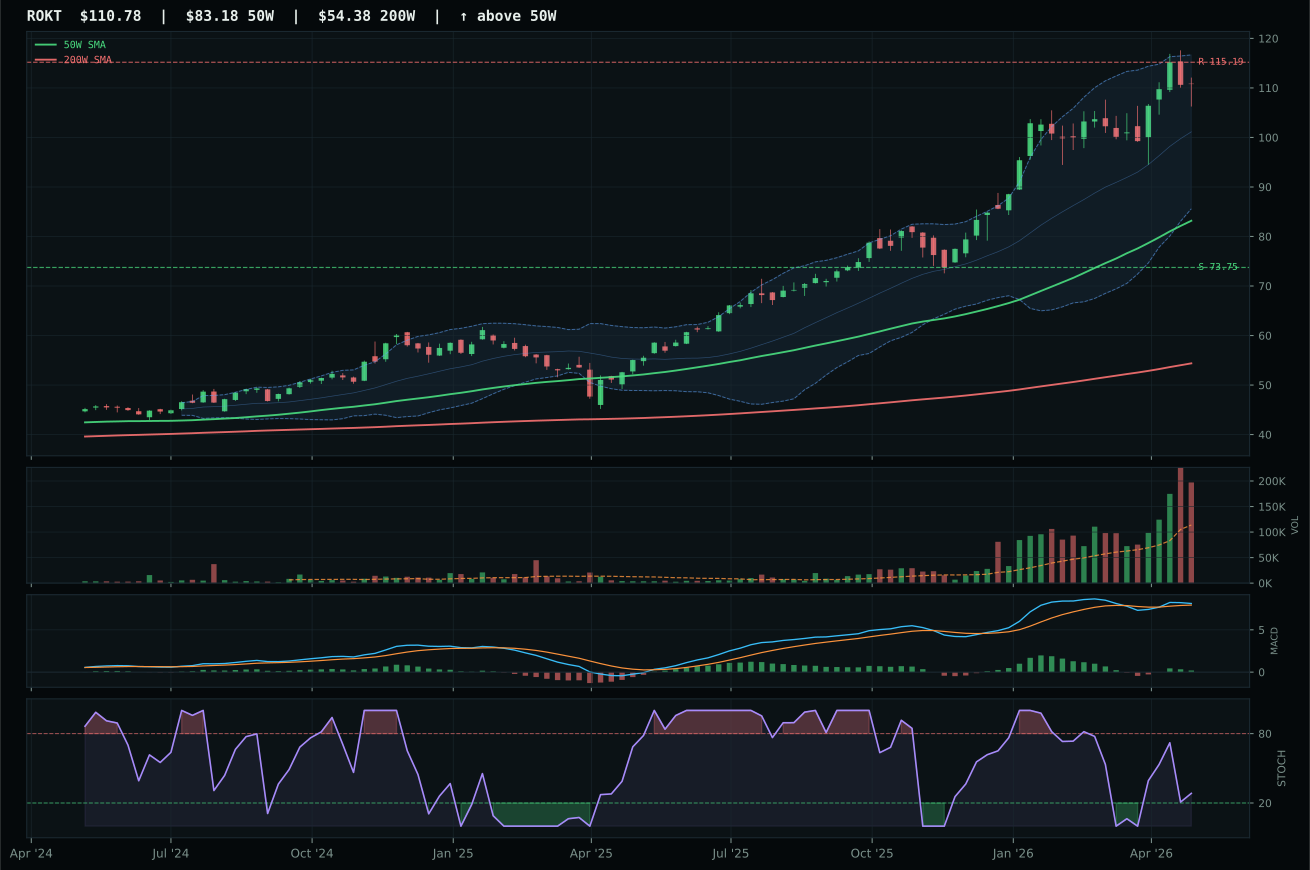
ROKT has a vertical extension profile with 5.8% 13-week relative strength versus SPY.
A failed hold above support would weaken the setup.
Actionable but governed by invalidation levels.
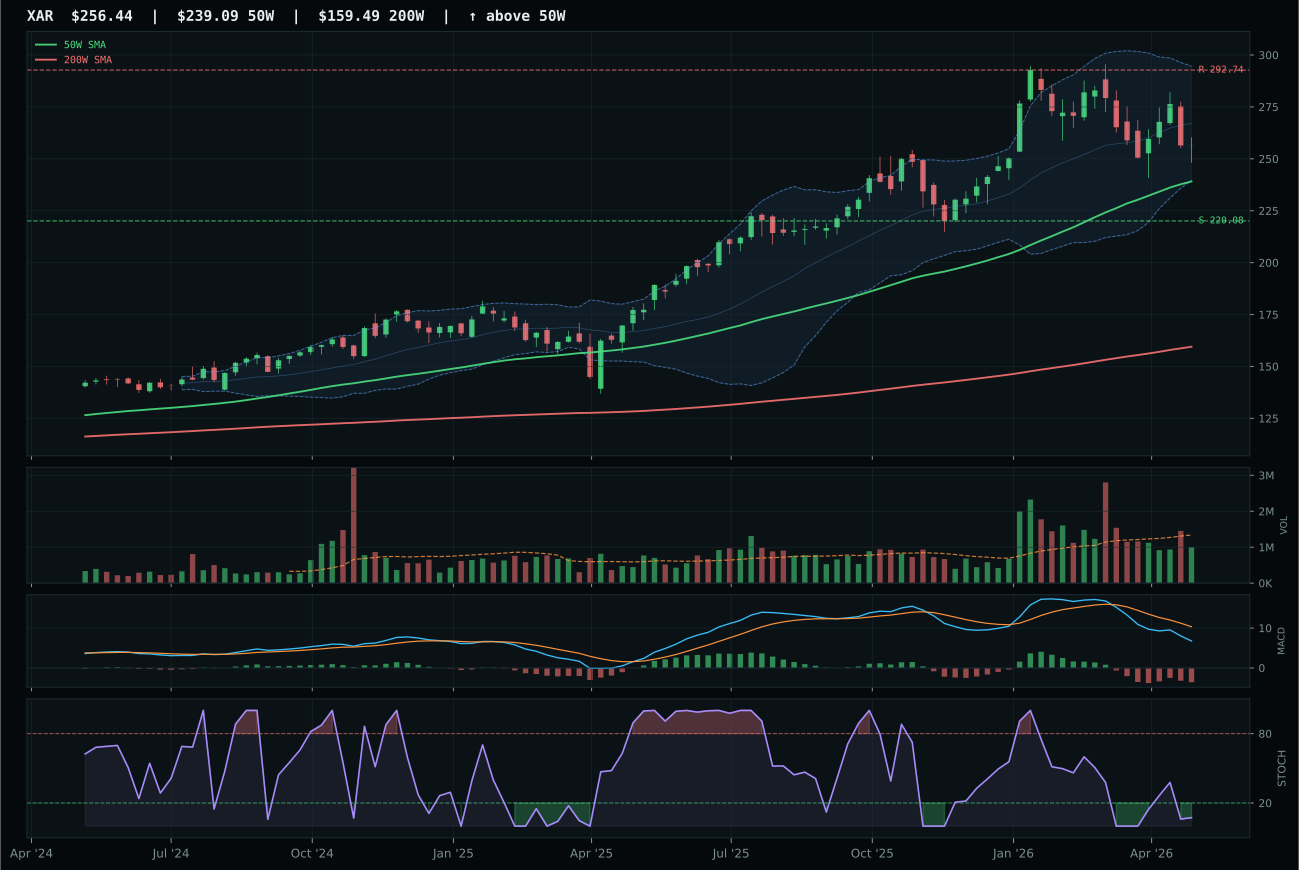
XAR has a neutral structure profile with -10.2% 13-week relative strength versus SPY.
A failed hold above support would weaken the setup.
Actionable but governed by invalidation levels.
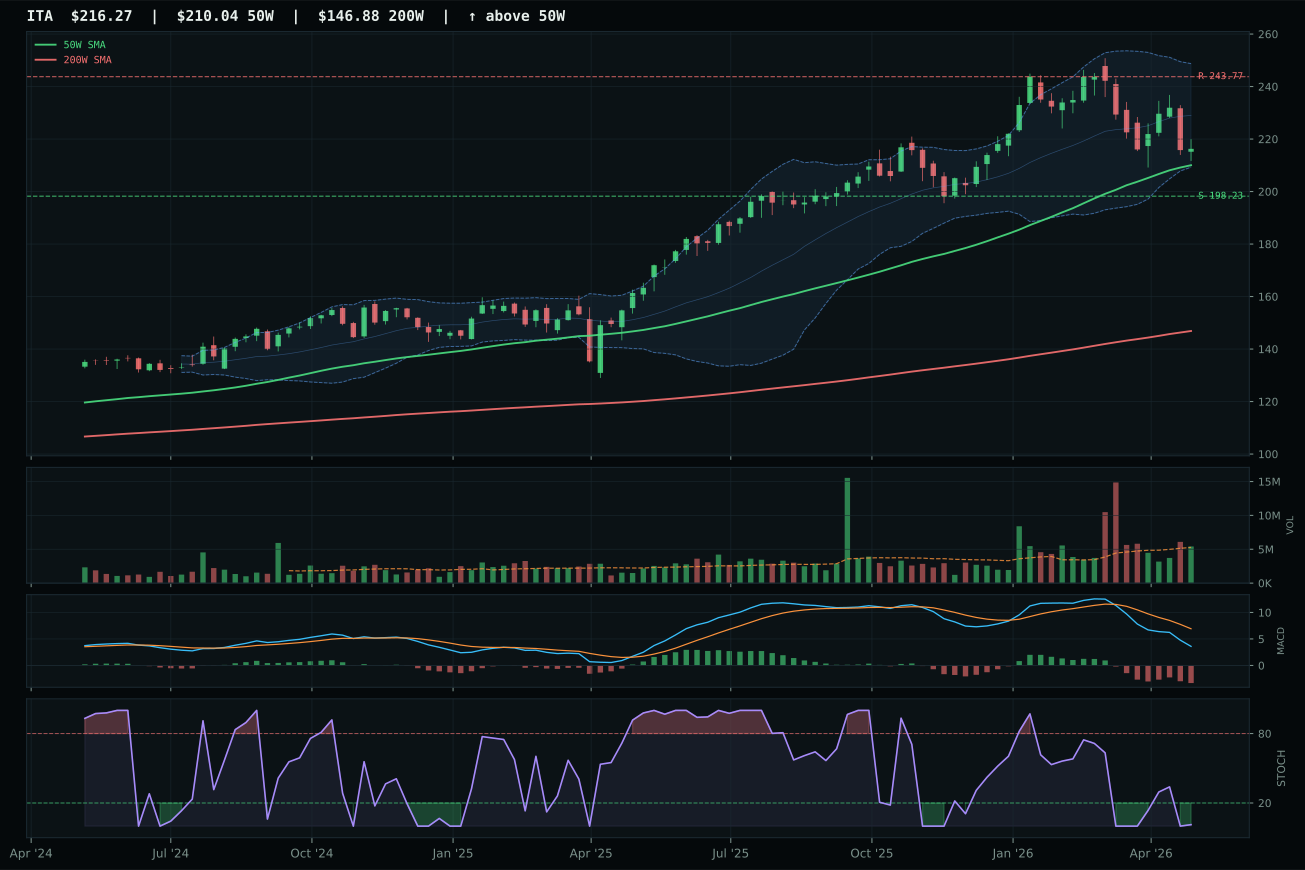
ITA has a compression near 50W profile with -11.1% 13-week relative strength versus SPY.
A failed hold above support would weaken the setup.
Actionable but governed by invalidation levels.
ROKT claimed the aerospace category with a dominant 95.1% technical evidence score, driven by pristine trend (100.0) and extraordinary volume-price confirmation at 92.9%. The space and growth beta narrative delivered 9.9% 13-week returns with 16.0% category-relative strength, while volume accumulated at 1.73x the 20-week average—the only competitor in this batch showing real sponsorship depth. XAR stumbled with a bearish but improving MACD and oversold stochastic RSI, a technical setup that failed to inspire accumulation and produced just -10.2% SPY-relative return and 0.0% category relative strength. ROKT's 33.2% extension above the 50-week line, while notable, earned a 53.0% timing score rather than a penalty because rising mid-zone stochastic RSI (0.28) signaled coiling momentum rather than overbought exhaustion.
Defense & Aerospace ranks 9th or 10th with a final score of 49.5 and receives no allocation this week. The category-level macro fit of 63.0/100 is respectable, supported by defensive rotation (+8) and transition regime tailwinds (+3), but this support fails to overcome weak technical evidence across the three-ETF basket. ROKT's 95.1 technical evidence score is the only bright spot, but it operates in isolation; XAR and ITA both carry sub-55 technical composites that drag the weighted 3/2/1 basket down to 66.7 before final category testing. The real issue is risk/reward asymmetry: upside to resistance is negative to flat across all three names, and while ROKT's 50.2% downside to support sounds deep, 51.4 risk/reward and 33.2% current extension mean the market has priced in substantial growth already. For this category to earn even a 10% slot, ROKT would need to consolidate and rebuild volume confirmation while MACD slopes remain positive—a setup that does not exist this week.
Precious Metals — GLD
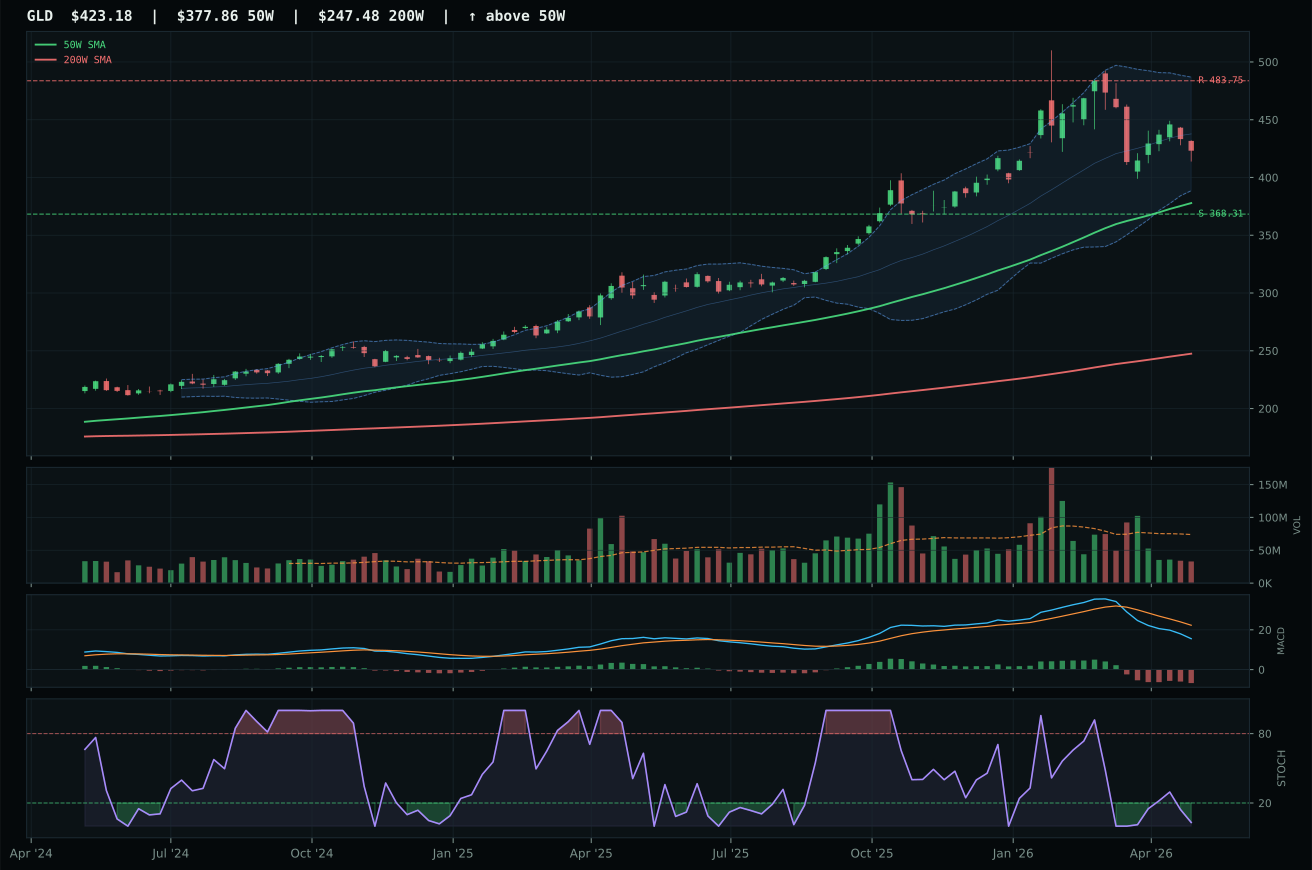
GLD has a neutral structure profile with -9.0% 13-week relative strength versus SPY.
A failed hold above support would weaken the setup.
Actionable but governed by invalidation levels.
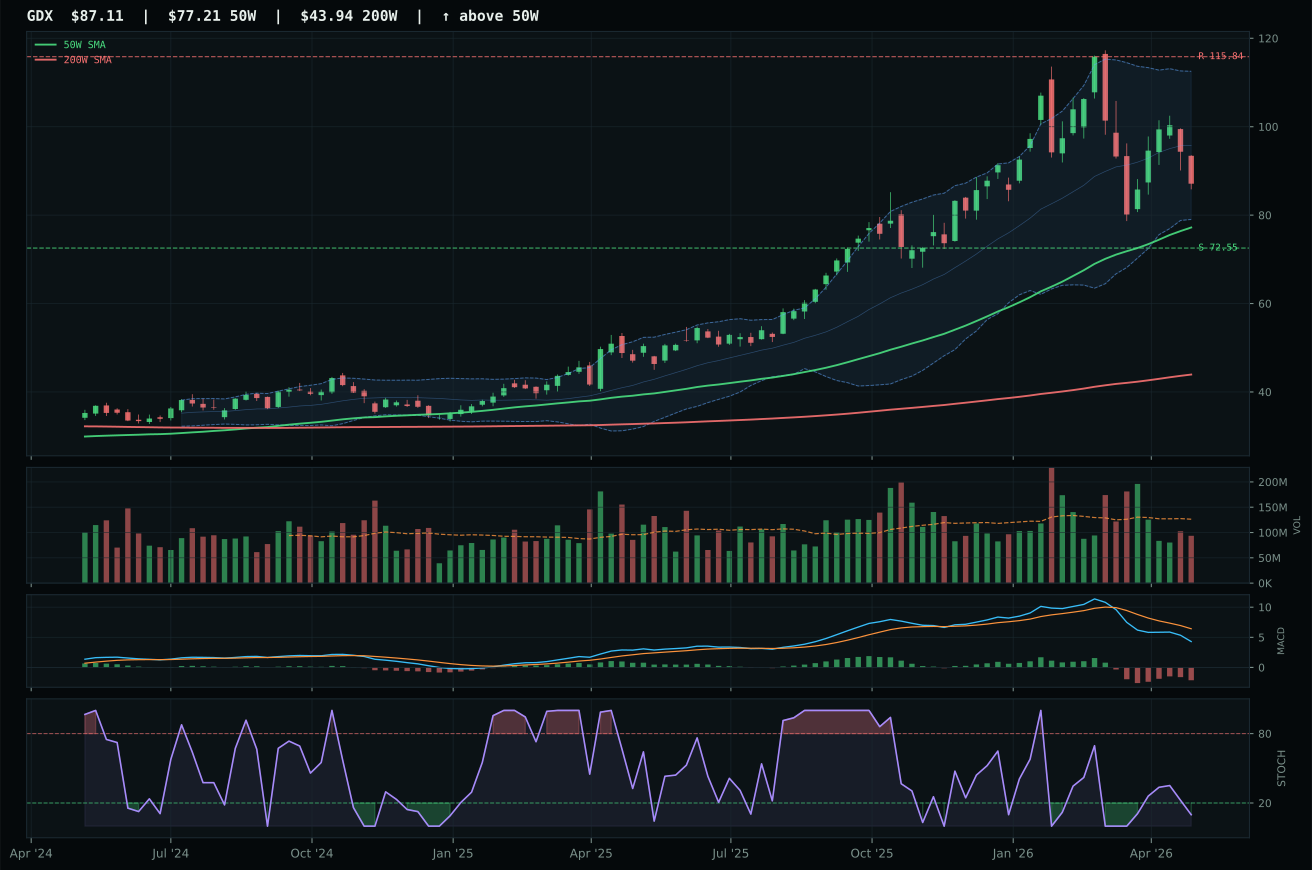
GDX has a neutral structure profile with -11.7% 13-week relative strength versus SPY.
A failed hold above support would weaken the setup.
Actionable but governed by invalidation levels.
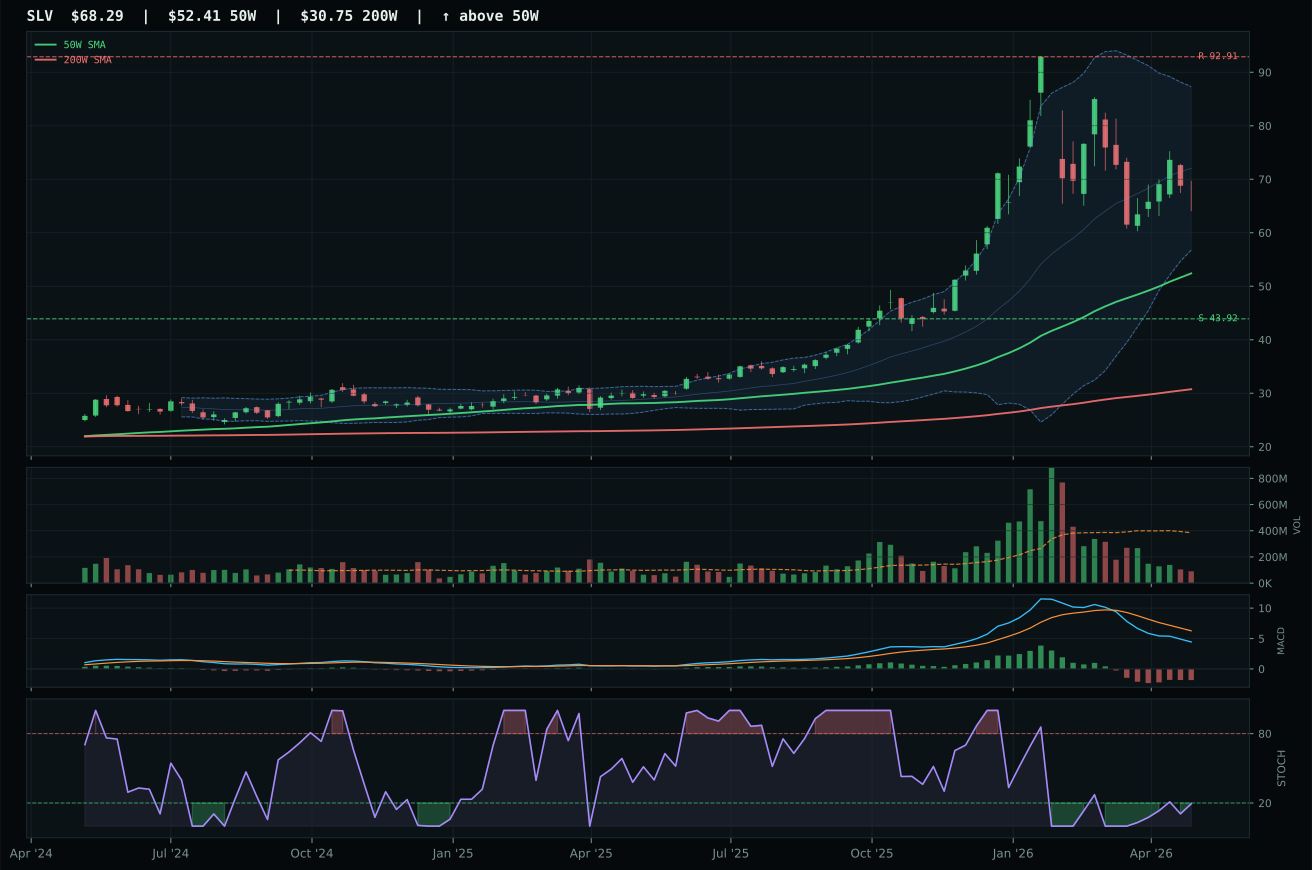
SLV has a vertical extension profile with -13.6% 13-week relative strength versus SPY.
A failed hold above support would weaken the setup.
Actionable but governed by invalidation levels.
GLD won a weak category by defending relative position rather than advancing conviction. Its 12.0% extension above the 50-week line and 68.1% risk-reward score represent the category's best opportunity, yet this baseline remains subpar: 77.0% timing is respectable, but momentum confirmation at only 12.6% reveals momentum dropout, with -4.9% 13-week returns and -9.0% SPY-relative weakness. GDX's 6.5-point gap to runner-up status reflects its weaker structure (62.2 vs 68.7) and inferior category-relative strength (0.0% vs 2.6%), but both gold and gold miners are fighting the regime rather than riding it. Thin volume participation (0.45x for GLD) across the category screams accumulation rejection; MACD bearish weakening and oversold stochastic RSI (0.03) mean this is a defensive hedge holding ground, not generating alpha.
Precious Metals scored 43.9 and receives zero allocation, ranking among the two lowest categories in the portfolio. The 53.0/100 macro fit is neutral at best: defensive rotation (+7) barely outweighs the headwind of risk appetite positive (-4), meaning this category lacks compelling macro sponsorship in a mixed regime. More critically, technical evidence across the basket averages just 39.8/100 due to bearish/weakening MACD and oversold stochastic RSI readings that suggest capitulation rather than opportunity. GLD's 36.6 technical evidence and GDX's 41.1 mark lows in the portfolio. Volume is draining (0.45x for GLD), momentum confirmation is anemic (12.6/100), and persistence is among the weakest measured (41.0/100). The category would require either a hard credit stress event (which would spike gold safely) or a sustained breakdown below support that forces mean-reversion buying—neither condition is present. Precious metals remain on the shelf.