
2026-04-24
Informational purposes only. The content in this report, including allocations, analysis, and commentary, is provided solely for informational and educational purposes. It does not constitute financial advice, investment advice, trading advice, or any other type of advice. Past performance does not guarantee future results. Always conduct your own research and consult a qualified financial professional before making investment decisions.
Weekly Allocation
| Ticker | Category | Weight | Role |
|---|---|---|---|
| XLE | Traditional Energy | 20% | Top-2 (20%) |
| SMH | AI | 20% | Top-2 (20%) |
| PAVE | Utilities & Infrastructure | 10% | Tier-2 (10%) |
| IEMG | Emerging Markets | 10% | Tier-2 (10%) |
| MOO | Agriculture & Livestock | 10% | Tier-2 (10%) |
| COPX | Industrial Metals | 10% | Tier-2 (10%) |
| URA | Nuclear Energy | 10% | Tier-2 (10%) |
| XLK | Technology | 10% | Tier-2 (10%) |
Trade Instructions — Monday Open
Sell the tranche from 2026-03-27 (completing its 4-week hold). Buy the new tranche. Instructions show net portfolio changes — same-asset positions cancel, weight changes show the delta.
| Action | Ticker | Instruction |
|---|---|---|
| SELL | XOP | Sell entire XOP position (5.00% of portfolio) |
| SELL | WEAT | Sell entire WEAT position (5.00% of portfolio) |
| SELL | IGF | Sell 50% of IGF position (reduce 5.00% → 2.50%) |
| SELL | NLR | Sell entire NLR position (2.50% of portfolio) |
| SELL | ITA | Sell entire ITA position (2.50% of portfolio) |
| SELL | GLD | Sell entire GLD position (2.50% of portfolio) |
| BUY | SMH | Buy SMH — 12.50% of freed cash (adds 2.50% to portfolio) |
| BUY | XLE | Buy XLE — 25.00% of freed cash (adds 5.00% to portfolio) |
| BUY | URA | Buy URA — 12.50% of freed cash (adds 2.50% to portfolio) |
| BUY | PAVE | Buy PAVE — 12.50% of freed cash (adds 2.50% to portfolio) |
| BUY | MOO | Buy MOO — 12.50% of freed cash (adds 2.50% to portfolio) |
| BUY | XLK | Buy XLK — 12.50% of freed cash (adds 2.50% to portfolio) |
| BUY | IEMG | Buy IEMG — 12.50% of freed cash (adds 2.50% to portfolio) |
Current Portfolio After Trade
Combined holdings across all 4 active tranches. Each tranche is 25% of the portfolio.
| Ticker | % of Portfolio | Weight Bar |
|---|---|---|
| XLE | 20.00% | |
| SMH | 12.50% | |
| VEGI | 10.00% | |
| URA | 10.00% | |
| COPX | 7.50% | |
| ILF | 7.50% | |
| PAVE | 7.50% | |
| MOO | 7.50% | |
| XAR | 5.00% | |
| XLK | 5.00% | |
| IGF | 2.50% | |
| REMX | 2.50% | |
| IEMG | 2.50% |
Macro Regime — Transition / Mixed
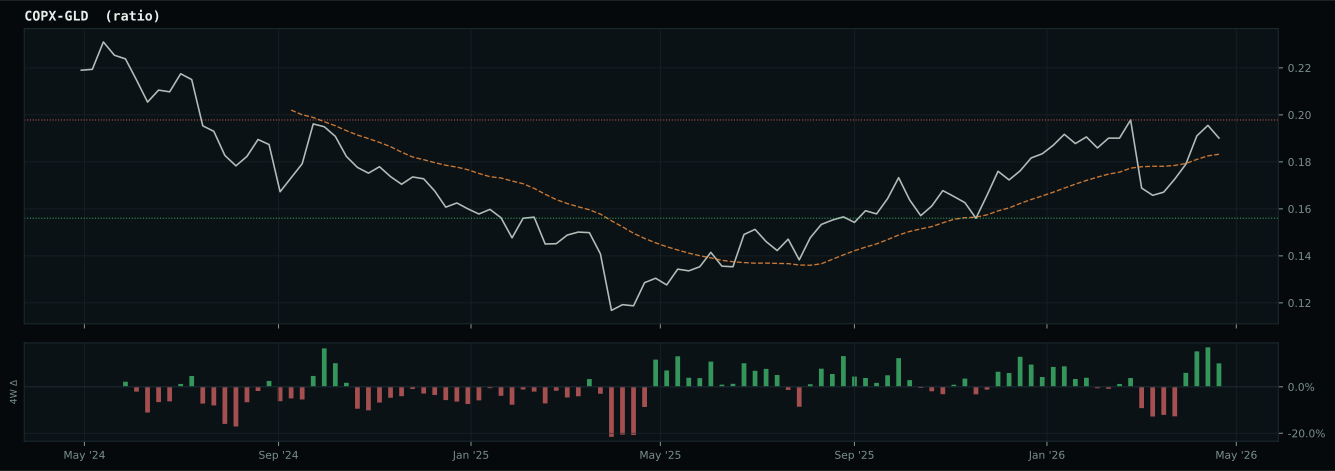
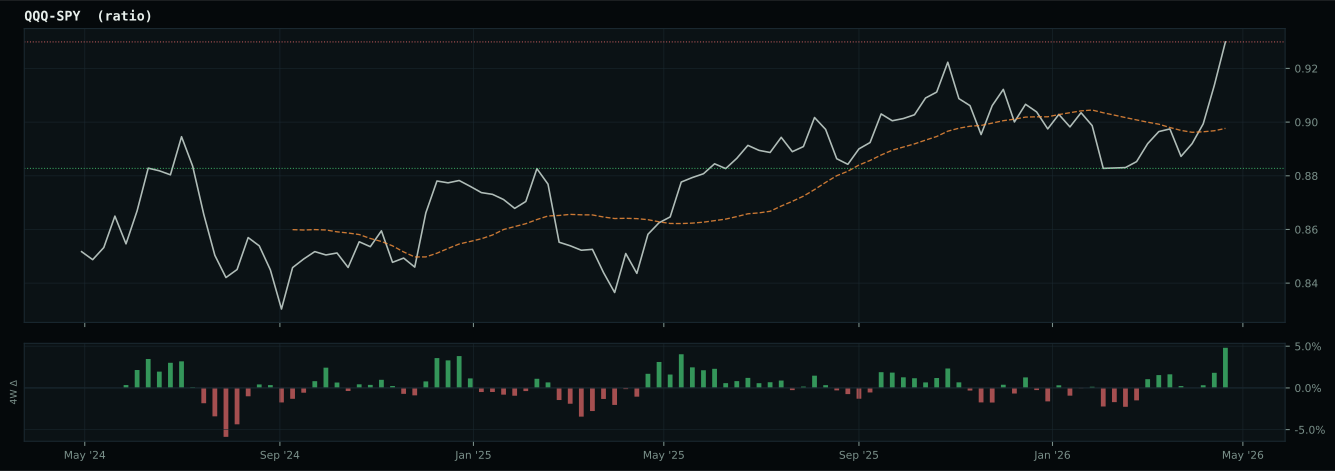
Macro Evidence Charts
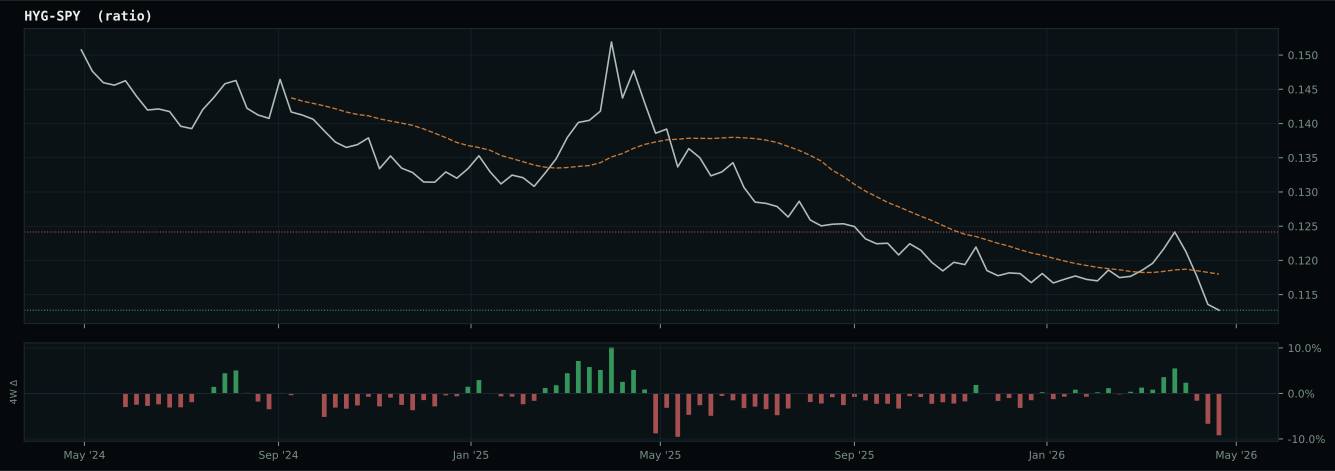
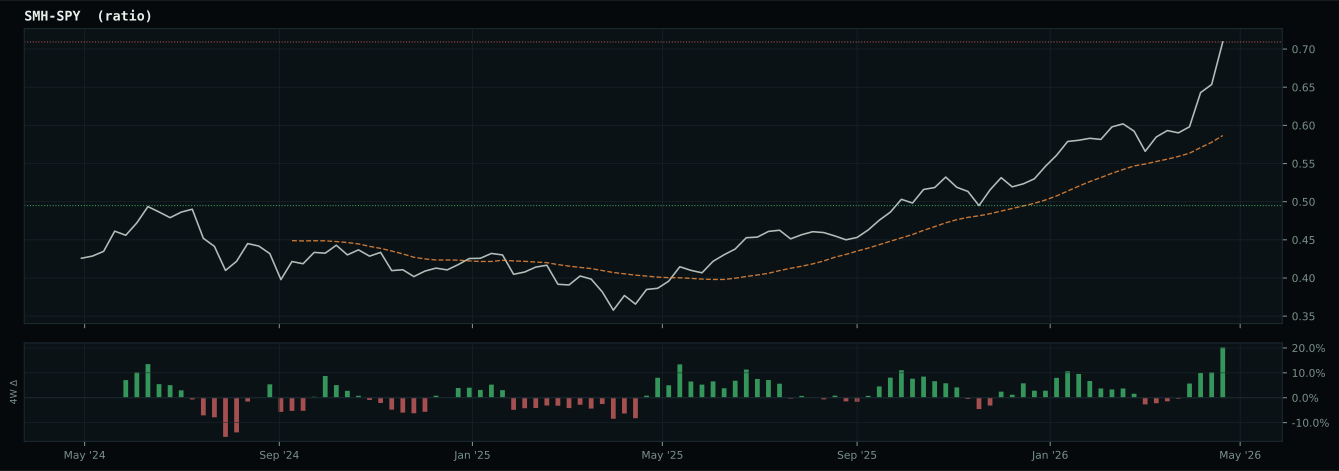
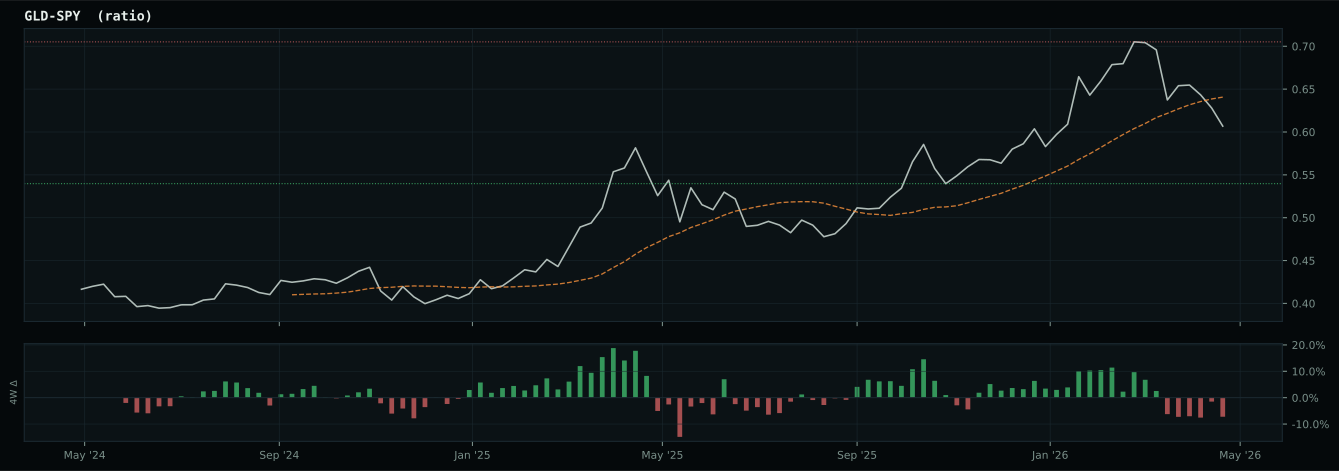
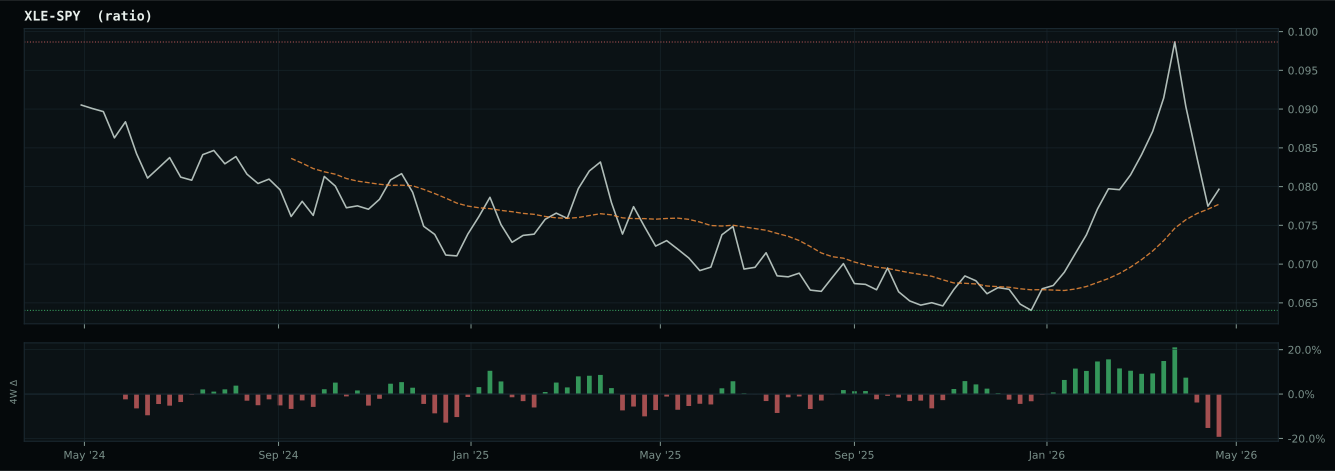
Market-implied signals behind the macro regime scores. Each ratio compares two assets; the direction and slope of the ratio is what the macro engine reads.
Crypto Regime — NoCrypto
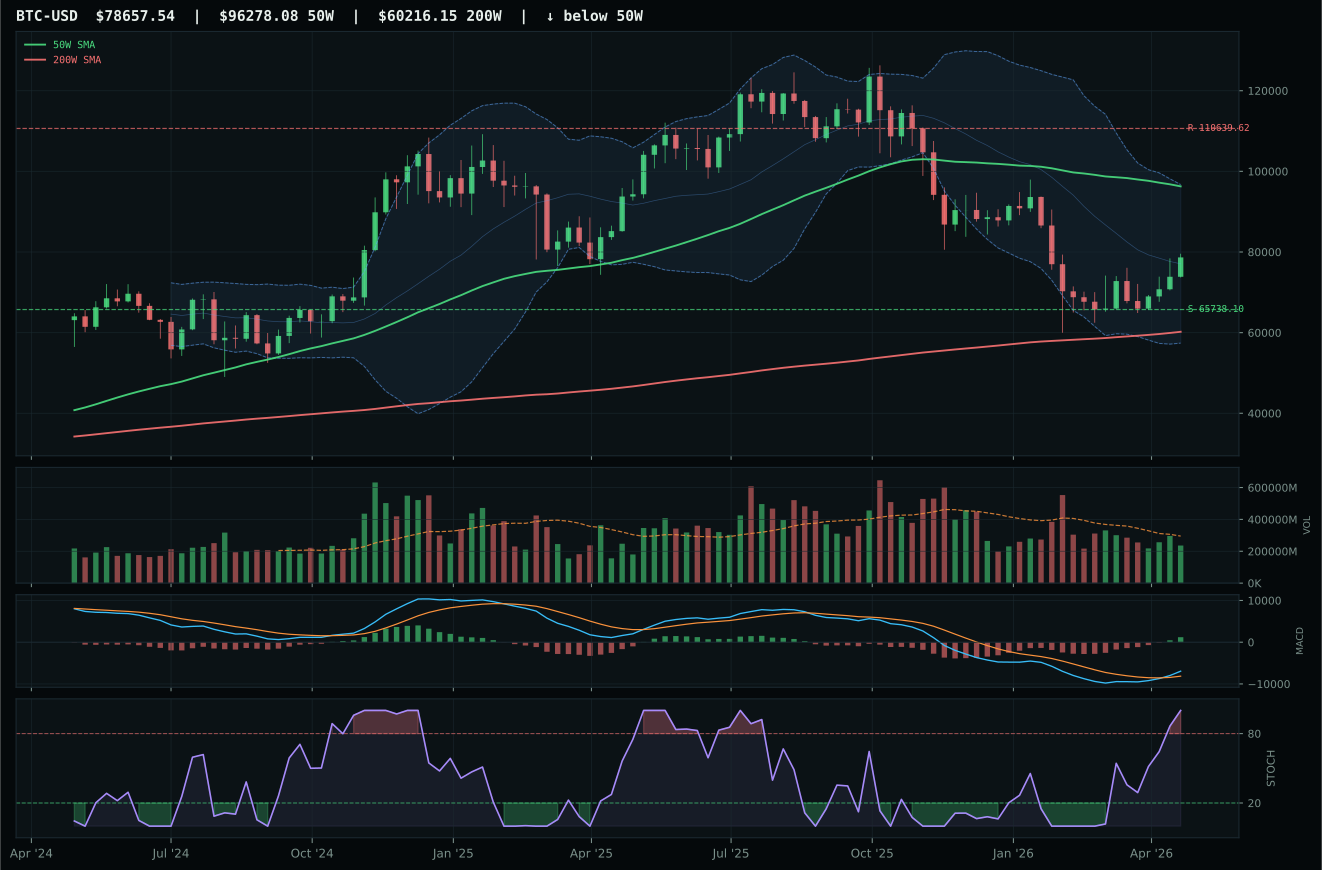
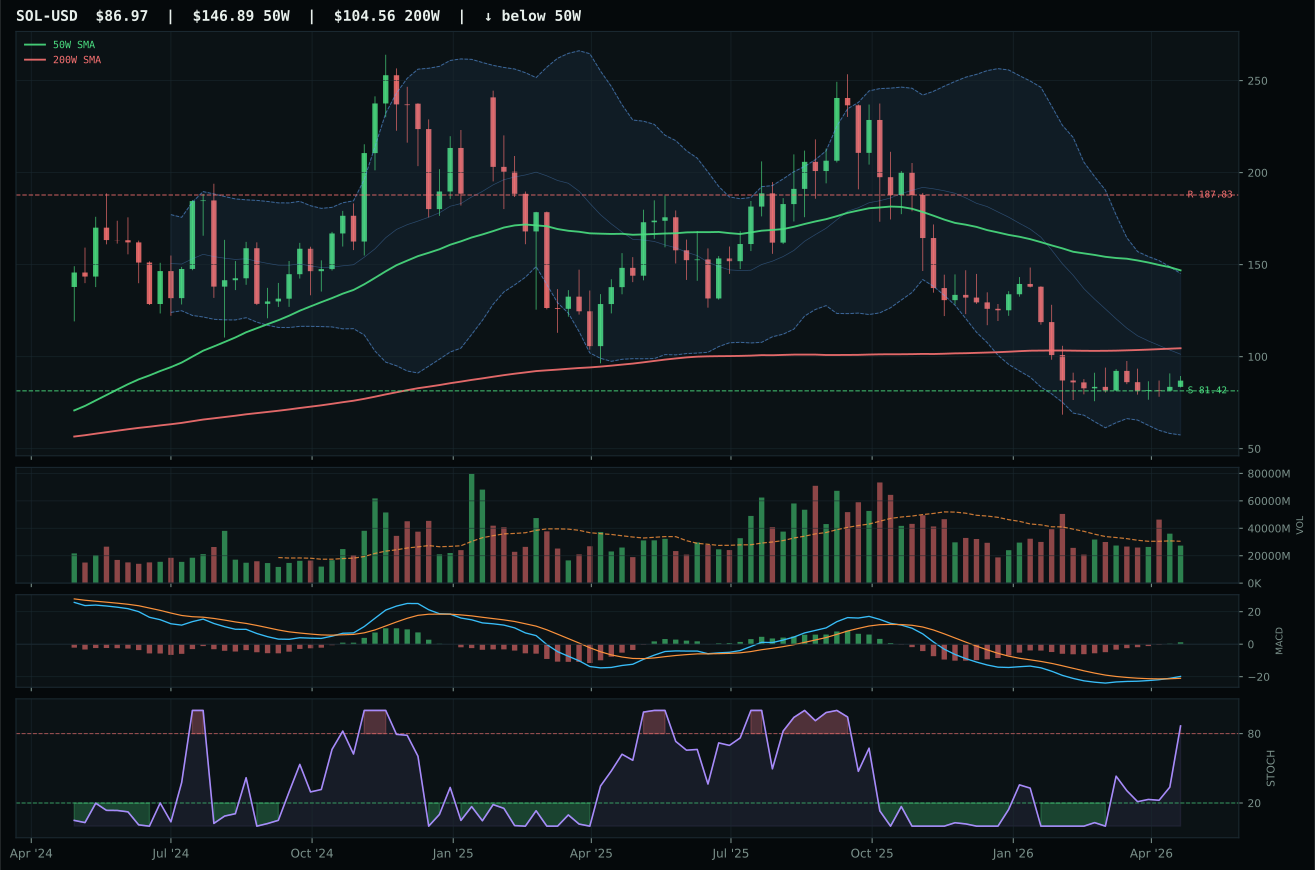
ValueBTC armed by first 200W buy-zone touch, but post-touch range age is 11 weeks; minimum is 12
TrendBTC not confirmed
one or more available conditions failed
Category Rankings
| Rank | Category | Winner | Score | Alloc | 4W Ret | Peers (4W) |
|---|---|---|---|---|---|---|
| 1 | Traditional Energy | XLE | 76.3 | 20% | +3.10% | FCG -0.5% · XOP +0.1% |
| 2 | AI | SMH | 72.8 | 20% | +16.18% | AIQ +16.2% · BOTZ +6.4% |
| 3 | Utilities & Infrastructure | PAVE | 68.6 | 10% | -0.98% | XLU -1.7% · IGF +0.1% |
| 4 | Emerging Markets | IEMG | 62.3 | 10% | +5.70% | ILF -5.0% · INDA -1.5% |
| 5 | Agriculture & Livestock | MOO | 61.4 | 10% | -2.70% | WEAT +4.8% · VEGI -1.9% |
| 6 | Industrial Metals | COPX | 52.7 | 10% | +5.55% | PICK +5.1% · REMX -0.4% |
| 7 | Nuclear Energy | URA | 51.3 | 10% | -9.45% | NLR -7.8% · URNM -12.1% |
| 8 | Technology | XLK | 51.3 | 10% | +14.49% | CIBR +25.8% · IGV +10.9% |
| 9 | Defense & Aerospace | ROKT | 48.8 | 0% | +18.18% | XAR +8.0% · ITA +5.9% |
| 10 | Precious Metals | GLD | 37.5 | 0% | -3.82% | GDX -6.8% · SLV +1.1% |
Traditional Energy — XLE
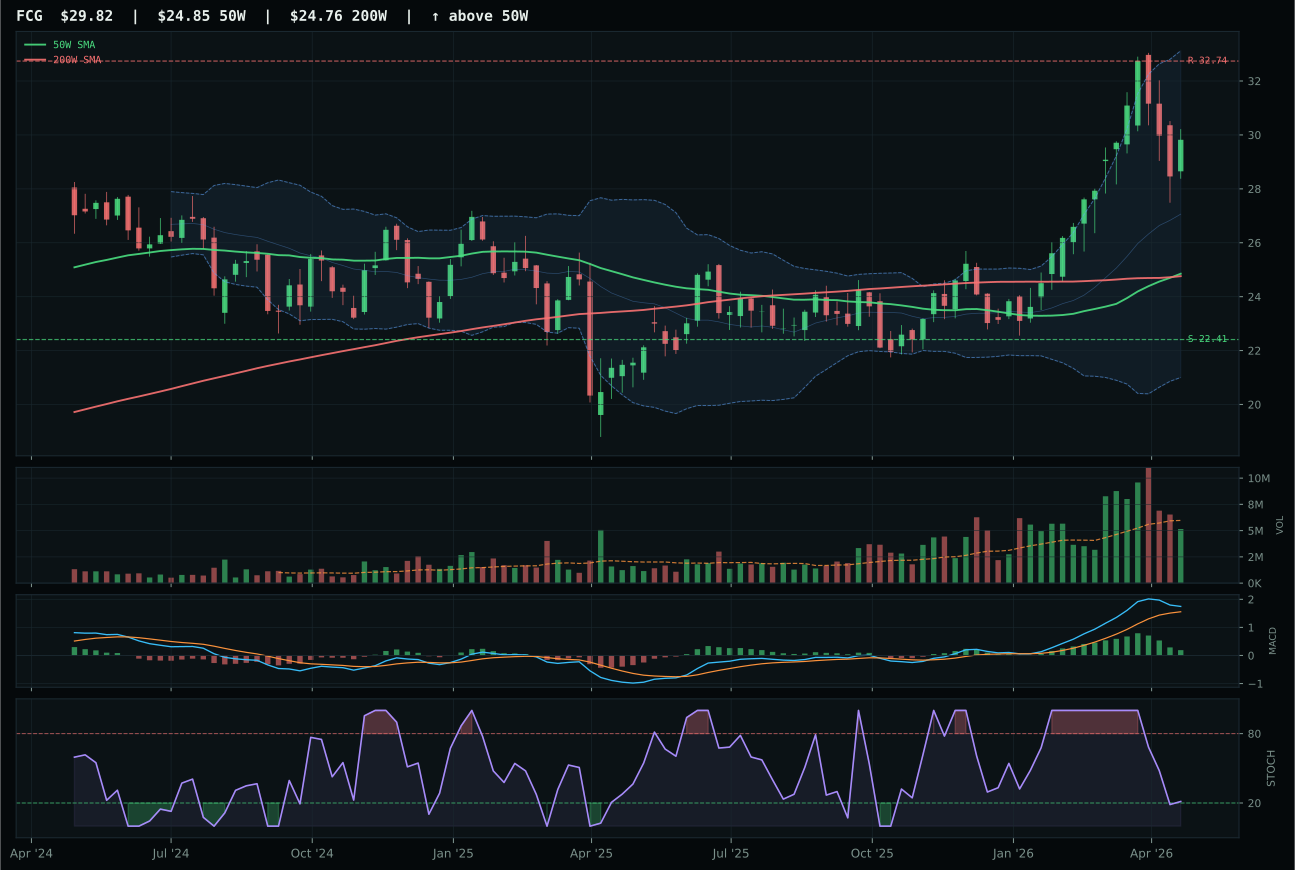
FCG has a vertical extension profile with 18.1% 13-week relative strength versus SPY.
A failed hold above support would weaken the setup.
Actionable but governed by invalidation levels.
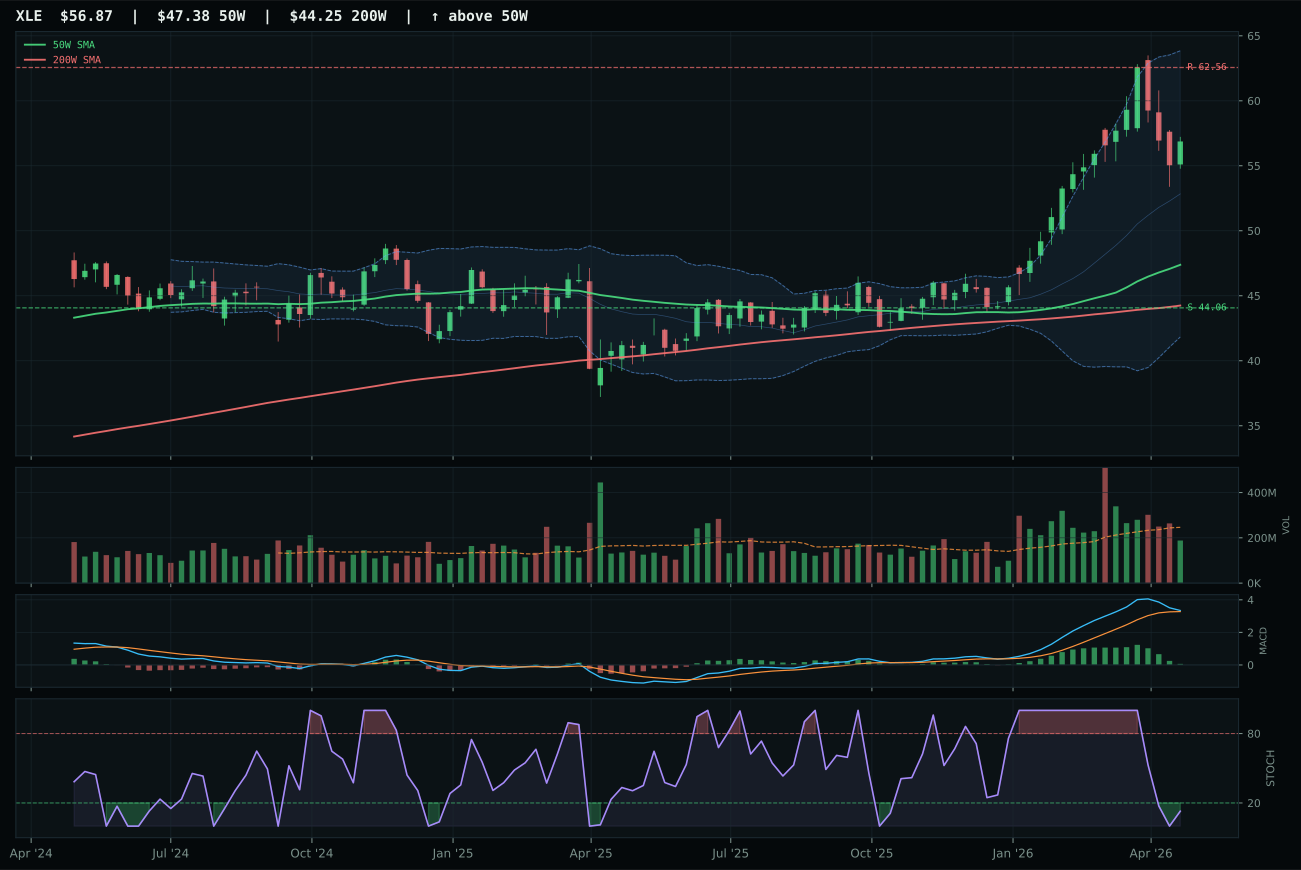
XLE has a vertical extension profile with 12.0% 13-week relative strength versus SPY.
A failed hold above support would weaken the setup.
Actionable but governed by invalidation levels.
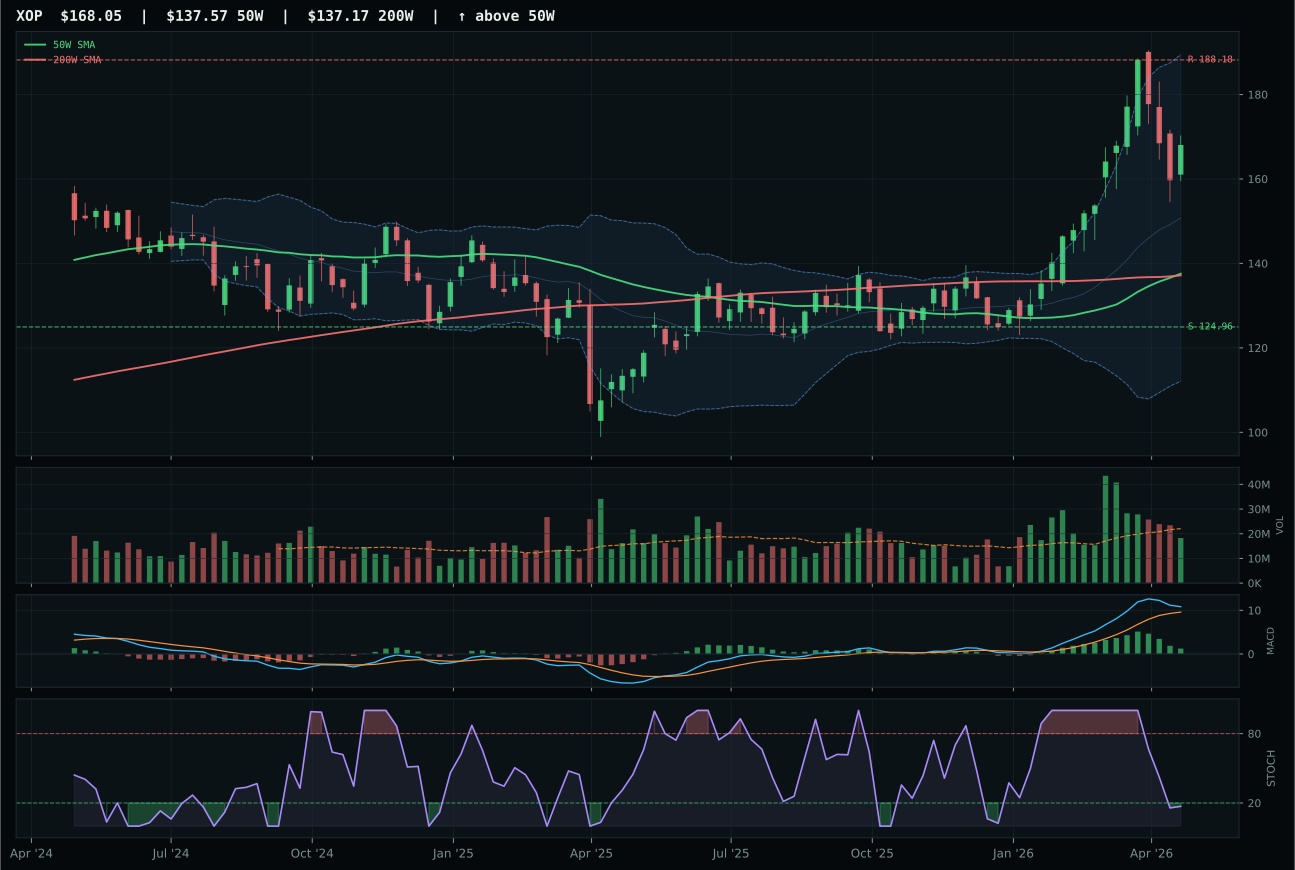
XOP has a vertical extension profile with 20.7% 13-week relative strength versus SPY.
A failed hold above support would weaken the setup.
Actionable but governed by invalidation levels.
XLE earned top-2 status and 20% allocation by scoring 76.3 at the category level, capturing leadership through trend 100.0, structure 77.2, and momentum confirmation 66.0 despite landing third in the reasoned ETF proof order behind XOP's 71.5 technical score. Energy scarcity at 16 basis points and inflation pressure at 10 basis points provided overwhelming macro tailwinds that elevated XLE's 57.3 technical evidence into category-winning territory. The chart displays a clean vertical extension 20.0% above the 50-week with bullish-flattening MACD and oversold stochastic at 0.13, creating the precise setup that works in transition regimes: strength without euphoria, momentum without capitulation, and supply-side fundamentals intact.
Traditional Energy ranked second at 76.3 and earned 20% because energy scarcity provides 16 basis points of macro support and inflation pressures add another 10, creating the portfolio's strongest fundamental tailwind outside of AI. XLE's 12.0% SPY outperformance and 15.6% thirteen-week return demonstrate real capital flows into the thesis, and the technical setup at timing 48 is neither stretched nor inverted—the 20% extension from the 50-week with oversold stochastic creates defensive entry geometry for fresh capital. Volume at neutral 0.76x suggests the move lacks euphoric participation, which paradoxically strengthens the macro case. This allocation would hold at 20% even if XLE retreated to the 50-week support at 44.06 with MACD still improving, validating that energy allocation reflects structural scarcity rather than momentum exhaustion.
AI — SMH
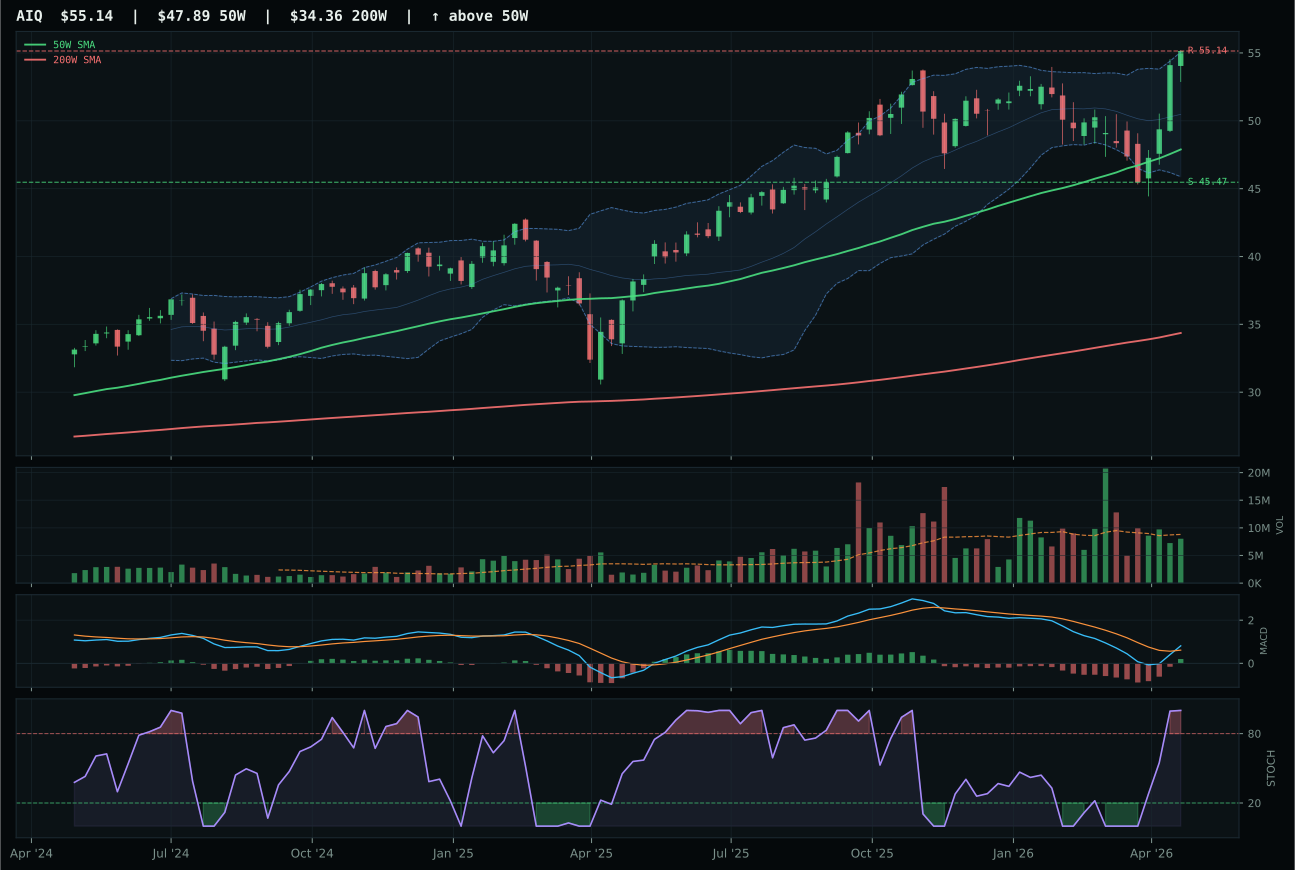
AIQ has a vertical extension profile with 1.4% 13-week relative strength versus SPY.
A failed hold above support would weaken the setup.
Actionable but governed by invalidation levels.
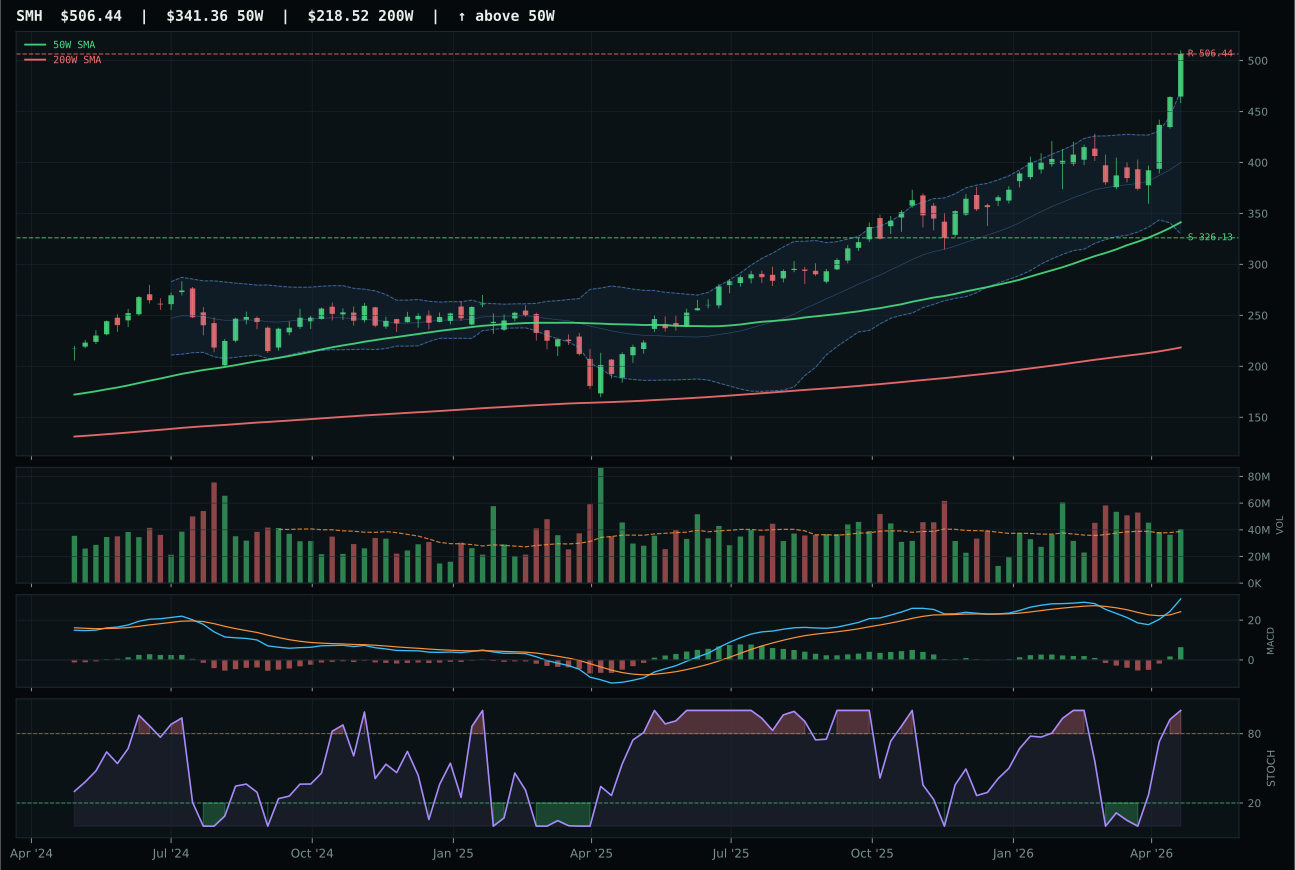
SMH has a vertical extension profile with 23.0% 13-week relative strength versus SPY.
A failed hold above support would weaken the setup.
Actionable but governed by invalidation levels.
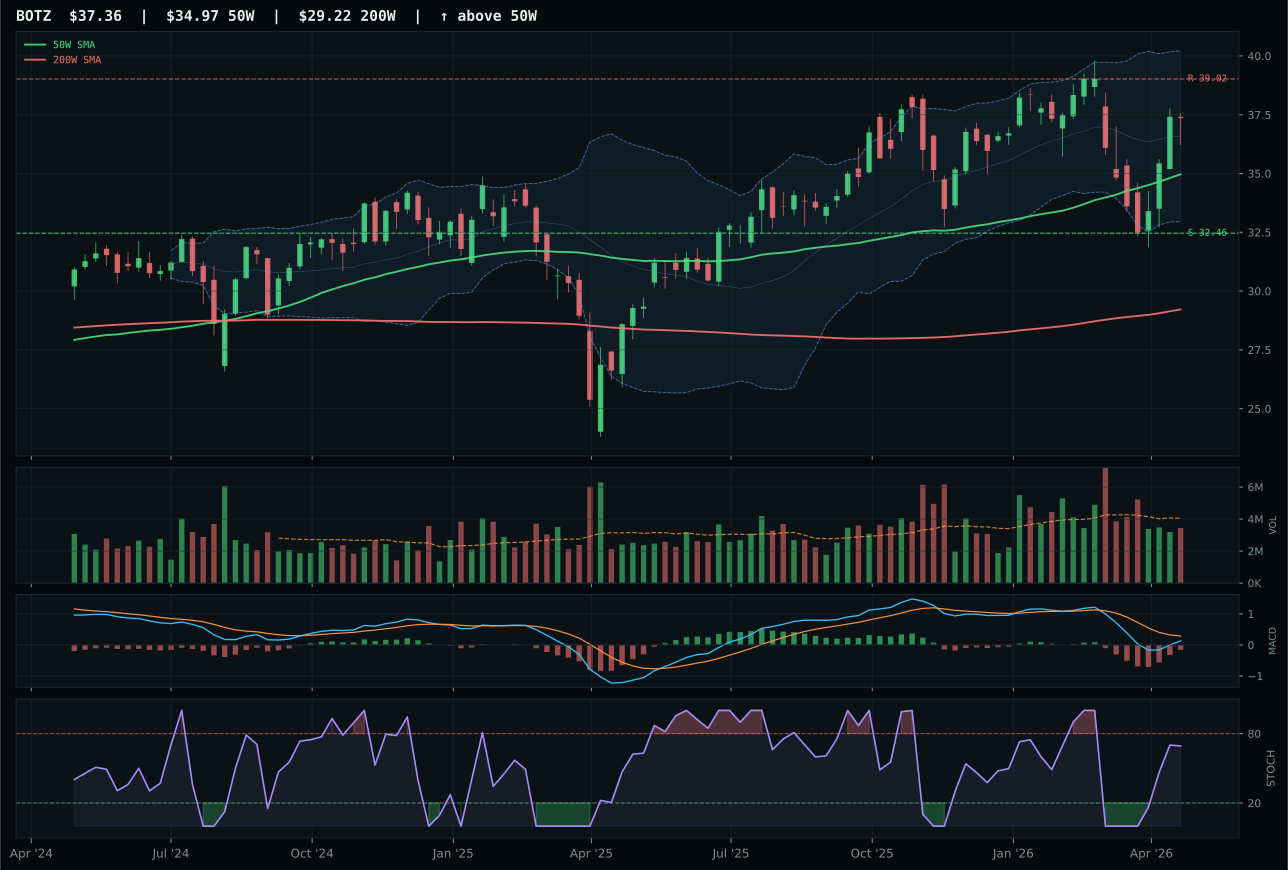
BOTZ has a neutral structure profile with -4.7% 13-week relative strength versus SPY.
A failed hold above support would weaken the setup.
Actionable but governed by invalidation levels.
SMH dominated the AI category with 21.6% relative strength versus peers and a stunning 26.6% thirteen-week return paired with 23.0% SPY outperformance, decisively beating AIQ's 1.4% SPY relative performance despite both charts sitting in nearly identical technical structures. The semiconductor ETF's 48.4% extension above the 50-week is severe—new entries face a 55.3% downside to support versus 0.0% upside to resistance—yet volume participation at neutral 1.05x and persistence scoring 95.8 confirm the move is being accumulated rather than merely bounced. Compute and chip fabrication beat software applications because AI growth sponsorship is worth 14 basis points in the macro scorecard, and capital-intensive hardware plays capture that demand signal more directly than platform software exposure.
AI earned 20% allocation as the second-highest category score at 72.8, reflecting the regime's explicit favoritism for artificial intelligence infrastructure amid liquidity expansion and positive risk appetite. SMH's 26.6% thirteen-week return and 95.8 persistence score demonstrate the move possesses genuine accumulation breadth, not momentum exhaustion. Timing reads 37 because price sits near 52-week highs, but that penalty is overwhelmed by 100/100 trend and momentum confirmation—the stock is performing exactly as a leadership position should in this macro environment. The risk is binary: if credit stress accelerates or AI capital spending cycles, this allocation contracts to 10%, but near-term momentum, macro tailwinds, and volume sponsorship justify the double weight.
Utilities & Infrastructure — PAVE
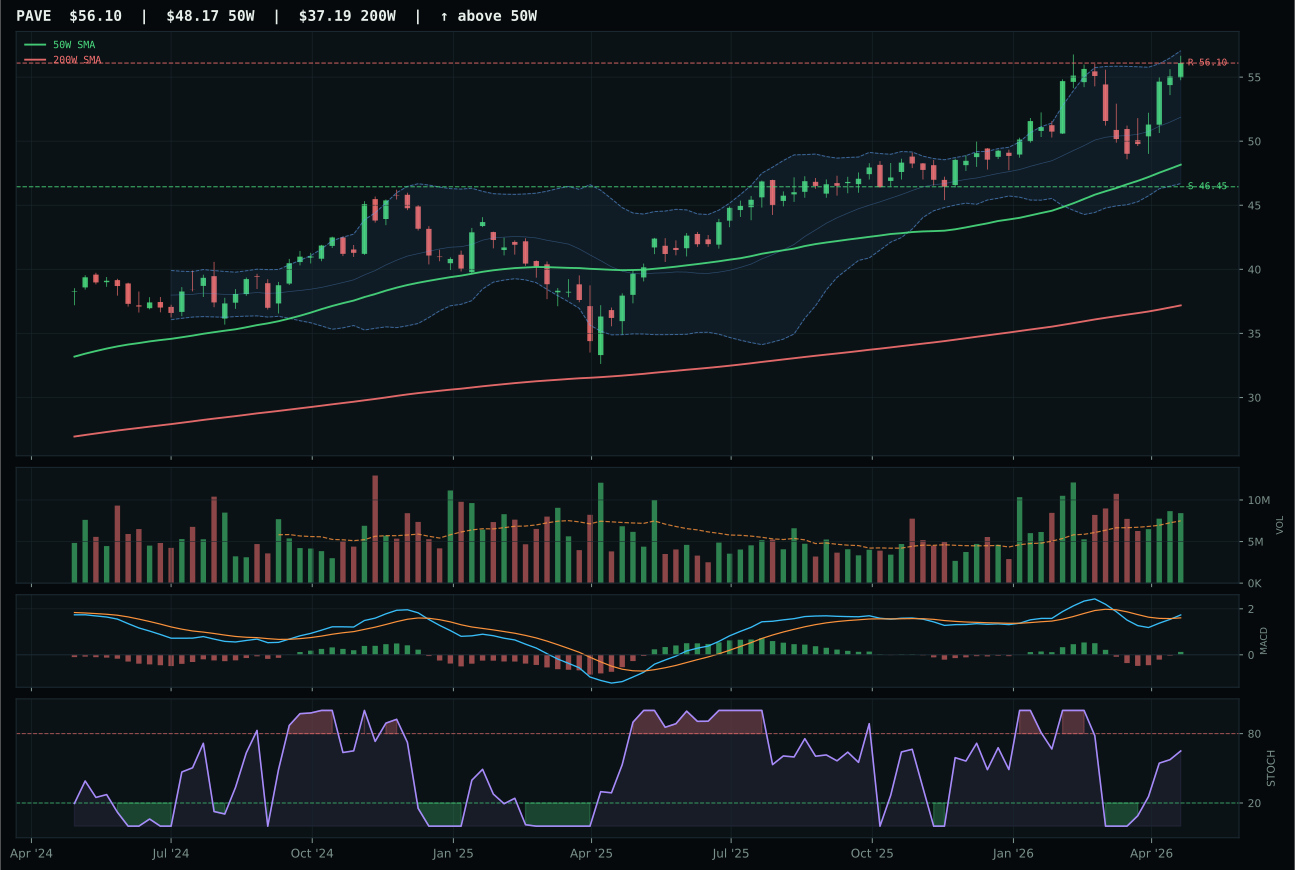
PAVE has a vertical extension profile with 6.2% 13-week relative strength versus SPY.
A failed hold above support would weaken the setup.
Actionable but governed by invalidation levels.
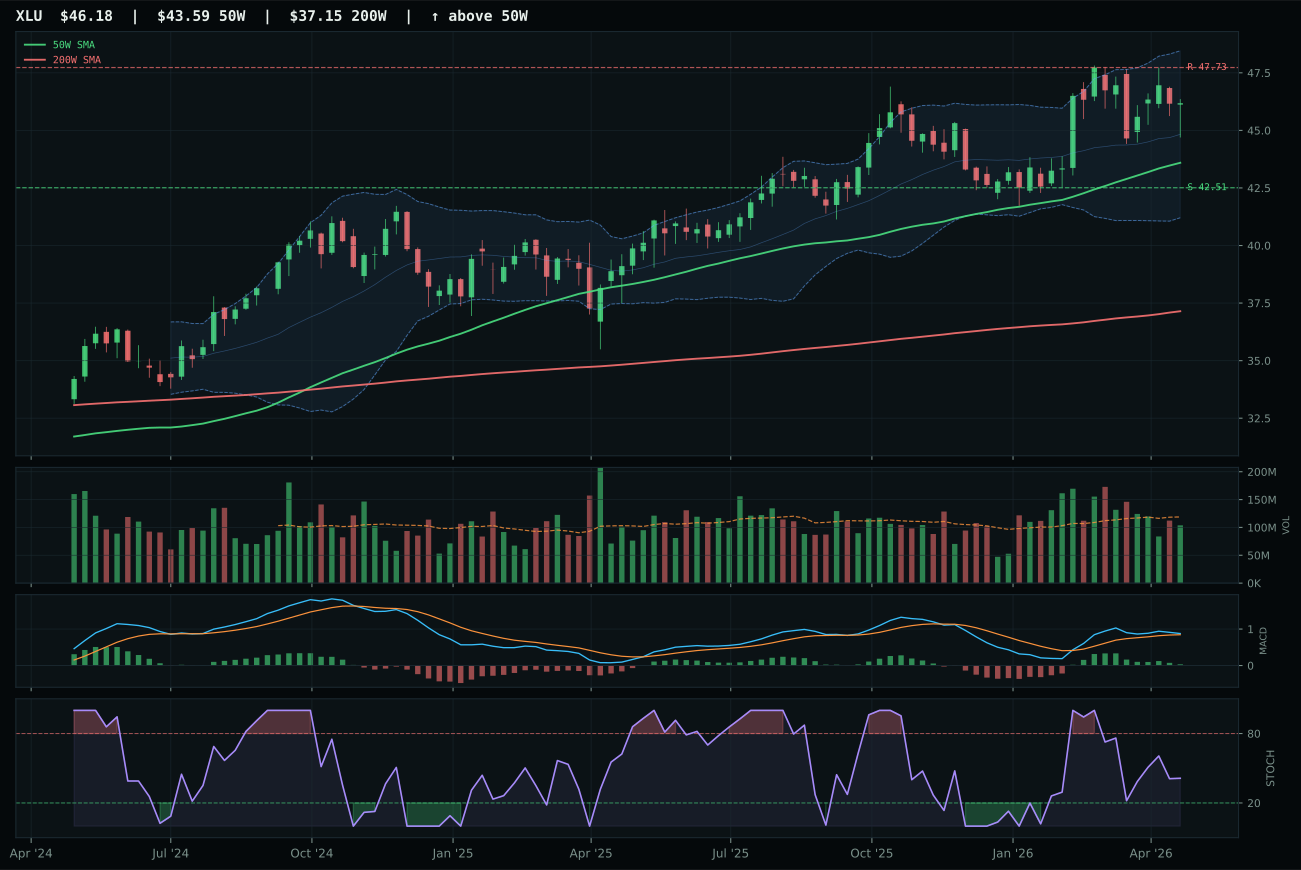
XLU has a neutral structure profile with 4.9% 13-week relative strength versus SPY.
A failed hold above support would weaken the setup.
Actionable but governed by invalidation levels.
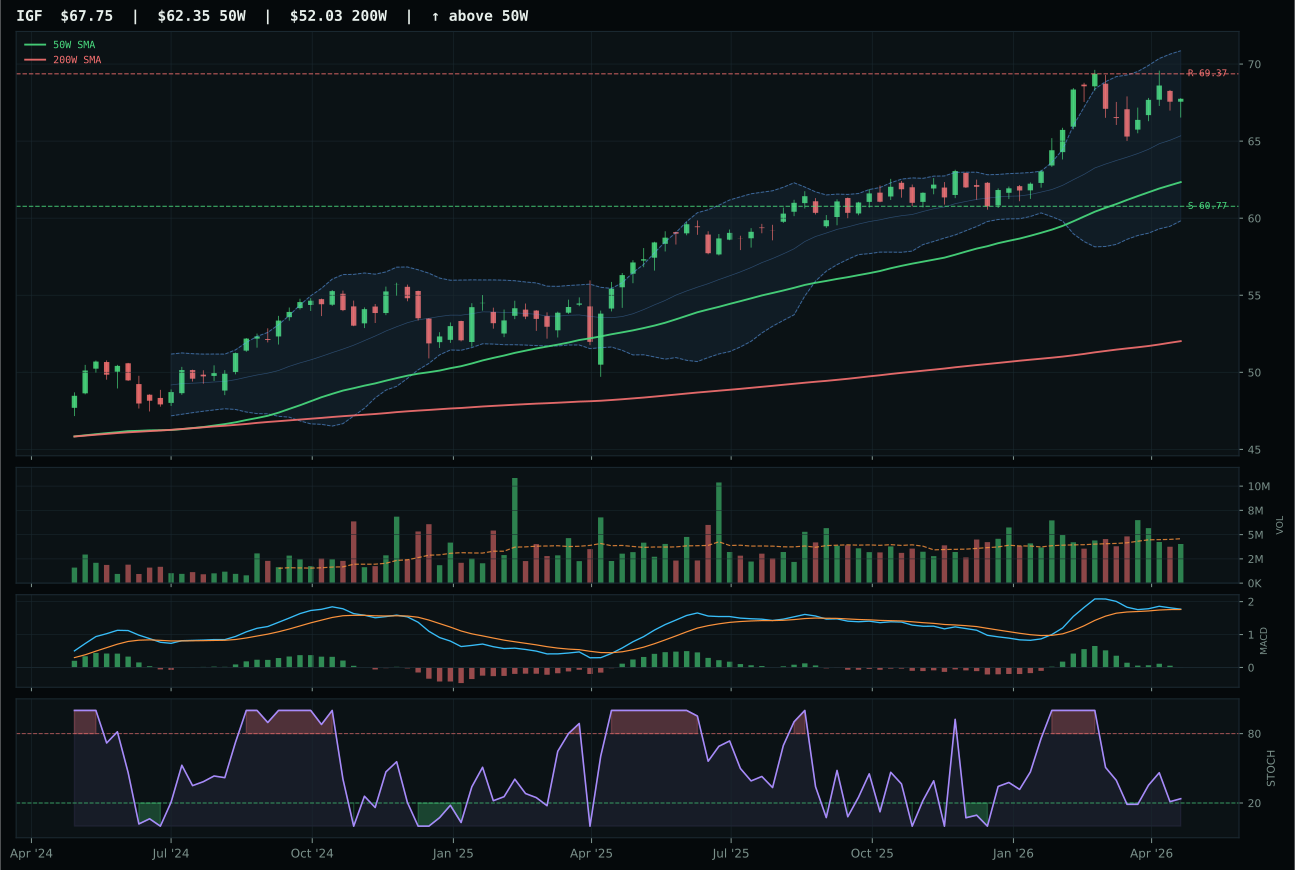
IGF has a neutral structure profile with 3.9% 13-week relative strength versus SPY.
A failed hold above support would weaken the setup.
Actionable but governed by invalidation levels.
PAVE captured utilities and infrastructure leadership with a 68.6 category score through superior structure at 78.5 versus XLU's 76.9, bullish-improving MACD versus XLU's bullish-flattening condition, and rising stochastic at 0.65 versus XLU's falling-neutral read at the same price levels. Momentum confirmation hit 100.0 for PAVE on 9.8% thirteen-week returns paired with above-average volume participation at 1.12x, while XLU managed only 75 despite showing strong trend and a 4.9% SPY outperformance. Infrastructure capex beta captured domestic tailwinds that utilities failed to express.
Utilities and Infrastructure holds 10% despite a respectable 68.6 score because macro fit sits only 58.0—defensive rotation provides 12 basis points while inflation pressure subtracts 6, leaving modest net support. PAVE's technical case at 90.5 evidence reads outstanding: trend 100, momentum 100, volume-price confirmation 74.2, yet the setup sits extended 16.5% from the moving average with 0.0% upside to resistance. The 20.8% downside buffer to support creates acceptable hedging geometry, making this allocation suitable for a transition regime seeking growth with defensive characteristics. Expansion to 20% would require either pullback to the 46.45 support with MACD still improving or acceleration of risk-appetite and commodity-breadth tailwinds; reduction to 5% would follow any deterioration of defensive rotation or confirmation that inflation pressure reverses negative.
Emerging Markets — IEMG
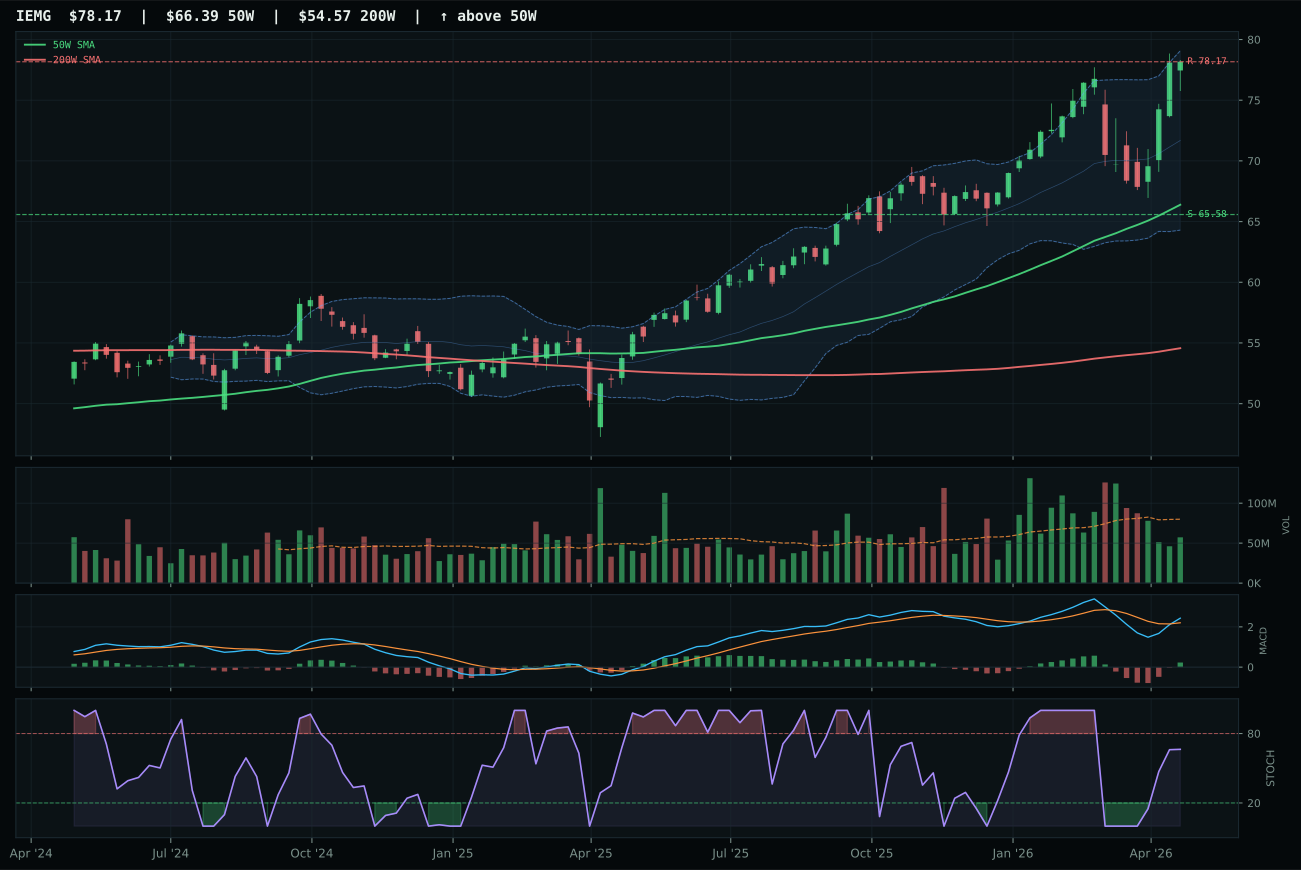
IEMG has a vertical extension profile with 4.4% 13-week relative strength versus SPY.
A failed hold above support would weaken the setup.
Actionable but governed by invalidation levels.
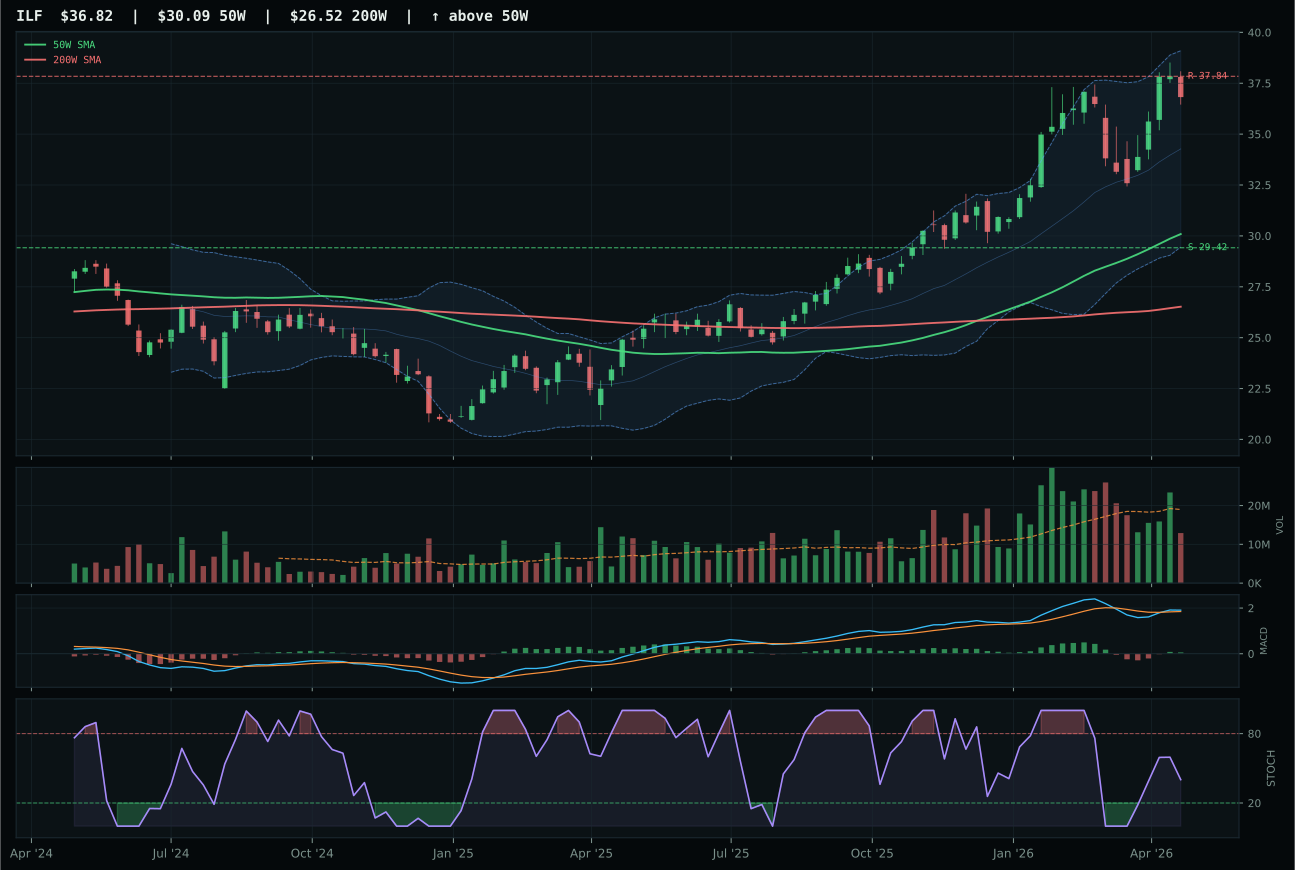
ILF has a vertical extension profile with 1.6% 13-week relative strength versus SPY.
A failed hold above support would weaken the setup.
Actionable but governed by invalidation levels.
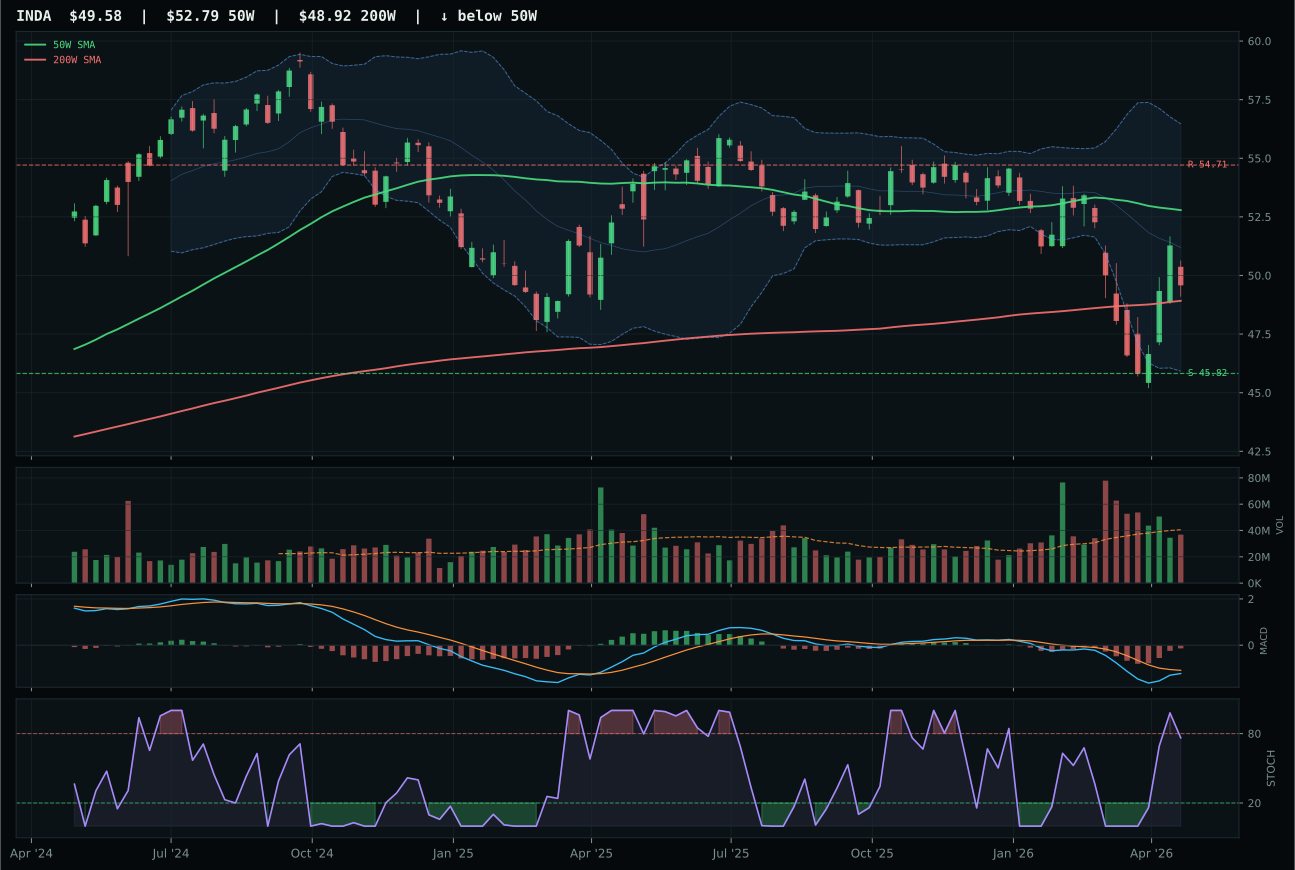
INDA has a neutral structure profile with -6.8% 13-week relative strength versus SPY.
A failed hold above support would weaken the setup.
Actionable but governed by invalidation levels.
IEMG secured the emerging markets representative at 62.3 category score with perfect 100.0 trend and momentum confirmation scores despite ILF showing nearly equivalent technical strength at 69 versus IEMG's 73. The deciding factors were structure cleanliness at 74.2 versus ILF's 70.5 and the critical 2.7% category-relative strength that ILF missed at 0.0%. EM liquidity support provided 14 basis points of macro backing, giving IEMG a clean technical picture: vertical extension 17.7% above the 50-week, bullish-improving MACD, and rising stochastic at 0.66 with thin but improving volume confirmation at 64.0.
Emerging Markets holds 10% because EM liquidity support delivers 14 basis points and risk appetite provides 8 more, anchoring a 70.0 macro fit score that elevates a 67.9 technical foundation into justified allocation territory. IEMG's 8.0% thirteen-week return and 4.4% SPY outperformance demonstrate the narrative capturing real flows, and thin 0.72x volume participation paradoxically reduces exhaustion risk. Timing scores 53 because the 17.7% extension from the moving average requires discipline, but the bullish MACD and rising stochastic offer downside protection. Allocation expands to 20% if risk appetite accelerates further or EM currency dynamics reverse tailwinds; it contracts below 10% if credit stress descriptors turn active or if IEMG breaks below 65.58 support on rising volume.
Agriculture & Livestock — MOO
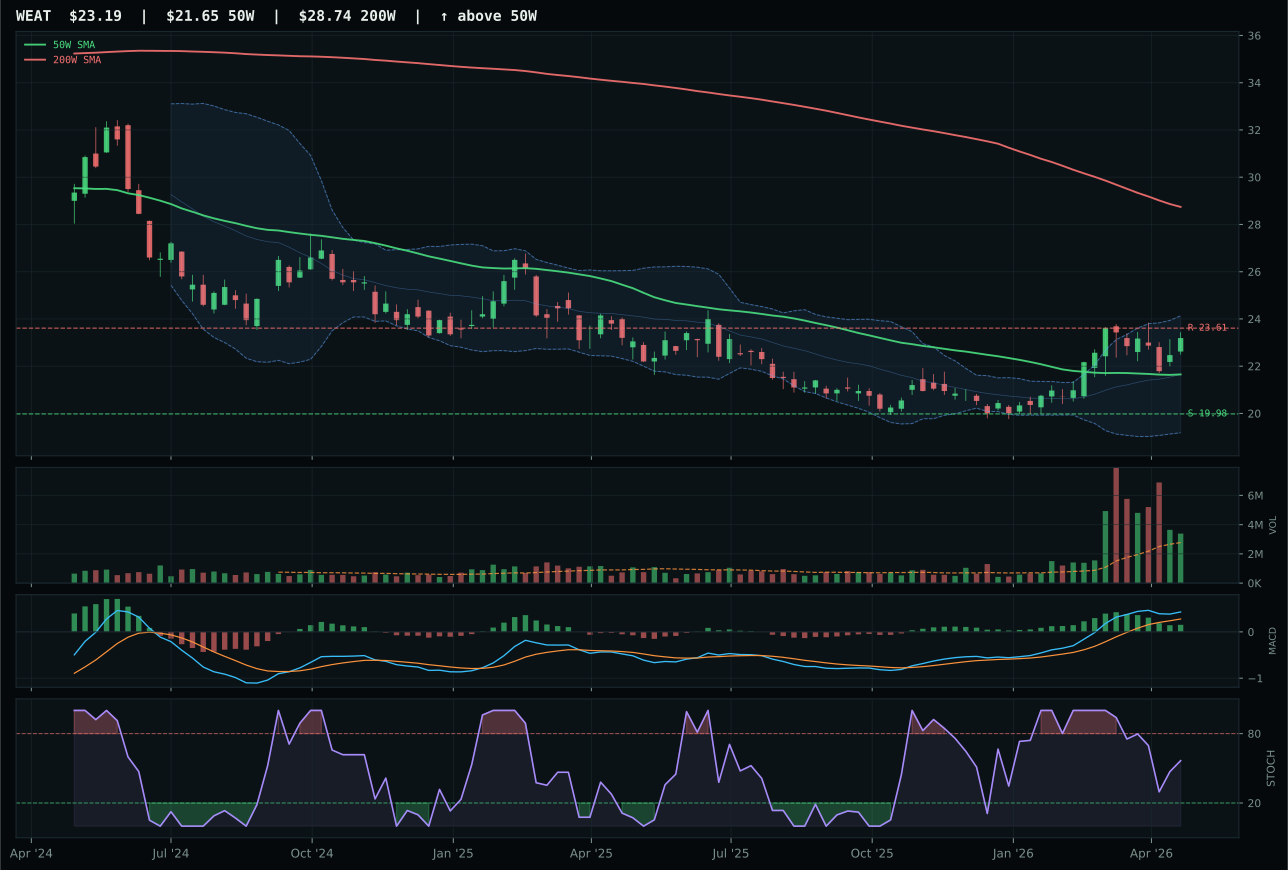
WEAT has a neutral structure profile with 8.2% 13-week relative strength versus SPY.
A failed hold above support would weaken the setup.
Actionable but governed by invalidation levels.
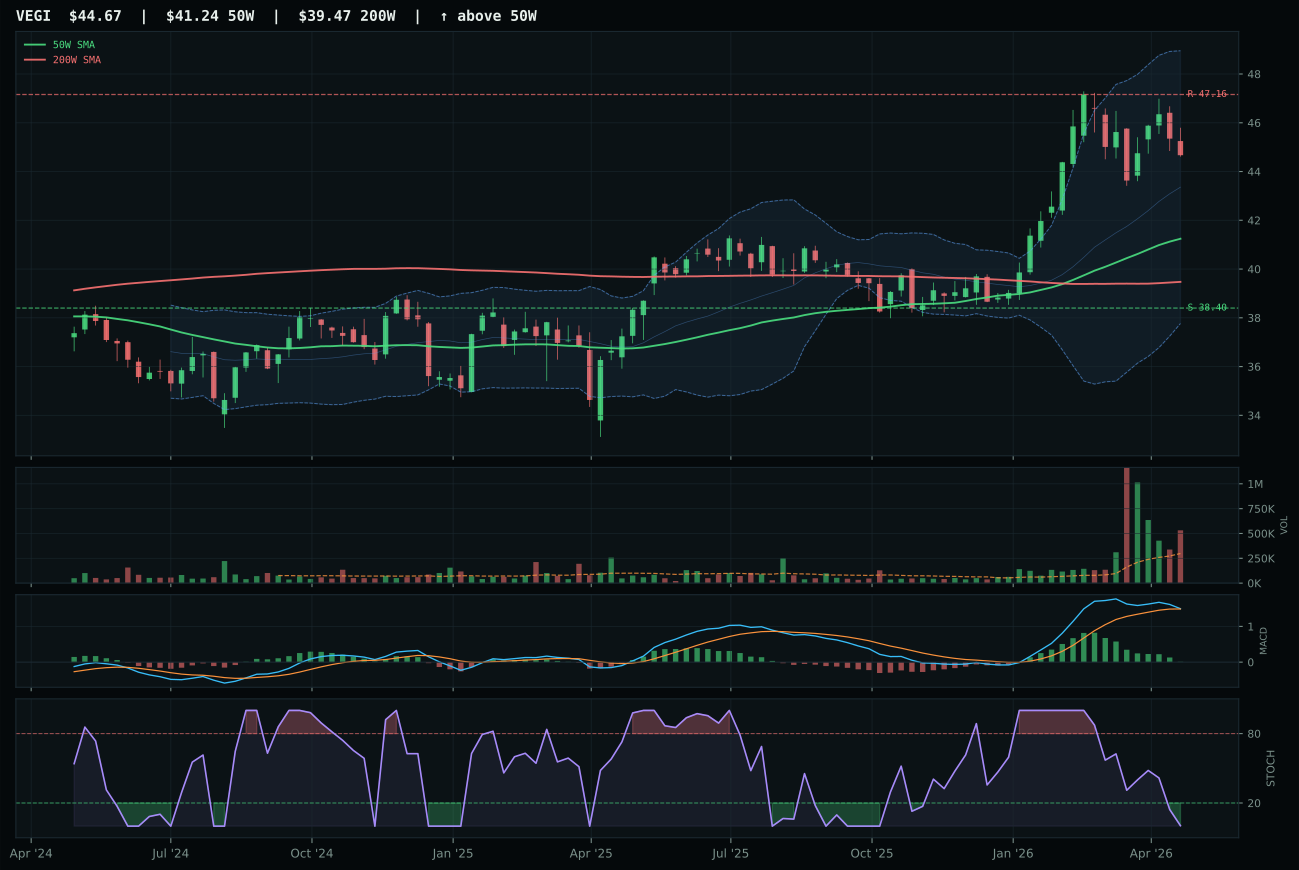
VEGI has a neutral structure profile with 2.8% 13-week relative strength versus SPY.
A failed hold above support would weaken the setup.
Actionable but governed by invalidation levels.
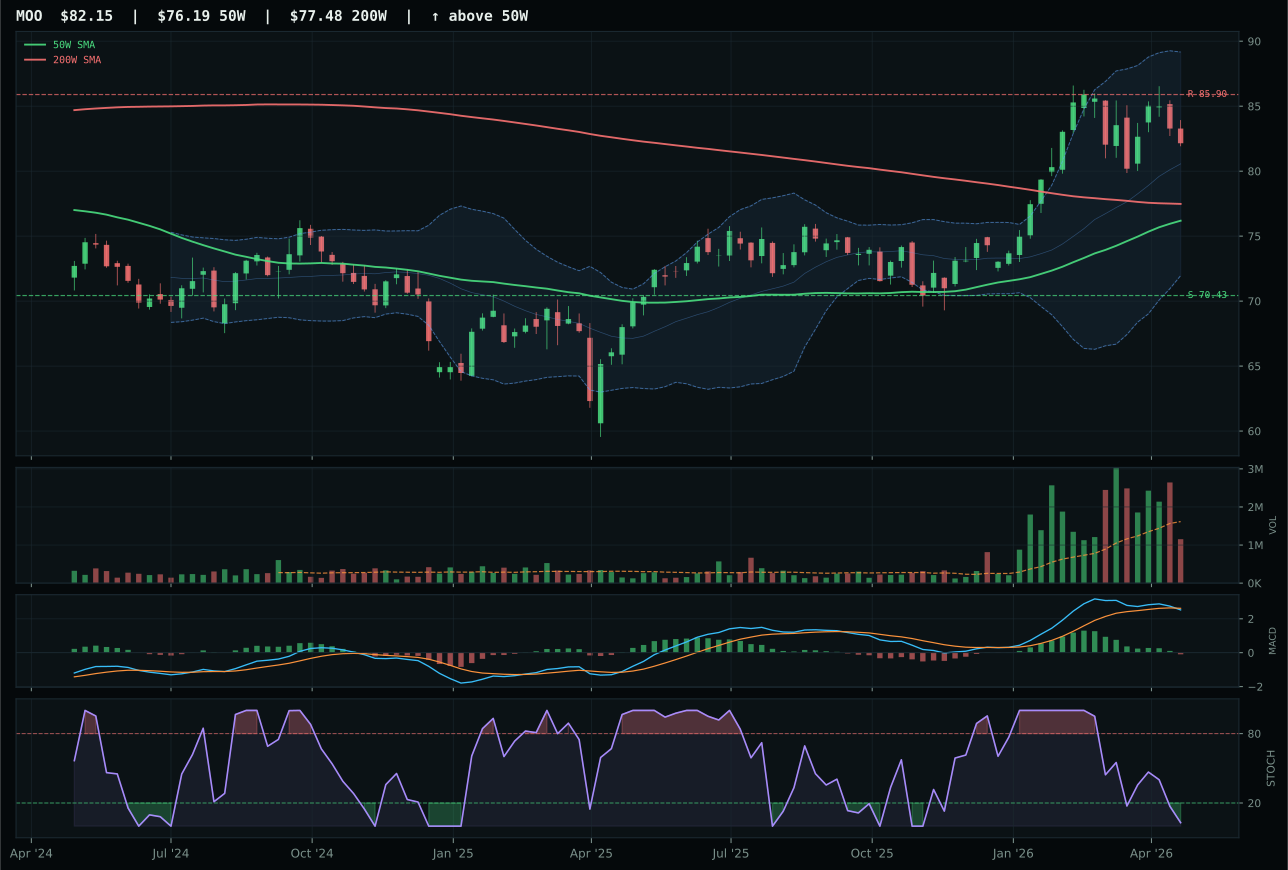
MOO has a neutral structure profile with -0.1% 13-week relative strength versus SPY.
A failed hold above support would weaken the setup.
Actionable but governed by invalidation levels.
MOO won the agriculture representative slot despite a 61.4 category score and WEAT showing dramatically superior technical evidence at 73.8 versus MOO's 34.1, because MOO's macro narrative fit scored 70.0 versus WEAT's neutral 50.0 profile when supply shortage, inflation pressure, and real asset sponsorship are all active. The category reasoner rated WEAT higher on technicals—11.8% thirteen-week return, 8.2% SPY outperformance, above-average volume participation—yet MOO's neutral structure with oversold stochastic at 0.03 positioned it as the carry candidate when commodity breadth is tailwind-supported. The 11.7-point score gap between MOO and WEAT reflects a regime where macro fundamentals override technical exhaustion signals.
Agriculture holds 10% because the category's 61.4 score reflects genuine commodity support from inflation and supply constraints offsetting weak technical conditions. MOO's 3.5% thirteen-week return and negative 0.1% SPY relative performance would normally disqualify it, yet its macro fit of 70.0 carries enough weight in the 62/38 technical-to-macro scoring split to justify allocation. The chart sits near-extended with thin participation, but the oversold stochastic creates tactical safety—downside to support measures only 16.6%, limiting drawdown. Sector rotation upside would require WEAT to regain category leadership through improved technical sponsorship or for MOO's momentum confirmation to lift from 28.6 toward 50 or higher; until then, 10% represents a macro conviction bet rather than a technical setup.
Industrial Metals — COPX
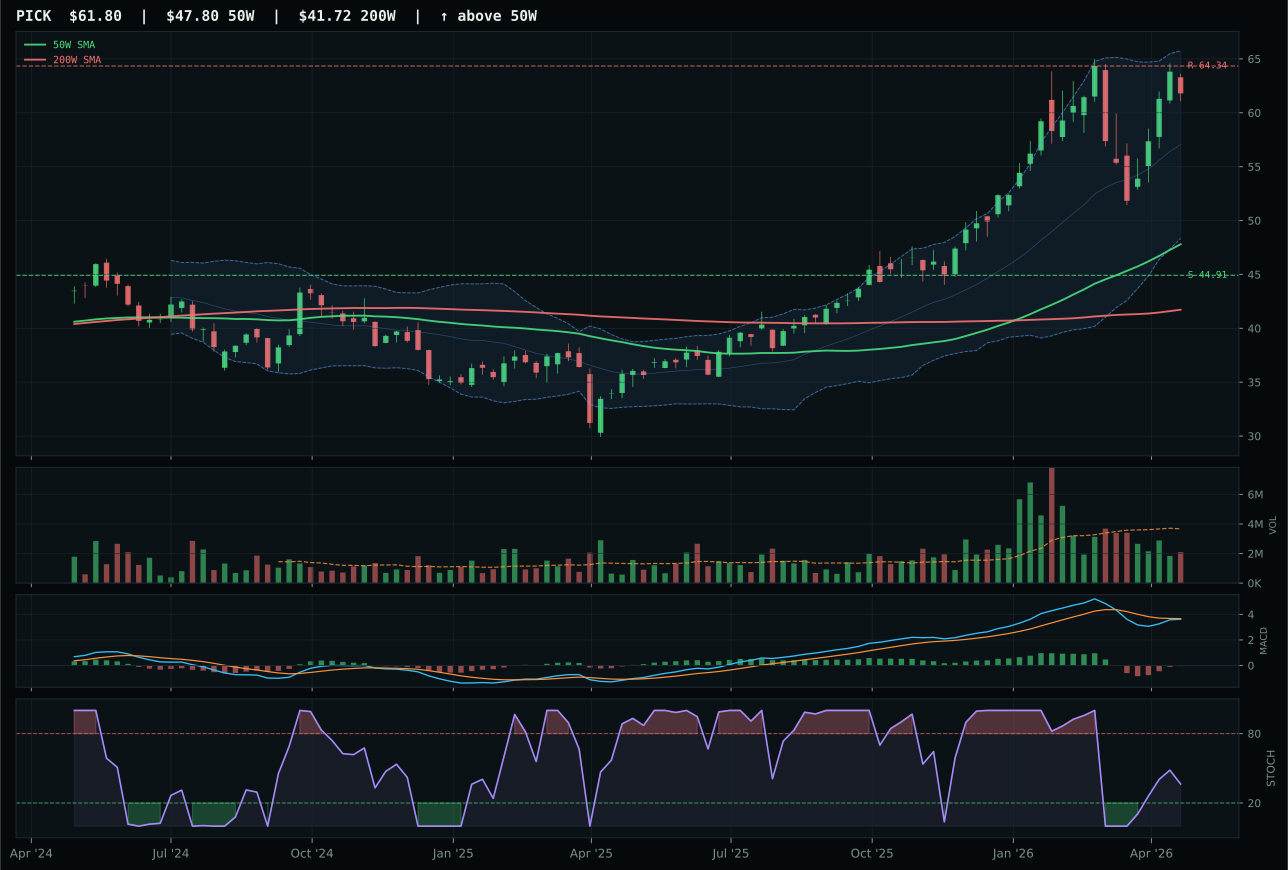
PICK has a vertical extension profile with 0.8% 13-week relative strength versus SPY.
A failed hold above support would weaken the setup.
Actionable but governed by invalidation levels.
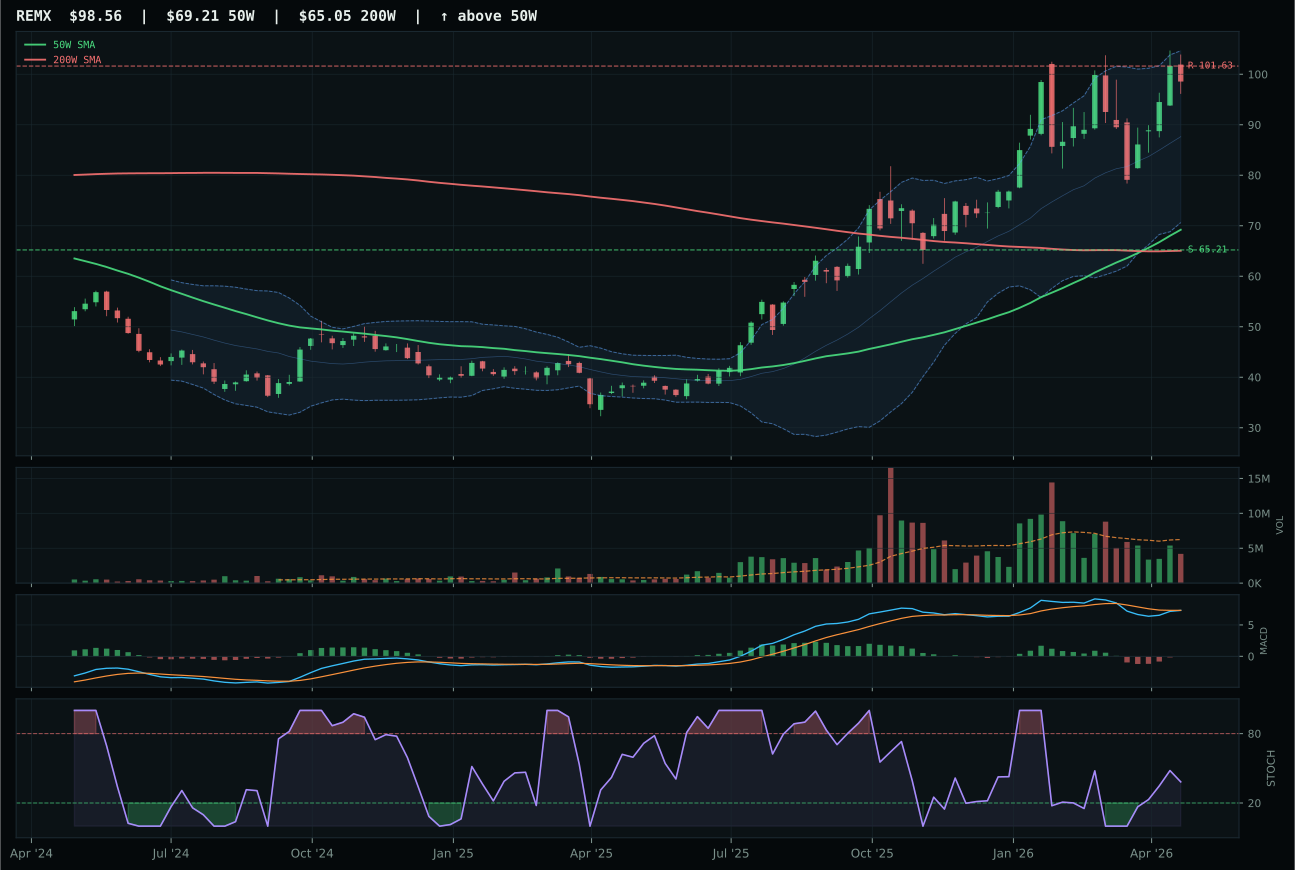
REMX has a vertical extension profile with -3.5% 13-week relative strength versus SPY.
A failed hold above support would weaken the setup.
Actionable but governed by invalidation levels.
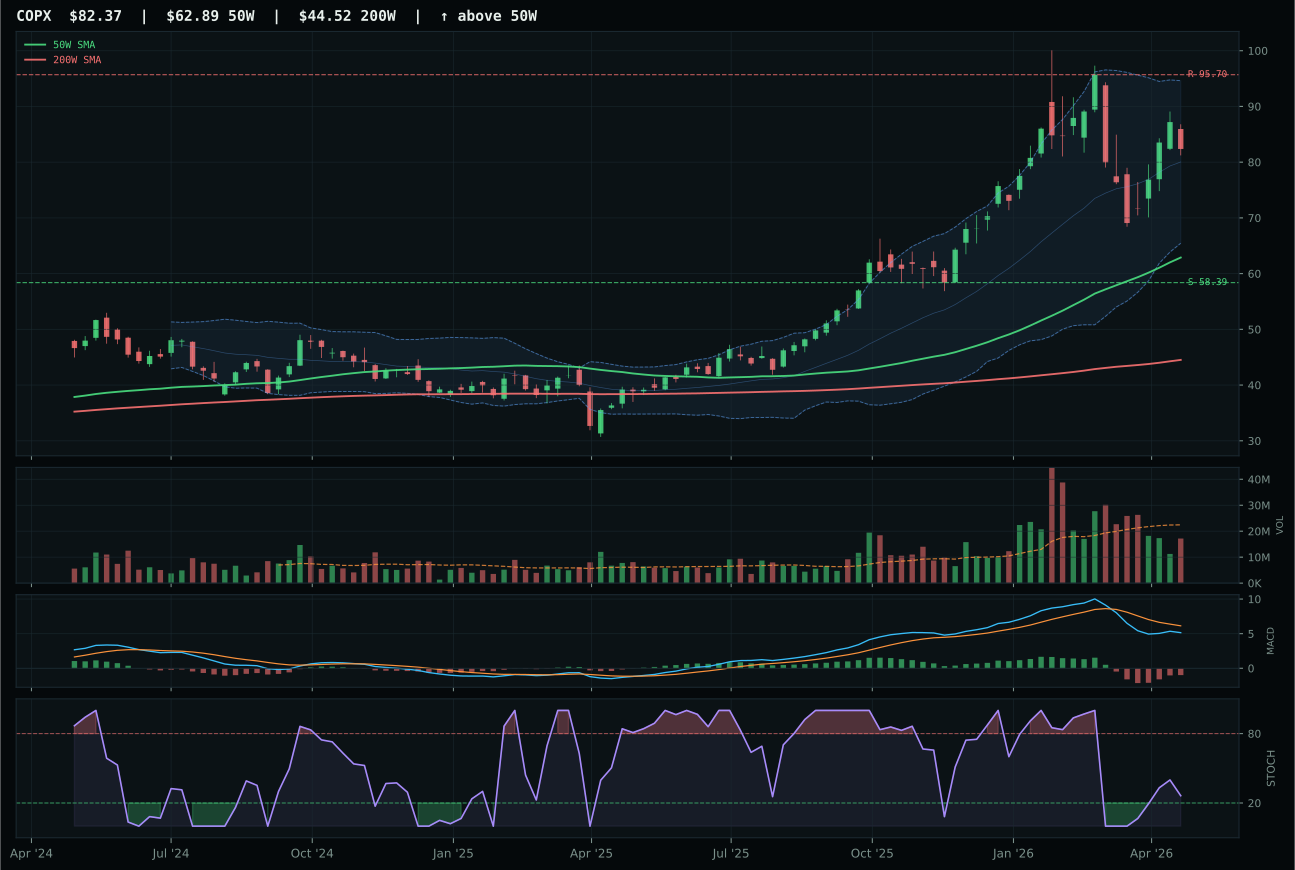
COPX has a vertical extension profile with -7.8% 13-week relative strength versus SPY.
A failed hold above support would weaken the setup.
Actionable but governed by invalidation levels.
COPX won the industrial metals slot with a 52.7 category score by capturing metals scarcity narrative value at 12 basis points of macro support despite finishing third in the reasoned ETF proof order behind PICK's 54.6 technical score. The category reasoner identified COPX's 31.0% extension above the 50-week as offering superior structure at 66.0 versus PICK's comparable vertical extension setup, and its volume at neutral 0.77x versus PICK's thin participation created the decisive edge. Copper scarcity and industrial demand resonate through the macro checklist when commodity breadth is positive, and COPX's stochastic RSI rising mid-zone at 0.26 provided timing superiority despite both showing bearish-improving MACD structures.
Industrial Metals holds 10% allocation because its 73.0 category-level macro fit score elevates a technically conflicted setup into a justified allocation slot. Metals scarcity tailwinds provide 14 basis points, and commodity breadth adds 10, creating a 24-point favorable macro bias even as technical evidence languishes at 35.2. COPX's momentum confirmation at 55.5 falls between distribution warning and accumulation signal, and the chart sits dangerously extended with negative risk/reward at 36.1. This allocation rewards macro discipline: the metals complex performs when real asset demand accelerates in inflationary regimes, which current active descriptors support. Expansion to 20% would require technical confirmation through stochastic RSI crossing into 0.5+ territory with volume acceleration; contraction to 5% or elimination would follow any reversal of supply shortage narratives.
Nuclear Energy — URA
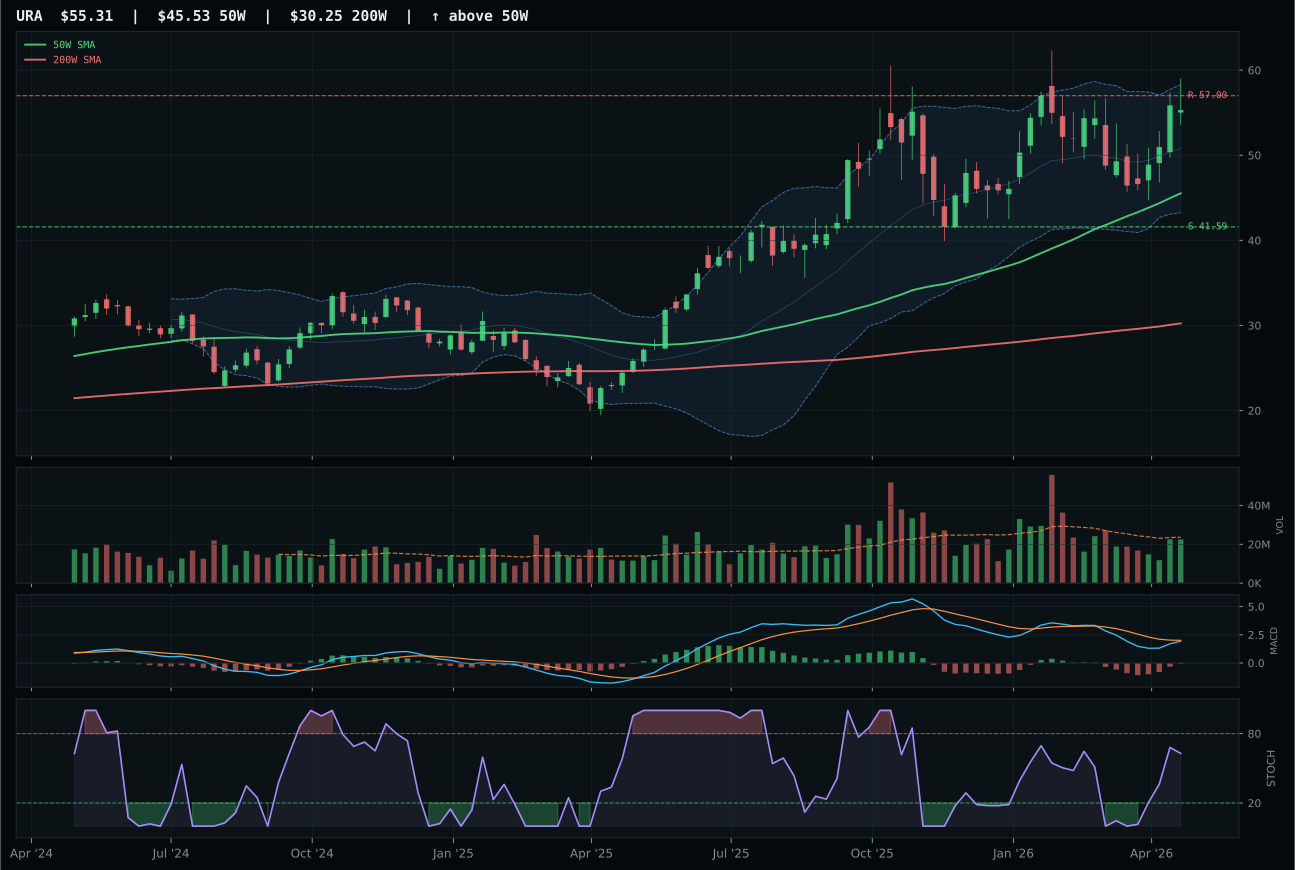
URA has a vertical extension profile with -6.6% 13-week relative strength versus SPY.
A failed hold above support would weaken the setup.
Actionable but governed by invalidation levels.
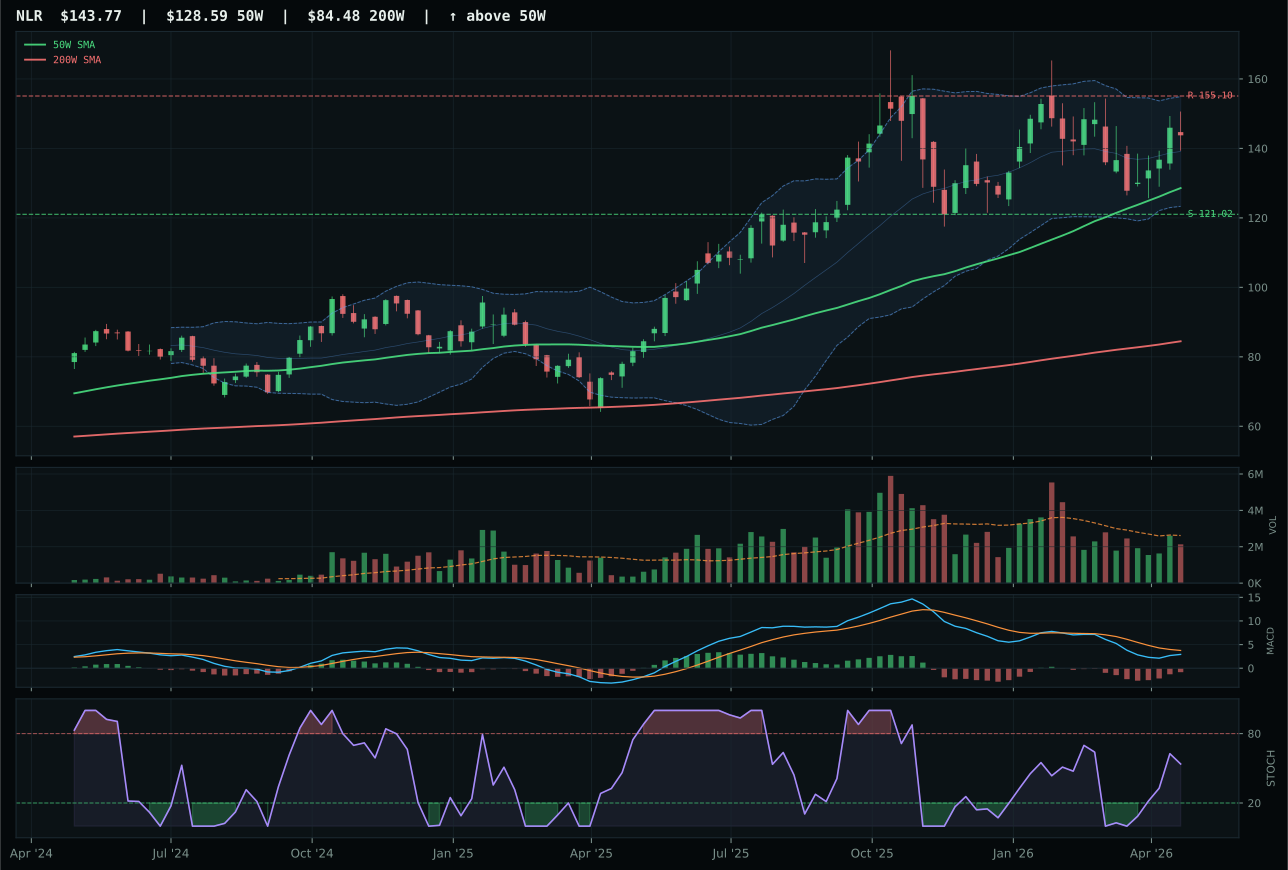
NLR has a neutral structure profile with -9.5% 13-week relative strength versus SPY.
A failed hold above support would weaken the setup.
Actionable but governed by invalidation levels.
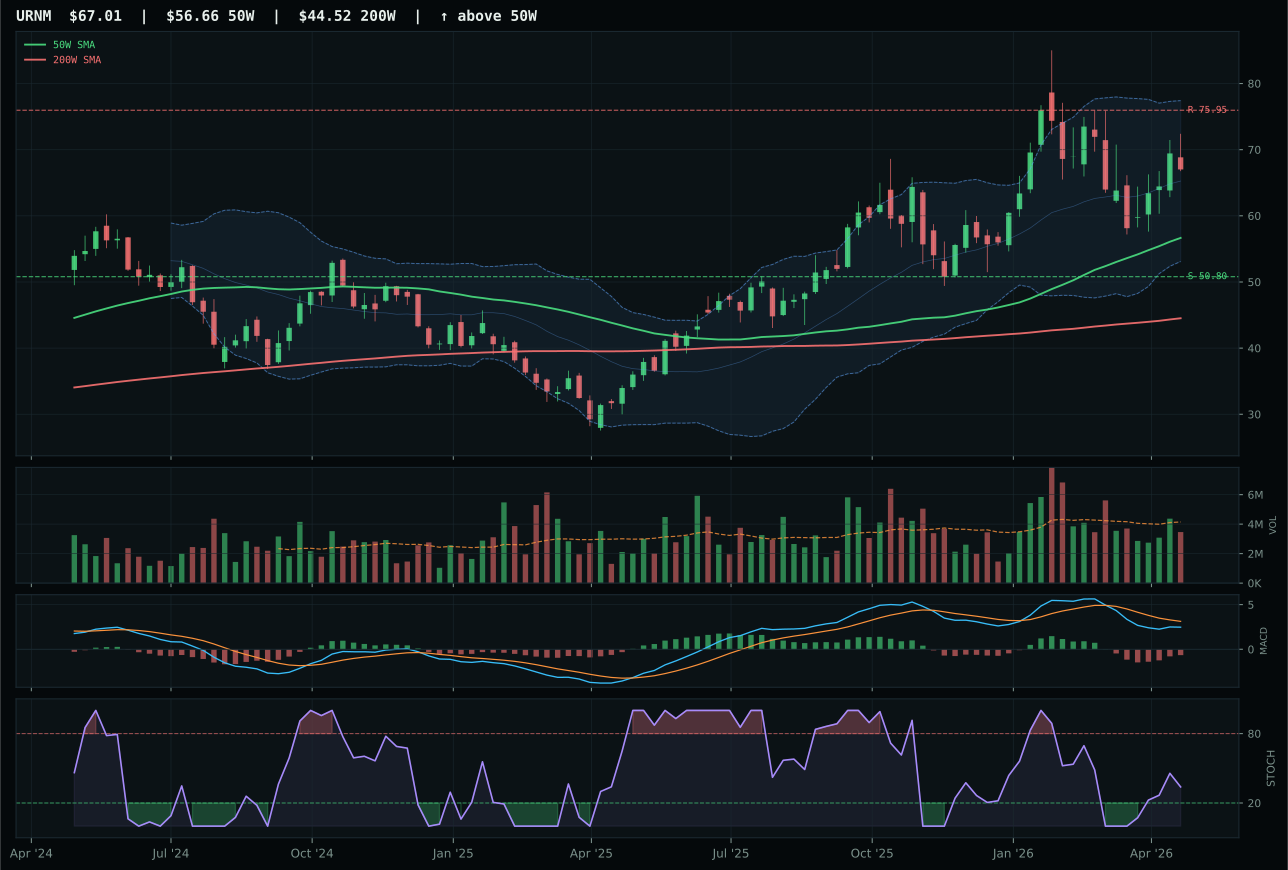
URNM has a vertical extension profile with -15.4% 13-week relative strength versus SPY.
A failed hold above support would weaken the setup.
Actionable but governed by invalidation levels.
URA won the nuclear representative slot at a 51.3 category score through category-relative strength of 2.9% versus NLR's 0.0%, despite NLR's superior composite technical score of 65 versus URA's 59. Both charts display vertical extension in the 21-23% range above moving averages with bearish-improving MACD and rising stochastic mid-zone momentum, yet URA's momentum confirmation at 76.1 decisively outpaced NLR's 49, indicating the ETF captured four-week acceleration the broader nuclear utilities cohort missed. Energy scarcity and real asset sponsorship provided macro support, but the winning margin came from within-basket leadership on recent momentum divergence.
Nuclear Energy holds 10% as a real asset and energy scarcity play despite the 51.3 category score and URA's modest technical foundation at 47.5 evidence. Energy scarcity tailwind provides 9 basis points and real asset sponsorship adds 7, justifying allocation despite -3.0% thirteen-week returns and negative six-week relative performance. The risk/reward at 31.6 is constrained—only 3.0% upside to resistance versus 33.0% downside—and momentum confirmation lags other categories, yet portfolio role centers on energy infrastructure exposure during transition regimes. Allocation would rise to 20% if stochastic RSI rose above 0.7 with volume participation normalizing toward 1.0x average, signaling accumulation rather than consolidation; conversely, a failure to hold 41.59 support would trigger reduction to 5%.
Technology — XLK
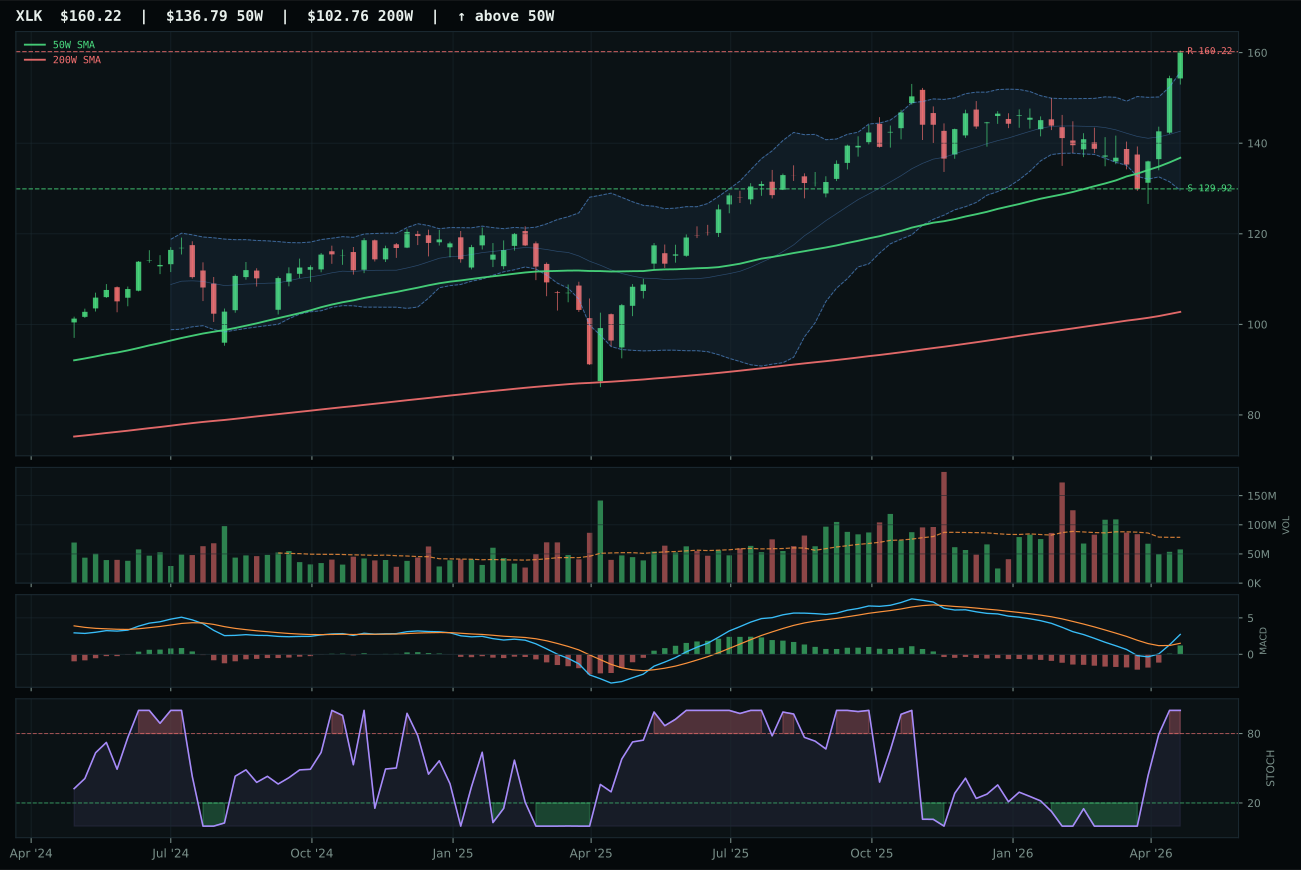
XLK has a vertical extension profile with 6.8% 13-week relative strength versus SPY.
A failed hold above support would weaken the setup.
Actionable but governed by invalidation levels.
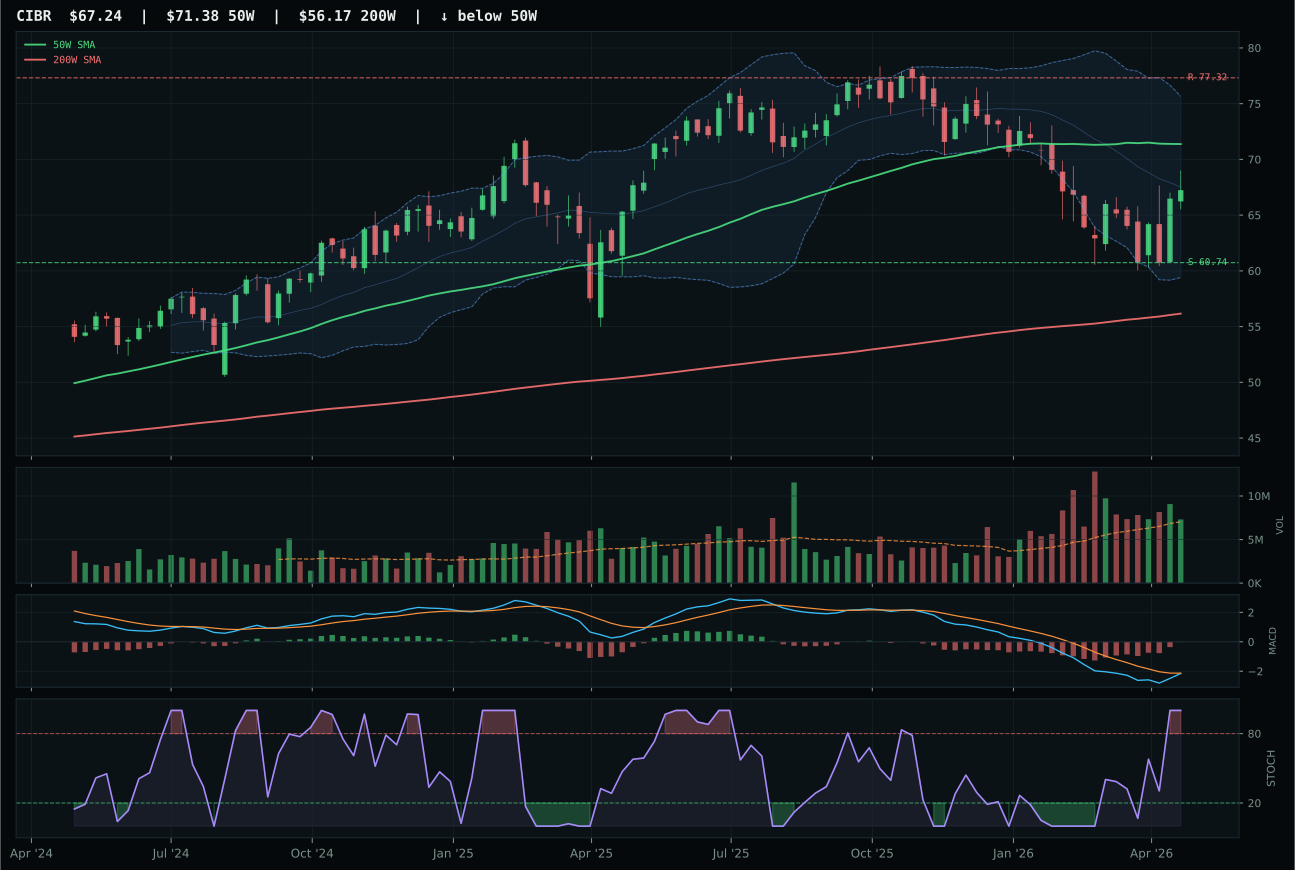
CIBR has a neutral structure profile with -8.6% 13-week relative strength versus SPY.
A failed hold above support would weaken the setup.
Actionable but governed by invalidation levels.
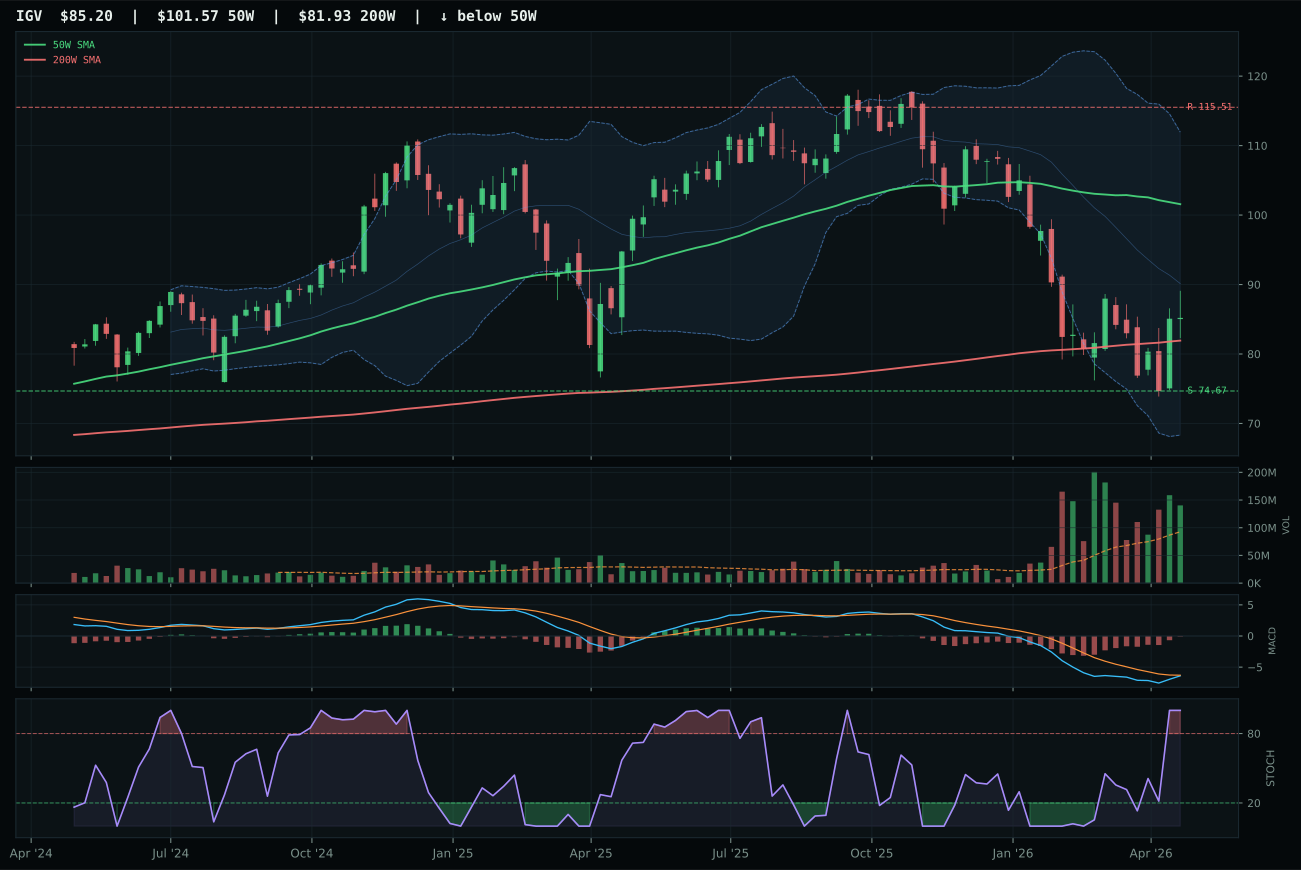
IGV has a neutral structure profile with -16.4% 13-week relative strength versus SPY.
A failed hold above support would weaken the setup.
Actionable but governed by invalidation levels.
XLK captured the category because it commands clear leadership inside its own basket with 15.5% relative strength versus the median, paired with 6.8% outperformance of SPY over thirteen weeks. The chart sits extended 17.1% above the 50-week moving average with a clean 0.8% upslope and MACD bullish and improving, yet momentum confirmation reads at 100 while entry risk has penalized timing to 37 because every new buyer arrives late. CIBR's structure scored 2.3 points lower with weaker category relative strength at 0.0%, a bearish (though improving) MACD, and thirteen-week SPY underperformance of 8.6%, which explains why profitable broad-market tech won over cybersecurity defensiveness when liquidity expansion and risk-on sentiment are active.
Technology earned 10% rather than a top-2 slot despite a 51.3 category score because two categories scored higher and the setup quality here contains asymmetric timing risk. XLK is extended 17.1% from its moving average with thin 0.74x volume participation, meaning the move lacks broad sponsorship even though trend and momentum remain clean. In a transition-to-mixed macro regime where credit stress is active, the cost of entry outweighs the technical evidence—this allocation functions as a tactical hold rather than a conviction bet. XLK would graduate to 20% if the chart pulled back to test the 50-week support at 129.92 with MACD still improving, creating a lower-risk reaccumulation setup.
Defense & Aerospace — ROKT
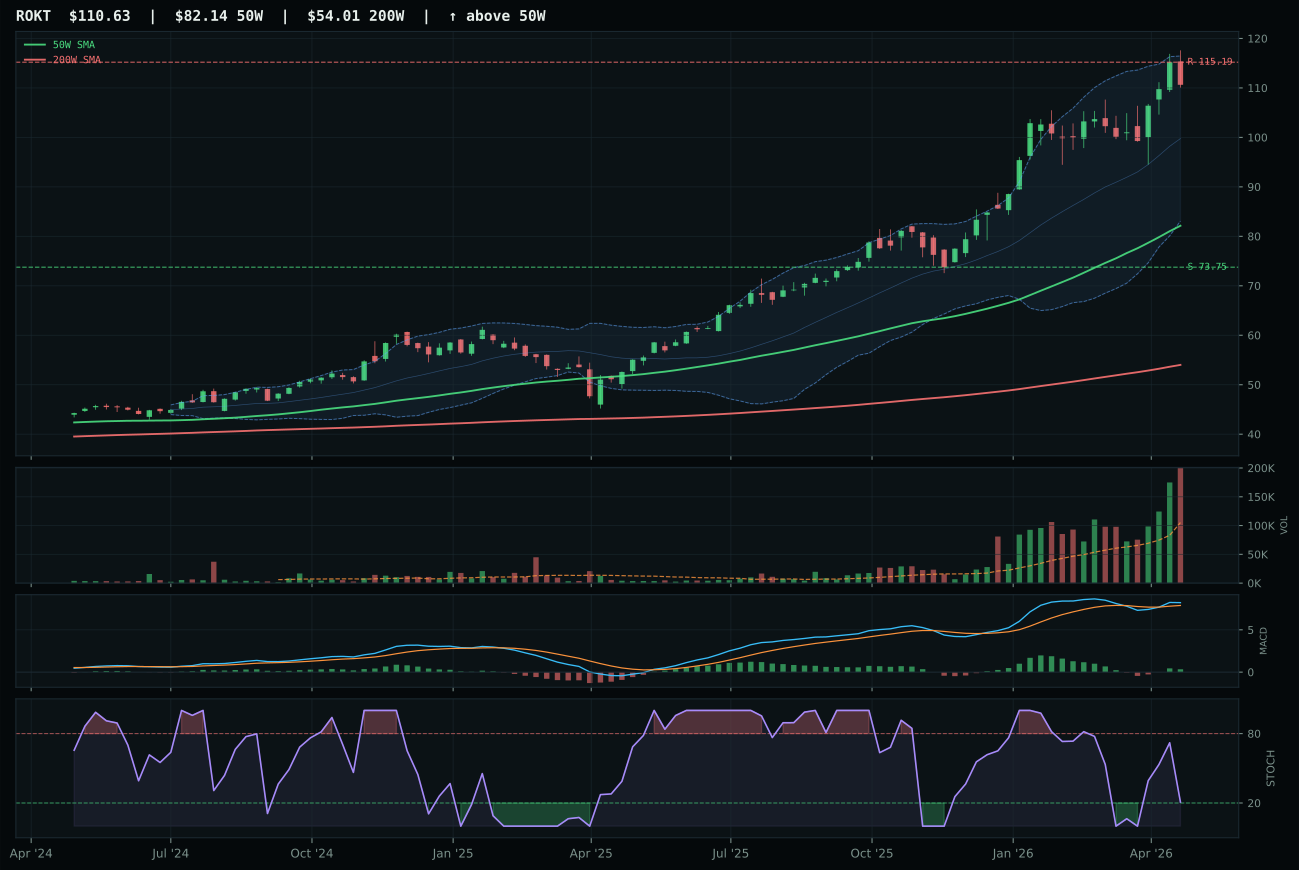
ROKT has a vertical extension profile with 4.2% 13-week relative strength versus SPY.
A failed hold above support would weaken the setup.
Actionable but governed by invalidation levels.
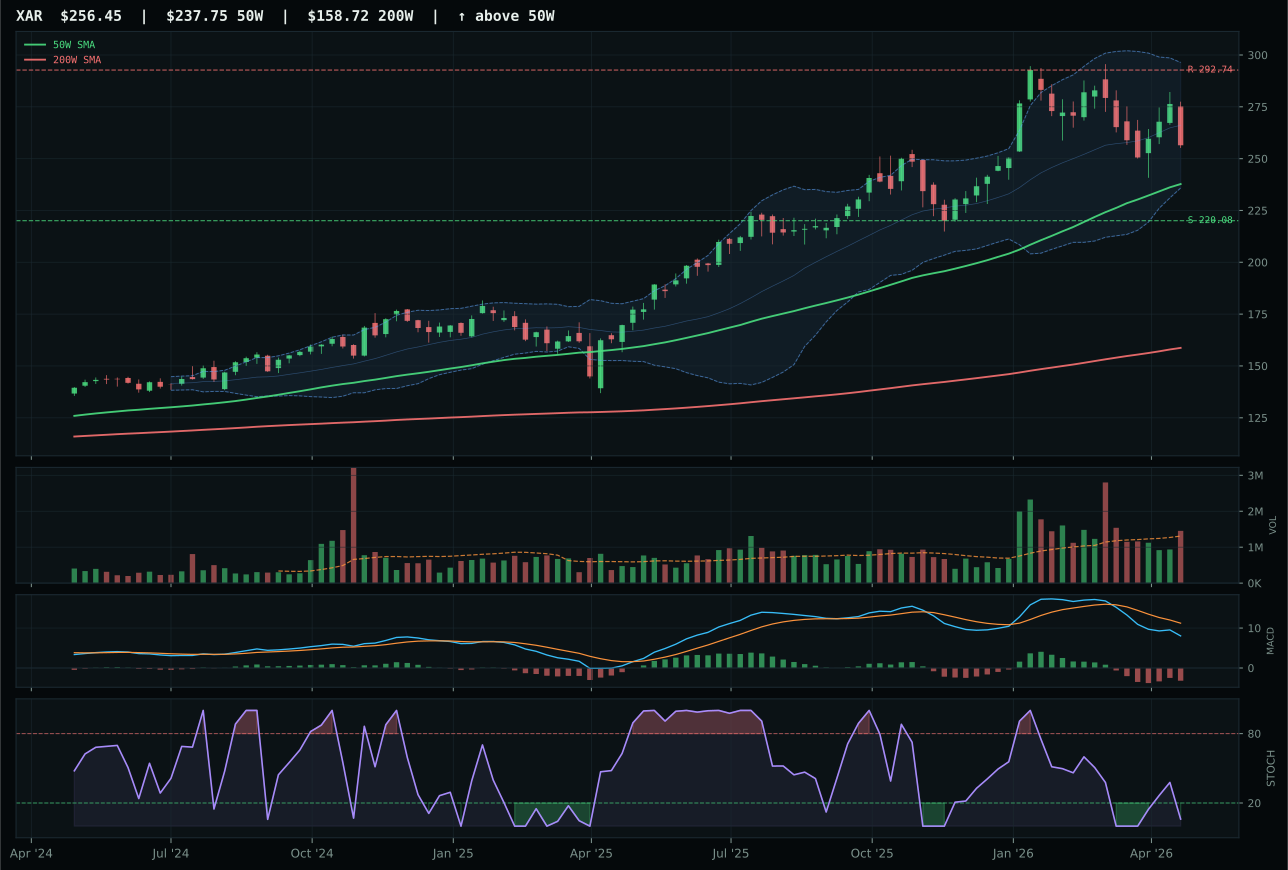
XAR has a neutral structure profile with -13.0% 13-week relative strength versus SPY.
A failed hold above support would weaken the setup.
Actionable but governed by invalidation levels.
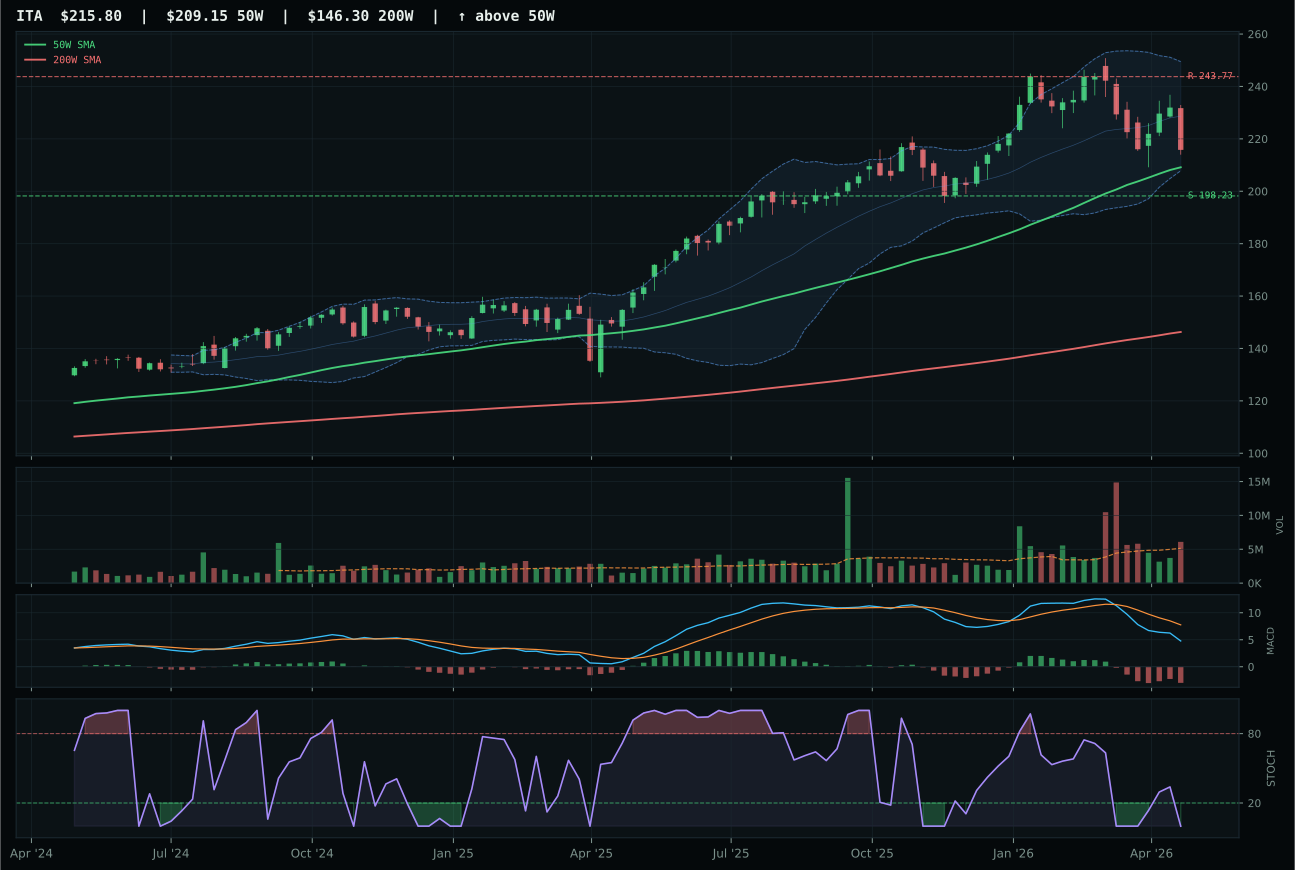
ITA has a neutral structure profile with -11.8% 13-week relative strength versus SPY.
A failed hold above support would weaken the setup.
Actionable but governed by invalidation levels.
ROKT won a narrow decision over XAR despite finishing at 48.8 category score, capturing the representative slot through superior structure cleanliness at 69.3 versus XAR's 68.6 and bullish-improving MACD versus XAR's bearish-improving condition. The space-and-aerospace ETF shows 16.0% category relative strength and a 34.7% extension from the 50-week with stochastic RSI falling into neutral territory at 0.21—a positive timing signal that others in the group lack. Volume, however, reveals distribution pressure at 4.34x average, which compressed the momentum confirmation score despite 7.8% thirteen-week returns, and the tight margin to XAR reflects a category lacking conviction altogether in a mixed macro regime.
Defense & Aerospace received zero allocation this week, ranking ninth or tenth across the ten categories with a 48.8 final score that failed to compete with stronger technical setups and more favorable macro tailwinds in Energy, AI, and Utilities/Infrastructure. The category's macro fit scored only 63.0/100; defensive rotation helped (+8), but credit stress pinched the narrative and risk appetite positive did not materialize as a tailwind. ROKT's distribution pressure at 4.34x volume—despite winning the category—signals that the rally is running out of steam, and the -4.0% upside to resistance creates an unfavorable risk-reward for new allocation. For Defense & Aerospace to earn a 10% slot, ROKT would need to consolidate volume below 2.0x average, rebuild MACD momentum, and ideally see either XAR overcome its -13.0% relative weakness or the macro regime tilt more explicitly toward geopolitical risk and defensive rotation.
Precious Metals — GLD
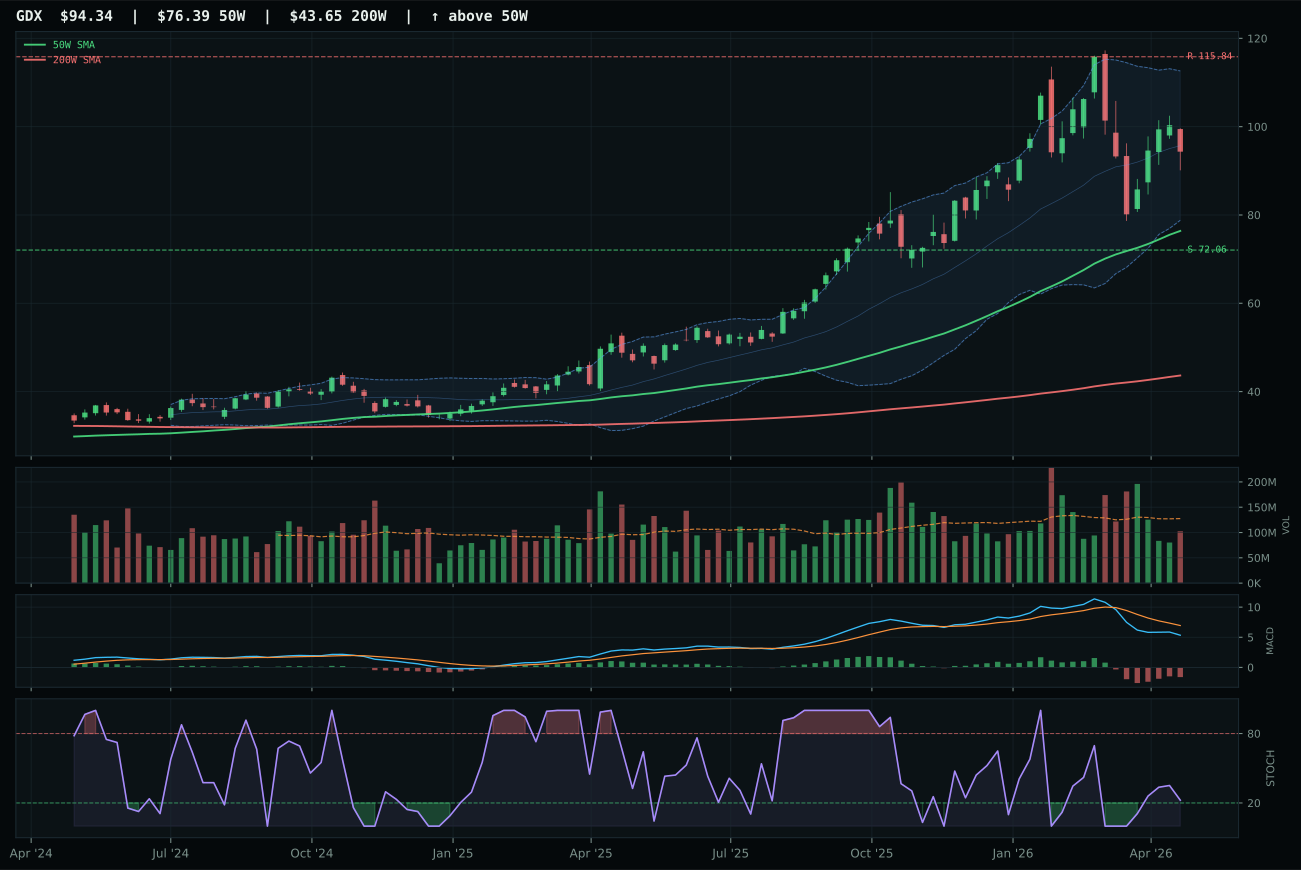
GDX has a vertical extension profile with -15.4% 13-week relative strength versus SPY.
A failed hold above support would weaken the setup.
Actionable but governed by invalidation levels.
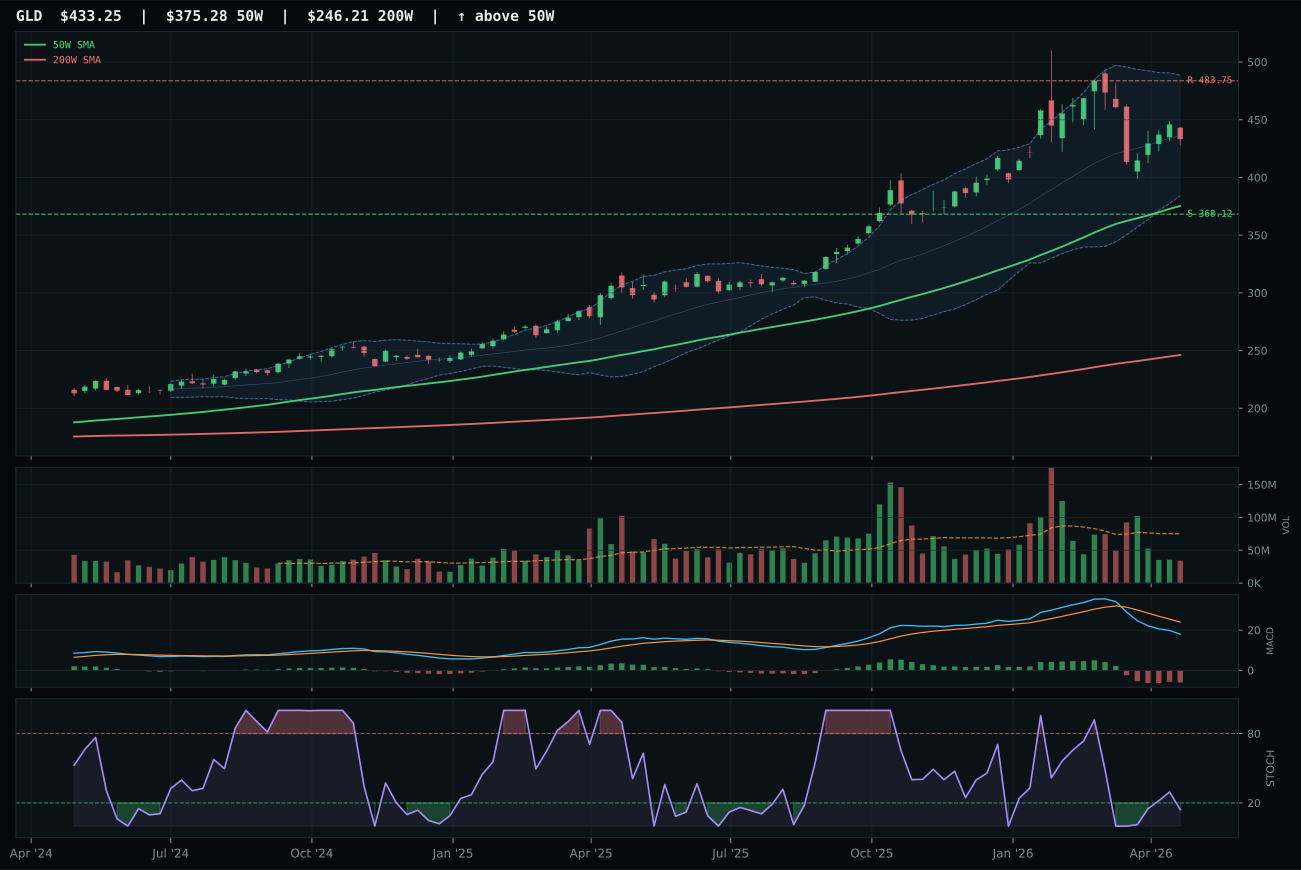
GLD has a vertical extension profile with -9.0% 13-week relative strength versus SPY.
A failed hold above support would weaken the setup.
Actionable but governed by invalidation levels.
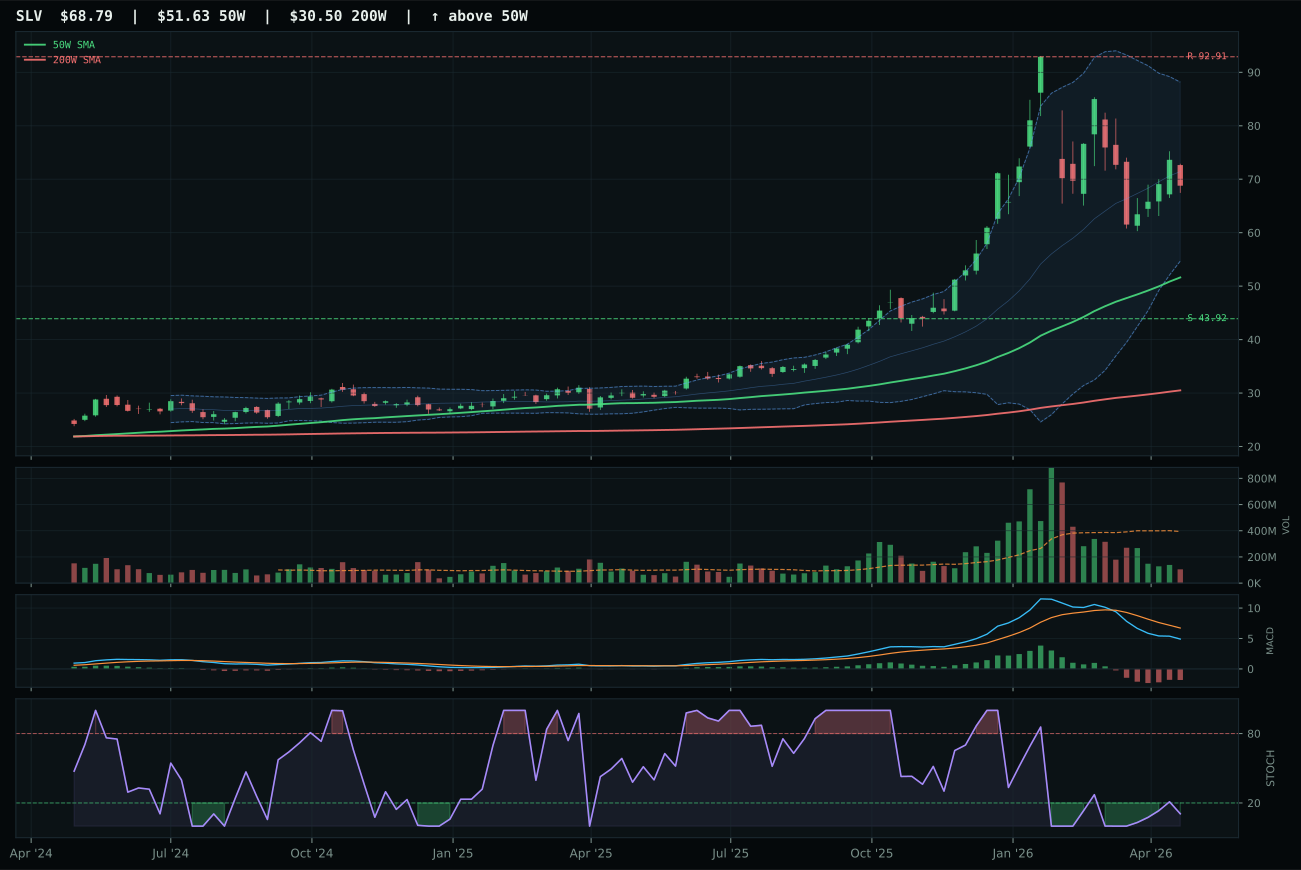
SLV has a vertical extension profile with -29.5% 13-week relative strength versus SPY.
A failed hold above support would weaken the setup.
Actionable but governed by invalidation levels.
GLD captured the precious metals representative despite a thin 37.5 category score through superior risk/reward framing at 55.6 versus GDX's 40.8 and better structural cleanliness at 71.0 versus GDX's 67.4, despite both occupying identical extension zones and both showing negative thirteen-week momentum. Gold's 15.4% distance from the 50-week provided measurably better entry geometry than GDX's 23.5% stretch, and GLD's 6.4% category relative strength versus GDX's 0.0% provided the final edge. Both charts show bearish-weakening MACD and oversold oscillators, yet GLD's vertical extension structure and defensive rotation macro tailwind of 6 basis points allowed it to win a category that fundamentally lacks conviction.
Precious Metals received zero allocation this week, ranked outside the top eight categories with a 37.5 category score driven by weak technical evidence (20.4/100 for GLD) and a neutral macro fit of 51.0/100 where defensive rotation (+7) could not overcome the headwind from positive risk appetite (-4). In a Transition/Mixed regime with credit stress active but risk appetite tilting positive, gold's defensive hedge value is questioned by the market; the -9.0% SPY-relative return on GLD and -15.4% on GDX confirmed that real assets like energy and industrial metals were preferred over monetary stores. GLD's bearish/weakening MACD and GDX's 23.5% extension left neither asset with near-term upside conviction. For Precious Metals to earn allocation next week, GLD would need to establish bullish MACD confirmation, trade below the 50-week moving average to reset timing, and ideally see risk appetite descriptors shift negative or credit stress accelerate, signaling a true flight-to-quality rotation.