
2026-04-17
Informational purposes only. The content in this report, including allocations, analysis, and commentary, is provided solely for informational and educational purposes. It does not constitute financial advice, investment advice, trading advice, or any other type of advice. Past performance does not guarantee future results. Always conduct your own research and consult a qualified financial professional before making investment decisions.
Weekly Allocation
| Ticker | Category | Weight | Role |
|---|---|---|---|
| XLE | Traditional Energy | 20% | Top-2 (20%) |
| MOO | Agriculture & Livestock | 20% | Top-2 (20%) |
| SMH | AI | 10% | Tier-2 (10%) |
| PAVE | Utilities & Infrastructure | 10% | Tier-2 (10%) |
| ILF | Emerging Markets | 10% | Tier-2 (10%) |
| REMX | Industrial Metals | 10% | Tier-2 (10%) |
| URA | Nuclear Energy | 10% | Tier-2 (10%) |
| XLK | Technology | 10% | Tier-2 (10%) |
Trade Instructions — Monday Open
Sell the tranche from 2026-03-20 (completing its 4-week hold). Buy the new tranche. Instructions show net portfolio changes — same-asset positions cancel, weight changes show the delta.
| Action | Ticker | Instruction |
|---|---|---|
| SELL | XOP | Sell 50% of XOP position (reduce 10.00% → 5.00%) |
| SELL | XLU | Sell entire XLU position (5.00% of portfolio) |
| SELL | WEAT | Sell 33% of WEAT position (reduce 7.50% → 5.00%) |
| SELL | AIQ | Sell entire AIQ position (2.50% of portfolio) |
| SELL | NLR | Sell 50% of NLR position (reduce 5.00% → 2.50%) |
| SELL | IGV | Sell entire IGV position (2.50% of portfolio) |
| BUY | SMH | Buy SMH — 12.50% of freed cash (adds 2.50% to portfolio) |
| BUY | XLE | Buy XLE — 25.00% of freed cash (adds 5.00% to portfolio) |
| BUY | URA | Buy URA — 12.50% of freed cash (adds 2.50% to portfolio) |
| BUY | PAVE | Buy PAVE — 12.50% of freed cash (adds 2.50% to portfolio) |
| BUY | MOO | Buy MOO — 25.00% of freed cash (adds 5.00% to portfolio) |
| BUY | XLK | Buy XLK — 12.50% of freed cash (adds 2.50% to portfolio) |
Current Portfolio After Trade
Combined holdings across all 4 active tranches. Each tranche is 25% of the portfolio.
| Ticker | % of Portfolio | Weight Bar |
|---|---|---|
| XLE | 15.00% | |
| SMH | 10.00% | |
| VEGI | 10.00% | |
| ILF | 7.50% | |
| COPX | 7.50% | |
| URA | 7.50% | |
| WEAT | 5.00% | |
| XOP | 5.00% | |
| IGF | 5.00% | |
| XAR | 5.00% | |
| PAVE | 5.00% | |
| MOO | 5.00% | |
| NLR | 2.50% | |
| ITA | 2.50% | |
| GLD | 2.50% | |
| REMX | 2.50% | |
| XLK | 2.50% |
Macro Regime — Transition / Mixed
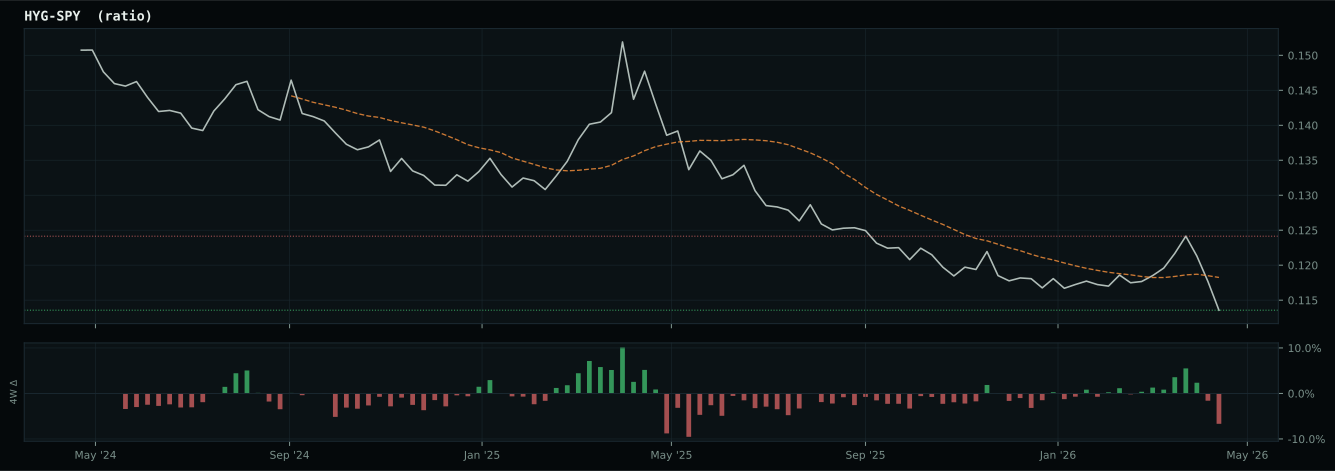
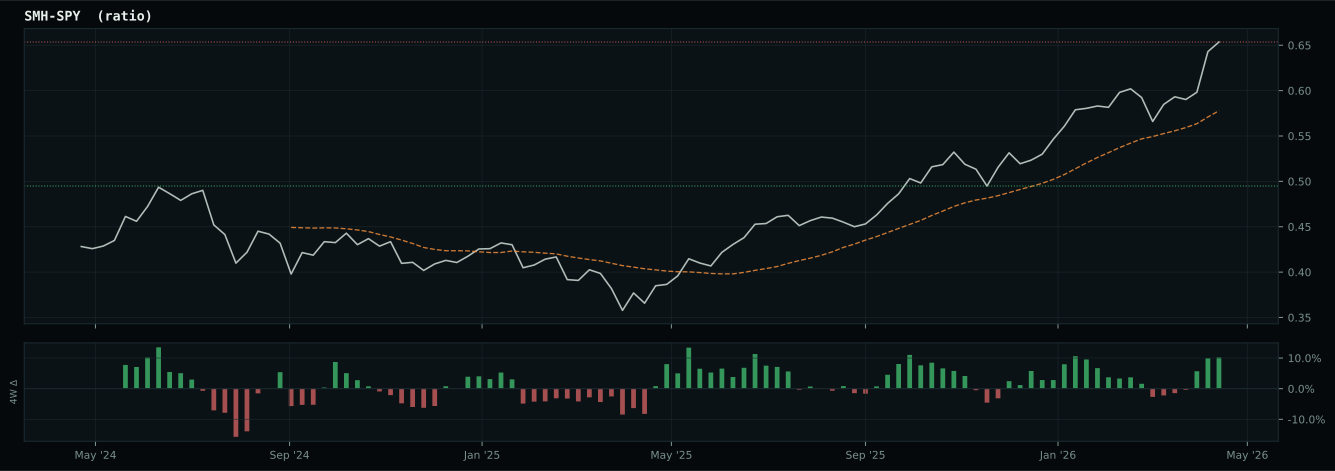
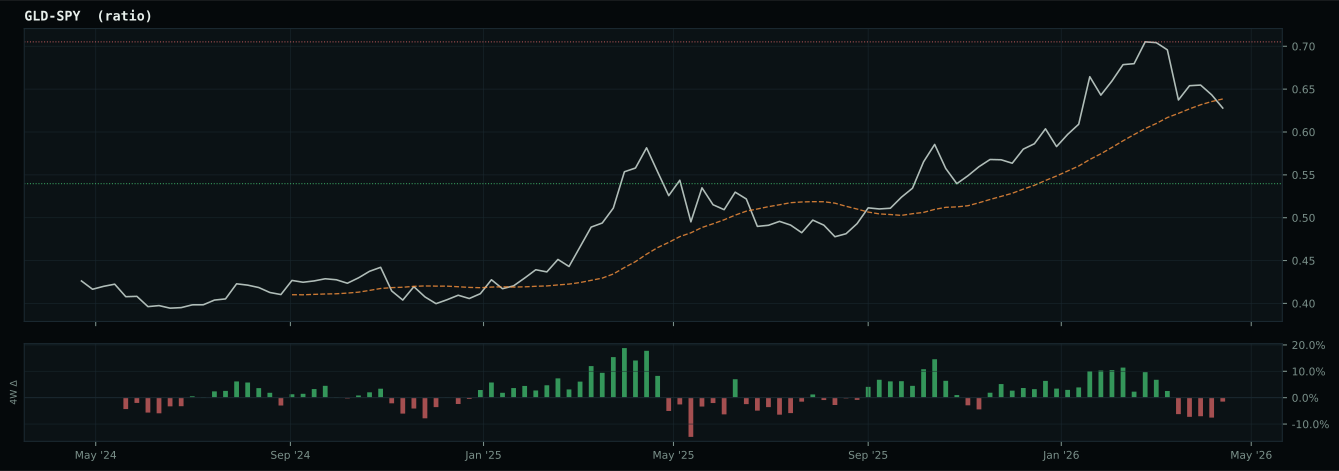
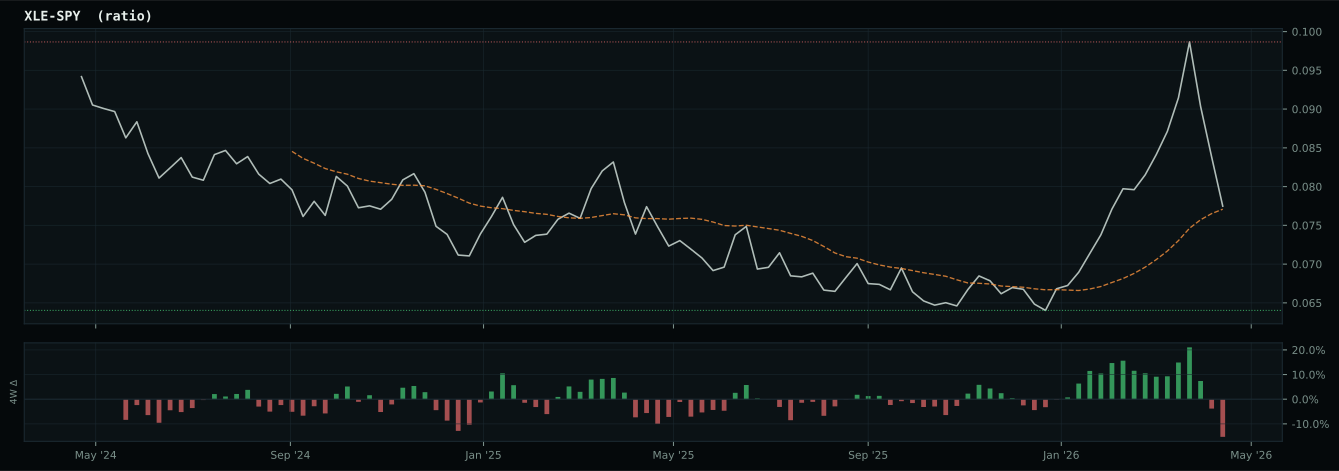
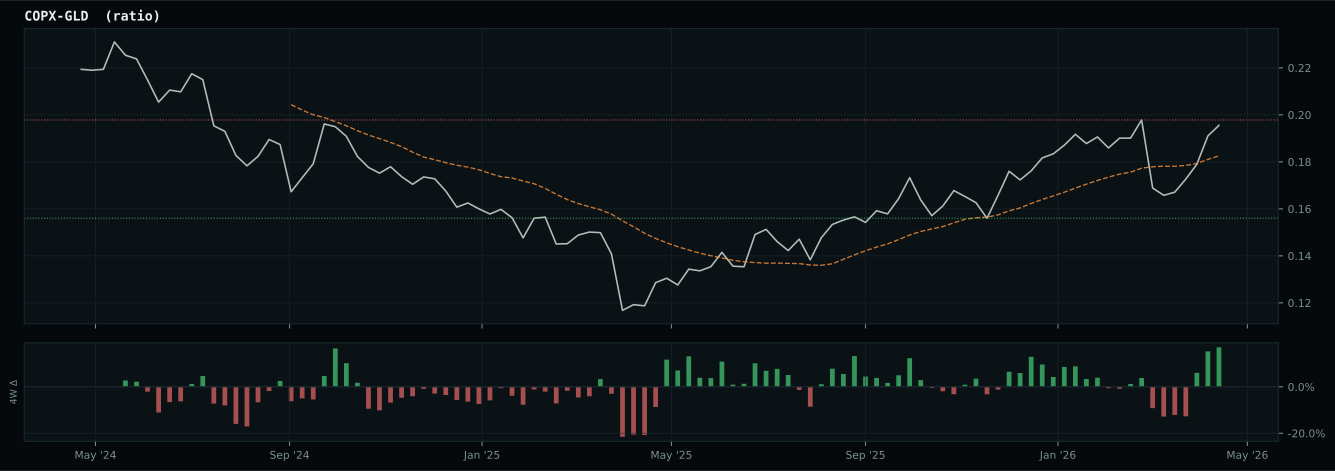
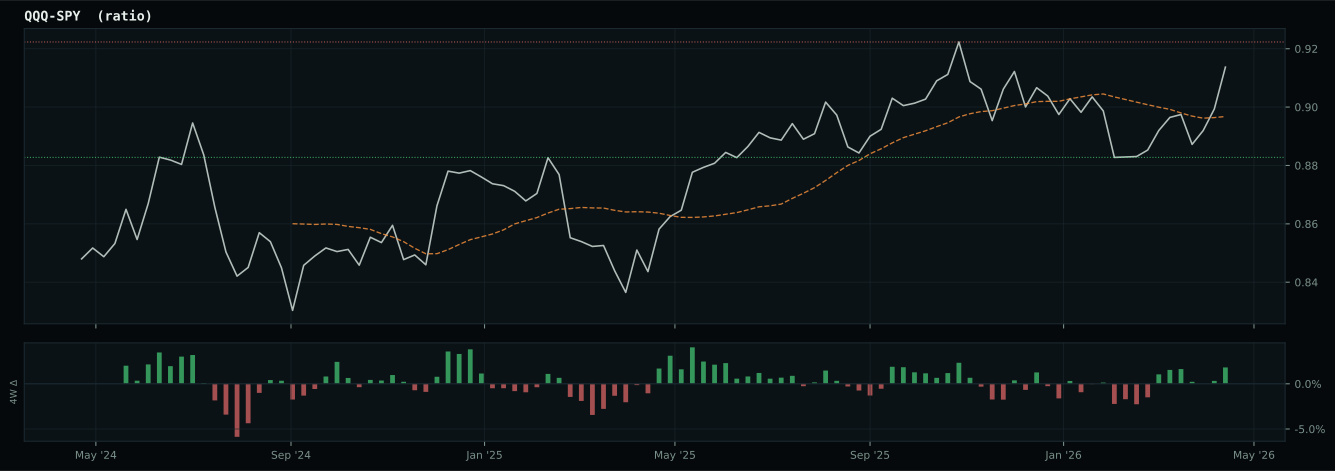
Macro Evidence Charts
Market-implied signals behind the macro regime scores. Each ratio compares two assets; the direction and slope of the ratio is what the macro engine reads.
Crypto Regime — NoCrypto
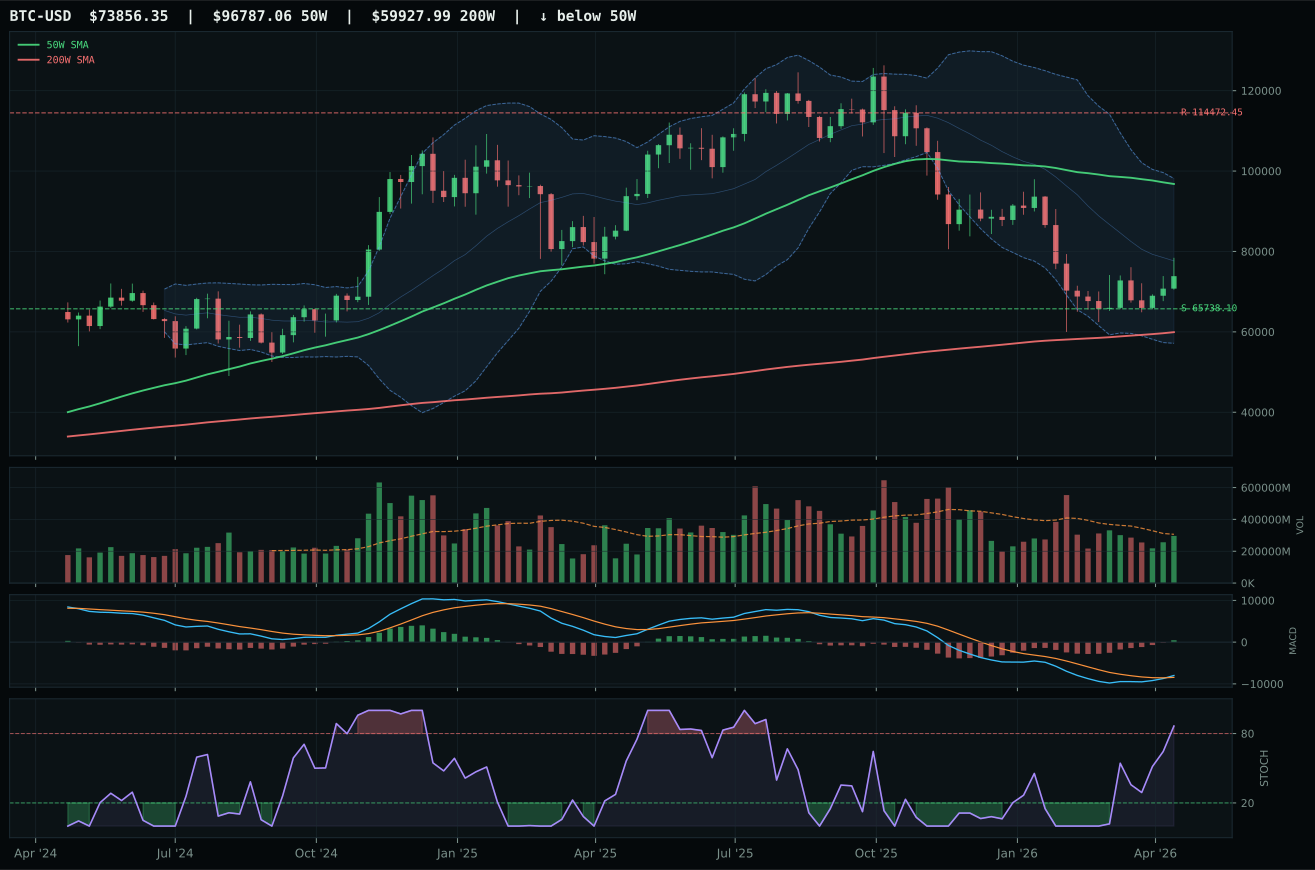
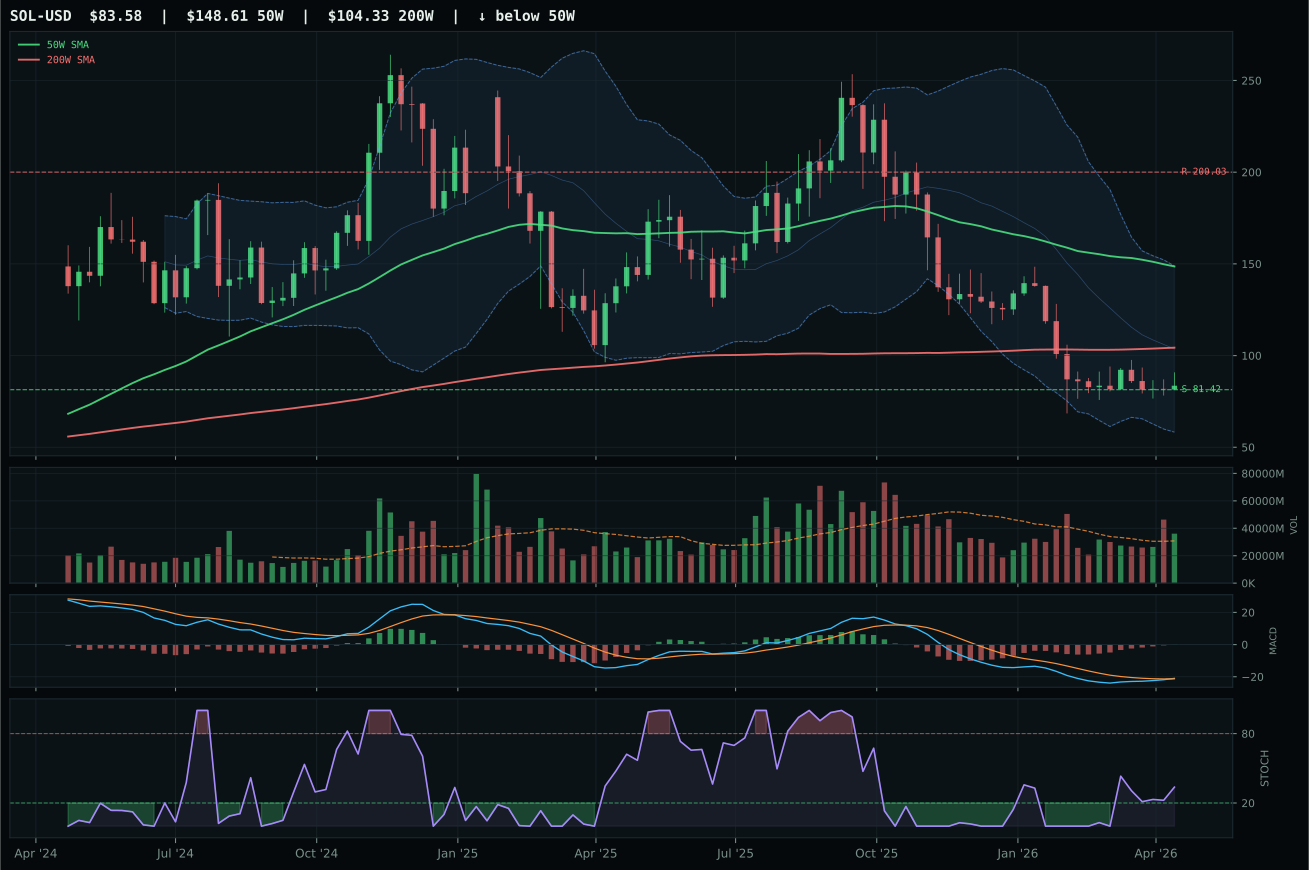
ValueBTC armed by first 200W buy-zone touch, but post-touch range age is 10 weeks; minimum is 12
TrendBTC not confirmed
one or more available conditions failed
Category Rankings
| Rank | Category | Winner | Score | Alloc | 4W Ret | Peers (4W) |
|---|---|---|---|---|---|---|
| 1 | Traditional Energy | XLE | 77.6 | 20% | +7.31% | XOP +7.4% · FCG +7.0% |
| 2 | Agriculture & Livestock | MOO | 76.7 | 20% | -2.52% | VEGI -0.5% · WEAT +9.5% |
| 3 | AI | SMH | 71.3 | 10% | +21.70% | AIQ +13.9% · BOTZ +7.4% |
| 4 | Utilities & Infrastructure | PAVE | 69.0 | 10% | +0.98% | IGF -2.0% · XLU -4.4% |
| 5 | Emerging Markets | ILF | 67.3 | 10% | -8.46% | IEMG +3.7% · INDA -4.9% |
| 6 | Industrial Metals | REMX | 60.8 | 10% | -4.26% | PICK -0.0% · COPX -2.5% |
| 7 | Nuclear Energy | URA | 57.2 | 10% | -9.03% | NLR -9.6% · URNM -12.4% |
| 8 | Technology | XLK | 51.7 | 10% | +15.11% | CIBR +18.9% · IGV +7.1% |
| 9 | Precious Metals | SLV | 44.8 | 0% | -3.33% | GLD -5.3% · GDX -10.9% |
| 10 | Defense & Aerospace | XAR | 37.4 | 0% | -4.21% | ITA -5.6% · ROKT +3.8% |
Traditional Energy — XLE
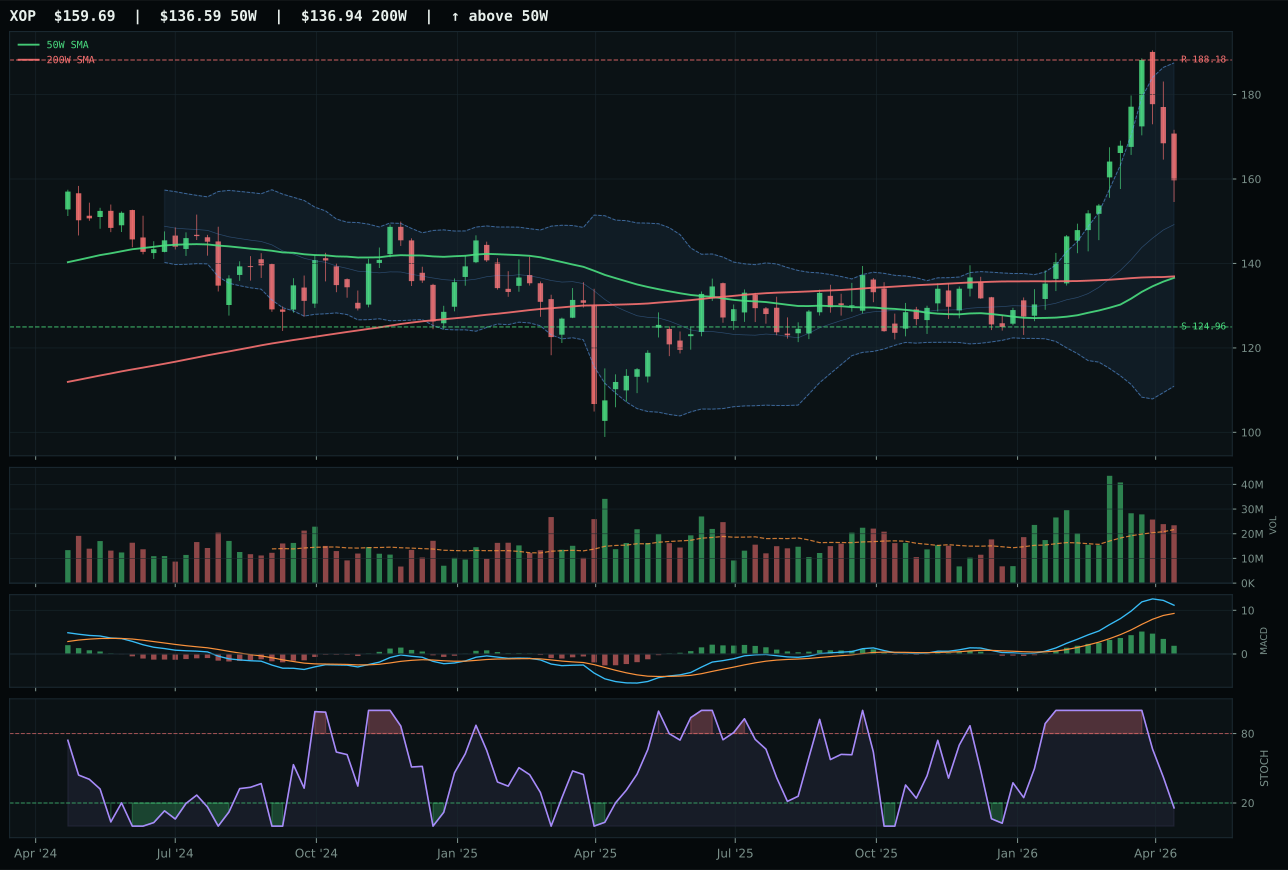
XOP has a vertical extension profile with 19.9% 13-week relative strength versus SPY.
A failed hold above support would weaken the setup.
Actionable but governed by invalidation levels.
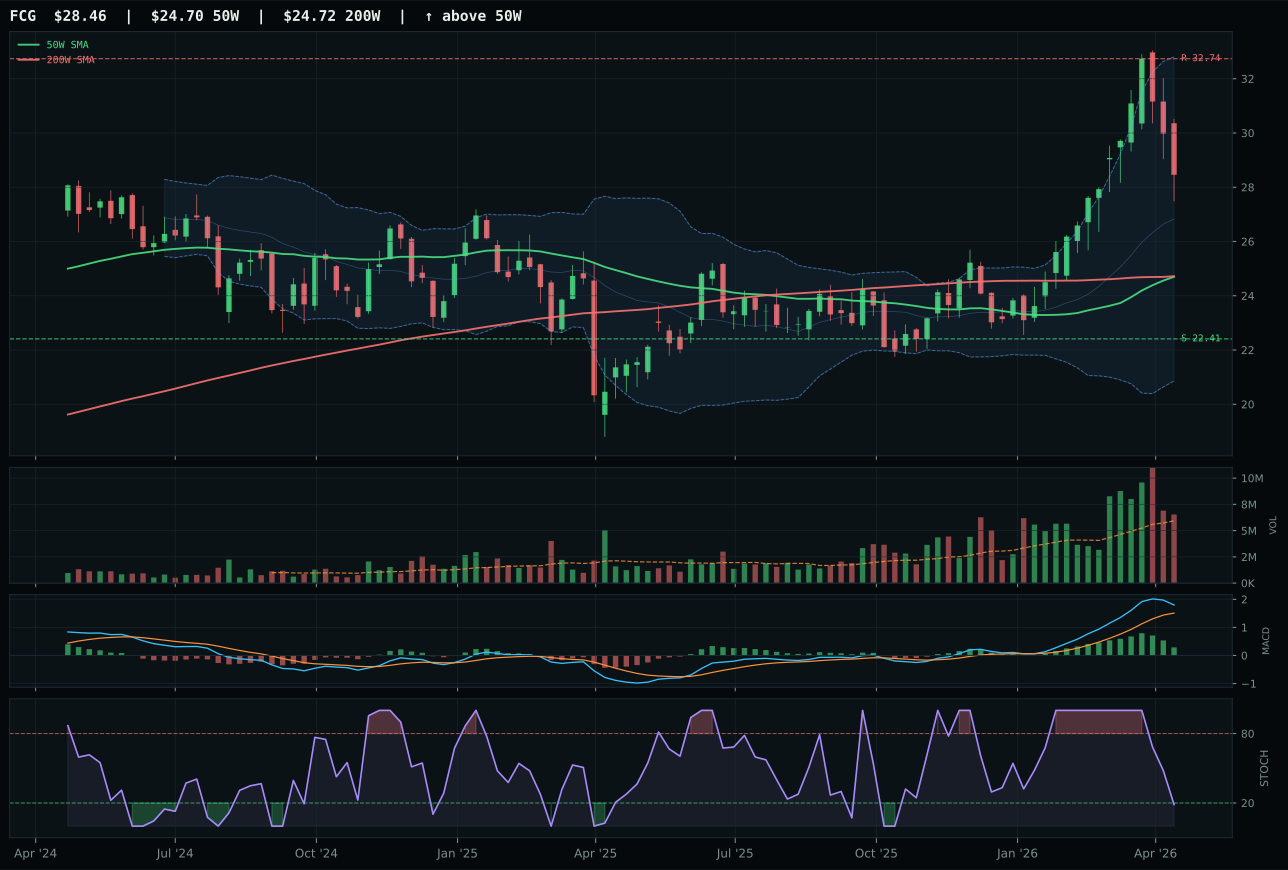
FCG has a vertical extension profile with 17.8% 13-week relative strength versus SPY.
A failed hold above support would weaken the setup.
Actionable but governed by invalidation levels.
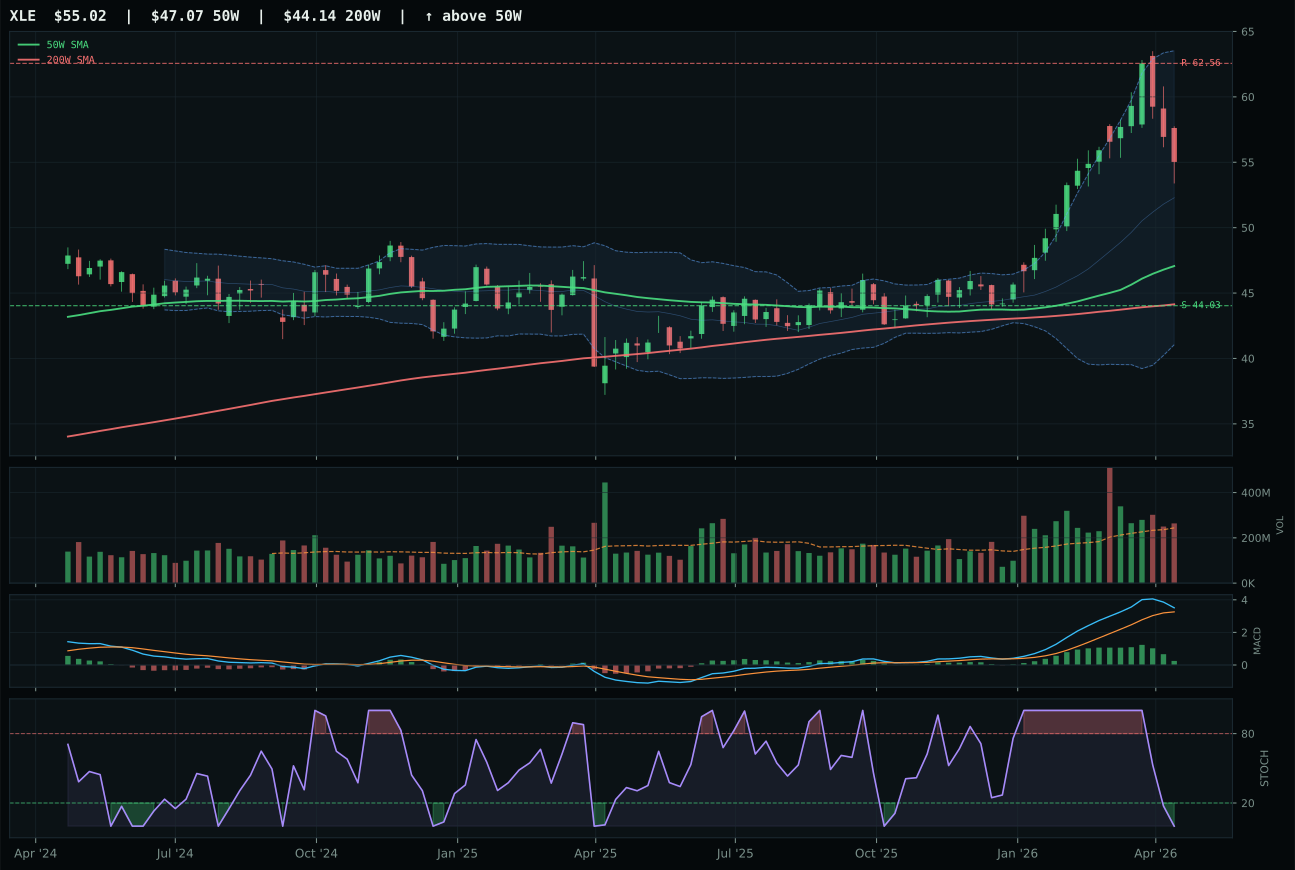
XLE has a vertical extension profile with 12.7% 13-week relative strength versus SPY.
A failed hold above support would weaken the setup.
Actionable but governed by invalidation levels.
XLE wins the category and claims a 20% portfolio slot as the second top-ranked position, defeating XOP (19.9% SPY-relative strength) because integrated energy cash-flow defense beats exploration beta in a macro environment where supply shortage and energy scarcity are active. Structure cleanliness favors XLE (75.0 vs 75.1), a razor-thin margin, but the decisive technical difference lies in volume confirmation: XLE at 1.08x (neutral) versus XOP at neutral, paired with XLE's 100 trend score and superior persistence (68.4). The 16.9% extension above the 50-week moving average is modest compared to other category winners, and MACD is bullish-but-flattening with stochastic RSI at 0.00 (oversold)—a setup that attracts institutional rotation from volatility into value. XLE's 13-week return of 15.4% and 12.7% SPY-relative strength prove that energy equities are outperforming in absolute terms, not just benefiting from relative weakness elsewhere.
Traditional Energy ranked 77.6 and earned the second 20% allocation slot because energy scarcity (+16), inflation pressure (+10), and supply shortage (+9) create a 35-point macro tailwind—the single strongest descriptor profile in the entire portfolio. Real asset sponsorship adds seven more points, while credit stress subtracts only seven, leaving a net +35 macro boost that is second only to Agriculture's +38. XLE's 60.3 technical evidence combines with 86.0 macro fit to deliver a 77.6 category score that ties with MOO for the top-two conviction slots. The portfolio's 20% combined allocation to XLE and MOO (40% of total capital) reflects belief that commodity inflation, supply disruption, and real-asset sponsorship will remain the dominant macro themes through the quarter. This is a high-conviction call; monitor for deterioration in energy scarcity descriptor or credit stress escalation as early warning signs. If oil prices break below the 50-week support at 44.03, rebalancing will be warranted despite the bullish structure.
Agriculture & Livestock — MOO
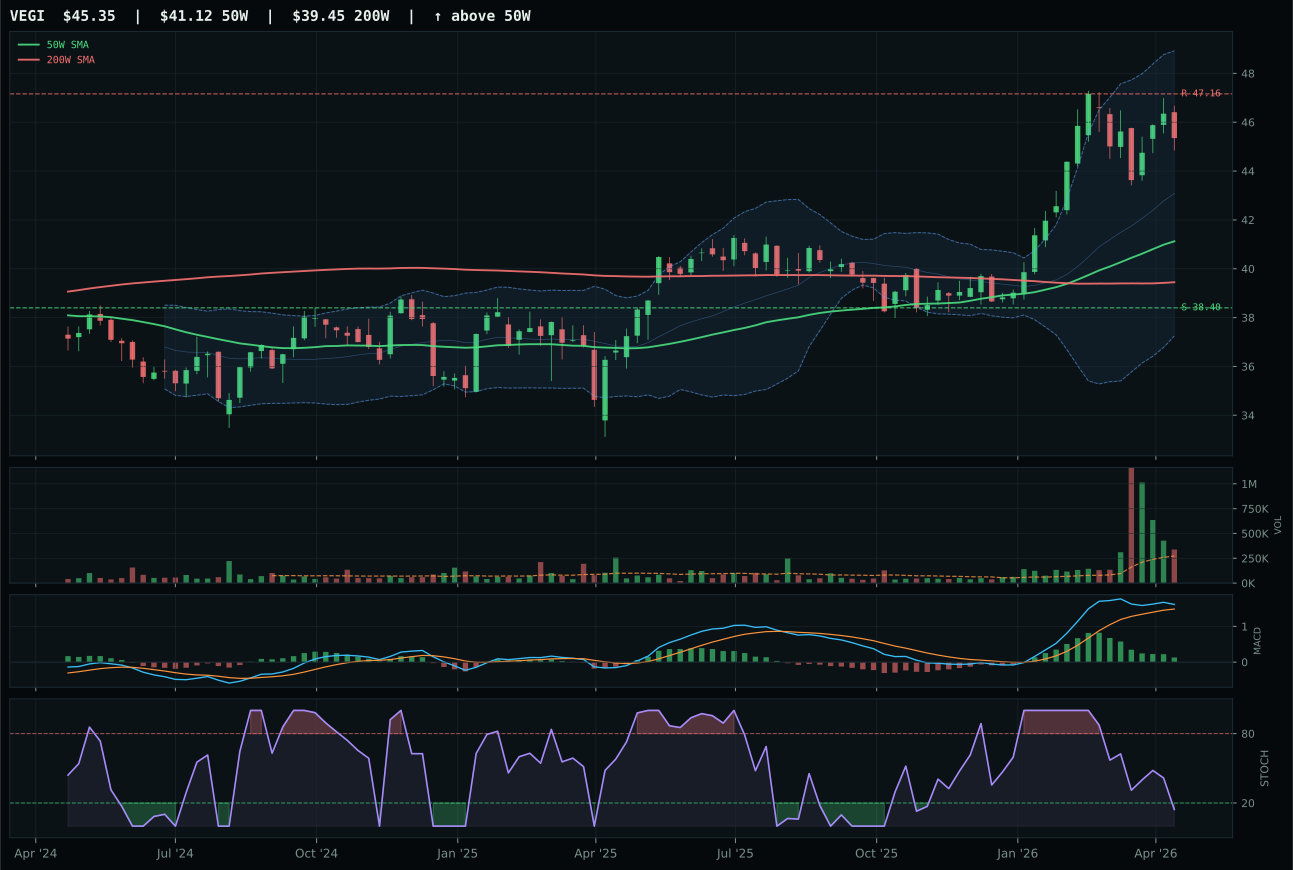
VEGI has a neutral structure profile with 6.9% 13-week relative strength versus SPY.
A failed hold above support would weaken the setup.
Actionable but governed by invalidation levels.
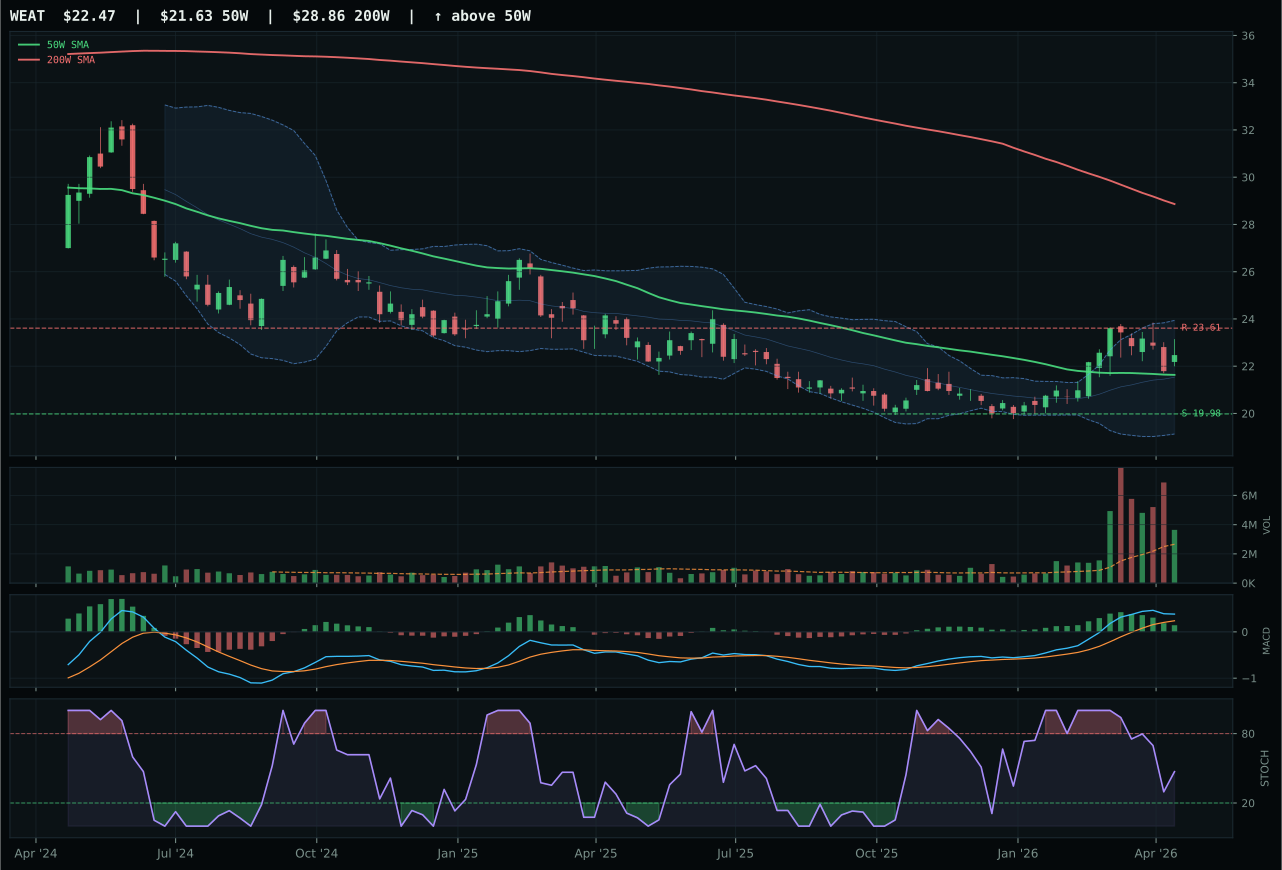
WEAT has a neutral structure profile with 7.7% 13-week relative strength versus SPY.
A failed hold above support would weaken the setup.
Actionable but governed by invalidation levels.
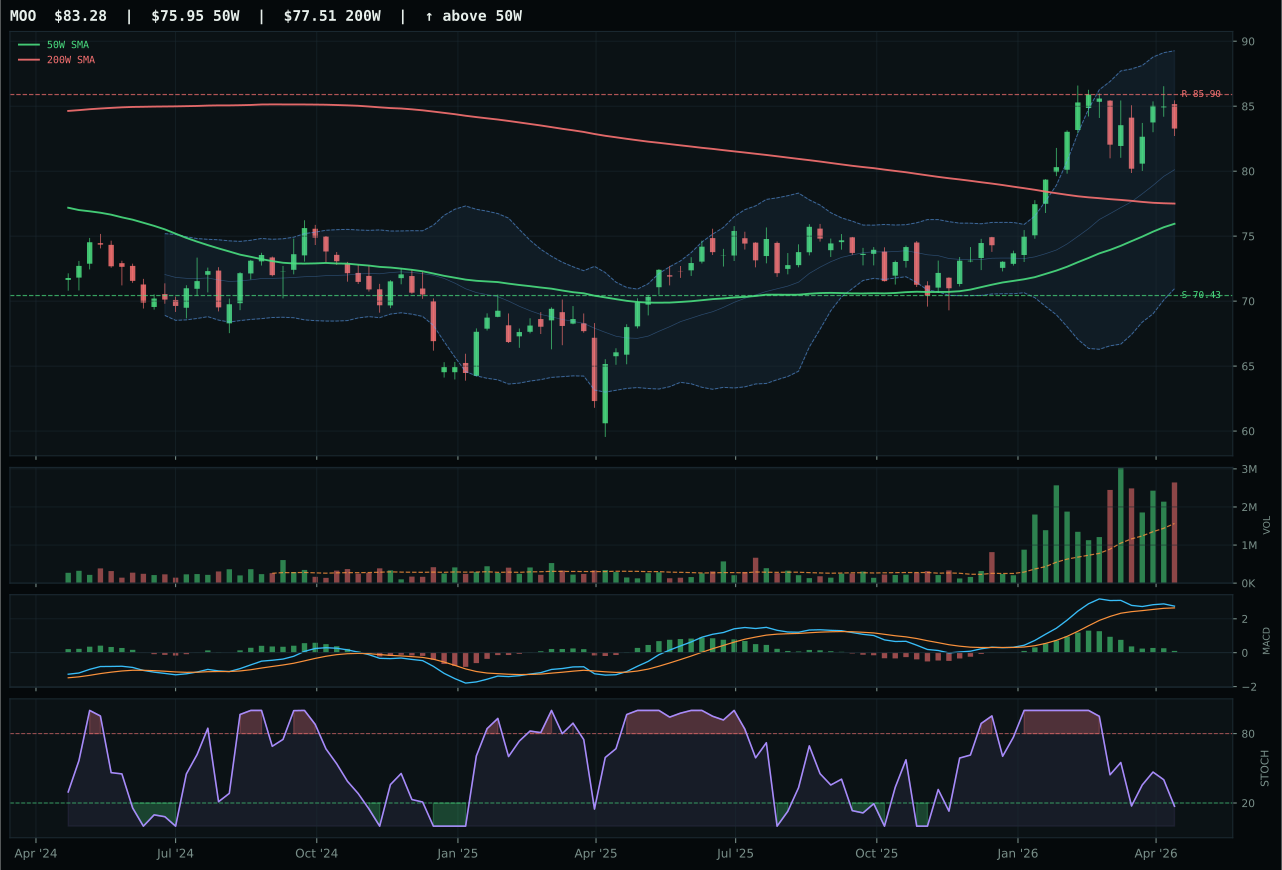
MOO has a neutral structure profile with 4.8% 13-week relative strength versus SPY.
A failed hold above support would weaken the setup.
Actionable but governed by invalidation levels.
MOO wins the category and earns a 20% allocation slot as one of two top-ranked positions, defeating VEGI despite trailing on technical evidence (39.0 vs 80.2) because macro sponsorship is overwhelming and the category-level macro fit of 86.0 elevates all peers. Supply shortage and inflation pressure contribute 13 and 10 points respectively, while commodity breadth positive and real asset sponsorship add five each—a combined 38-point tailwind that overpowers VEGI's superior structure and momentum scores. MOO's 93.3 trend and 70.0 timing, paired with a 9.6% extension and bullish-but-flattening MACD, position it as a quality entry point despite 1.69x volume (distribution pressure). The stochastic RSI reading of 0.17 (oversold) combined with neutral structure and breadth support suggests consolidation rather than capitulation, making this a rare case where macro conviction justifies technical caution.
Agriculture & Livestock ranked 76.7, earning it the second 20% slot alongside Traditional Energy, because the macro regime has shifted decisively toward commodity inflation and supply-side stress. The 3/2/1 basket weighting placed VEGI first technically (79.6) but MOO's category-relative momentum and macro alignment elevated the final winner. This allocation reflects the portfolio's view that real-asset inflation will persist and that agricultural commodity prices remain range-bound between the 50-week support (70.43) and resistance (85.90) with upside driven by weather volatility and geopolitical supply disruption. The 20% weight signals conviction that commodity breadth will remain positive and that inflation pressure will stay active through the quarter. Monitor for MACD flattening as a warning sign; if stochastic RSI rises to overbought and volume turns to accumulation (above 1.69x), the setup will have matured and warrant rebalancing toward emerging markets or energy.
AI — SMH
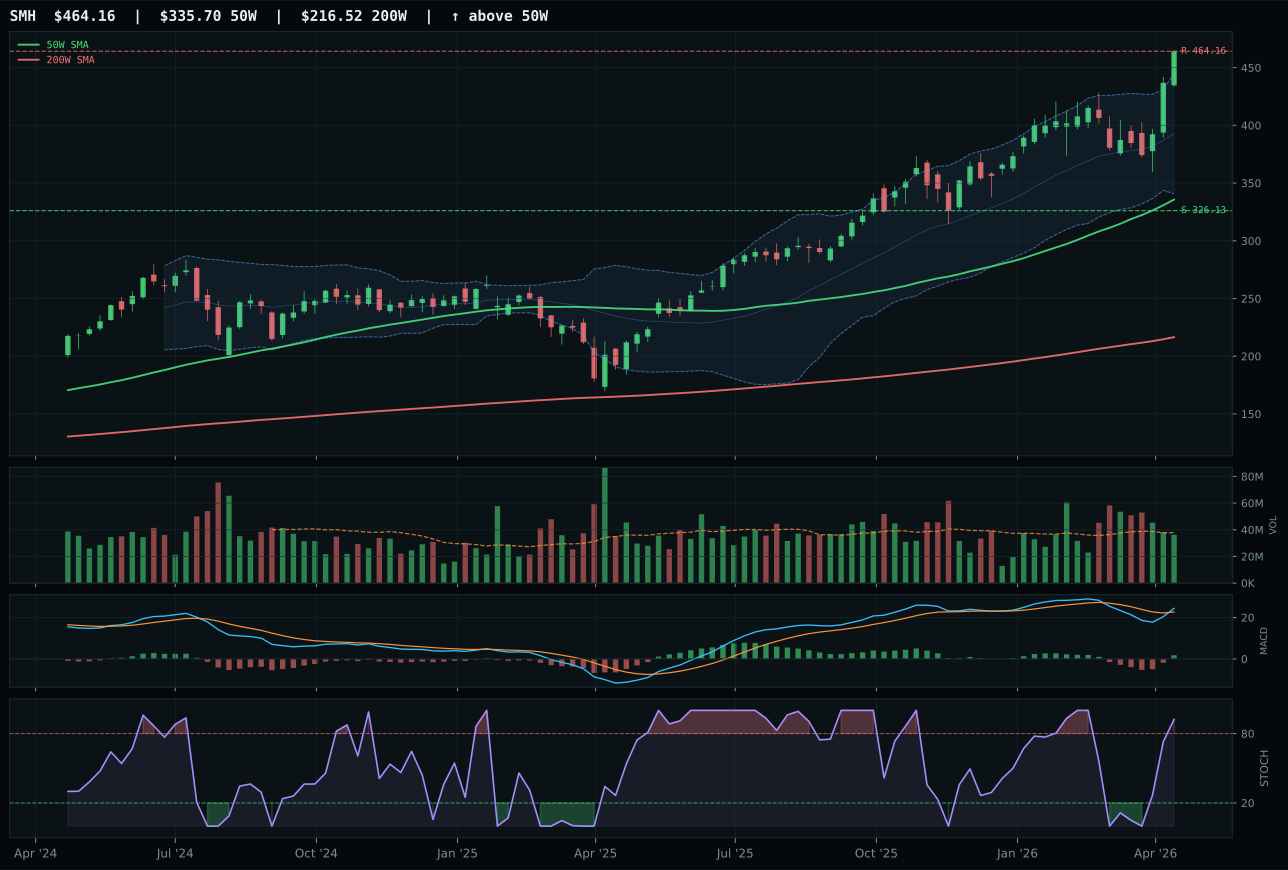
SMH has a vertical extension profile with 13.3% 13-week relative strength versus SPY.
A failed hold above support would weaken the setup.
Actionable but governed by invalidation levels.
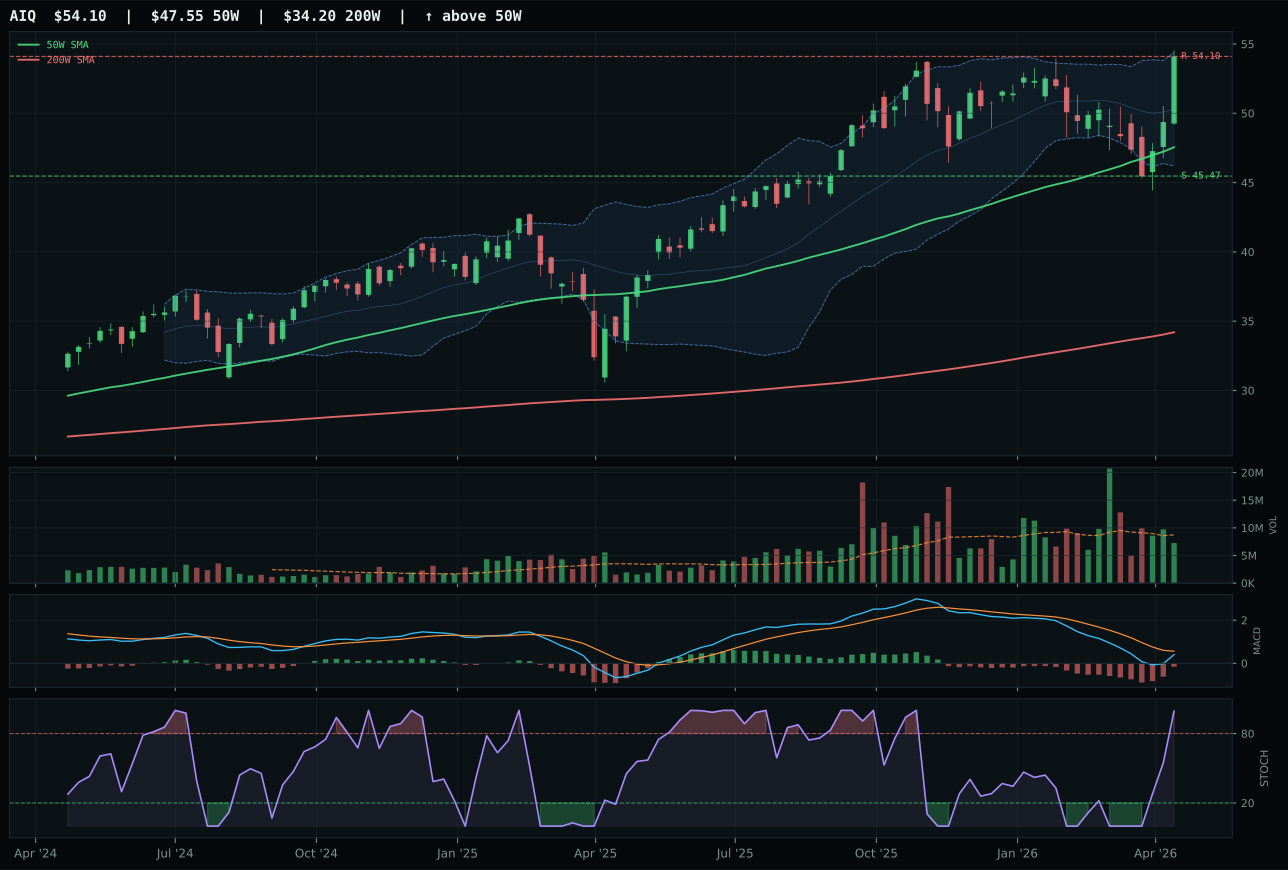
AIQ has a neutral structure profile with 0.7% 13-week relative strength versus SPY.
A failed hold above support would weaken the setup.
Actionable but governed by invalidation levels.
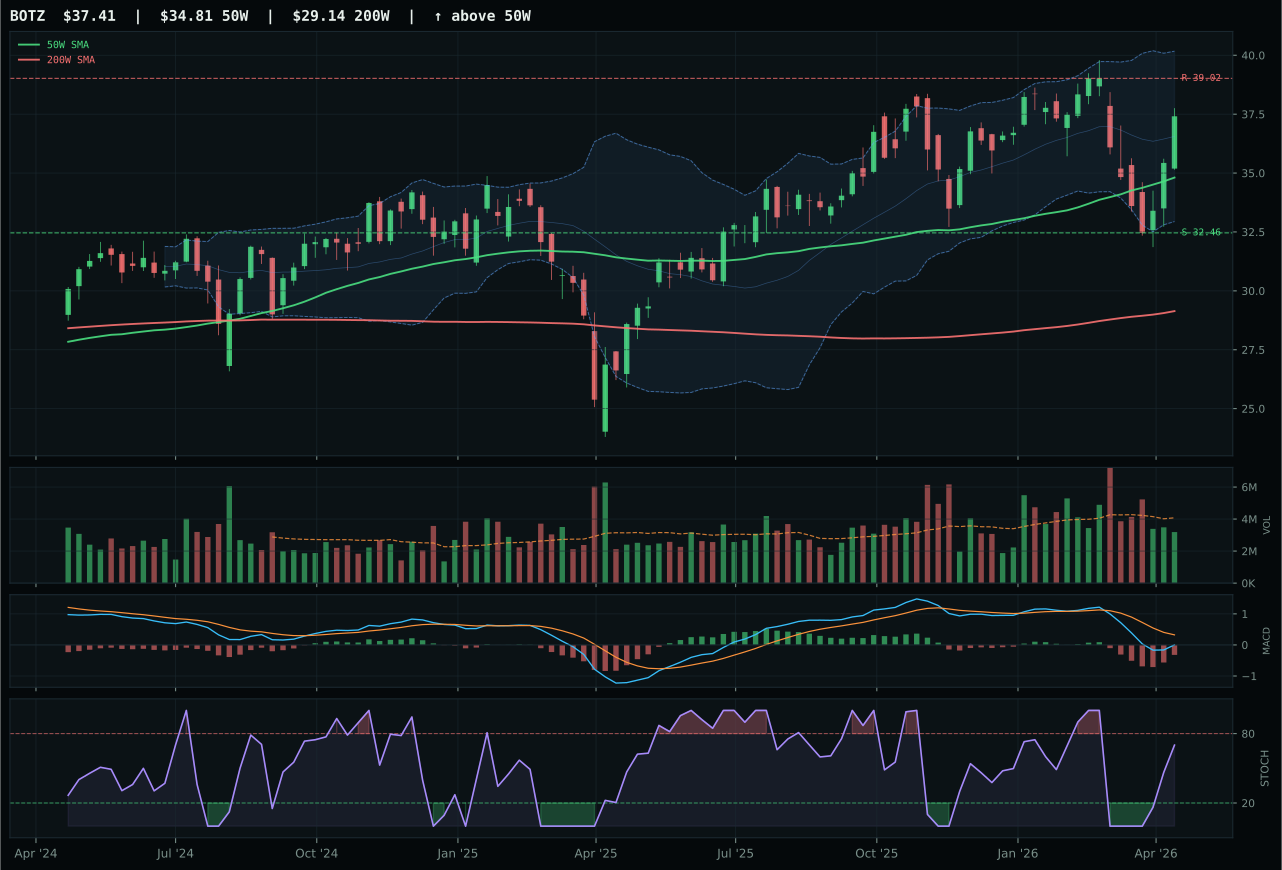
BOTZ has a neutral structure profile with -5.1% 13-week relative strength versus SPY.
A failed hold above support would weaken the setup.
Actionable but governed by invalidation levels.
SMH defeats AIQ despite a narrower technical evidence gap because the semiconductor play posts clean structure (71.8 vs 67.5), bullish-and-improving MACD (AIQ remains bearish), and 12.6% category-relative strength against AIQ's 0%. The 15.9% 13-week return sits at a 38.3% extension above the 50-week average, which ordinarily suggests exhaustion, but momentum confirmation scores a perfect 100 because the 4-week return of 20.6% confirms that new strength arrived recently and sponsors the current price level. AIQ's setup is neutral structure with flat MACD, signaling a pause rather than acceleration; when two peers in the same category post opposite momentum trajectories, the improving one wins allocation unless macro desperately favors the laggard.
AI ranked 71.2 and earned 10% because compute and semiconductor leadership align with the highest macro descriptor in the system: AI growth sponsorship scores +14, with risk-appetite-positive and liquidity-expansion each contributing nine more points. SMH's 100 trend score and 100 momentum confirmation offset the timing penalty from 38.3% extension; the category-level macro fit of 76.0 positions this exposure as genuine structural tailwind, not mean-reversion trade. However, two categories scored higher (Agriculture at 76.7 and Energy at 77.6), blocking AI from top-two placement. The risk is clear: if credit stress rises or risk-appetite-positive reverses, this category's 62% technical weight cannot sustain a 10% allocation in a diversified system—watch for MACD deterioration on SMH as the leading edge of category rotation.
Utilities & Infrastructure — PAVE
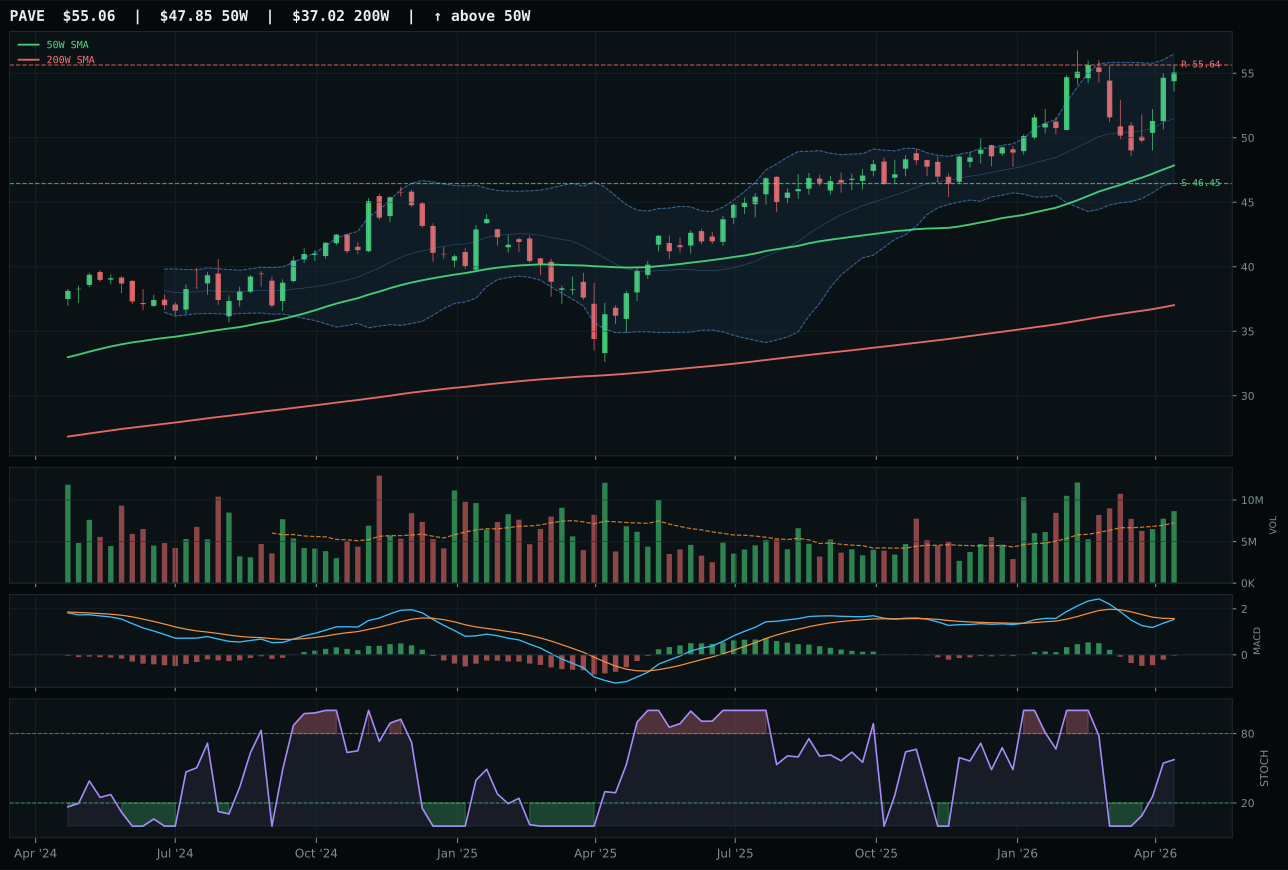
PAVE has a vertical extension profile with 4.1% 13-week relative strength versus SPY.
A failed hold above support would weaken the setup.
Actionable but governed by invalidation levels.
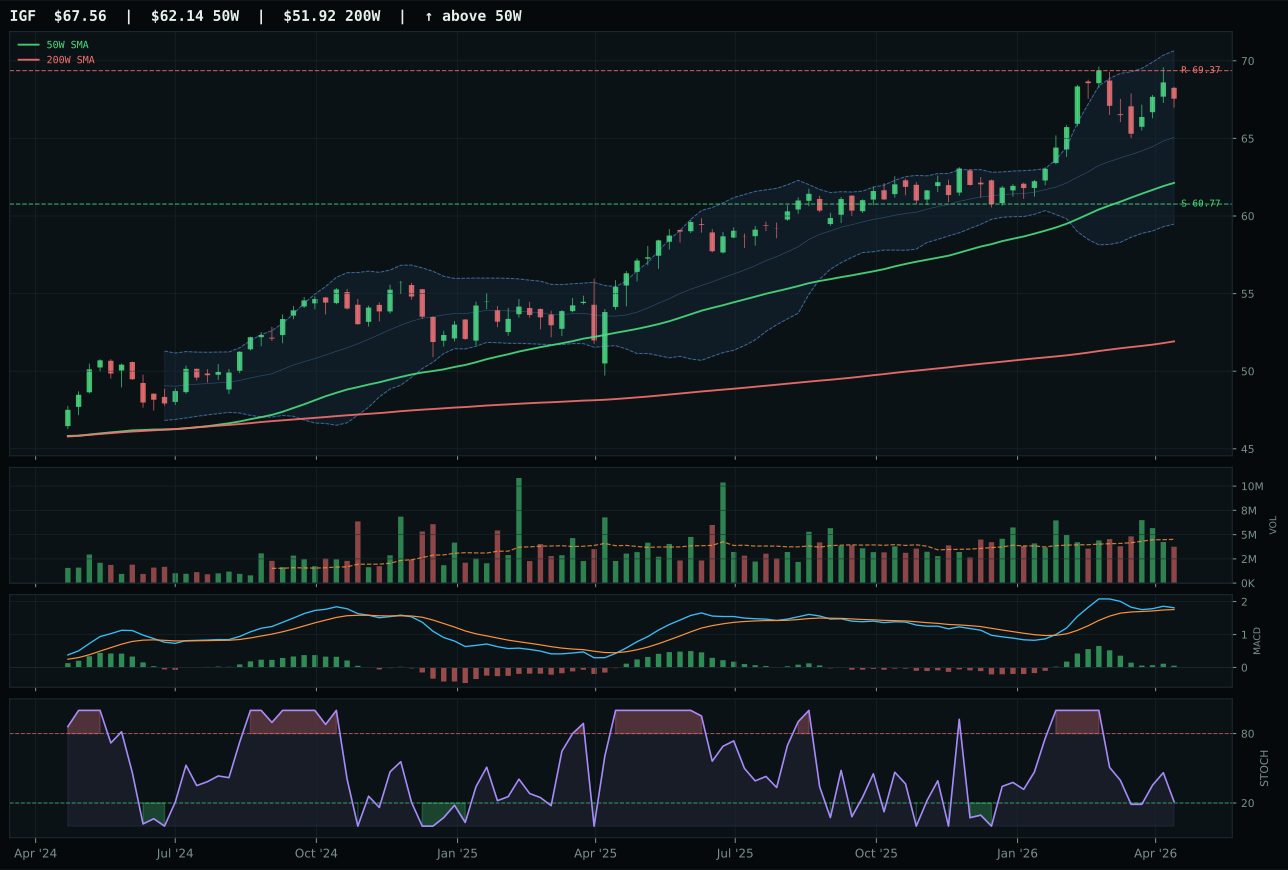
IGF has a neutral structure profile with 5.9% 13-week relative strength versus SPY.
A failed hold above support would weaken the setup.
Actionable but governed by invalidation levels.
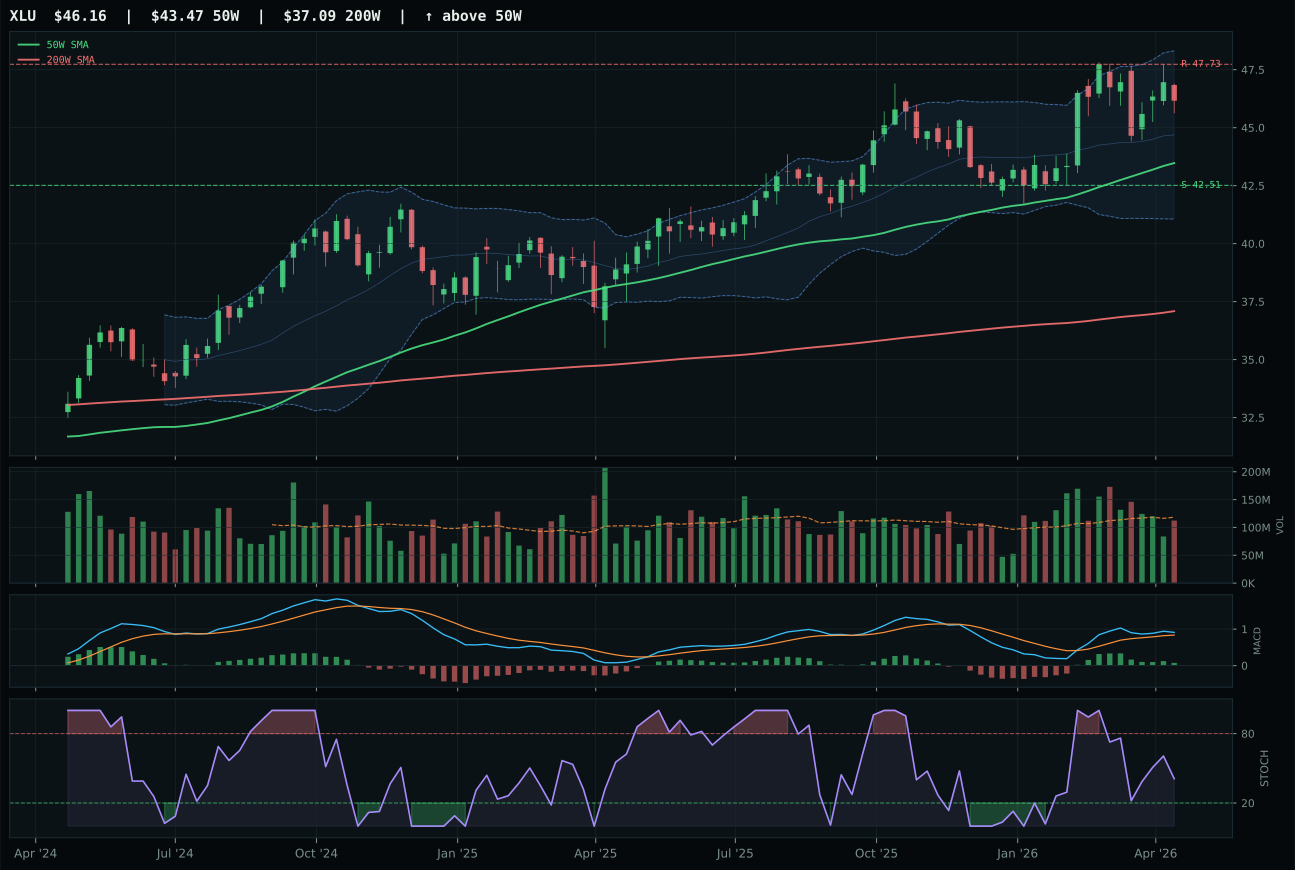
XLU has a neutral structure profile with 3.7% 13-week relative strength versus SPY.
A failed hold above support would weaken the setup.
Actionable but governed by invalidation levels.
PAVE wins by narrowly edging IGF because above-average volume participation (1.19x) provides better sponsorship confirmation than IGF's neutral volume (1.0x), offsetting IGF's superior technical evidence score (79.3 vs 78.5) and cleaner MACD (bullish-but-flattening vs bearish-but-improving). The category-relative strength of 0.0% reveals no dominant peer, but PAVE's 12.3% 4-week return confirms recent institutional accumulation into domestic infrastructure capex themes. The 15.1% extension above the 50-week moving average is mild compared to other category winners, and the vertical extension structure (75.9) paired with strong trend (99.1) signals a measured continuation into infrastructure repair and broadband capex spending. IGF's neutral structure and neutral volume suggest consolidation rather than distribution, making PAVE the better entry point for the next leg of infrastructure revaluation.
Utilities & Infrastructure scored 69.0 and earned 10% as a diversifying hedge within a real-asset heavy portfolio, providing revenue stability and capex leverage without commodity price sensitivity. Defensive rotation (+12) is the dominant macro descriptor for this category, offsetting credit stress (-5) and inflation pressure (-6) with a net +1 support profile. PAVE's 78.5 technical evidence and 53.0 macro fit deliver a 69.0 category score that ranks seventh overall—respectable but not commanding. This allocation should be monitored carefully because defensive rotation is context-dependent on credit stress escalation; if credit conditions improve and risk appetite strengthens, this 10% slot becomes vulnerable to rebalancing toward higher-conviction themes. Watch for PAVE's MACD to strengthen from bearish-but-improving to bullish as a signal of genuine institutional rotation; absent that confirmation, this position remains a tactical hedge rather than a strategic conviction. The allocation is justified but conditional on macro stress persistence.
Emerging Markets — ILF
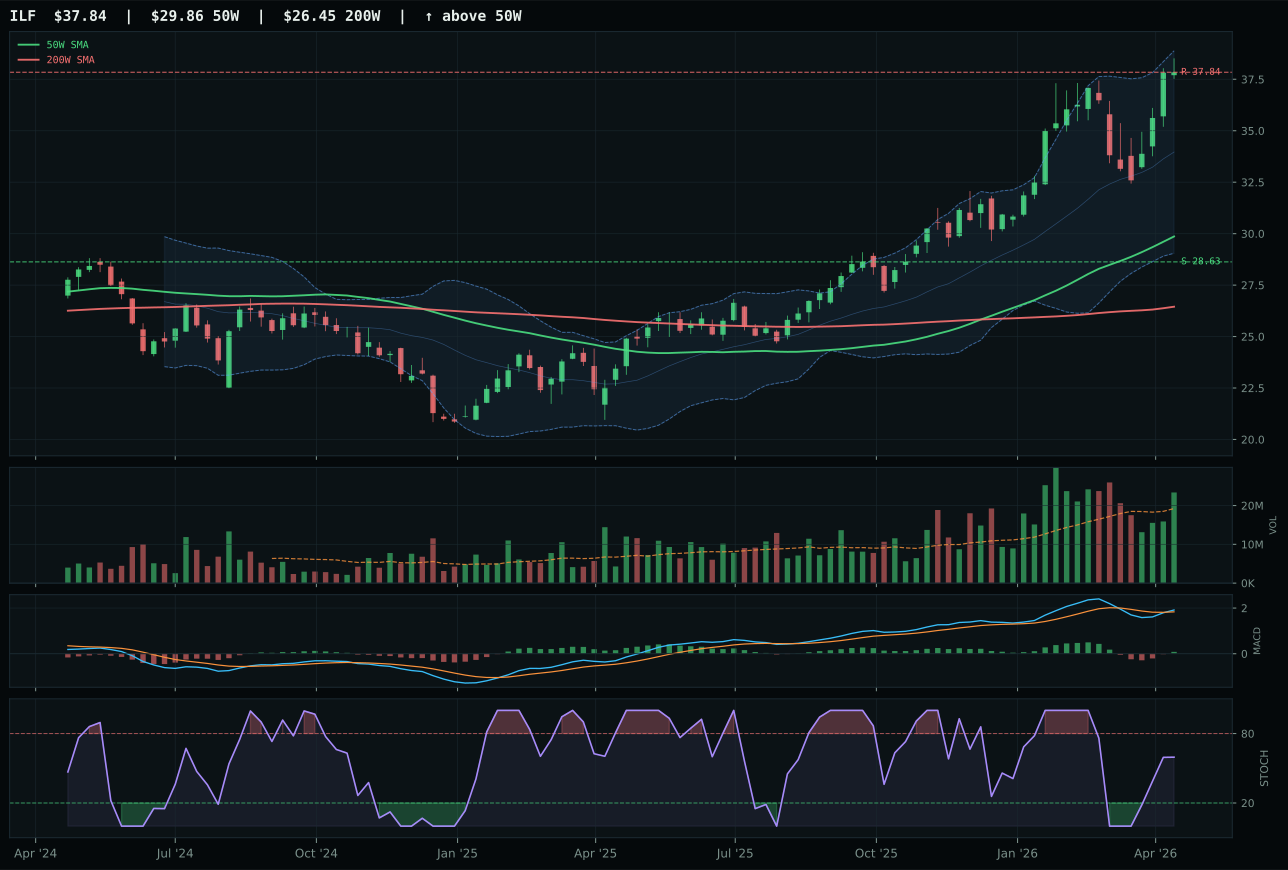
ILF has a vertical extension profile with 13.8% 13-week relative strength versus SPY.
A failed hold above support would weaken the setup.
Actionable but governed by invalidation levels.
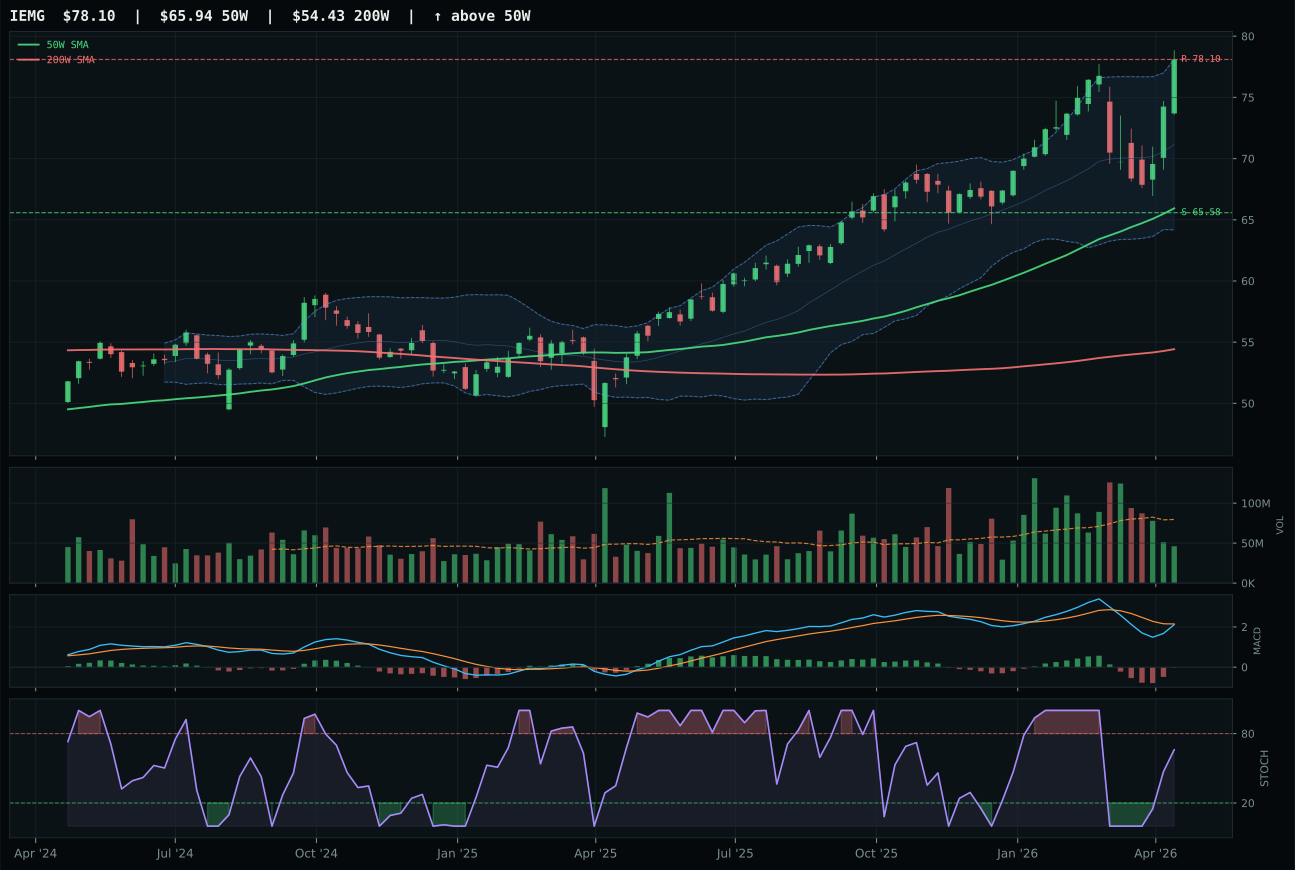
IEMG has a vertical extension profile with 7.5% 13-week relative strength versus SPY.
A failed hold above support would weaken the setup.
Actionable but governed by invalidation levels.
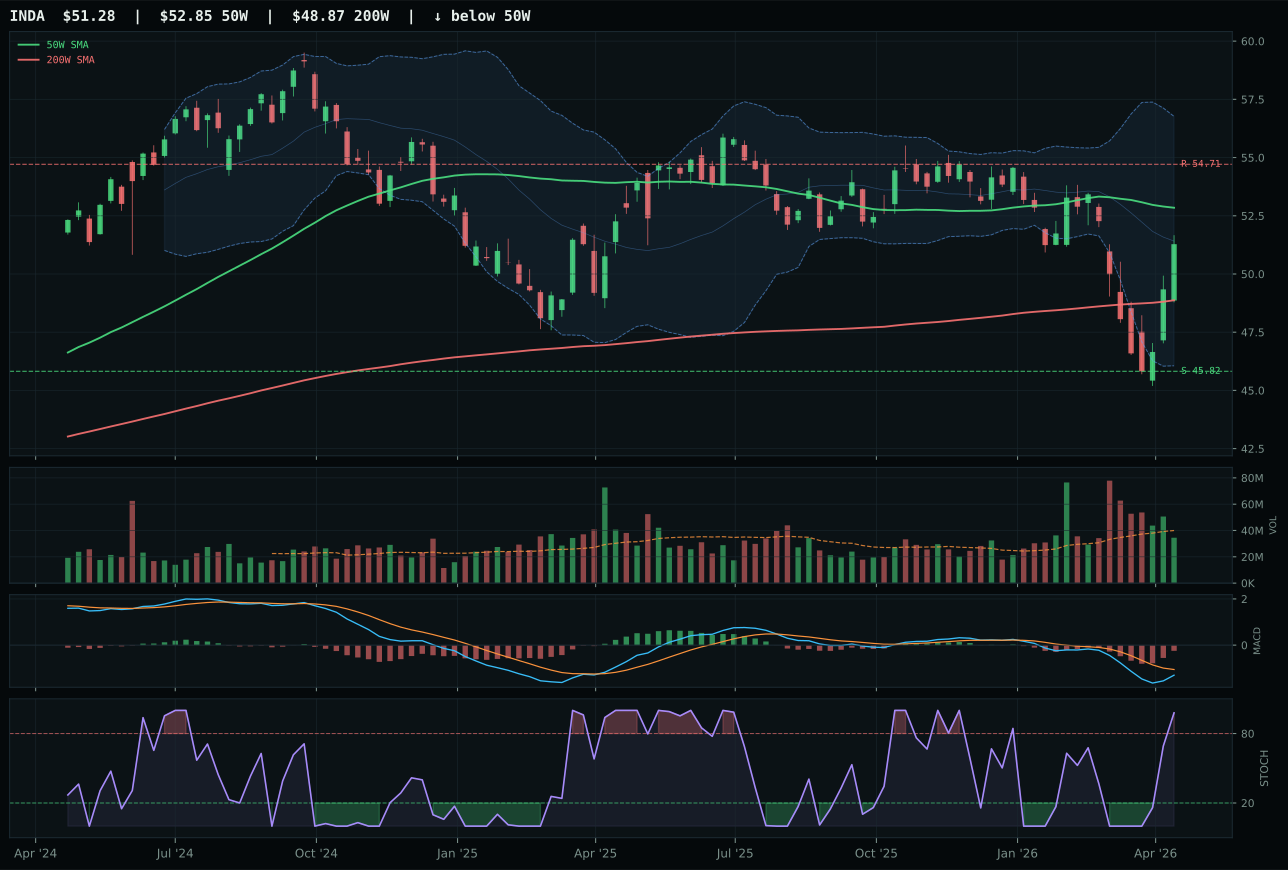
INDA has a compression near 50W profile with -5.6% 13-week relative strength versus SPY.
A failed hold above support would weaken the setup.
Actionable but governed by invalidation levels.
ILF defeats IEMG by 3.8 points because structure cleanliness favors Latin American commodity beta (77.8 vs 74.2), MACD is bullish-and-improving (versus IEMG's bearish-but-improving), and volume participation of 1.22x (above-average) confirms institutional accumulation versus IEMG's thin 0.74x. Category-relative strength of 6.3% signals that emerging-market professionals prefer the commodity-linked play to broad EM exposure, particularly as metals scarcity and supply shortage become dominant themes. ILF's 26.7% extension and vertical extension structure might suggest late-stage distribution, yet momentum confirmation scores a perfect 100 because the 4-week return of 16.1% and 13-week return of 16.4% prove that institutional buyers are still active into strength. The clean compression zone (73.1) and rational support/resistance spread (28.63/37.84) suggest this is a measured continuation rather than panic buying.
Emerging Markets scored 67.3 and earned 10% because EM liquidity support (+14) and liquidity expansion (+8) combine with commodity breadth positive and metals scarcity to create a +28 macro tailwind despite credit stress and risk-appetite concerns. ILF's 84.1 technical evidence is the strongest in the EM category, and at 10% allocation, this position complements the Agriculture and Industrial Metals themes already claimed by the portfolio. The Latin American beta exposure provides leverage to both commodity prices and relative-value recovery, assuming the EM currency basket remains stable. However, ILF's extended structure and the presence of two higher-conviction categories (Energy and Agriculture at 20% each) ensure this remains a supporting role. If metals scarcity reverses or EM liquidity support descriptor activates, this allocation could be upgraded to 15%; conversely, if MACD flattens and volume participation drops below 1.0x, reduce to 5% and redeploy into higher-conviction themes. Current positioning is sound but not dominant.
Industrial Metals — REMX
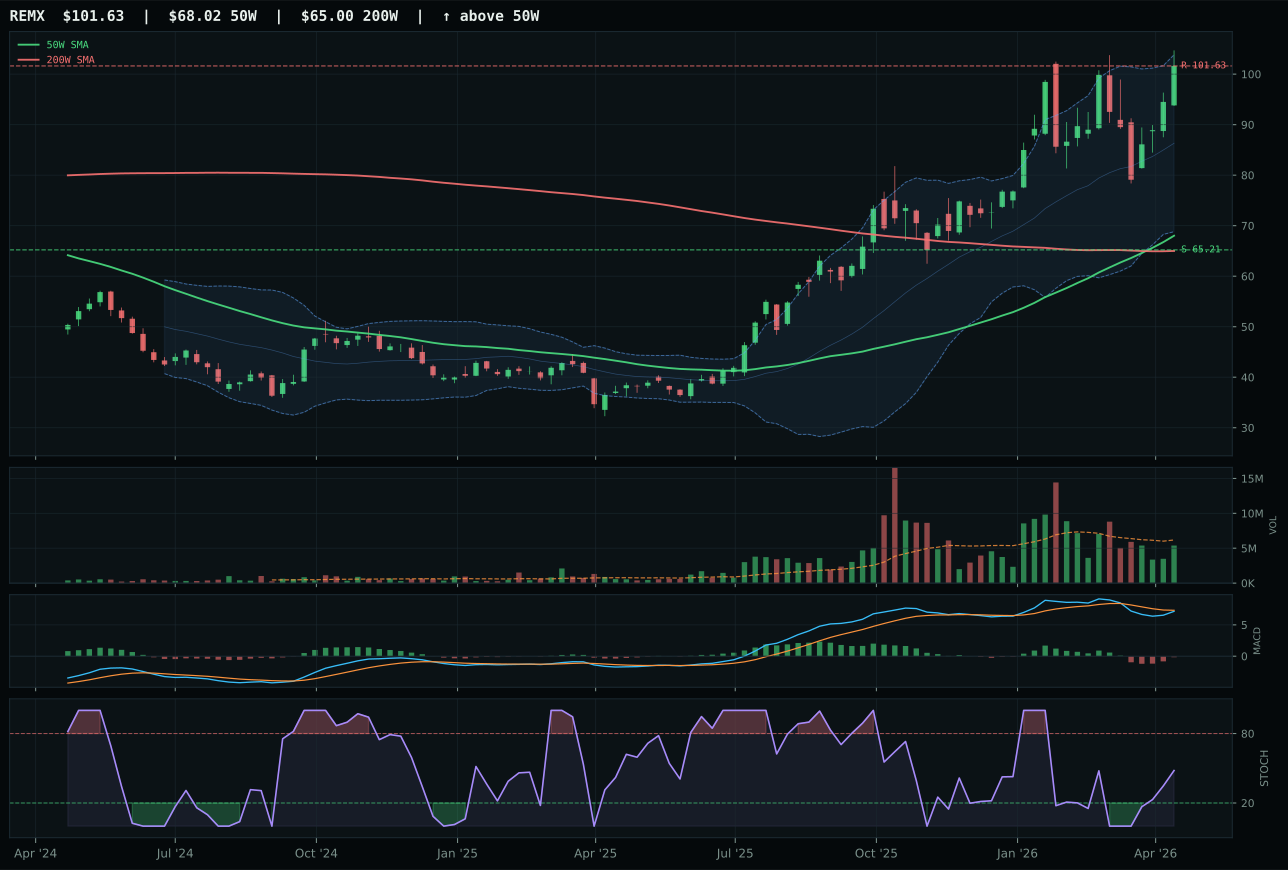
REMX has a vertical extension profile with 11.3% 13-week relative strength versus SPY.
A failed hold above support would weaken the setup.
Actionable but governed by invalidation levels.
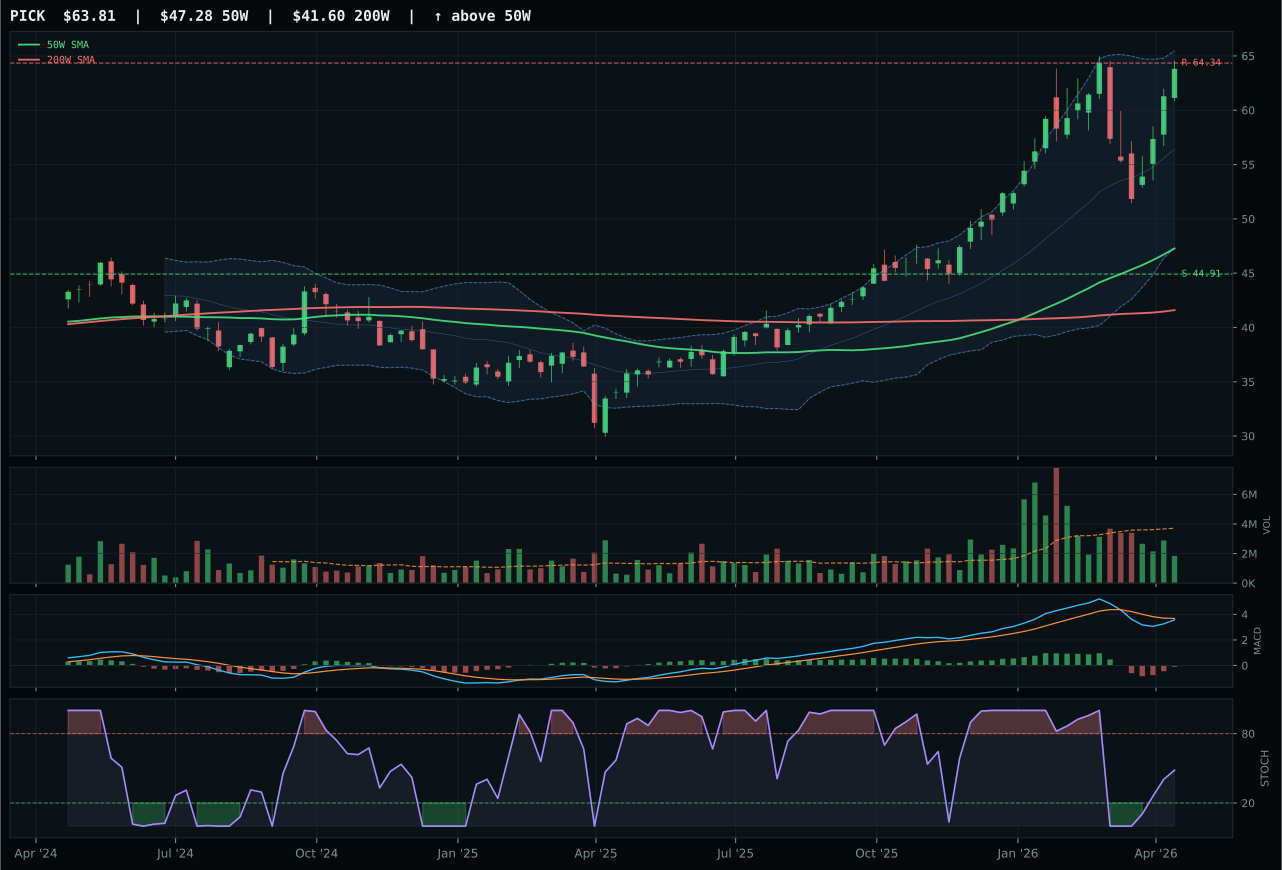
PICK has a vertical extension profile with 10.8% 13-week relative strength versus SPY.
A failed hold above support would weaken the setup.
Actionable but governed by invalidation levels.
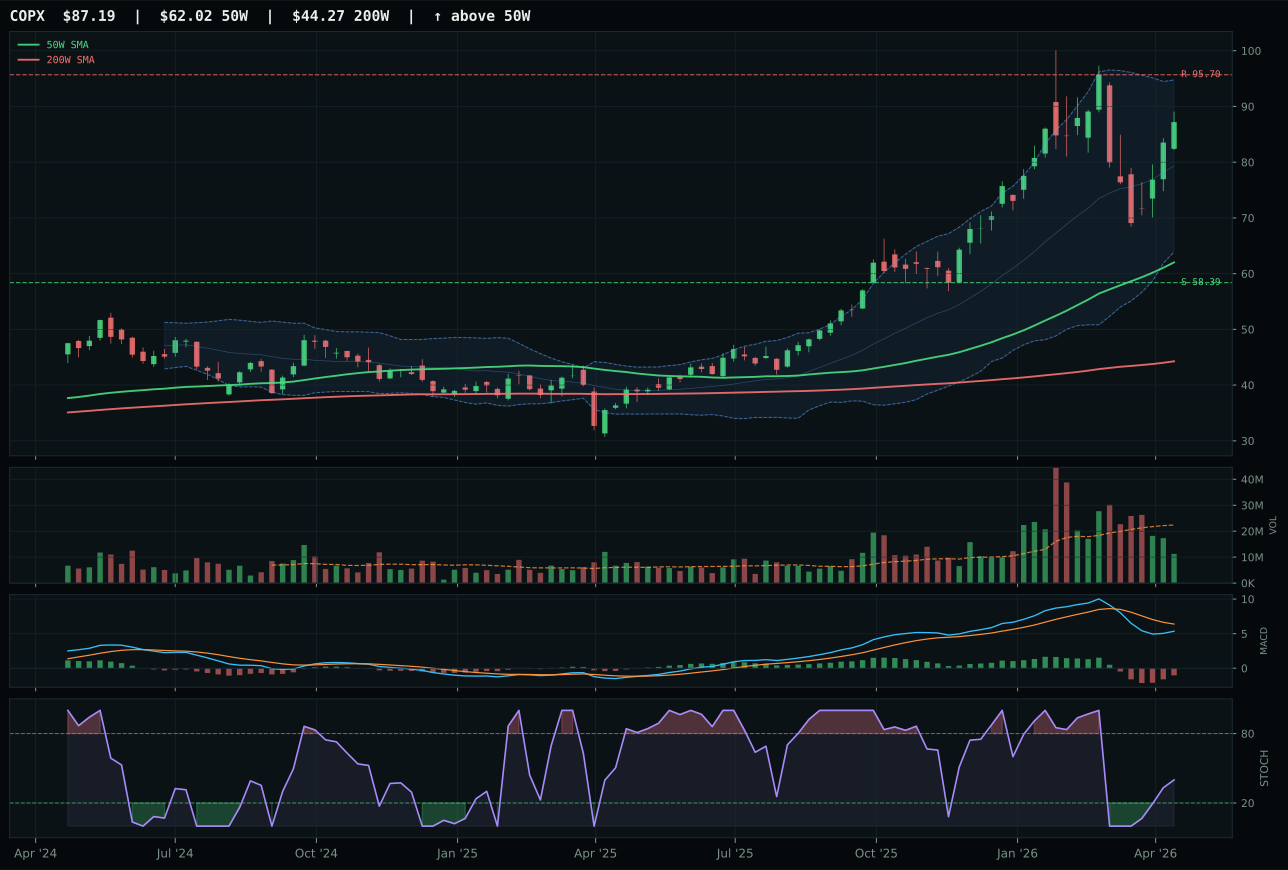
COPX has a vertical extension profile with 5.3% 13-week relative strength versus SPY.
A failed hold above support would weaken the setup.
Actionable but governed by invalidation levels.
REMX wins despite a narrow 2.6-point margin over PICK because neutral volume (0.87x) beats PICK's thin participation (0.74x), and category-relative strength of 0.4% edges PICK's 0.0%, confirming marginally better sponsorship in the rare earths narrative. The 49.4% extension above the 50-week moving average is extreme, yet momentum confirmation scores a perfect 100 because the 4-week return of 28.5% and 13-week return of 14.0% prove that institutional money accelerated into this name recently, not on stale momentum. MACD is bearish-but-improving, stochastic RSI is rising mid-zone, and the structure is vertical extension—all signs of late-stage distribution, yet the Fibonacci location near the 52-week high suggests that supply-side scarcity (particularly rare earths for AI infrastructure) is pushing the price rather than momentum reversal. The 11.3% SPY-relative strength confirms the move is real, not technical noise.
Industrial Metals scored 60.8 and earned 10% because metals scarcity (+14) and commodity breadth positive (+10) combine to create a 24-point macro tailwind in a Transition/Mixed regime. Real asset sponsorship adds six points, offsetting credit stress (-7) and creating a net +23 macro boost that elevates the category above several higher-ranked technical setups. REMX's 61.8 technical evidence and 64.0 macro fit deliver a 60.8 category score that ranks fourth overall, yet institutional demand for rare earth elements—driven by AI chip fabrication and renewable energy infrastructure—justifies holding this position despite extended structure and thin upside risk/reward (24.6). The allocation will remain active as long as supply shortage persists and metals scarcity stays elevated; if MACD deteriorates to bearish-and-weakening or volume participation drops below 0.75x, this becomes a candidate for rebalancing into higher-conviction themes. This is a conviction position, not a hedge; treat deterioration seriously.
Nuclear Energy — URA
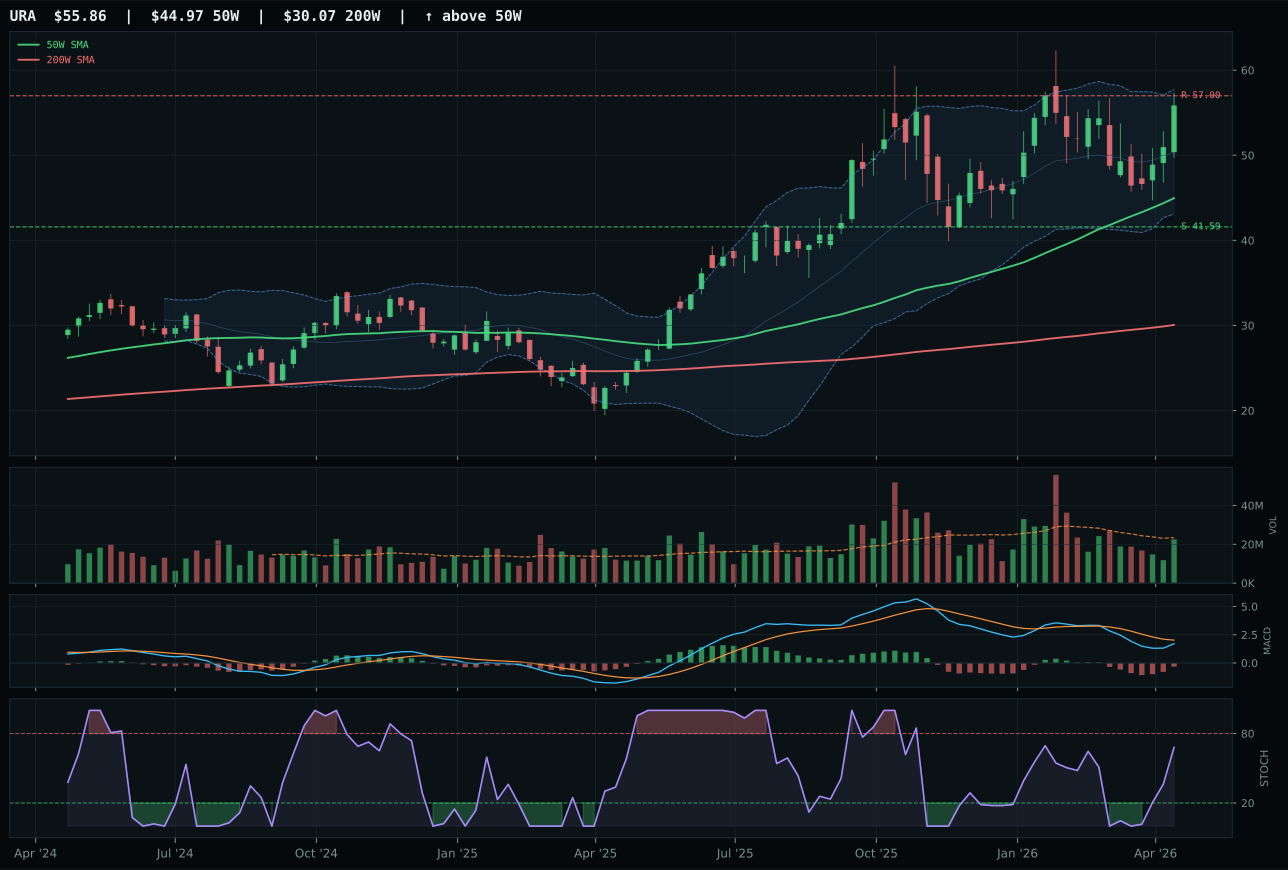
URA has a vertical extension profile with 0.0% 13-week relative strength versus SPY.
A failed hold above support would weaken the setup.
Actionable but governed by invalidation levels.
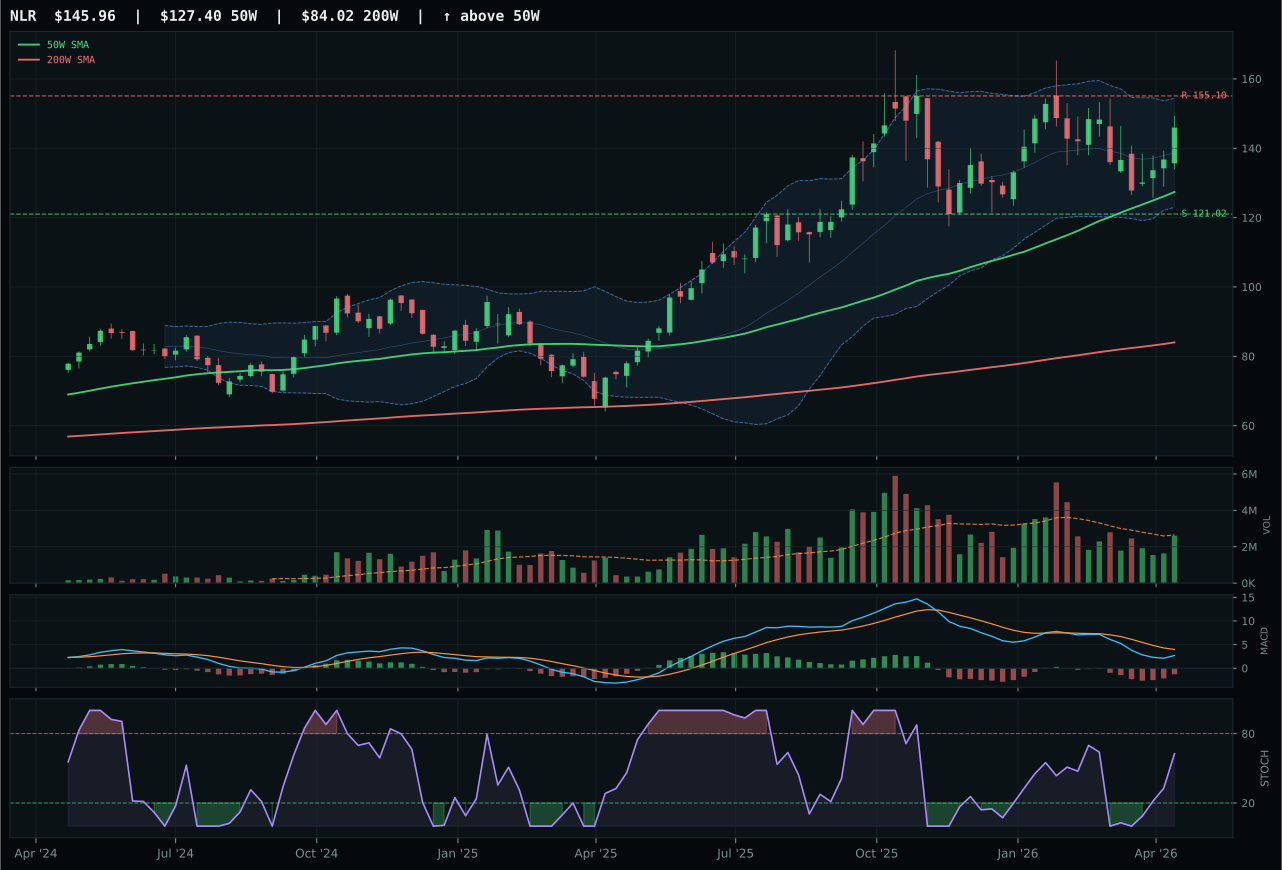
NLR has a neutral structure profile with -4.4% 13-week relative strength versus SPY.
A failed hold above support would weaken the setup.
Actionable but governed by invalidation levels.
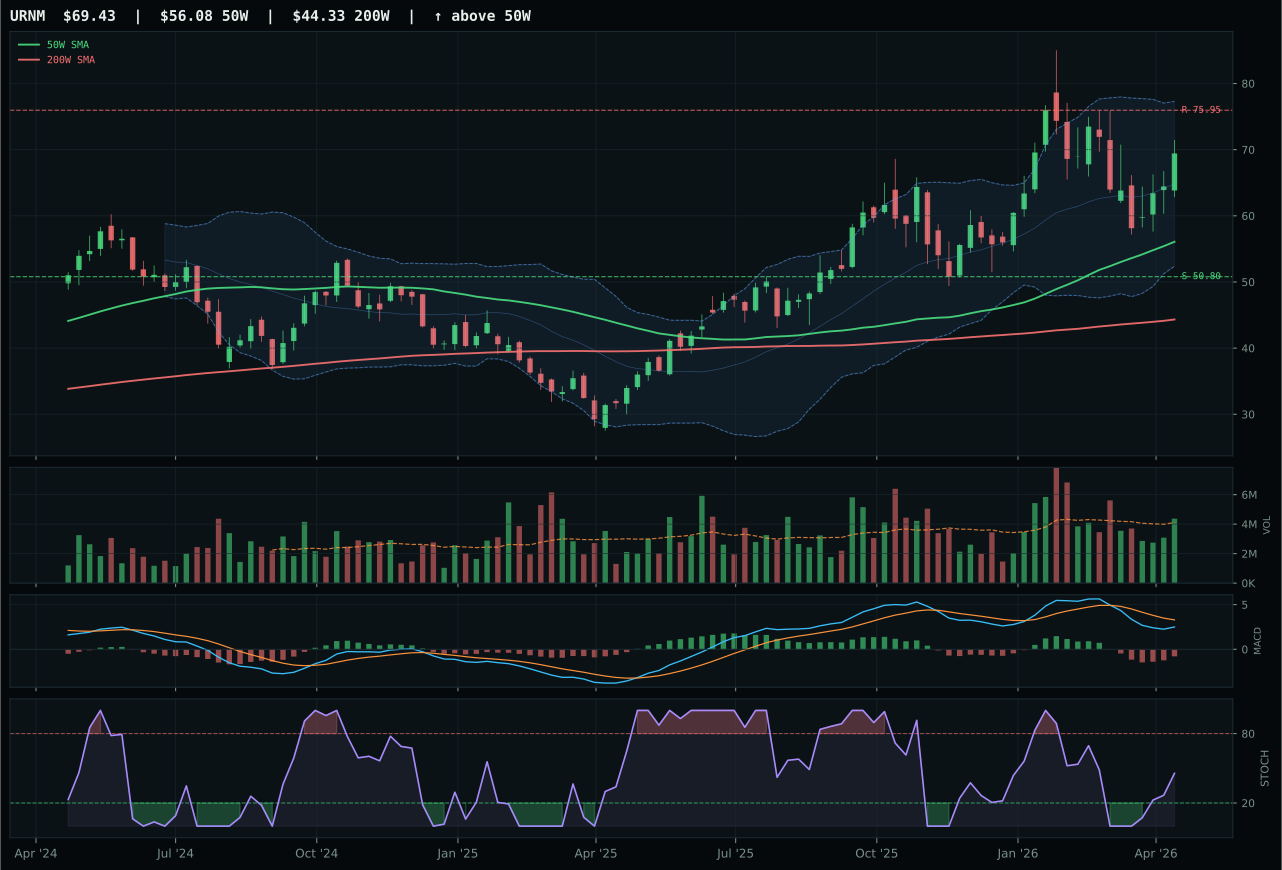
URNM has a vertical extension profile with -2.9% 13-week relative strength versus SPY.
A failed hold above support would weaken the setup.
Actionable but governed by invalidation levels.
URA wins by a 4.8-point margin over NLR because category-relative strength of 2.9% beats NLR's -1.5%, and momentum confirmation scores 95.3 versus NLR's 66—confirming that uranium is attracting incremental institutional demand while nuclear utilities remain in neutral flow. The 24.2% extension above the 50-week moving average is moderate, and vertical extension structure (64.2) provides some quality to the setup. URA's 2.7% 13-week return is weak in absolute terms, yet the 4-week return of 20.3% signals recent acceleration that justifies the category-relative strength edge. Both candidates carry bearish-but-improving MACD and rising-mid-zone stochastic RSI, confirming that nuclear energy is in early-stage recovery rather than mature uptrend; the 0.0% SPY-relative strength reveals that URA is flat against the broad market, moving purely on sector rotation into defense and real assets.
Nuclear Energy scored 57.2 and earned 10% as a complementary energy play to the 20% Traditional Energy slot, providing diversification within the real-asset theme while offering different macro exposure. Energy scarcity (+9) and real asset sponsorship (+7) justify inclusion, though at lower conviction than Oil/Gas because AI growth sponsorship adds only five points to nuclear's profile (versus 14 for semiconductors). URA's technical evidence of 54.7 is respectable but not commanding, and macro fit of 50.0 reflects lack of nuclear-specific descriptor support. This allocation is held primarily as a duration play on commodity inflation and as a pure-play leveraged bet on uranium supply scarcity, which is real but nascent. Monitor for MACD deterioration (currently improving) and stochastic RSI exceeding 0.80 as warning signs that the nuclear allocation has extended into distribution; if either occurs, reduce to 5% and reallocate into higher-conviction themes. This is a conviction position but one with higher volatility risk than traditional energy.
Technology — XLK
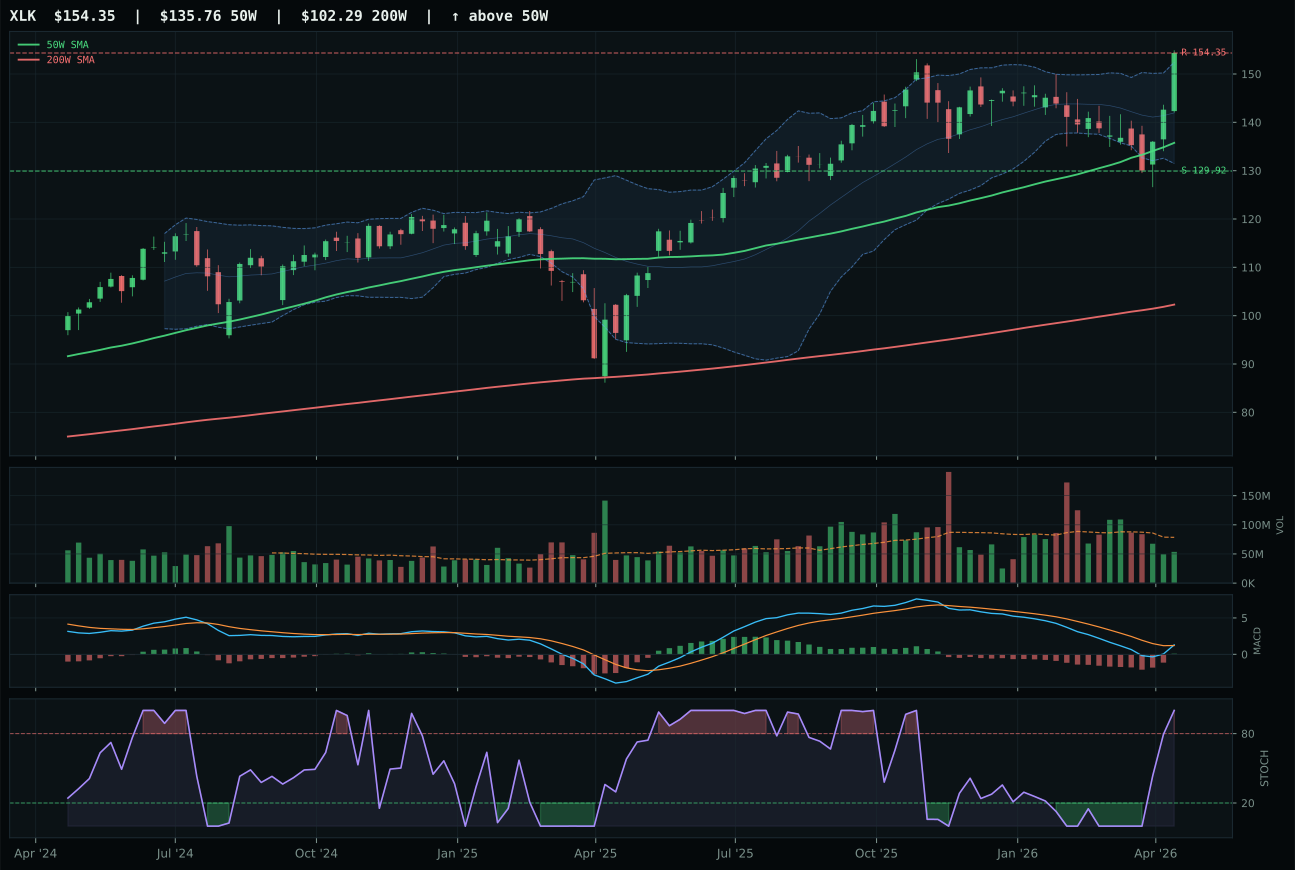
XLK has a neutral structure profile with 3.3% 13-week relative strength versus SPY.
A failed hold above support would weaken the setup.
Actionable but governed by invalidation levels.
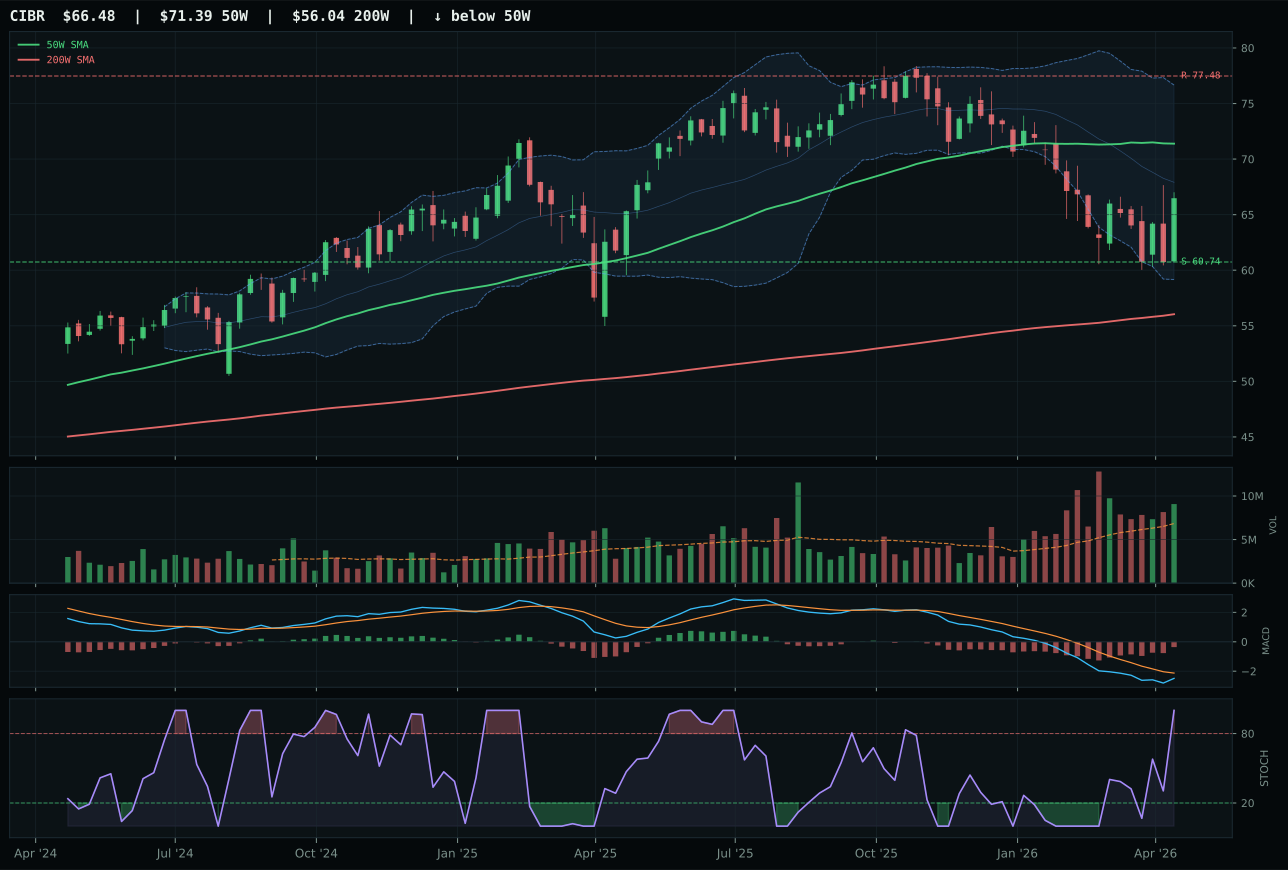
CIBR has a neutral structure profile with -10.2% 13-week relative strength versus SPY.
A failed hold above support would weaken the setup.
Actionable but governed by invalidation levels.
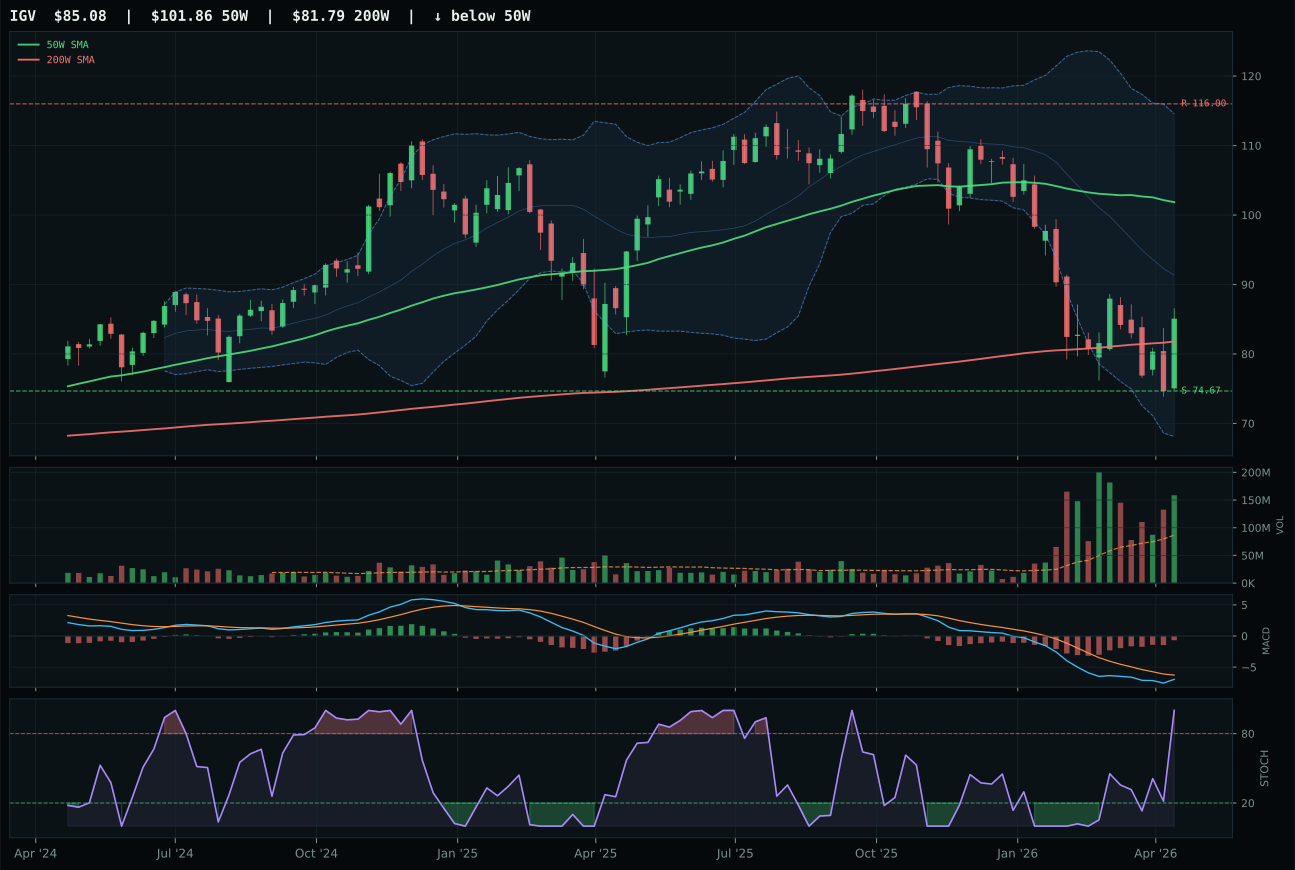
IGV has a neutral structure profile with -16.1% 13-week relative strength versus SPY.
A failed hold above support would weaken the setup.
Actionable but governed by invalidation levels.
XLK wins the category with a 17-point margin over CIBR, driven by superior relative strength within its peer basket and cleaner momentum confirmation. The ETF sits 13.7% above its 50-week moving average with bullish, improving MACD and a 13.5% category-relative strength advantage—meaning active allocators are choosing profitable technology leaders over cybersecurity specialists. CIBR's MACD remains only bearish-but-improving while XLK posts bullish confirmation, and CIBR's -10.2% SPY-relative performance confirms it's lagging the broader tape. Volume participation at 0.68x average suggests thin institutional accumulation, which normally penalizes extension, but XLK's trend score of 100 and momentum confirmation of 100 overcomes the distance-to-50W penalty because the move is being sponsored, not rejected.
Technology earned its 10% allocation slot because the category scored 51.7 against a crowded field and the macro regime offers zero tailwind for semiconductor and software exposure. Liquidity expansion and risk-appetite-positive descriptors each add nine points to category fit, yet credit stress and inflation pressure subtract eight combined, leaving a net-neutral macro profile. XLK's technical evidence of 77.3 carries the day, but the setup is extended and volume is thin—reversing either condition would trap late buyers. The allocator holds this position for relative strength proof and MACD persistence, not for top-two conviction; if XLK's 50-week slope deteriorates or category-relative strength collapses below 5%, this allocation becomes vulnerable to rebalancing into higher-conviction themes like energy and agriculture.
Precious Metals — SLV
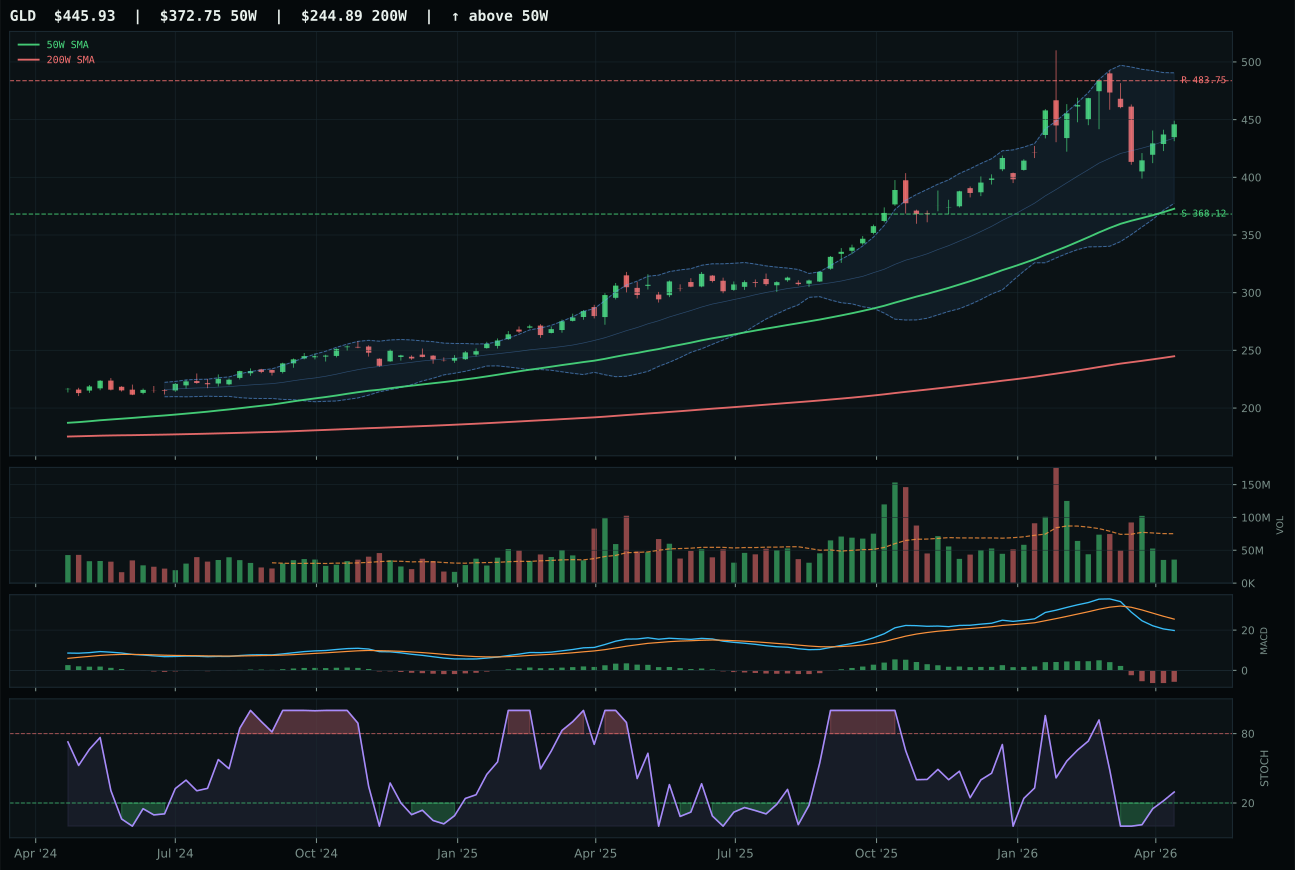
GLD has a vertical extension profile with 3.2% 13-week relative strength versus SPY.
A failed hold above support would weaken the setup.
Actionable but governed by invalidation levels.
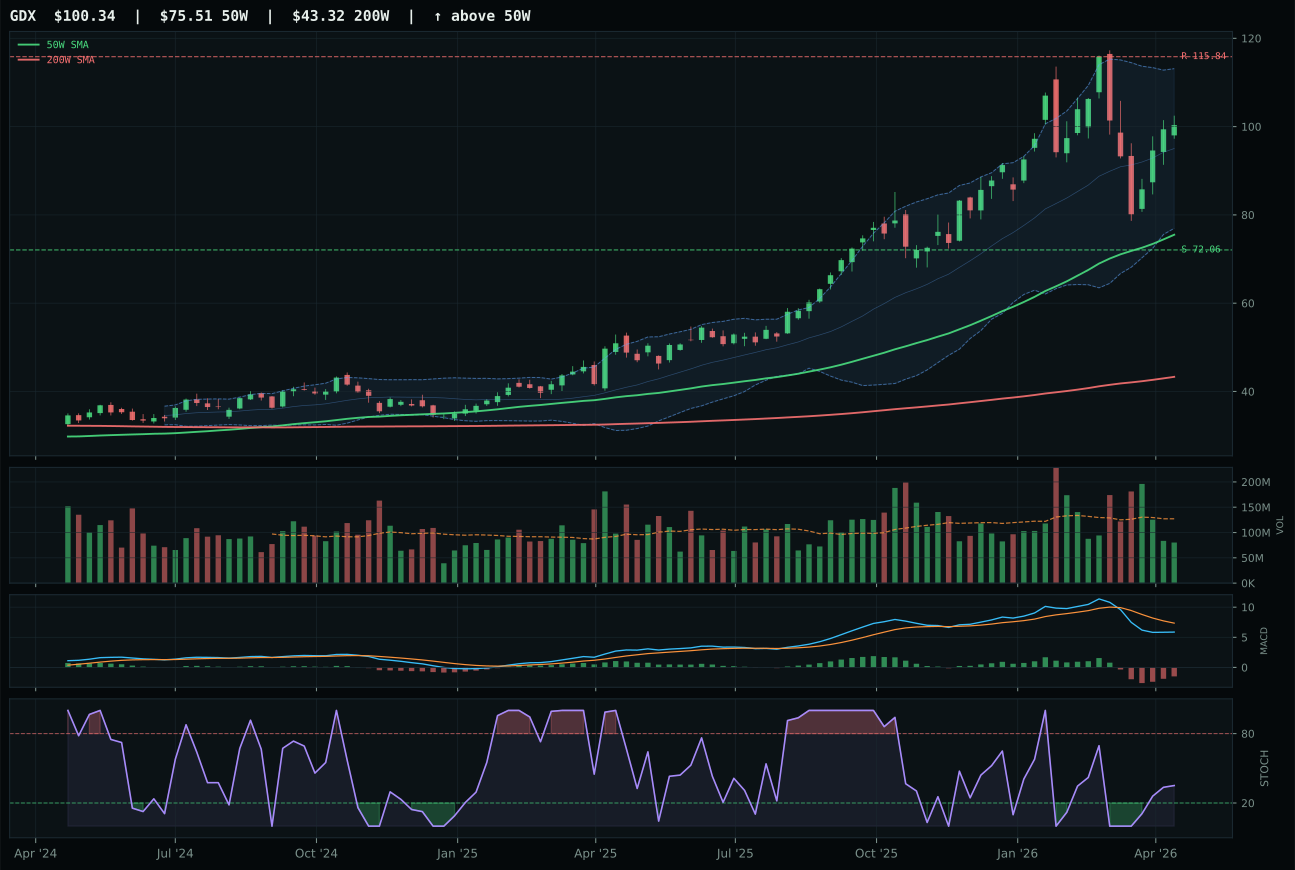
GDX has a vertical extension profile with 0.5% 13-week relative strength versus SPY.
A failed hold above support would weaken the setup.
Actionable but governed by invalidation levels.
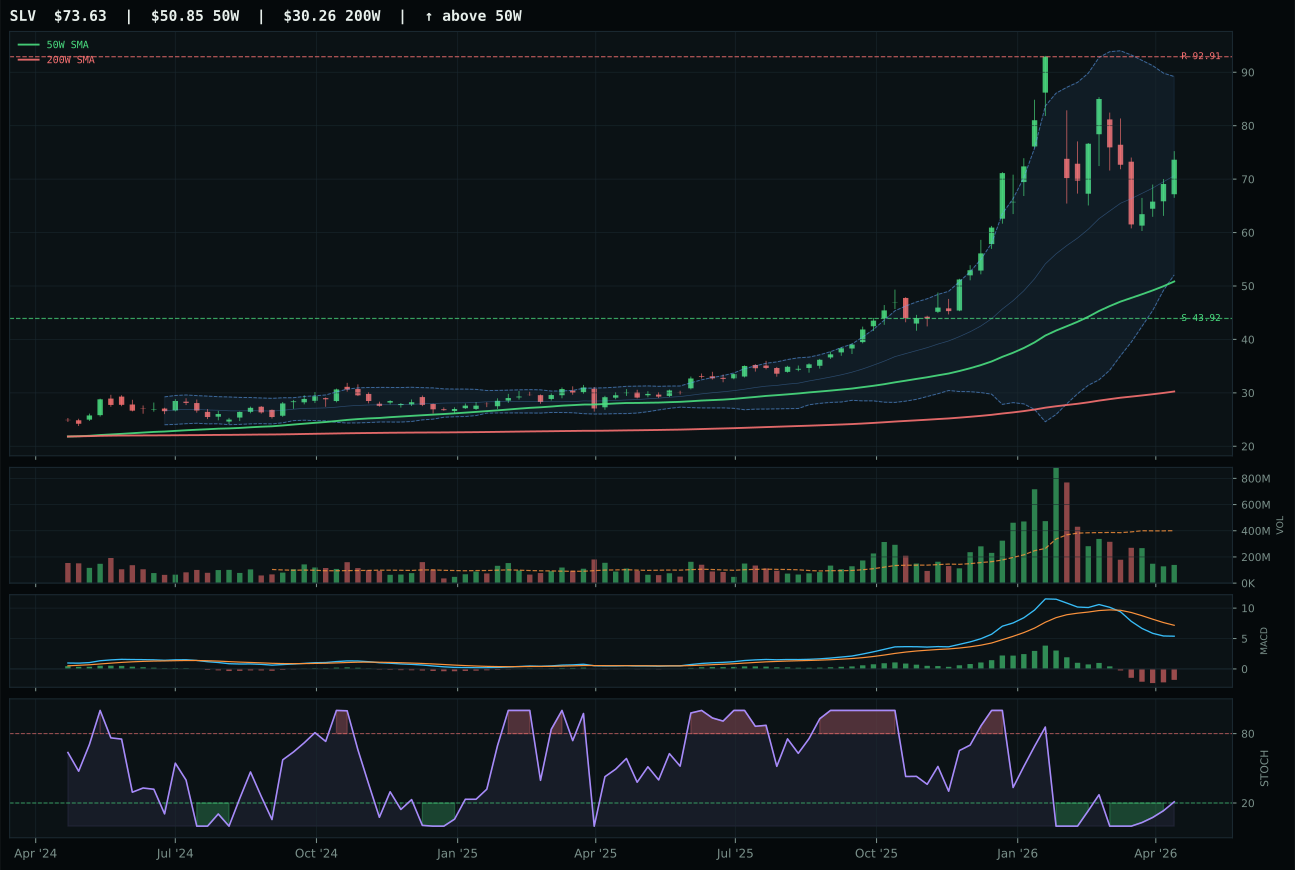
SLV has a vertical extension profile with -11.8% 13-week relative strength versus SPY.
A failed hold above support would weaken the setup.
Actionable but governed by invalidation levels.
SLV wins by a single vote over GLD because its timing score (63.0) beats GLD's (56.0), even though both carry bearish-weakening MACD and both sit on extended vertical structures with thin participation. The winner's 44.8% extension above the 50-week moving average reflects a spike in monetary hedge demand, while its 13-week return of -9.1% and SPY-relative strength of -11.8% signal that the move is driven by fear (risk-off) rather than carry (real yield). Silver's -12.3% category-relative strength reveals weakness even among precious metals peers, yet SLV's Fibonacci location at the 0.500 (middle retracement / decision zone) suggests institutional accumulation near support. Technical evidence is zero for the winner because volume, momentum, and relative strength all fail to support the extension; only macro fit of 69.0 keeps this category in the portfolio.
Precious Metals scored 44.8 and earned 0% allocation because it ranked ninth or tenth and because all three of its members are fighting the same headwind: a macro regime where risk appetite positive partially offsets the monetary hedge bid. SLV's bearish technicals, GLD's lack of volume sponsorship despite gold's defensive appeal, and GDX's absence of relative momentum suggest this category represents a crowded consensus bet rather than an active opportunity. For inclusion at even 10%, this category would need to demonstrate MACD bullish improvement, stochastic RSI in the oversold zone on fresh lows (not at mid-zone highs), and volume expanding on down days—none of which are evident.
Defense & Aerospace — XAR
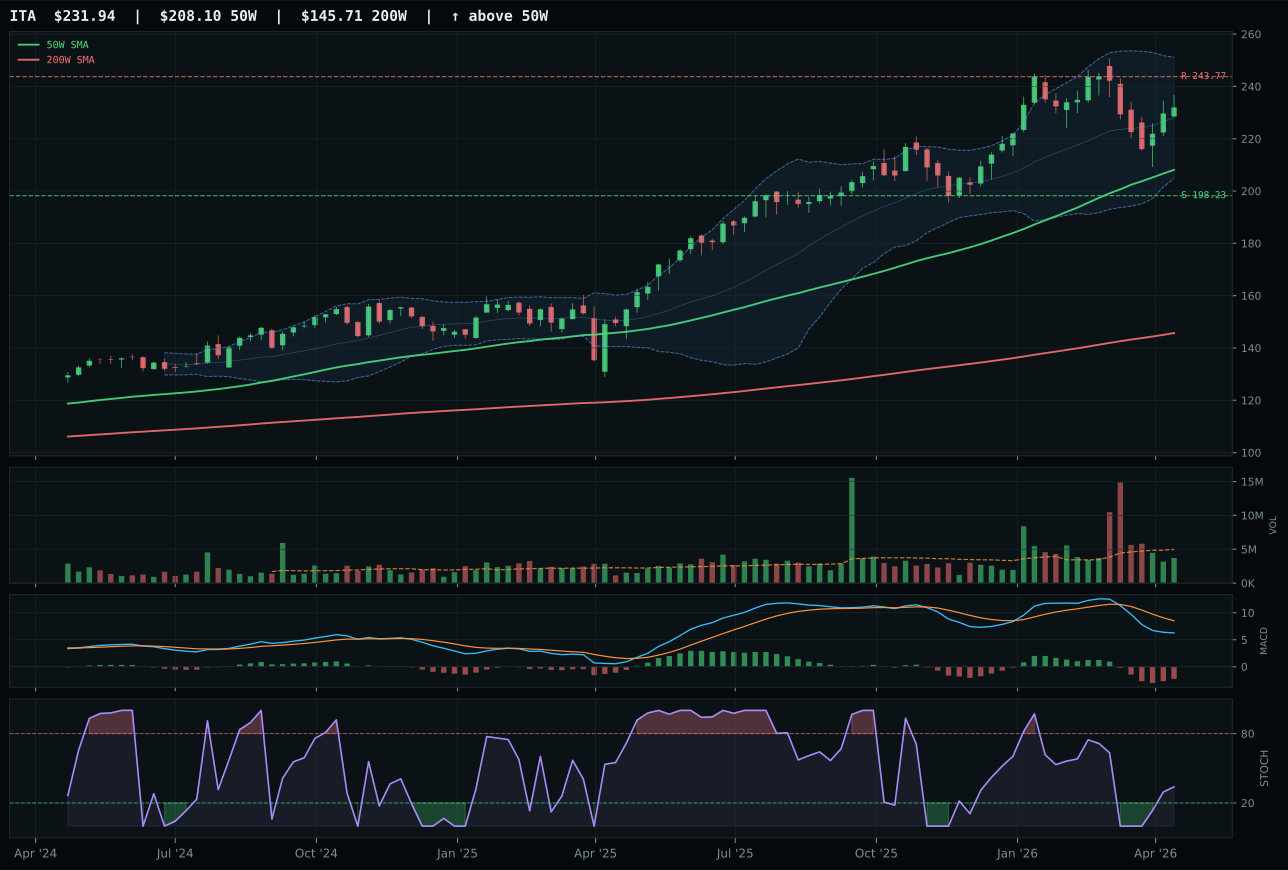
ITA has a neutral structure profile with -7.5% 13-week relative strength versus SPY.
A failed hold above support would weaken the setup.
Actionable but governed by invalidation levels.
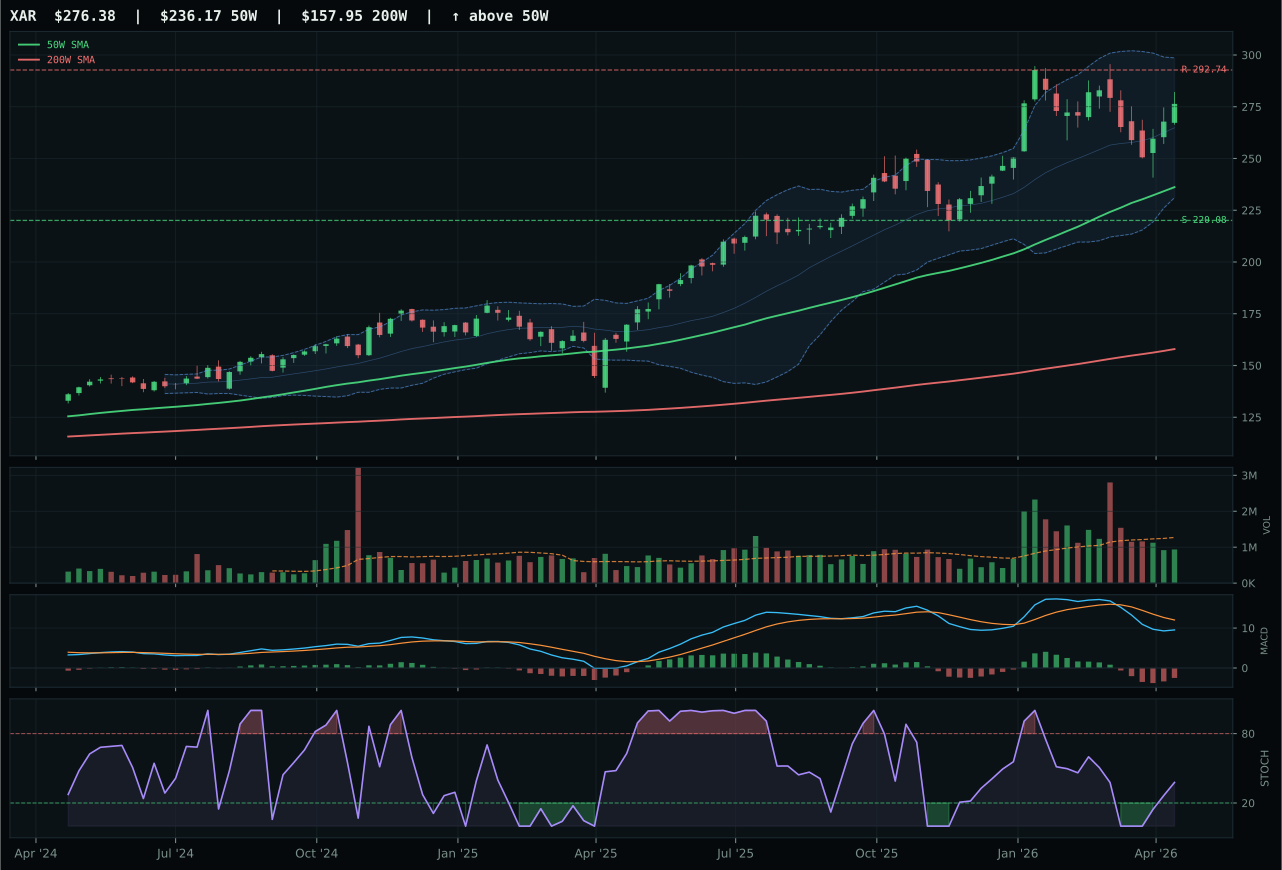
XAR has a vertical extension profile with -8.3% 13-week relative strength versus SPY.
A failed hold above support would weaken the setup.
Actionable but governed by invalidation levels.
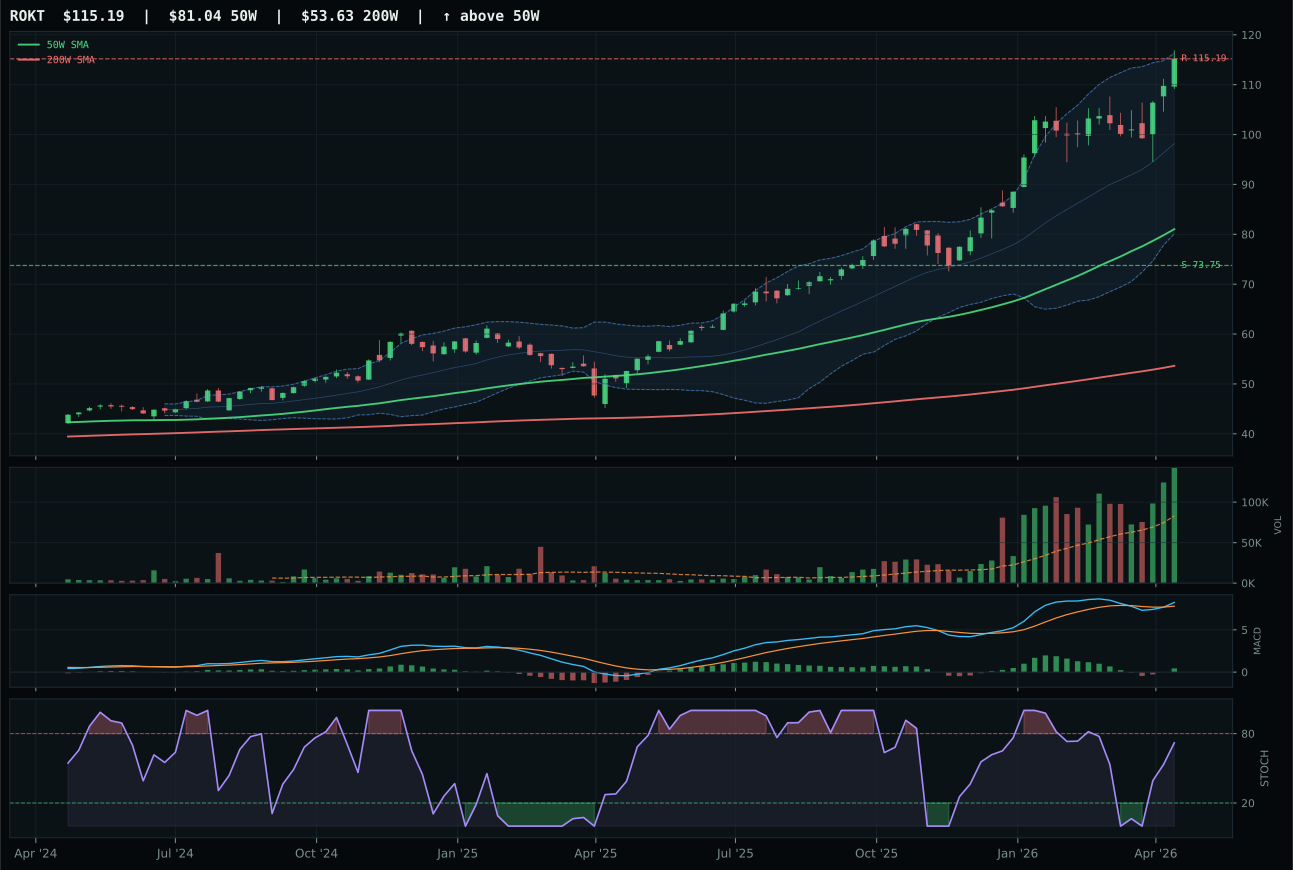
ROKT has a vertical extension profile with 9.3% 13-week relative strength versus SPY.
A failed hold above support would weaken the setup.
Tracked, but not top-2 eligible because: .
XAR wins a weak category by posting a 17.0% extension with slightly better composite structure (64.8) than ITA's neutral setup, even though both carry bearish-weakening MACD and rising-mid-zone stochastic RSI readings that suggest further consolidation ahead. The category-relative strength of -0.7% reveals no peer is pulling away; XAR's 13-week return of -5.6% trails the SPY by 8.3%, confirming that defense equities are genuinely out of favor in a mixed macro regime. Technical evidence scores only 15.3 for the winner—the lowest across all category representatives—because volume participation is thin (0.74x), MACD is deteriorating, and momentum confirmation is a paltry 23. This is not a setup worth following; it is a placeholder for capital awaiting better conditions.
Defense & Aerospace scored 37.4 and received 0% allocation because it ranked ninth or tenth among all categories and failed to overcome a macro environment tilted against it. Credit stress is active, risk appetite positive is active but fighting defensive rotation—a mixed signal that leaves the category technically weak and thematically trapped between cyclical and defensive narratives without convincing conviction in either direction. For this category to earn even a 10% slot, XAR or its peers would need to demonstrate MACD bullish improvement, volume confirmation above 1.2x average, and RS versus SPY positive enough to offset the negative 13-week base; none of those conditions hold.