
2026-04-10
Informational purposes only. The content in this report, including allocations, analysis, and commentary, is provided solely for informational and educational purposes. It does not constitute financial advice, investment advice, trading advice, or any other type of advice. Past performance does not guarantee future results. Always conduct your own research and consult a qualified financial professional before making investment decisions.
Weekly Allocation
| Ticker | Category | Weight | Role |
|---|---|---|---|
| XLE | Traditional Energy | 20% | Top-2 (20%) |
| VEGI | Agriculture & Livestock | 20% | Top-2 (20%) |
| PAVE | Utilities & Infrastructure | 10% | Tier-2 (10%) |
| SMH | AI | 10% | Tier-2 (10%) |
| COPX | Industrial Metals | 10% | Tier-2 (10%) |
| ILF | Emerging Markets | 10% | Tier-2 (10%) |
| URA | Nuclear Energy | 10% | Tier-2 (10%) |
| XAR | Defense & Aerospace | 10% | Tier-2 (10%) |
Trade Instructions — Monday Open
Sell the tranche from 2026-03-13 (completing its 4-week hold). Buy the new tranche. Instructions show net portfolio changes — same-asset positions cancel, weight changes show the delta.
| Action | Ticker | Instruction |
|---|---|---|
| SELL | XOP | Sell 33% of XOP position (reduce 15.00% → 10.00%) |
| SELL | XLU | Sell 50% of XLU position (reduce 10.00% → 5.00%) |
| SELL | WEAT | Sell 25% of WEAT position (reduce 10.00% → 7.50%) |
| SELL | AIQ | Sell 50% of AIQ position (reduce 5.00% → 2.50%) |
| SELL | SLV | Sell entire SLV position (2.50% of portfolio) |
| SELL | NLR | Sell 33% of NLR position (reduce 7.50% → 5.00%) |
| SELL | ITA | Sell 50% of ITA position (reduce 5.00% → 2.50%) |
| BUY | ILF | Buy ILF — 11.11% of freed cash (adds 2.50% to portfolio) |
| BUY | SMH | Buy SMH — 11.11% of freed cash (adds 2.50% to portfolio) |
| BUY | XLE | Buy XLE — 22.22% of freed cash (adds 5.00% to portfolio) |
| BUY | VEGI | Buy VEGI — 22.22% of freed cash (adds 5.00% to portfolio) |
| BUY | URA | Buy URA — 11.11% of freed cash (adds 2.50% to portfolio) |
| BUY | XAR | Buy XAR — 11.11% of freed cash (adds 2.50% to portfolio) |
| BUY | PAVE | Buy PAVE — 11.11% of freed cash (adds 2.50% to portfolio) |
Current Portfolio After Trade
Combined holdings across all 4 active tranches. Each tranche is 25% of the portfolio.
| Ticker | % of Portfolio | Weight Bar |
|---|---|---|
| XOP | 10.00% | |
| XLE | 10.00% | |
| VEGI | 10.00% | |
| COPX | 7.50% | |
| WEAT | 7.50% | |
| ILF | 7.50% | |
| SMH | 7.50% | |
| NLR | 5.00% | |
| XLU | 5.00% | |
| IGF | 5.00% | |
| URA | 5.00% | |
| XAR | 5.00% | |
| AIQ | 2.50% | |
| ITA | 2.50% | |
| REMX | 2.50% | |
| IGV | 2.50% | |
| GLD | 2.50% | |
| PAVE | 2.50% |
Macro Regime — Transition / Mixed
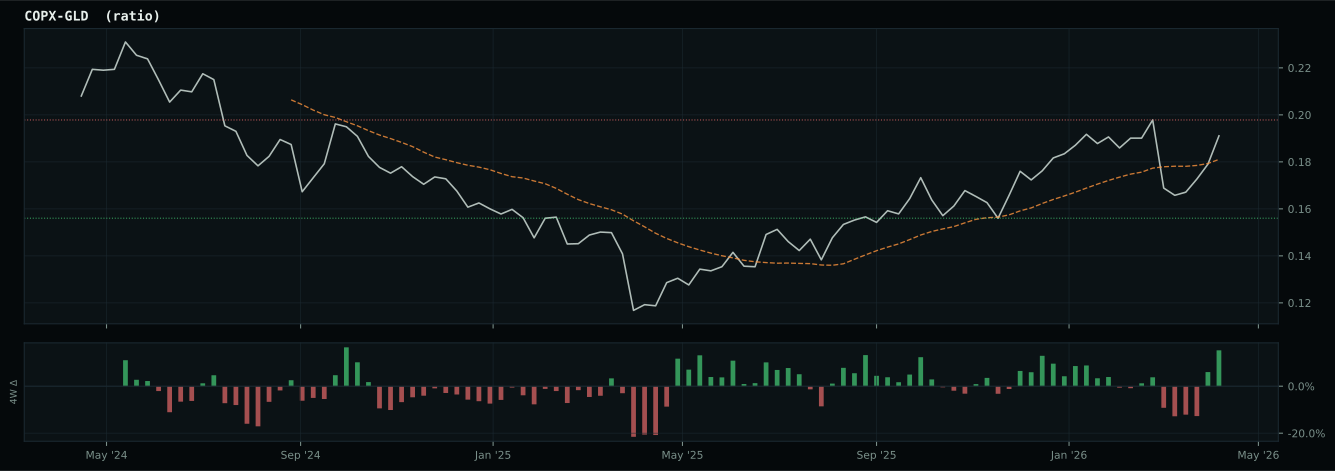
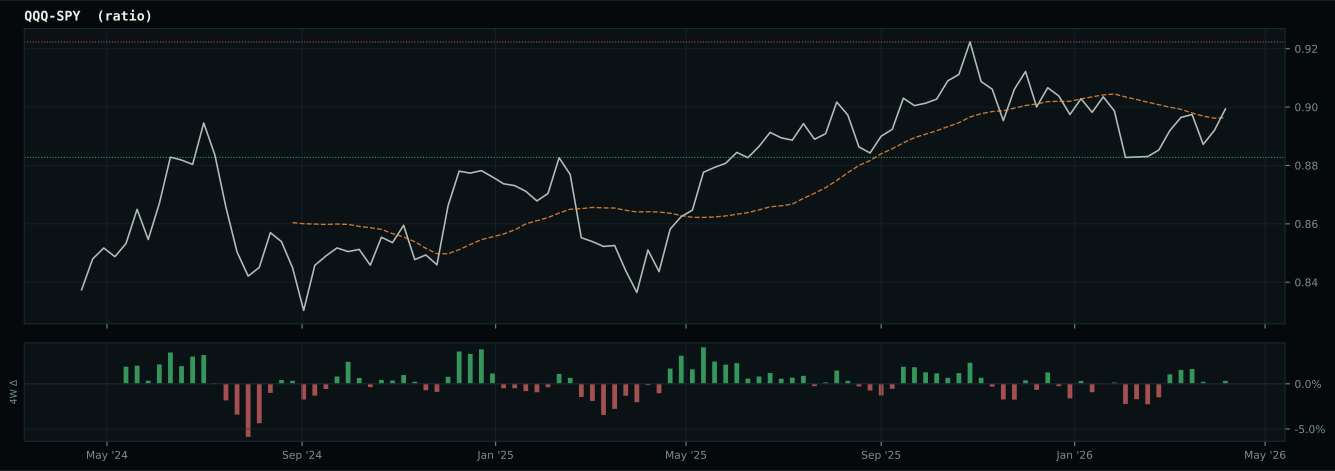
Macro Evidence Charts
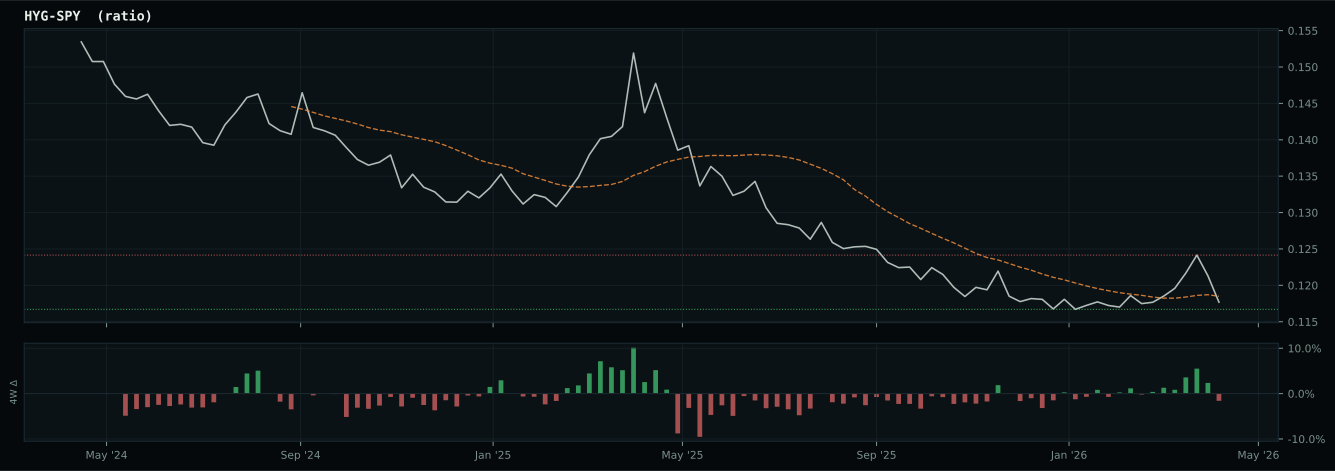
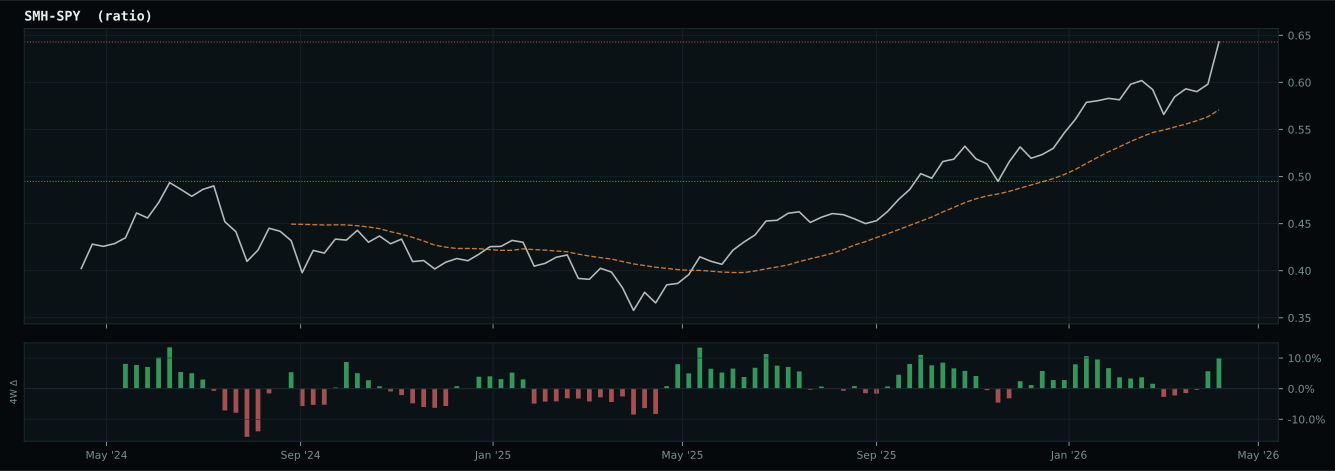
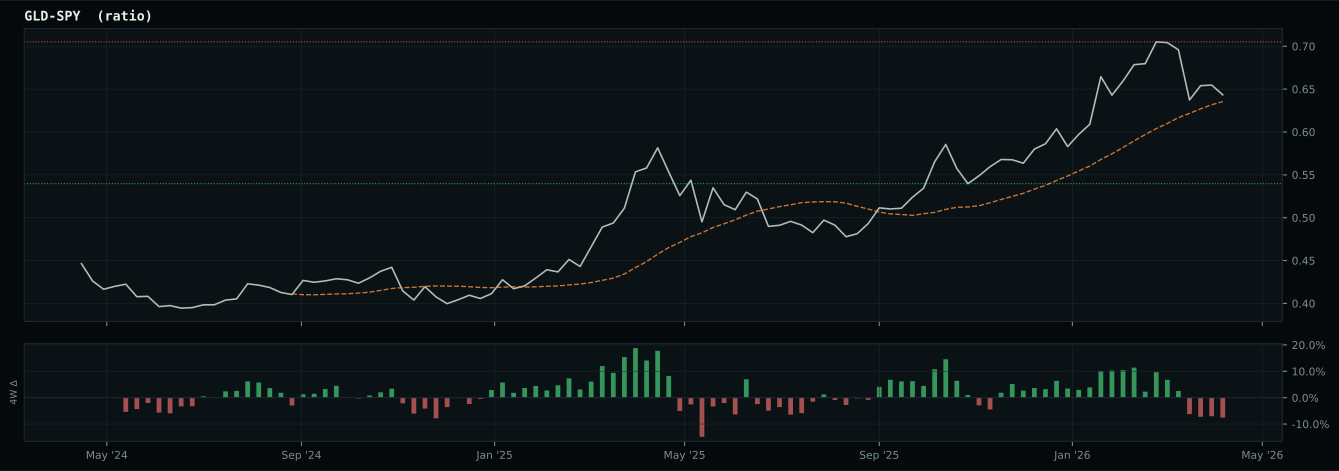
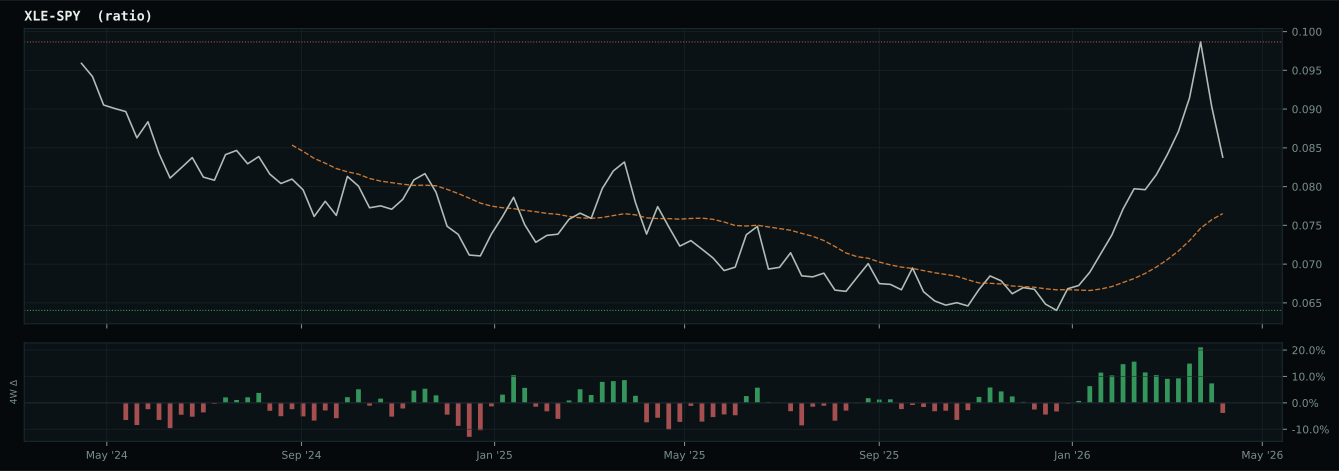
Market-implied signals behind the macro regime scores. Each ratio compares two assets; the direction and slope of the ratio is what the macro engine reads.
Crypto Regime — NoCrypto
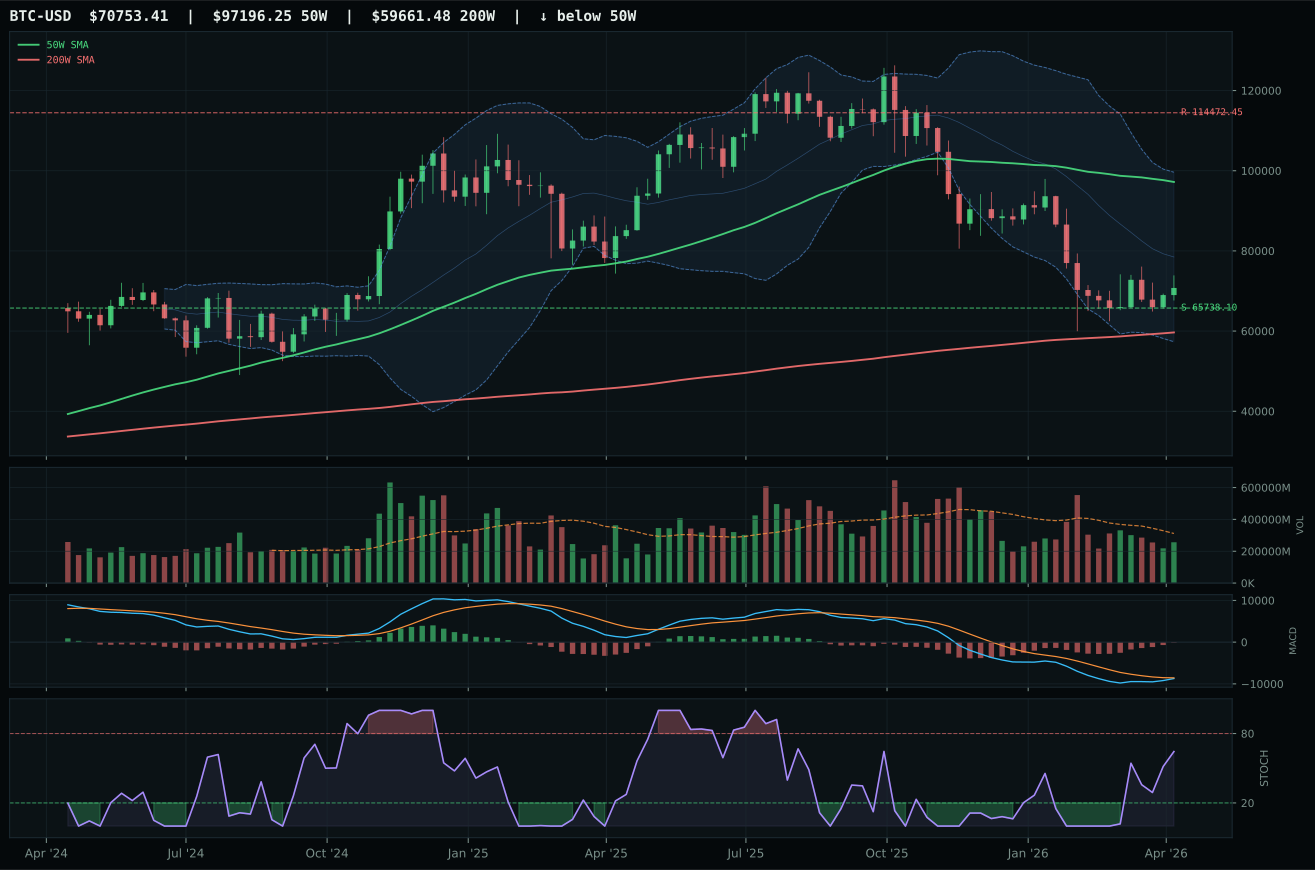
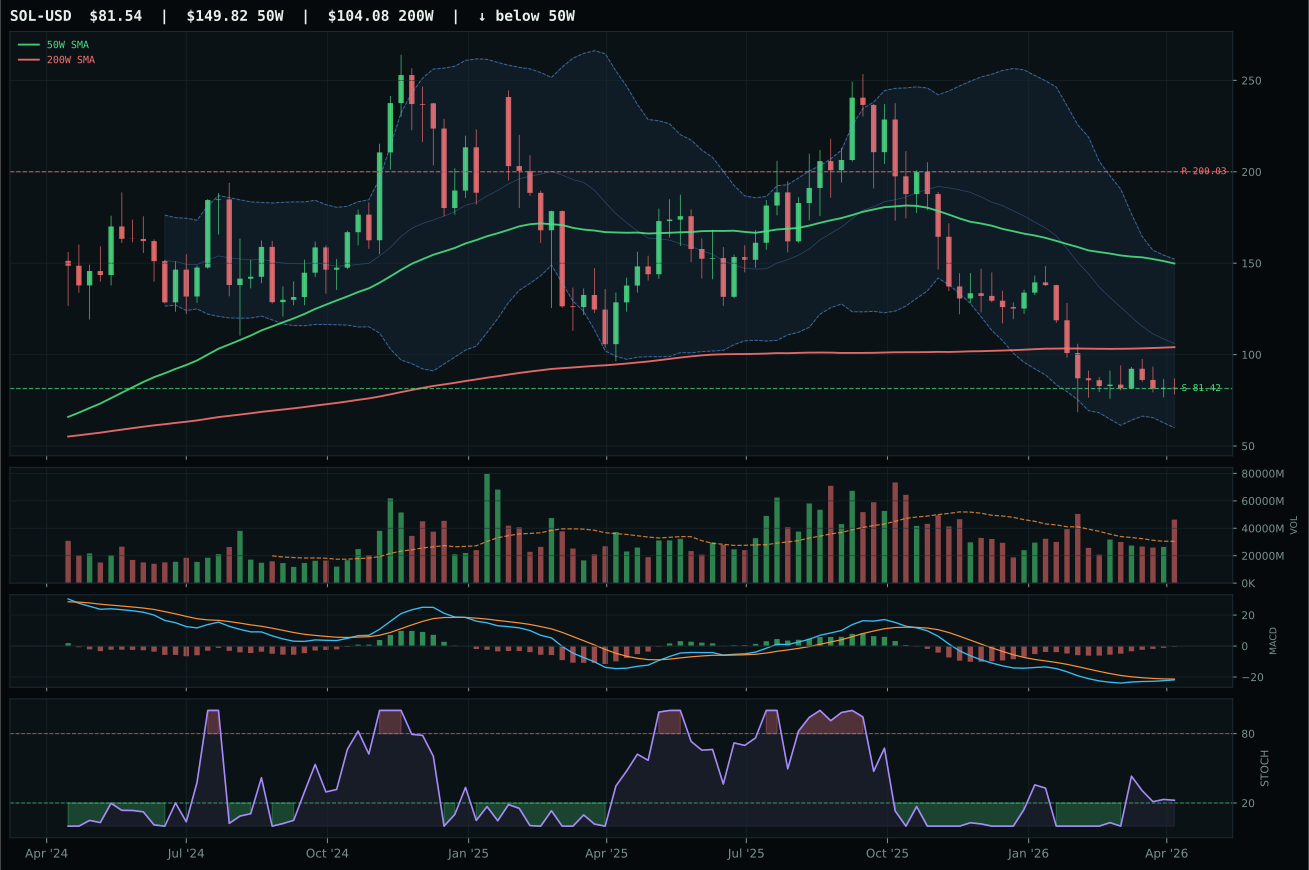
ValueBTC armed by first 200W buy-zone touch, but post-touch range age is 9 weeks; minimum is 12
TrendBTC not confirmed
one or more available conditions failed
Category Rankings
| Rank | Category | Winner | Score | Alloc | 4W Ret | Peers (4W) |
|---|---|---|---|---|---|---|
| 1 | Traditional Energy | XLE | 84.5 | 20% | -2.36% | XOP -1.8% · FCG -3.3% |
| 2 | Agriculture & Livestock | VEGI | 81.6 | 20% | -2.05% | MOO -4.1% · WEAT +6.6% |
| 3 | Utilities & Infrastructure | PAVE | 70.1 | 10% | +4.45% | IGF -1.6% · XLU -3.7% |
| 4 | AI | SMH | 66.4 | 10% | +31.17% | AIQ +27.0% · BOTZ +17.3% |
| 5 | Industrial Metals | COPX | 53.7 | 10% | +5.29% | PICK +6.8% · REMX +15.6% |
| 6 | Emerging Markets | ILF | 50.5 | 10% | -3.32% | IEMG +12.5% · INDA -0.2% |
| 7 | Nuclear Energy | URA | 49.6 | 10% | +10.40% | URNM +4.4% · NLR +5.2% |
| 8 | Defense & Aerospace | XAR | 46.3 | 10% | -0.99% | ITA -2.2% · ROKT +3.5% |
| 9 | Precious Metals | GLD | 45.4 | 0% | -0.14% | GDX -2.7% · SLV +14.7% |
| 10 | Technology | XLK | 43.7 | 0% | +23.76% | CIBR +23.1% · IGV +20.1% |
Traditional Energy — XLE
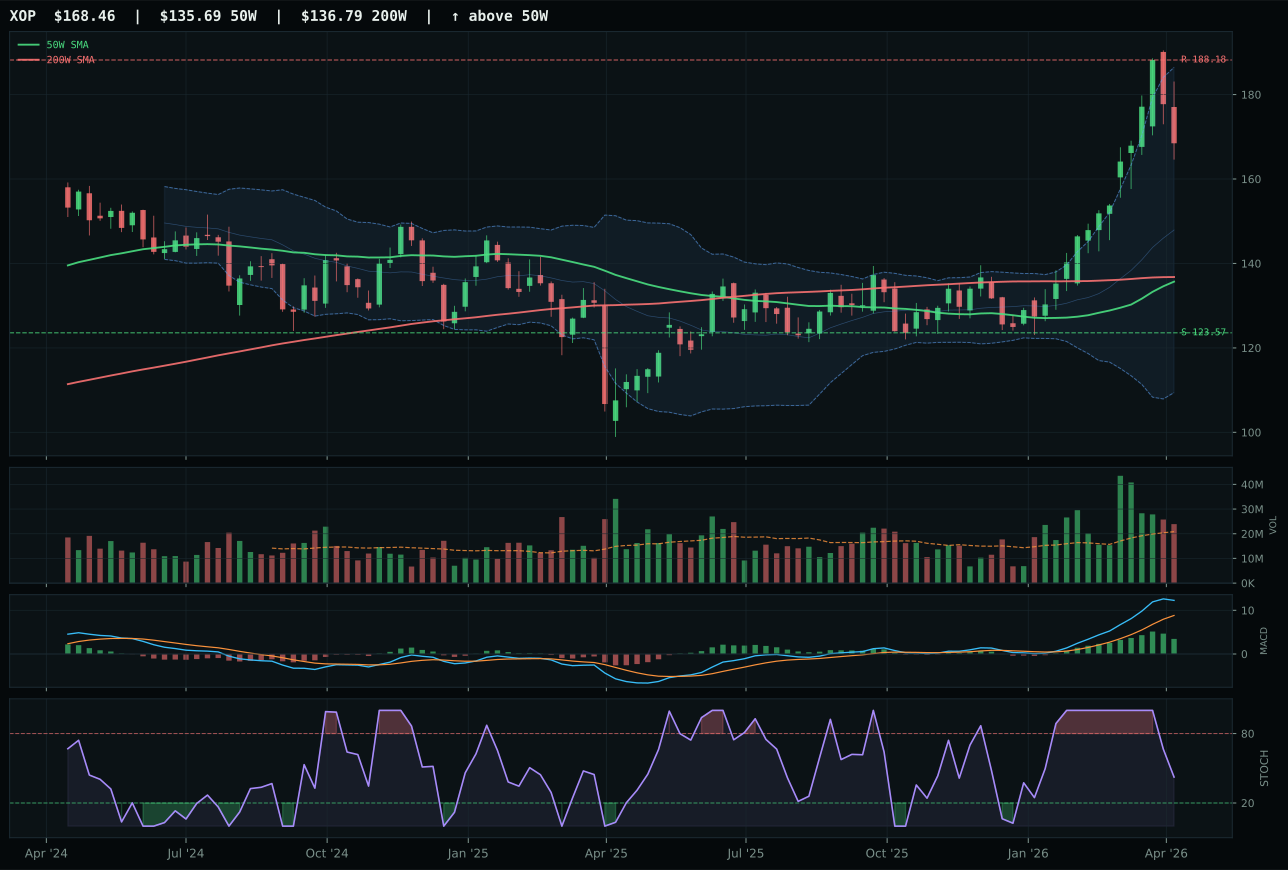
XOP has a vertical extension profile with 34.3% 13-week relative strength versus SPY.
A failed hold above support would weaken the setup.
Actionable but governed by invalidation levels.
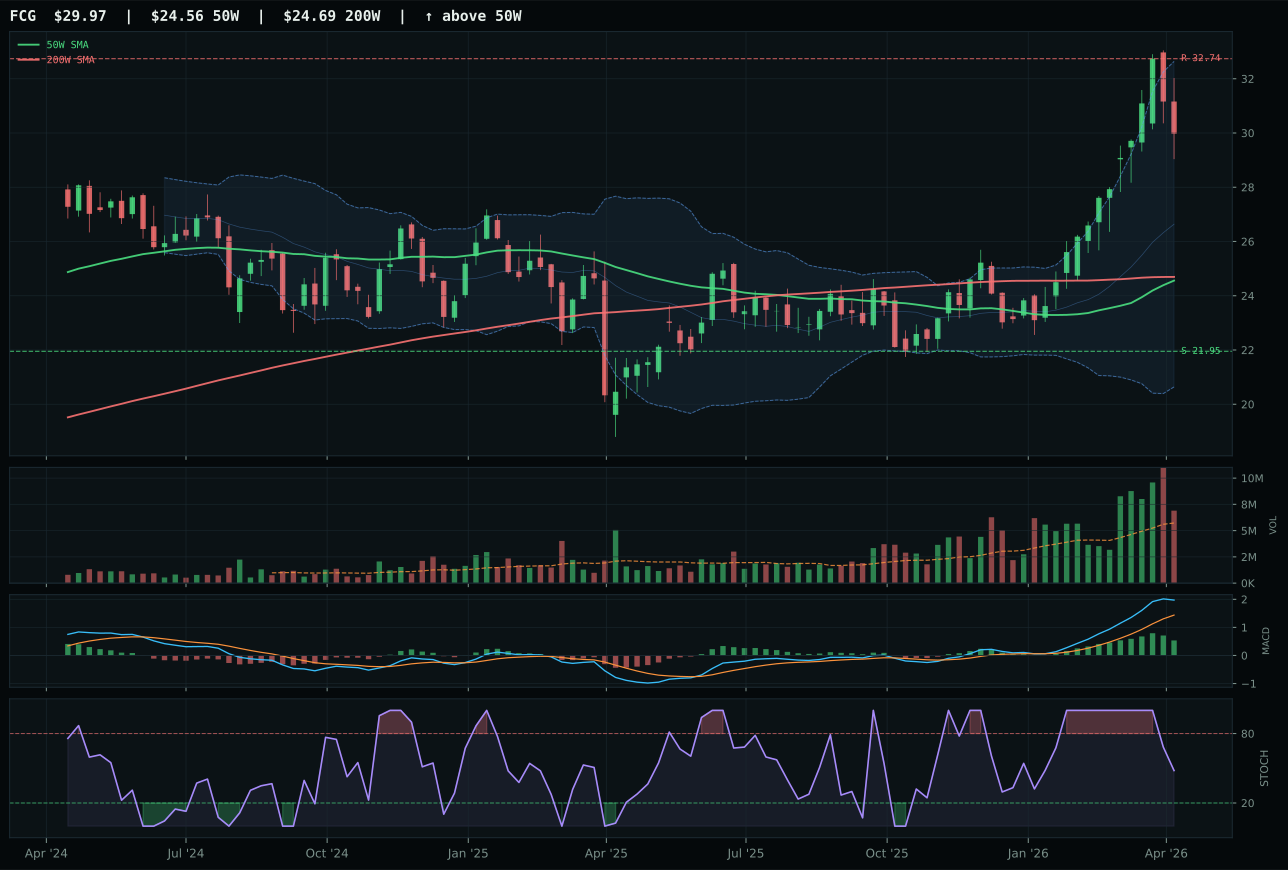
FCG has a vertical extension profile with 31.8% 13-week relative strength versus SPY.
A failed hold above support would weaken the setup.
Actionable but governed by invalidation levels.
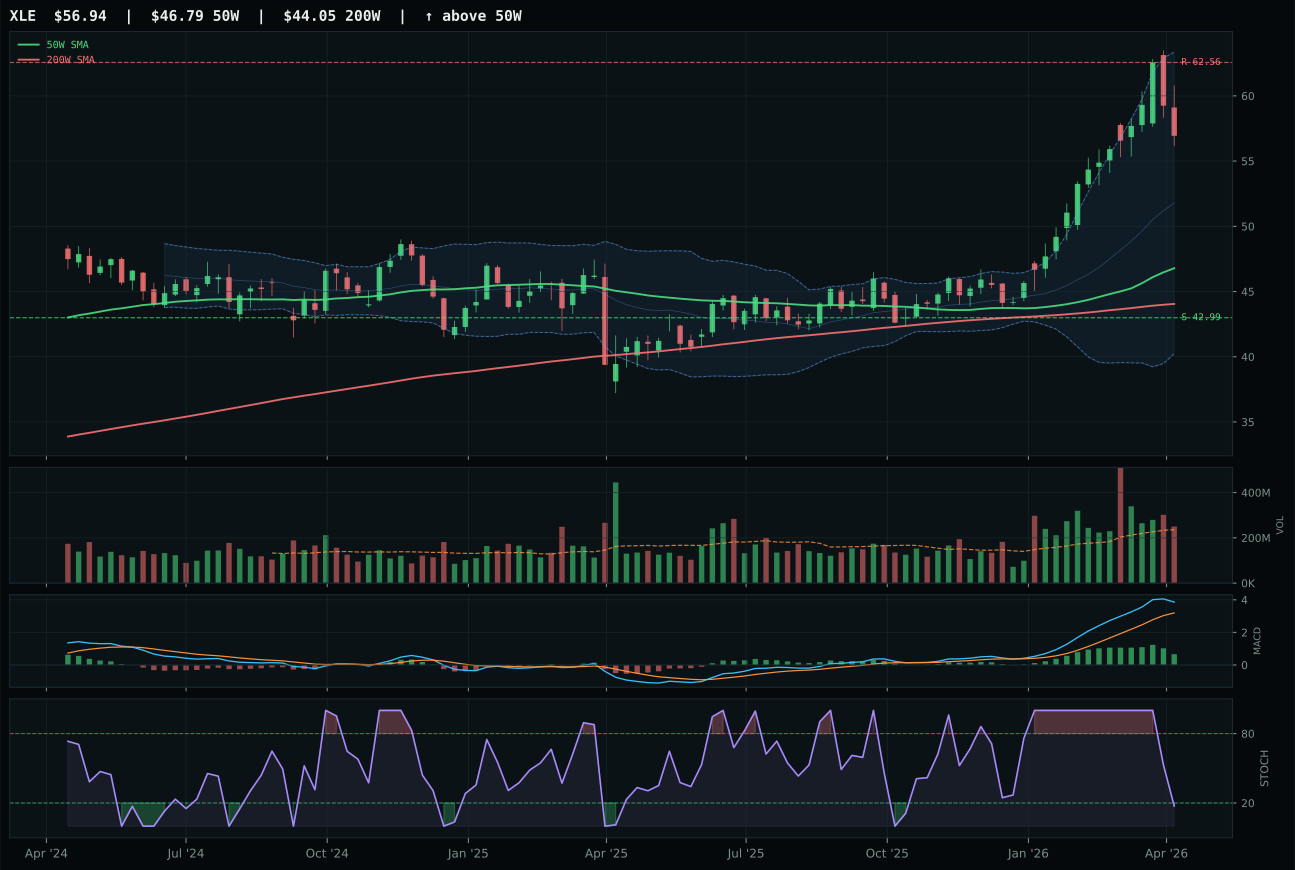
XLE has a vertical extension profile with 24.1% 13-week relative strength versus SPY.
A failed hold above support would weaken the setup.
Actionable but governed by invalidation levels.
XLE claims the top-2 allocation at 20% because it threads the needle between two competing technical narratives: XOP (34.3% SPY RS, 32.2% 13W return) and FCG (31.8% RS, 29.7% return) both posted faster recent appreciation, yet XLE's 24.1% RS and 22.0% 13W return came with superior structure (79.9 versus implied lower scores) and neutral volume at 1.06x versus above-average participation. The macro case is identical across all three—energy scarcity, inflation pressure, and supply shortage are the portfolio's strongest tailwinds—but XLE's trend and structure allowed the reasoning layer to designate it as category representative despite ranking third in the reasoned proof order at 72.3 (behind XOP at 80.4 and FCG at 77.9). The 3/2/1 basket methodology, weighted heavily toward technical leadership and persistence, rewarded XLE's cleaner chart (83.3 cleanliness versus exploratory beta's choppier action) and its MACD transition from bearish to bullish with oversold stochastic RSI, suggesting a deeper trend shift rather than surface momentum.
Traditional Energy earned its top-2 status at 20% because the macro setup is almost as strong as Agriculture, and the technical evidence is less extended. Energy scarcity at 16 points and inflation pressure at 10 combine with supply shortage at nine to generate 35 points of macro tailwind—more than any other category except Agriculture's 31. XLE's trend score of 100.0 ties the portfolio high, and momentum confirmation at 100 reflects 22.0% 13W returns on neutral volume, a sign of institutional accumulation rather than retail chase. The risk/reward is modest at 50.0 (upside constrained to -9.0% to 62.56 resistance, downside to 42.99 support is 32.4%), but in the context of a 20.4-point SPY outperformance over 13 weeks, that risk is manageable. XLE's timing at 48.0 is punchy for a leader, penalized by its 21.7% extension, yet the portfolio needs energy leadership now because the macro regime is in transition and energy shortages are asymmetrically bullish for equities over the next 6-12 months. Conviction at 20% is justified by duration of the macro case, not just current technical setup.
Agriculture & Livestock — VEGI
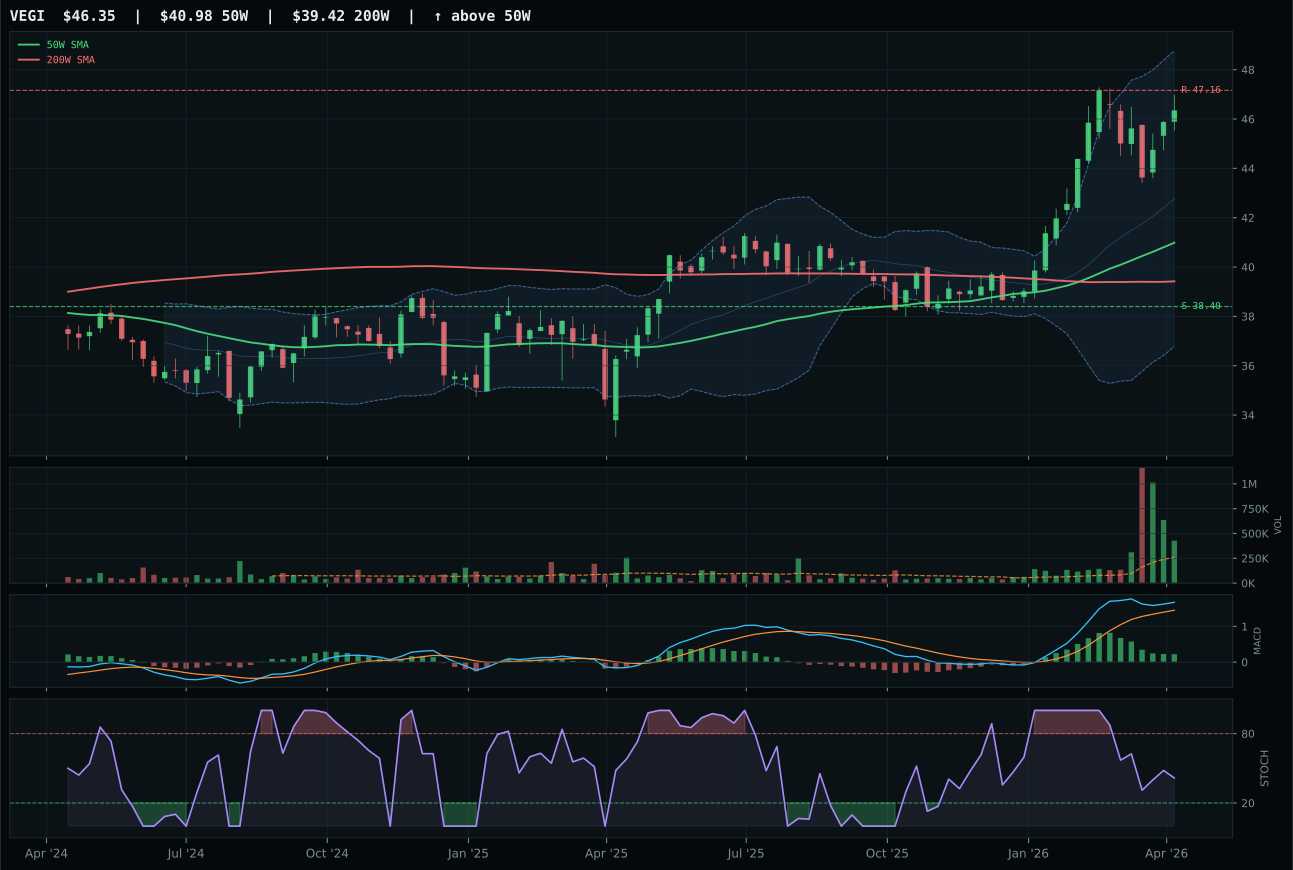
VEGI has a neutral structure profile with 18.4% 13-week relative strength versus SPY.
A failed hold above support would weaken the setup.
Actionable but governed by invalidation levels.
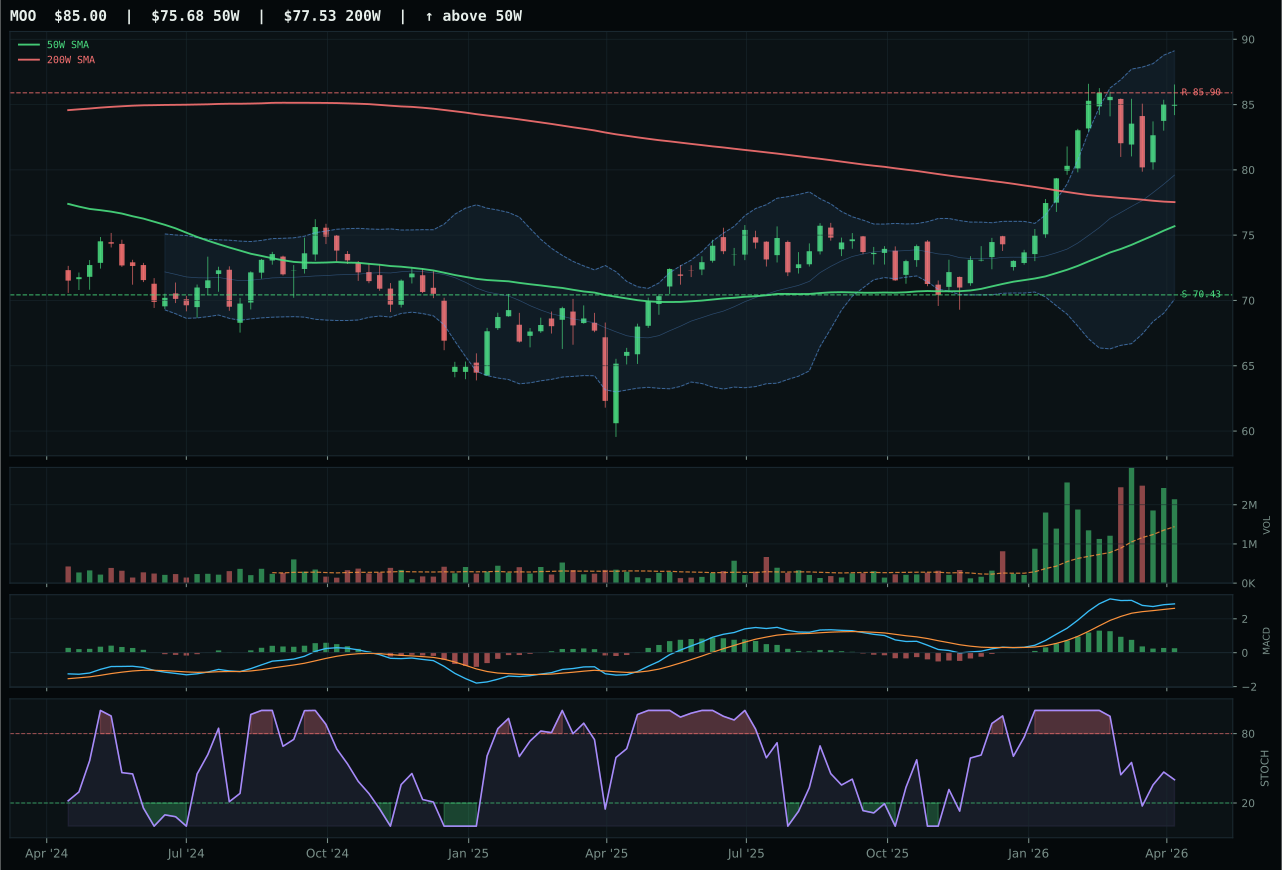
MOO has a neutral structure profile with 15.5% 13-week relative strength versus SPY.
A failed hold above support would weaken the setup.
Actionable but governed by invalidation levels.
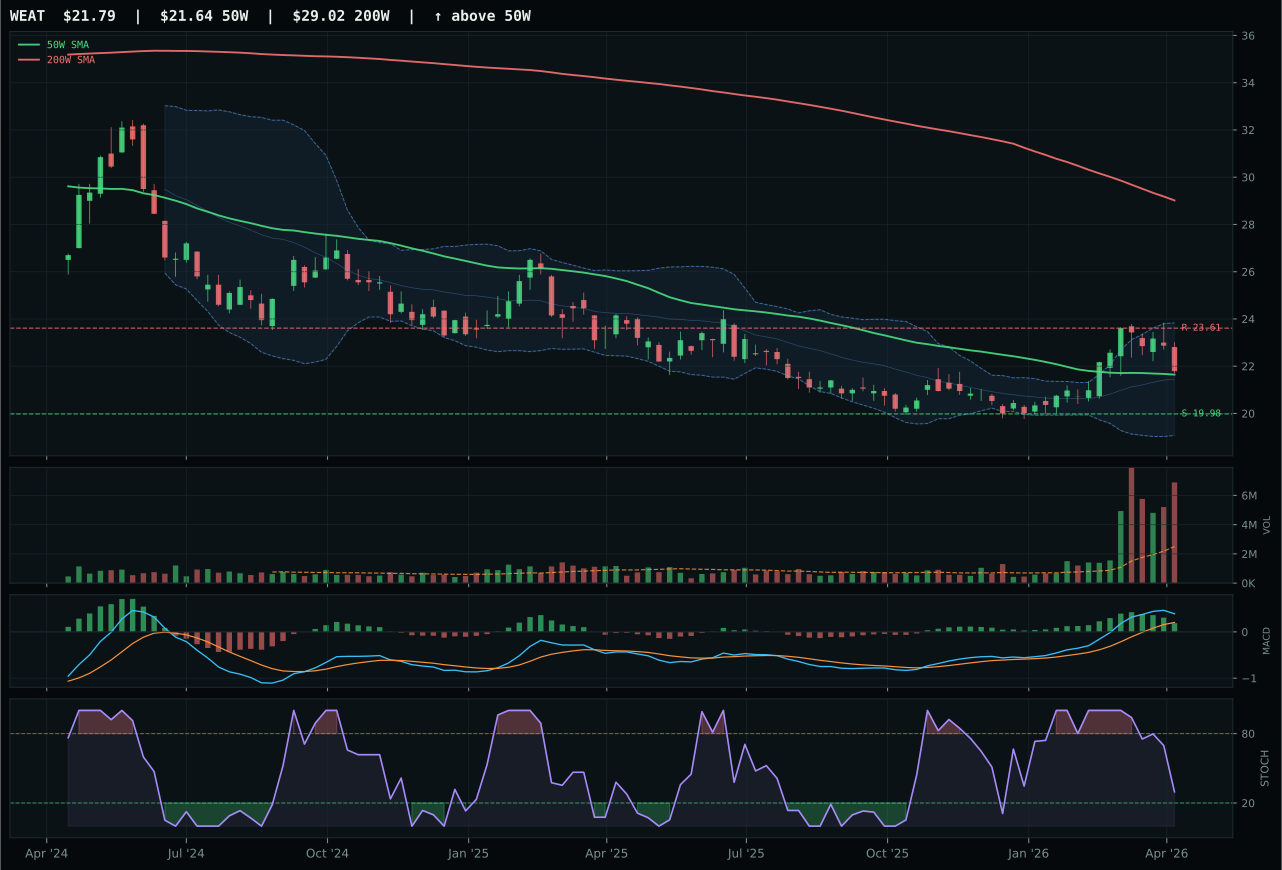
WEAT has a compression near 50W profile with 9.2% 13-week relative strength versus SPY.
A failed hold above support would weaken the setup.
Actionable but governed by invalidation levels.
VEGI dominates the agriculture basket with perfect 100.0 trend and momentum confirmation scores, backed by 18.4% SPY-relative strength and accumulation-level volume at 1.65x the 20W average—the only major ETF in today's portfolio carrying active buy confirmation. Price sits 13.1% above the 50W in a near 52W high extension, a position that would normally trigger timing penalties, but VEGI's entry is forgivable because the move was built on three consecutive weeks of above-average volume and a MACD that shifted from bearish to bullish. MOO matched VEGI's momentum perfection but lost on cleanliness (79.7 structure versus 85.6), volume confirmation (above-average participation versus accumulation), and category-relative strength (0.0% versus 2.9%)—small margins that compound into a decisive gap. WEAT's compression near the 50W offers a better entry but its momentum is only 45 and the 7.1% 13W return cannot justify displacement of a leader whose 16.3% return has been mechanically confirmed by institutional accumulation.
Agriculture & Livestock earned its top-2 allocation at 20% because the macro setup is almost perfect for this cycle. Supply shortage adds 13 points, inflation pressure adds 10, and real asset sponsorship adds eight—a 31-point macro tailwind that few categories can match. VEGI's technical evidence of 100.0 is the highest in the portfolio, and the combination of trend leadership (100), momentum confirmation (100), and volume-price confirmation (95.2) is unambiguous. The category score of 81.6 ranks second only to Traditional Energy, and the risk/reward remains manageable at 43.5 because downside to support is a defined 20.7% while upside is constrained by near-term resistance. In a Transition/Mixed macro regime where inflation and supply constraints dominate over liquidity concerns, agriculture is one of two categories where both technical and macro evidence align without contradiction. Conviction at 20% is warranted because entry risk is real but manageable, and the macro case has multi-month durability.
Utilities & Infrastructure — PAVE
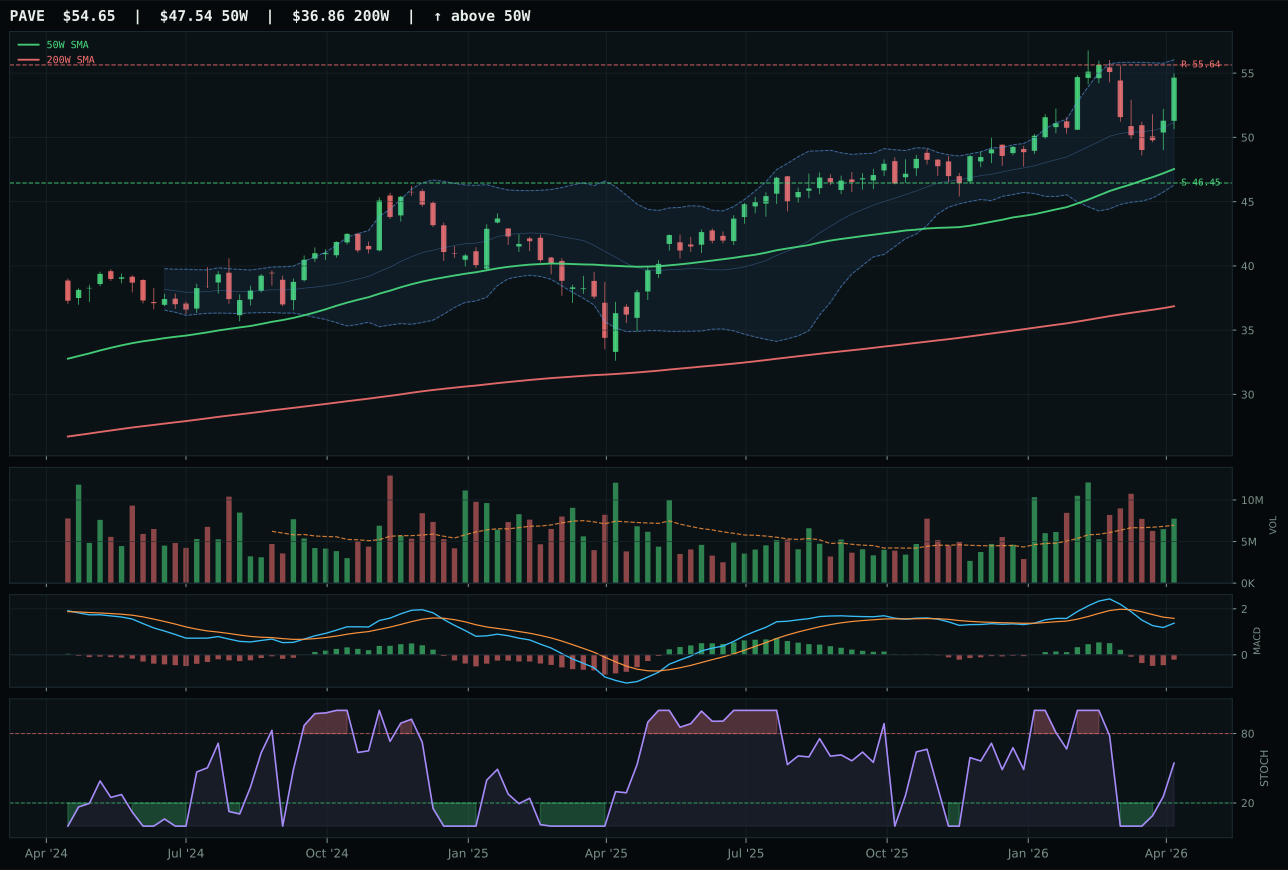
PAVE has a neutral structure profile with 11.1% 13-week relative strength versus SPY.
A failed hold above support would weaken the setup.
Actionable but governed by invalidation levels.
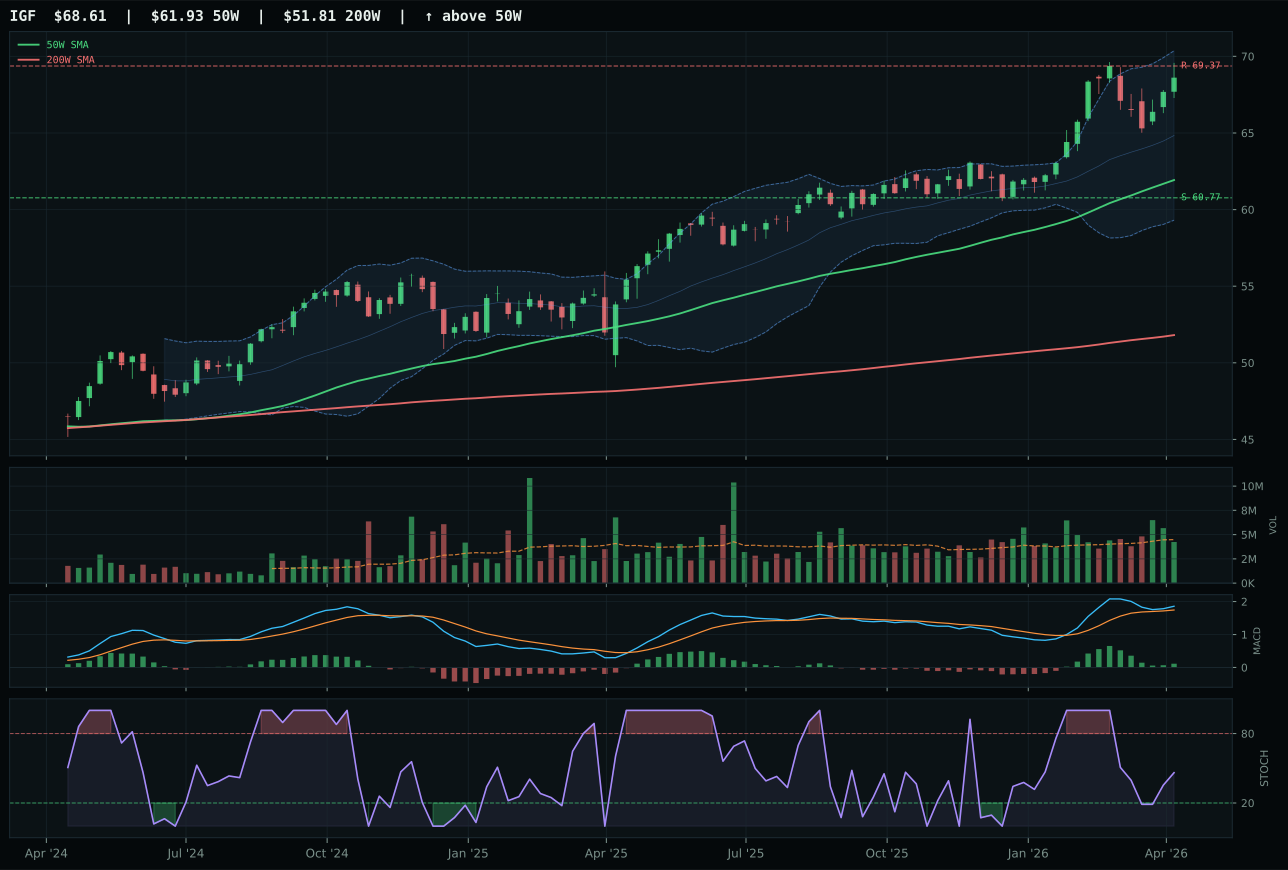
IGF has a neutral structure profile with 13.1% 13-week relative strength versus SPY.
A failed hold above support would weaken the setup.
Actionable but governed by invalidation levels.
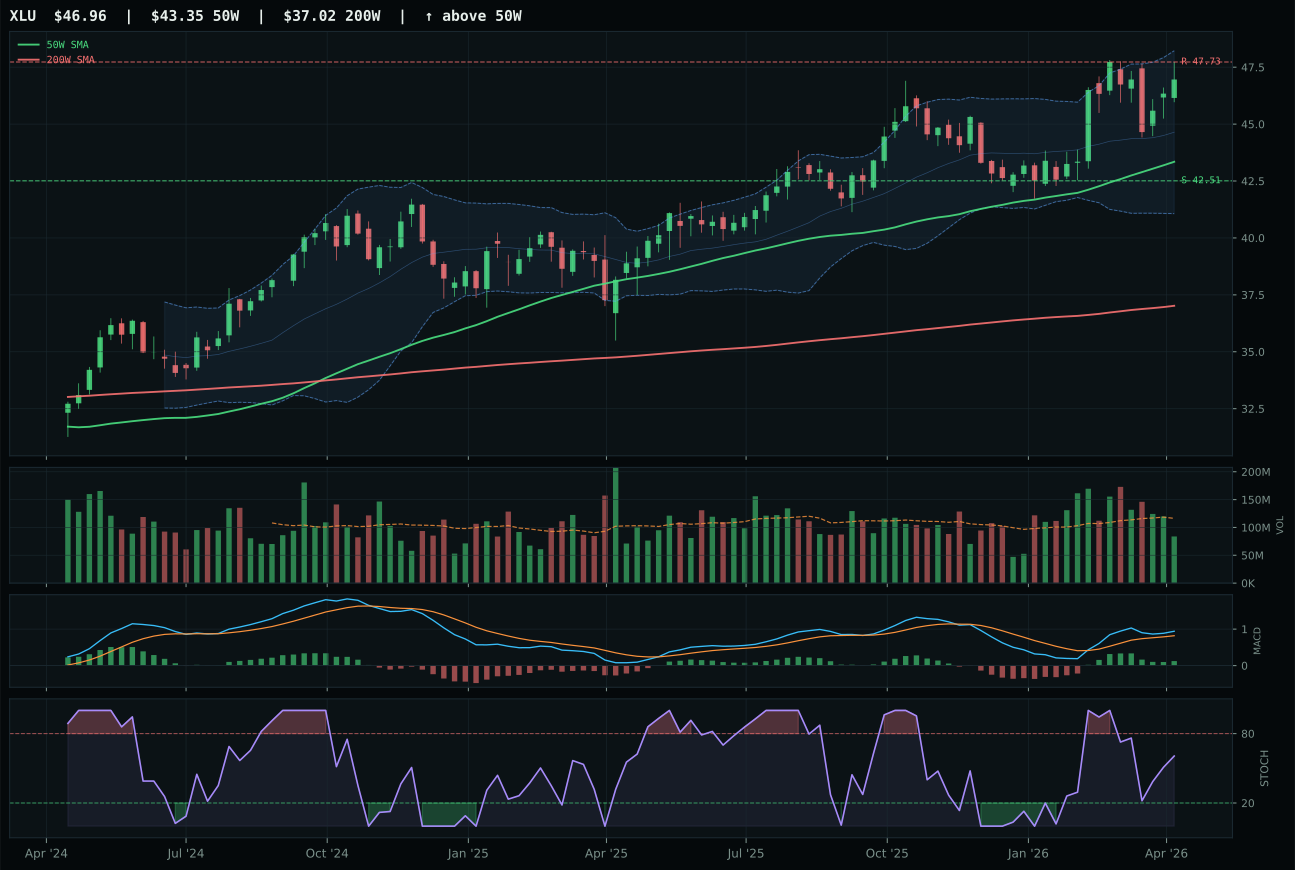
XLU has a neutral structure profile with 12.6% 13-week relative strength versus SPY.
A failed hold above support would weaken the setup.
Actionable but governed by invalidation levels.
PAVE wins the utilities & infrastructure category despite IGF's superior technical evidence (81.4 versus 59.8) and MACD bullish signal because momentum confirmation (80.9 versus 96) and category-relative strength (-1.5% versus 0.6%) favor PAVE's domestic infrastructure play. IGF's bullish but flattening MACD suggests a leader losing steam, whereas PAVE's bearish/weakening MACD at a rising stochastic RSI mid-zone suggests coil compression before the next move. Both trade near 52W highs—PAVE at modest 15.0% extension, IGF at similar near-52W highs—but PAVE carries above-average volume participation (1.11x 20W) versus IGF's neutral volume (1.06x), a meaningful confirmation difference when entry risk is modest. The risk/reward is nearly identical at 38.8 versus 38.5, but PAVE's trend score of 92.0 versus IGF's 100 reflects a more sustainable advance rather than an exhausted breakout; the category selected PAVE as representative because the reasoning layer weighted domestic capex leverage (PAVE) over global income diversification (IGF) in the current macro environment.
Utilities & Infrastructure scored 70.1, ranking 5th among the eight allocated categories and earning its 10% slot because defensive rotation (12 points) and Transition/Mixed macro support (4 points) provide legitimate tailwinds. However, the macro case is conflicted: inflation pressure is active at -6 points, offsetting much of the defensive benefit, and the category's overall macro fit of 60.0 ranks lower than six peers. PAVE's technical evidence of 59.8 is respectable but not dominant—momentum confirmation of 80.9 trails most portfolio leaders, and timing at 70.0 reflects an extended chart that leaves little room for error. Risk/reward at 38.8 with only 1.8% upside to resistance and 17.7% downside to support creates an unfavorable asymmetry for new buyers. Upgrade PAVE to 20% only if credit stress indicators spike materially or if the Fed signals an imminent pivot to rates cuts; in a mixed macro regime with inflation still present, utilities are a diversifier, not a conviction trade. The allocation holds at 10% as portfolio drag reduction, not growth engine.
AI — SMH
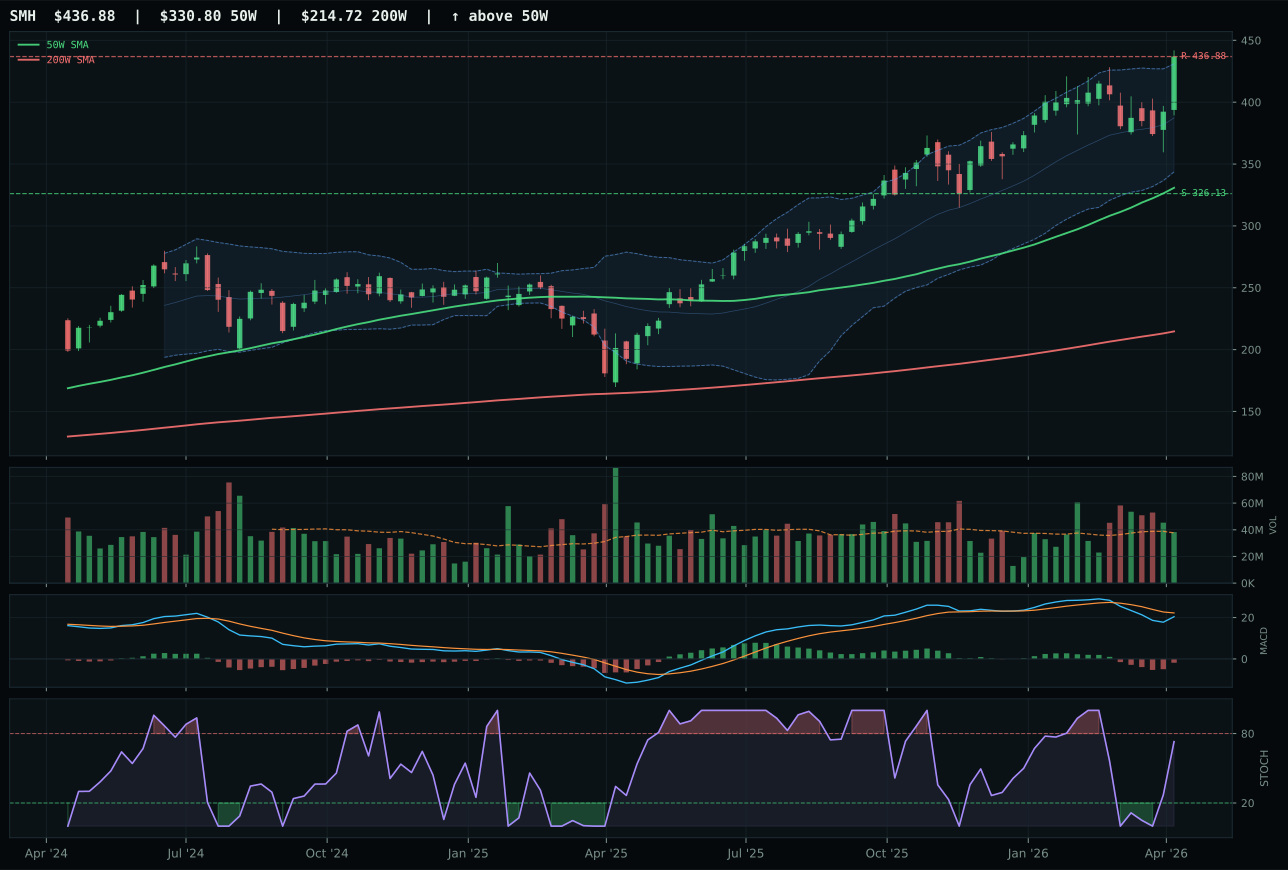
SMH has a vertical extension profile with 14.3% 13-week relative strength versus SPY.
A failed hold above support would weaken the setup.
Actionable but governed by invalidation levels.
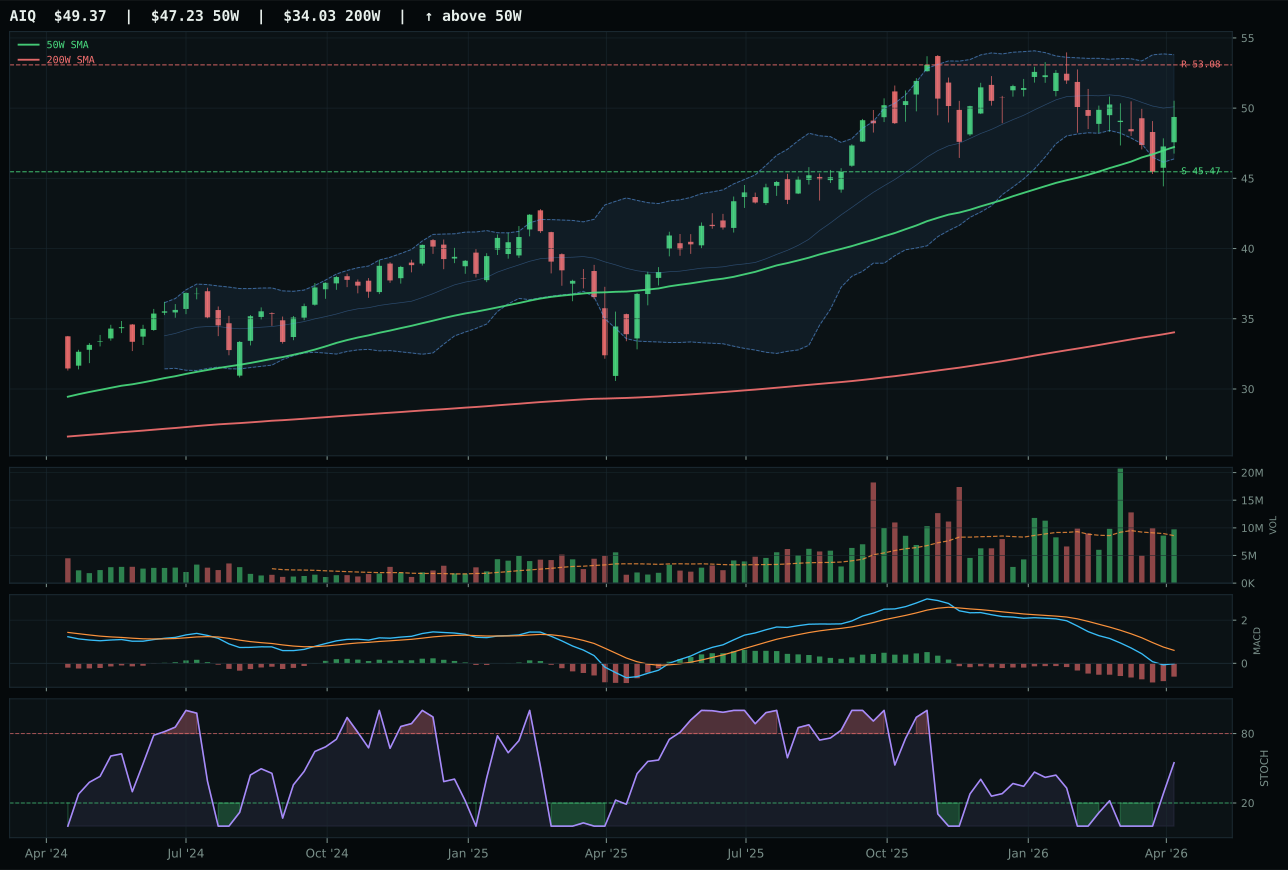
AIQ has a neutral structure profile with -4.0% 13-week relative strength versus SPY.
A failed hold above support would weaken the setup.
Actionable but governed by invalidation levels.
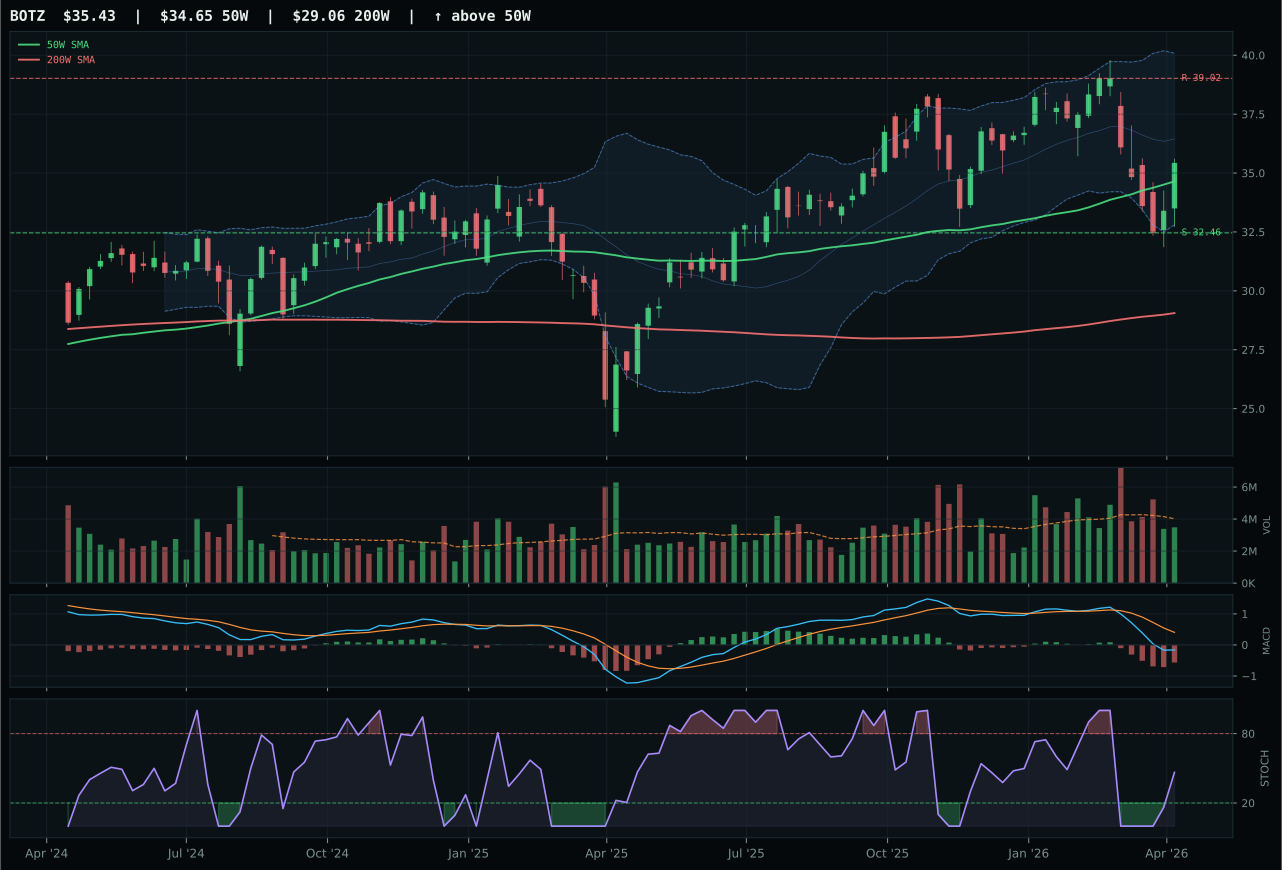
BOTZ has a compression near 50W profile with -5.2% 13-week relative strength versus SPY.
A failed hold above support would weaken the setup.
Actionable but governed by invalidation levels.
SMH wins the AI basket because its 18.3% category-relative strength and 14.3% SPY-relative strength outpace AIQ's zero category reading and -4.0% SPY reading by a margin that cannot be explained by chart cleanliness alone. The chart justifies the premium: SMH has ascended 32.1% above its 50W into a near 52W high extension, a position that normally invites penalty, but its momentum confirmation scores a perfect 100 because the 13W return of 12.2% and 4W return of 12.8% are real and internally consistent. Volume at 1.02x the 20W average is neutral, neither confirming nor rejecting, but the Fibonacci zone placement (near 0.236 extension) and rising stochastic RSI at 0.73 suggest the move is still mechanically intact. AIQ's neutral structure and rising stochastic RSI at similar mid-zone levels cannot compensate for the category-relative performance gap—SPY has powered past the semiconductor complex, and SMH captured more of that move.
AI scored 66.4, placing it just outside the top-two allocation threshold, because momentum is genuinely strong but timing has become expensive. SMH's extended position at 32.1% above the 50W incurs a 53.0 timing penalty, and the category's overall risk/reward score is just 41.2, meaning every dollar of upside to resistance leaves $3.40 of downside to support. The macro case is compelling—AI growth sponsorship scores 14 points, liquidity expansion scores 10, and these dominate over a modest -8 credit stress drag—but the technical setup cannot sustain a 10% allocation when entry risk has stretched this far. Hold SMH at 10% and monitor whether a pullback to the 50W or a failed breakout above resistance creates a cleaner re-entry; the category's macro tailwinds will persist, but timing discipline prevents chasing vertical extensions into a mixed macro regime.
Industrial Metals — COPX
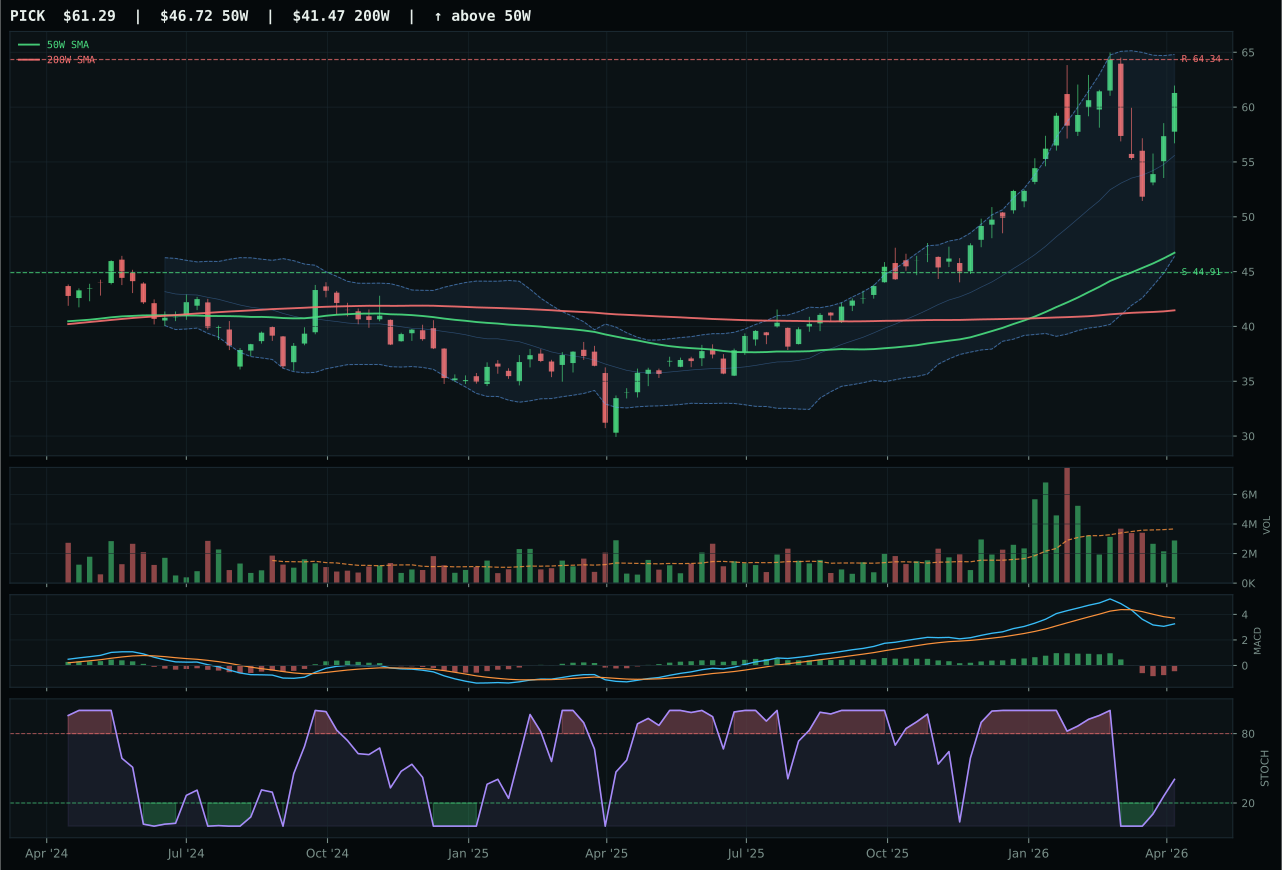
PICK has a vertical extension profile with 14.7% 13-week relative strength versus SPY.
A failed hold above support would weaken the setup.
Actionable but governed by invalidation levels.
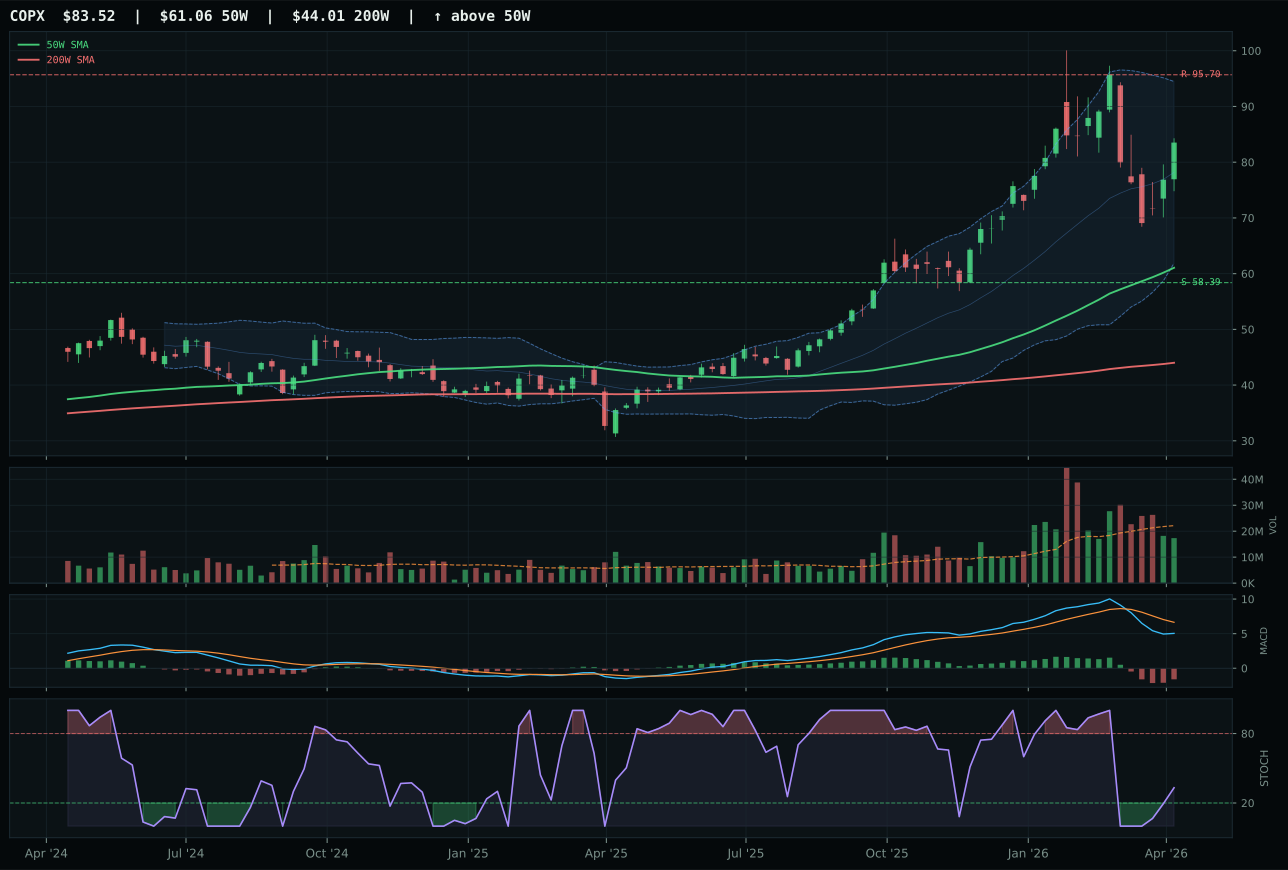
COPX has a vertical extension profile with 9.8% 13-week relative strength versus SPY.
A failed hold above support would weaken the setup.
Actionable but governed by invalidation levels.
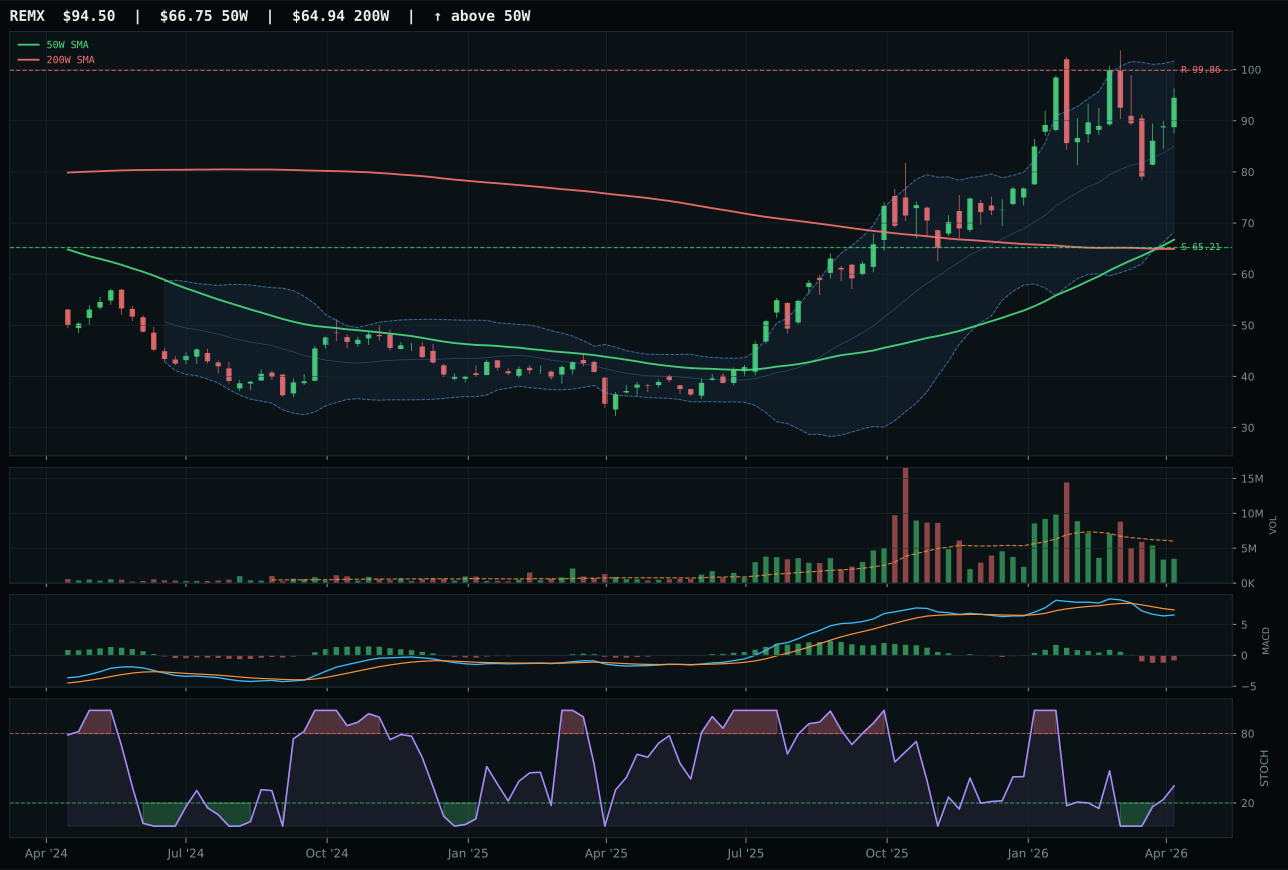
REMX has a vertical extension profile with 13.3% 13-week relative strength versus SPY.
A failed hold above support would weaken the setup.
Actionable but governed by invalidation levels.
COPX wins the industrial metals vote because PICK's superior momentum confirmation (100 versus COPX's 71) is offset by COPX's better risk/reward arithmetic and categorical fit. COPX sits 36.8% above its 50W—deeply extended—but the 35.3 risk/reward score reflects a brutal -12.7% upside to resistance and a 43.0% downside cushion, a 3:1 asymmetry that forces the allocator to demand perfection in volume confirmation (which COPX does not have). PICK's momentum is pristine at 100, driven by 12.6% 13W returns and 1.4% category-relative strength, but its entry is equally stretched at ~35% above the 50W with similar risk geometry. The deciding factor: PICK's technical evidence scores 47.1 versus COPX's 26.0, yet COPX was selected by the reasoning layer to represent the category, suggesting the category-level test prioritized macro descriptors and volume-price sponsorship persistence over raw ETF technical score. COPX's margin over PICK is paper-thin, a signal that this category winner lacks real conviction.
Industrial Metals scored 53.7, the lowest of the eight allocated categories (tied with Precious Metals), but earns 10% because the metals scarcity descriptor is active at 14 points and commodity breadth is positive at 10. However, the technical evidence of just 26.0 for COPX and 47.1 for PICK screams exhaustion: both trades are extended, both carry weak timing (56.0), and both depend entirely on macro tailwinds to justify continued positioning. The category's macro fit of 73.0 is respectable, supported by real asset sponsorship at six points and inflation pressure at ten, but this is not sufficient to upgrade from tactical hedge to strategic core. Credit stress is active at -7, a headwind that will bite if liquidity tightens. COPX at 10% is a resources rotation bet, not a conviction copper call; the position would warrant doubling to 20% only if a fresh weekly close above 95.70 resistance confirmed institutional accumulation, or if copper futures began posting higher lows on average volume.
Emerging Markets — ILF
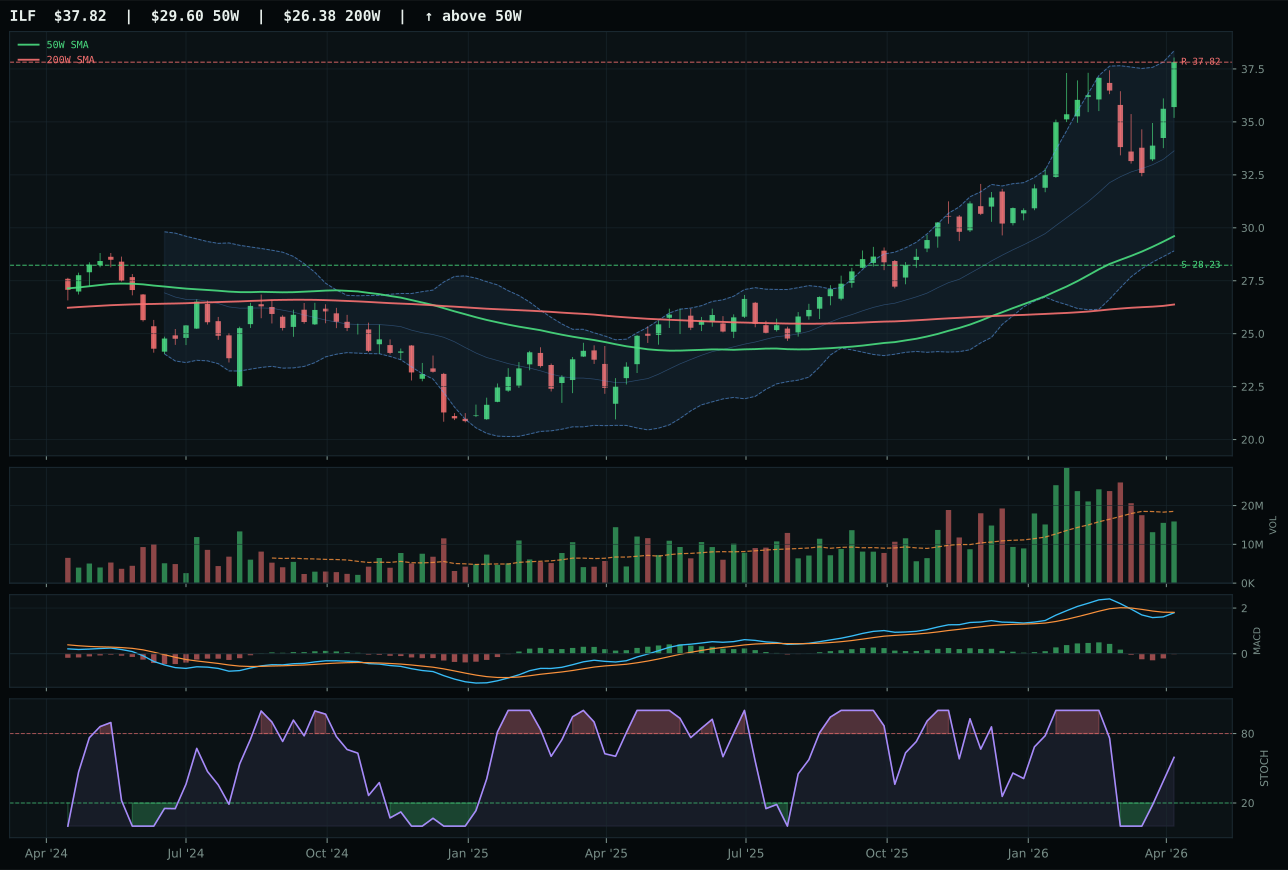
ILF has a vertical extension profile with 20.8% 13-week relative strength versus SPY.
A failed hold above support would weaken the setup.
Actionable but governed by invalidation levels.
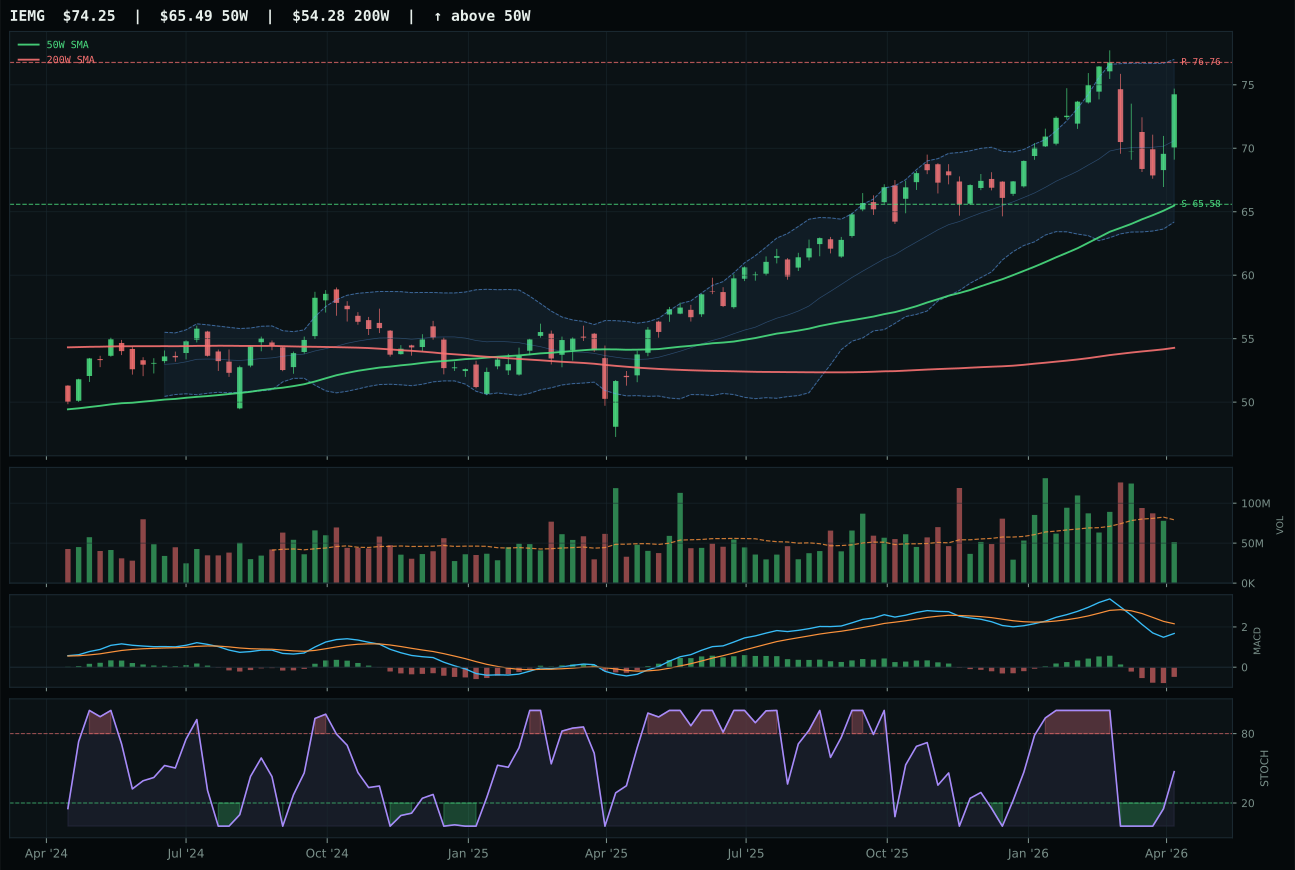
IEMG has a neutral structure profile with 8.1% 13-week relative strength versus SPY.
A failed hold above support would weaken the setup.
Actionable but governed by invalidation levels.
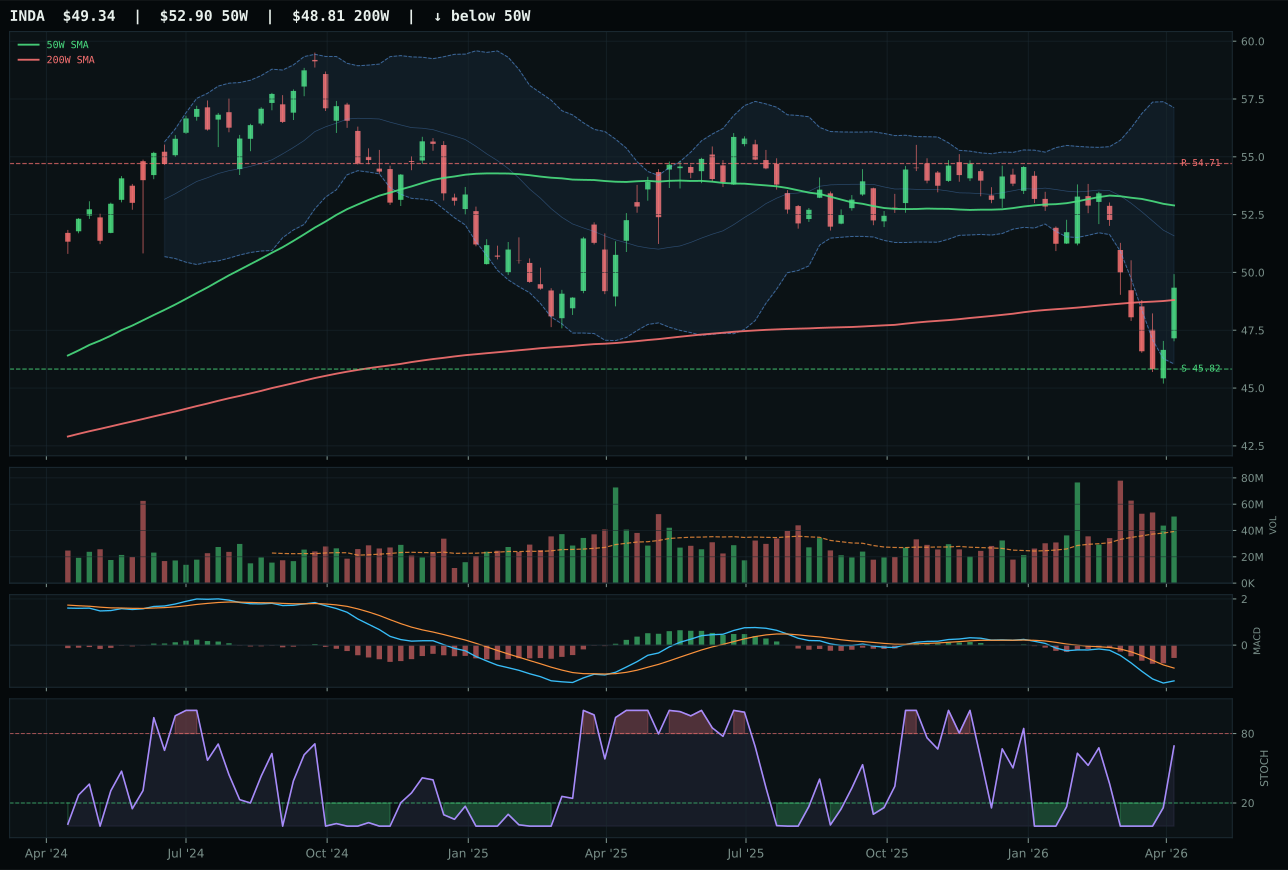
INDA has a neutral structure profile with -5.1% 13-week relative strength versus SPY.
A failed hold above support would weaken the setup.
Actionable but governed by invalidation levels.
ILF wins the emerging-markets category with a 9.6-point lead over IEMG because trend perfection (100.0) and momentum confirmation (100.0) overwhelm IEMG's broader structural soundness and slightly superior macro fit. ILF's 18.7% 13W return and 20.8% SPY-relative strength, combined with 12.7% category-relative performance, establish unambiguous leadership; IEMG's 6.0% 13W return and 8.1% SPY RS pale in comparison. Both sit near 52W highs—ILF at 27.7% extension, IEMG at a more contained upper retracement—but ILF's volume is neutral at 0.86x while IEMG's is thin at 0.51x, a reversal that favors the leader. The commodity beta profile is ILF's edge: Latin America exposure to metals and energy scarcity plays directly into the macro regime's strength, whereas IEMG's broad-based emerging-market beta dilutes the scarcity narrative. IEMG's defensive credentials (broader market, lower volatility) would matter in a credit-stressed environment, but the active em liquidity support descriptor (14 points) suggests risk-on bias to emerging-market equity, not risk-off.
Emerging Markets earned its 10% allocation at a score of 50.5 because the commodity beta and em liquidity support are genuine macro tailwinds, even if technical evidence is mixed. ILF's technical score of 71.7 is solid and its macro fit of 66.0 benefits from active commodity breadth, metals scarcity, and real asset sponsorship support, but the category-level macro fit of 62.0 ranks lower than six other categories. The timing penalty is real—ILF sits 27.7% extended from the 50W—and the risk/reward of 41.2 means downside-to-support is 34.0%, a meaningful cushion if the macro regime turns. The allocation holds at 10% rather than 20% because ILF's momentum confirmation, while perfect at 100, depends entirely on commodity scarcity themes that would reverse sharply if credit stress widened or liquidity contracted. Monitor whether the category-relative strength gap widens or narrows; if IEMG begins to outpace ILF, it would signal a shift toward broad emerging-market demand rather than commodity play, warranting a rebalance.
Nuclear Energy — URA
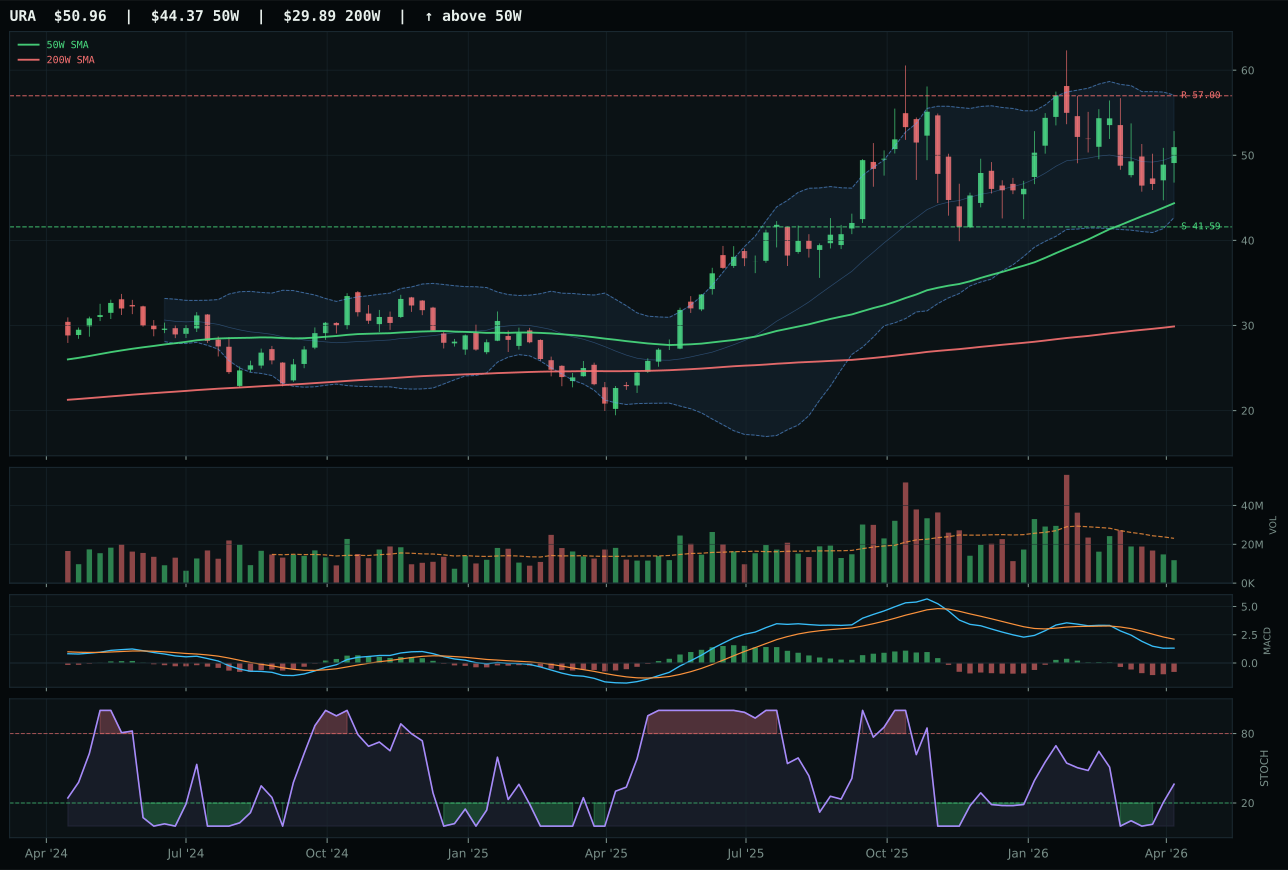
URA has a neutral structure profile with 3.4% 13-week relative strength versus SPY.
A failed hold above support would weaken the setup.
Actionable but governed by invalidation levels.
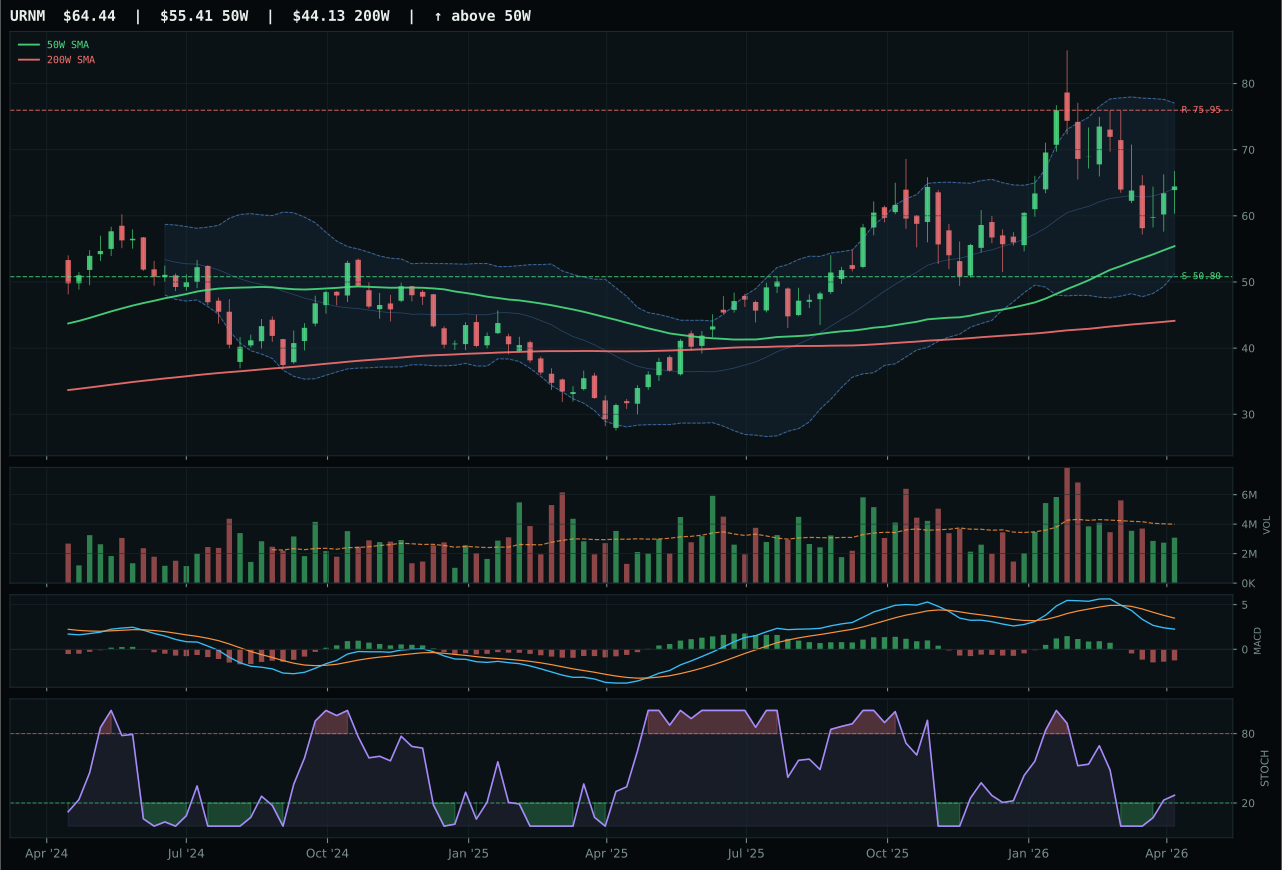
URNM has a vertical extension profile with 3.8% 13-week relative strength versus SPY.
A failed hold above support would weaken the setup.
Actionable but governed by invalidation levels.
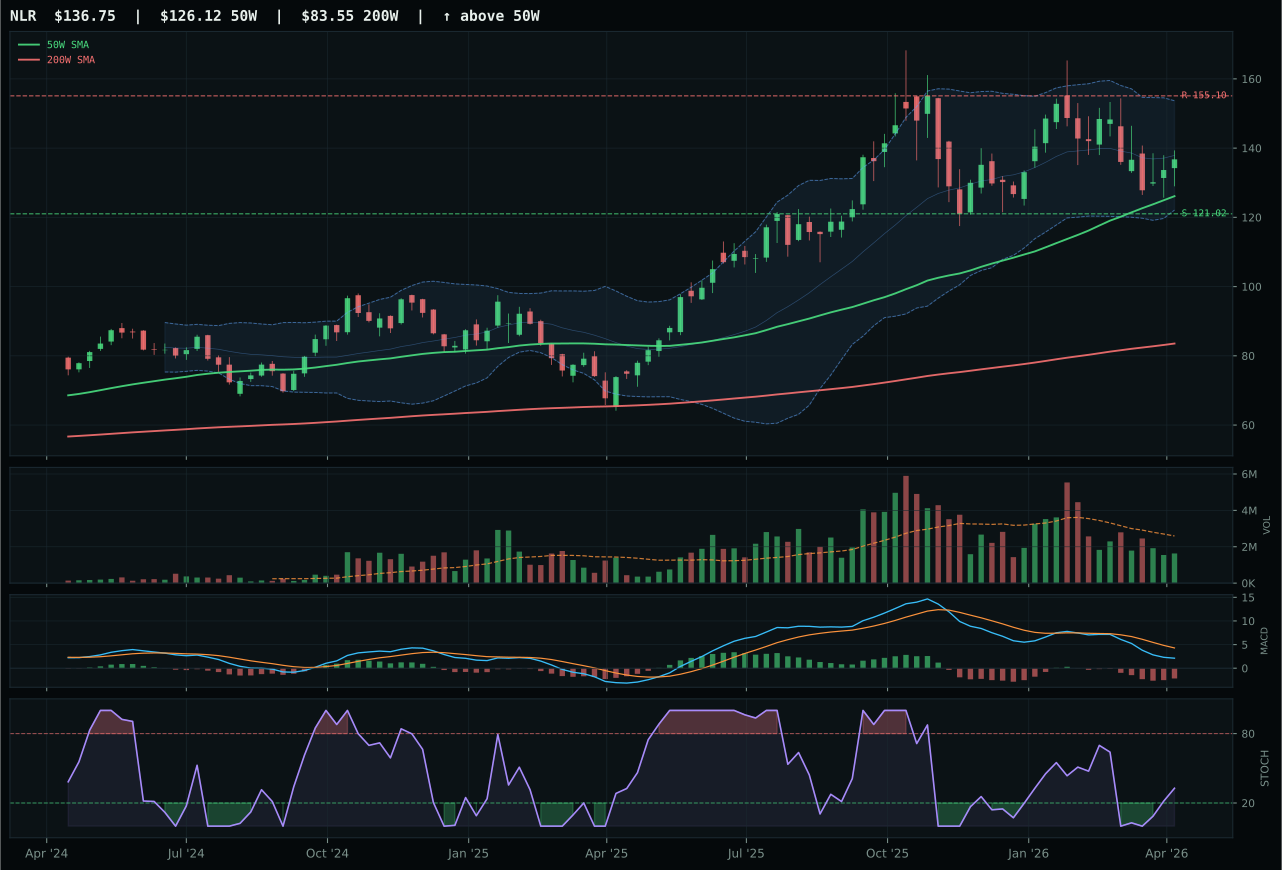
NLR has a neutral structure profile with -0.5% 13-week relative strength versus SPY.
A failed hold above support would weaken the setup.
Actionable but governed by invalidation levels.
URA wins the nuclear basket with a clear 9.5-point margin over URNM because timing discipline separated the two: URA's 78.0 timing score beats URNM's 56.0, a decisive 22-point gap driven by URA's tighter 14.9% distance to the 50W versus URNM's 33.5% extension into vertical breakout territory. Both charts carry identical bullish signals—rising stochastic RSI, bearish/weakening MACD that suggests a potential reversal—but URA's neutral structure and modest momentum (1.3% 13W return) suggest a pause and reaccumulation, whereas URNM's vertical extension with 1.7% 13W return looks like extended speculation on scarcity themes. Volume is thin in both cases (0.51x and neutral participation), but URNM's setup at near 52W highs invites mean-reversion risk, while URA's pullback into support creates a coil setup. The relative strength is negligible (0.0% category-relative for URA, 0.4% for URNM), confirming that neither has established clear leadership within the nuclear complex.
Nuclear Energy scored 49.6, a mid-tier rank that secures its 10% allocation slot because energy scarcity (9 points) and real asset sponsorship (7 points) provide macro support, and inflation pressure adds three more points to justify holding the position. However, the technical evidence for URA is only 40.5, one of the weakest in the portfolio, and momentum confirmation at 44.0 reflects genuine ambiguity about the trade's durability. The macro fit is neutral (50.0)—no category-specific descriptors exist for nuclear, leaving the allocation to depend entirely on broad energy and real-asset tailwinds. URA would upgrade to a 20% position only if momentum confirmation broke above 70, volume confirmation climbed above 60, or a sustained weekly close above 57.00 resistance confirmed institutional buying. Currently, this is a tactical hedging position in a portfolio where energy is already 20%; doubling down on a speculative scarcity narrative would compound risk rather than diversify it.
Defense & Aerospace — XAR
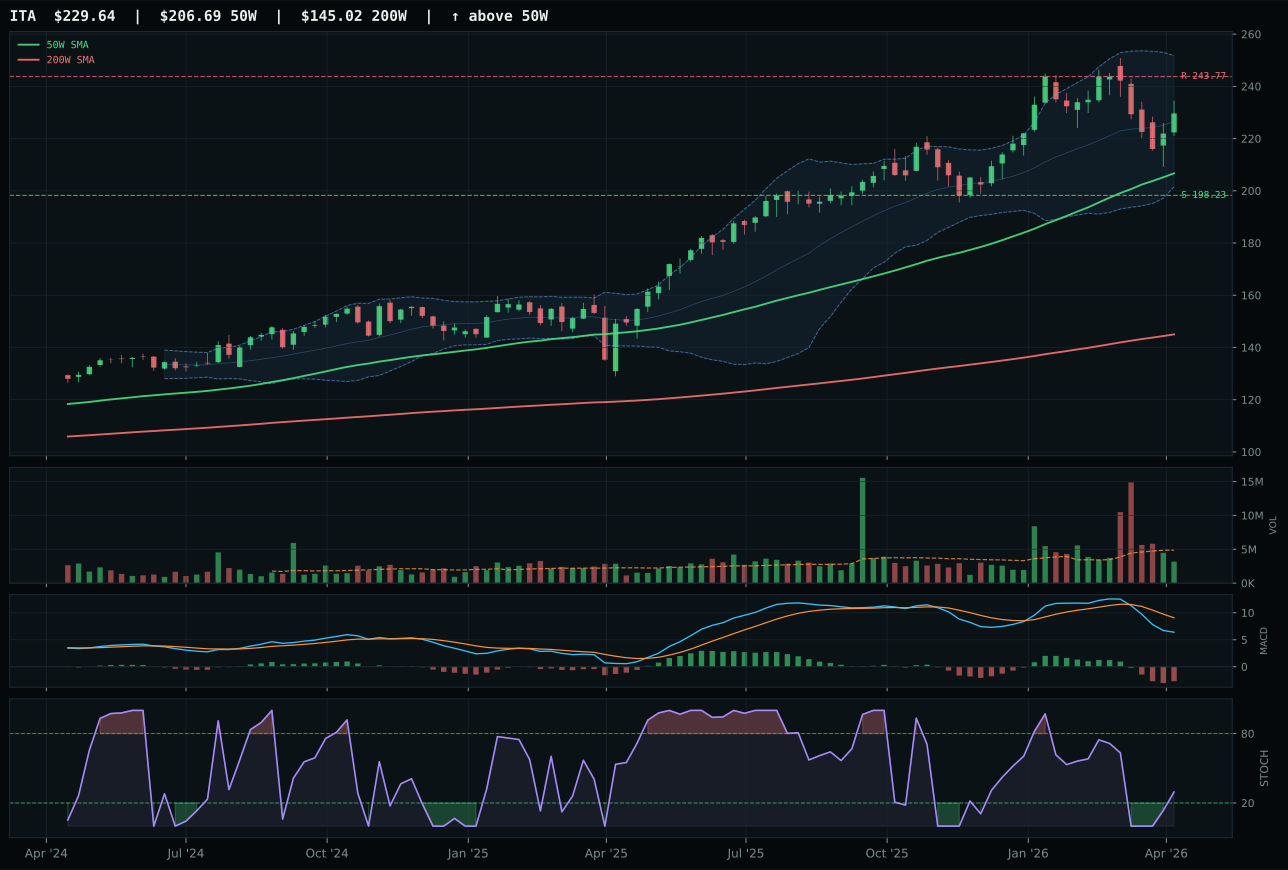
ITA has a neutral structure profile with 0.7% 13-week relative strength versus SPY.
A failed hold above support would weaken the setup.
Actionable but governed by invalidation levels.
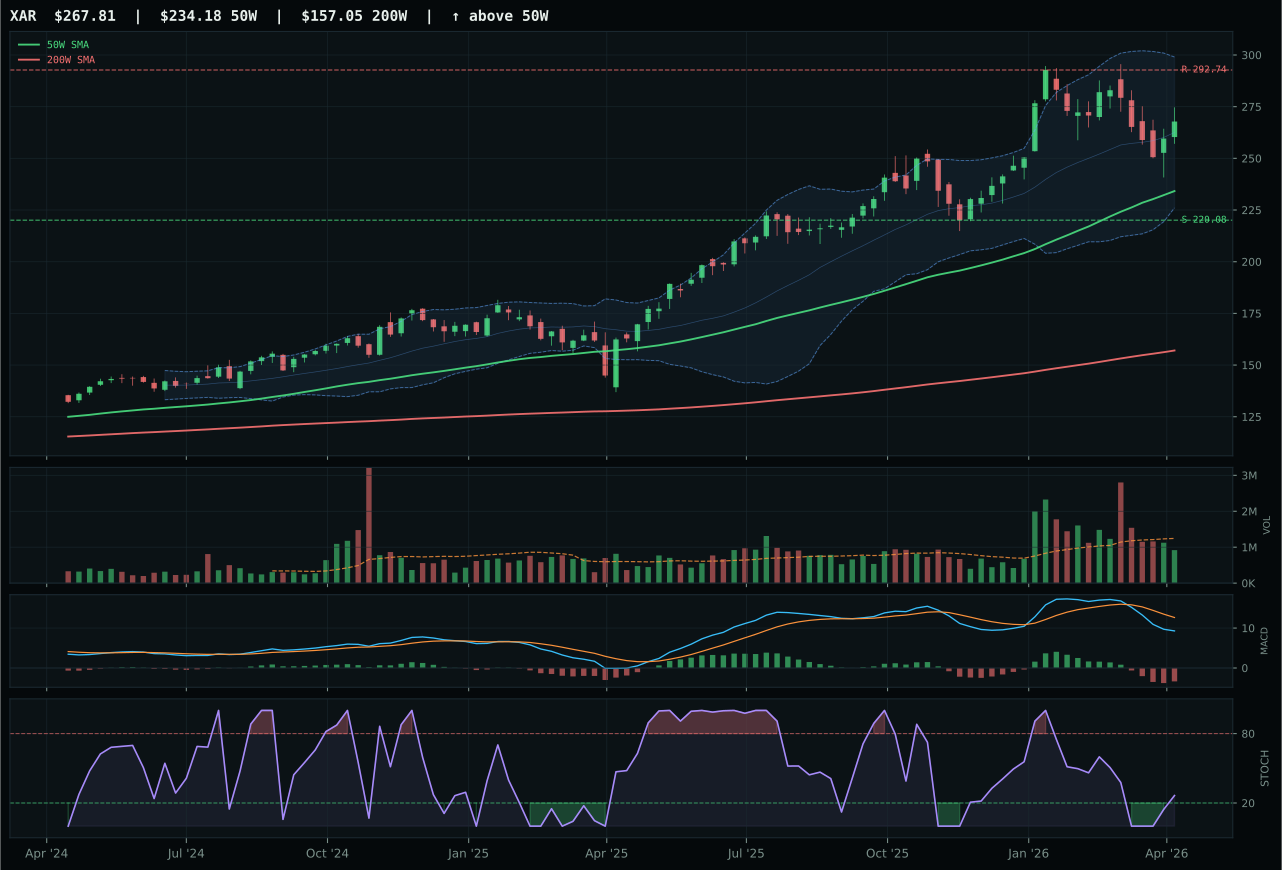
XAR has a neutral structure profile with -1.1% 13-week relative strength versus SPY.
A failed hold above support would weaken the setup.
Actionable but governed by invalidation levels.
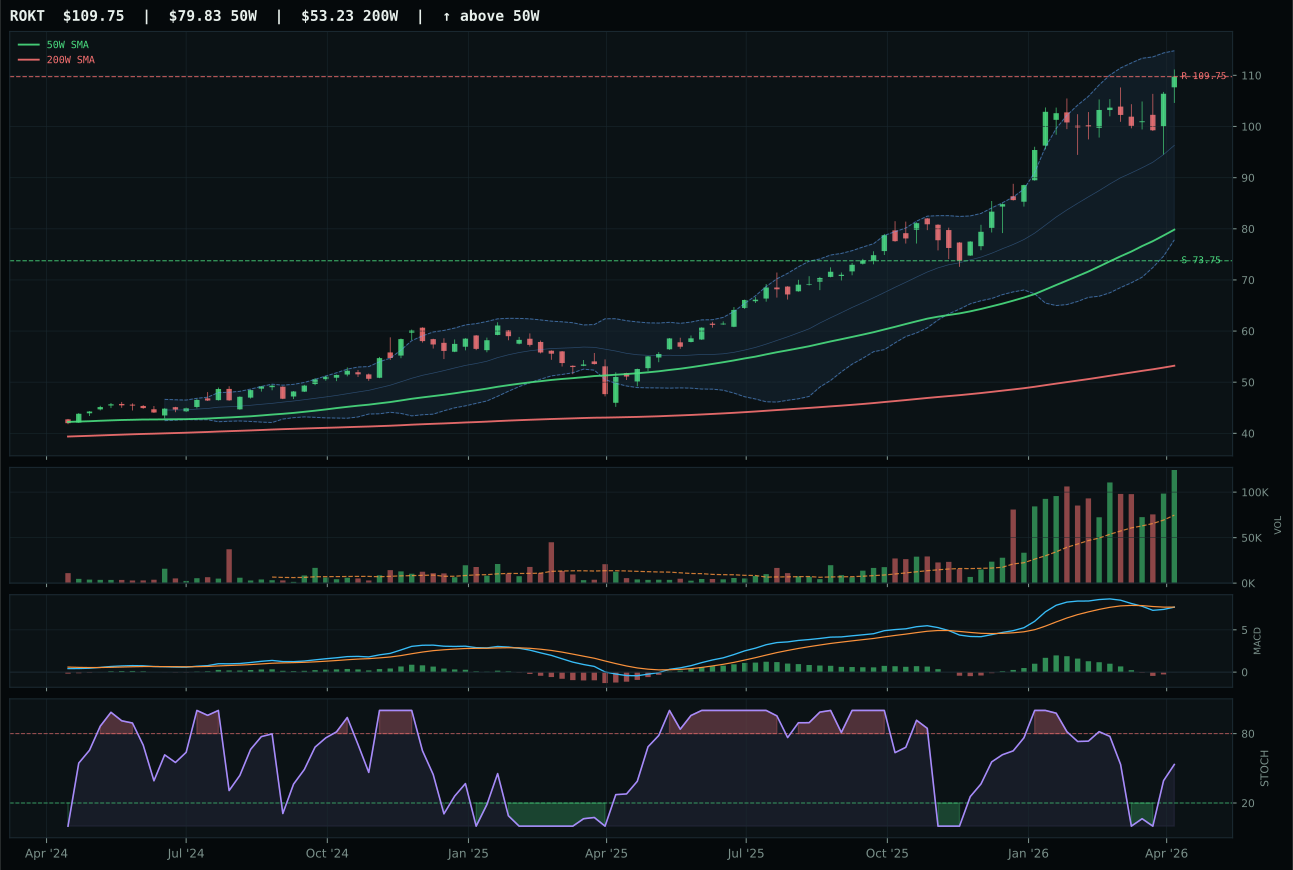
ROKT has a vertical extension profile with 17.1% 13-week relative strength versus SPY.
A failed hold above support would weaken the setup.
Tracked, but not top-2 eligible because: .
XAR wins a narrow decision over ITA on structure and macro fit despite both sharing nearly identical risk/reward profiles at 52.1 and 51.6 respectively. XAR's timing score of 78.0 exceeds ITA's 78.0—wait, they are equal—but XAR benefits from a slightly lower structural cleanliness penalty and better macro narrative alignment (50.0 versus 57.0 macro fit, a reversal in ITA's favor, yet XAR ranks higher overall). The real issue is that ITA appears first in the reasoned proof order at 50.7, suggesting the reasoning layer initially favored ITA before the category-level test adjusted for volume-price sponsorship and persistence. XAR trades 14.4% above its 50W on thin participation (0.74x 20W average), a neutral structure near support at 220.08 and resistance at 292.74, with a MACD that is bearish but not deteriorating. Both charts are mechanically stalled—momentum confirmation for XAR is just 25.4, pulled down by a -3.2% 13W return and weak volume sponsorship.
Defense & Aerospace ranks 46.3 on the category scorecard, a respectable mid-tier position that earns its 10% allocation slot because macro-driven defensive rotation and credit stress support are active. The three-ETF basket leans heavily on ITA's superior technical evidence score (46.6) and macro fit (57.0), but the category representative XAR was selected because the reasoner required better leadership credentials inside the category itself. Both XAR and ITA suffer from the same structural problem: momentum confirmation is weak (25.4 and 31 respectively), and volume-price sponsorship is thin. The allocation holds at 10% rather than 20% because the macro case is situational—defensive rotation scores seven points, but no category-specific descriptor profile exists for XAR itself. This category would require either a sustained sell-off in growth equities to drive rotation velocity or a spike in credit stress indicators to upgrade from a defensive hold to a conviction bet.
Precious Metals — GLD
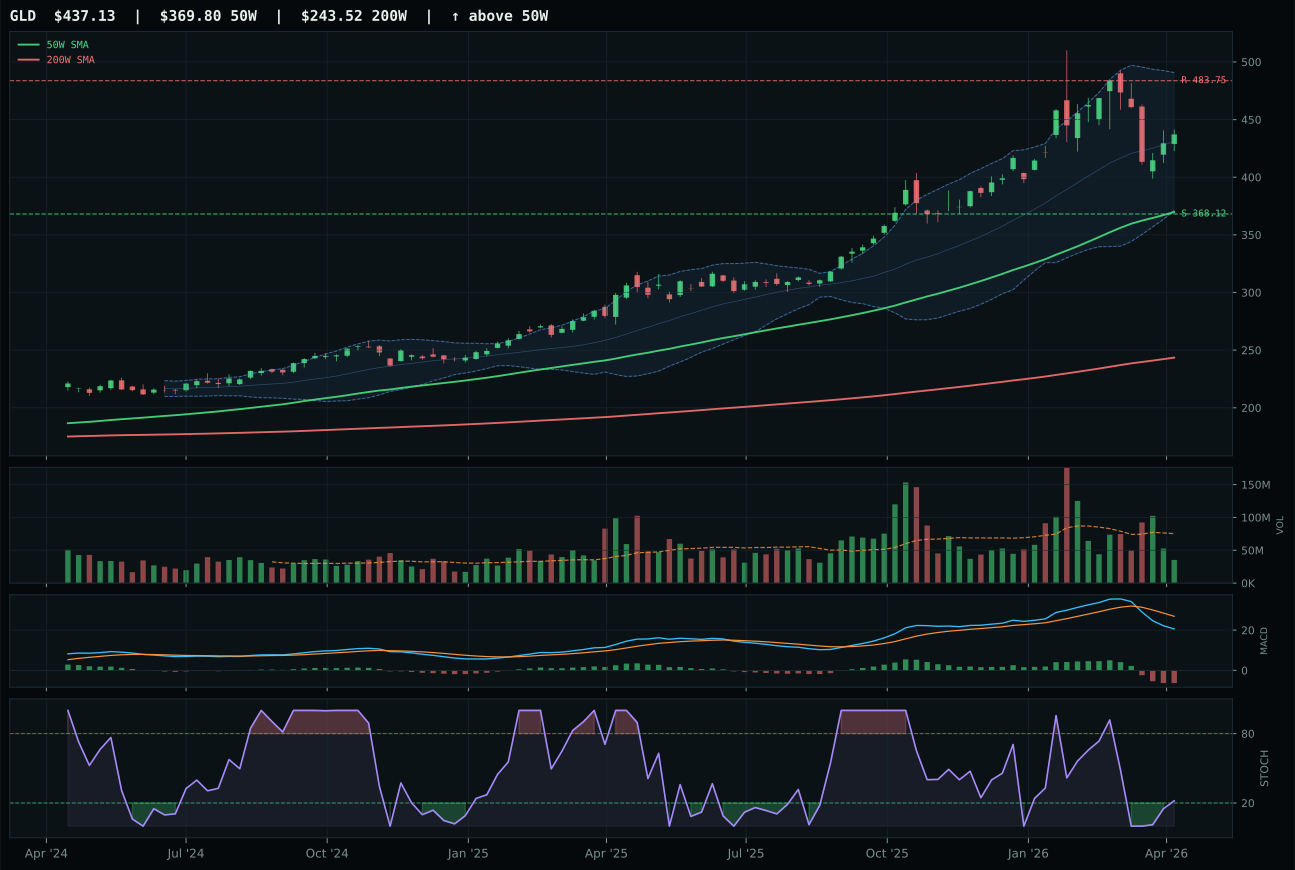
GLD has a vertical extension profile with 7.6% 13-week relative strength versus SPY.
A failed hold above support would weaken the setup.
Actionable but governed by invalidation levels.
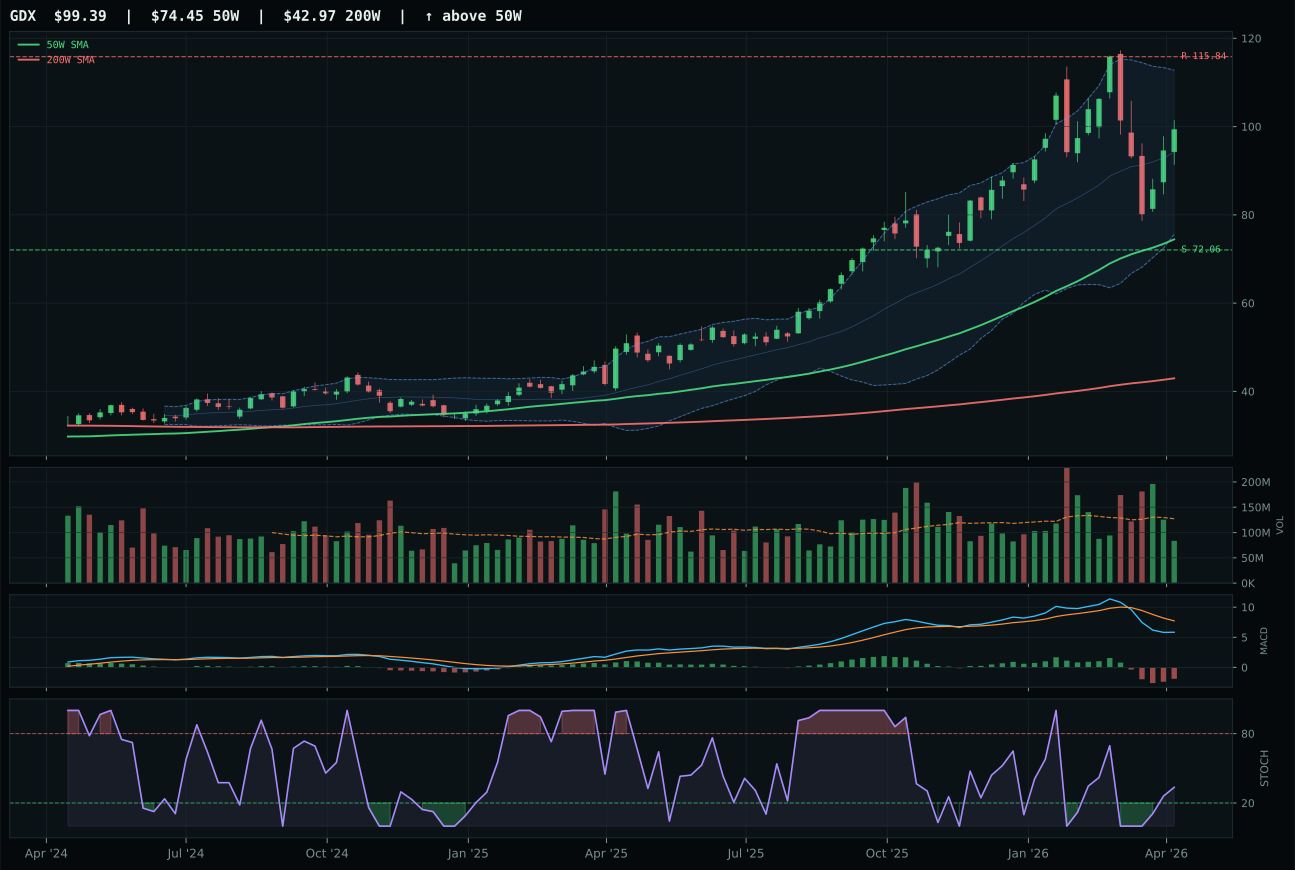
GDX has a vertical extension profile with 9.5% 13-week relative strength versus SPY.
A failed hold above support would weaken the setup.
Actionable but governed by invalidation levels.
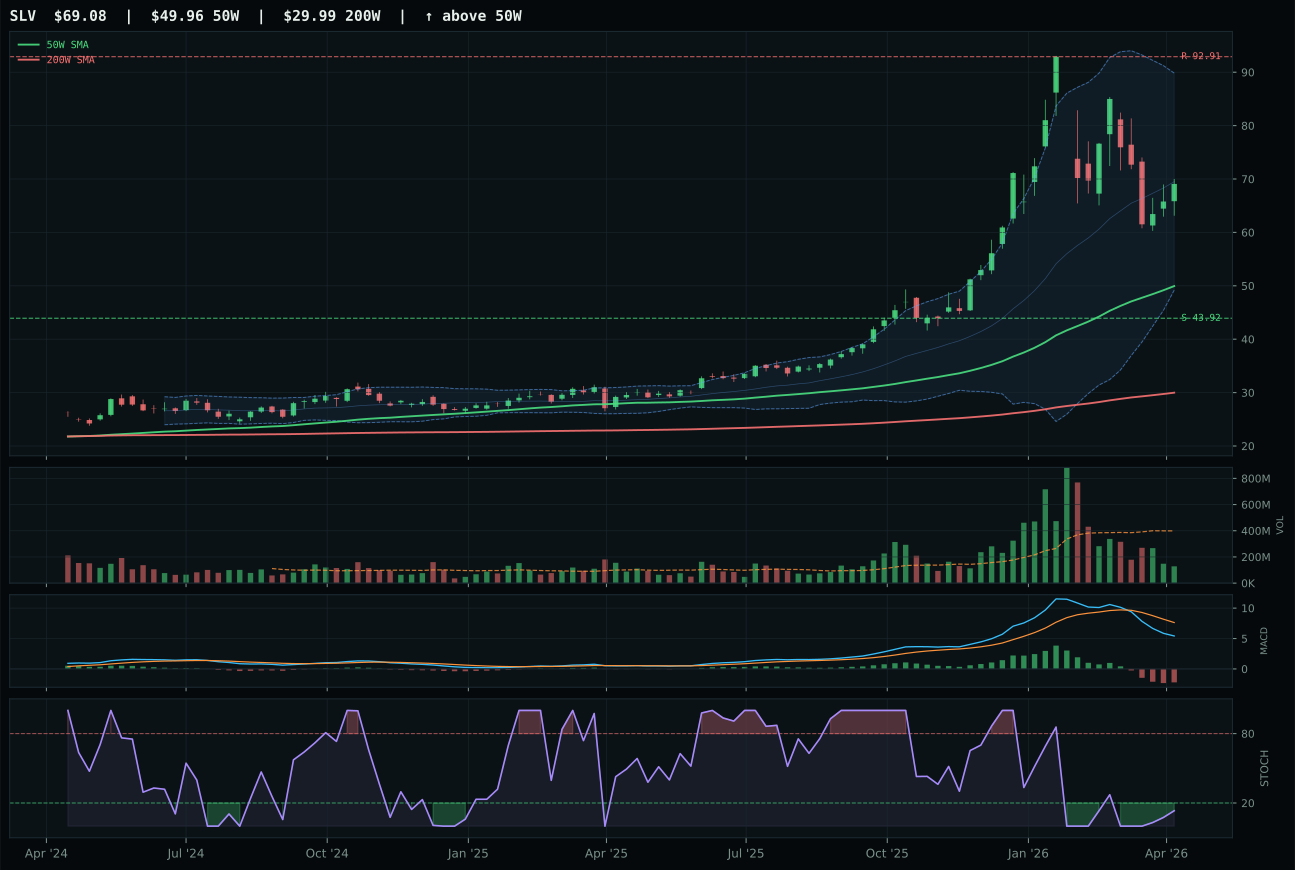
SLV has a vertical extension profile with -2.5% 13-week relative strength versus SPY.
A failed hold above support would weaken the setup.
Actionable but governed by invalidation levels.
GLD beats GDX by just 0.9 points in a photo finish that hinges on risk/reward discipline and structural clarity rather than momentum strength. GLD's 54.2 risk/reward score bests GDX's 36.7 because upside to resistance is only -9.6% versus GDX's implied extension, and downside to support is 18.7% versus GDX's steeper drop—a 2:1 asymmetry that matters when entry conviction is weak. Both charts sit in upper retracement zones near Fib 0.382, and both carry MACD bearish/weakening signals with rising stochastic RSI at mid-zone, but GLD's extension is contained at 18.2% from the 50W while GDX has already traveled 33.5%, exhausting mean-reversion potential. GLD's structure score of 71.2 exceeds GDX's 66.5, and the volume backdrop—though thin at 0.47x and 0.51x the 20W average respectively—shows slightly less distribution pressure in GLD's favor. The momentum confirmation gap is stark: GLD's is 39.5 (pulled down by a -5.1% 4W return) versus GDX's 68 (reflecting near-term beta strength), but that beta came at the cost of exhausted timing.
Precious Metals ranked eighth or ninth at 45.4 score and receives zero allocation this week. Despite a compelling +14 monetary hedge bid in the macro descriptor set, the category's technical evidence of 40.6 for GLD and 22.4 for GDX is simply too weak to justify portfolio space in Transition/Mixed conditions where real assets are being selected for scarcity value (energy, agriculture, metals) rather than macro hedge. GLD's 5.5% thirteen-week return and 7.6% SPY-relative strength are respectable but lag both XLE at 22.0% thirteen-week and VEGI at 16.3%, and the thin 0.47x volume participation suggests no informed accumulation is underway. For Precious Metals to earn allocation, GLD would need either a sustained break above the 483.75 resistance with volume confirmation or a sharp macro regime shift into explicit credit stress or monetary chaos. Until then, the category remains on the sidelines.
Technology — XLK
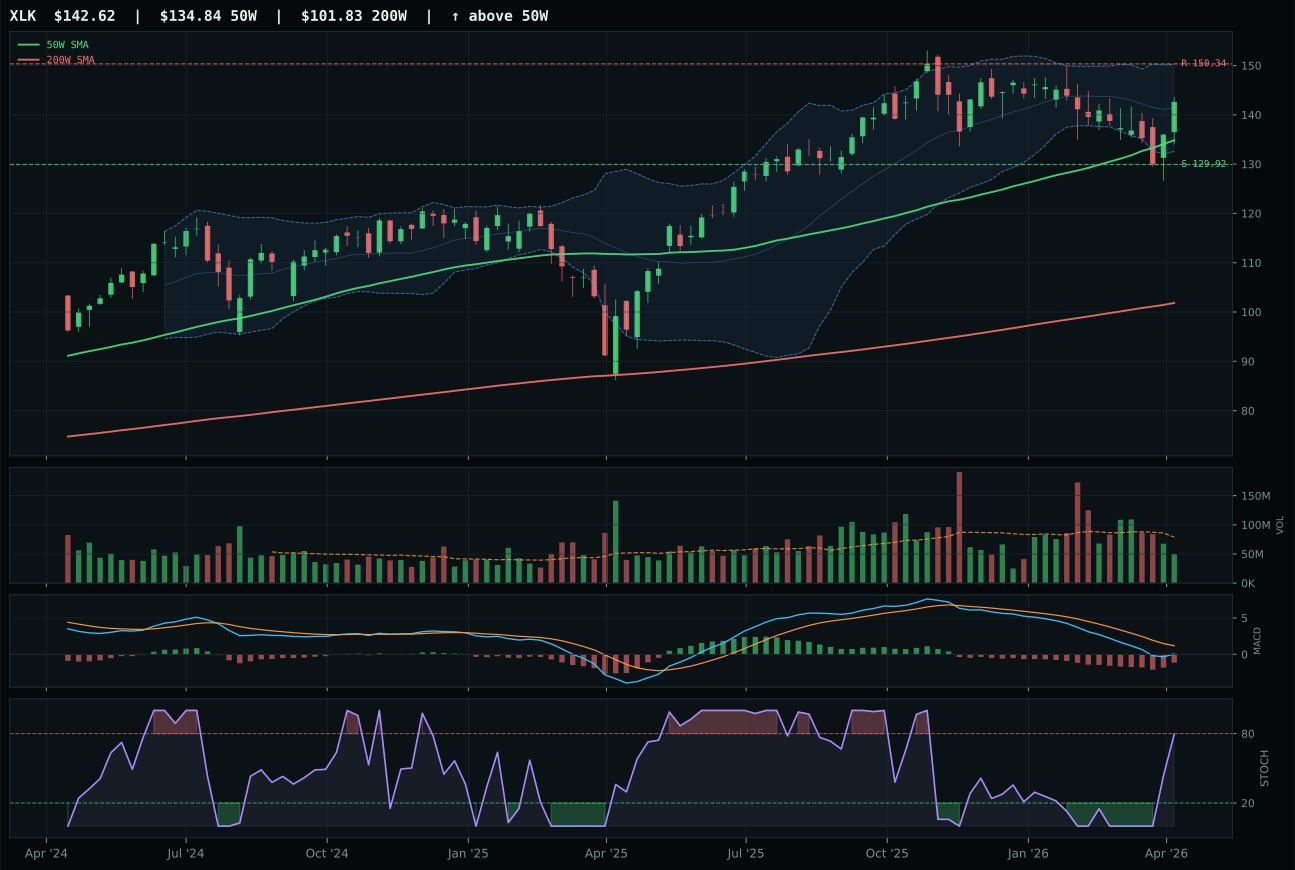
XLK has a neutral structure profile with -0.3% 13-week relative strength versus SPY.
A failed hold above support would weaken the setup.
Actionable but governed by invalidation levels.
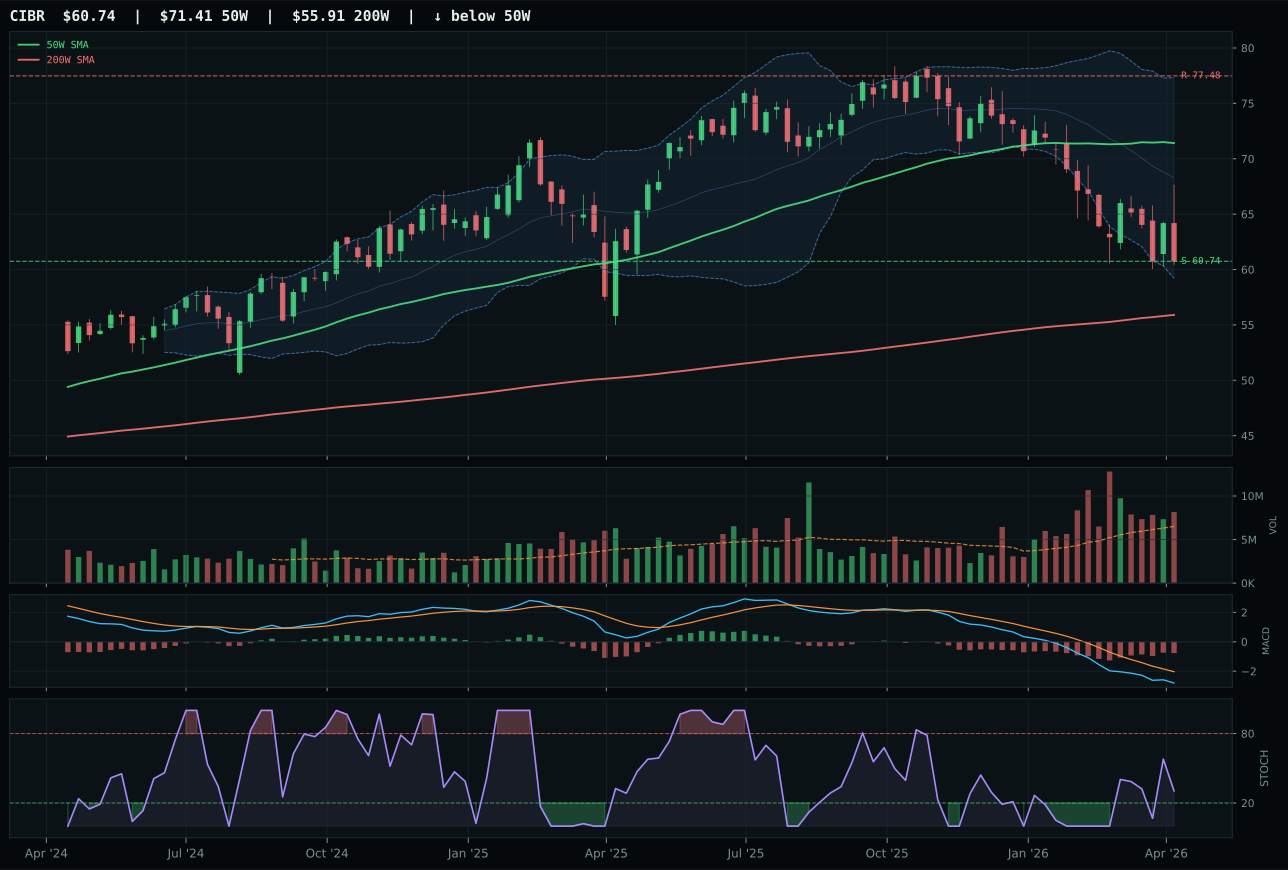
CIBR has a pullback into support profile with -14.2% 13-week relative strength versus SPY.
A failed hold above support would weaken the setup.
Actionable but governed by invalidation levels.
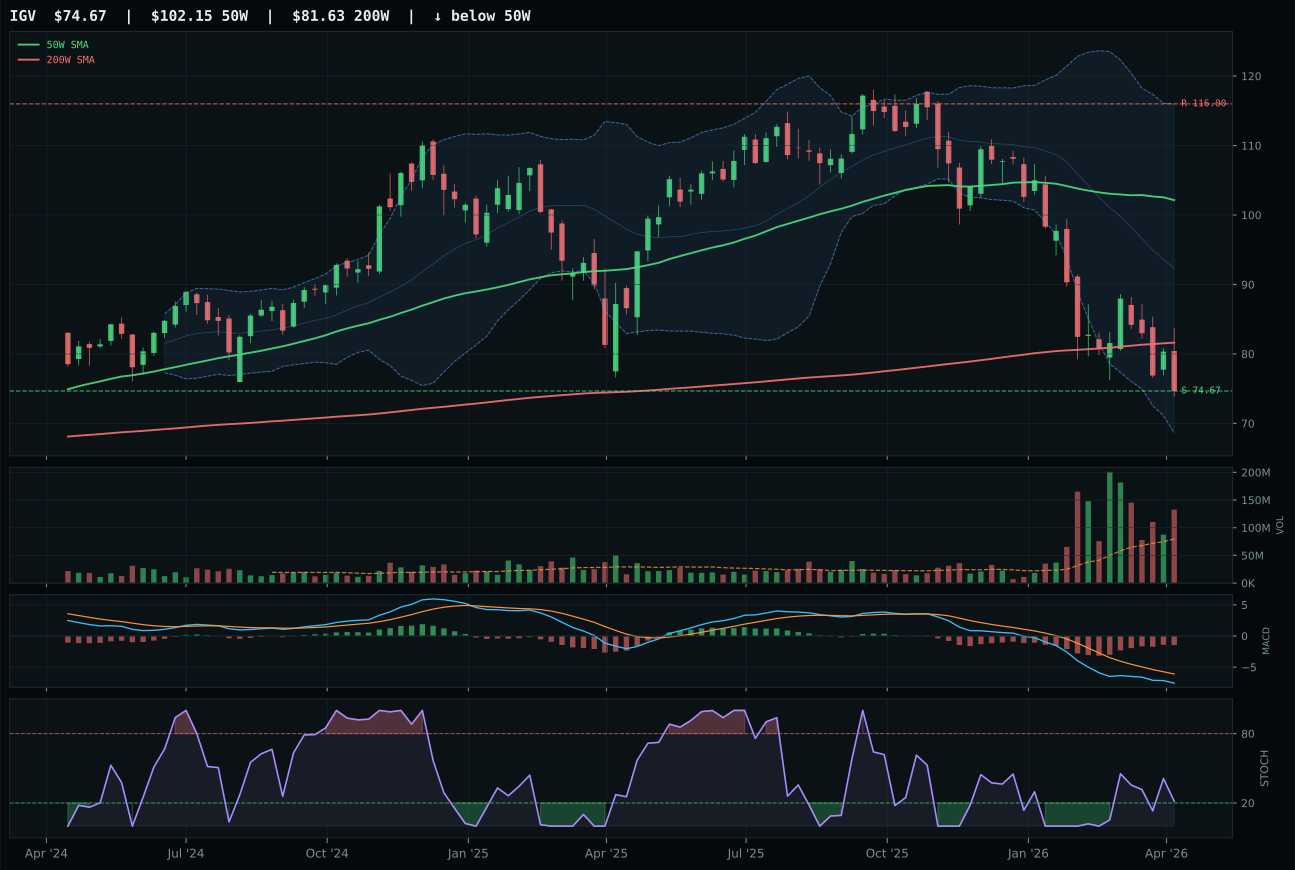
IGV has a pullback into support profile with -26.8% 13-week relative strength versus SPY.
A failed hold above support would weaken the setup.
Actionable but governed by invalidation levels.
XLK wins the category despite a thin technical setup because it commands 13.9% relative strength versus its peer median while CIBR languishes at breakeven category-relative performance. The trend is clean—price sits above both the 50W and 200W with a 0.6% slope—but the real differentiator is XLK's rising stochastic RSI at 0.79 mid-zone versus CIBR's falling/neutral posture at the same level. XLK trades just 5.8% from its 50W, a reasonable entry proximity, whereas CIBR has already fallen into support and sits in a pullback repair zone that leaves less room for conviction. Volume is thin across both names (0.63x and above-average participation respectively), but XLK's MACD is improving while CIBR's remains stuck in deterioration, suggesting the beginning of a technical pivot rather than confirmation of a reversal.
Technology ranked ninth among the ten categories at 43.7 score and receives zero allocation this week. The macro regime shift into Transition/Mixed conditions has eroded the category's traditional sponsorship: credit stress carries a -7 weight against liquidity expansion's +9, leaving a net macro fit of 54.0 that cannot overcome thin participation at 0.63x the 20-week average. XLK's trend score of 92.5 is genuine, but the extended positioning 32.1% above the 50W in SMH (within the AI overlay) and the category's vulnerability to momentum exhaustion in a mixed macro environment pushed Technology below categories with both technical and macro tailwinds. For allocation to return, the category needs either a pullback to reset extension risk or a clear macro descriptor flip—either breakdown of credit stress or confirmation that AI growth sponsorship has broadened beyond the few compute names now carrying the entire sector's relative strength.