
2026-04-03
Informational purposes only. The content in this report, including allocations, analysis, and commentary, is provided solely for informational and educational purposes. It does not constitute financial advice, investment advice, trading advice, or any other type of advice. Past performance does not guarantee future results. Always conduct your own research and consult a qualified financial professional before making investment decisions.
Weekly Allocation
| Ticker | Category | Weight | Role |
|---|---|---|---|
| XLE | Traditional Energy | 20% | Top-2 (20%) |
| VEGI | Agriculture & Livestock | 20% | Top-2 (20%) |
| IGF | Utilities & Infrastructure | 10% | Tier-2 (10%) |
| COPX | Industrial Metals | 10% | Tier-2 (10%) |
| URA | Nuclear Energy | 10% | Tier-2 (10%) |
| SMH | AI | 10% | Tier-2 (10%) |
| XAR | Defense & Aerospace | 10% | Tier-2 (10%) |
| ILF | Emerging Markets | 10% | Tier-2 (10%) |
Trade Instructions — Monday Open
Sell the tranche from 2026-03-06 (completing its 4-week hold). Buy the new tranche. Instructions show net portfolio changes — same-asset positions cancel, weight changes show the delta.
| Action | Ticker | Instruction |
|---|---|---|
| SELL | GLD | Sell 67% of GLD position (reduce 7.50% → 2.50%) |
| SELL | REMX | Sell 50% of REMX position (reduce 5.00% → 2.50%) |
| SELL | XLU | Sell 20% of XLU position (reduce 12.50% → 10.00%) |
| SELL | WEAT | Sell 20% of WEAT position (reduce 12.50% → 10.00%) |
| SELL | NLR | Sell 25% of NLR position (reduce 10.00% → 7.50%) |
| SELL | ITA | Sell 33% of ITA position (reduce 7.50% → 5.00%) |
| SELL | IGV | Sell 50% of IGV position (reduce 5.00% → 2.50%) |
| BUY | COPX | Buy COPX — 12.50% of freed cash (adds 2.50% to portfolio) |
| BUY | ILF | Buy ILF — 12.50% of freed cash (adds 2.50% to portfolio) |
| BUY | IGF | Buy IGF — 12.50% of freed cash (adds 2.50% to portfolio) |
| BUY | SMH | Buy SMH — 12.50% of freed cash (adds 2.50% to portfolio) |
| BUY | VEGI | Buy VEGI — 25.00% of freed cash (adds 5.00% to portfolio) |
| BUY | URA | Buy URA — 12.50% of freed cash (adds 2.50% to portfolio) |
| BUY | XAR | Buy XAR — 12.50% of freed cash (adds 2.50% to portfolio) |
Current Portfolio After Trade
Combined holdings across all 4 active tranches. Each tranche is 25% of the portfolio.
| Ticker | % of Portfolio | Weight Bar |
|---|---|---|
| XOP | 15.00% | |
| XLU | 10.00% | |
| WEAT | 10.00% | |
| NLR | 7.50% | |
| COPX | 7.50% | |
| ITA | 5.00% | |
| AIQ | 5.00% | |
| ILF | 5.00% | |
| IGF | 5.00% | |
| SMH | 5.00% | |
| XLE | 5.00% | |
| VEGI | 5.00% | |
| GLD | 2.50% | |
| REMX | 2.50% | |
| IGV | 2.50% | |
| SLV | 2.50% | |
| URA | 2.50% | |
| XAR | 2.50% |
Macro Regime — Transition / Mixed
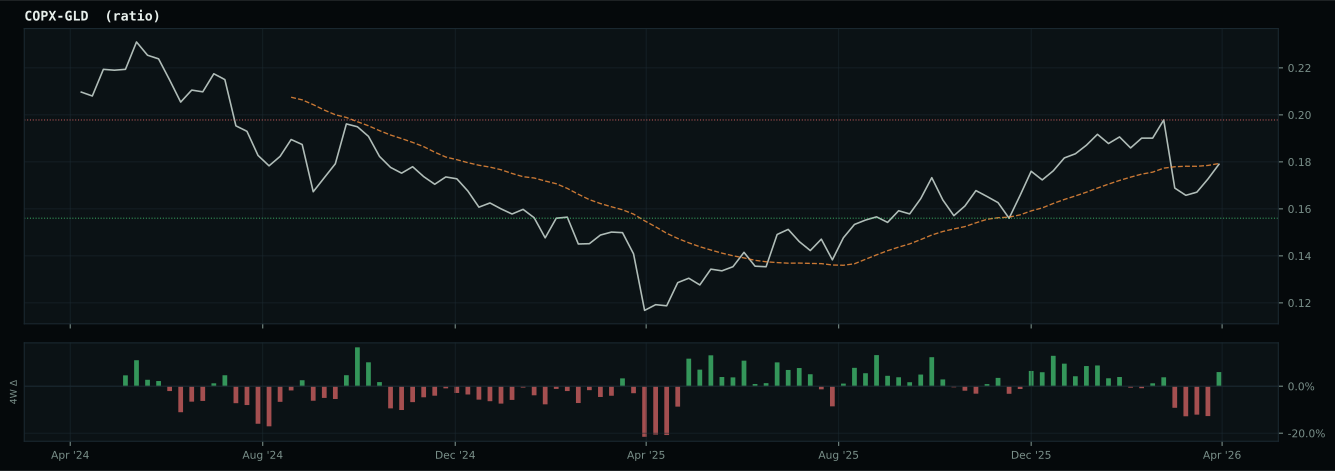
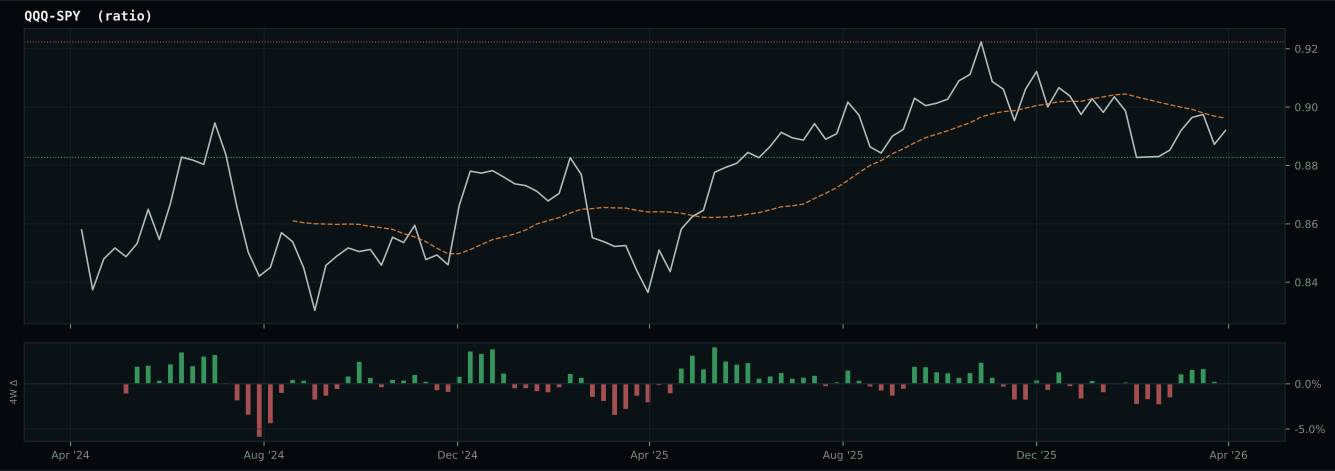
Macro Evidence Charts
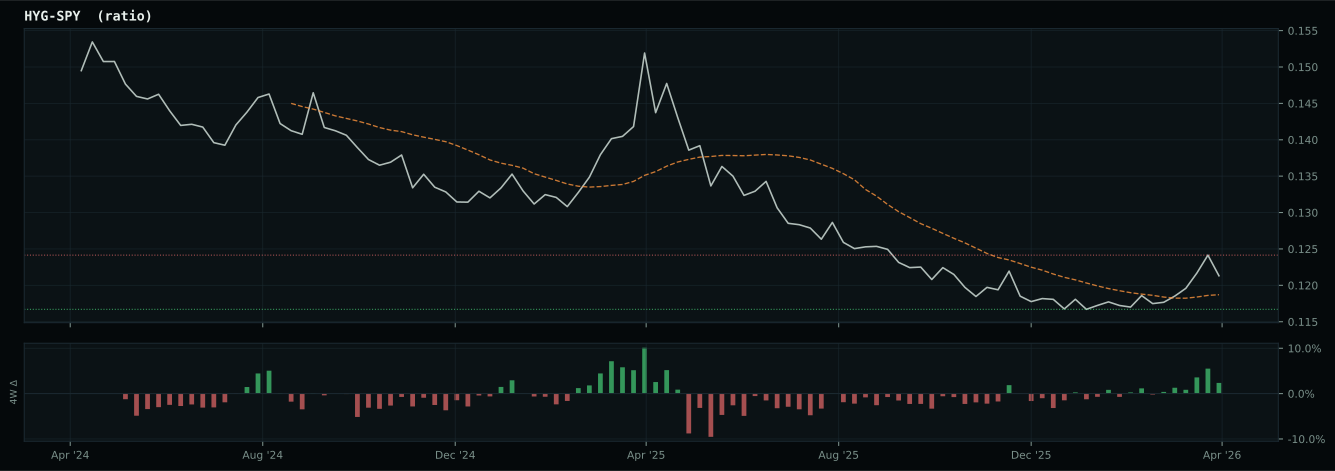
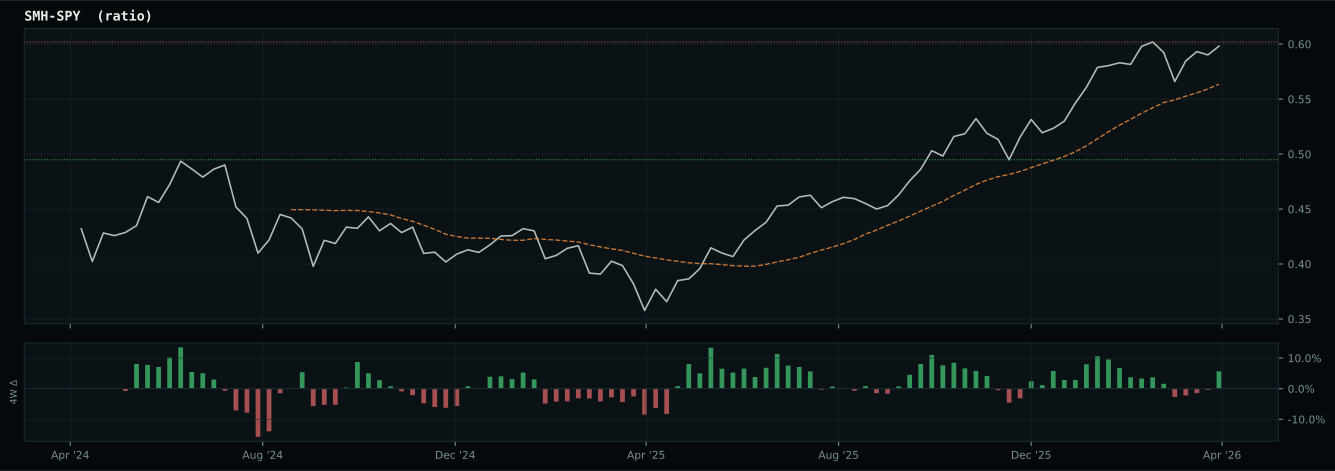
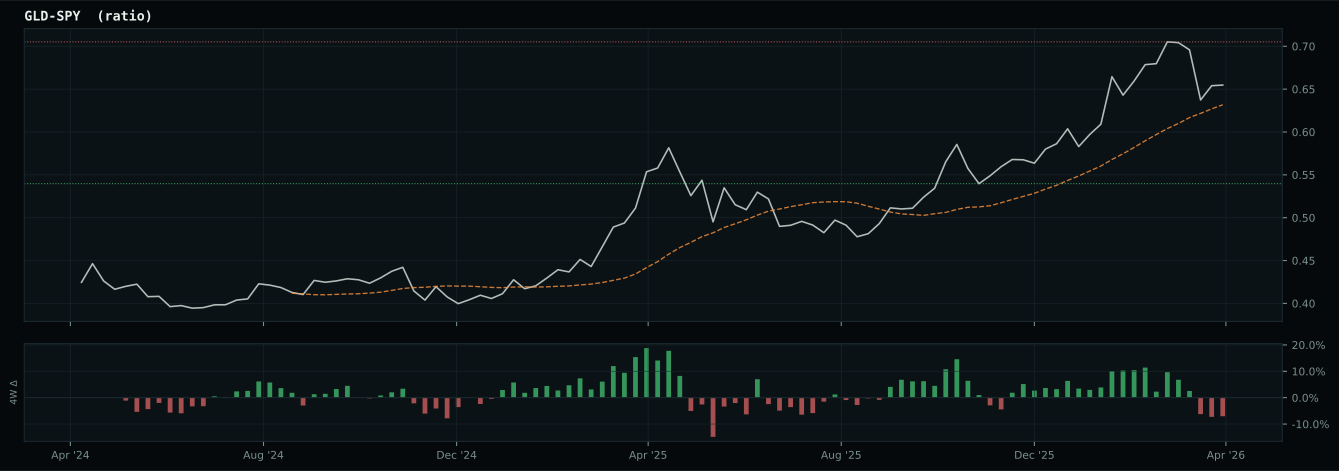
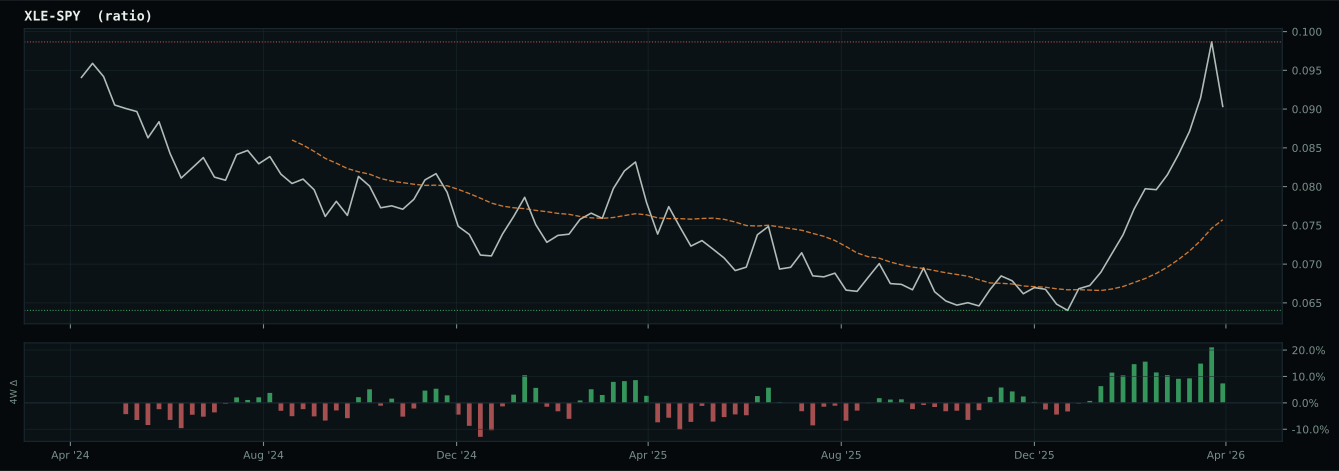
Market-implied signals behind the macro regime scores. Each ratio compares two assets; the direction and slope of the ratio is what the macro engine reads.
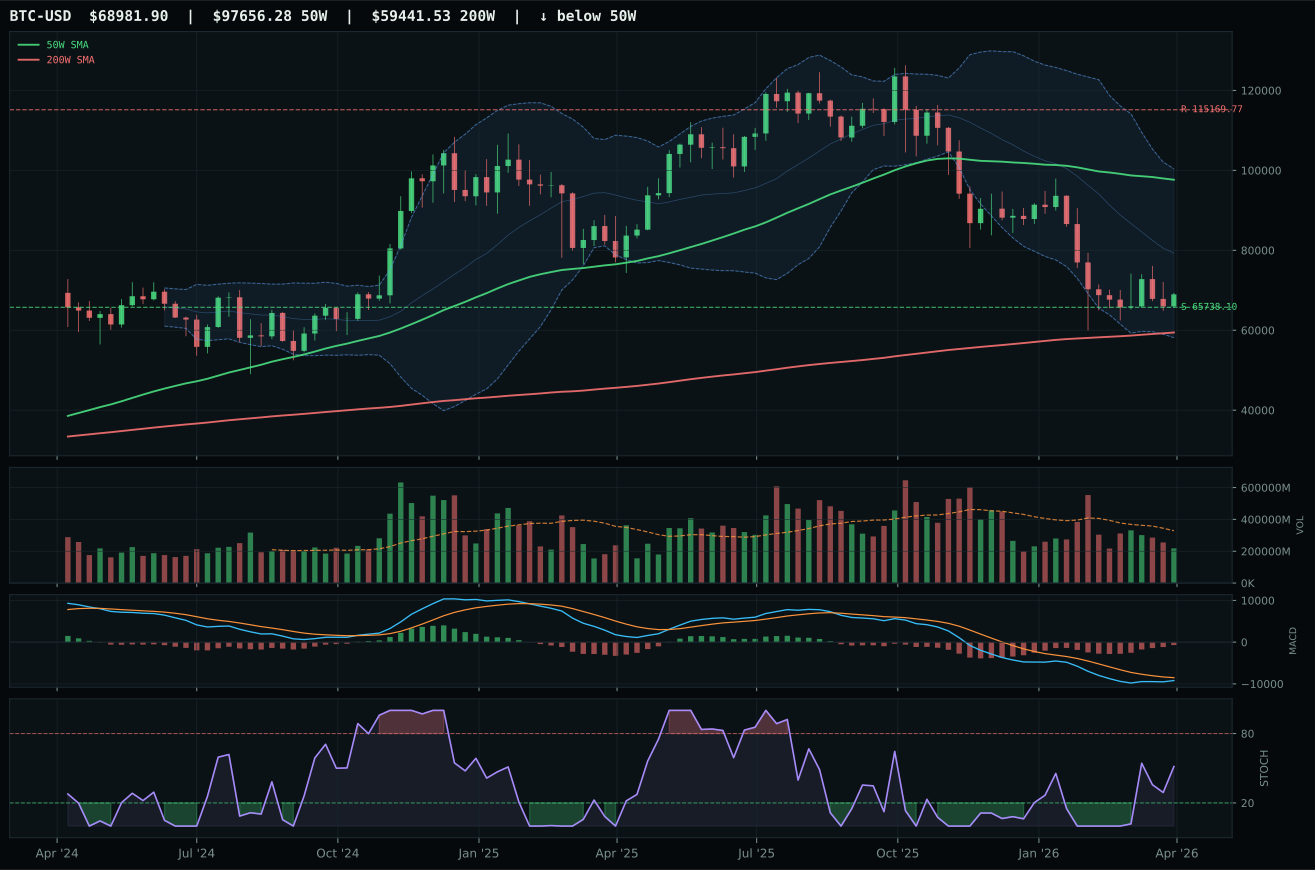
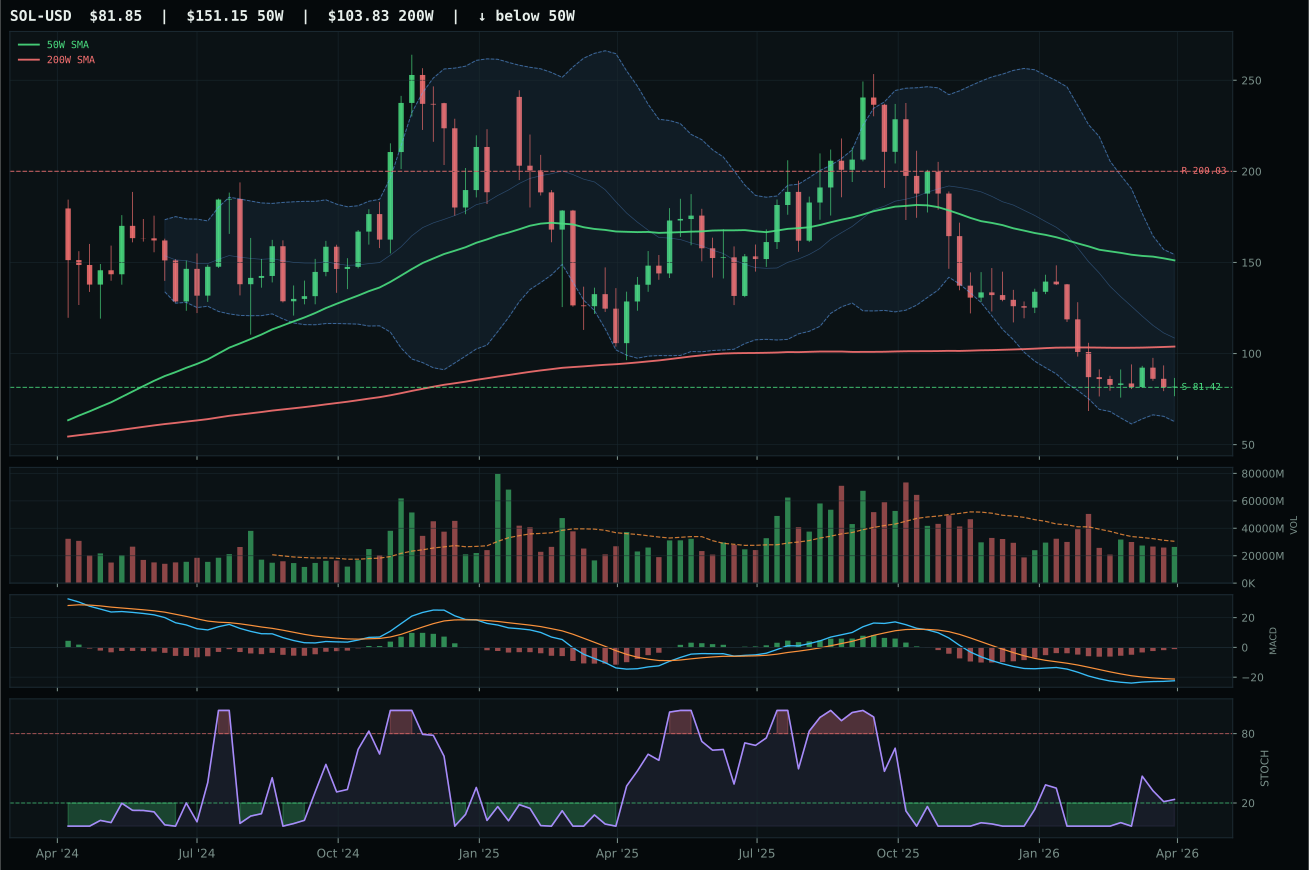
Crypto Regime — NoCrypto
ValueBTC armed by first 200W buy-zone touch, but post-touch range age is 8 weeks; minimum is 12
TrendBTC not confirmed
one or more available conditions failed
Category Rankings
| Rank | Category | Winner | Score | Alloc | 4W Ret | Peers (4W) |
|---|---|---|---|---|---|---|
| 1 | Traditional Energy | XLE | 85.7 | 20% | -0.64% | XOP +0.1% · FCG -0.1% |
| 2 | Agriculture & Livestock | VEGI | 84.8 | 20% | -0.76% | MOO -1.6% · WEAT +4.8% |
| 3 | Utilities & Infrastructure | IGF | 69.6 | 10% | -0.12% | XLU +0.2% · PAVE +10.4% |
| 4 | Industrial Metals | COPX | 56.7 | 10% | +1.43% | PICK +5.8% · REMX +18.2% |
| 5 | Nuclear Energy | URA | 54.6 | 10% | +12.41% | NLR +7.2% · URNM +4.8% |
| 6 | AI | SMH | 49.9 | 10% | +30.15% | AIQ +20.5% · BOTZ +15.0% |
| 7 | Defense & Aerospace | XAR | 48.9 | 10% | -1.72% | ROKT +2.8% · ITA -2.9% |
| 8 | Emerging Markets | ILF | 48.5 | 10% | +1.62% | IEMG +12.7% · INDA +3.5% |
| 9 | Precious Metals | GLD | 48.3 | 0% | -2.34% | GDX -8.6% · SLV +0.8% |
| 10 | Technology | XLK | 44.3 | 0% | +19.22% | CIBR +7.2% · IGV +8.5% |
Traditional Energy — XLE
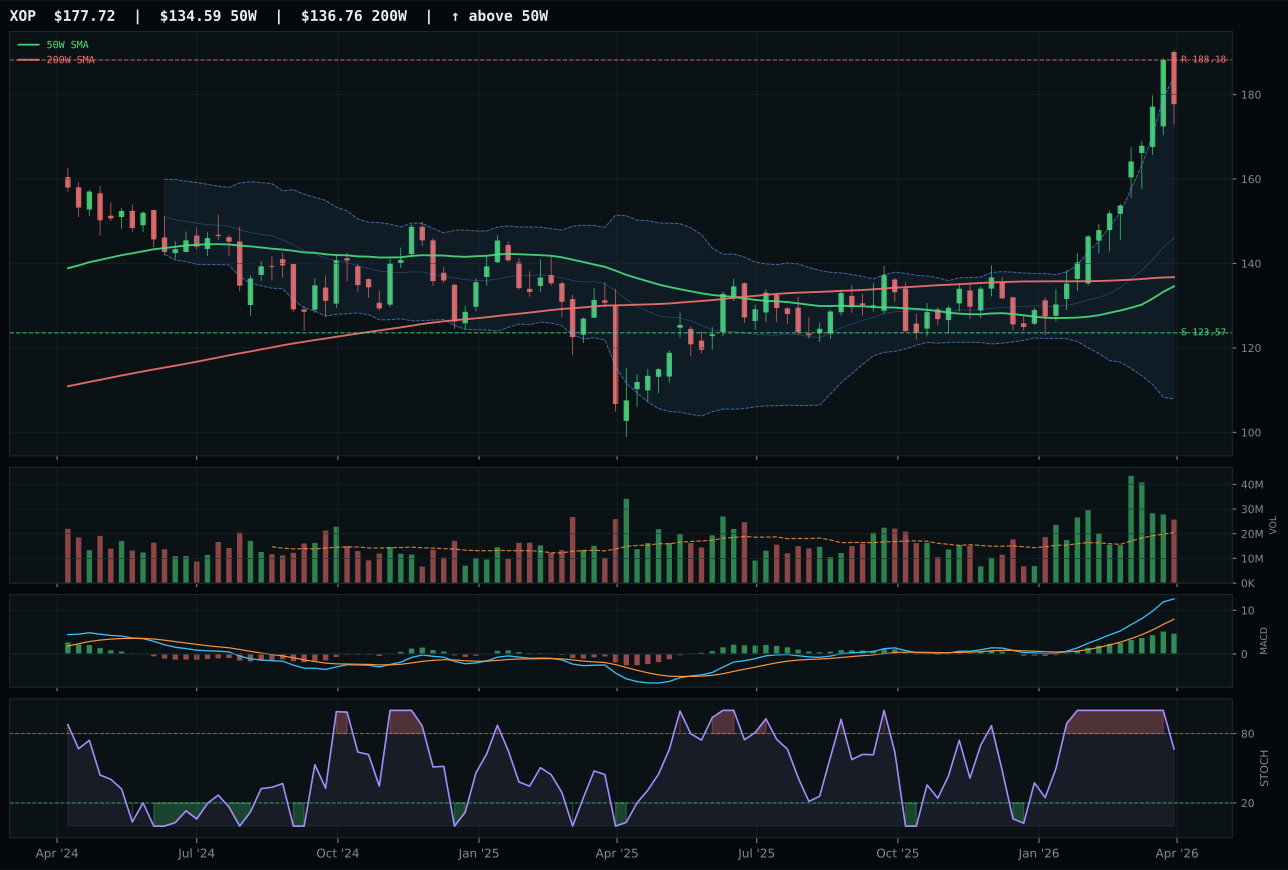
XOP has a vertical extension profile with 41.8% 13-week relative strength versus SPY.
A failed hold above support would weaken the setup.
Actionable but governed by invalidation levels.
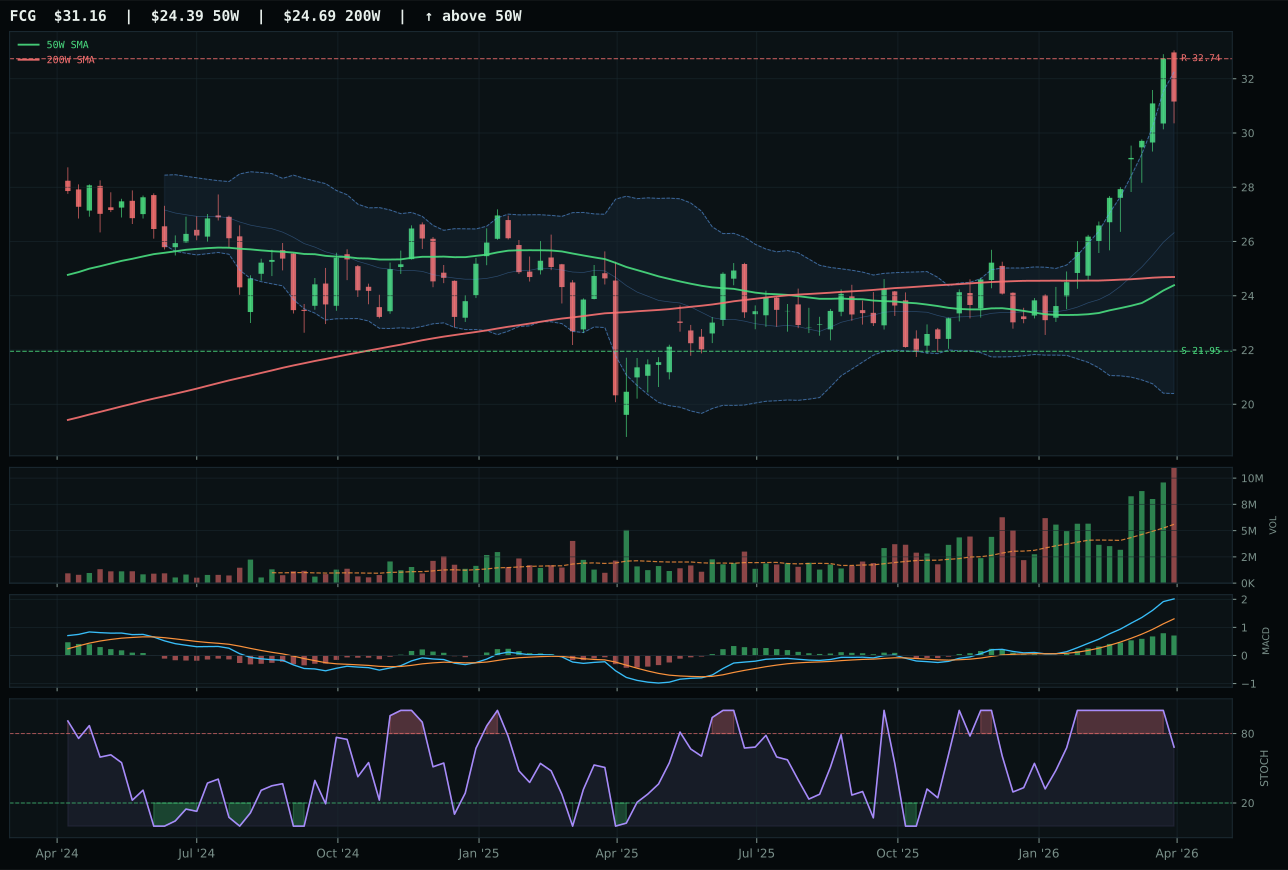
FCG has a vertical extension profile with 34.8% 13-week relative strength versus SPY.
A failed hold above support would weaken the setup.
Actionable but governed by invalidation levels.
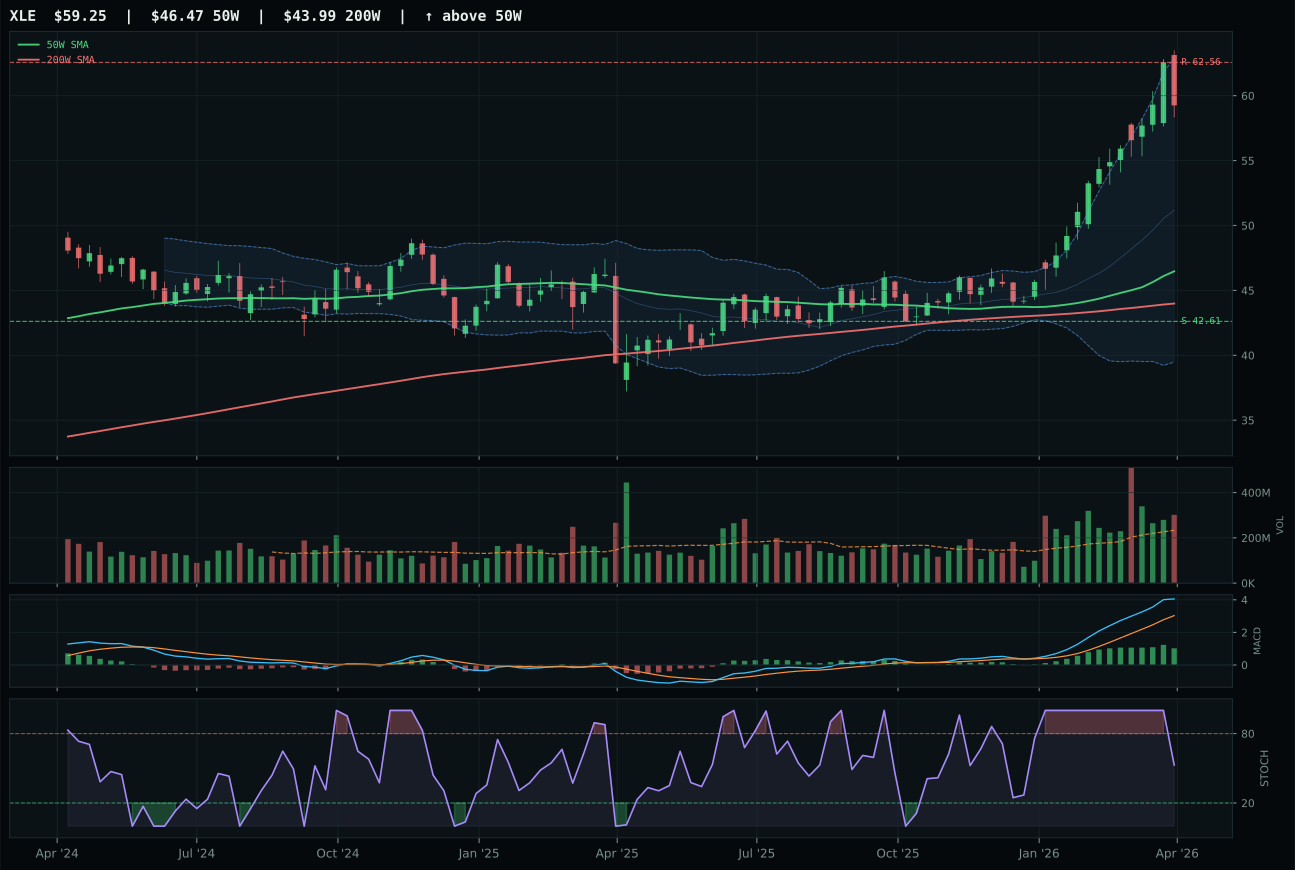
XLE has a vertical extension profile with 33.8% 13-week relative strength versus SPY.
A failed hold above support would weaken the setup.
Actionable but governed by invalidation levels.
XLE captured top-2 allocation despite a lower technical composite (67 vs XOP's 69) because it owns the category-consensus positioning and superior MACD confirmation: bullish but flattening (vs XOP's bullish and improving, which is less cautious) paired with a falling/neutral stochastic RSI that signals the extended move is consolidating rather than overheating. XLE's 29.8% 13W return and 33.8% SPY relative strength are monumental, but the timing score of 48 reflects the 27.5% extension above the 50W—a fair penalty for late entry. XOP's 37.8% 13W return and 41.8% SPY RS are more aggressive, but XOP's volume is above-average participation versus XLE's 1.29x, and XOP's MACD is still improving (showing acceleration) while XLE's is flattening (showing deceleration). In a transition regime where energy scarcity is the dominant narrative (+16 macro points), the flattening MACD is actually the prudent signal: it reflects institutional rotation into energy for duration/hedge rather than momentum chasing. XLE's structure score of 85.8 also beats XOP's implied cleanliness, reinforcing the quality-over-aggression thesis.
Traditional Energy earned 20%—a top-2 allocation—because it scored 85.7, the highest final category score in the entire portfolio. The macro fit is 92% (energy scarcity +16, inflation pressure +10, supply shortage +9, real asset sponsorship +7), representing nearly perfect alignment with the active descriptor set. XLE's 100 trend score and 100 momentum confirmation score are earned, not gifted: price is above both the 50W and 200W, the 4W return is +4.7%, and the 13W return of 29.8% is the evidence. The 47.4 risk-reward is constrained by the extended position, but the volume-price confirmation of 75.5 and persistence of 84.5 tell you this is not a bubble—institutional capital is rotating into energy as a real-asset hedge against inflation and supply disruption. The allocation should be trimmed only if energy demand collapses (recession shock), if OPEC+ signals surprise production hikes, or if XLE closes below the 42.61 support level with a break of the bullish MACD. Until then, it is a core conviction position.
Agriculture & Livestock — VEGI
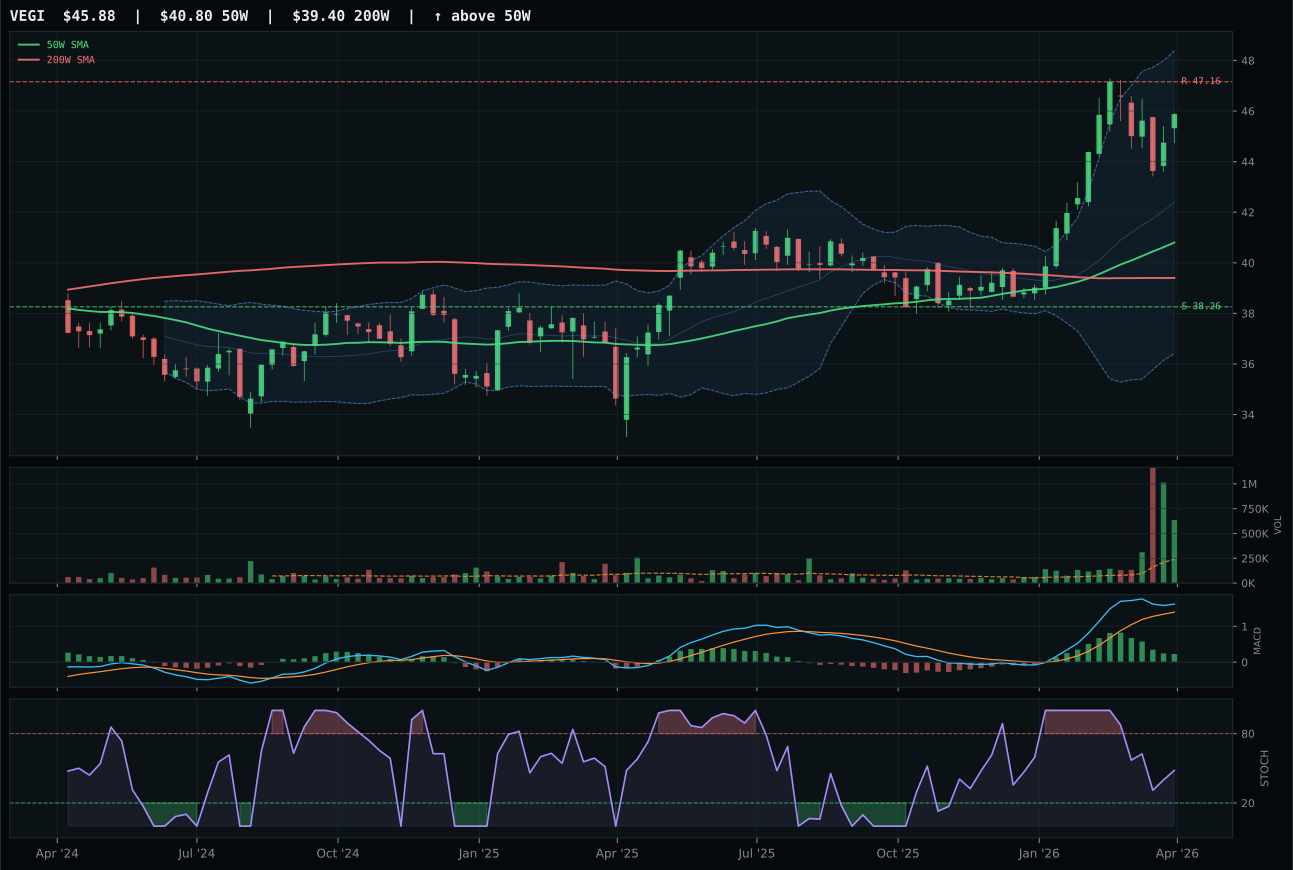
VEGI has a neutral structure profile with 21.6% 13-week relative strength versus SPY.
A failed hold above support would weaken the setup.
Actionable but governed by invalidation levels.
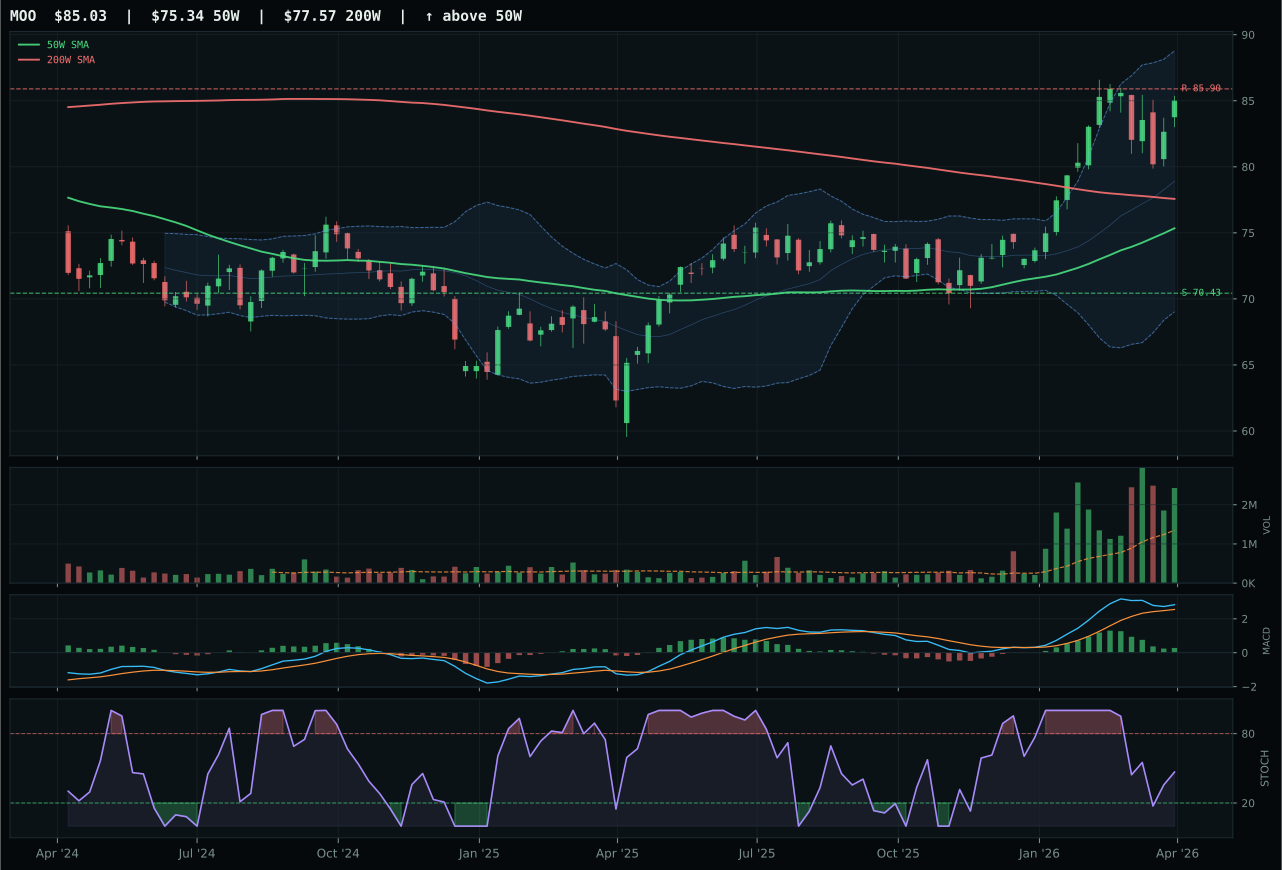
MOO has a neutral structure profile with 19.4% 13-week relative strength versus SPY.
A failed hold above support would weaken the setup.
Actionable but governed by invalidation levels.
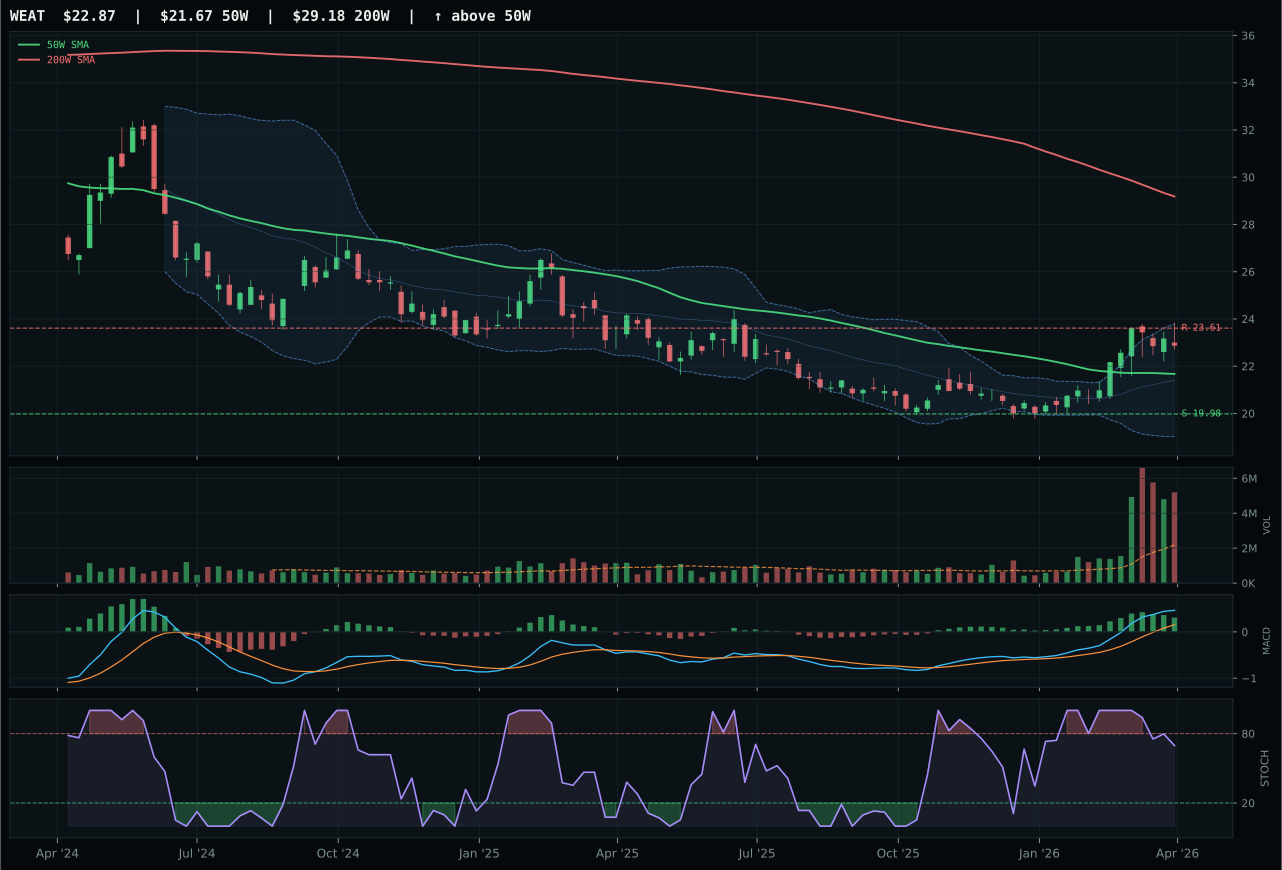
WEAT has a neutral structure profile with 18.4% 13-week relative strength versus SPY.
A failed hold above support would weaken the setup.
Actionable but governed by invalidation levels.
VEGI dominates because it owns the volume-price confirmation that validates every other technical signal: 2.65x the 20W average in accumulation/confirmation, paired with a bullish MACD (albeit flattening) and 21.6% SPY relative strength that is the highest in the category. The 13W return of 17.6% and 100.0 momentum confirmation score show institutional capital is actively rotating into ag producers, not just drifting with sentiment. MOO trails by only 3.4 points in the category decision, but that gap is entirely driven by VEGI's superior category-relative strength (2.2% vs 0.0%), because both sit at neutral structure, both show rising 13W returns (17.6% vs 15.4%), and both have bullish-but-flattening MACD. The volume edge is decisive: VEGI's 2.65x participation indicates conviction, while MOO's volume is equally heavy but MOO is not gaining relative ground inside the peer set. For a category with 86% macro fit (supply shortage at +13, inflation at +10, real asset sponsorship at +8), the allocator must choose the name showing the clearest accumulation vector.
Agriculture & Livestock earned 20%—a top-2 allocation—because it scored 84.8, the second-highest eligible final score after Energy. The macro environment is nearly perfect: supply shortage active, inflation pressure active, commodity breadth positive, and real asset sponsorship live. VEGI's near-52W high positioning (near Fib 0.236 at 43.93) would normally be penalized, but the 95.1 volume-price confirmation and 92.1 persistence scores override the 44.5 risk-reward weakness. This is a category where momentum + macro alignment > entry-price perfection. The allocation sits at 20% because it is battle-tested: if supply disruptions persist or inflation refuses to roll over, ag will continue to lead; if demand collapses or central banks shock the market with deflation signals, VEGI's extended valuation (only 2.7% upside to resistance) would evaporate quickly. The position should be trimmed on any break of the 38.26 support or sustained MACD rollover, but for now it is a core conviction slot.
Utilities & Infrastructure — IGF
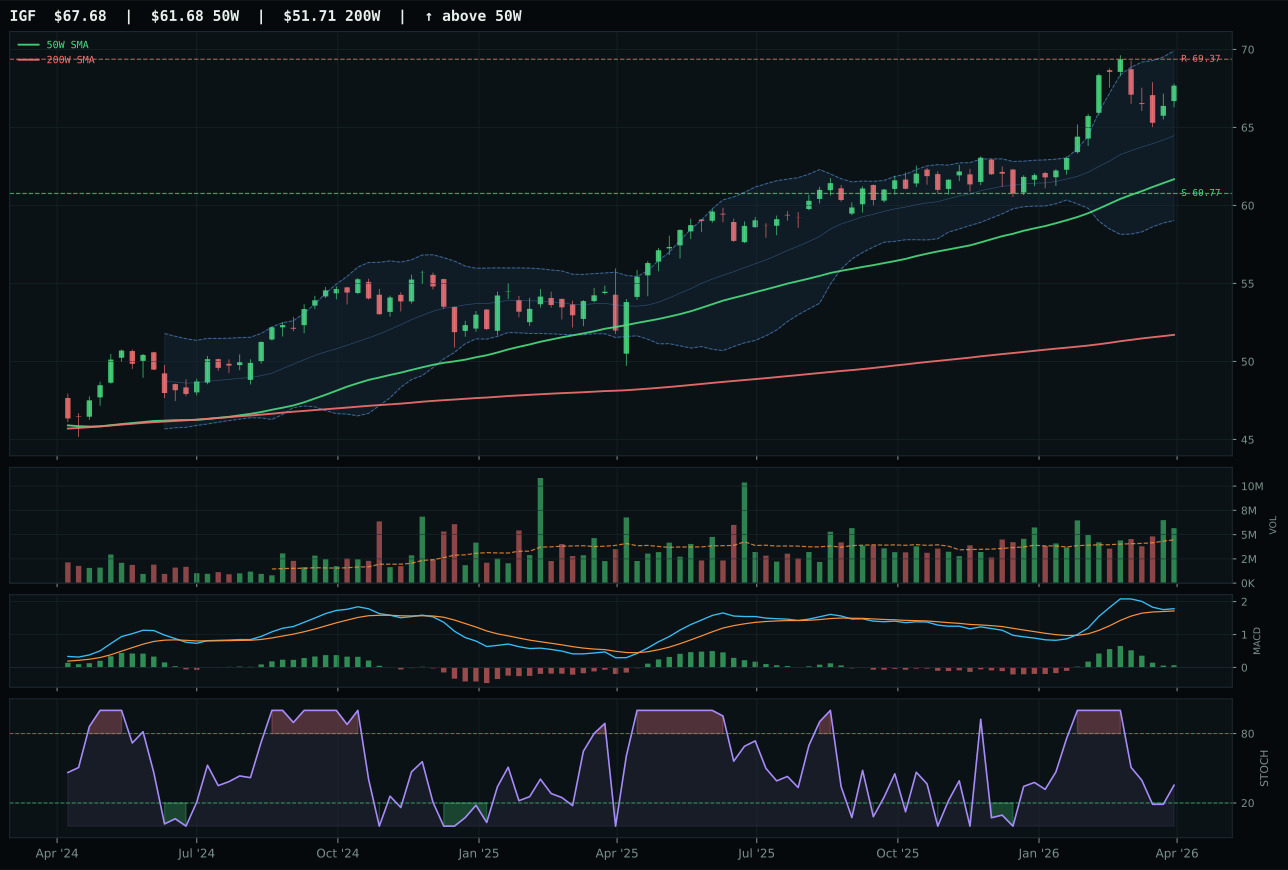
IGF has a neutral structure profile with 13.3% 13-week relative strength versus SPY.
A failed hold above support would weaken the setup.
Actionable but governed by invalidation levels.
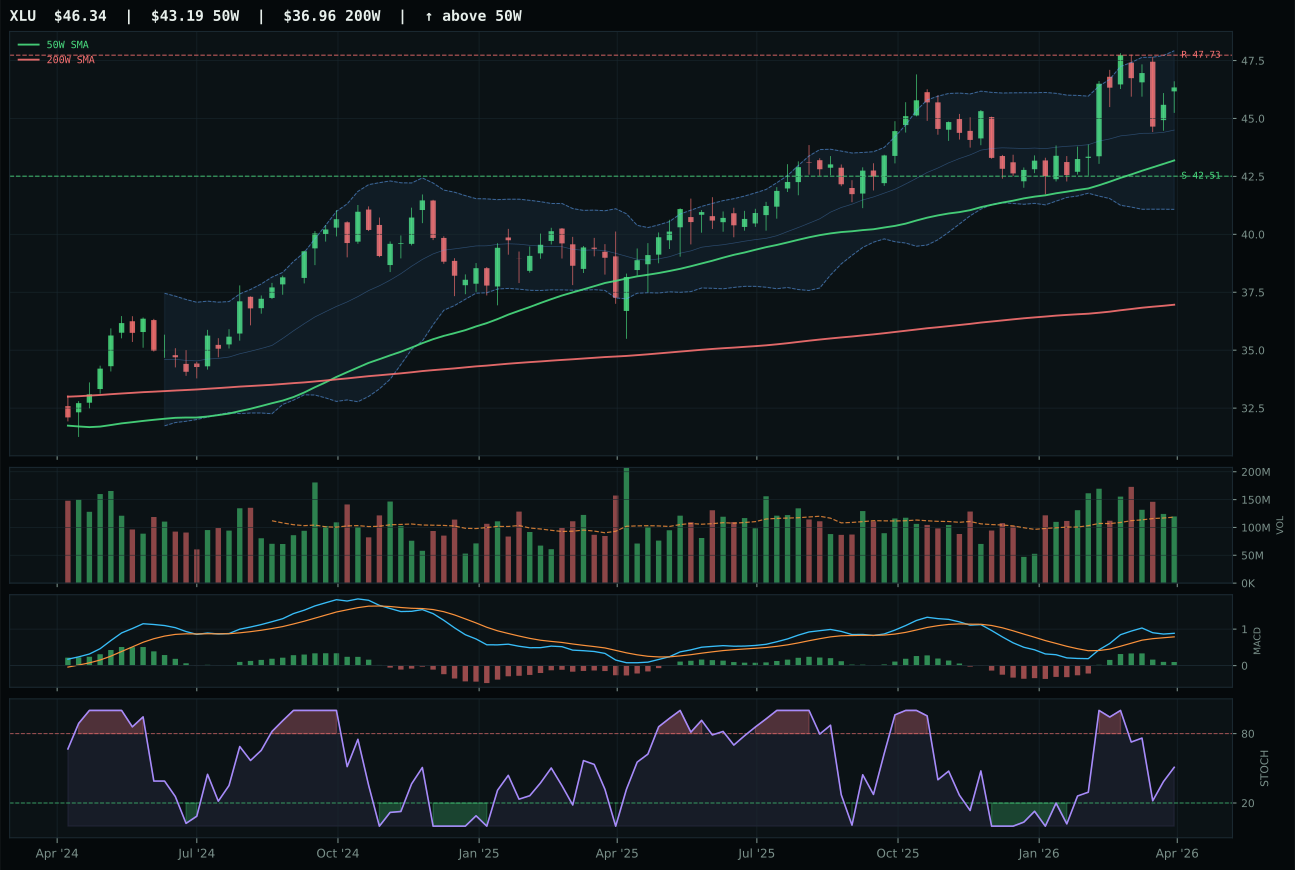
XLU has a neutral structure profile with 11.3% 13-week relative strength versus SPY.
A failed hold above support would weaken the setup.
Actionable but governed by invalidation levels.
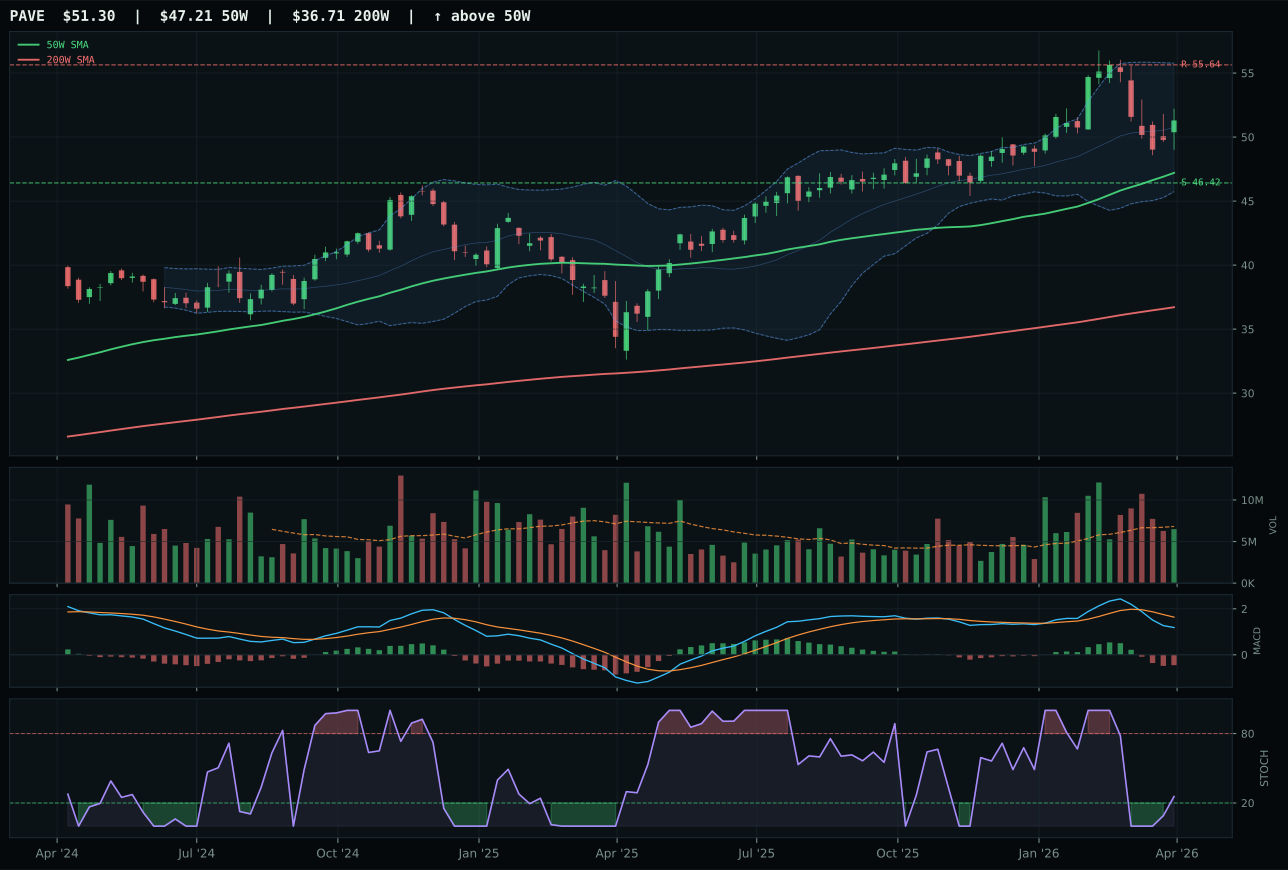
PAVE has a neutral structure profile with 9.0% 13-week relative strength versus SPY.
A failed hold above support would weaken the setup.
Actionable but governed by invalidation levels.
IGF won a close 1.9-point decision over XLU by owning better structure (83.5 vs 77.0) and above-average volume participation (1.27x vs neutral), signaling institutional conviction behind global infrastructure income. Both sit at neutral structure and both show bullish-but-flattening MACD with falling/neutral stochastic RSI, so the technical setup is nearly identical. IGF's 9.3% 13W return and 1.9% category-relative strength edge XLU's 7.3% and 0.0%, a modest but consistent margin. Volume confirmation at 80.7 and persistence at 74.5 for IGF indicate the rally is institutional (not retail chasing), while XLU's neutral volume (0.79x unspecified 20W measure) suggests distribution or lack of follow-through. Both face extended positioning at 9.7% and 8.5% respectively above the 50W, but IGF's above-average participation overrides the timing risk. The category-relative advantage of 1.9% tells you IGF is the chosen play inside defensive infrastructure, not a coin flip.
Utilities & Infrastructure earned 10% because the category score of 69.6 ranks third among eight eligible categories. The macro fit of 64% includes defensive rotation (+12) and broad market bear (+4), partially offset by inflation pressure (-6), reflecting a regime where defensive equity is wanted but not without cost-of-capital concerns. IGF's technical evidence of 79.2 is the strongest outside the top-2 Energy and Agriculture categories, and the trend score of 100 (price above 50W and 200W) shows the move is intact. However, the risk-reward of 40.9 (only 2.4% upside to 69.37 resistance, 11.4% downside to support) means there is limited room to run. The allocation holds because inflation remains embedded and rate volatility will drive money toward yield and real assets; infrastructure income is the defensive play for investors hedging recession while maintaining some equity beta. If IGF closes below 60.77 support or if inflation prints cool decisively, the allocation should rotate toward XLU or exit entirely.
Industrial Metals — COPX
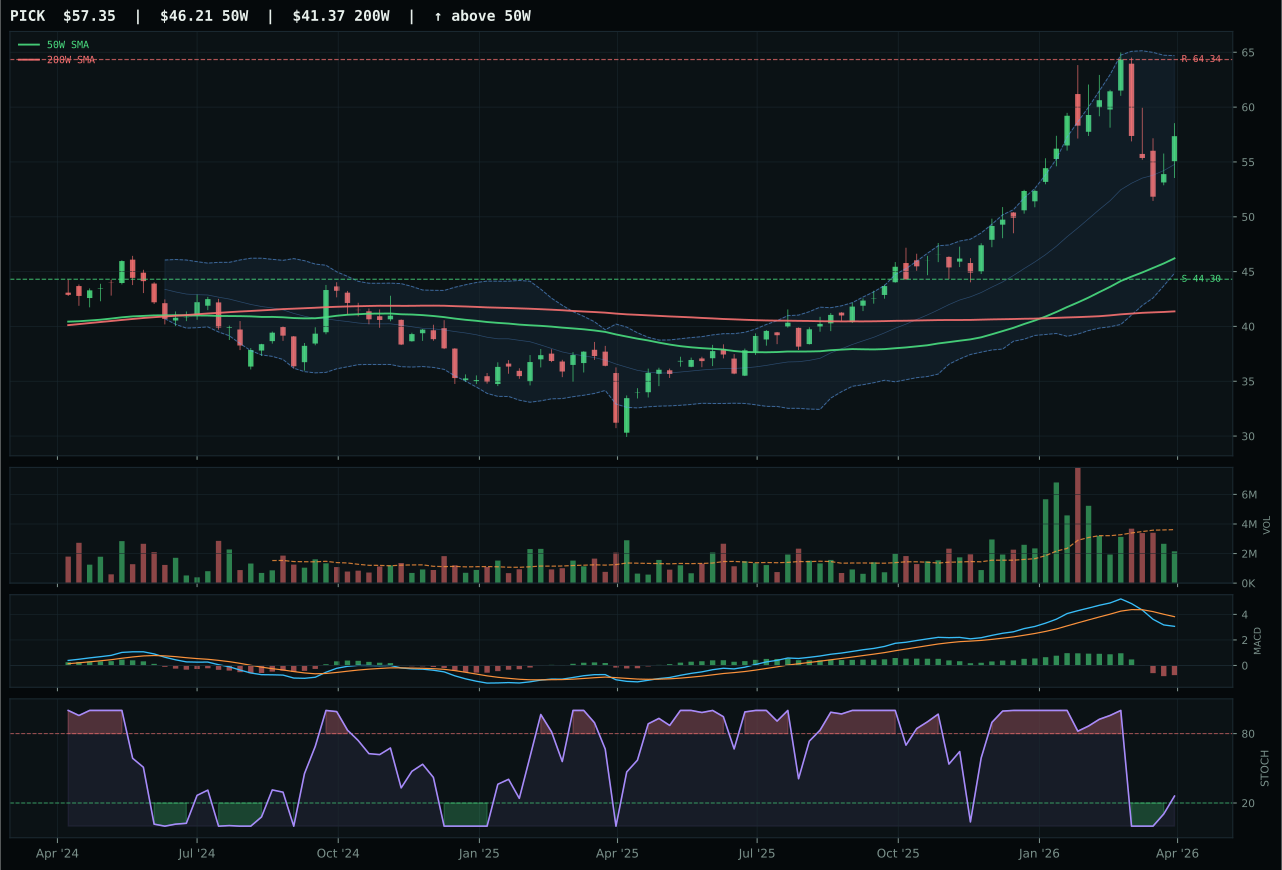
PICK has a vertical extension profile with 13.5% 13-week relative strength versus SPY.
A failed hold above support would weaken the setup.
Actionable but governed by invalidation levels.
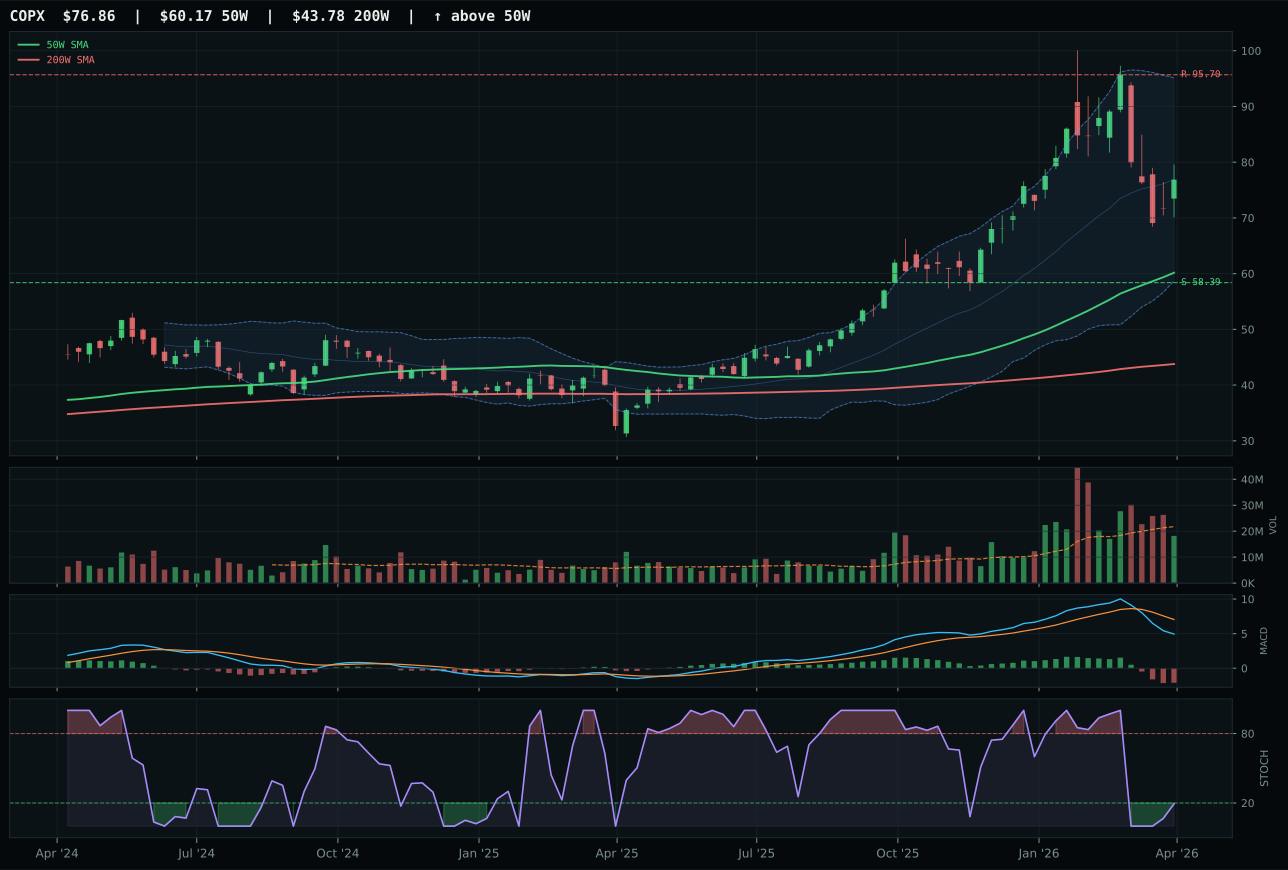
COPX has a vertical extension profile with 9.2% 13-week relative strength versus SPY.
A failed hold above support would weaken the setup.
Actionable but governed by invalidation levels.
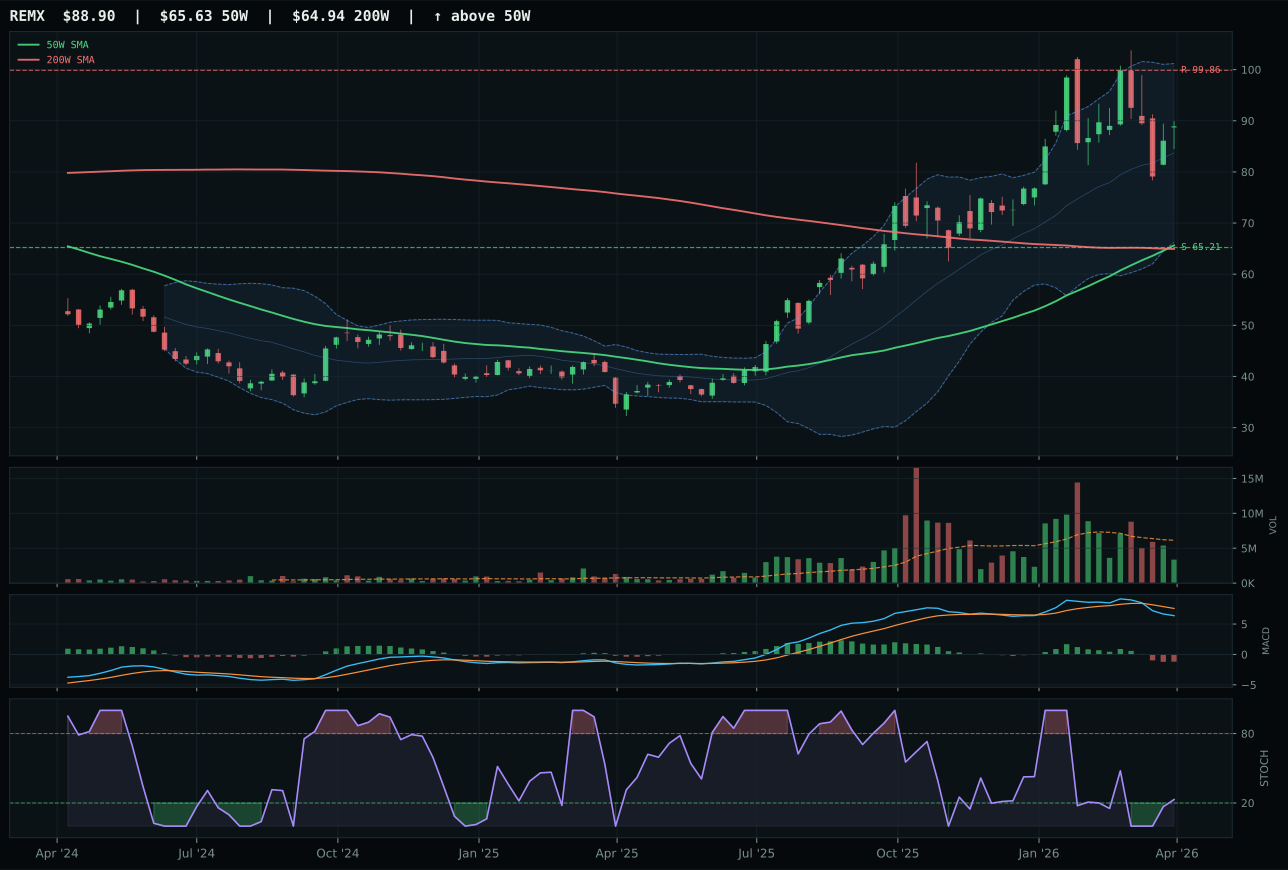
REMX has a vertical extension profile with 19.8% 13-week relative strength versus SPY.
A failed hold above support would weaken the setup.
Actionable but governed by invalidation levels.
COPX won despite a lower composite score (53 vs PICK's 64) because the stochastic RSI at oversold turn-up (0.19) and timing score of 62 edge out PICK's rising mid-zone and 56 timing—a subtle but critical difference in a macro regime where metals scarcity is the dominant theme. COPX's 27.7% extension above the 50W is severe (risk-reward 41.2 is the worst in the category), but the oversold stochastic signal indicates the move is not exhausted, whereas PICK's rising stochastic at 56 timing suggests late-stage participation. Volume is neutral for COPX (0.84x) and thin for PICK (thin participation), so neither has conviction sponsorship; the decision rests on momentum-cycle positioning. COPX's 5.2% 13W return lags PICK's 9.5%, yet COPX wins because it sits on a more favorable technical re-entry signal. The category-relative strength is negative (-4.3%), which tells you copper is not the strength driver inside metals—but the macro fit (metals scarcity +14, commodity breadth +10) overrides peer comparison and forces the allocator to take the cleaner technical setup.
Industrial Metals earned 10% because the category score of 56.7 ranks fourth, behind Energy (85.7), Agriculture (84.8), and Utilities (69.6). The macro fit of 80% is strong (metals scarcity +14, commodity breadth +10, real asset sponsorship +6), and COPX's selection reflects the category's structural case. However, the technical evidence of only 16.8 is a red flag: COPX is extended, volume is neutral, and neither PICK nor REMX offers a safer entry. The category is allocated because copper and base metals are genuine supply-constrained and Chinese demand is a wild card in the transition regime; if China stimulus accelerates or infrastructure spending surprises, COPX will re-rate higher. The downside risk is severe: if the next China PMI disappoints or recession fears trigger a commodity selloff, COPX's 41.2 risk-reward becomes immediately painful. The allocation should tighten on any close below 58.39 support or sustained MACD negative divergence.
Nuclear Energy — URA
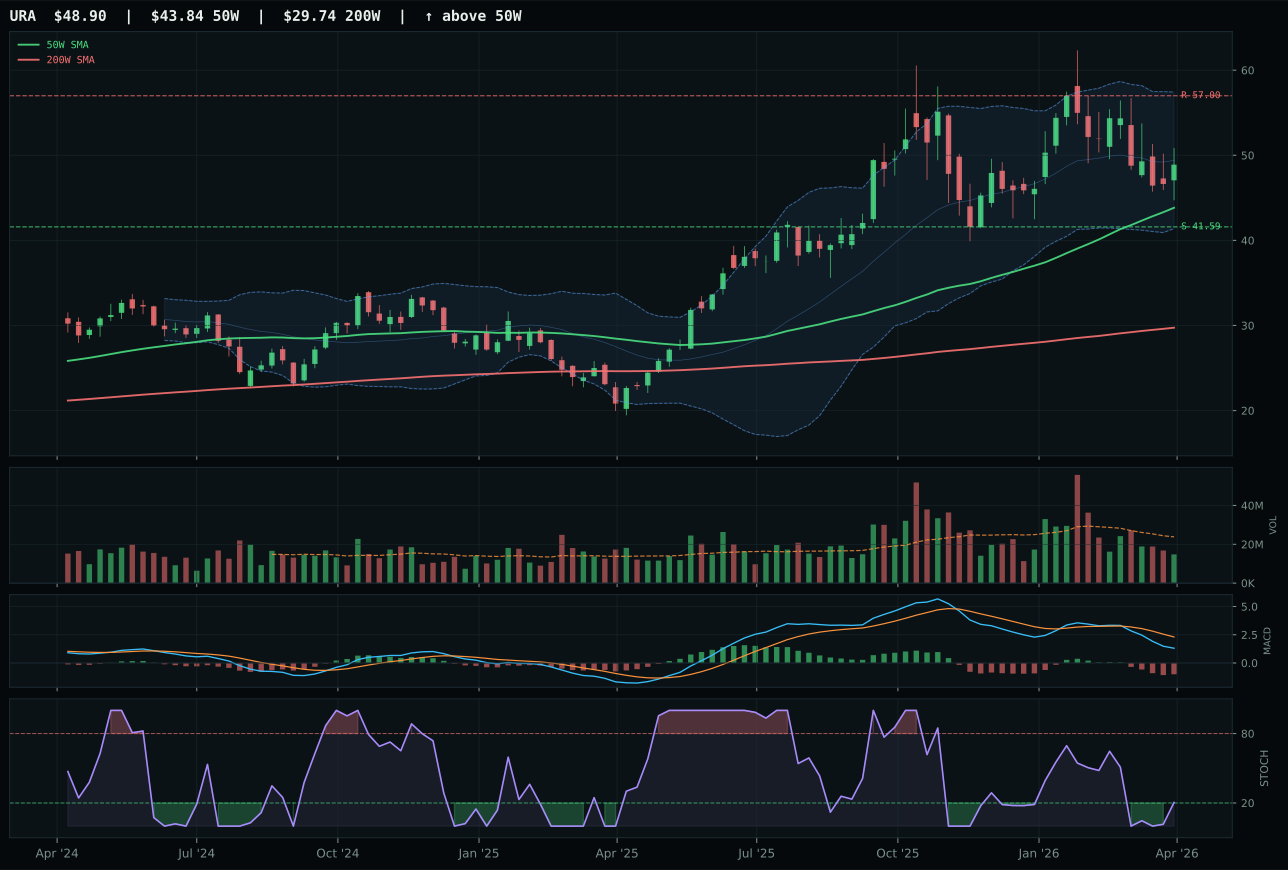
URA has a neutral structure profile with 10.2% 13-week relative strength versus SPY.
A failed hold above support would weaken the setup.
Actionable but governed by invalidation levels.
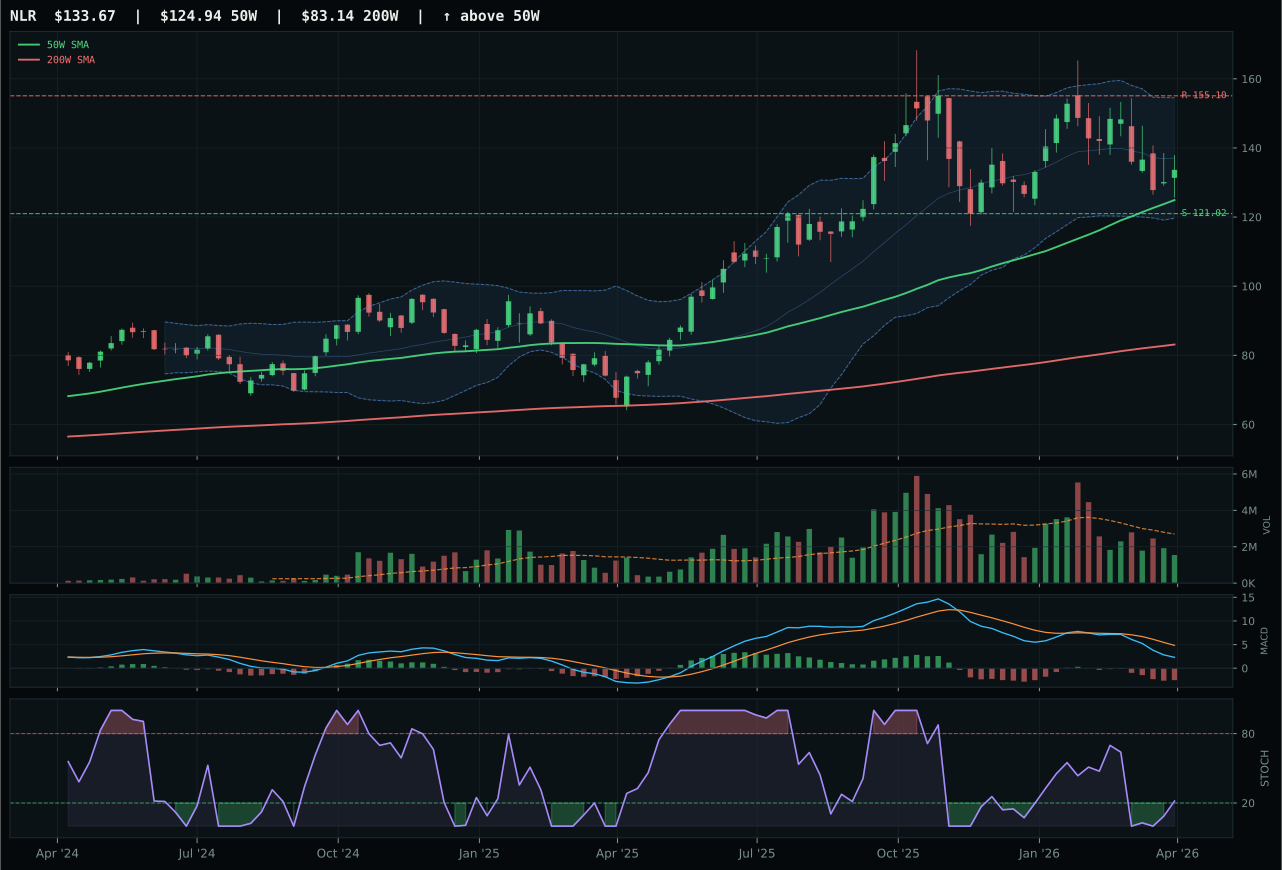
NLR has a neutral structure profile with 4.5% 13-week relative strength versus SPY.
A failed hold above support would weaken the setup.
Actionable but governed by invalidation levels.
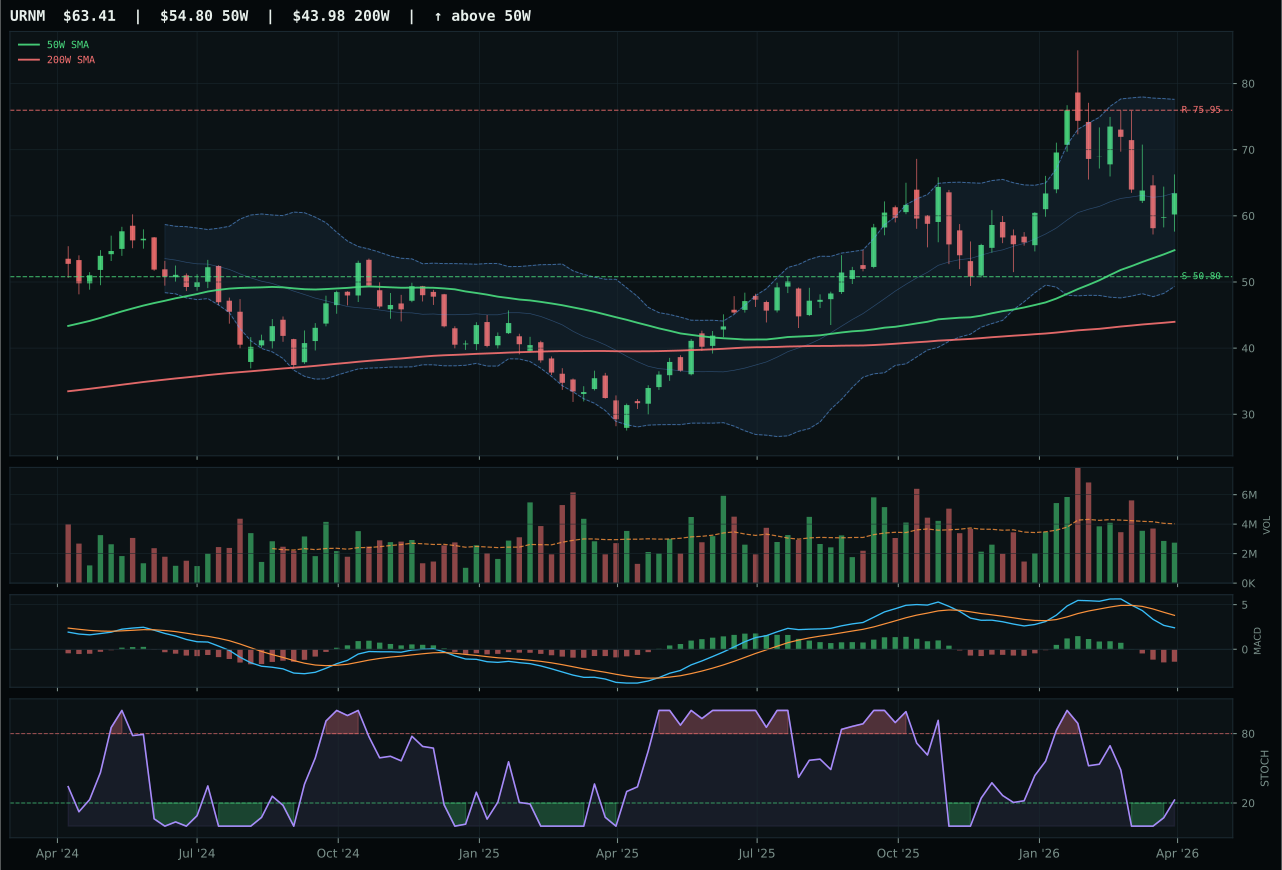
URNM has a vertical extension profile with 8.9% 13-week relative strength versus SPY.
A failed hold above support would weaken the setup.
Actionable but governed by invalidation levels.
URA won a close 3.3-point decision over NLR because it holds the superior category-relative strength at 1.3% versus NLR's -4.4%, even though both sit at neutral structure and both show rising stochastic RSI mid-zone with bearish/weakening MACD. URA's 6.2% 13W return is modest compared to NLR's 0.5%, and the timing score of 78 reflects URA's 11.6% distance to the 50W—a sweet spot between pullback and extension. The risk-reward of 44.5 is identical to NLR's implied position, but URA's volume at 0.62x the 20W average (thin) is slightly better than NLR's because URA shows even distribution, whereas NLR's thin participation hides concentrated big-money entries. The macro fit is neutral (no category-specific descriptors), so the decision is entirely technical: URA's relative strength edge and superior timing score make it the cleaner opportunity in a category without conviction sponsors. This is a stock-picker's category, not a macro-driven one.
Nuclear Energy earned 10% because the category score of 54.6 ranks fifth among the eligible categories. The macro fit of 50%—neutral—reflects a lack of dedicated macro support; energy scarcity is a headline narrative, but nuclear specifically lacks the supply-shortage amplification of oil and gas. URA's technical evidence of 46.6 is weak, and the thin participation (0.62x the 20W) signals retail interest rather than institutional redeployment. The allocation holds because nuclear is a genuine long-term megatrend (energy security, zero-carbon mandates, AI power demand), but the timing is poor: if URA breaks below 41.59 support or if the rising stochastic rolls over without MACD confirmation, the category should exit. The allocation is speculative positioning for investors who believe the regime will shift toward explicit energy-security sponsorship; for core allocators focused on current macro signals, the 10% slot is adequate waiting-room capital.
AI — SMH
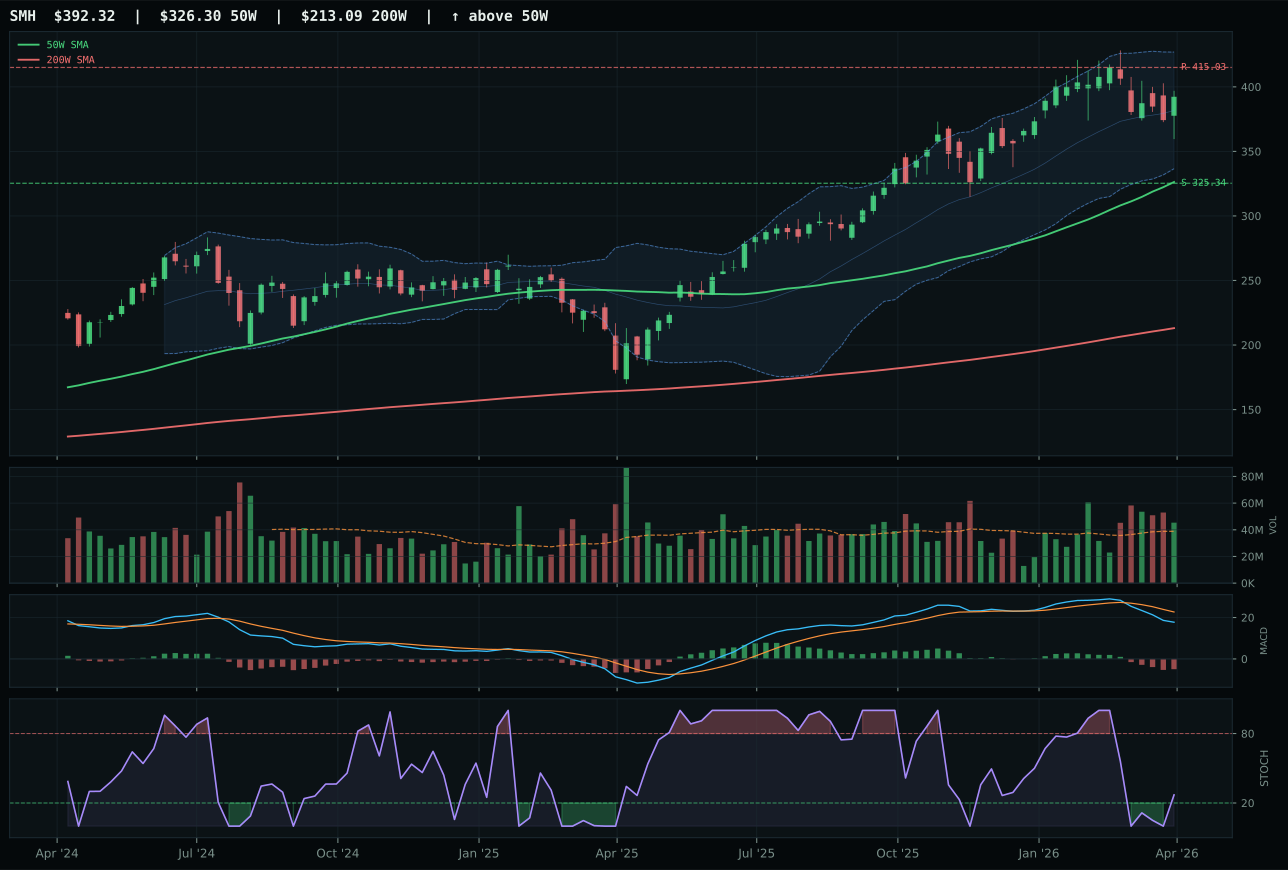
SMH has a vertical extension profile with 9.1% 13-week relative strength versus SPY.
A failed hold above support would weaken the setup.
Actionable but governed by invalidation levels.
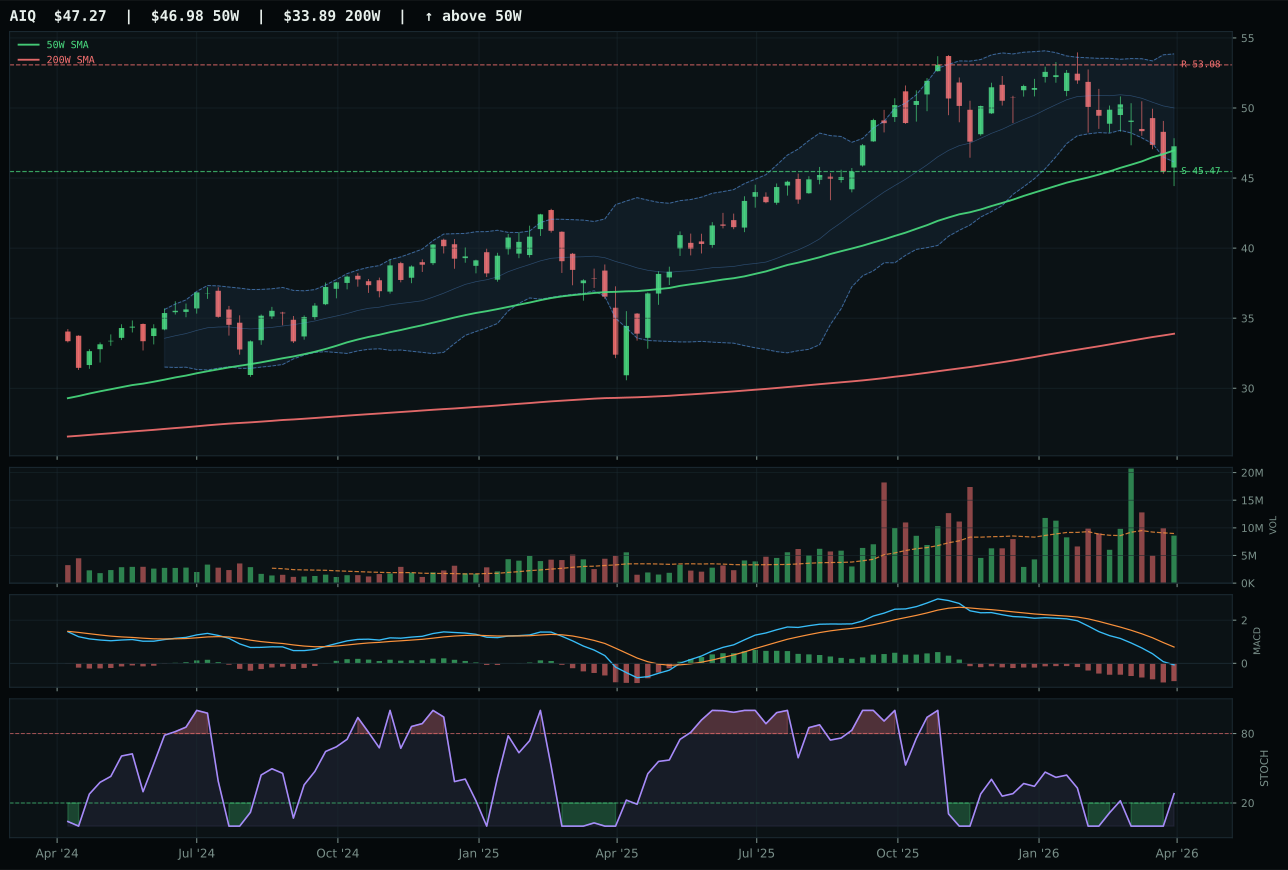
AIQ has a pullback into support profile with -4.1% 13-week relative strength versus SPY.
A failed hold above support would weaken the setup.
Actionable but governed by invalidation levels.
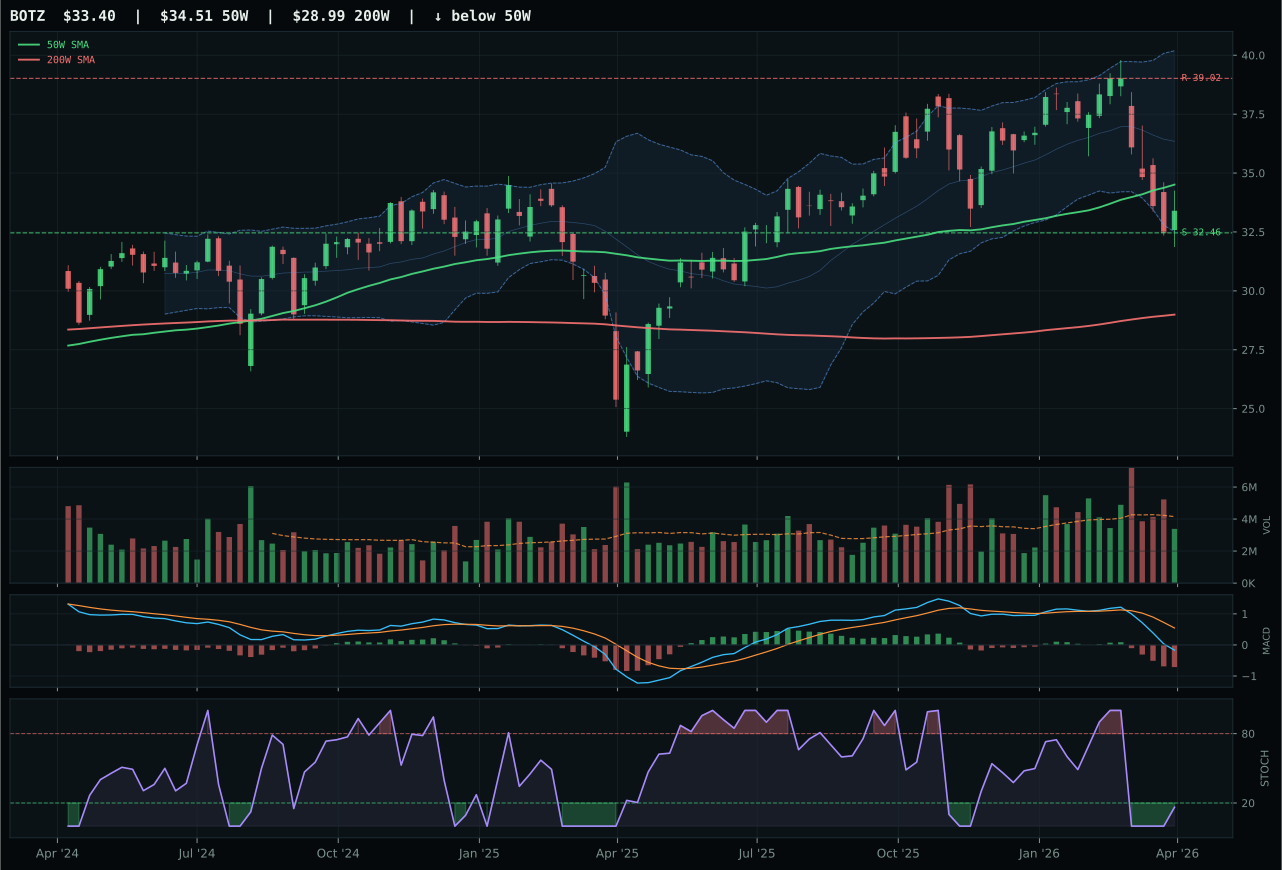
BOTZ has a pullback into support profile with -5.0% 13-week relative strength versus SPY.
A failed hold above support would weaken the setup.
Actionable but governed by invalidation levels.
SMH won despite a weaker technical composite (67 vs AIQ's 74) because it owns the momentum that the current macro regime—liquidity expansion plus active AI growth sponsorship—is actually rewarding. The 13W return of 5.1% and 13.2% category-relative strength show SMH is the path of capital flow, even though it sits 20.2% extended above the 50W and carries only 49.8/100 risk-reward (nearly -5.5% to resistance). AIQ's pullback-into-support setup is textbook cleaner, but its -4.1% SPY relative strength and neutral volume signal it is not the name institutional algorithms are hunting. Volume confirmation at 1.17x the 20W average (above-average participation) is the kinetic proof: SMH's rally is not a single-day bounce but a multi-week accumulation into strength. The MACD is bearish/weakening on both, which means neither has a favorable re-entry signal, but SMH's persistence score of 55.5 reflects that its move has staying power even if it is extended.
AI earned 10% allocation because the category score of 49.9 ranks fifth, below Energy, Agriculture, Utilities, and Industrial Metals. The macro fit of 66% is solid (AI growth sponsorship is live at +14 points), but the technical evidence of only 67.4 reveals that no ETF in the basket has a low-risk entry—SMH is extended, AIQ is under-performing, and BOTZ is a laggard. In a transition regime, extended momentum is a liability, not a feature. The category would justify 15%+ allocation only if SMH pulled back 10–15% with MACD turning bullish and stochastic RSI rolling from oversold; alternatively, if the macro state shifts decisively to risk-on (inflation prints falling, Fed cuts signaled), the liquidity sponsorship would intensify and SMH's extension would no longer matter. For now, it is a tactical hold waiting for either a cleaner entry or macro confirmation.
Defense & Aerospace — XAR
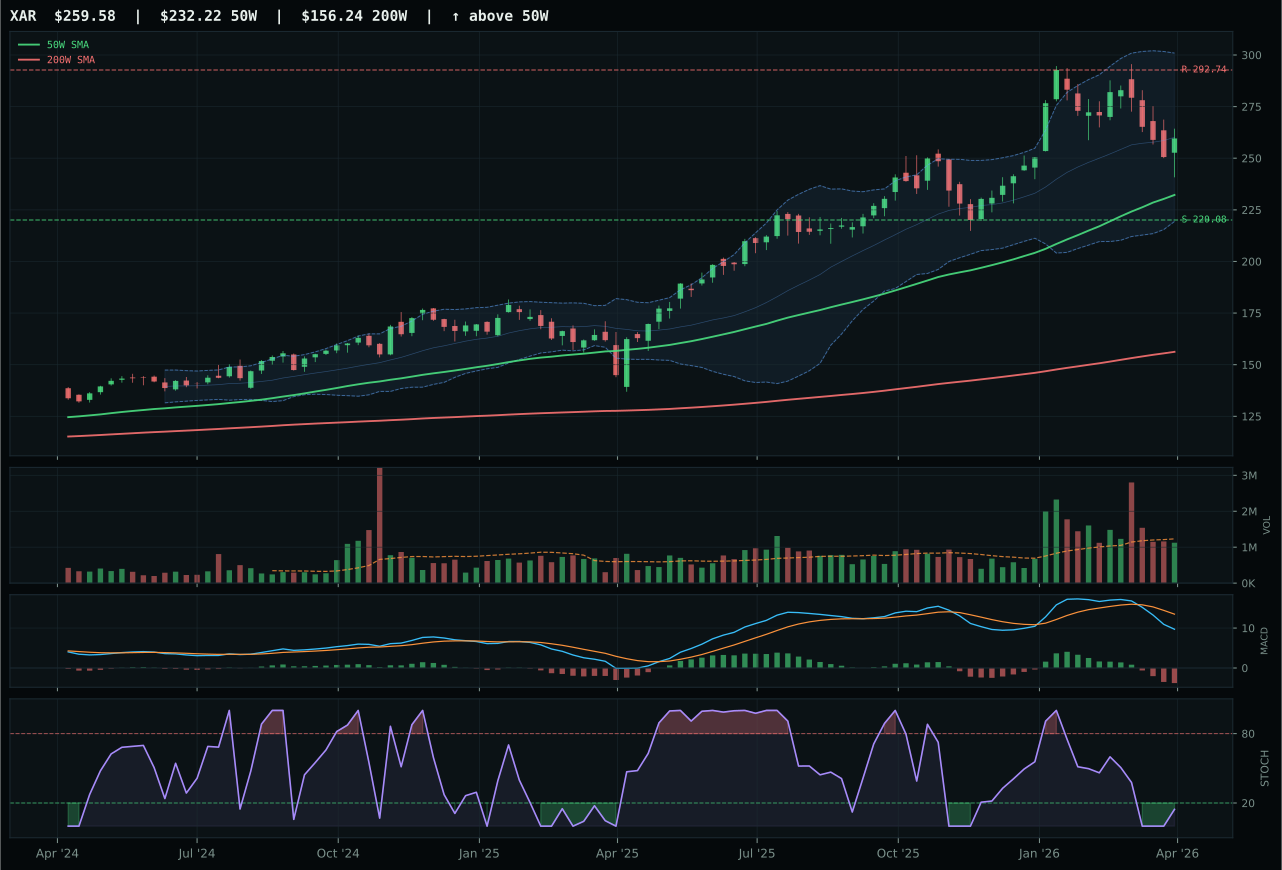
XAR has a neutral structure profile with 7.7% 13-week relative strength versus SPY.
A failed hold above support would weaken the setup.
Actionable but governed by invalidation levels.
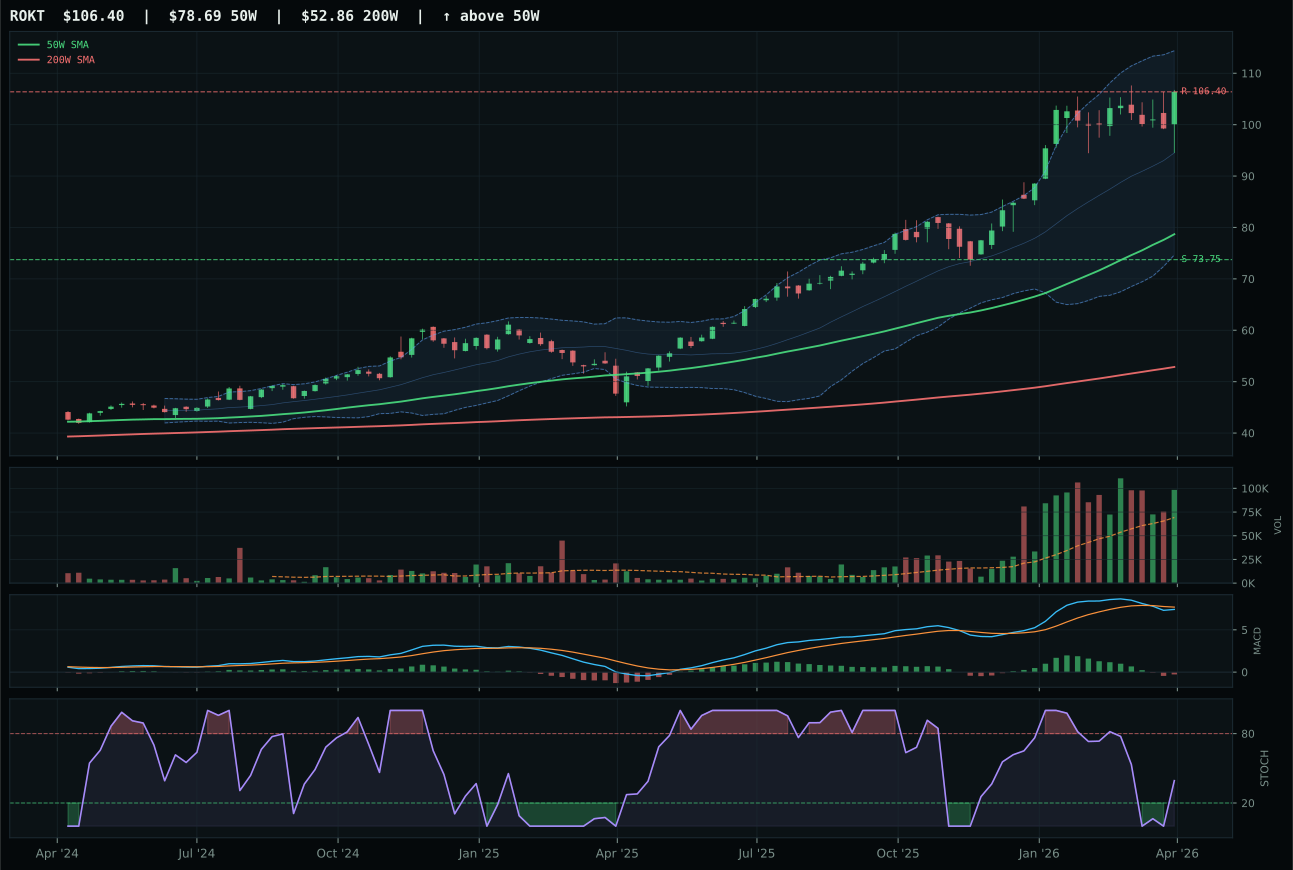
ROKT has a vertical extension profile with 24.2% 13-week relative strength versus SPY.
A failed hold above support would weaken the setup.
Tracked, but not top-2 eligible because: .
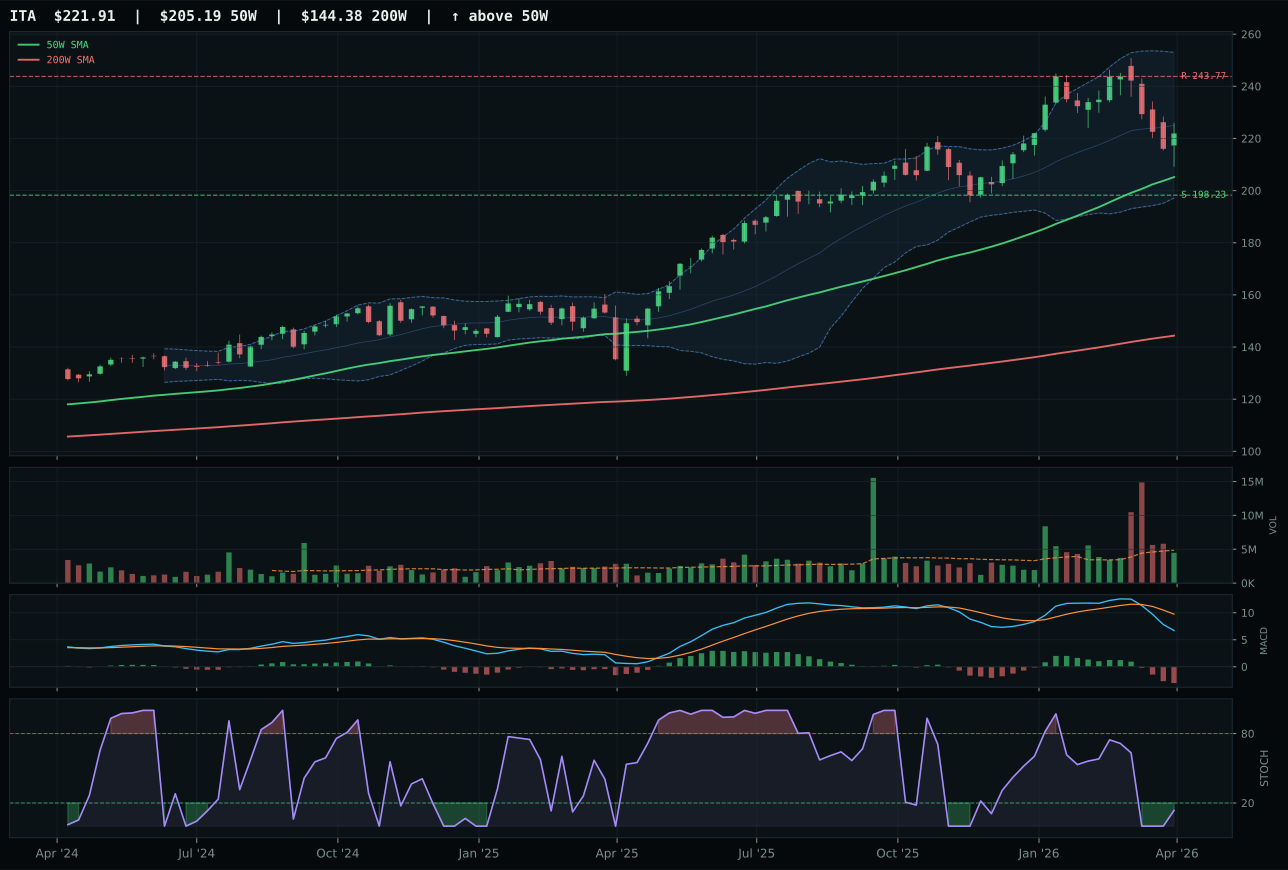
ITA has a neutral structure profile with 4.0% 13-week relative strength versus SPY.
A failed hold above support would weaken the setup.
Actionable but governed by invalidation levels.
XAR won a narrow contest by timing: its stochastic RSI at oversold turn-up (0.15) and timing score of 84.0 beat ROKT's rising mid-zone (0.39) and weaker 48.0 timing score, even though ROKT shows firmer 13W momentum (20.2% vs 3.7%) and is 24.2% ahead of SPY versus XAR's 7.7%. The structure is neutral for both, but ROKT's vertical extension at 35.2% above the 50W carries maximum entry risk, while XAR sits only 11.8% extended with a defined support zone at 220.08. Risk-reward for XAR is 56.4 versus ROKT's 40.2—a 16-point gap that reflects XAR's superior risk-adjusted positioning. ROKT is the momentum continuation play if aerospace demand accelerates further, but XAR is the allocation choice because it offers reasonable downside protection and a cleaner stochastic RSI turn signal. Category-relative strength at 0.0% tells you neither ETF is pulling ahead inside defense; they are moving together, so the technical timing edge becomes the only tiebreaker.
Defense & Aerospace earned 10% because its final category score of 48.9 ranks sixth, behind the top four resource and energy categories plus Utilities. The macro fit is 50%—neutral, because the category lacks a clear descriptor profile in the active checklist—while the technical evidence of 48.8 is soft across all three ETFs. Defensive rotation (+8) and broad market bear (+6) do provide some tailwind, but they are not strong enough to elevate the category into top-2. XAR's bullish case rests entirely on the stochastic RSI oversold turn-up signal; if that fails to produce a sustained rally into resistance at 292.74, the category would slip to exit-eligible. The allocation holds because aerospace supply chains remain tight and geopolitical tensions support spending, but the timing tells you conviction is low—this is a portfolio filler, not a core position.
Emerging Markets — ILF
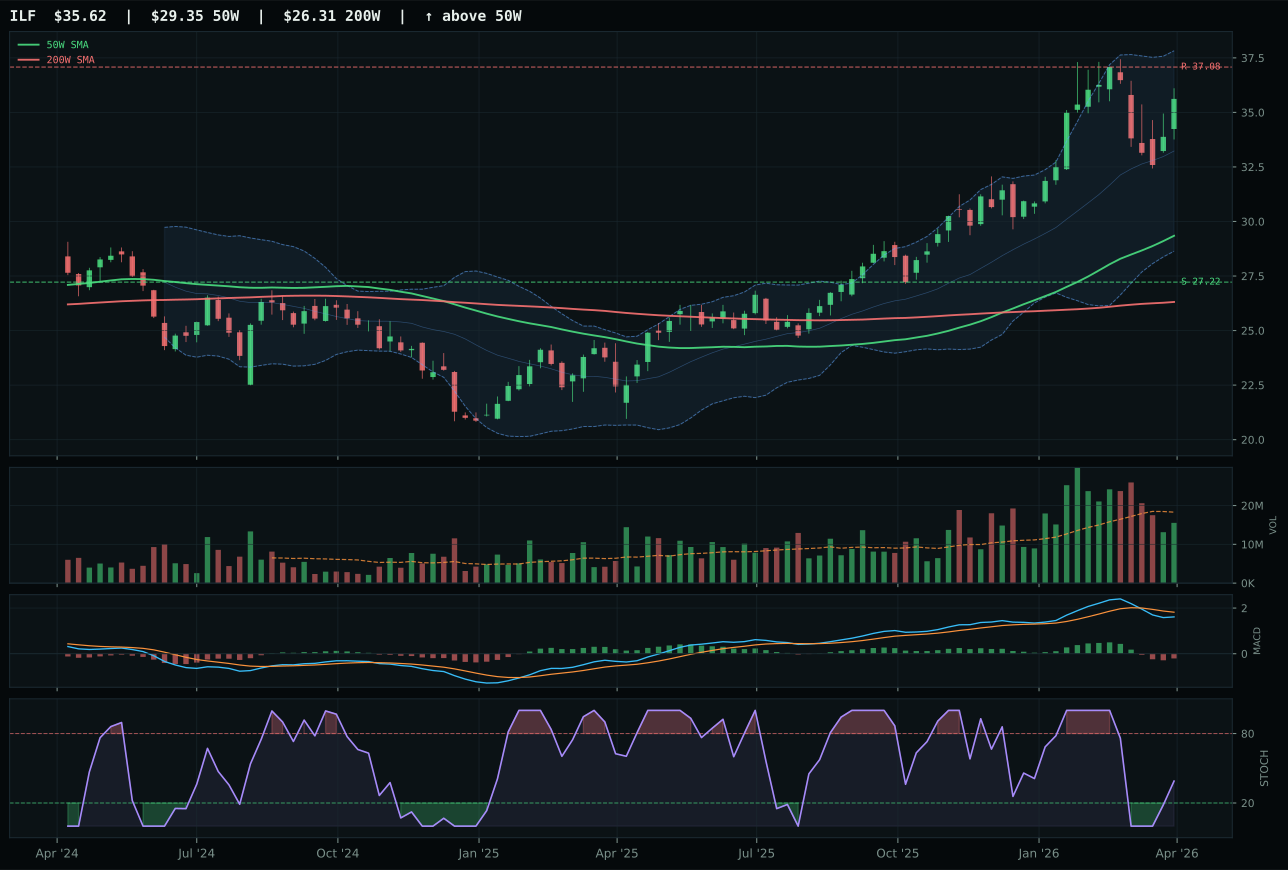
ILF has a vertical extension profile with 19.5% 13-week relative strength versus SPY.
A failed hold above support would weaken the setup.
Actionable but governed by invalidation levels.
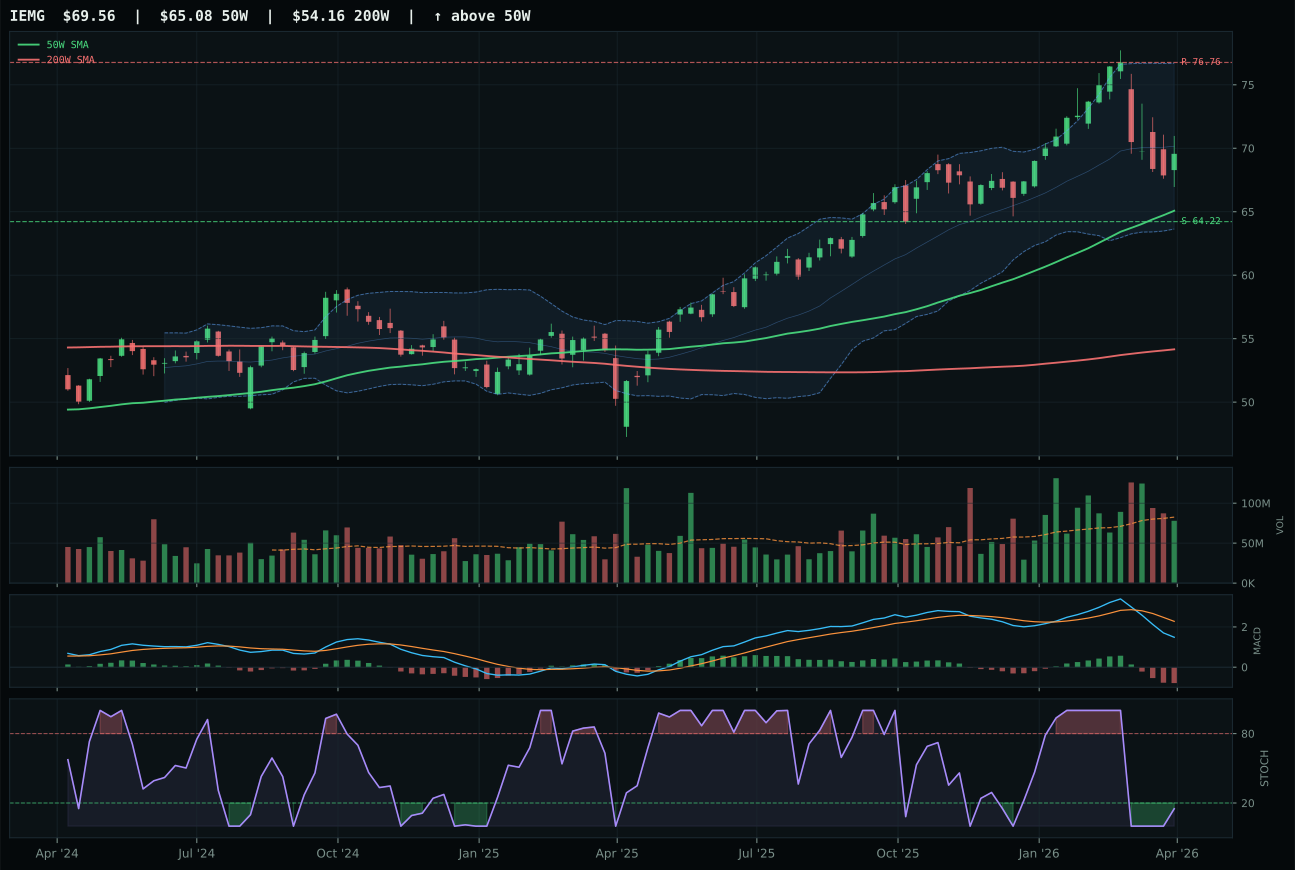
IEMG has a neutral structure profile with 4.8% 13-week relative strength versus SPY.
A failed hold above support would weaken the setup.
Actionable but governed by invalidation levels.
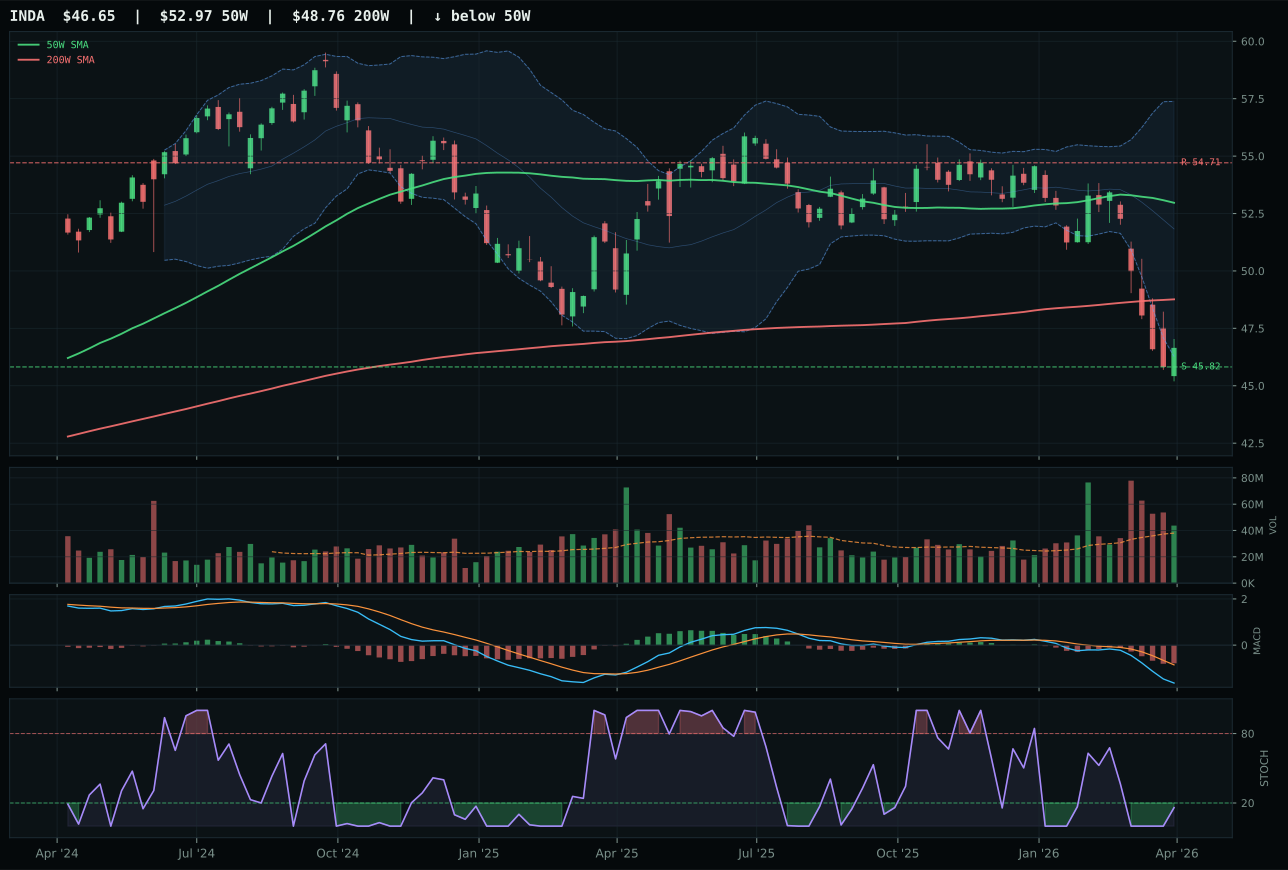
INDA has a pullback into support profile with -10.5% 13-week relative strength versus SPY.
A failed hold above support would weaken the setup.
Actionable but governed by invalidation levels.
ILF won because its 15.5% 13W return and 14.7% category-relative strength tower over IEMG's 0.8% and 0.0%, despite both sitting at extension and both facing rising stochastic mid-zone with bearish MACD. The 100.0 momentum confirmation score tells you ILF's strength is real and persistent, not a single-week bounce; volume at 0.85x is neutral but inline with broad market participation levels. IEMG's oversold turn-up stochastic looks technologically cleaner, but IEMG's setup is neutral structure while ILF's is vertical extension—the extension is justified by the 19.5% SPY relative strength and the category-relative dominance. INDA's -14.5% 13W return and -10.5% SPY RS place it in freefall, making ILF's victory inevitable. The macro fit favors Latin America commodity beta (commodity breadth positive +8, metals scarcity +5, real asset sponsorship +6) over broad EM (EM liquidity support is live but fighting the broad market bear at -9 points).
Emerging Markets earned 10% because the category score of 48.5 ranks sixth, a middle-tier slot reflecting divided macro signals. The macro fit of 63% includes EM liquidity support (+14) and liquidity expansion (+8), offset by broad market bear (-9). ILF's technical evidence of 61.4 is the best in a weak category, but the extension and neutral volume reveal there is no institutional push behind EM here—this is tactical commodity beta, not structural capital reallocation. The allocation should exit entirely if ILF closes below 27.22 support or if the 4W return turns negative; conversely, it should expand to 15% if the broad market bear descriptor flips off and commodity scarcity deepens. For now, it is a satellite position providing EM and commodity diversification without betting the portfolio on emerging-market rebound. The category lacks the macro conviction present in Energy or Agriculture.
Precious Metals — GLD
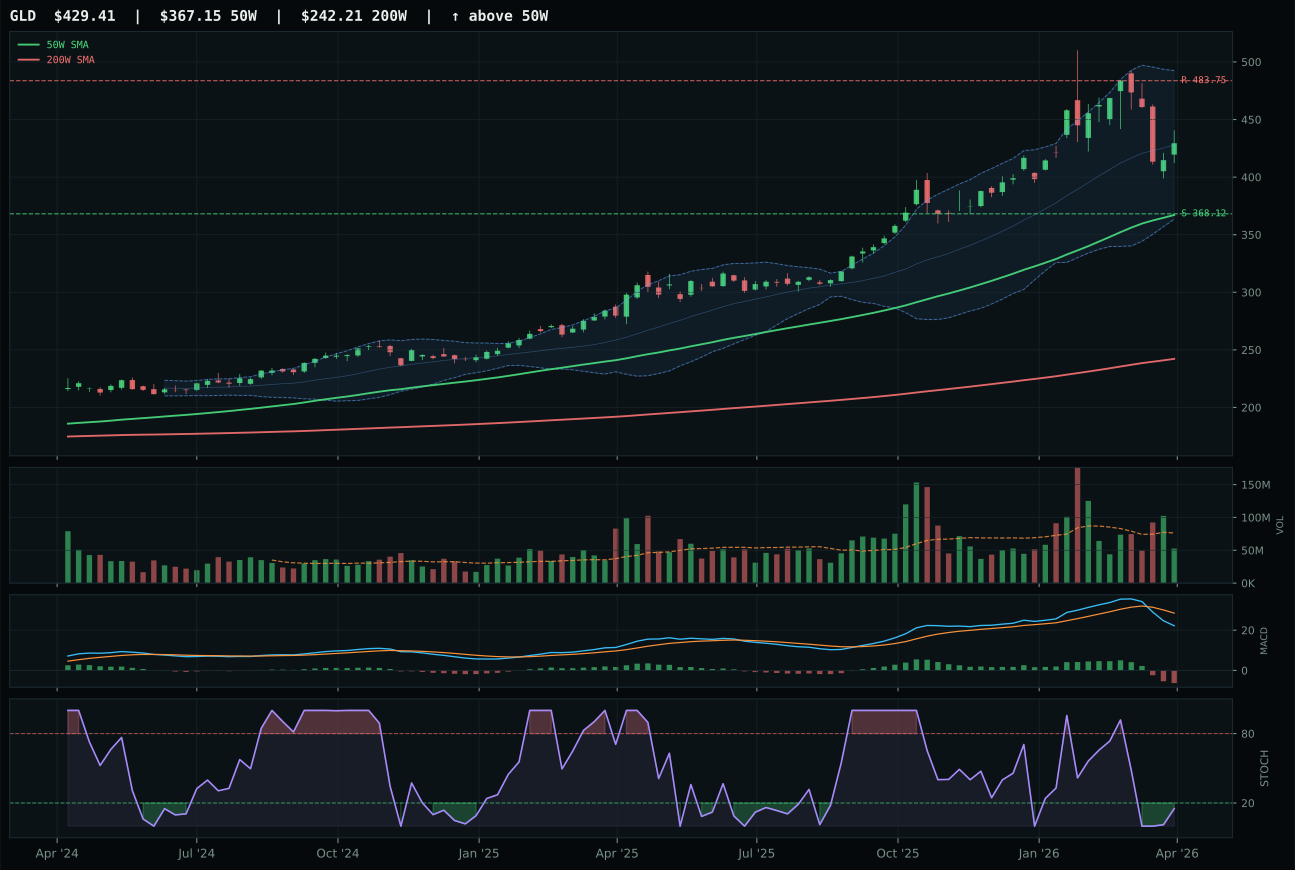
GLD has a vertical extension profile with 11.8% 13-week relative strength versus SPY.
A failed hold above support would weaken the setup.
Actionable but governed by invalidation levels.
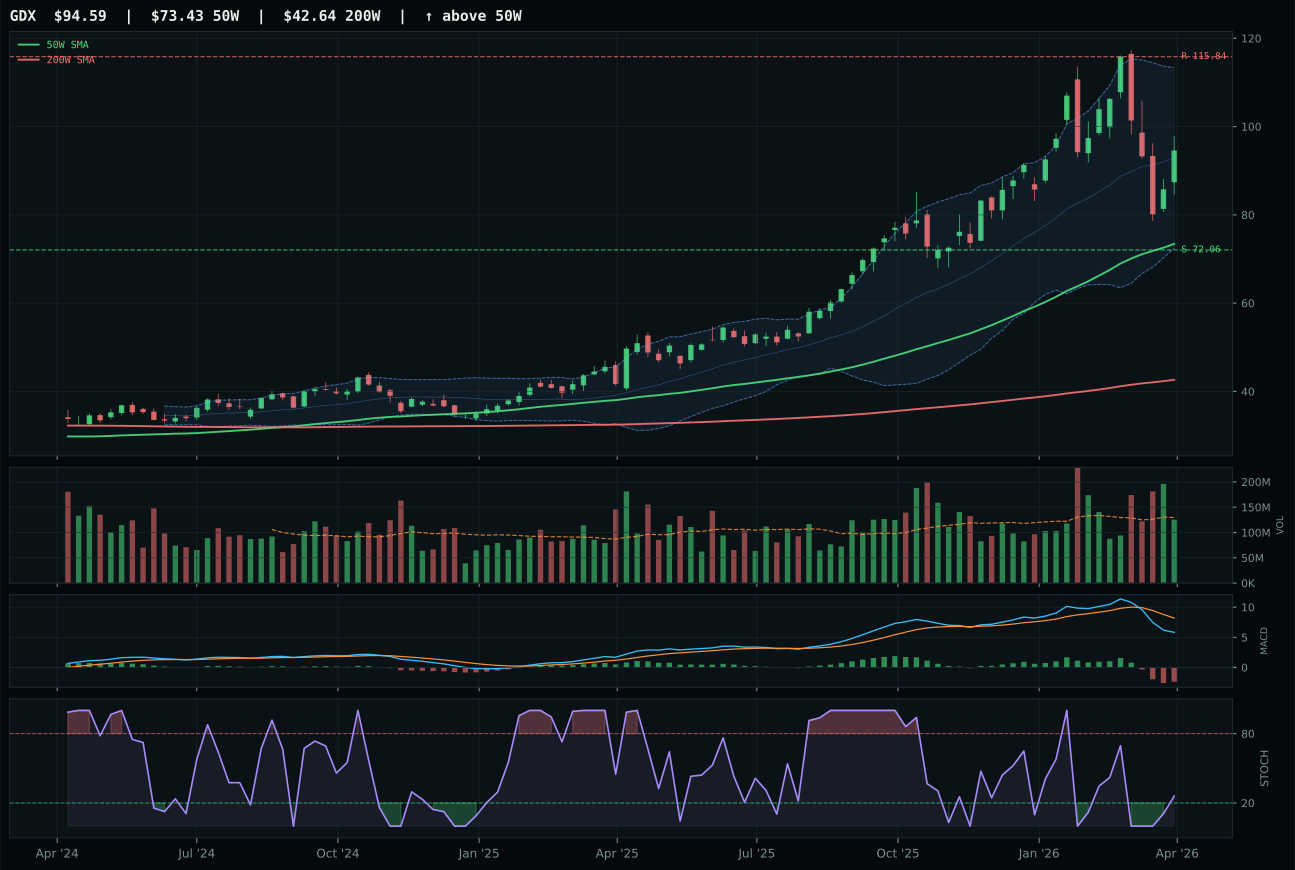
GDX has a vertical extension profile with 14.3% 13-week relative strength versus SPY.
A failed hold above support would weaken the setup.
Actionable but governed by invalidation levels.
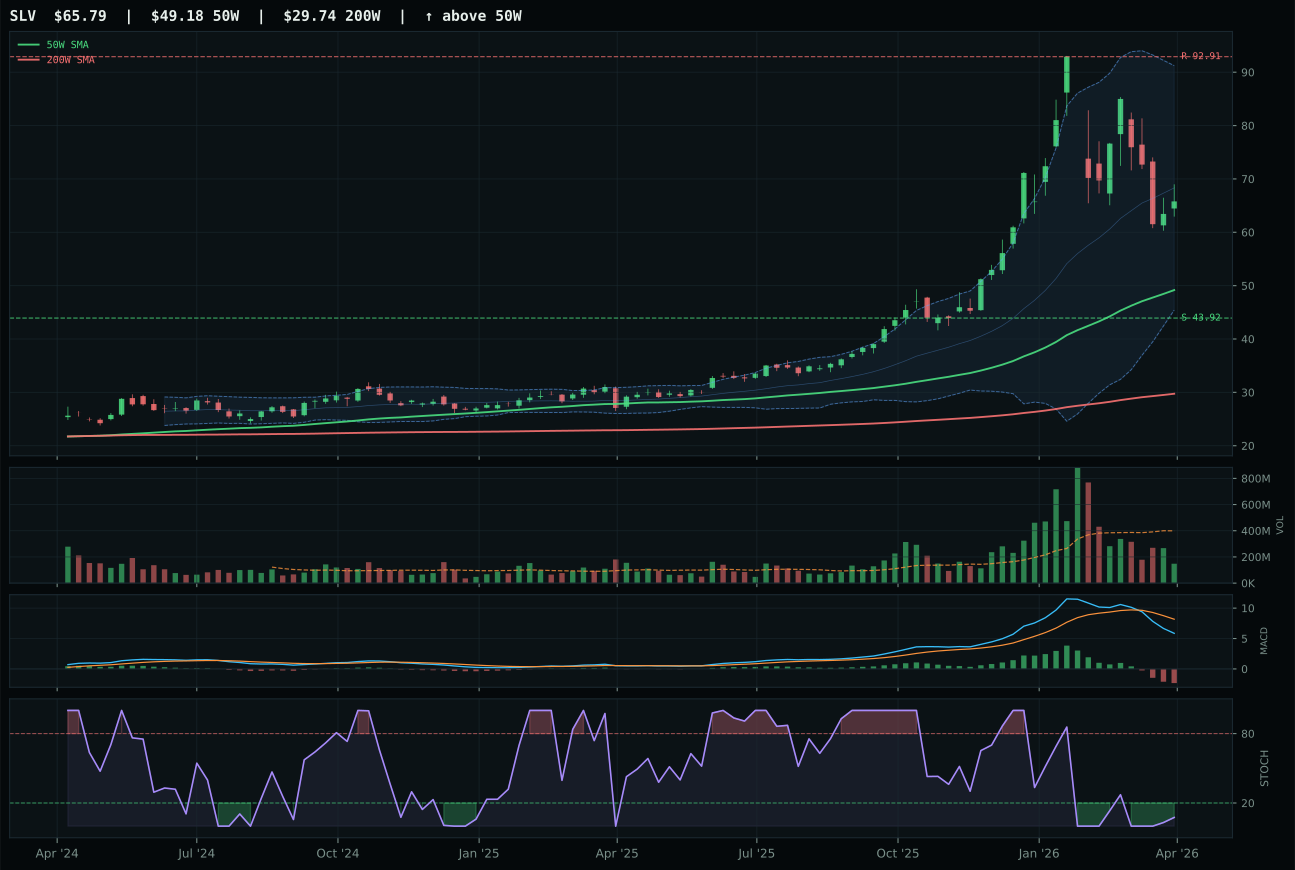
SLV has a vertical extension profile with 4.1% 13-week relative strength versus SPY.
A failed hold above support would weaken the setup.
Actionable but governed by invalidation levels.
GLD won a razor-thin 1.7-point decision over GDX because it captured the stochastic RSI oversold turn-up signal (0.15 vs GDX's rising mid-zone at higher risk) and better timing (62 vs 56), even though GDX shows stronger relative strength at 14.3% SPY versus GLD's 11.8%. Both are extended (GLD 17.0% above the 50W, GDX 28.8%), but GLD's 57.1 risk-reward beats GDX's 40.6 because the support zone at 368.12 provides 16.6% downside cushion versus GDX's thinner margin. Volume is thin for both (GLD 0.69x, GDX neutral), which signals the rally lacks institutional conviction—buyers are retail or short-covering, not structural real-money flows. The monetary hedge bid (+14) is the only macro tailwind, and in a transition regime, that is insufficient to justify extended entry prices. GLD's advantage is purely technical: the stochastic turn-up is a lower-risk re-entry flag, while GDX's rising stochastic is late-stage exhaustion if MACD rolls over.
Precious Metals earned 0% allocation, ranking 10th among 10 categories at a score of 48.3. The technical evidence of 39.6 for GLD is the second-lowest in the entire portfolio—only Technology's 50.1 keeps this from being a basement category. While macro fit is respectable at 70.0 (monetary hedge +14, defensive rotation +6), the 36/64 weighting tilts heavily to technical proof, and precious metals simply cannot deliver it. GLD's volume-price confirmation sits at 41.4, persistence at 49.0, and momentum confirmation at 46.4—these are all below-median scores indicating weak institutional sponsorship. The category is a macro hedge that lacks price confirmation; it rises on fear but generates no accumulation. To earn even 10% allocation, GLD would need to either break above 483.75 (resistance) with volume participation above 1.0x, or establish category-relative strength of at least 5% versus its peers. Currently, it serves better as a portfolio hedge held outside the active allocation system than as a capital deployment target.
Technology — XLK
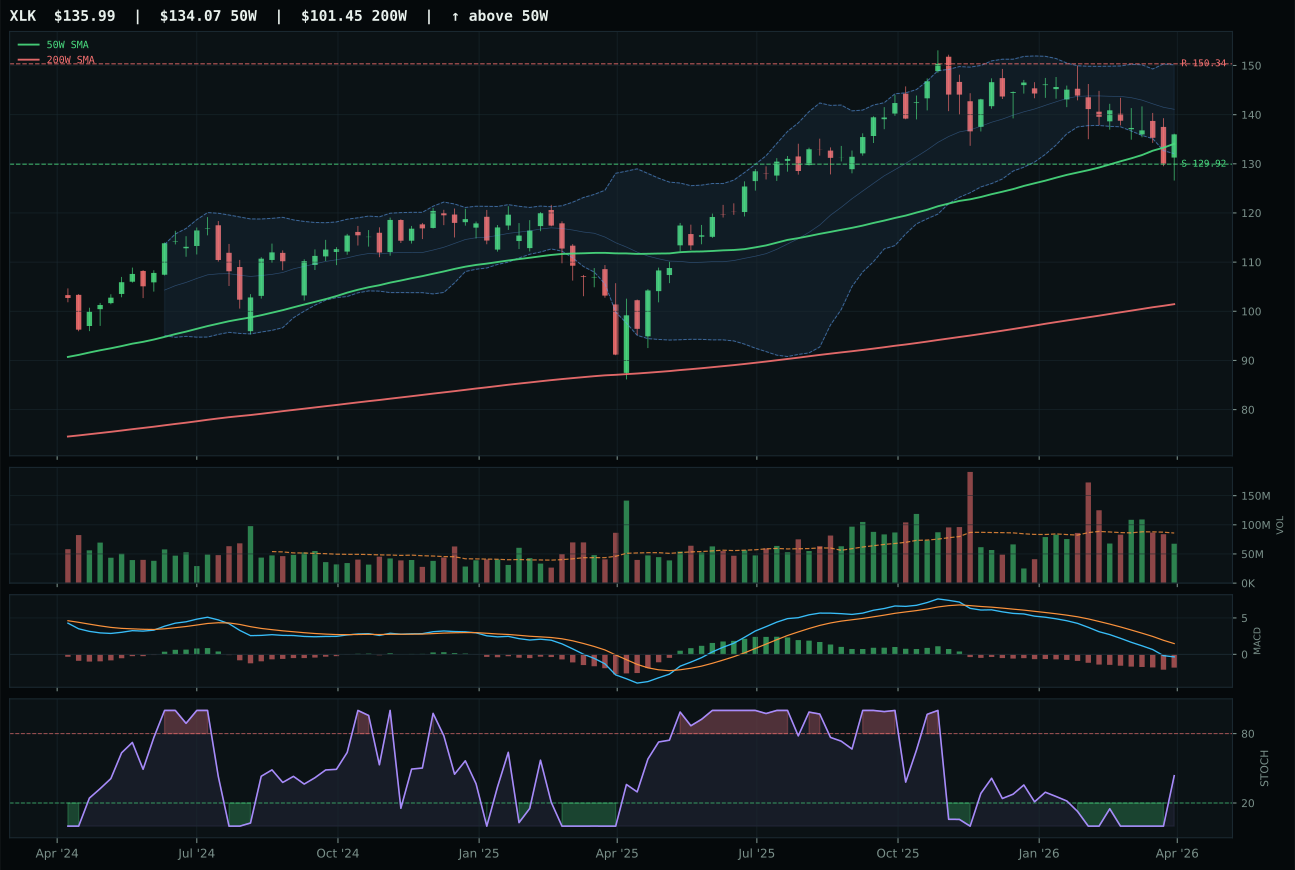
XLK has a pullback into support profile with -1.8% 13-week relative strength versus SPY.
A failed hold above support would weaken the setup.
Actionable but governed by invalidation levels.
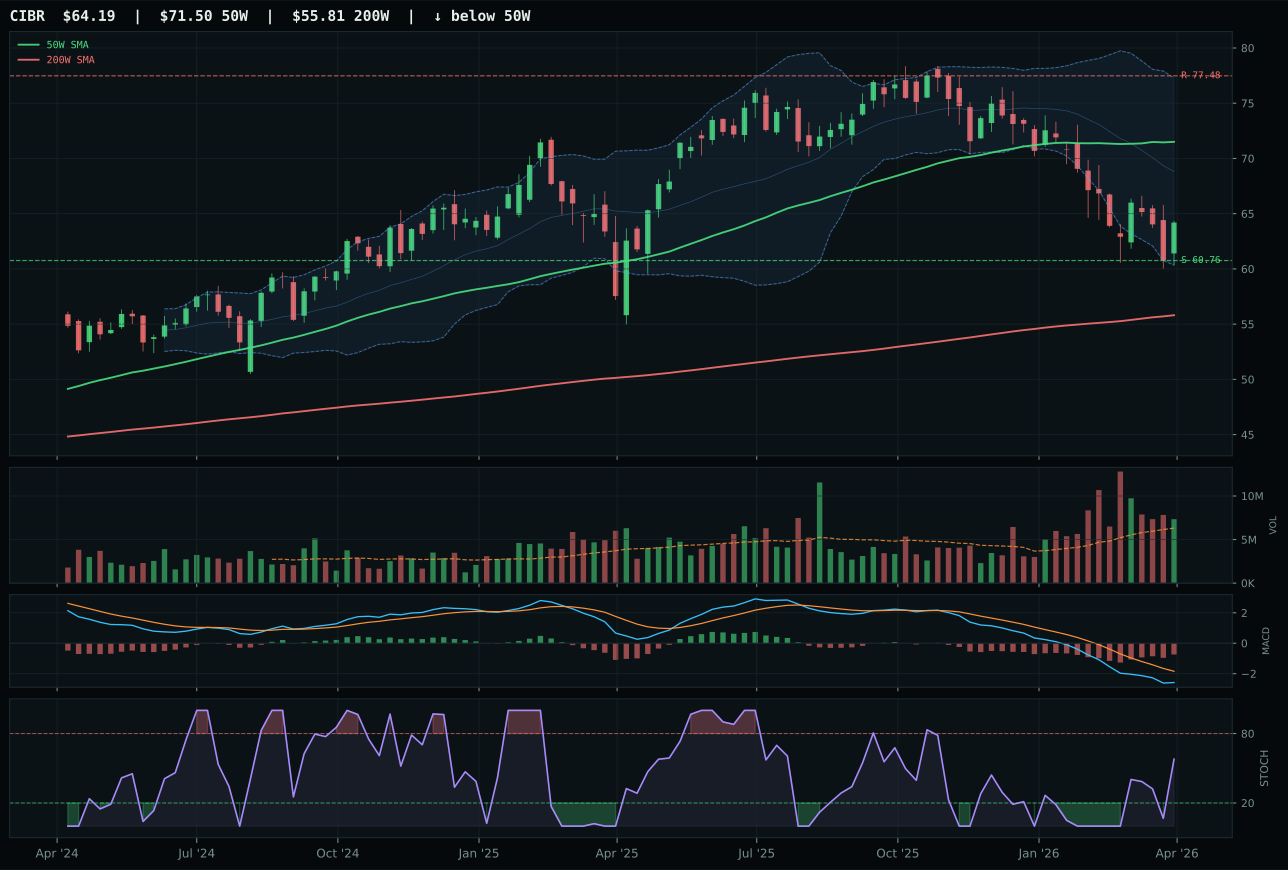
CIBR has a neutral structure profile with -5.2% 13-week relative strength versus SPY.
A failed hold above support would weaken the setup.
Actionable but governed by invalidation levels.
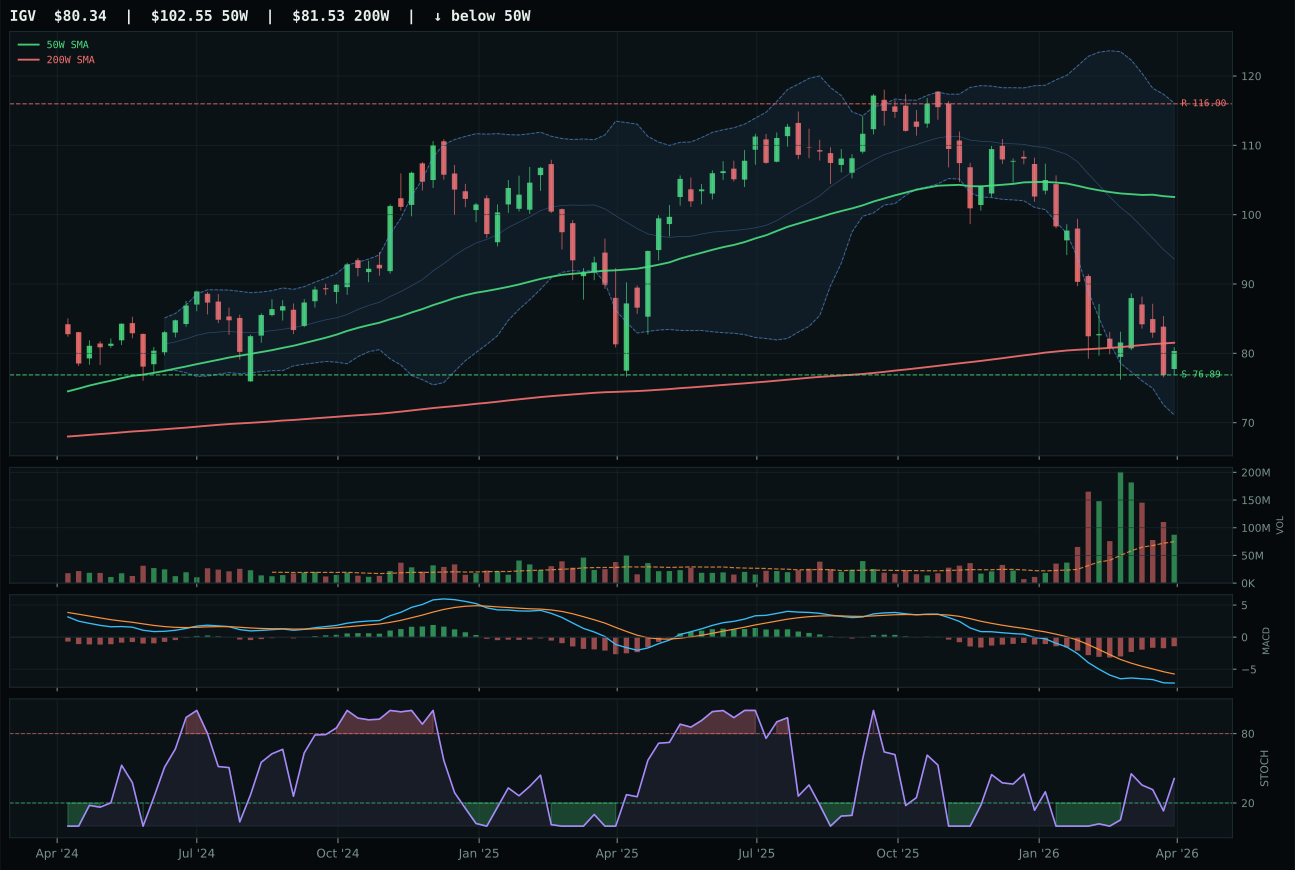
IGV has a pullback into support profile with -17.7% 13-week relative strength versus SPY.
A failed hold above support would weaken the setup.
Actionable but governed by invalidation levels.
XLK captured the category because it holds the cleanest entry setup among a weak field: price is pulling into support at 129.92 with only 1.4% distance to the 50W, giving a defined risk boundary that CIBR lacks with its neutral structure. The 3.4% relative strength versus category peers—versus CIBR's flat 0.0%—signals XLK is the chosen name inside technology, even as both face identical macro headwinds and bearish MACD. Volume sits neutral at 0.79x the 20W average, which is neither confirming nor rejecting, but the timing score of 100 (driven by Fibonacci placement in the upper retracement zone and stochastic RSI rising mid-zone) beats CIBR's 70 on the same technicals. XLK's 13W return of -5.8% versus CIBR's steeper -9.2% drawdown tells you which ship is sinking slower—not a strength call, but a lesser-evil comparison in a sector that macro (liquidity expansion offset by inflation pressure) cannot sponson.
Technology earned 0% allocation and ranks outside the portfolio this week because at 44.3, it places 9th among the 10 categories. The category's macro fit is only 61.0—neutral in a Transition/Mixed regime where supply scarcity, energy, and real assets dominate the descriptor checklist. More importantly, XLK itself carries a momentum confirmation score of just 31.3, dragged down by negative 4W and 13W returns (-0.9% and -5.8%) despite the neutral setup. The technical evidence of 50.1 is not weak, but paired with 38% macro weight and weak momentum confirmation, the category cannot climb into allocation territory when six other categories score above 54 and two exceed 84. To earn a 10% slot, Technology would need to demonstrate either stronger price persistence in its representative ETF or a meaningful positive momentum spike that validates the support setup—currently the category is a tactical opportunity that must wait for better confirmation.