
2026-03-27
Informational purposes only. The content in this report, including allocations, analysis, and commentary, is provided solely for informational and educational purposes. It does not constitute financial advice, investment advice, trading advice, or any other type of advice. Past performance does not guarantee future results. Always conduct your own research and consult a qualified financial professional before making investment decisions.
Weekly Allocation
| Ticker | Category | Weight | Role |
|---|---|---|---|
| XOP | Traditional Energy | 20% | Top-2 (20%) |
| WEAT | Agriculture & Livestock | 20% | Top-2 (20%) |
| IGF | Utilities & Infrastructure | 10% | Tier-2 (10%) |
| NLR | Nuclear Energy | 10% | Tier-2 (10%) |
| COPX | Industrial Metals | 10% | Tier-2 (10%) |
| ITA | Defense & Aerospace | 10% | Tier-2 (10%) |
| GLD | Precious Metals | 10% | Tier-2 (10%) |
| SMH | AI | 10% | Tier-2 (10%) |
Trade Instructions — Monday Open
Sell the tranche from 2026-02-27 (completing its 4-week hold). Buy the new tranche. Instructions show net portfolio changes — same-asset positions cancel, weight changes show the delta.
| Action | Ticker | Instruction |
|---|---|---|
| SELL | XLE | Sell 50% of XLE position (reduce 10.00% → 5.00%) |
| SELL | REMX | Sell 50% of REMX position (reduce 10.00% → 5.00%) |
| SELL | BOTZ | Sell entire BOTZ position (2.50% of portfolio) |
| SELL | IEMG | Sell entire IEMG position (2.50% of portfolio) |
| SELL | XLU | Sell 17% of XLU position (reduce 15.00% → 12.50%) |
| BUY | WEAT | Buy WEAT — 28.57% of freed cash (adds 5.00% to portfolio) |
| BUY | XOP | Buy XOP — 28.57% of freed cash (adds 5.00% to portfolio) |
| BUY | COPX | Buy COPX — 14.29% of freed cash (adds 2.50% to portfolio) |
| BUY | IGF | Buy IGF — 14.29% of freed cash (adds 2.50% to portfolio) |
| BUY | SMH | Buy SMH — 14.29% of freed cash (adds 2.50% to portfolio) |
Current Portfolio After Trade
Combined holdings across all 4 active tranches. Each tranche is 25% of the portfolio.
| Ticker | % of Portfolio | Weight Bar |
|---|---|---|
| XOP | 15.00% | |
| XLU | 12.50% | |
| WEAT | 12.50% | |
| NLR | 10.00% | |
| GLD | 7.50% | |
| ITA | 7.50% | |
| XLE | 5.00% | |
| REMX | 5.00% | |
| IGV | 5.00% | |
| COPX | 5.00% | |
| AIQ | 5.00% | |
| SLV | 2.50% | |
| ILF | 2.50% | |
| IGF | 2.50% | |
| SMH | 2.50% |
Macro Regime — Transition / Mixed
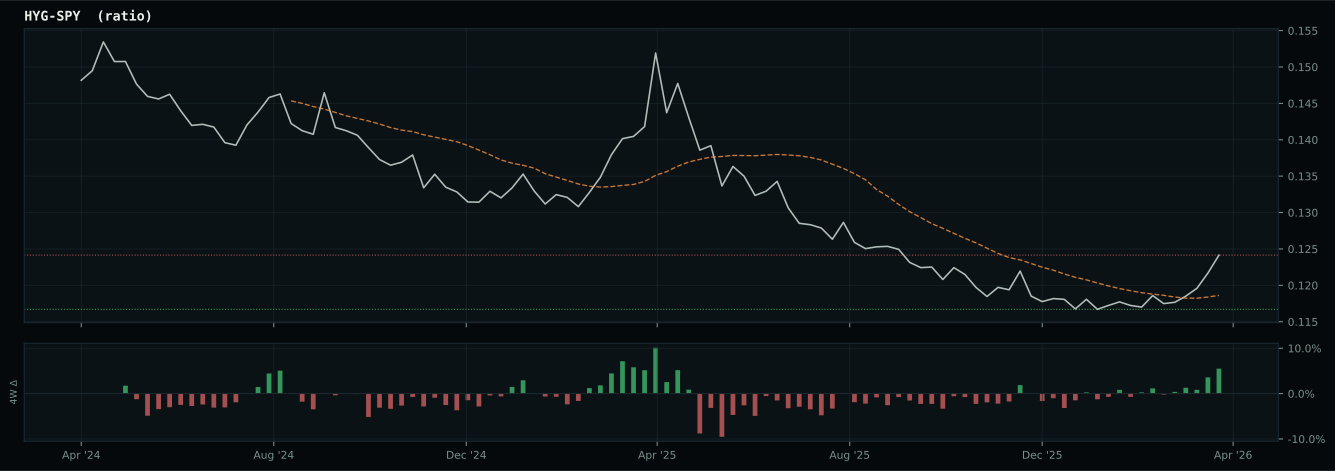
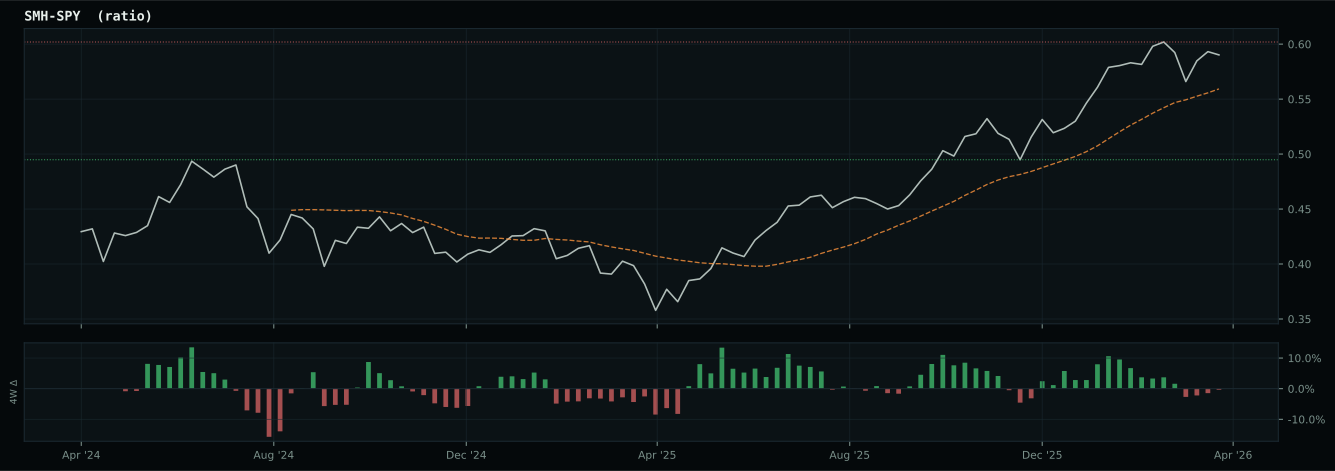
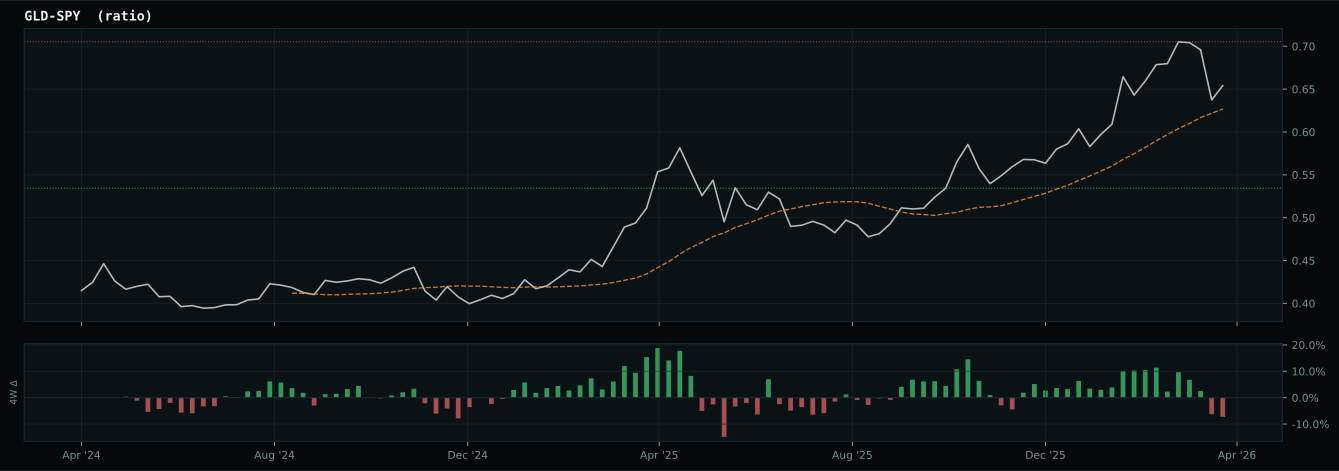
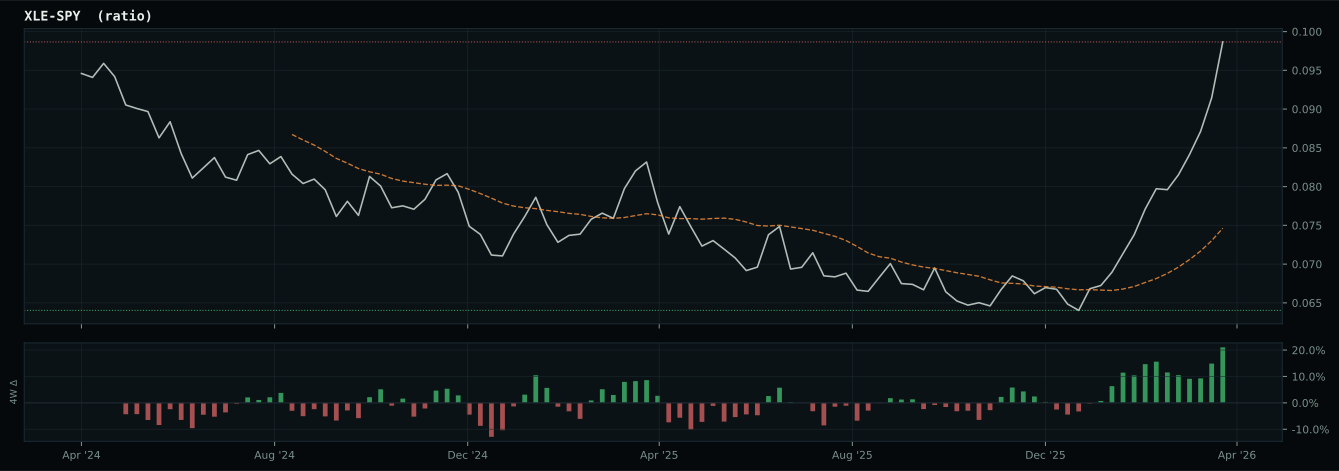
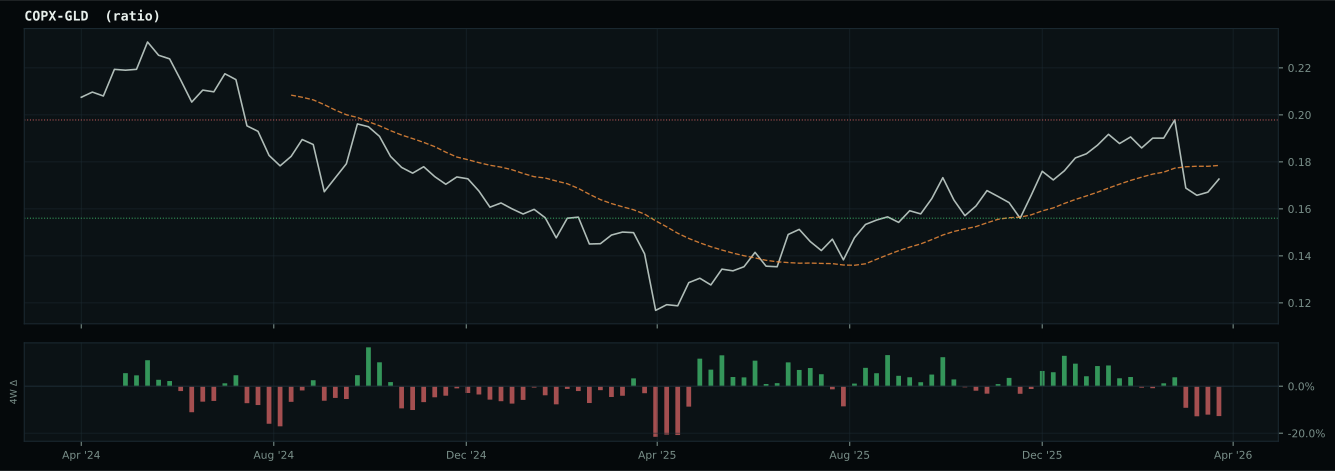
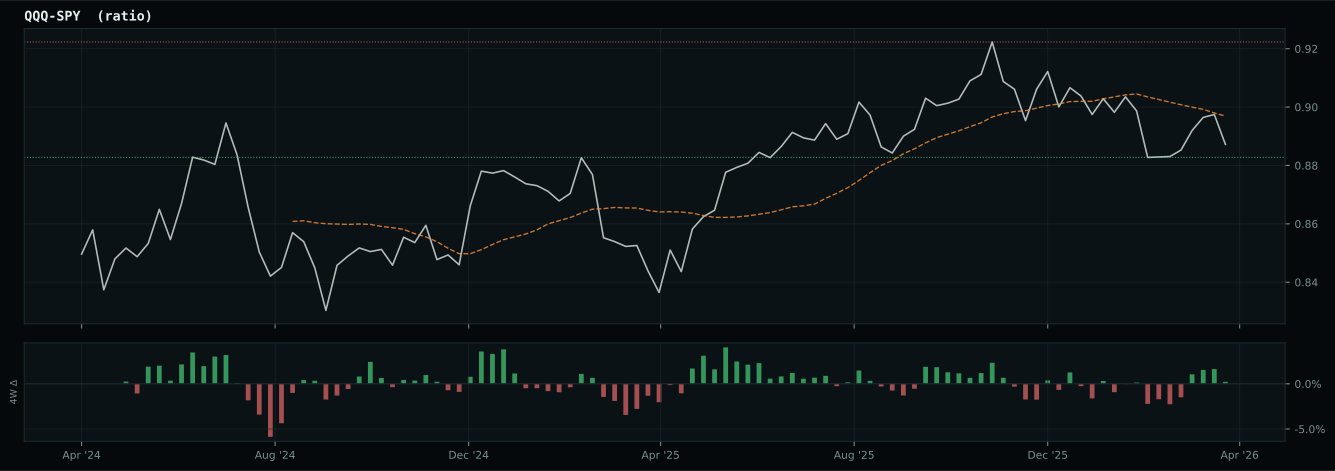
Macro Evidence Charts
Market-implied signals behind the macro regime scores. Each ratio compares two assets; the direction and slope of the ratio is what the macro engine reads.
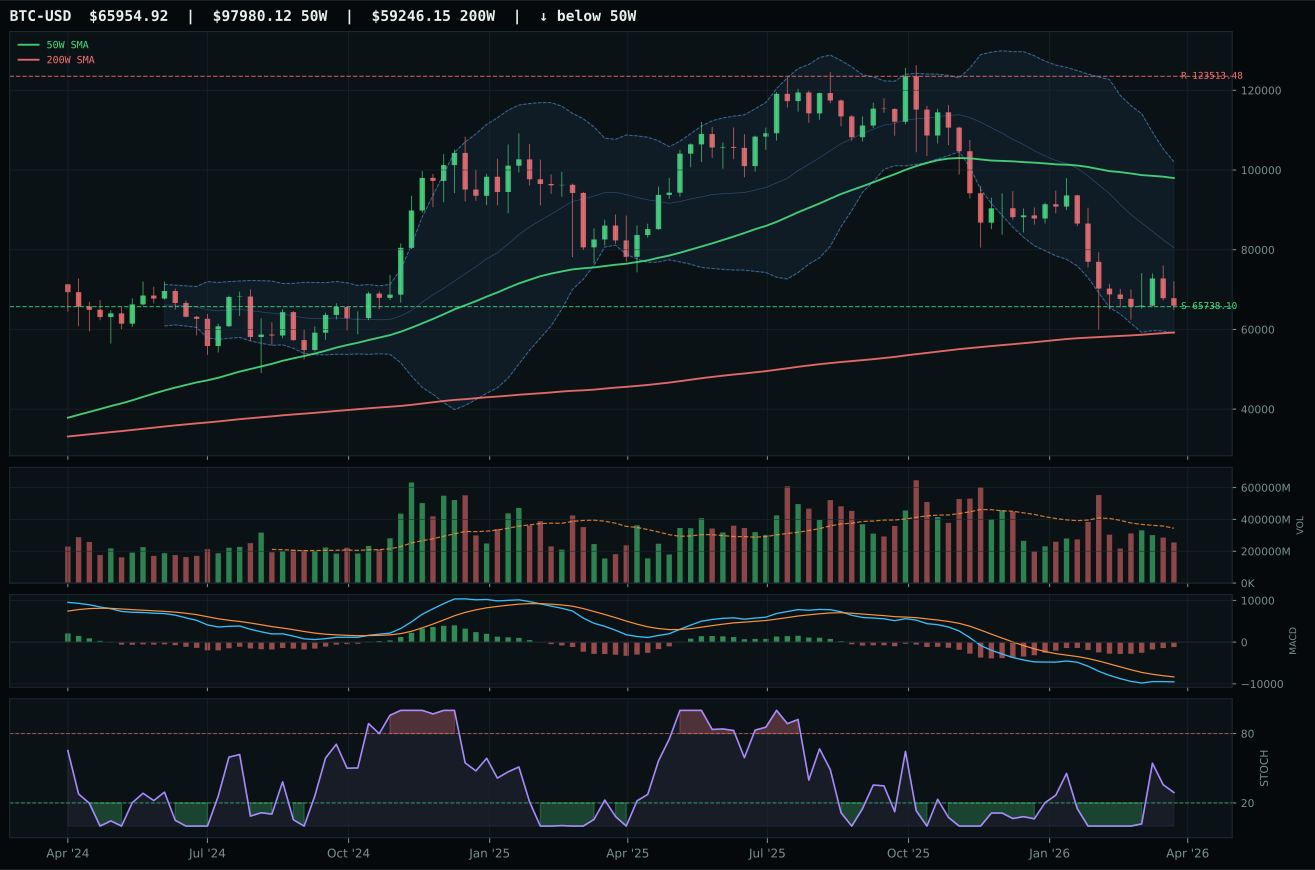
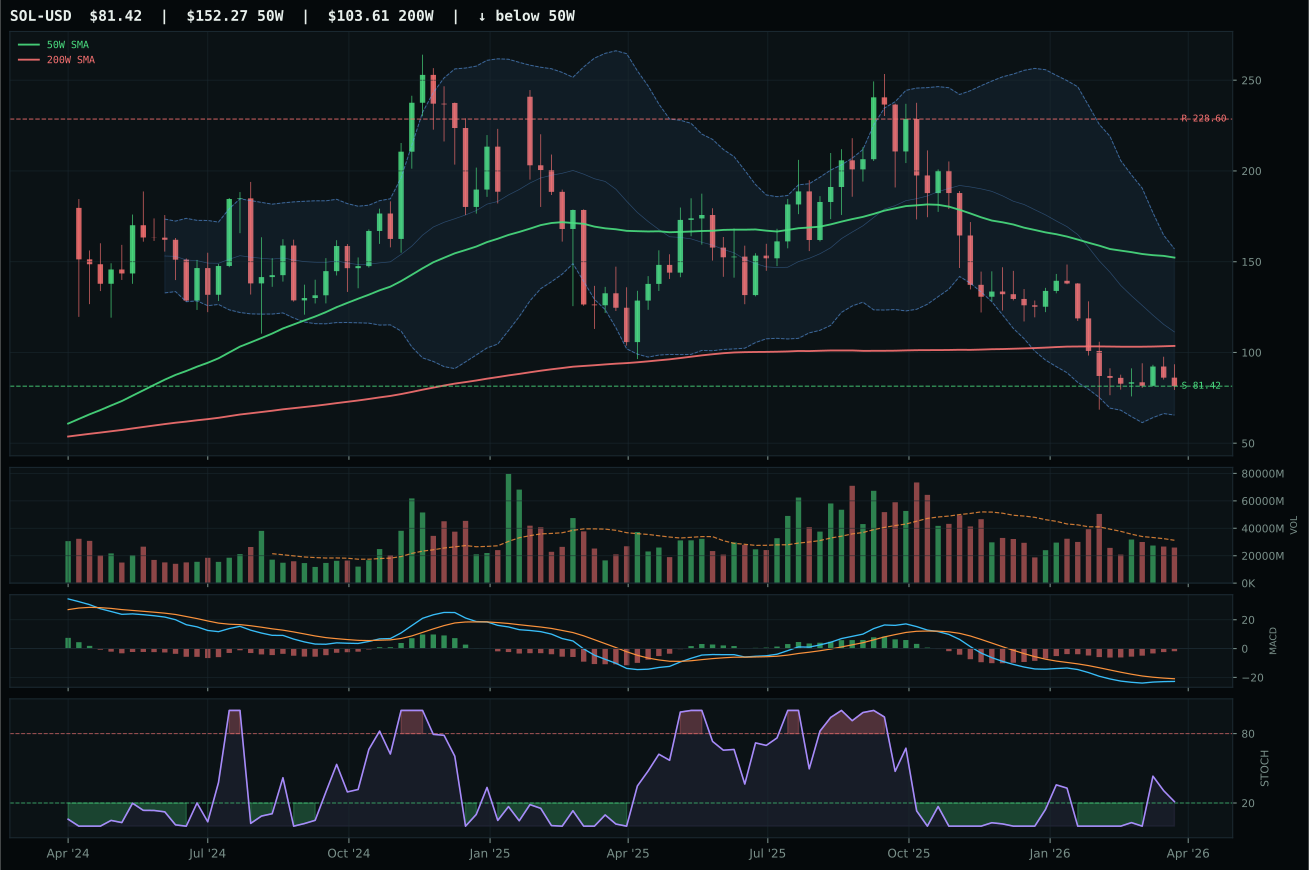
Crypto Regime — NoCrypto
ValueBTC armed by first 200W buy-zone touch, but post-touch range age is 7 weeks; minimum is 12
TrendBTC not confirmed
one or more available conditions failed
Category Rankings
| Rank | Category | Winner | Score | Alloc | 4W Ret | Peers (4W) |
|---|---|---|---|---|---|---|
| 1 | Traditional Energy | XOP | 93.3 | 20% | -10.85% | FCG -8.7% · XLE -9.6% |
| 2 | Agriculture & Livestock | WEAT | 78.2 | 20% | +1.22% | MOO -1.6% · VEGI -1.2% |
| 3 | Utilities & Infrastructure | IGF | 66.1 | 10% | +1.80% | XLU +0.4% · PAVE +11.4% |
| 4 | Nuclear Energy | NLR | 55.2 | 10% | +10.09% | URNM +12.6% · URA +18.5% |
| 5 | Industrial Metals | COPX | 50.6 | 10% | +11.49% | REMX +10.9% · PICK +11.9% |
| 6 | Defense & Aerospace | ITA | 49.7 | 10% | -1.00% | ROKT +10.8% · XAR +1.5% |
| 7 | Precious Metals | GLD | 48.2 | 10% | +2.89% | GDX +6.9% · SLV +6.0% |
| 8 | AI | SMH | 43.5 | 10% | +34.84% | AIQ +21.0% · BOTZ +18.0% |
| 9 | Technology | CIBR | 42.4 | 0% | +9.16% | XLK +21.9% · IGV +9.0% |
| 10 | Emerging Markets | ILF | 20.5 | 0% | +8.15% | IEMG +14.8% · INDA +8.9% |
Traditional Energy — XOP
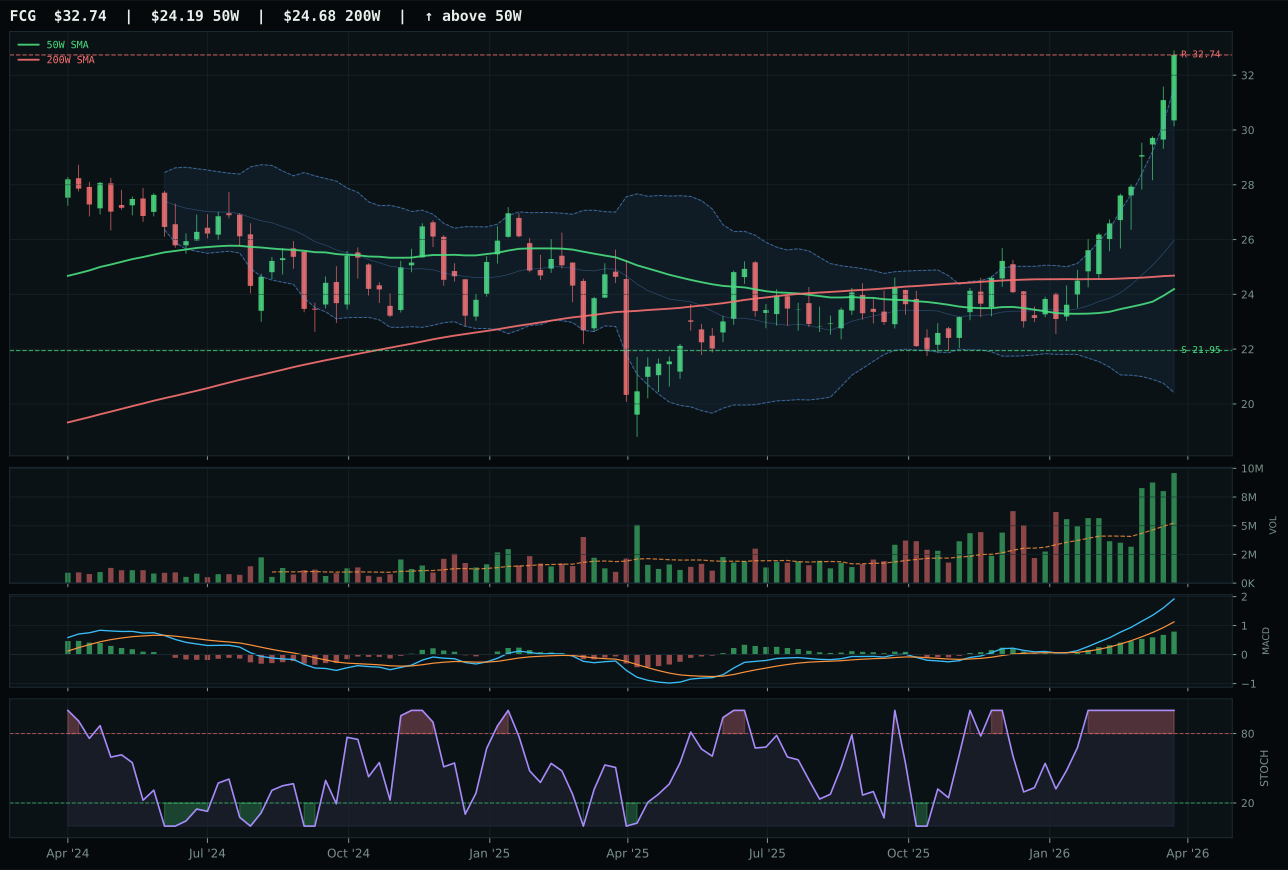
FCG has a vertical extension profile with 49.6% 13-week relative strength versus SPY.
A failed hold above support would weaken the setup.
Actionable but governed by invalidation levels.
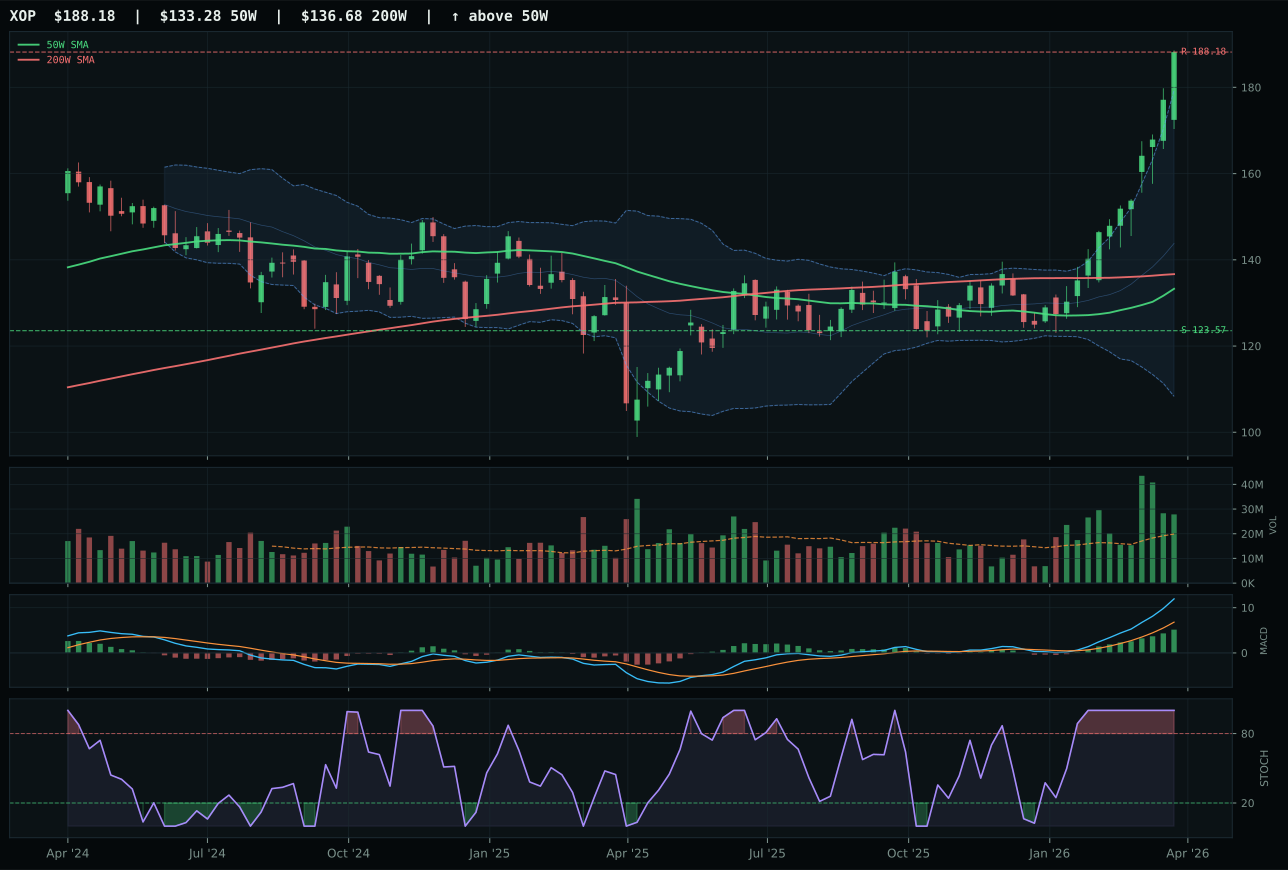
XOP has a vertical extension profile with 58.7% 13-week relative strength versus SPY.
A failed hold above support would weaken the setup.
Actionable but governed by invalidation levels.
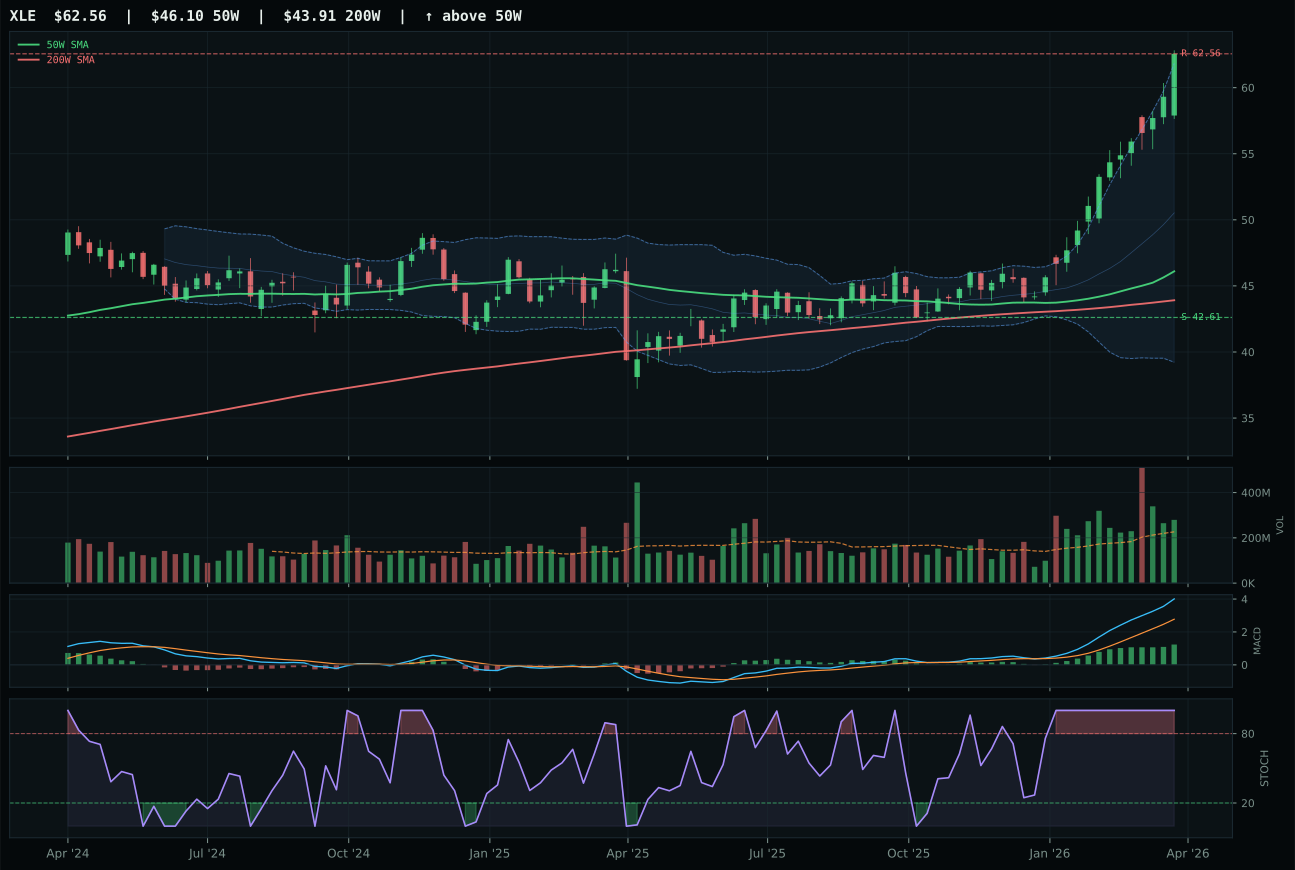
XLE has a vertical extension profile with 49.7% 13-week relative strength versus SPY.
A failed hold above support would weaken the setup.
Actionable but governed by invalidation levels.
XOP secures the top-2 allocation with a perfect storm of technicals and macro alignment that no competitor can match. Price sits 41.2% above the 50-week moving average with a trend score of 100, a 58.7% relative strength advantage to SPY, and a 50.6% 13-week return—these are not marginal outperformance numbers but wholesale re-rating driven by energy-scarcity tailwinds and geopolitical supply concerns. MACD is bullish and improving with stochastic RSI at overbought momentum (1.00), yet volume remains at 1.40x the 20-week average, indicating that accumulation is still taking place despite the extended entry. FCG offers slightly higher technical evidence (94.8 vs 91.8) but trails in category-relative strength at -0.1% versus XOP's 9.1%, meaning XOP is capturing both absolute energy strength and peer outperformance within the basket. The structure score of 85.5 and persistence of 100 reveal this is not a flash move but a sustained shift in energy allocation driven by supply shocks and inflation expectations.
Traditional Energy dominates at 20% allocation with a category score of 93.3—the highest in the entire portfolio—and a macro fit of 92% anchored on energy-scarcity (+16), inflation-pressure (+10), supply-shortage (+9), and real-asset-sponsorship (+7). XOP's technical evidence score of 91.8 is exceptional, but the true allocator signal is macro: the Transition/Mixed regime has activated three persistent energy-supportive descriptors simultaneously, and geopolitical supply constraints show no sign of resolution. Risk/reward is the only caveat: upside to resistance is capped at 0.0% (price is already at the 52-week high), and downside support at 123.57 implies 52.3% drawdown risk if the cycle turns. The timing score of 37 reflects this tension—the chart is extended and stochastic RSI is overbought, warning that entry risk is real. However, the persistence score of 100 and momentum confirmation of 100 signal that conviction remains intact. The 20% allocation is justified because energy supply dynamics are structural, not cyclical, and portfolio inflation-hedging through real assets is warranted. XOP holds top-2 status despite entry risk because the macro case overwhelms valuation concerns in a transition regime.
Agriculture & Livestock — WEAT
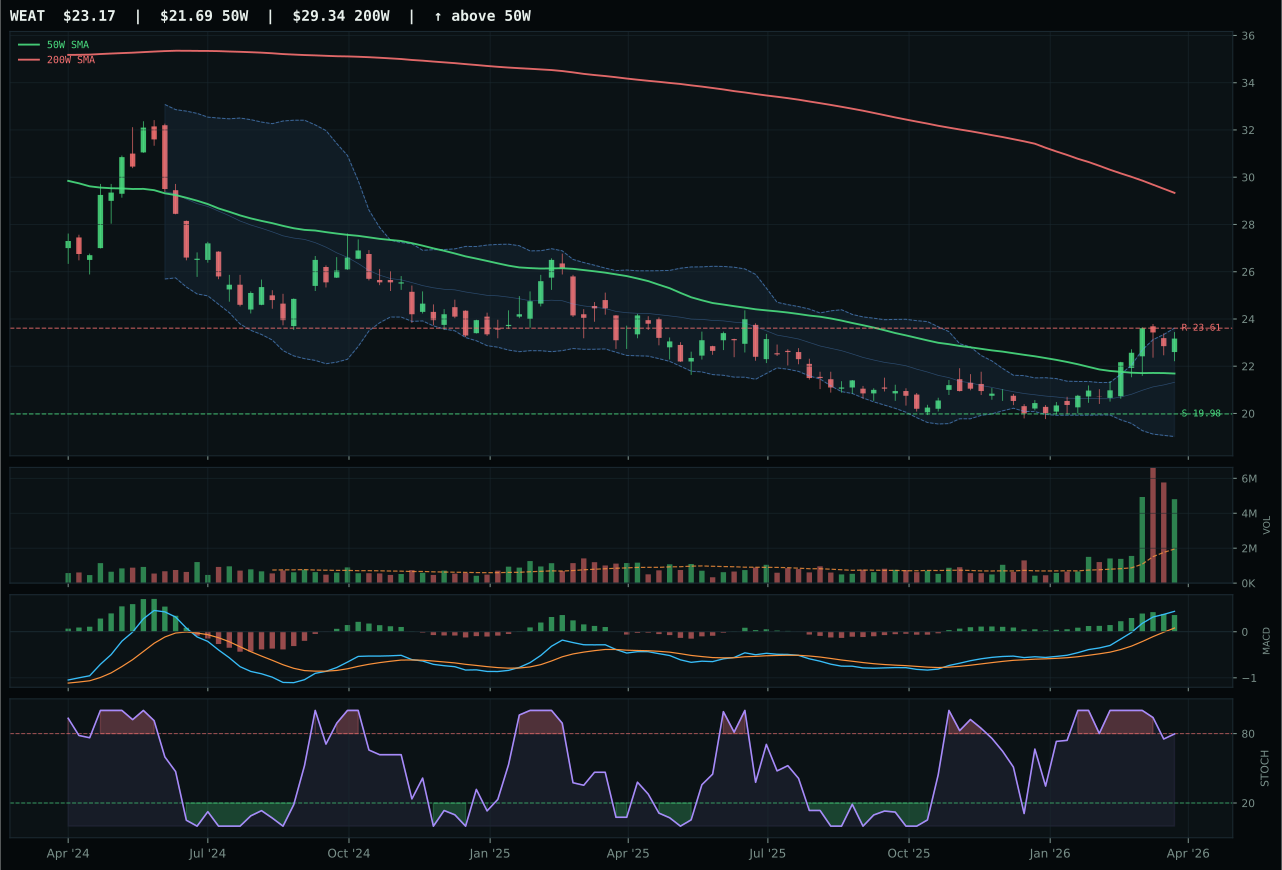
WEAT has a neutral structure profile with 21.5% 13-week relative strength versus SPY.
A failed hold above support would weaken the setup.
Actionable but governed by invalidation levels.
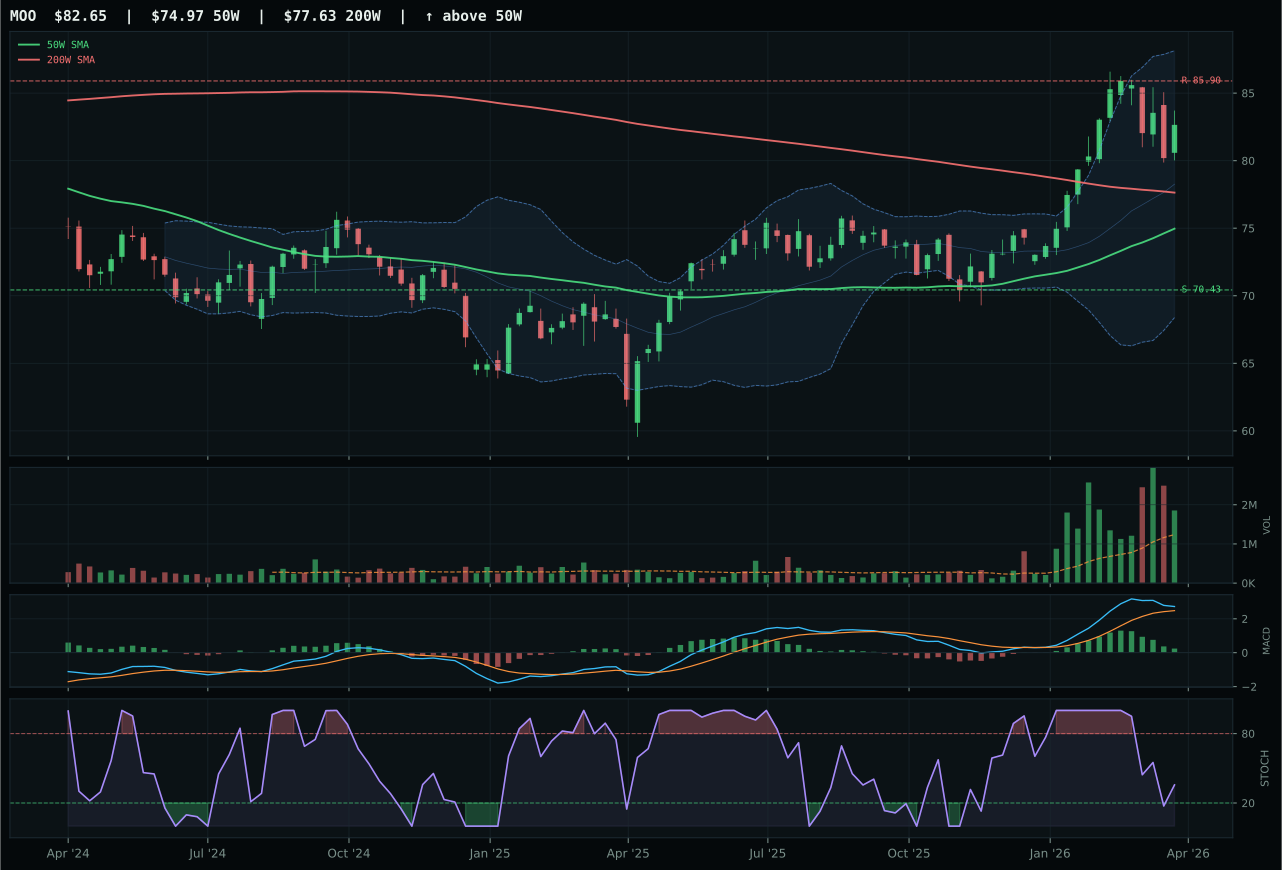
MOO has a neutral structure profile with 21.3% 13-week relative strength versus SPY.
A failed hold above support would weaken the setup.
Actionable but governed by invalidation levels.
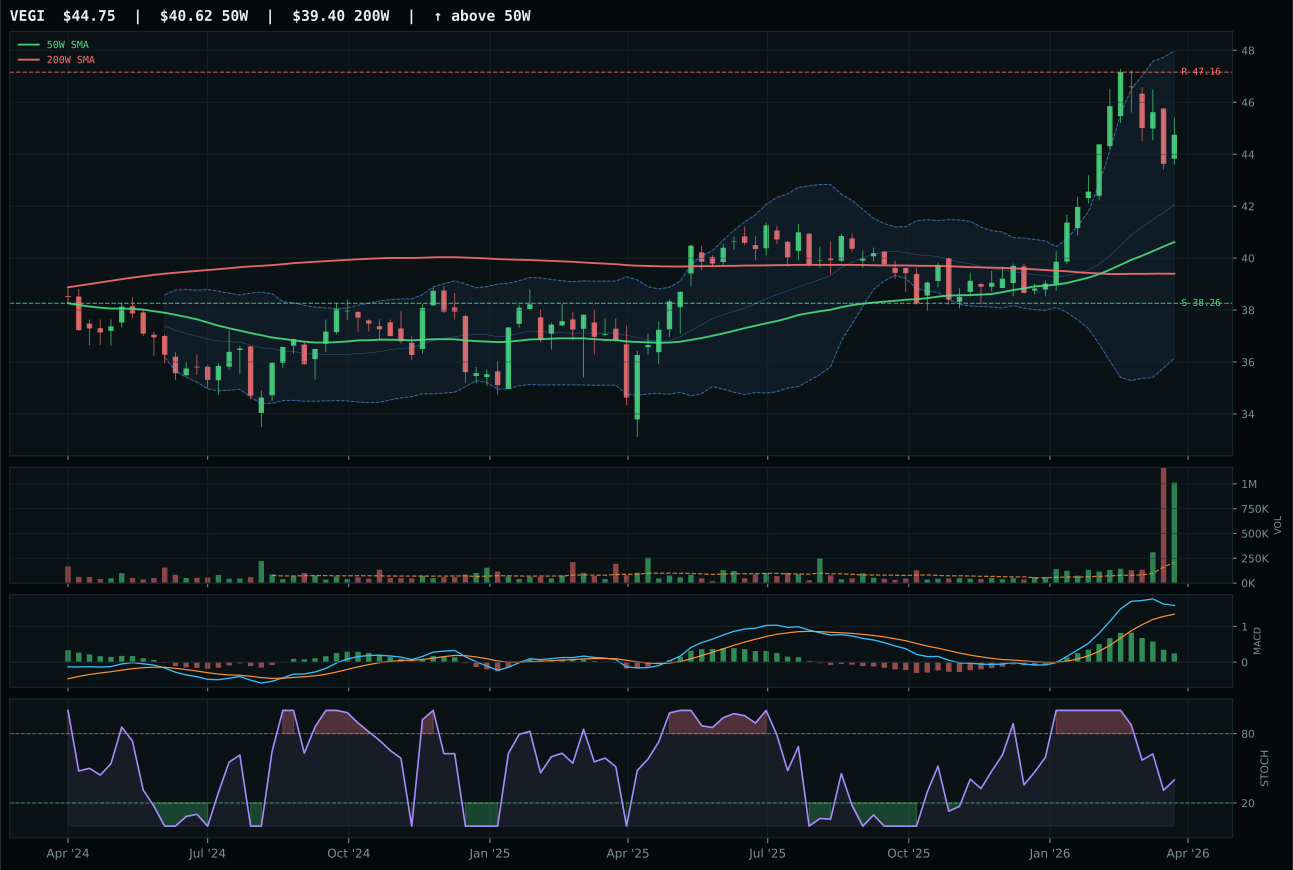
VEGI has a neutral structure profile with 23.4% 13-week relative strength versus SPY.
A failed hold above support would weaken the setup.
Tracked, but not top-2 eligible because: .
WEAT secures the top-2 slot by combining the strongest momentum confirmation score (100) with the highest volume-price confirmation (85.5) in a category defined by supply-shortage and inflation-pressure tailwinds. Price sits just 6.8% above the 50-week moving average after a 13.4% 13-week return, and the critical difference between WEAT and MOO is MACD clarity: WEAT's bullish-and-improving signal carries far more weight than MOO's bullish-but-flattening deterioration, and volume at 2.46x the 20-week average (accumulation/confirmation) dwarfs MOO's participation. The 21.5% relative strength to SPY matches the category median at 0.0% relative-strength internally, meaning WEAT is the category's expression, not an outlier. MOO's superior trend score (96 vs 70) is undermined by a stochastic RSI that remains oversold without the turn-up signal WEAT displays, signaling that the momentum behind MOO's uptrend is fading while WEAT's is crystallizing into institutional accumulation.
Agriculture earns 20% allocation as the second-highest-ranked category at 78.2, driven by a category-level macro fit of 86% anchored on four active descriptors: supply shortage (+13), inflation pressure (+10), real-asset sponsorship (+8), and commodity-breadth positive (+5). WEAT's technical evidence score of 95.3 and momentum-confirmation perfect score reflect the alignment between rising commodity prices and institutional repositioning into hard assets. The category's risk/reward is asymmetric at 52.1: upside to resistance is constrained (-1.9%), but downside support at 19.98 offers 16% cushion, a profile that defends capital in a transition regime while participating in scarcity-driven re-rating. The structure score of 85.2 and persistence of 83.4 indicate this is not a flash move but an accumulation pattern. Agriculture's 20% slot is justified because macro sponsorship is durable (supply shocks don't reverse overnight) and technical confirmation has broadened from WEAT into MOO's 13-week gains of 13.2%, suggesting this is category-wide rotation rather than single-name momentum.
Utilities & Infrastructure — IGF
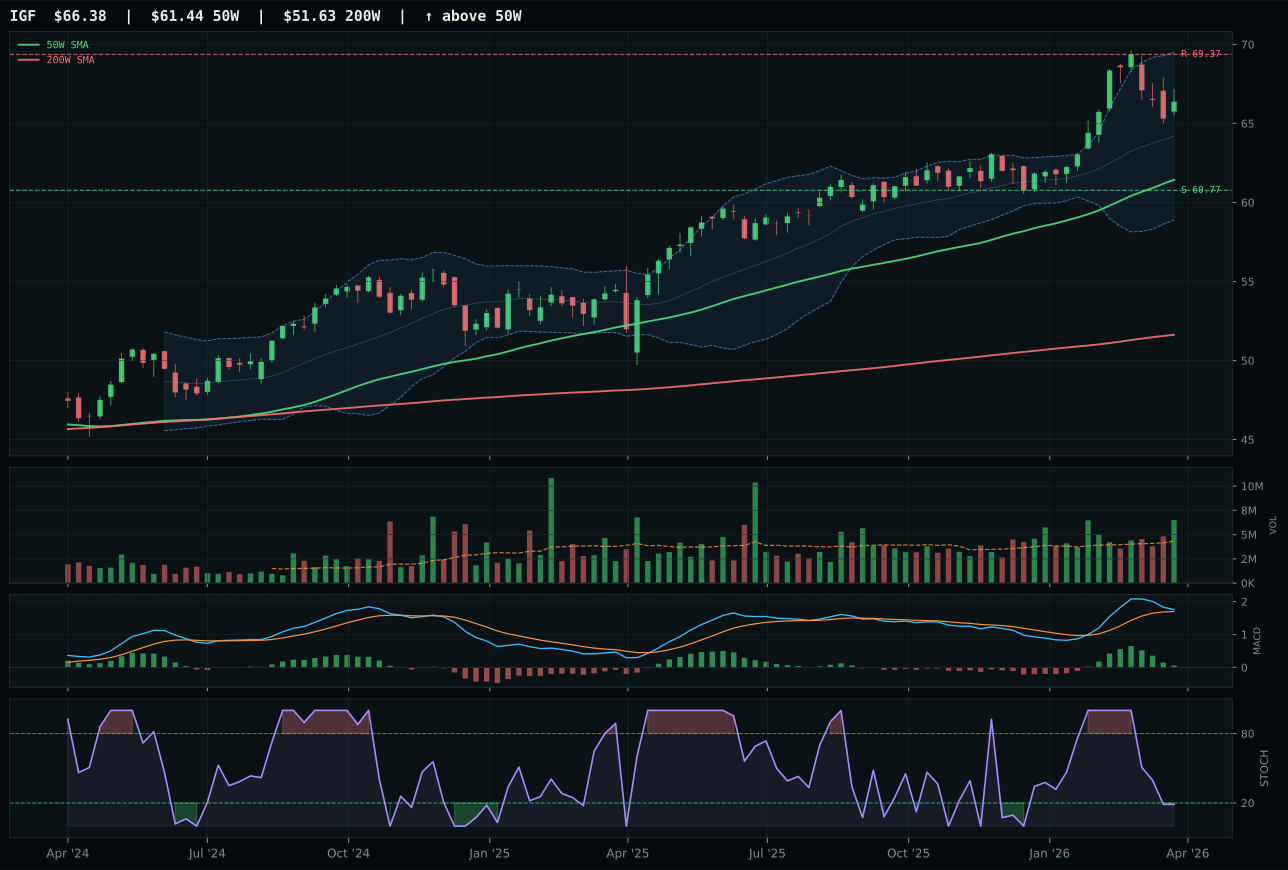
IGF has a neutral structure profile with 15.5% 13-week relative strength versus SPY.
A failed hold above support would weaken the setup.
Actionable but governed by invalidation levels.
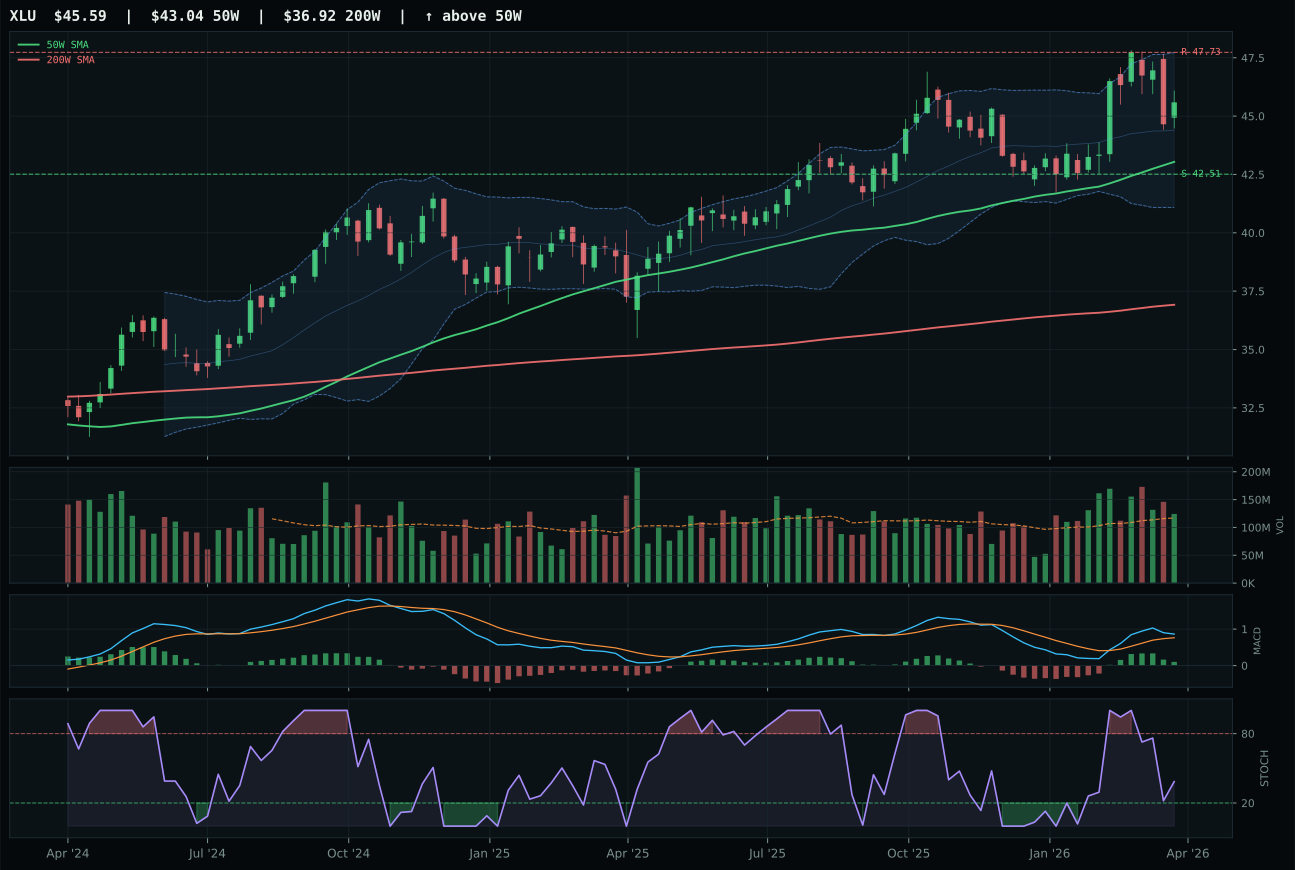
XLU has a neutral structure profile with 14.7% 13-week relative strength versus SPY.
A failed hold above support would weaken the setup.
Actionable but governed by invalidation levels.
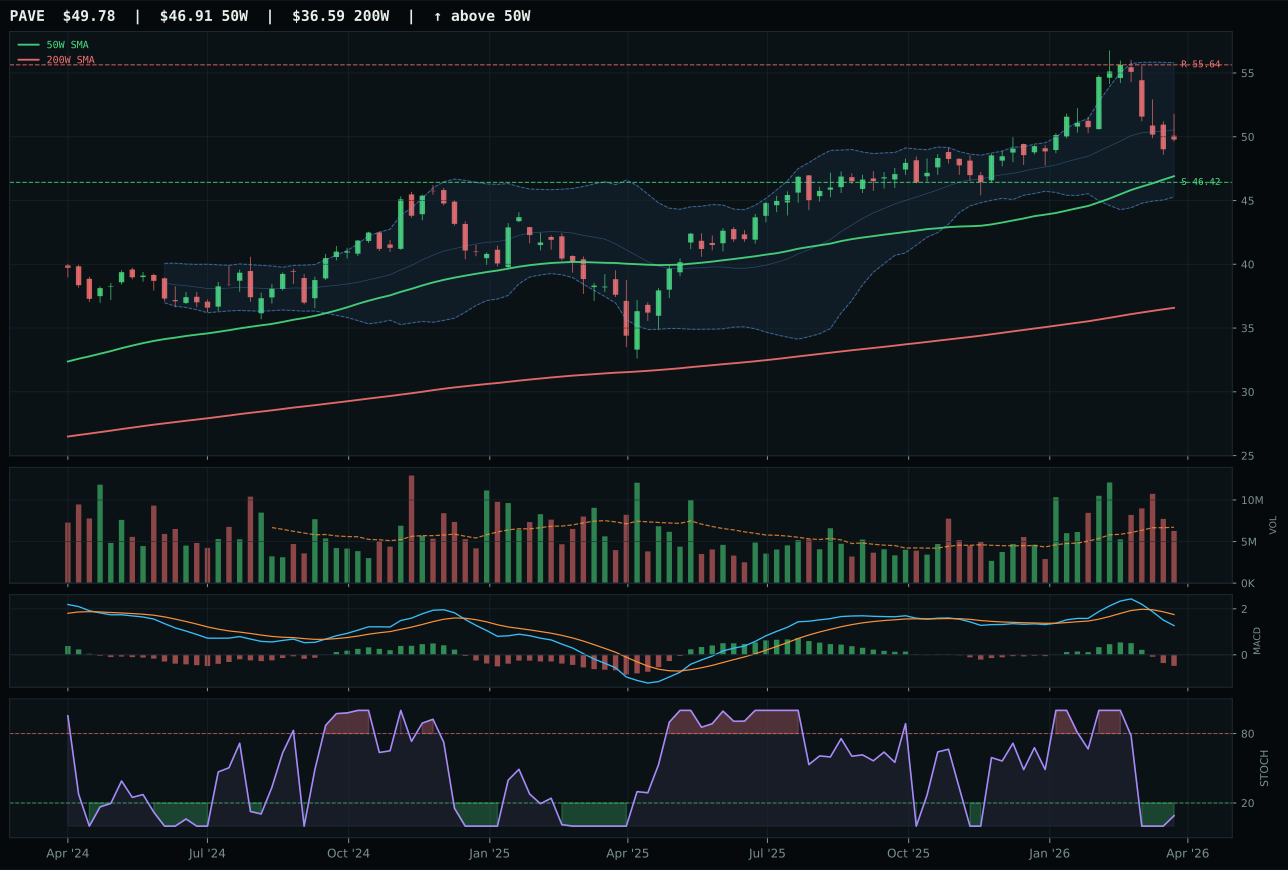
PAVE has a neutral structure profile with 9.2% 13-week relative strength versus SPY.
A failed hold above support would weaken the setup.
Actionable but governed by invalidation levels.
IGF secures the category win with the highest momentum confirmation (91.4) and volume-price confirmation (90.4) scores in a field of defensive postures, combining defensive positioning with genuine accumulation. Price sits just 8% above the 50-week moving average with a perfect trend score of 100 and 15.5% relative strength to SPY, yet the critical edge over XLU lies in volume: 1.50x at accumulation/confirmation versus XLU's neutral participation. Momentum confirmation at 91.4 reflects IGF's +7.4% 13-week return and bullish-but-flattening MACD, both superior to XLU's 6.6% return despite XLU's flattening MACD showing less conviction. The structure score of 84.5 and persistence of 77.4 indicate that IGF's infrastructure theme (global assets, real yields, inflation hedging) is attracting institutional capital while XLU's regulated-utility defense remains more tactical. XLU's neutral volume and 0.0% category-relative strength reveal it is being held rather than accumulated.
Utilities & Infrastructure warrants 10% at a category score of 66.1 with a macro fit of 64%, supported by defensive-rotation (+12), Transition/Mixed regime boost (+4), and broad-market-bear (+4), partially offset by inflation-pressure (-6) headwinds. IGF's technical evidence score of 85.3 is among the highest in the portfolio, reflecting clean trend, solid relative strength, and above-average volume participation that signals real allocator conviction. The category's dual nature—defensive yield plus real-asset inflation hedging—provides portfolio diversification that pure equity or pure commodity positioning cannot match. Risk/reward of 58.4 is moderate (upside constrained at -4.3% to resistance, downside 9.2% to support), but the combination of trend strength (100), momentum confirmation (91.4), and volume-price confirmation (90.4) suggests the market is pricing in further accumulation. However, the category ranking at third-tier reflects macro caution: utilities and infrastructure are defensive names in a transition regime, suitable for risk management but not portfolio drivers. To move Utilities higher, either broad-market volatility would need to spike or real-yield compression would need to reverse, activating monetaryhedge demand.
Nuclear Energy — NLR
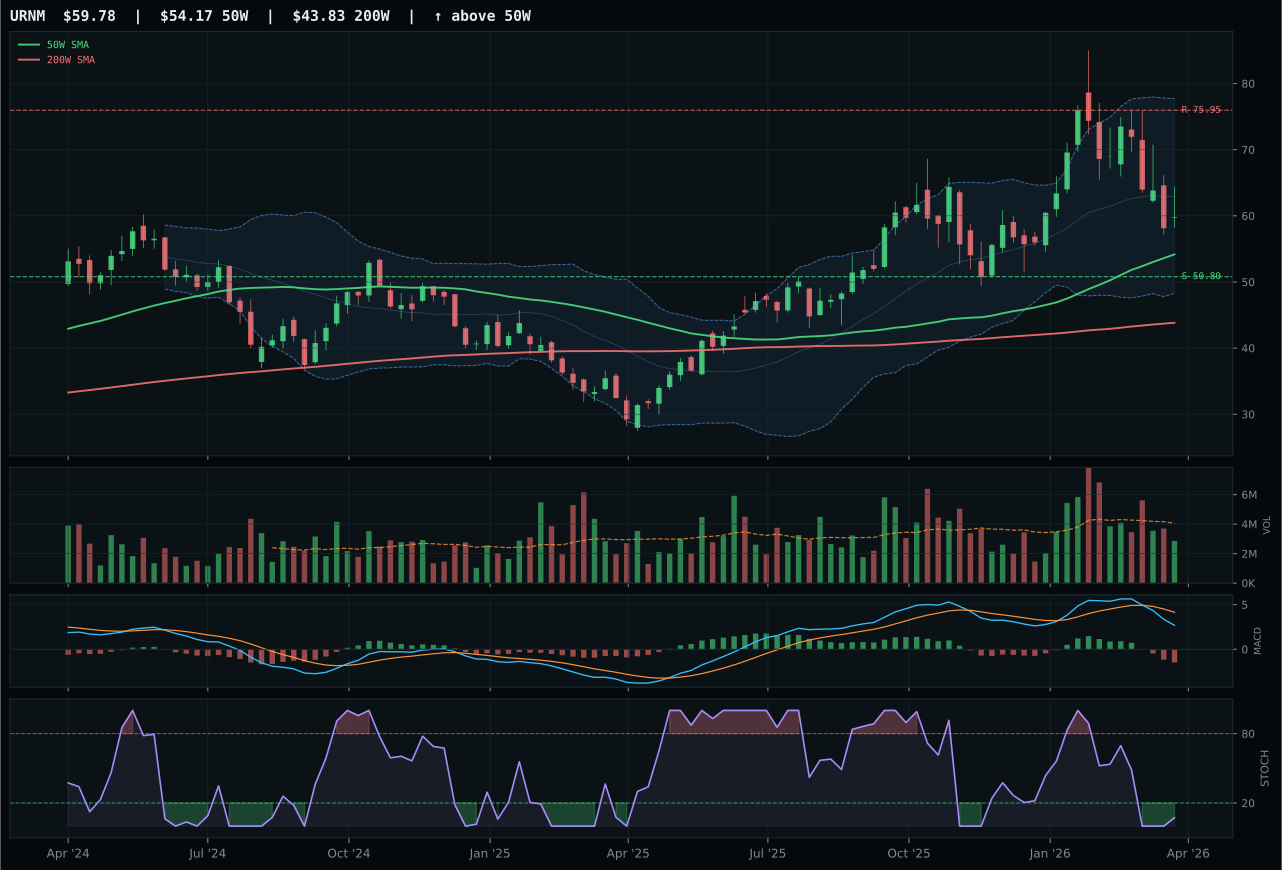
URNM has a neutral structure profile with 14.9% 13-week relative strength versus SPY.
A failed hold above support would weaken the setup.
Actionable but governed by invalidation levels.
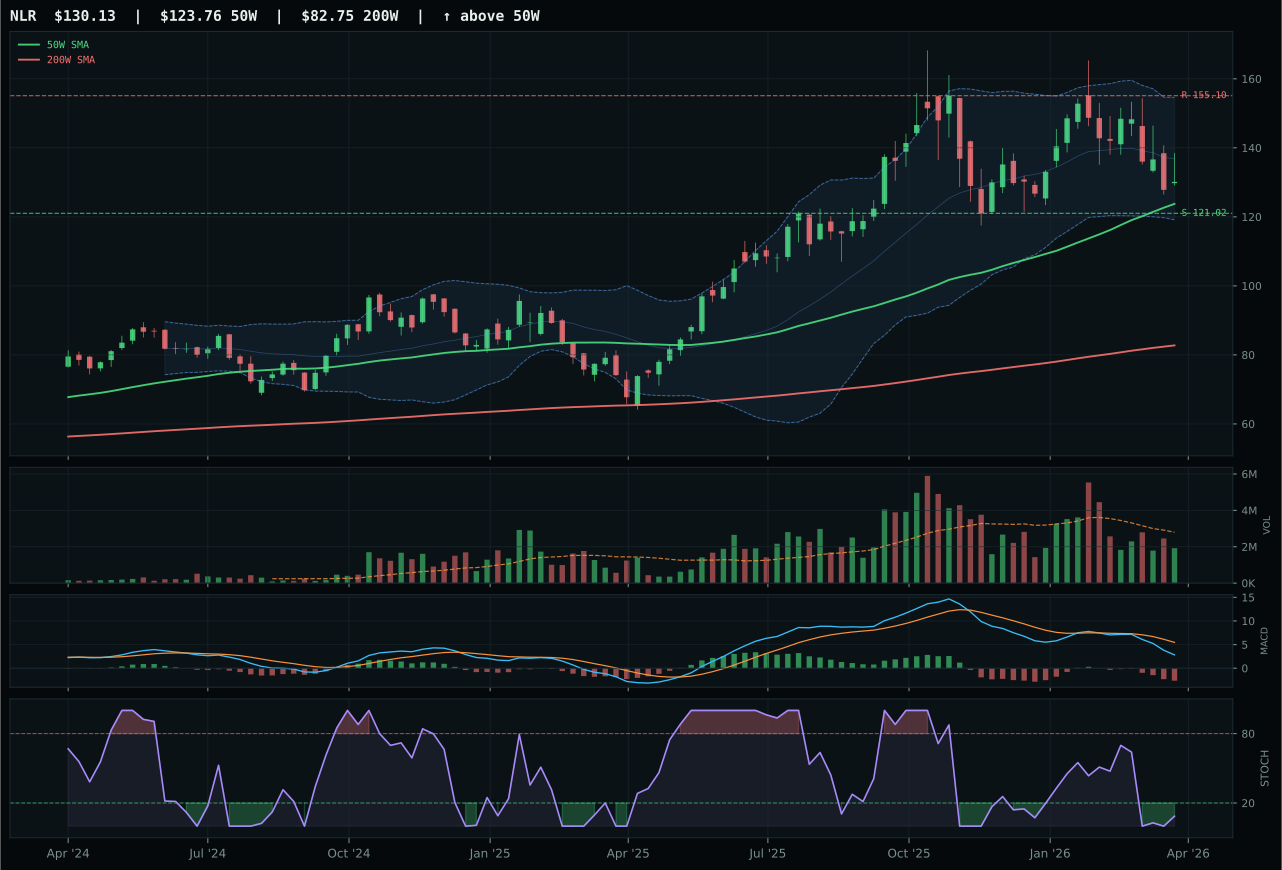
NLR has a neutral structure profile with 10.8% 13-week relative strength versus SPY.
A failed hold above support would weaken the setup.
Actionable but governed by invalidation levels.
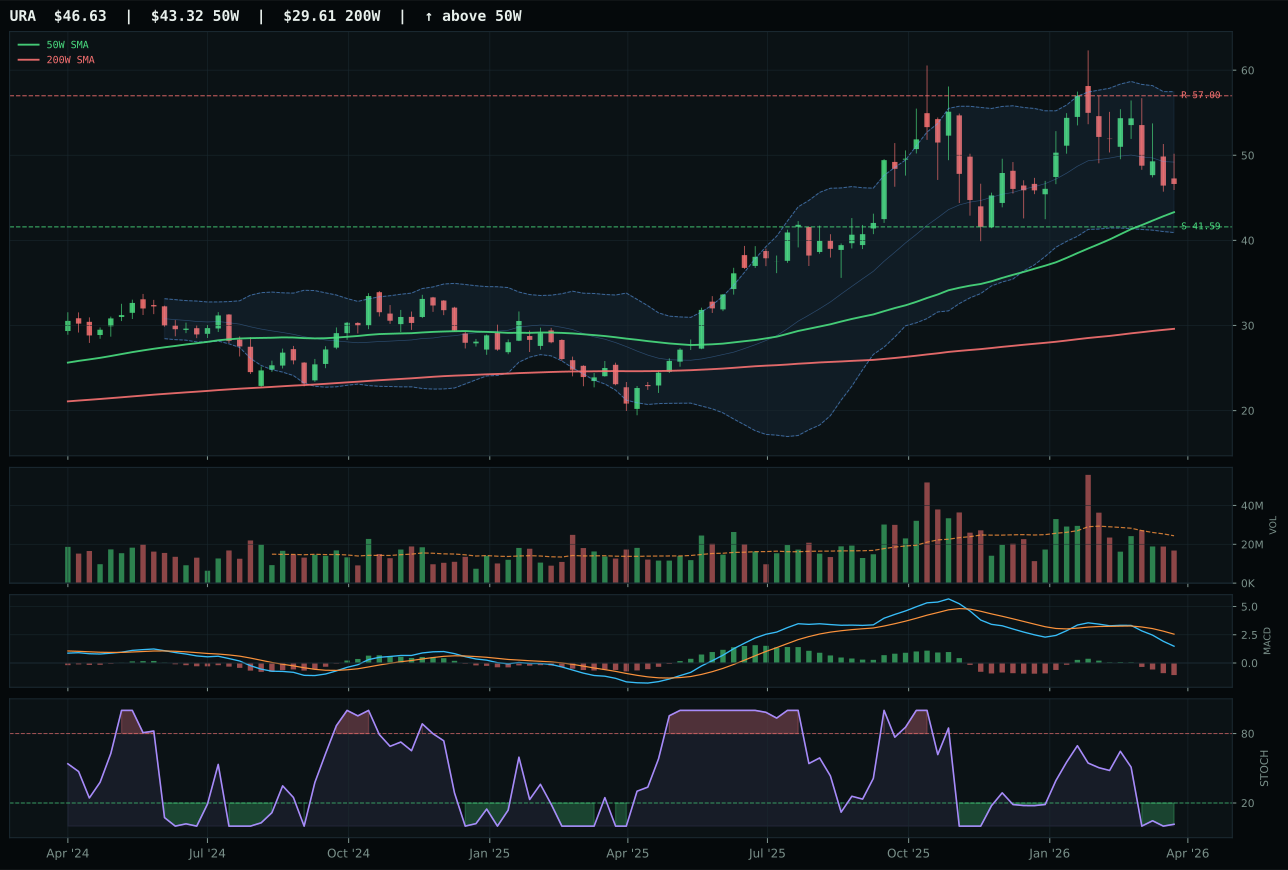
URA has a neutral structure profile with 9.8% 13-week relative strength versus SPY.
A failed hold above support would weaken the setup.
Actionable but governed by invalidation levels.
NLR prevails over URNM by the narrowest margin (55.2 vs 54.3) through superior risk/reward (68.5 vs 51.7) and timing (84 vs 91), a trade-off that favors entry quality over upside potential. Price sits just 5.1% above the 50-week moving average in the upper-retracement zone, offering defined support at 121.02 with a tight 7.5% downside cushion—URNM is extended 10.4% from the 50W and carries higher timing risk despite a superior stochastic RSI turn-up signal. Volume at 0.69x reveals thin participation, a structural weakness across the entire nuclear basket, but NLR's structure score of 63.7 and neutral setup suggest accumulation is happening quietly without panic. URNM's 14.9% relative strength to SPY and 6.8% 13-week return appear superior to NLR's 2.7%, but that outperformance comes from leverage (uranium miner beta) rather than institutional conviction, and the weaker risk/reward of 51.7 reveals that upside is increasingly constrained.
Nuclear Energy earns 10% at a category score of 55.2 with a macro fit of 74% driven by energy-scarcity (+9), real-asset-sponsorship (+7), and AI-growth-sponsorship (+5)—a diversified support structure that reflects nuclear's dual role as both energy alternative and clean-energy infrastructure play. NLR's technical evidence score of 47.7 is modest, reflecting thin volume at 0.69x and momentum confirmation at 34.8, signaling that conviction has not yet broadened into the nuclear basket beyond a handful of names. The category is allocated because supply-chain tailwinds (uranium scarcity, reactor build-out, grid-stability concerns) are durable, and the defensive-rotation descriptor (+6) aligns with portfolio hedging. However, the allocation size reflects caution: thin participation means liquidity could evaporate if sentiment shifts, and the MACD bearish/weakening signal across the basket warns that the initial excitement may have peaked. For Nuclear to move into higher allocation, either broad institutional participation would need to show up (volume multiples increasing) or MACD would need to turn bullish with conviction.
Industrial Metals — COPX
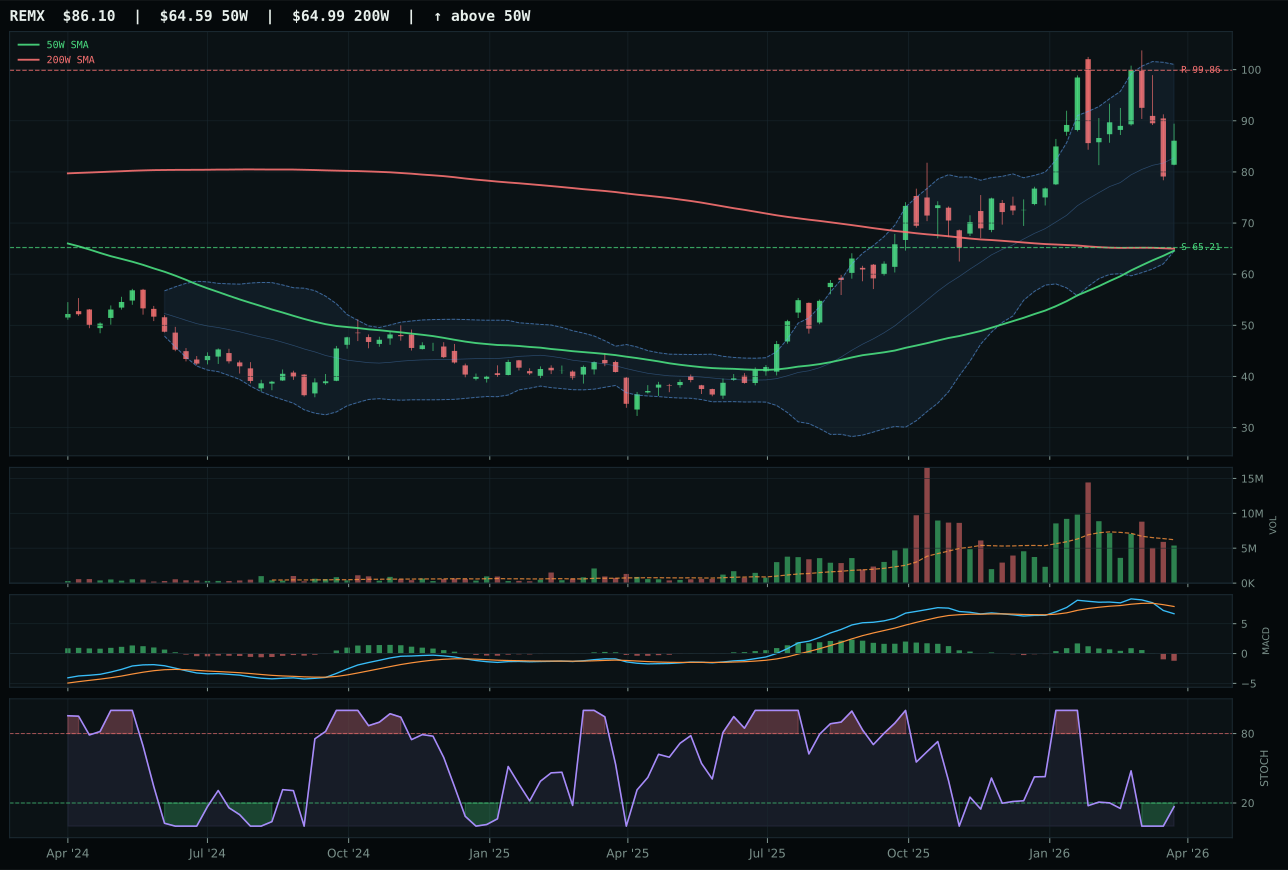
REMX has a vertical extension profile with 20.3% 13-week relative strength versus SPY.
A failed hold above support would weaken the setup.
Actionable but governed by invalidation levels.
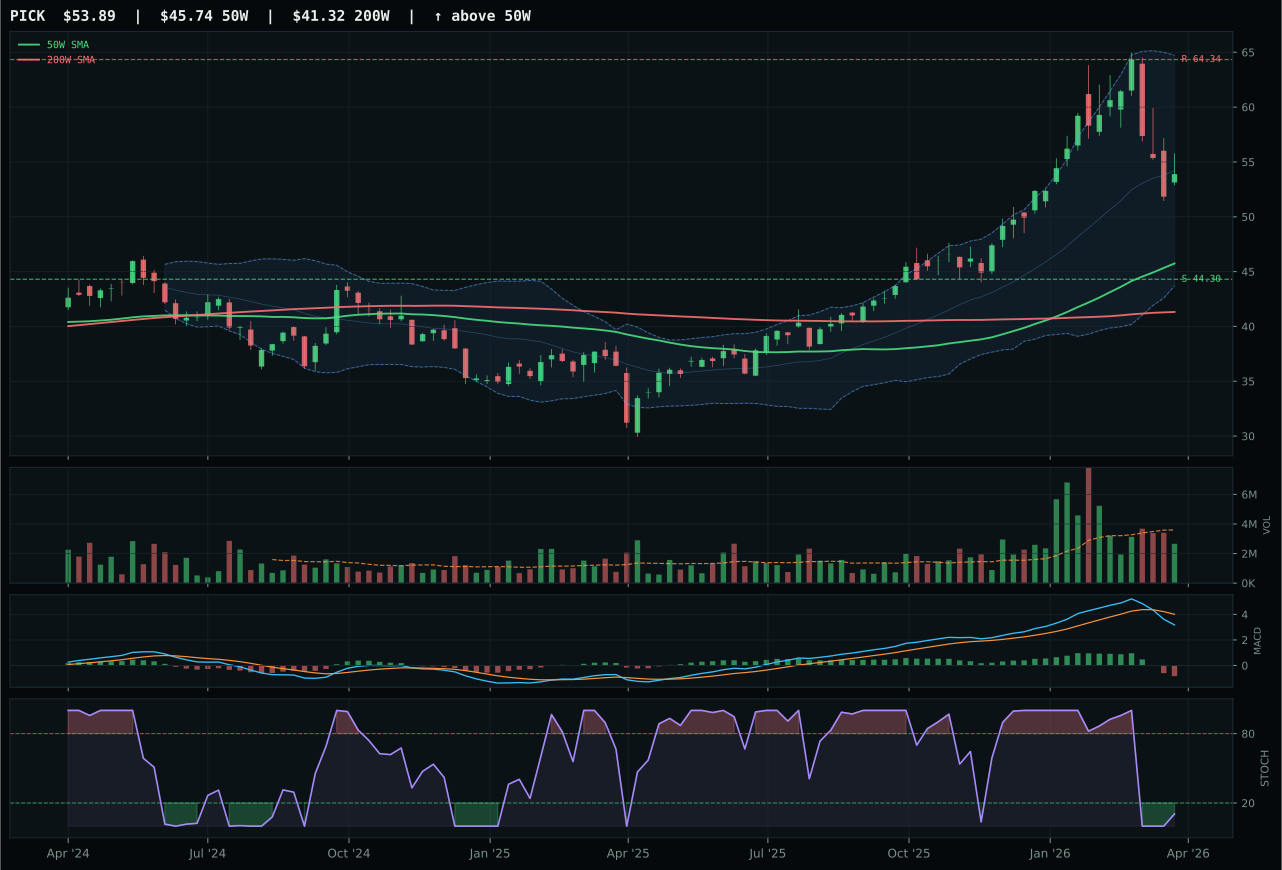
PICK has a vertical extension profile with 11.1% 13-week relative strength versus SPY.
A failed hold above support would weaken the setup.
Actionable but governed by invalidation levels.
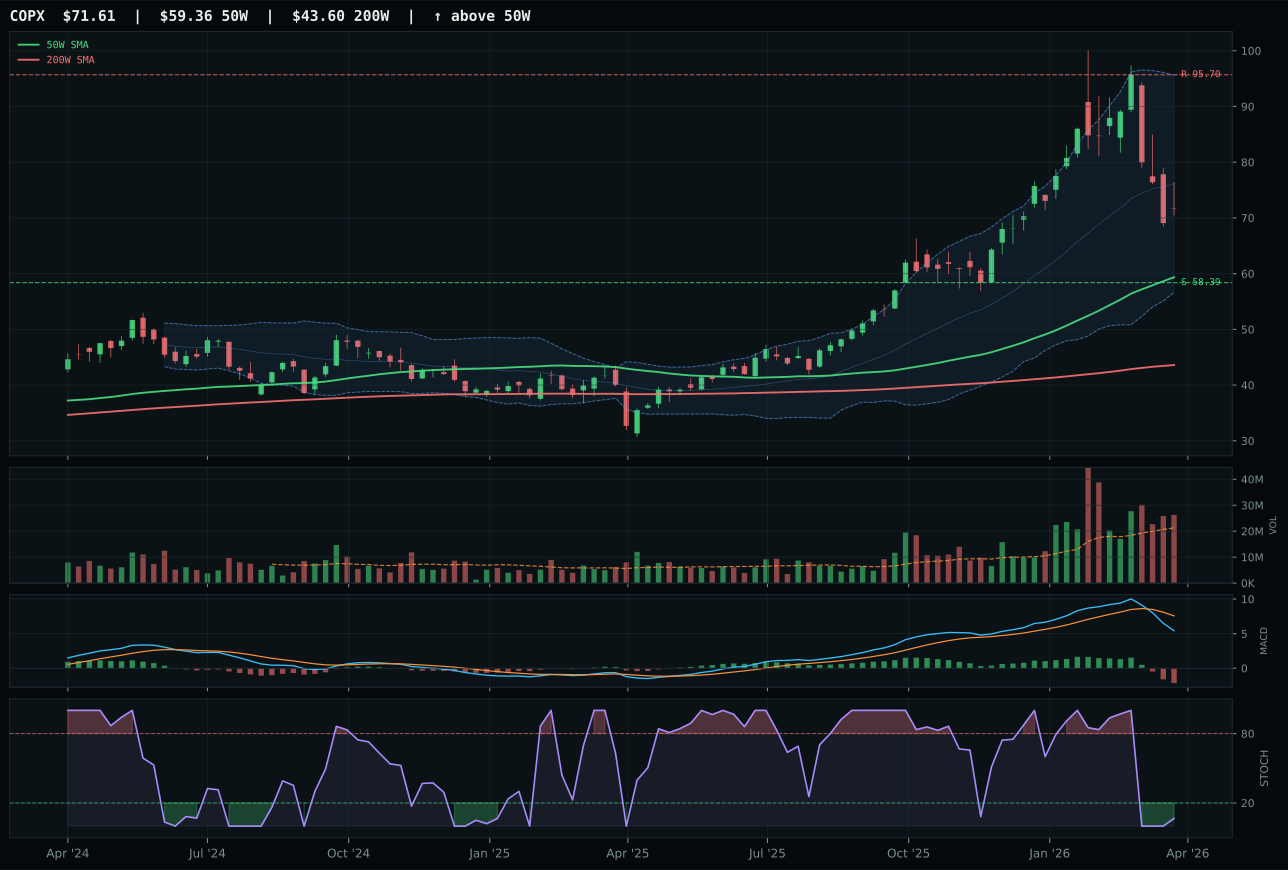
COPX has a vertical extension profile with 2.7% 13-week relative strength versus SPY.
A failed hold above support would weaken the setup.
Actionable but governed by invalidation levels.
COPX wins by the narrowest margin (50.6 vs REMX at 49.3) because its category-relative strength, though negative at -8.4%, is penalized less severely than REMX's stretched entry 33.3% above the 50-week moving average. Price at 20.6% above the 50W is extended but not climactic, and the stochastic RSI oversold-turn-up reading at 0.07 provides some technical cushion for mean reversion. Volume at 1.23x confirms above-average participation despite the extension, and the macro environment of metals-scarcity (+12) and commodity-breadth-positive (+7) supports copper's structural scarcity narrative. REMX's 20.3% relative strength to SPY and 12.2% 13-week return look compelling until you examine the timing: REMX is 33.3% extended from the 50W with neutral volume and a flat MACD, meaning the entire move has been priced in without institutional accumulation. The 1.3-point spread is tight enough to reflect category confusion, but COPX's risk/reward at 58 vs REMX's 37.7 demonstrates that entry quality still matters when both are extended.
Industrial Metals warrants 10% allocation at a category score of 50.6, supported by a macro fit of 73% driven by metals-scarcity (+14), commodity-breadth-positive (+10), and real-asset-sponsorship (+6). The category-level technical evidence score is weak at 18.6 for the representative, revealing that COPX is the lesser evil in a field where all three options are extended: PICK at Fib 0.382 with thin volume, REMX at Fib 0.618 with neutral volume, and COPX at Fib 0.382 with above-average participation. The risk/reward at 58 is asymmetric but not compelling—upside to resistance is constrained at -25.2%, and the momentum confirmation score of 0.0 signals that 4-week returns have turned negative. Industrial metals hold their slot because scarcity narratives (rare earths, copper for AI infrastructure, demand from supply-chain diversification) are durable, but the extended positioning across the category suggests patience is warranted. For Industrial Metals to move higher in the allocation stack, MACD would need to turn bullish across the basket and relative strength would need to broaden into PICK or REMX from COPX.
Defense & Aerospace — ITA
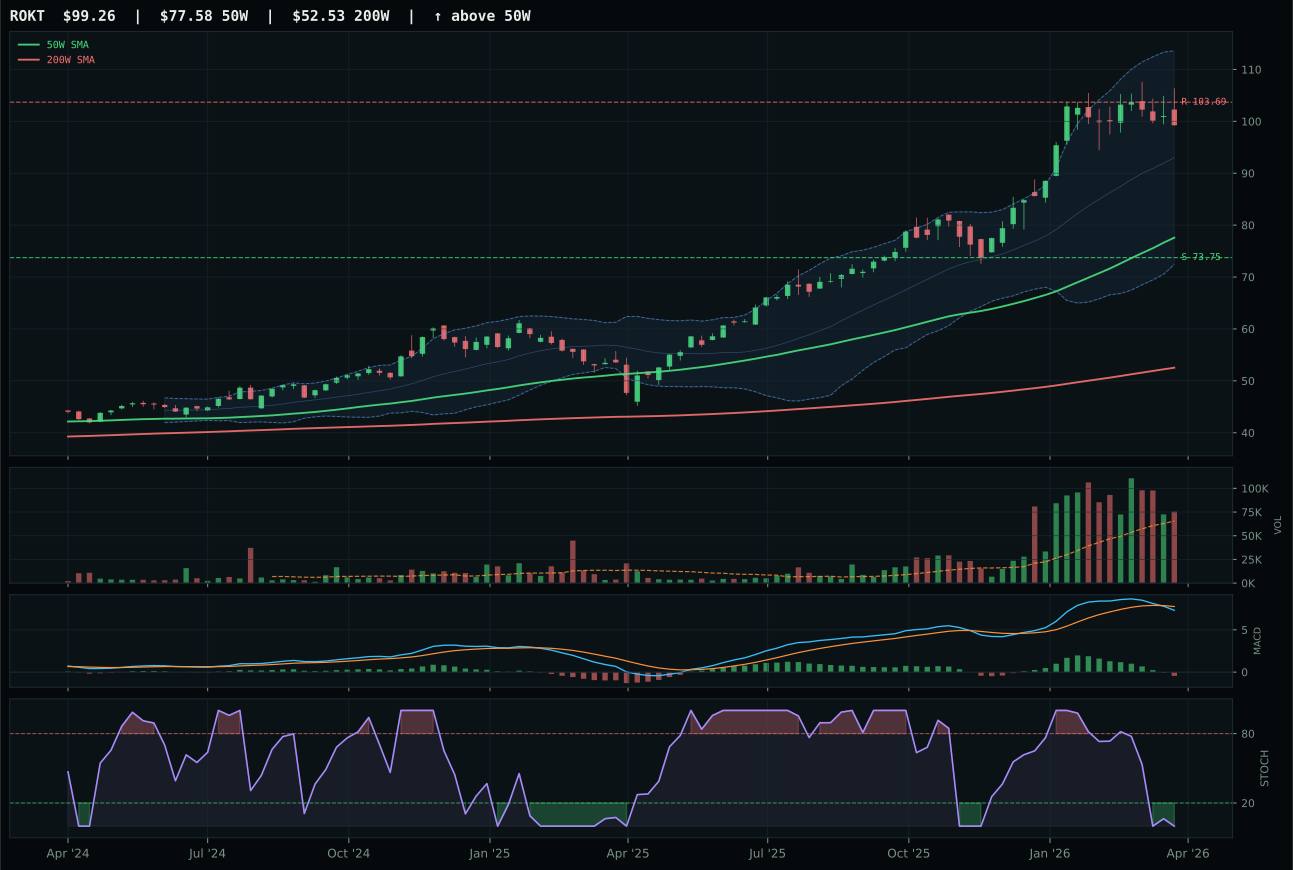
ROKT has a vertical extension profile with 24.1% 13-week relative strength versus SPY.
A failed hold above support would weaken the setup.
Tracked, but not top-2 eligible because: .
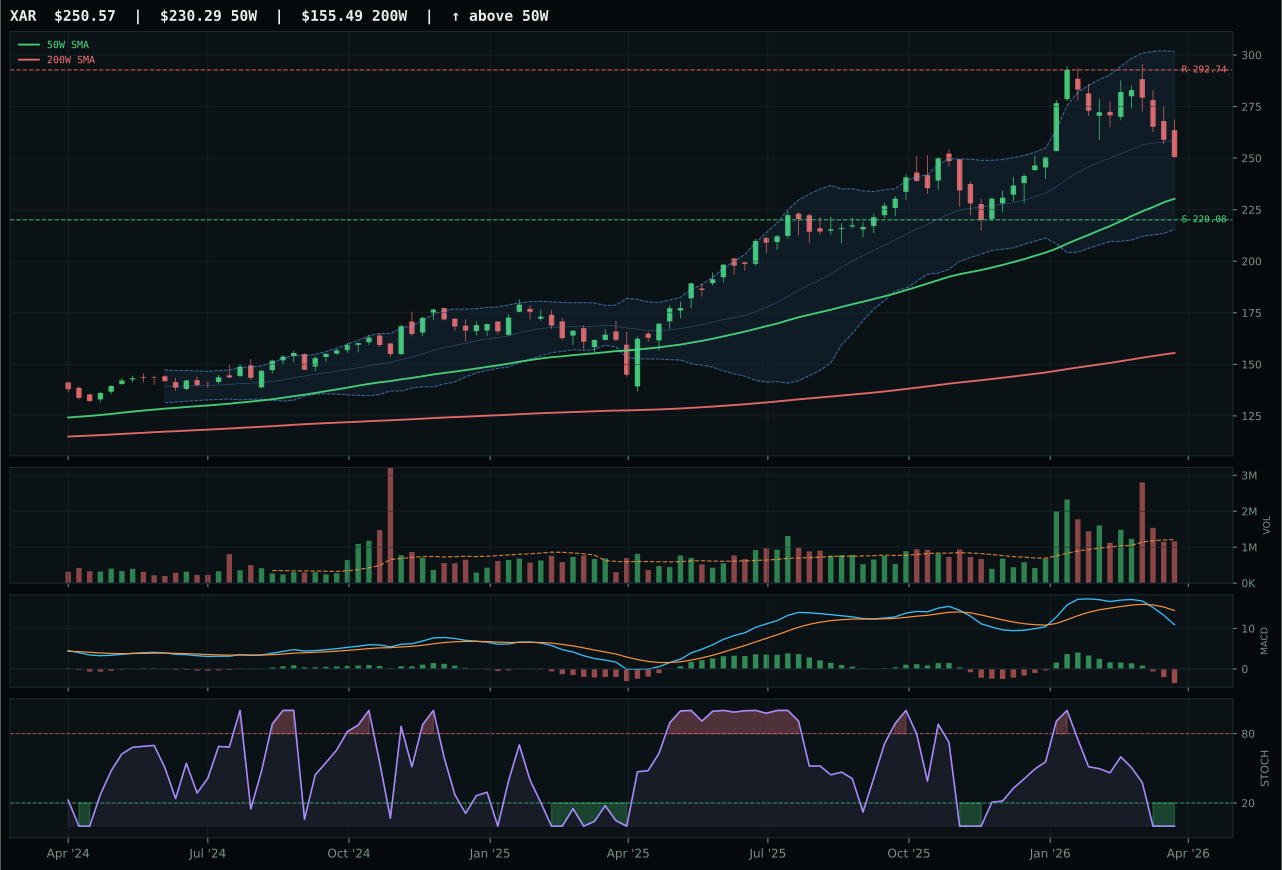
XAR has a neutral structure profile with 9.8% 13-week relative strength versus SPY.
A failed hold above support would weaken the setup.
Actionable but governed by invalidation levels.
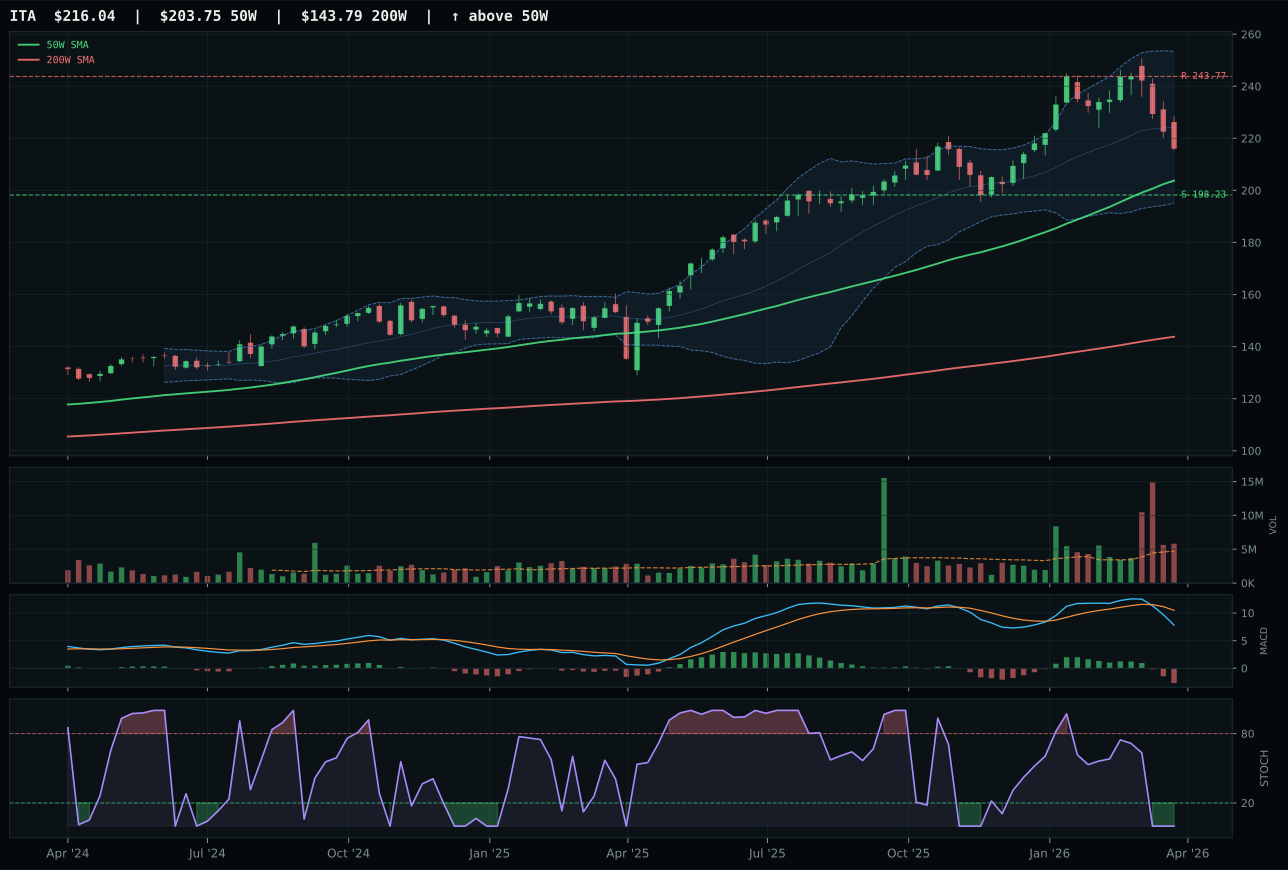
ITA has a neutral structure profile with 7.2% 13-week relative strength versus SPY.
A failed hold above support would weaken the setup.
Actionable but governed by invalidation levels.
ITA edges out ROKT and XAR because it balances trend with pragmatic positioning rather than chasing the most extreme relative strength. Price sits just 6% above the 50-week moving average with trend and timing scores both at 92 and 70, placing it in the zone where new entries have limited execution risk and downside protection is solid at 9%. ROKT, despite commanding 24.1% relative strength to SPY and 15.9% 13-week returns, is extended 27.9% from the 50W and weighted heavily in momentum confirmation (100 points), a danger signal that all gains have been priced in and risk/reward has collapsed to 47. ITA's neutral structure and -2.6% category-relative strength matter less than volume participation at 1.23x and the 92-point trend score, which reflects price above both key moving averages and positive slope. The 29.6-point gap over ROKT demonstrates that in a defensive-rotation environment, stability and entry quality trump pure beta.
Defense & Aerospace merits 10% as the third-ranked category at 49.7, benefiting from the Transition/Mixed regime and active defensive-rotation (+8) and broad-market-bear (+6) descriptors that drive a macro fit of 70%. The category's technical evidence floor is solid at 39.8 for the representative, and infrastructure breadth within the three-ETF basket (XAR, ITA, ROKT) ensures diversified exposure to primes, utilities, and growth betas. However, the timing score of 70 indicates some urgency—ITA's stochastic RSI is oversold and MACD is bearish, warning that the initial panic rotation may have peaked. The allocation holds because defensive postures remain warranted and the risk/reward of 68 provides downside protection, but upside is capped by the bearish MACD structure across the category. For Defense to move into top-2 allocation, either category technicals would need to confirm through a MACD bullish crossover, or the macro environment would need to shift from Transition to clearly Defensive.
Precious Metals — GLD
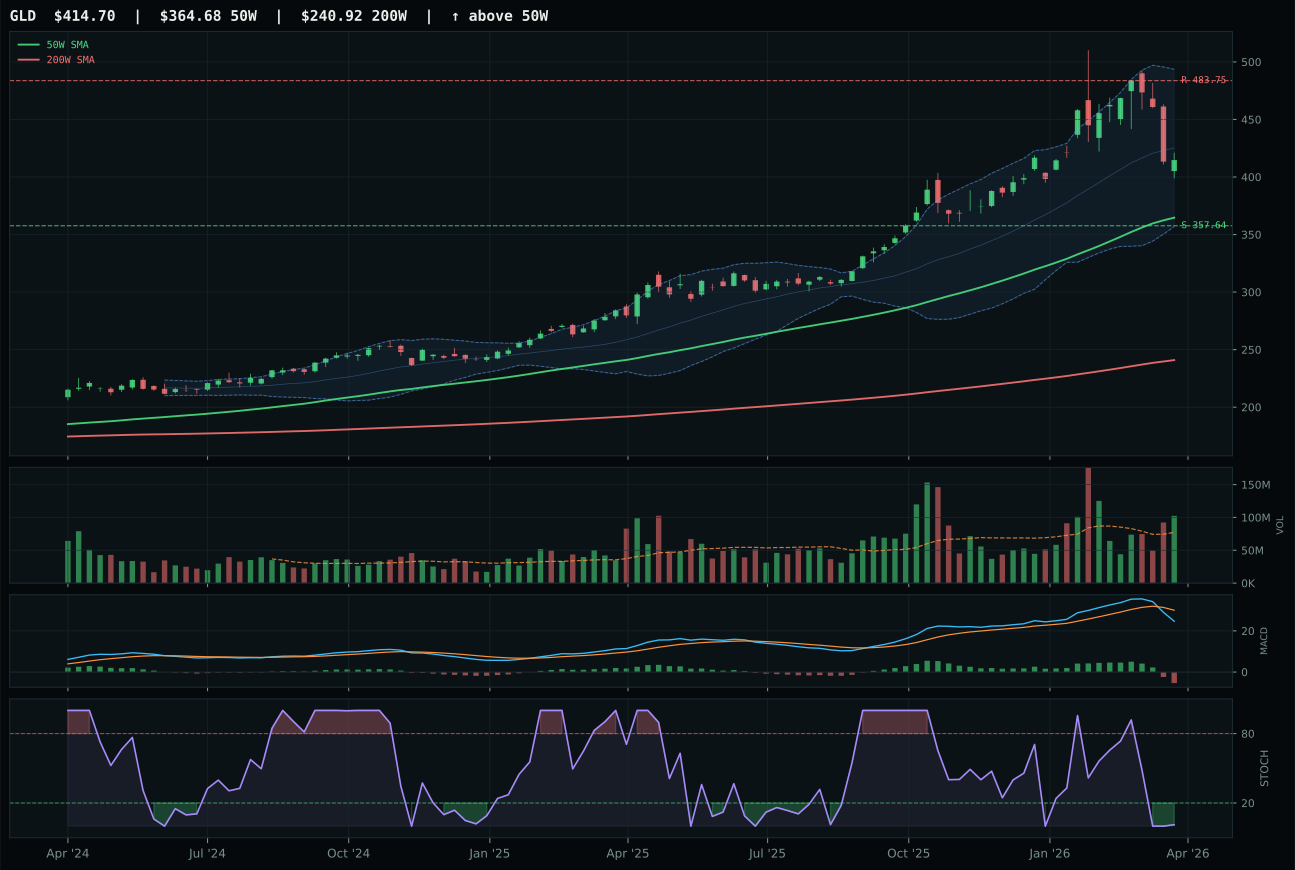
GLD has a neutral structure profile with 7.7% 13-week relative strength versus SPY.
A failed hold above support would weaken the setup.
Actionable but governed by invalidation levels.
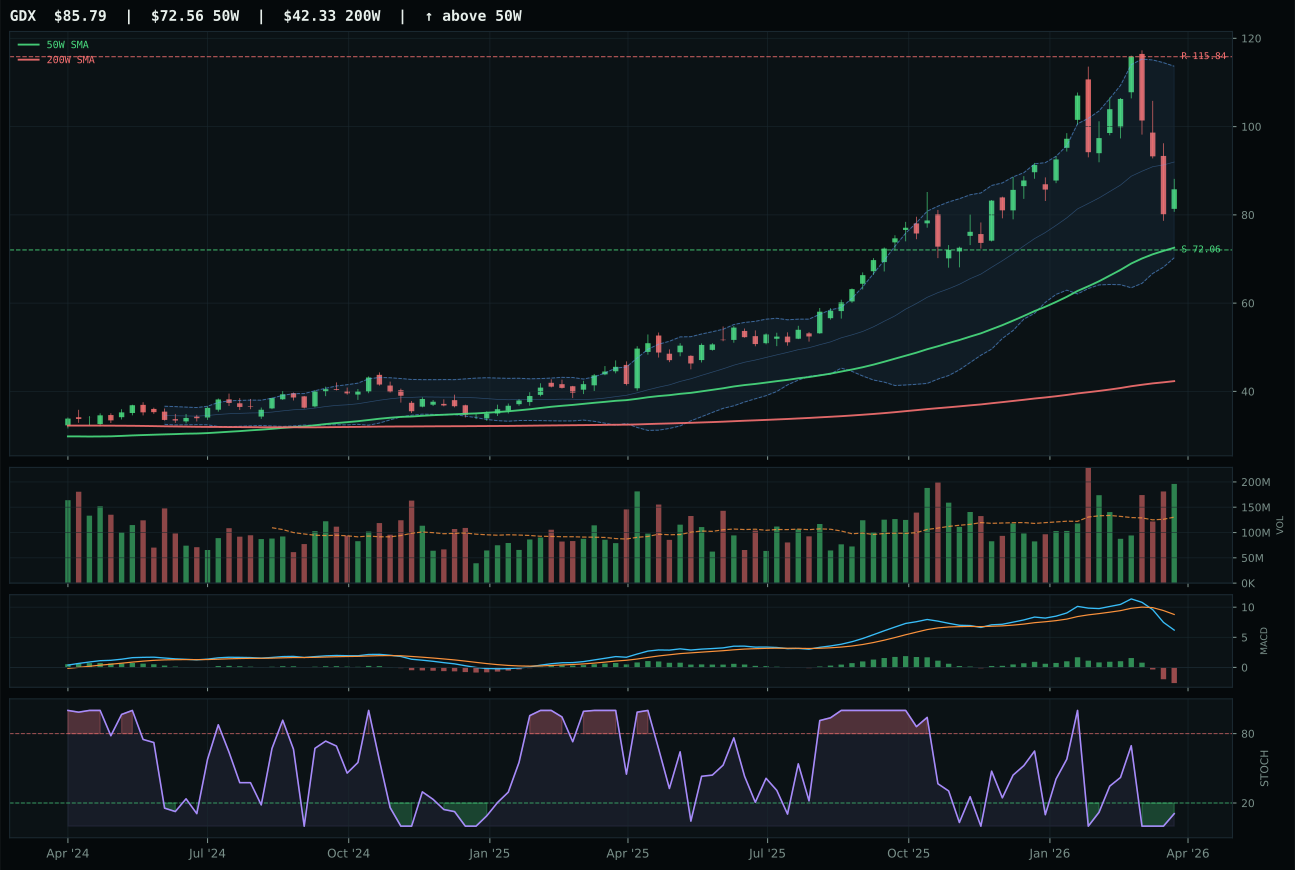
GDX has a vertical extension profile with 2.1% 13-week relative strength versus SPY.
A failed hold above support would weaken the setup.
Actionable but governed by invalidation levels.
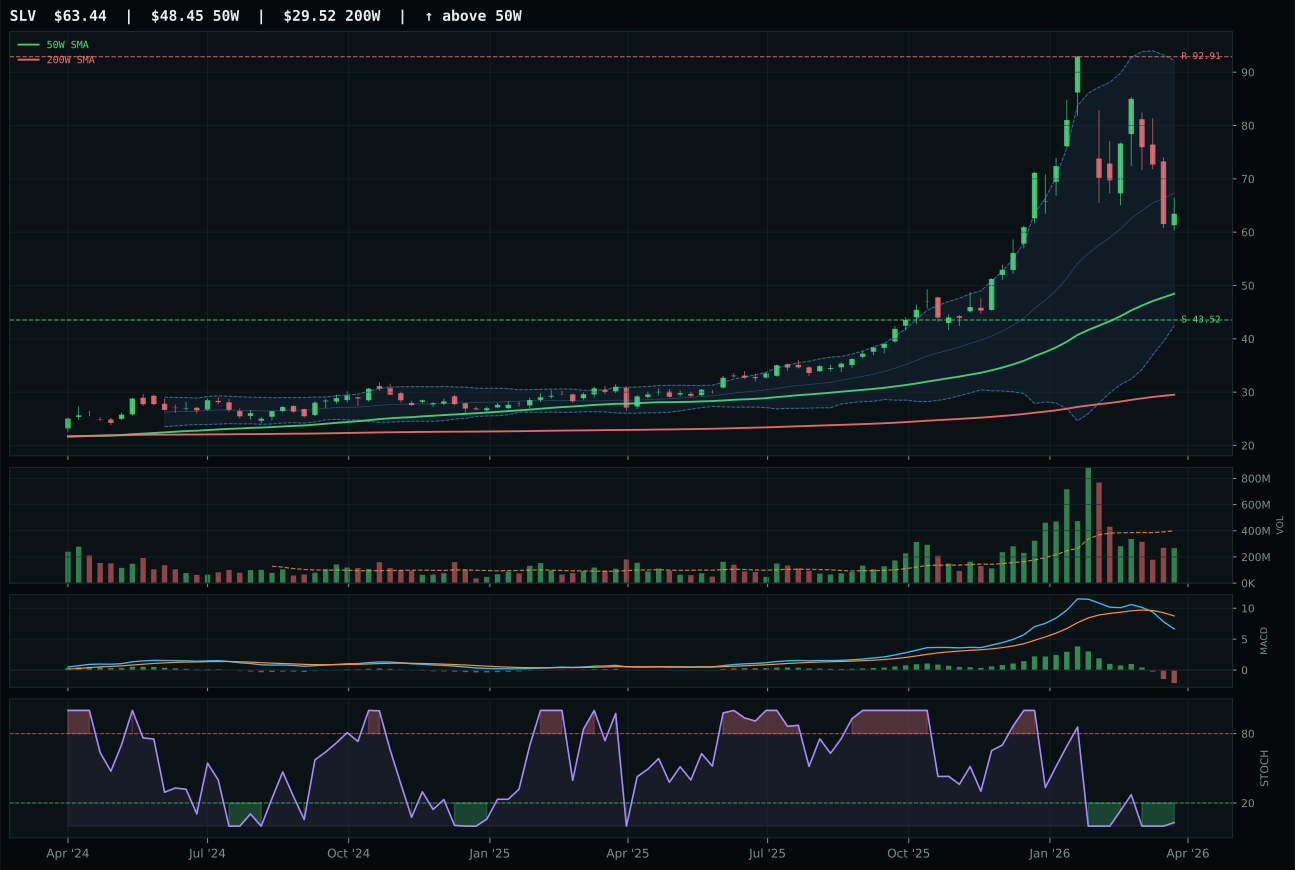
SLV has a vertical extension profile with -2.7% 13-week relative strength versus SPY.
A failed hold above support would weaken the setup.
Actionable but governed by invalidation levels.
GLD prevails because it offers the optimal trade-off between trend strength and entry risk in an environment where monetary-hedge demand is active. Price sits 13.7% above the 50-week moving average in the middle retracement / decision zone near Fib 0.382, and while this means GLD is extended relative to GDX's vertical-extension setup, the timing score of 77 reflects that buyers have not yet moved too far ahead of themselves. Volume at 1.32x confirms above-average participation, and the 7.7% relative strength to SPY validates that gold is outperforming equities without commanding the extreme conviction that would suggest a final climax move. GDX loses because its 2.1% relative strength to SPY and stochastic RSI at oversold-turn-up (0.01) read as potential capitulation from miners, not accumulation—the setup is technically sound but lacks the sponsored conviction that GLD's accumulation pattern displays. The risk/reward differential (69.1 vs 67.5) favors GLD despite GDX's mining leverage.
Precious Metals earns 10% as a defensive allocation with a category macro fit of 72%, where monetary-hedge-bid (+14), defensive-rotation (+7), and dollar-pressure (+3) descriptors provide genuine conviction. GLD's technical evidence score of 50.4 is modest but reflects the challenge of trading a mean-reverting asset in a broad-market-bear regime: trend and timing are strong (92 and 77), but momentum confirmation drops to 35.2 because 4-week returns are -14.3%, signaling that gold has not yet rolled over but is not accelerating. The category score of 48.2 ranks below most peers because GLD's macro tailwind is real but timing has gotten crowded—stochastic RSI is oversold and MACD is bearish, suggesting a correction is likely before the next leg higher. Precious metals hold the slot because defensive rotation is active and dollar pressure persists, but the allocation reflects tactical positioning rather than strategic conviction. To move Precious Metals higher, either gold would need to consolidate above the Fib 0.382 zone with MACD confirmation, or macro conditions would need to deteriorate enough to trigger panic-bid dynamics.
AI — SMH
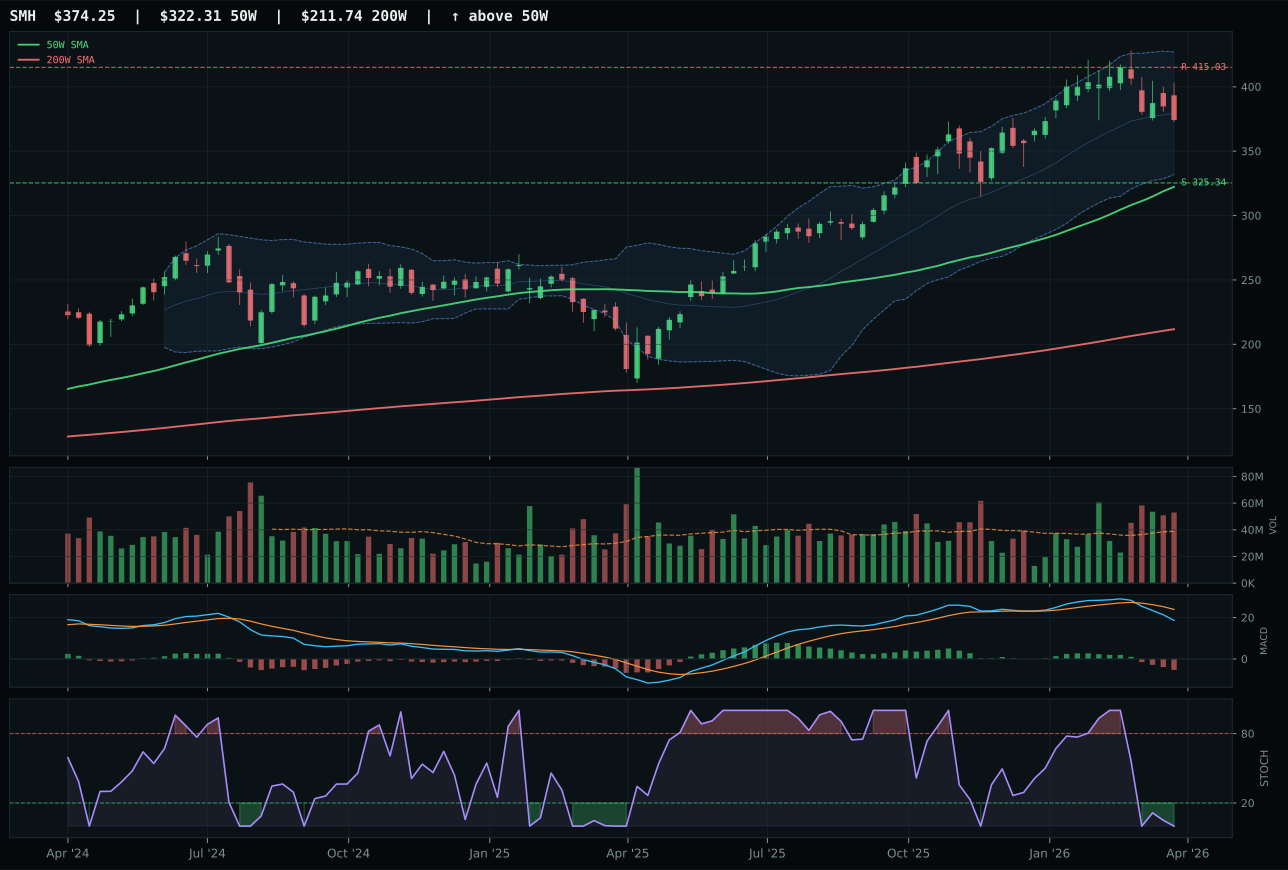
SMH has a vertical extension profile with 10.4% 13-week relative strength versus SPY.
A failed hold above support would weaken the setup.
Actionable but governed by invalidation levels.
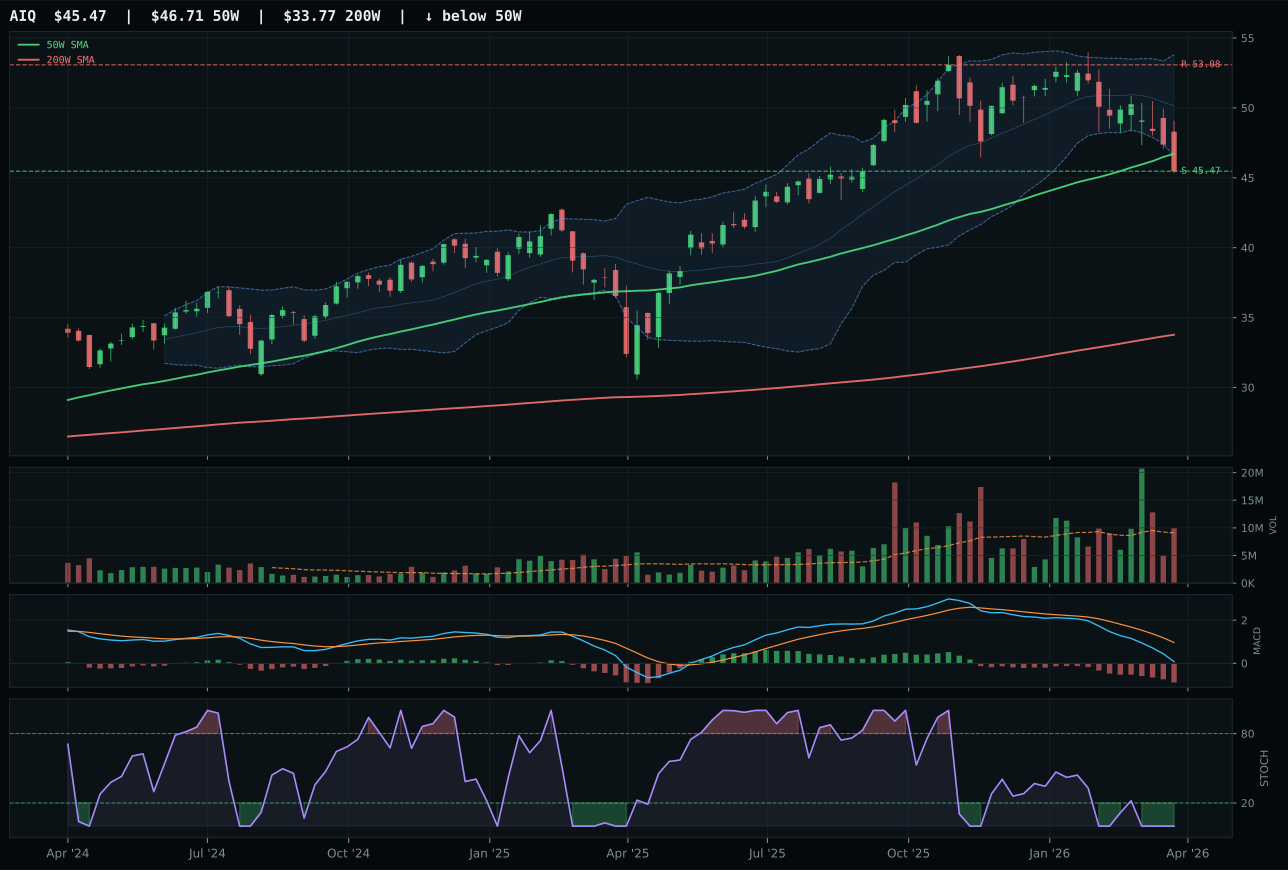
AIQ has a pullback into support profile with -3.7% 13-week relative strength versus SPY.
A failed hold above support would weaken the setup.
Actionable but governed by invalidation levels.
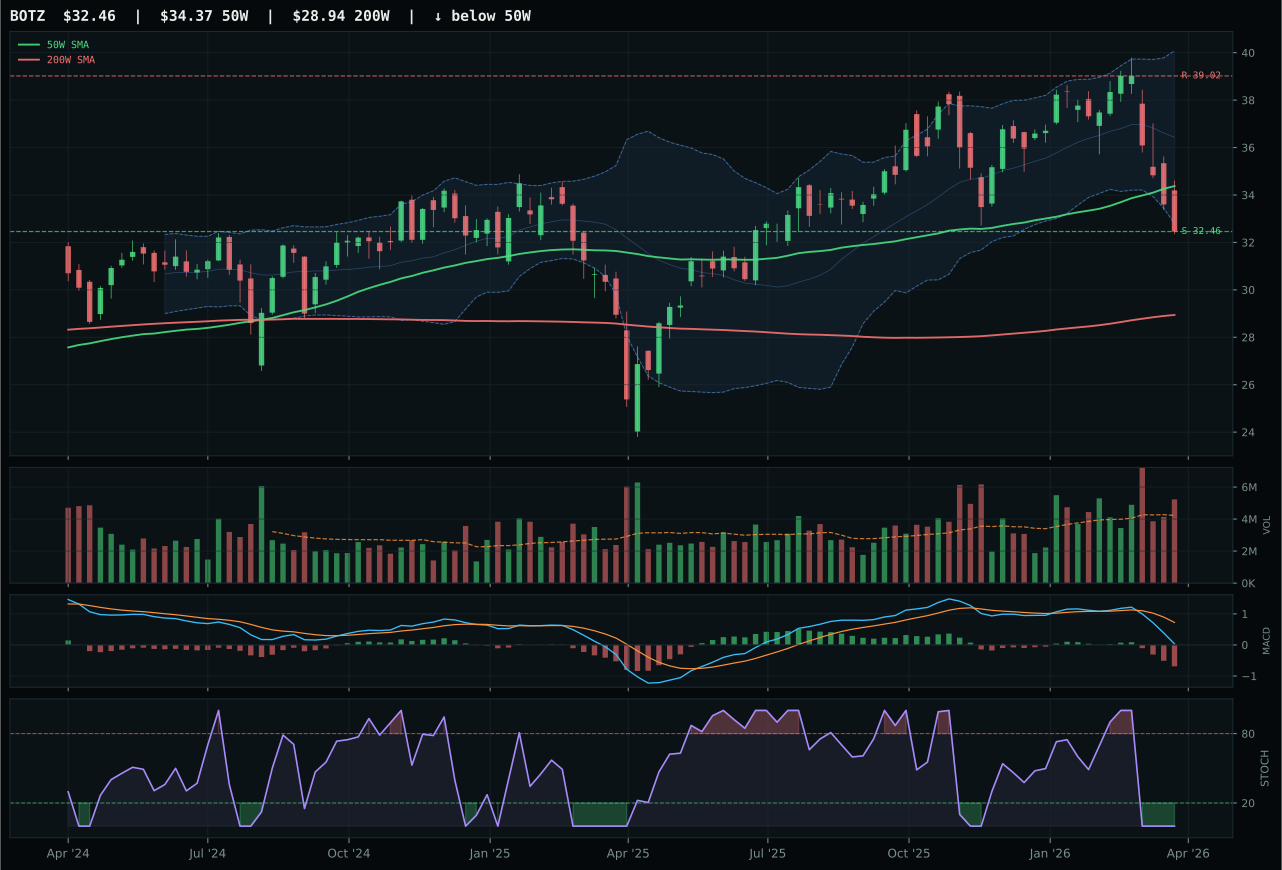
BOTZ has a pullback into support profile with -3.1% 13-week relative strength versus SPY.
A failed hold above support would weaken the setup.
Actionable but governed by invalidation levels.
SMH dominates by virtue of price momentum and category relative strength that AIQ cannot match. The semiconductor ETF sits 16.1% above its 50-week moving average with a 10.4% relative strength advantage versus SPY and 13.6% outperformance of category peers, signaling that buyers are still showing up despite the extended entry. Volume at 1.36x the 20-week average validates accumulation, and the 2.3% 13-week return alongside bullish MACD despite an oversold stochastic RSI reading suggests the uptrend has room to run before rolling over. AIQ's -3.7% relative strength to SPY and neutral volume participation reveal institutional disinterest—the setup is technically sound (pullback into support) but lacks the sponsorship that SMH commands. The 19.5-point score gap reflects the difference between a name catching real momentum and one that is structurally correct but orphaned by flows.
AI's 10% allocation is justified primarily by its strong macro fit of 62% and AI growth sponsorship scoring +14, offsetting technical weakness. SMH's trend and momentum confirmation scores (92 and 66, respectively) anchor the category above the median, but the timing score of 48 and risk/reward of 57 penalize the extended entry that now sits near 52-week resistance. The category merits the slot because liquidity expansion and AI sponsorship remain the two most active macro descriptors, and semiconductor strength is structurally aligned with that regime. However, the 43.5 category score is more technical resilience than genuine leadership: SMH is extended, AIQ is weak, and BOTZ offers no momentum confirmation. To move AI into top-2 consideration, either price would need to consolidate and MACD to clarify true conviction, or category-relative strength would need to broaden beyond SMH into the software tier.
Technology — CIBR
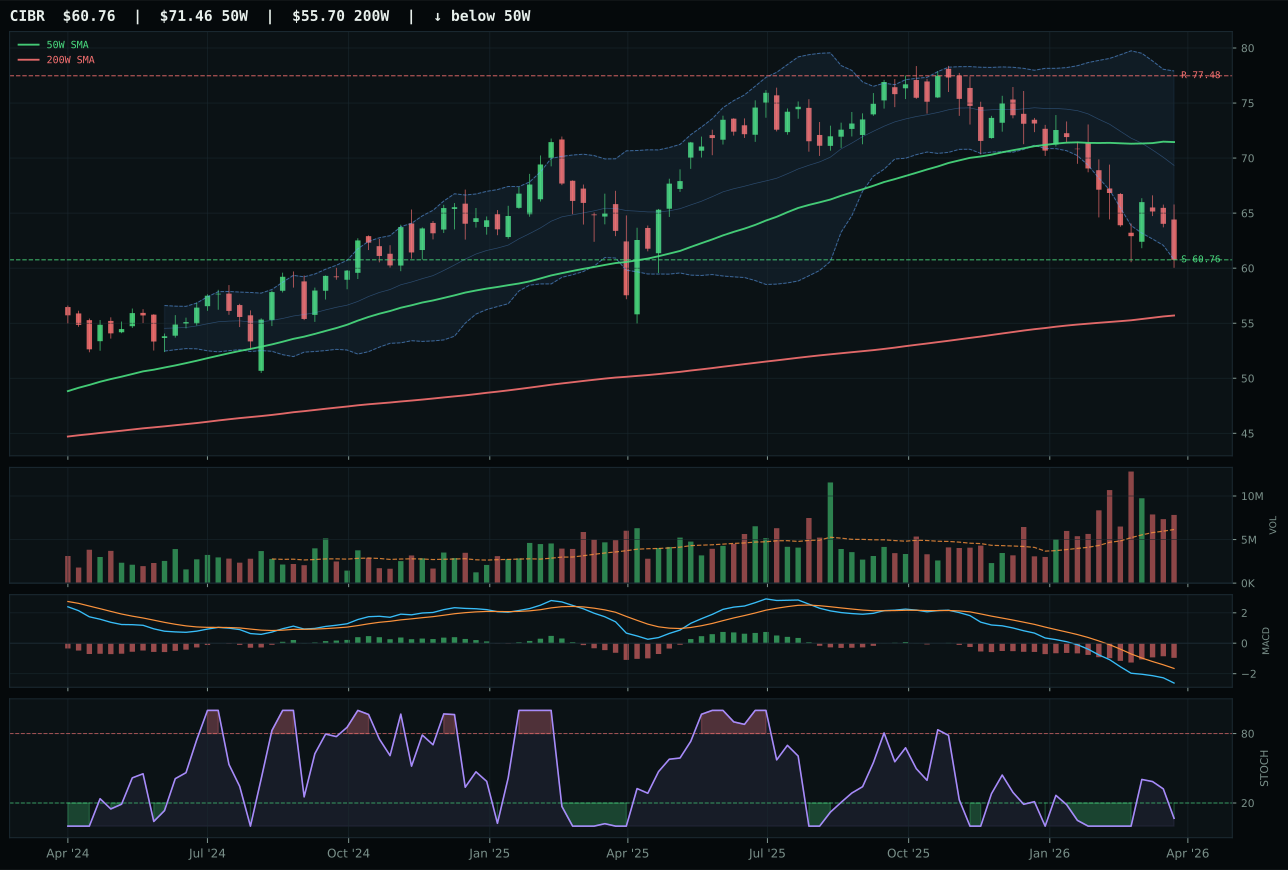
CIBR has a pullback into support profile with -8.8% 13-week relative strength versus SPY.
A failed hold above support would weaken the setup.
Actionable but governed by invalidation levels.
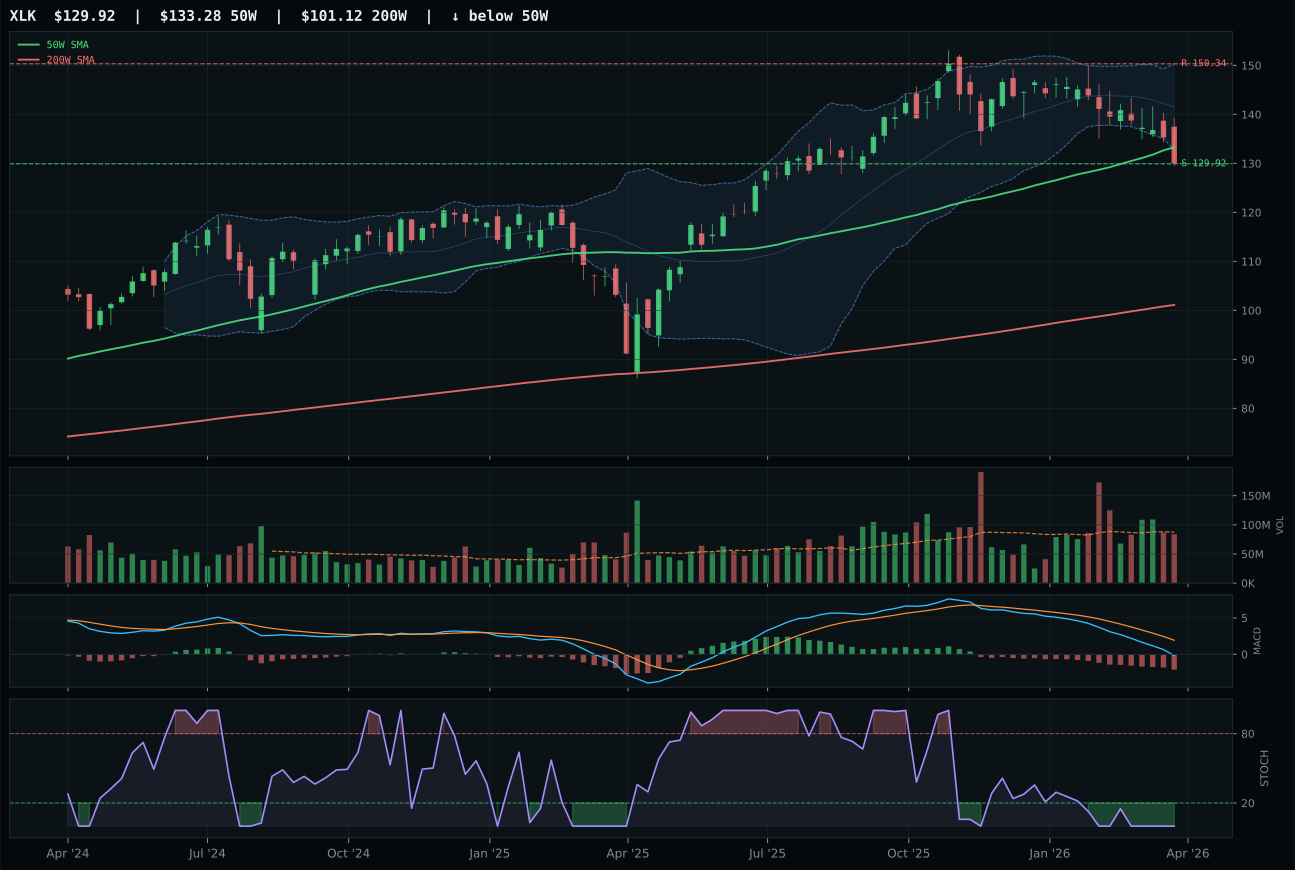
XLK has a pullback into support profile with -3.2% 13-week relative strength versus SPY.
A failed hold above support would weaken the setup.
Actionable but governed by invalidation levels.
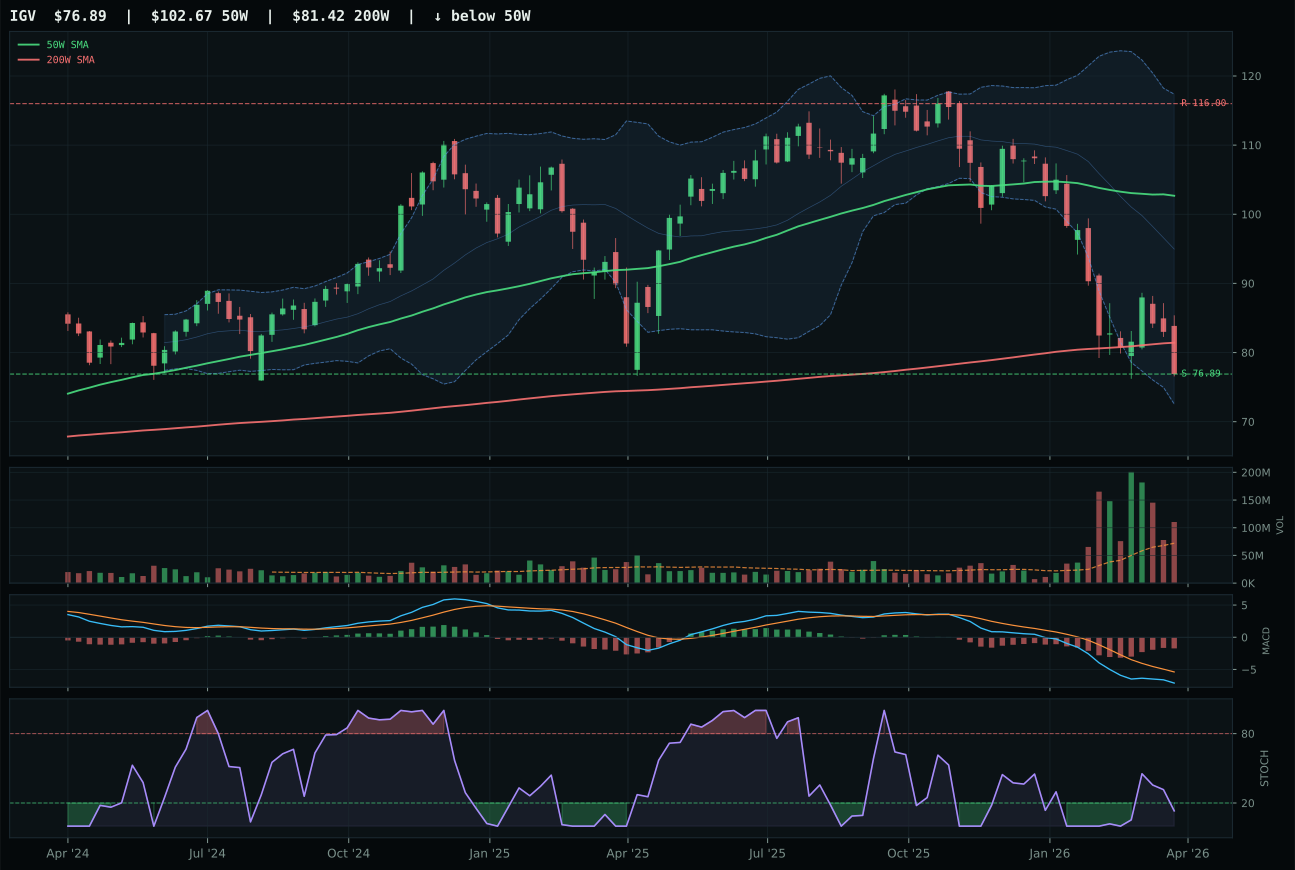
IGV has a pullback into support profile with -20.7% 13-week relative strength versus SPY.
A failed hold above support would weaken the setup.
Actionable but governed by invalidation levels.
CIBR clinches the category by offering the only clean mean-reversion setup in a field of extended names. Price sits 15% below the 50-week moving average with support at 60.76 and resistance at 77.48, creating a defined risk zone where new buyers are not chasing extended momentum. The 1.27x volume participation above the 20-week average confirms institutional accumulation into weakness, and the stochastic RSI at 0.07 signals oversold conditions without deterioration—MACD is bearish but improving, the hallmark of a coiling setup. XLK lost ground because its 98-point risk/reward advantage is negated by proximity to the 50W (only -2.5% away), neutral volume, and a weakening MACD that suggests conviction has faded. In a transition regime where defensive rotation is active, CIBR's pullback into support offers asymmetric entry versus XLK's extended attempt to hold broken momentum.
Technology ranks ninth or tenth among all categories this week and earns zero allocation. The category score of 42.4 reflects a conflict between improving technical indicators and a macro backdrop that actively penalizes growth: liquidity expansion and AI sponsorship are live, but defensive rotation and broad-market bear signals are more powerful. CIBR's oversold condition is textbook mean-reversion bait, yet without category-level macro sponsorship—no supply shortage, no inflation protection narrative—the setup carries asymmetric timing risk. The transition regime tolerates this setup as a speculative entry for patients, but capital is deployed first to energy and agriculture where macro tailwinds are embedded in the category score itself. For Technology to claim allocation, relative strength versus SPY would need to turn positive and MACD would need to cross above the signal line with volume confirmation; neither condition is met.
Emerging Markets — ILF
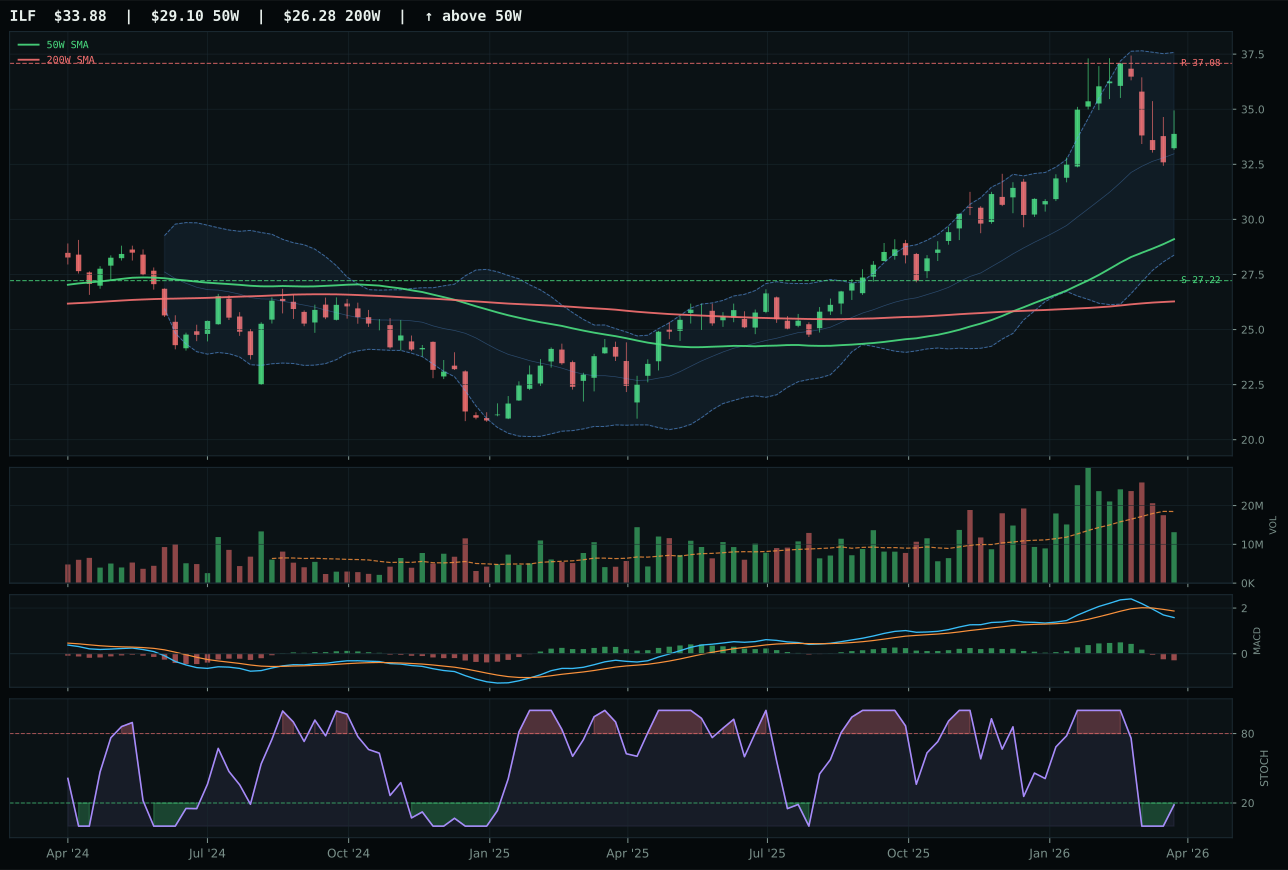
ILF has a vertical extension profile with 17.7% 13-week relative strength versus SPY.
A failed hold above support would weaken the setup.
Actionable but governed by invalidation levels.
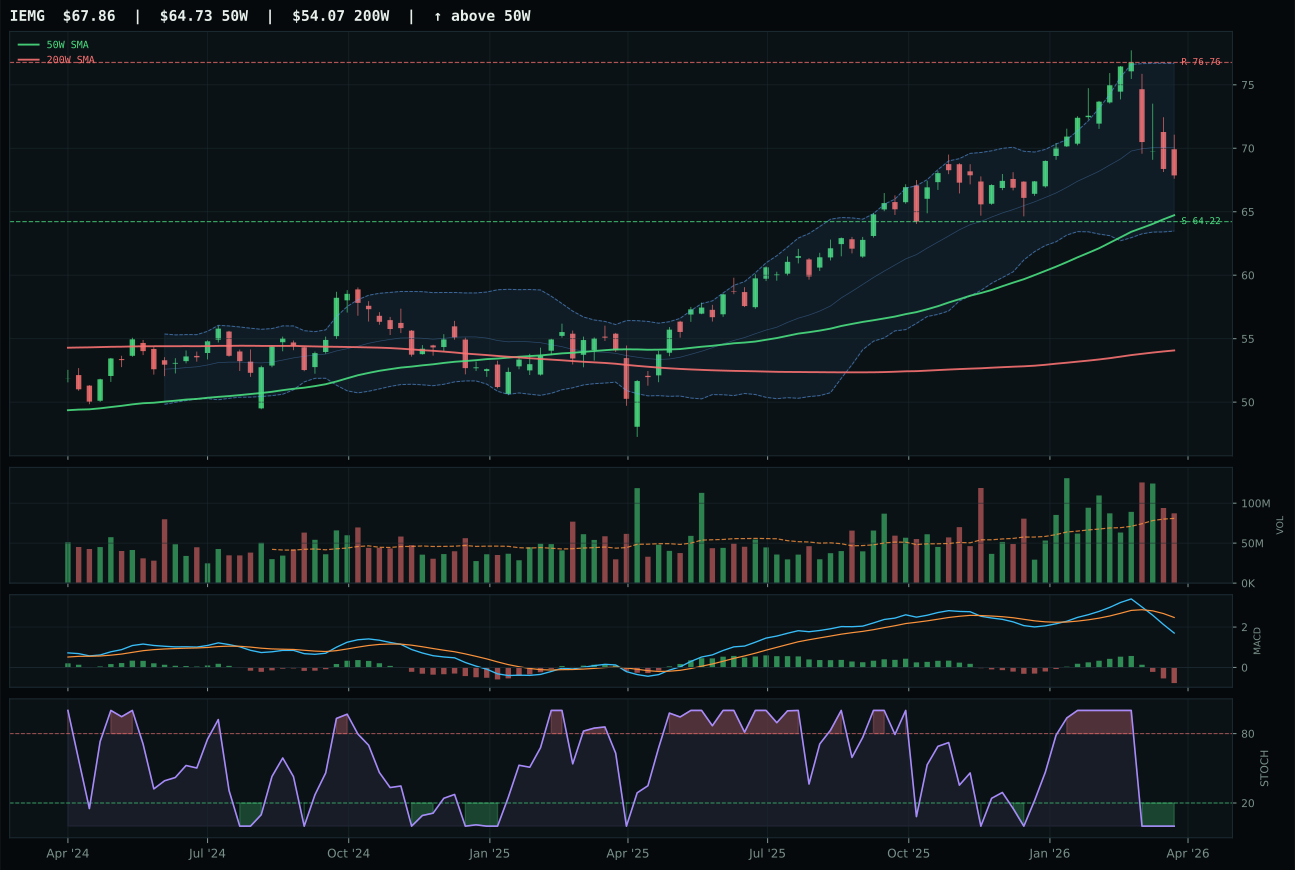
IEMG has a neutral structure profile with 8.8% 13-week relative strength versus SPY.
A failed hold above support would weaken the setup.
Actionable but governed by invalidation levels.
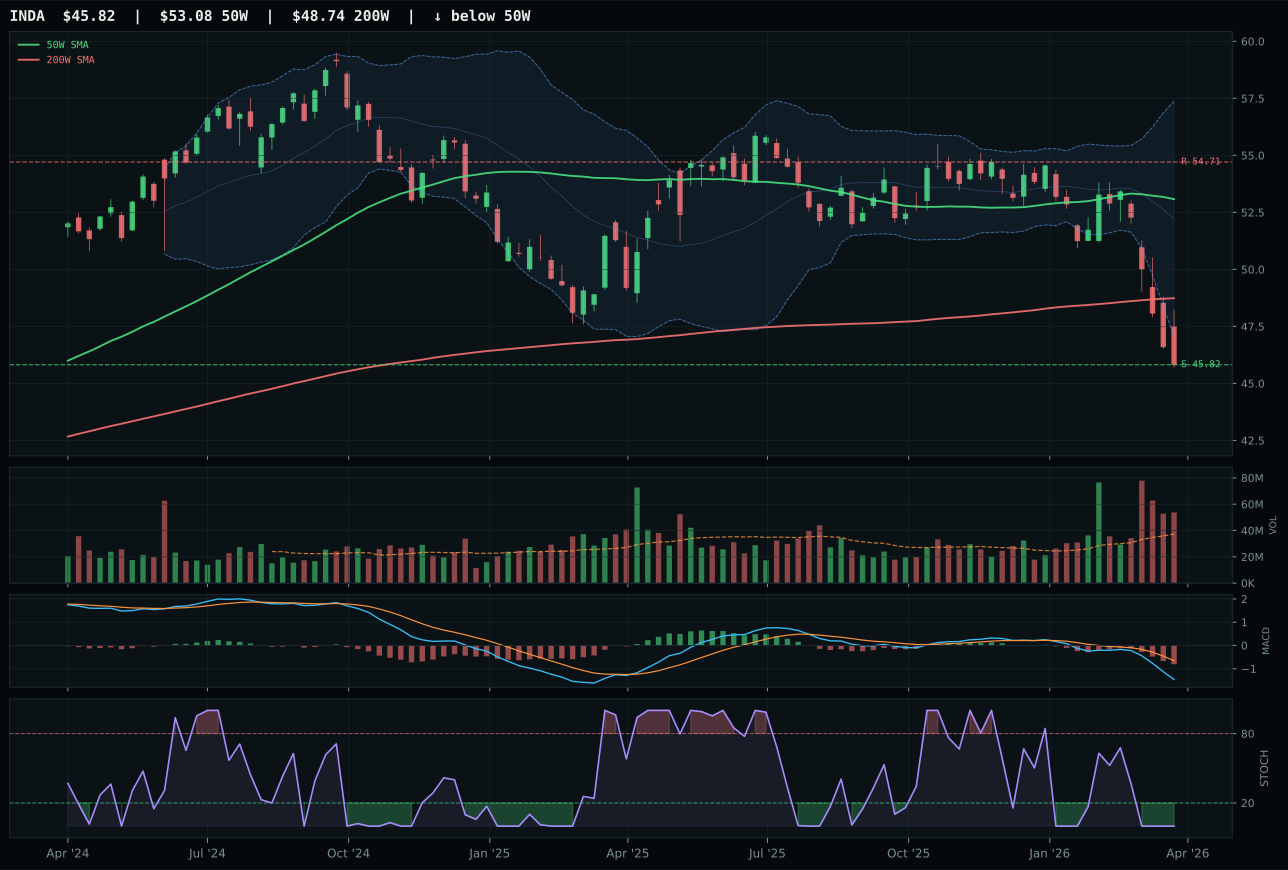
INDA has a pullback into support profile with -6.8% 13-week relative strength versus SPY.
A failed hold above support would weaken the setup.
Actionable but governed by invalidation levels.
ILF wins a weak category by offering the cleanest stochastic RSI signal and best category-relative strength despite trailing IEMG in overall composite quality. Price sits 16.4% above the 50-week moving average with a 9.5% 13-week return and stochastic RSI at oversold-turn-up (0.18), signaling potential reversal energy that IEMG's oversold-but-flat reading (0.01 with no turn-up) cannot match. Volume at 0.71x is thin, but category-relative strength at 8.8% versus IEMG's 0.0% indicates that Latin America's commodity and value beta is capturing real allocator flows despite the liquidity constraints. IEMG's composite score of 76 versus ILF's 60 creates a scoring paradox: IEMG is technically superior (trend 92, timing 85, risk/reward 82) but lacks momentum confirmation (31) and the stochastic turn-up signal that suggests institutional re-entry. ILF's strength is narrower but more actionable—the oversold-turn-up stochastic reading provides a catalyst that IEMG's flat oversold condition does not.
Emerging Markets earns zero allocation this week, ranking ninth or tenth among all categories with a final score of just 20.5. The macro backdrop is actively hostile: dollar pressure at -14 and broad-market bear at -9 overwhelm commodity breadth positive at +8 and real asset sponsorship at +6. The category-level macro fit is only 35.0 out of 100, reflecting that emerging-market exposure fights against the regime rather than with it. Even ILF's technical evidence at 49.7 is insufficient to overcome the macro headwinds, and IEMG's broader exposure shows only 0.7% 13-week return, indicating capital is flowing away from the asset class. For Emerging Markets to earn allocation, either dollar pressure would need to reverse (unlikely near-term in a transition regime) or emerging-market equities would need to show positive 13-week momentum despite macro headwinds—neither condition is present. The category is excluded entirely from the portfolio, allowing capital to concentrate in energy, agriculture, and defensive names that align with the current regime.