
2026-03-20
Informational purposes only. The content in this report, including allocations, analysis, and commentary, is provided solely for informational and educational purposes. It does not constitute financial advice, investment advice, trading advice, or any other type of advice. Past performance does not guarantee future results. Always conduct your own research and consult a qualified financial professional before making investment decisions.
Weekly Allocation
| Ticker | Category | Weight | Role |
|---|---|---|---|
| XOP | Traditional Energy | 20% | Top-2 (20%) |
| XLU | Utilities & Infrastructure | 20% | Top-2 (20%) |
| WEAT | Agriculture & Livestock | 10% | Tier-2 (10%) |
| AIQ | AI | 10% | Tier-2 (10%) |
| REMX | Industrial Metals | 10% | Tier-2 (10%) |
| NLR | Nuclear Energy | 10% | Tier-2 (10%) |
| ILF | Emerging Markets | 10% | Tier-2 (10%) |
| IGV | Technology | 10% | Tier-2 (10%) |
Trade Instructions — Monday Open
Sell the tranche from 2026-02-20 (completing its 4-week hold). Buy the new tranche. Instructions show net portfolio changes — same-asset positions cancel, weight changes show the delta.
| Action | Ticker | Instruction |
|---|---|---|
| SELL | XLE | Sell 33% of XLE position (reduce 15.00% → 10.00%) |
| SELL | MOO | Sell entire MOO position (5.00% of portfolio) |
| SELL | IEMG | Sell 50% of IEMG position (reduce 5.00% → 2.50%) |
| SELL | COPX | Sell 50% of COPX position (reduce 5.00% → 2.50%) |
| SELL | BOTZ | Sell 50% of BOTZ position (reduce 5.00% → 2.50%) |
| SELL | GLD | Sell 25% of GLD position (reduce 10.00% → 7.50%) |
| BUY | XLU | Buy XLU — 12.50% of freed cash (adds 2.50% to portfolio) |
| BUY | REMX | Buy REMX — 12.50% of freed cash (adds 2.50% to portfolio) |
| BUY | WEAT | Buy WEAT — 12.50% of freed cash (adds 2.50% to portfolio) |
| BUY | IGV | Buy IGV — 12.50% of freed cash (adds 2.50% to portfolio) |
| BUY | XOP | Buy XOP — 25.00% of freed cash (adds 5.00% to portfolio) |
| BUY | AIQ | Buy AIQ — 12.50% of freed cash (adds 2.50% to portfolio) |
| BUY | ILF | Buy ILF — 12.50% of freed cash (adds 2.50% to portfolio) |
Current Portfolio After Trade
Combined holdings across all 4 active tranches. Each tranche is 25% of the portfolio.
| Ticker | % of Portfolio | Weight Bar |
|---|---|---|
| XLU | 15.00% | |
| XLE | 10.00% | |
| NLR | 10.00% | |
| REMX | 10.00% | |
| XOP | 10.00% | |
| GLD | 7.50% | |
| ITA | 7.50% | |
| WEAT | 7.50% | |
| IGV | 5.00% | |
| AIQ | 5.00% | |
| IEMG | 2.50% | |
| COPX | 2.50% | |
| BOTZ | 2.50% | |
| SLV | 2.50% | |
| ILF | 2.50% |
Macro Regime — Transition / Mixed
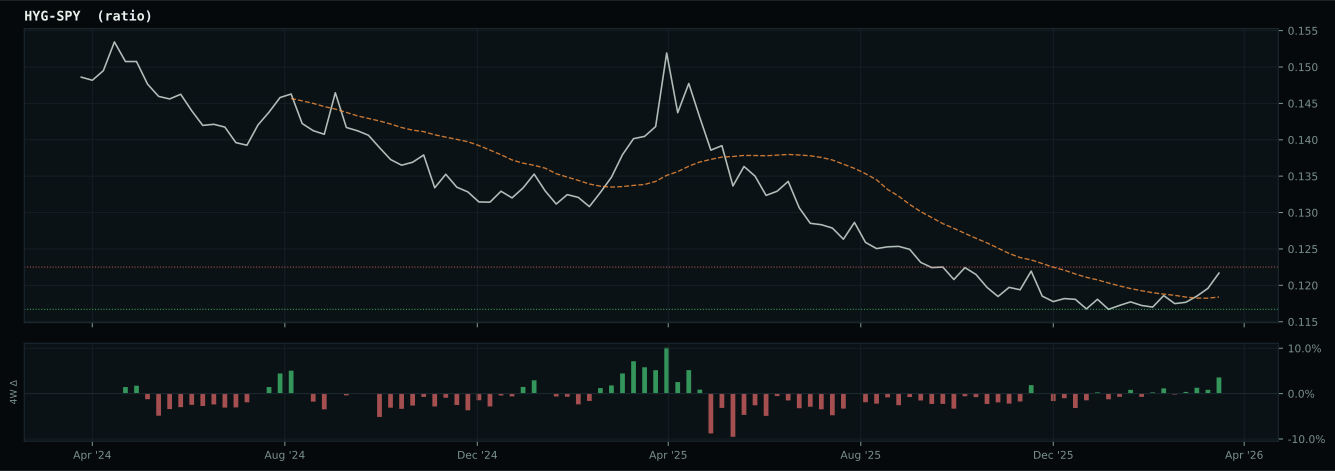
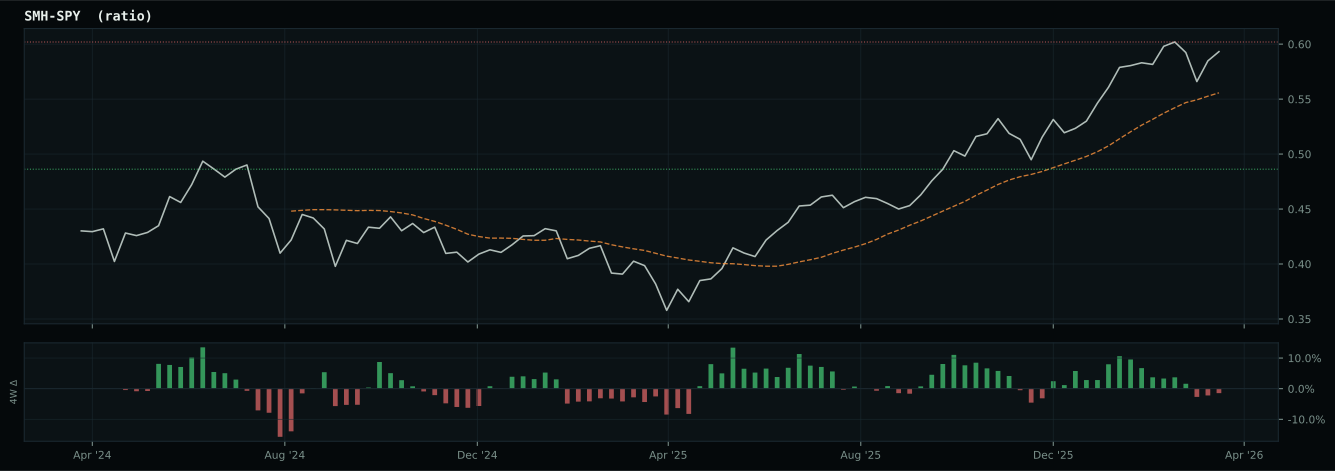
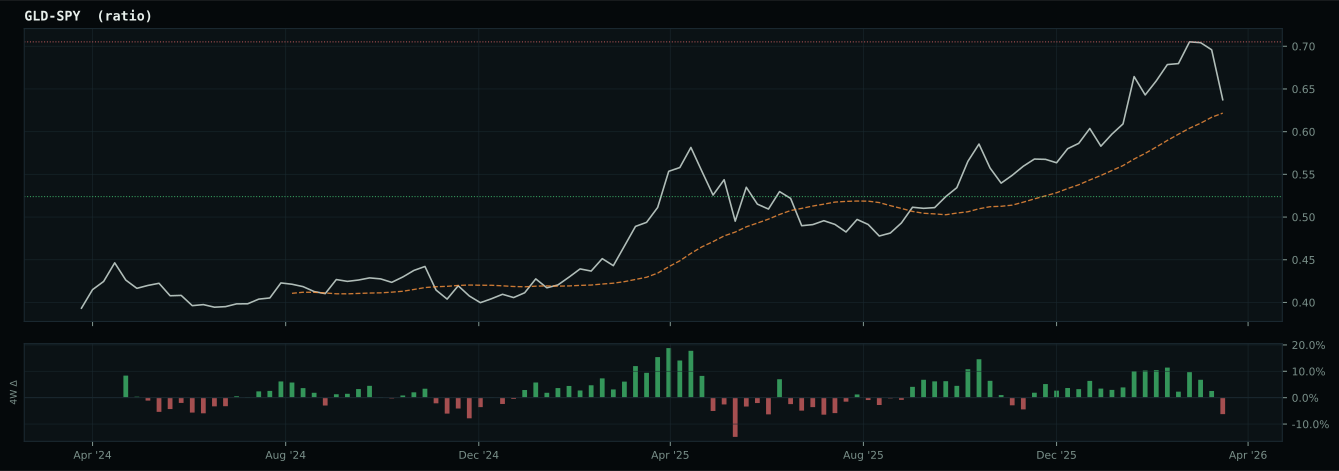
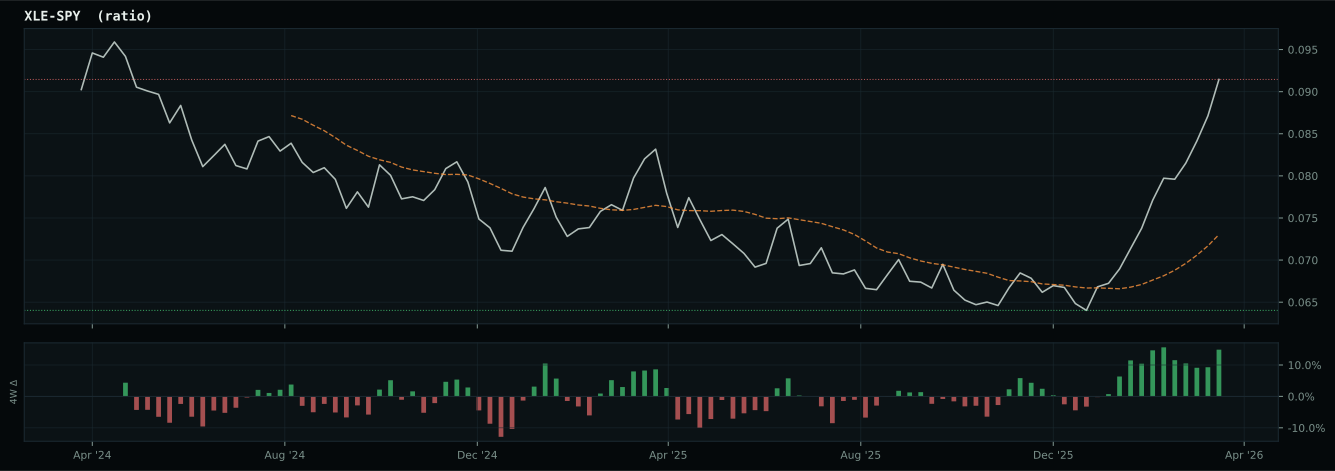
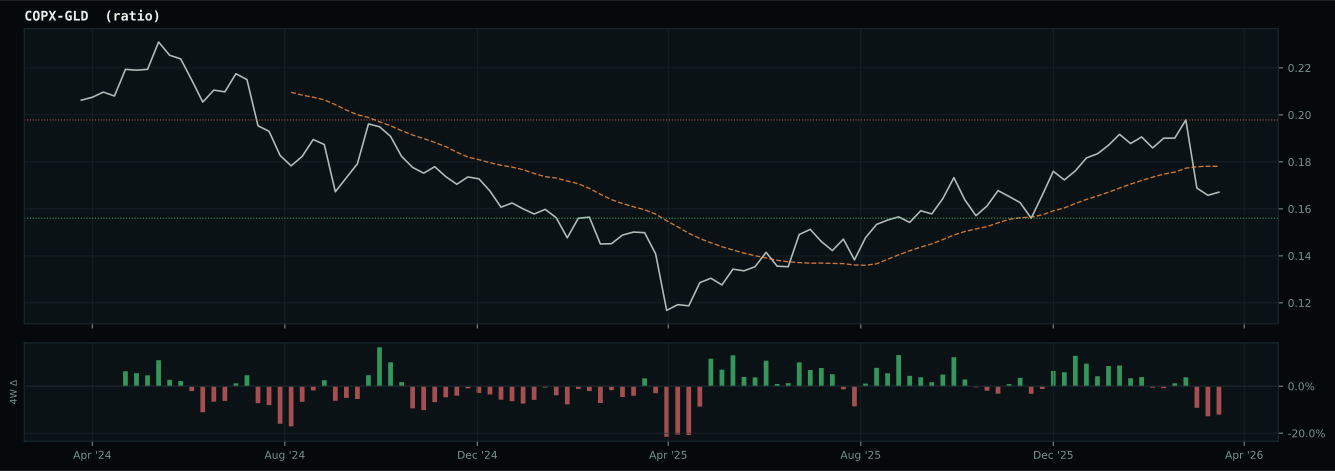
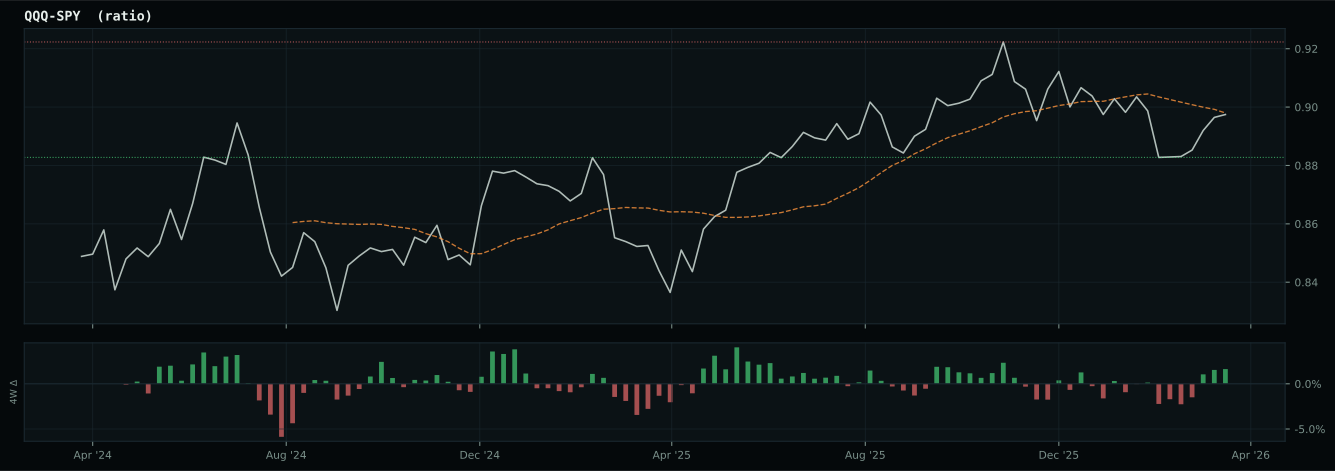
Macro Evidence Charts
Market-implied signals behind the macro regime scores. Each ratio compares two assets; the direction and slope of the ratio is what the macro engine reads.
Crypto Regime — NoCrypto
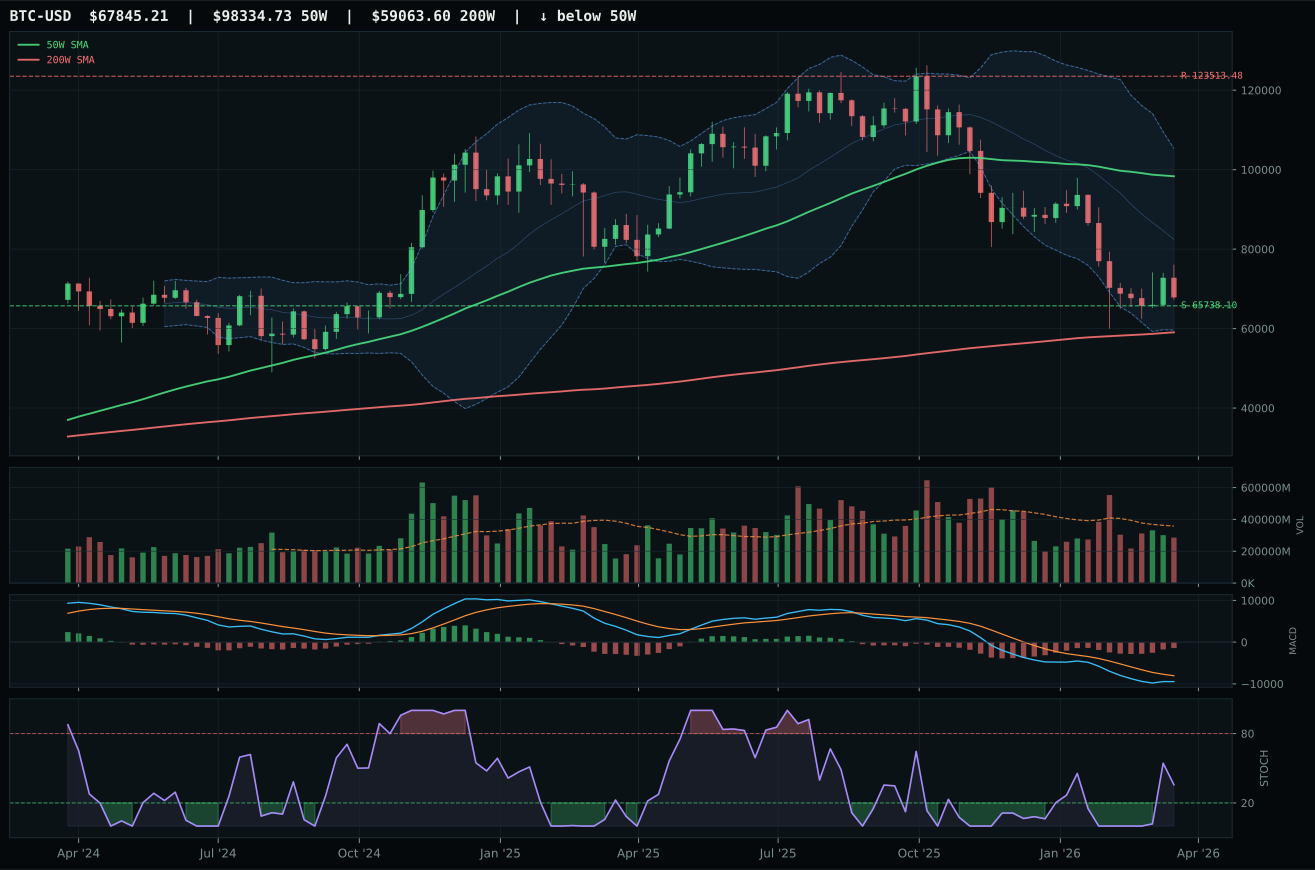
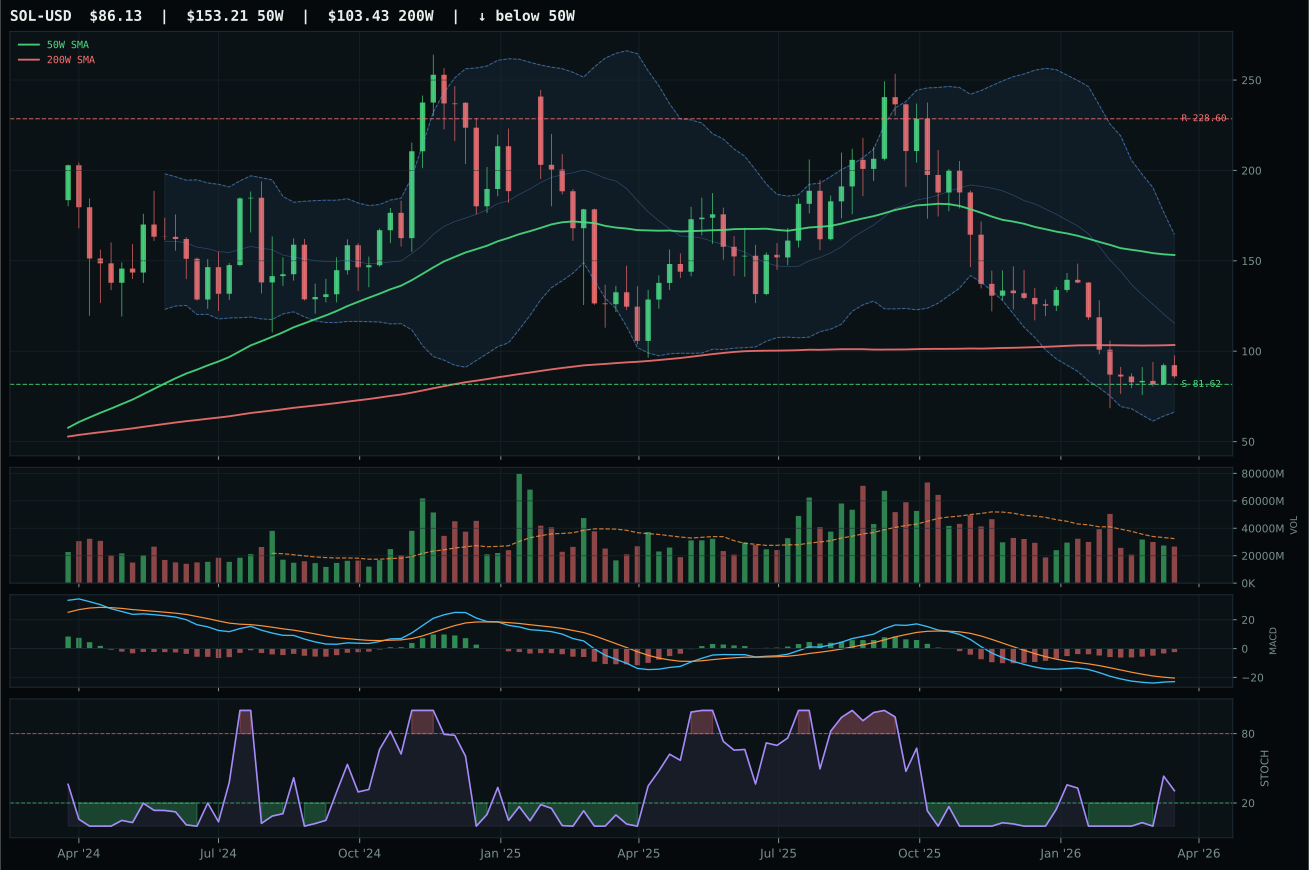
ValueBTC armed by first 200W buy-zone touch, but post-touch range age is 6 weeks; minimum is 12
TrendBTC not confirmed
one or more available conditions failed
Category Rankings
| Rank | Category | Winner | Score | Alloc | 4W Ret | Peers (4W) |
|---|---|---|---|---|---|---|
| 1 | Traditional Energy | XOP | 92.4 | 20% | -6.63% | FCG -5.6% · XLE -4.8% |
| 2 | Utilities & Infrastructure | XLU | 63.4 | 20% | +2.65% | IGF +2.8% · PAVE +9.8% |
| 3 | Agriculture & Livestock | WEAT | 58.0 | 10% | +0.09% | VEGI +3.2% · MOO +3.4% |
| 4 | AI | AIQ | 55.1 | 10% | +11.88% | SMH +18.1% · BOTZ +9.4% |
| 5 | Industrial Metals | REMX | 54.3 | 10% | +25.21% | PICK +19.1% · COPX +19.9% |
| 6 | Nuclear Energy | NLR | 52.0 | 10% | +11.51% | URNM +15.3% · URA +16.4% |
| 7 | Emerging Markets | ILF | 50.5 | 10% | +13.78% | IEMG +10.8% · INDA +6.0% |
| 8 | Technology | IGV | 49.8 | 10% | +1.41% | CIBR +2.8% · XLK +12.2% |
| 9 | Defense & Aerospace | XAR | 49.5 | 0% | +4.46% | ROKT +12.8% · ITA +2.4% |
| 10 | Precious Metals | GLD | 42.8 | 0% | +9.38% | SLV +18.5% · GDX +22.2% |
Traditional Energy — XOP
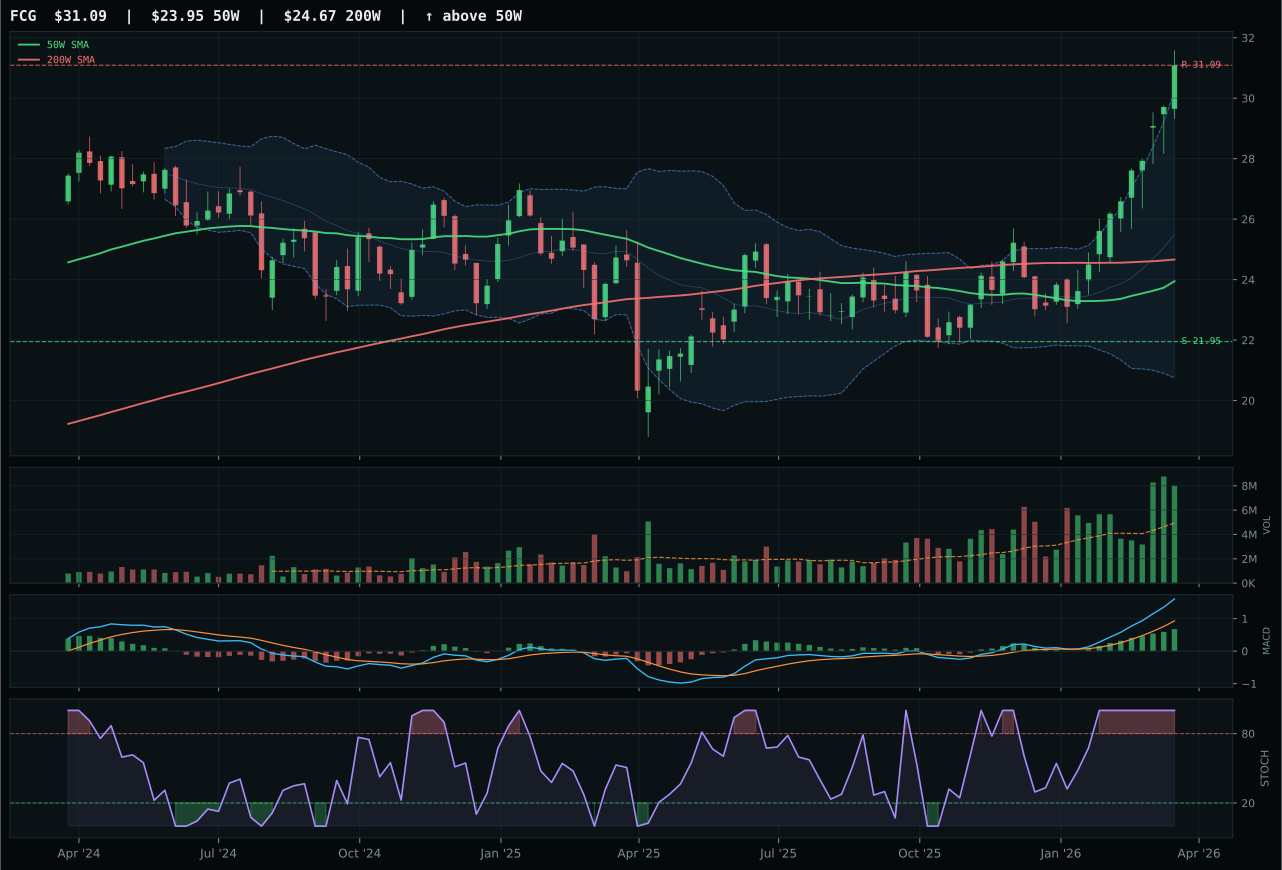
FCG has a vertical extension profile with 39.8% 13-week relative strength versus SPY.
A failed hold above support would weaken the setup.
Actionable but governed by invalidation levels.
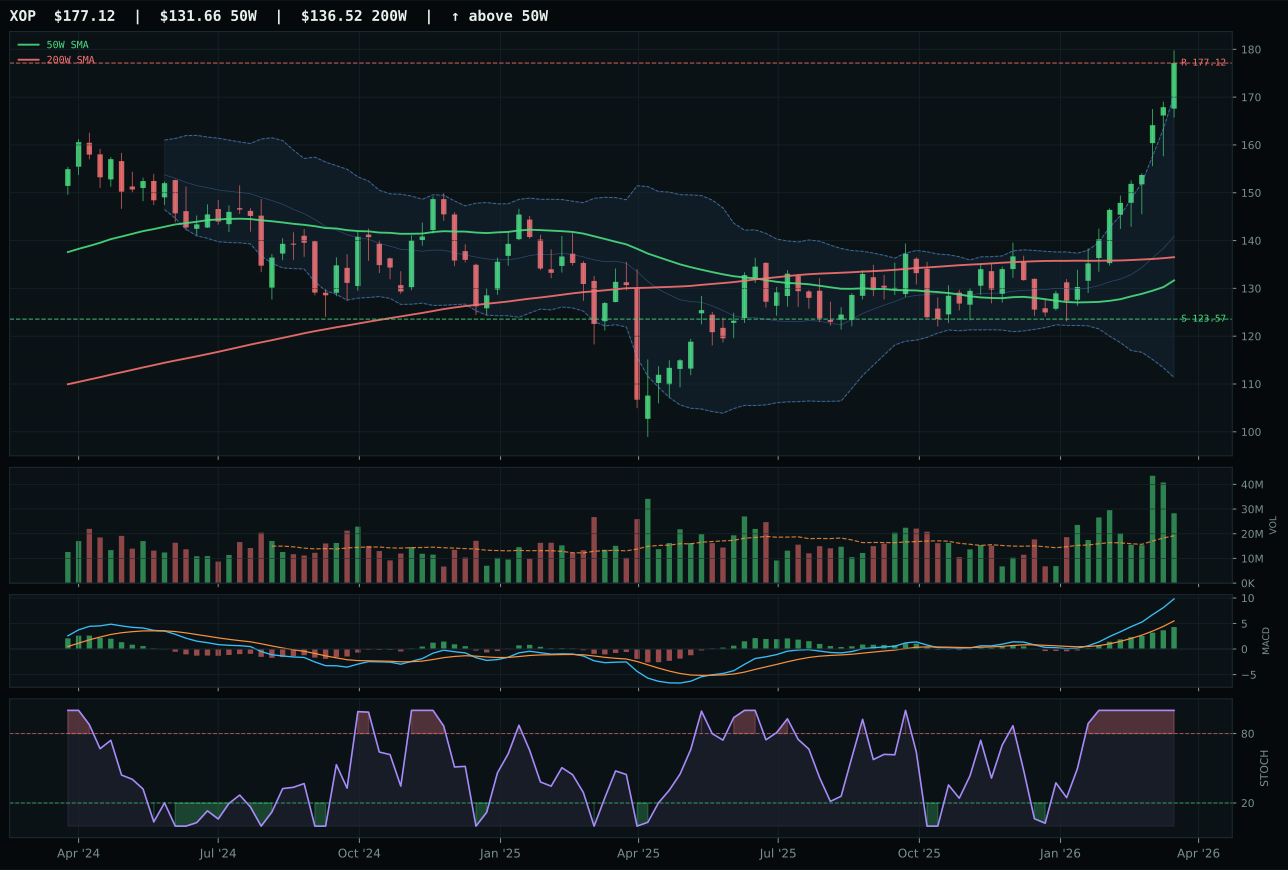
XOP has a vertical extension profile with 45.8% 13-week relative strength versus SPY.
A failed hold above support would weaken the setup.
Actionable but governed by invalidation levels.
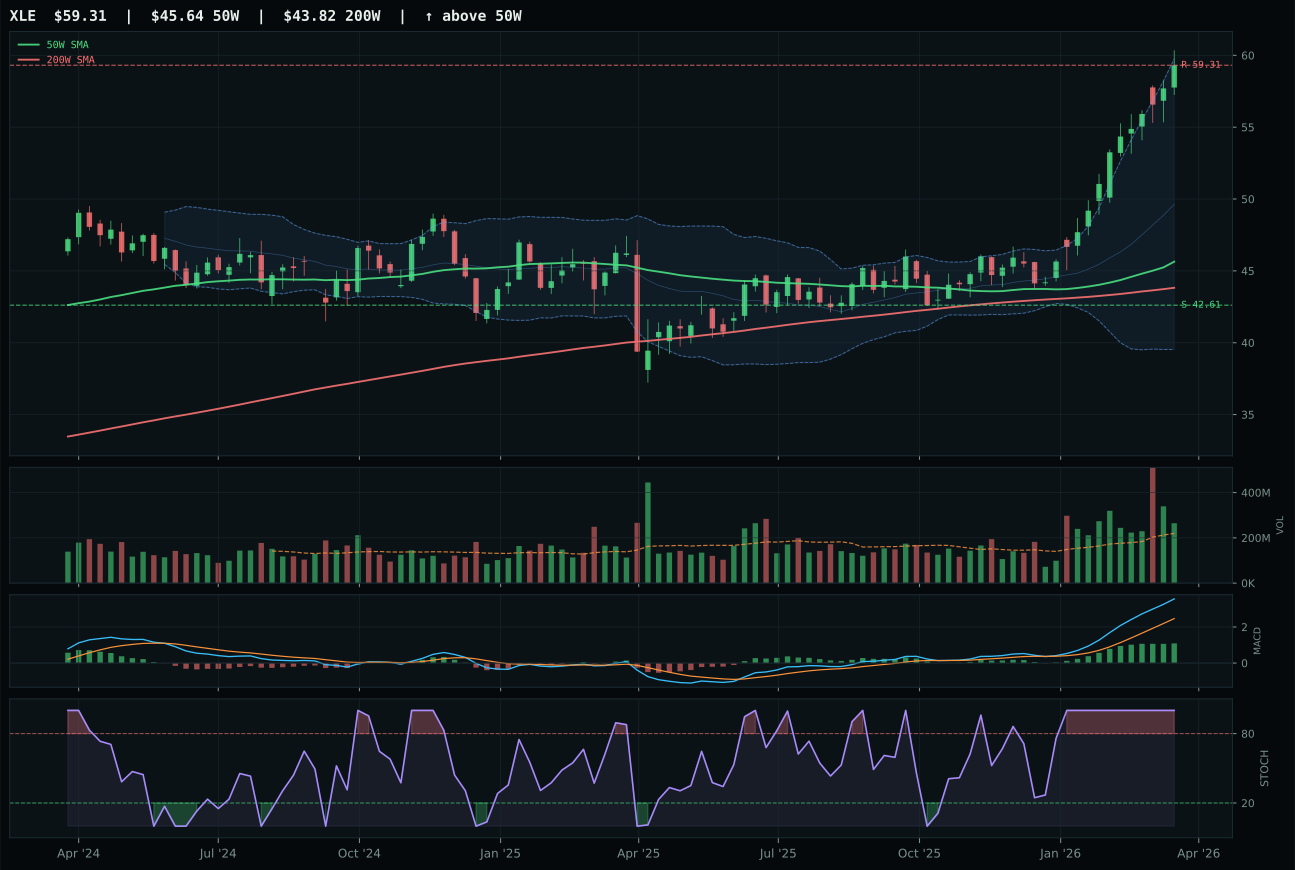
XLE has a vertical extension profile with 39.1% 13-week relative strength versus SPY.
A failed hold above support would weaken the setup.
Actionable but governed by invalidation levels.
XOP wins the top-2 allocation slot because it delivers the rare combination of 100.0 trend confirmation, 100.0 momentum confirmation, and 41.1% 13-week returns with overbought stochastic RSI at 1.00 and bullish-improving MACD. The 45.8% RS versus SPY is the strongest in the portfolio, signaling that energy buyers are absorbing new supply across the category rather than rotating into a narrow leadership. The 34.5% extension above the 50W is substantial, but the score gap versus runner-up FCG is only 1.5 points—a statistical tie that favors the representative with category-relative strength at 6.0%, edging FCG's 0.0%. The vertical extension structure is penalized in timing (37.0), but the persistence score of 98.7 and volume-price confirmation at 81.4 indicate sustained accumulation rather than momentum trap. XOP carries the sector's full macro conviction without sacrificing breadth.
Traditional Energy ranks first among all categories at a score of 92.4, warranting the 20% top-2 allocation. The category-level macro fit is exceptionally strong at 92.0 out of 100, with energy scarcity (plus-16), inflation pressure (plus-10), supply shortage (plus-9), and real asset sponsorship (plus-7) providing multiple reinforcing tailwinds. The technical evidence from XOP is dominant at 88.2 out of 100, so this allocation rests on both macro structure and chart confirmation. Oil and gas face no near-term competition for capital in this regime—the Energy scarcity descriptor is the highest-magnitude active factor across all ten categories. The 20% slot assumes energy strength persists through quarter-end; deterioration in either oil prices or the energy scarcity descriptor would trigger reassessment, but current evidence supports holding full weight. This is the highest-conviction allocation in the portfolio.
Utilities & Infrastructure — XLU
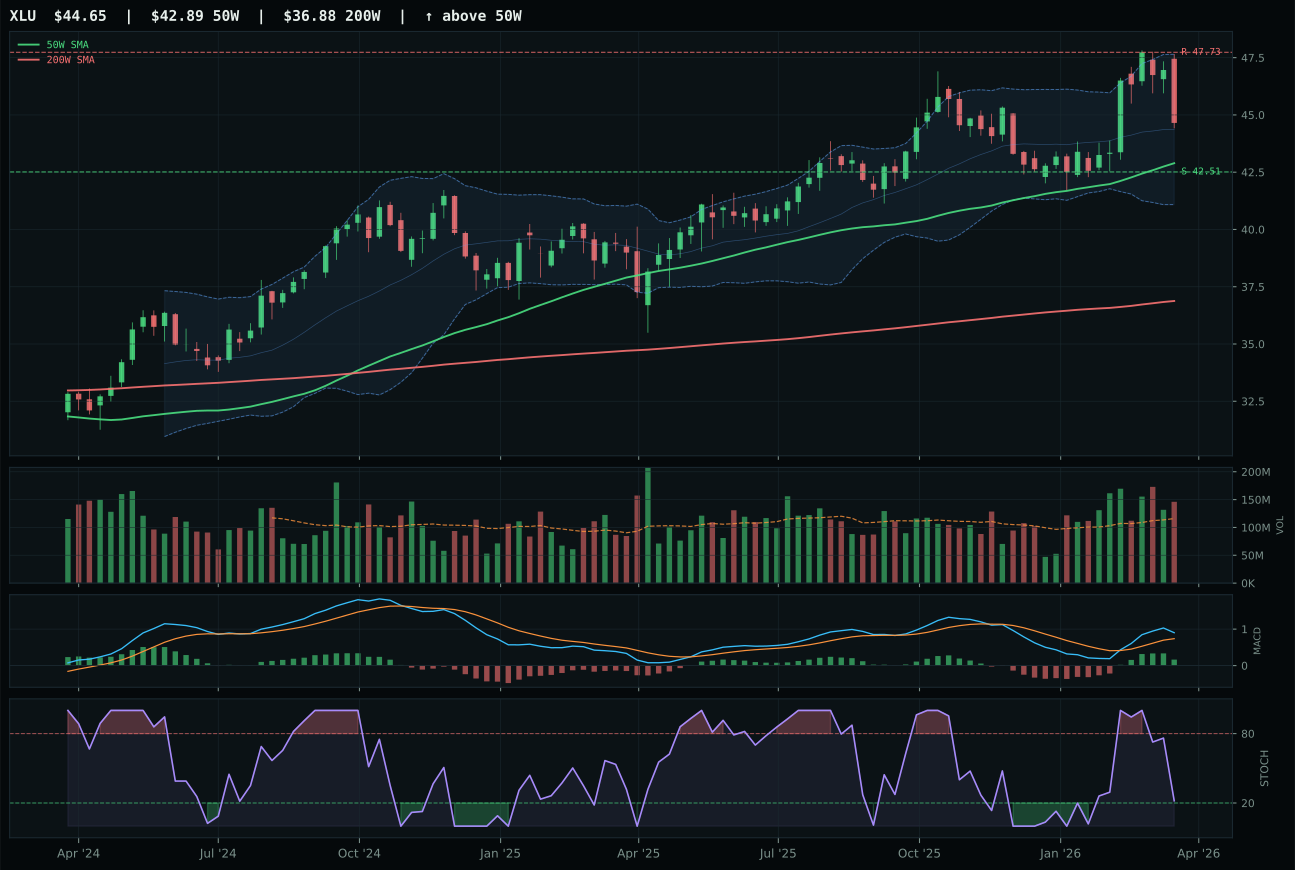
XLU has a neutral structure profile with 9.4% 13-week relative strength versus SPY.
A failed hold above support would weaken the setup.
Actionable but governed by invalidation levels.
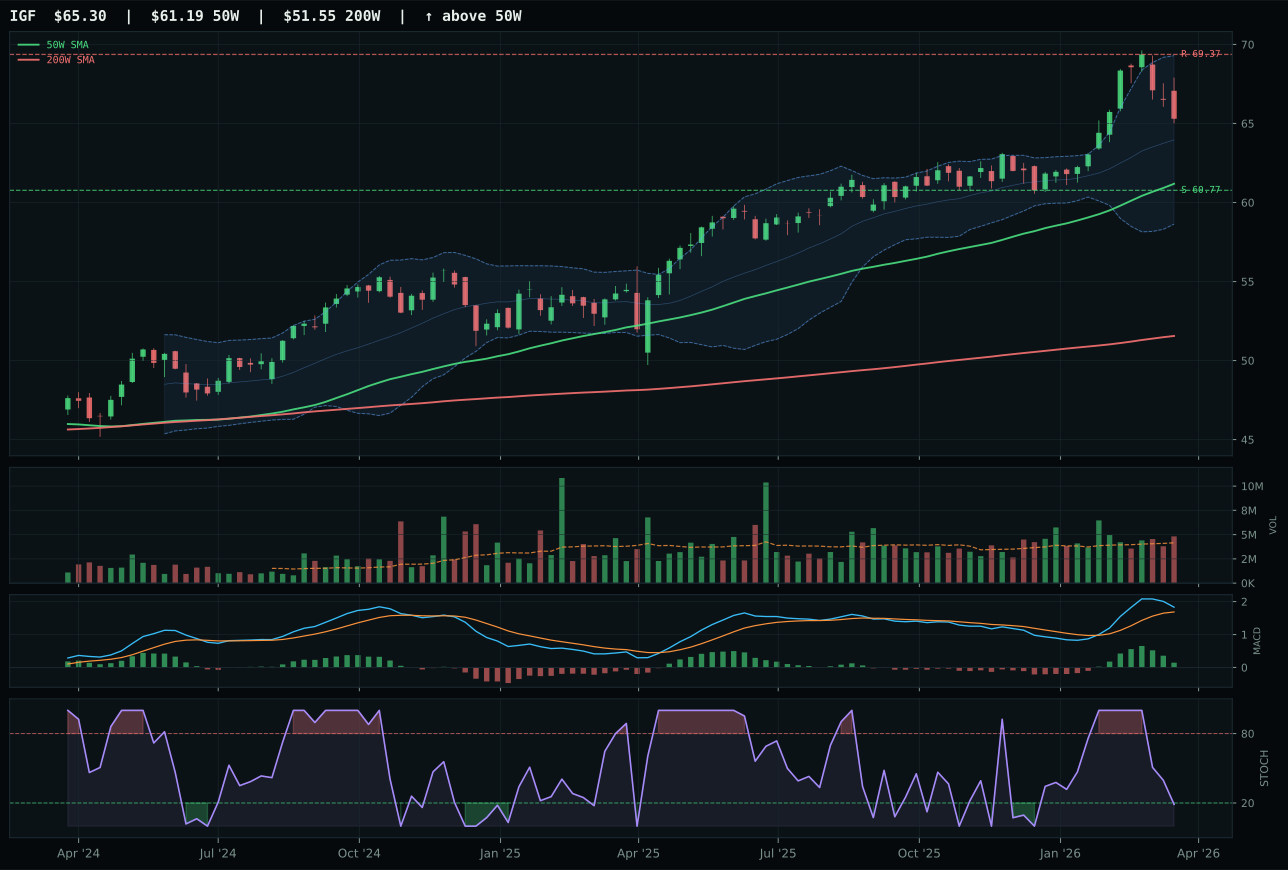
IGF has a neutral structure profile with 12.2% 13-week relative strength versus SPY.
A failed hold above support would weaken the setup.
Actionable but governed by invalidation levels.
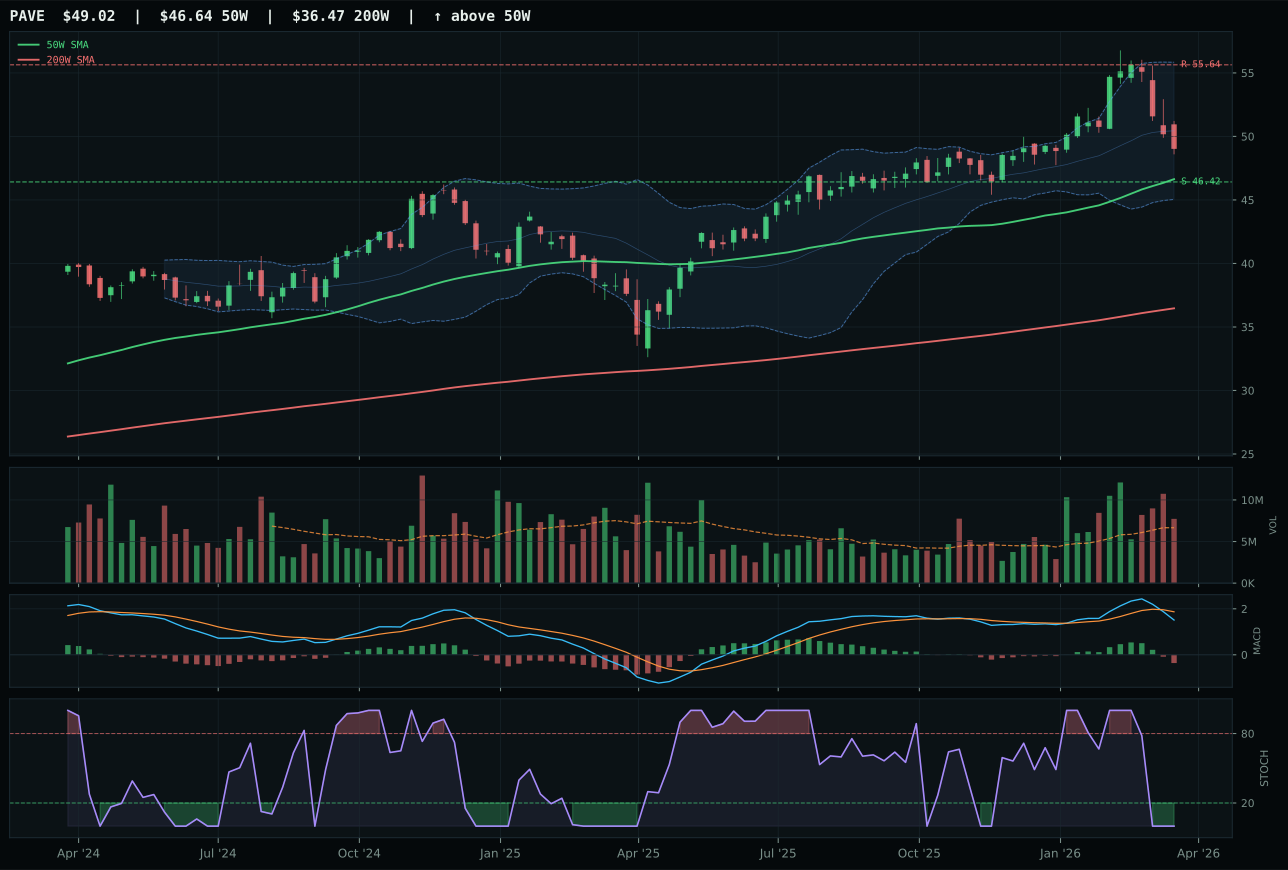
PAVE has a neutral structure profile with 5.7% 13-week relative strength versus SPY.
A failed hold above support would weaken the setup.
Actionable but governed by invalidation levels.
XLU wins the second top-2 allocation slot with a commanding 88 composite score and 100.0 trend confirmation, supported by bullish-improving MACD and falling stochastic RSI at 0.22 that signals sustainable momentum without overbought excess. The 9.4% RS versus SPY combined with price just 4.1% above the 50W places XLU in the rare position of being both relatively strong and well-positioned for entry. Above-average volume participation at 1.26x the 20W average confirms institutional accumulation into utility strength. IGF, the runner-up, offers higher SPY-relative at 12.2%, but timing is weaker (70.0 versus 90.0) and MACD is bullish-but-flattening rather than bullish-improving, marking momentum as decelerating. The 4.4-point gap reflects XLU's superior technical conviction in a defensive regime.
Utilities & Infrastructure ranks second among all categories at 63.4, justifying the 20% top-2 allocation in a Transition / Mixed macro state where defensive positioning is rewarded. The category-level macro fit of 62.0 out of 100 is driven by defensive rotation (plus-12), broad market bear support (plus-4), and Transition / Mixed regime tailwind (plus-4), offset by inflation headwinds (-6) and a slight risk appetite drag (-2). The technical evidence is exceptionally strong at 82.2 out of 100, with XLU delivering textbook trend, momentum, and volume confirmation that make this allocation feel both defensive and technically sound. Unlike precious metals, which are defensive but technically weak, Utilities provides defensive protection with positive momentum, making it the ideal 20% partner to Energy's 20%. This allocation should hold as long as defensive rotation remains active and broad market bear persists; any shift toward sustained risk appetite would argue for reducing this slot in favor of cyclical exposure.
Agriculture & Livestock — WEAT
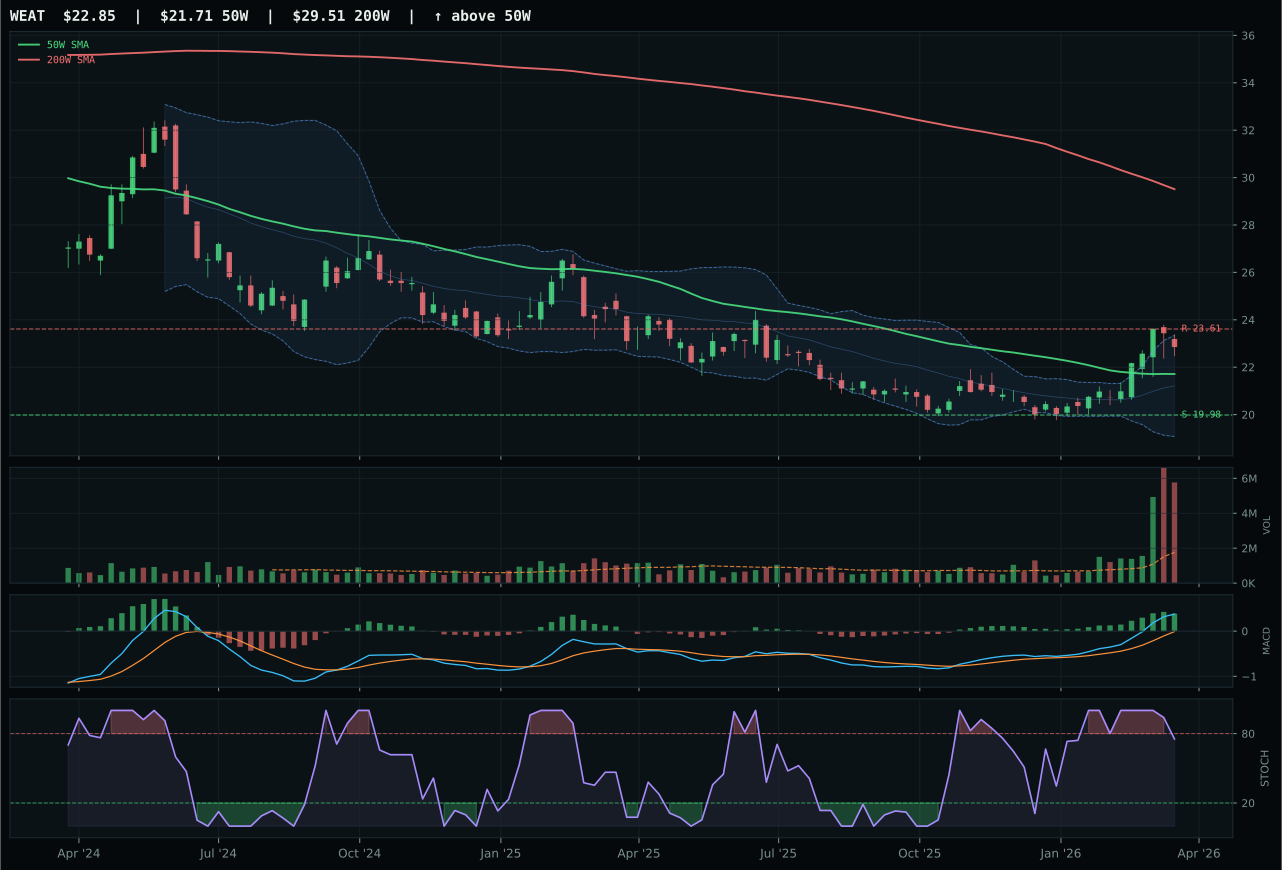
WEAT has a neutral structure profile with 19.1% 13-week relative strength versus SPY.
A failed hold above support would weaken the setup.
Actionable but governed by invalidation levels.
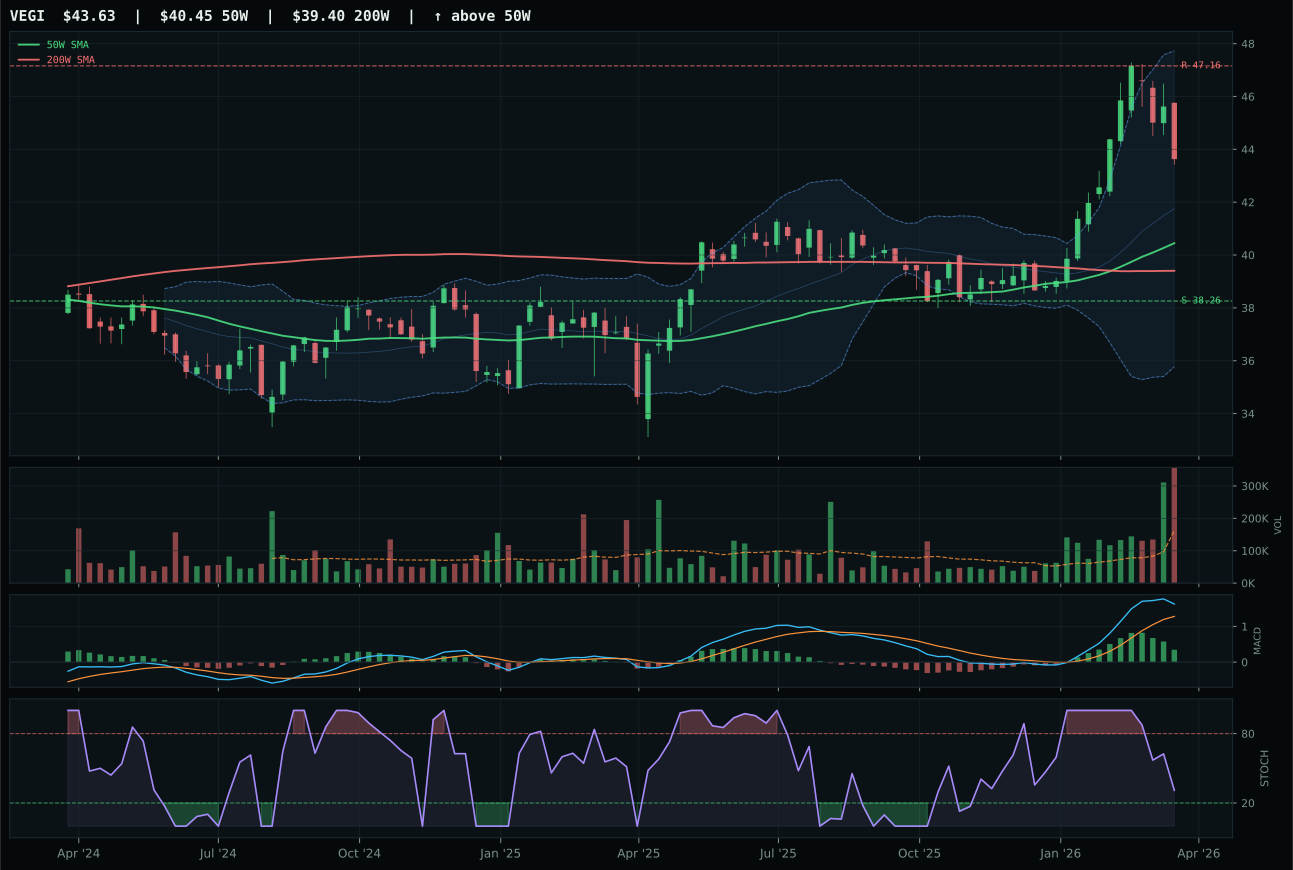
VEGI has a neutral structure profile with 17.6% 13-week relative strength versus SPY.
A failed hold above support would weaken the setup.
Tracked, but not top-2 eligible because: .
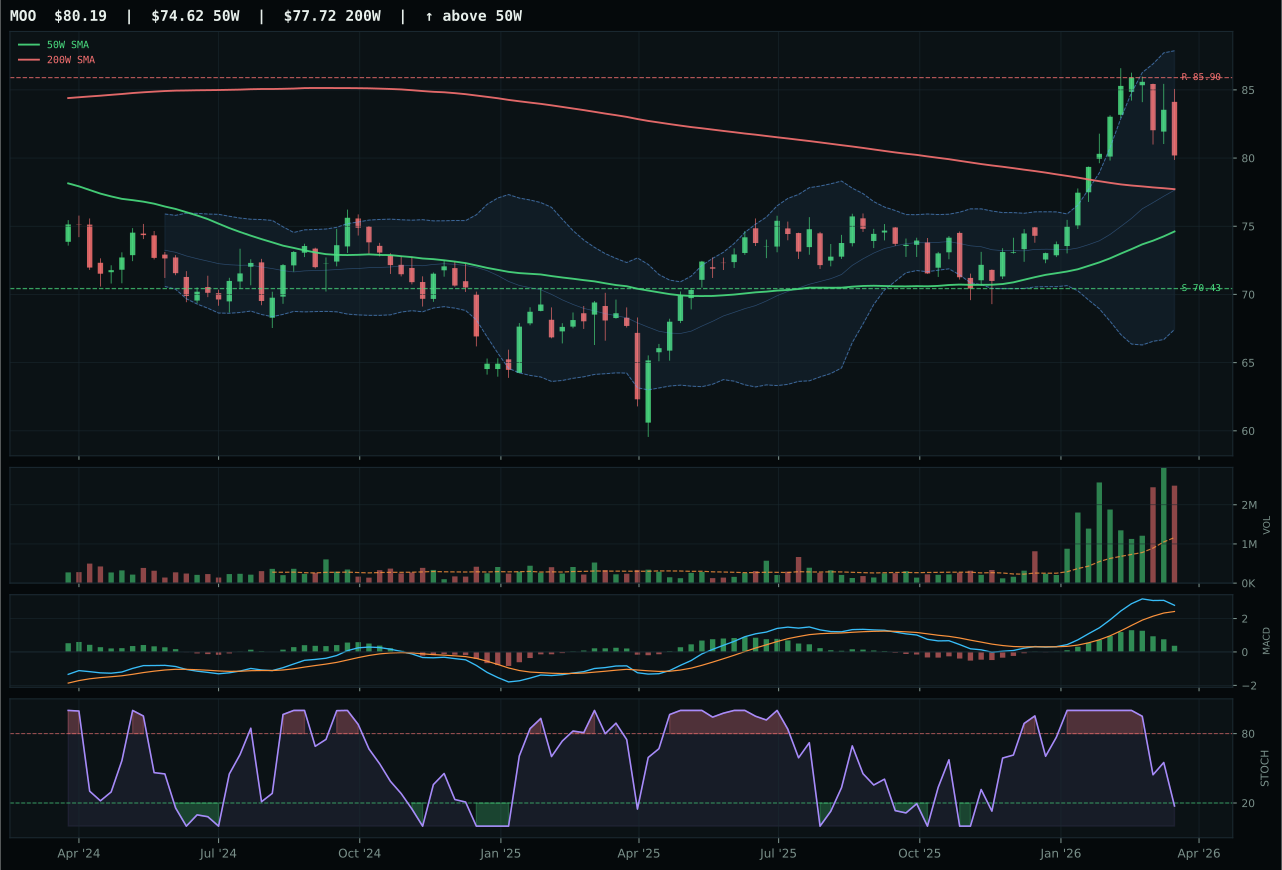
MOO has a neutral structure profile with 12.6% 13-week relative strength versus SPY.
A failed hold above support would weaken the setup.
Actionable but governed by invalidation levels.
WEAT wins with a perfect 100.0 momentum confirmation score driven by 14.4% 13-week returns and bullish-improving MACD—the strongest momentum signal in the entire portfolio. Price sits just 5.2% above the 50W with neutral structure and clean compression at 79.6, making this neither a chase nor a deep pullback, but rather an early-stage reacceleration. The 19.1% RS versus SPY and distribution pressure at 3.28x the 20W average signal institutional participation into strength. VEGI lost ground due to weaker MACD confirmation (bullish but flattening versus bullish and improving) and category-relative strength that lagged at 0.0%, despite having similar structural and trend metrics. The supply shortage descriptor is active at plus-13, the highest single macro factor for any category, making WEAT's technical confirmation feel almost secondary.
Agriculture & Livestock earns 10% on the back of the highest category-level macro fit in the portfolio at 86.0 out of 100. Supply shortage (plus-13), inflation pressure (plus-10), and real asset sponsorship (plus-8) create a structural tailwind that justifies holding the position even as price sits near upper retracement zones. The technical evidence score of 52.8 is moderate—WEAT's setup is solid but not exceptional—yet the macro foundation is so strong that category rank improves to 58.0, placing it fourth among eligible categories. This is a macro conviction allocation that should hold even if near-term price action weakens, provided the supply shortage descriptor remains active. The 10% slot reflects confidence in the macro thesis balanced against cautious positioning due to elevated technical readings and distribution volume pressure.
AI — AIQ
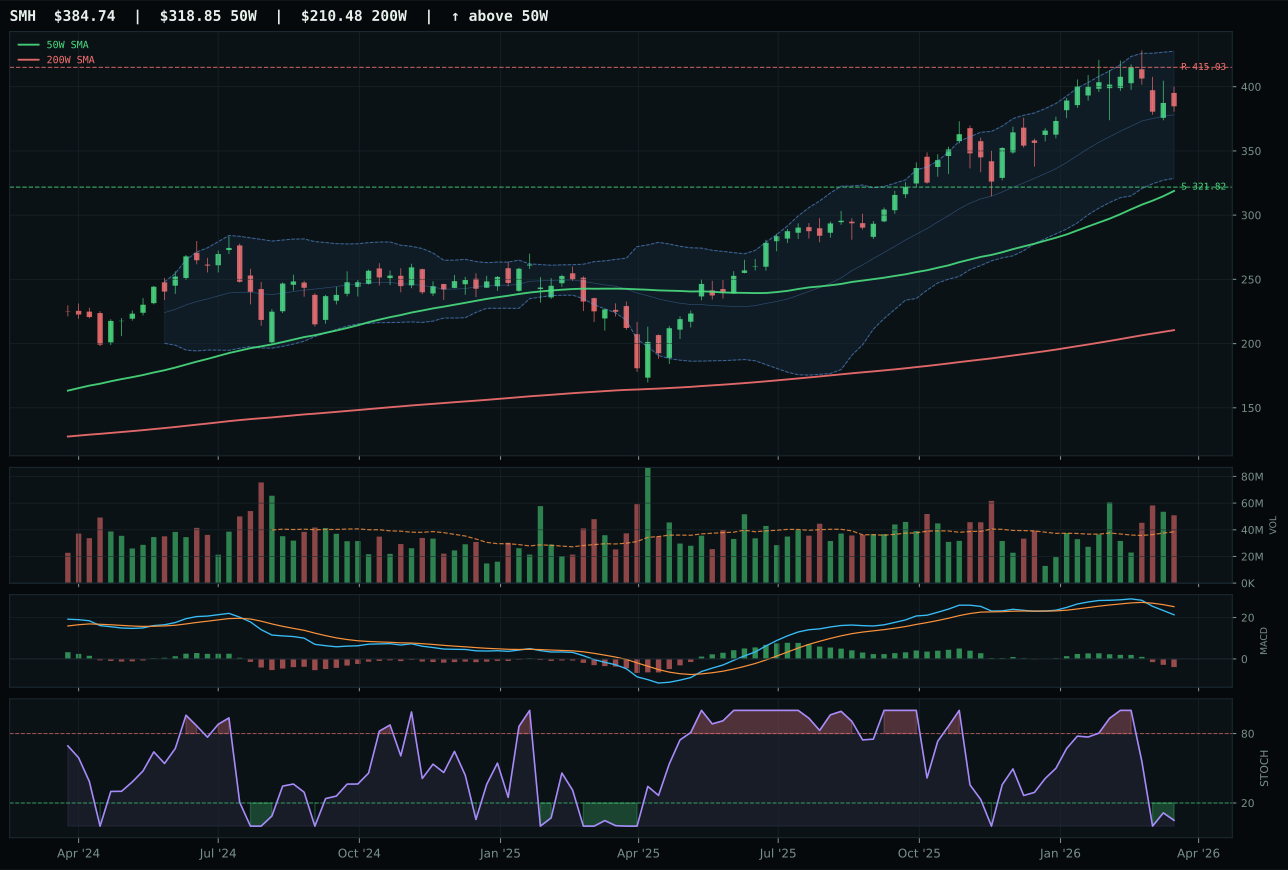
SMH has a vertical extension profile with 12.7% 13-week relative strength versus SPY.
A failed hold above support would weaken the setup.
Actionable but governed by invalidation levels.
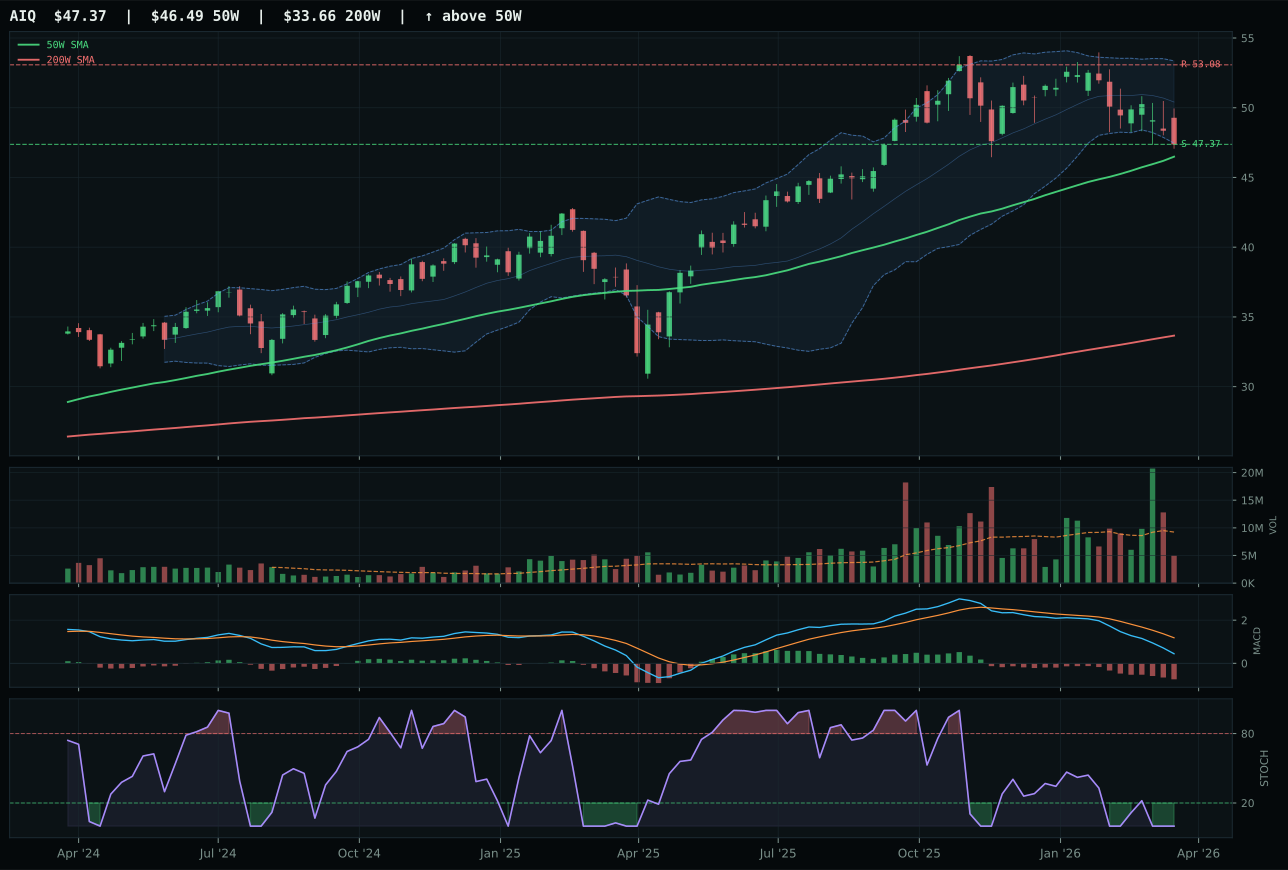
AIQ has a pullback into support profile with -1.9% 13-week relative strength versus SPY.
A failed hold above support would weaken the setup.
Actionable but governed by invalidation levels.
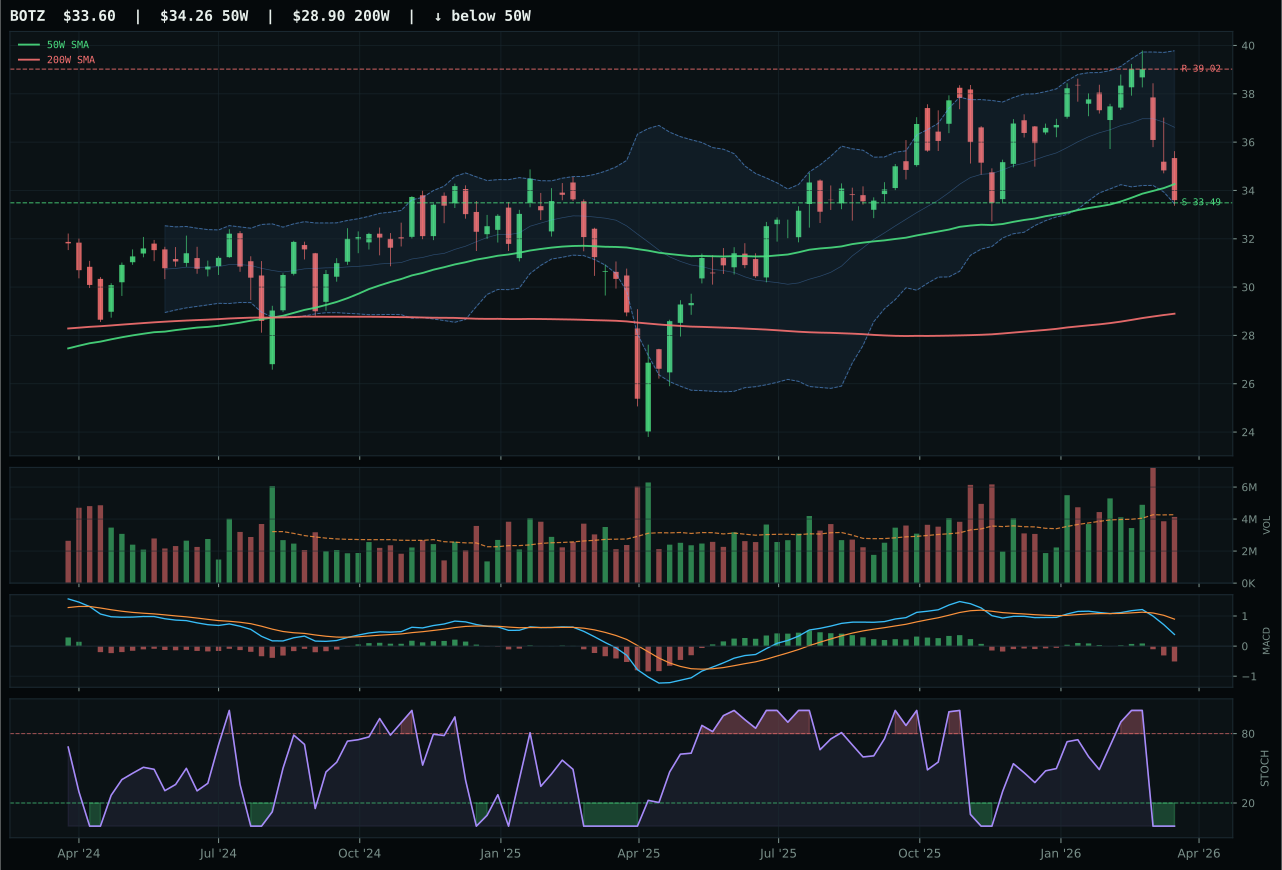
BOTZ has a pullback into support profile with -1.9% 13-week relative strength versus SPY.
A failed hold above support would weaken the setup.
Actionable but governed by invalidation levels.
AIQ wins by combining price 1.9% above the 50-week moving average with a timing score of 95.0—the highest available in this category—and a superior risk-reward ratio that oversells the competition. The setup is pullback into support at 47.37 with stochastic RSI oversold at 0.00, creating a textbook mean-reversion coil. SMH, the runner-up, has posted stronger 13-week returns of 8.0% and RS versus SPY of 12.7%, but it is also 20.7% extended above the 50W with deteriorating timing (48.0) and compressed risk-reward (51.7), meaning it has already captured most of the available upside. AIQ's thin volume participation at 0.54x the 20-week average is a drawback, but macro sponsorship from AI growth remains the strongest tailwind in the portfolio at plus-14 score points, making the near-term setup more important than the liquidity question.
AI holds its 10% allocation because the category score of 55.1 ranks it third among all eligible categories, just behind Utilities and Energy. The macro fit is exceptionally strong at 78.0 out of 100, powered by AI growth sponsorship that is deeper than any other category descriptor. However, the technical evidence lags at only 34.6 out of 100, dragged down by thin volume and weak momentum confirmation—the reason AIQ itself carries zero momentum score despite bullish macro context. This is a pure conviction macro allocation: the category does not need strong setup confirmation to justify 10% because the structural AI tailwind outweighs setup deterioration. If technical confirmation deteriorates further or if the AI growth sponsorship descriptor turns false, this slot becomes vulnerable to reallocation.
Industrial Metals — REMX
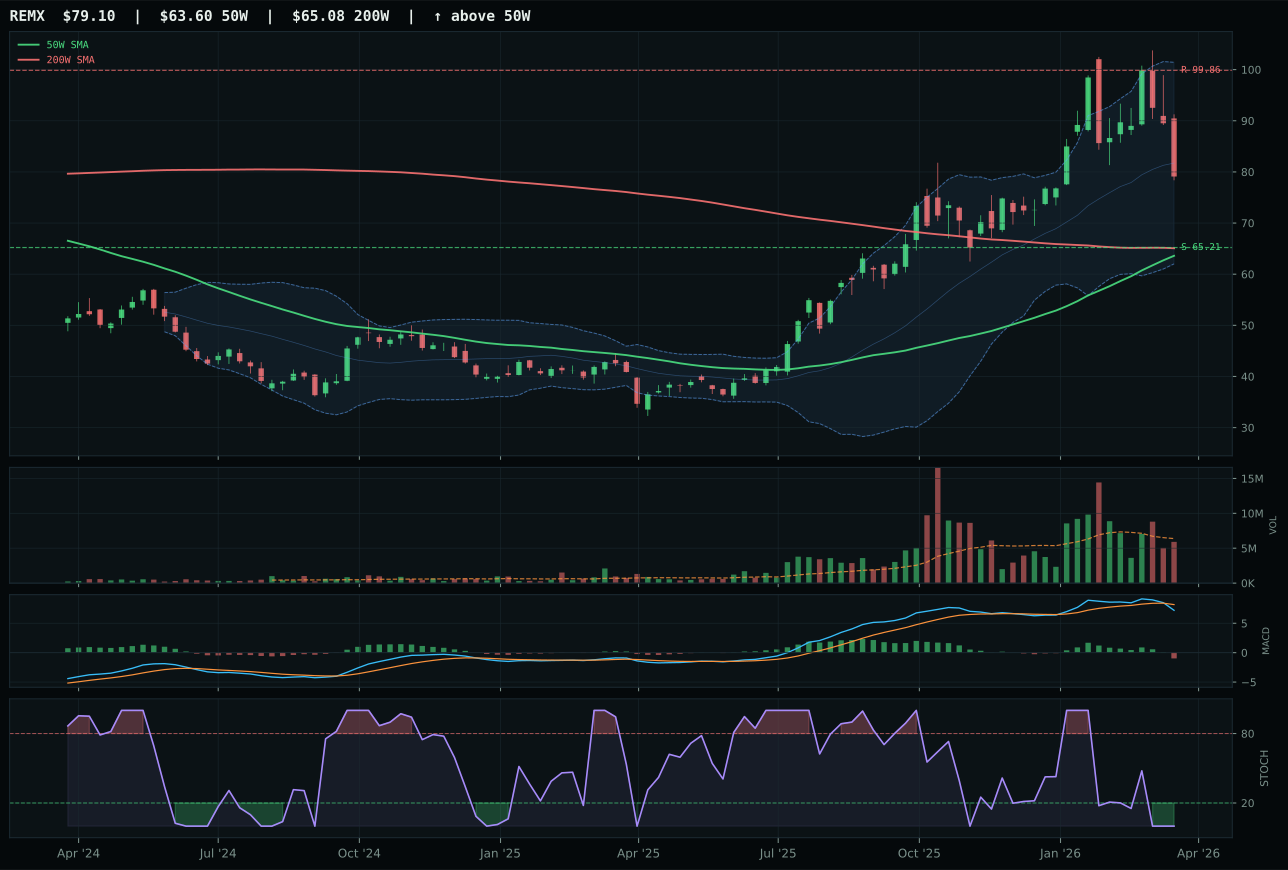
REMX has a vertical extension profile with 13.7% 13-week relative strength versus SPY.
A failed hold above support would weaken the setup.
Actionable but governed by invalidation levels.
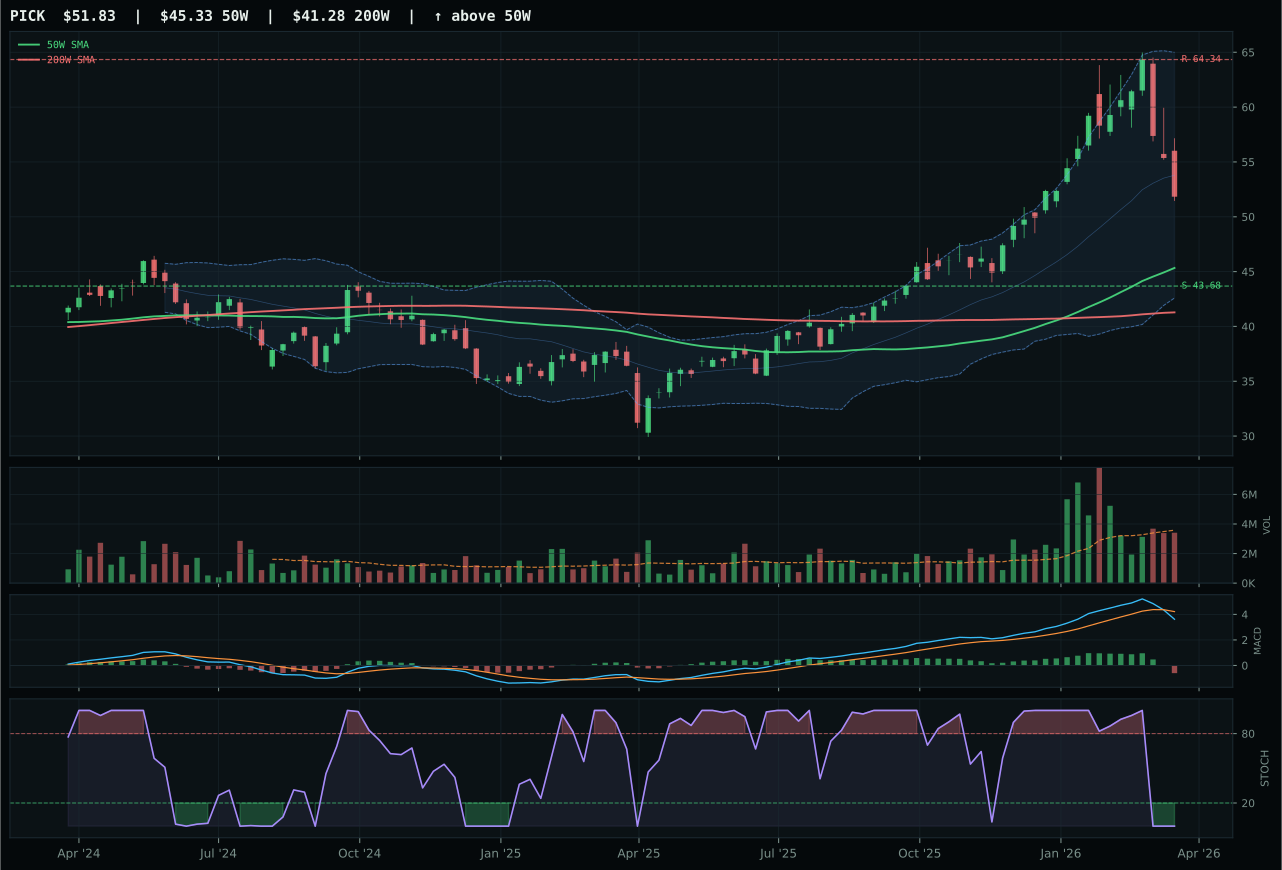
PICK has a neutral structure profile with 8.6% 13-week relative strength versus SPY.
A failed hold above support would weaken the setup.
Actionable but governed by invalidation levels.
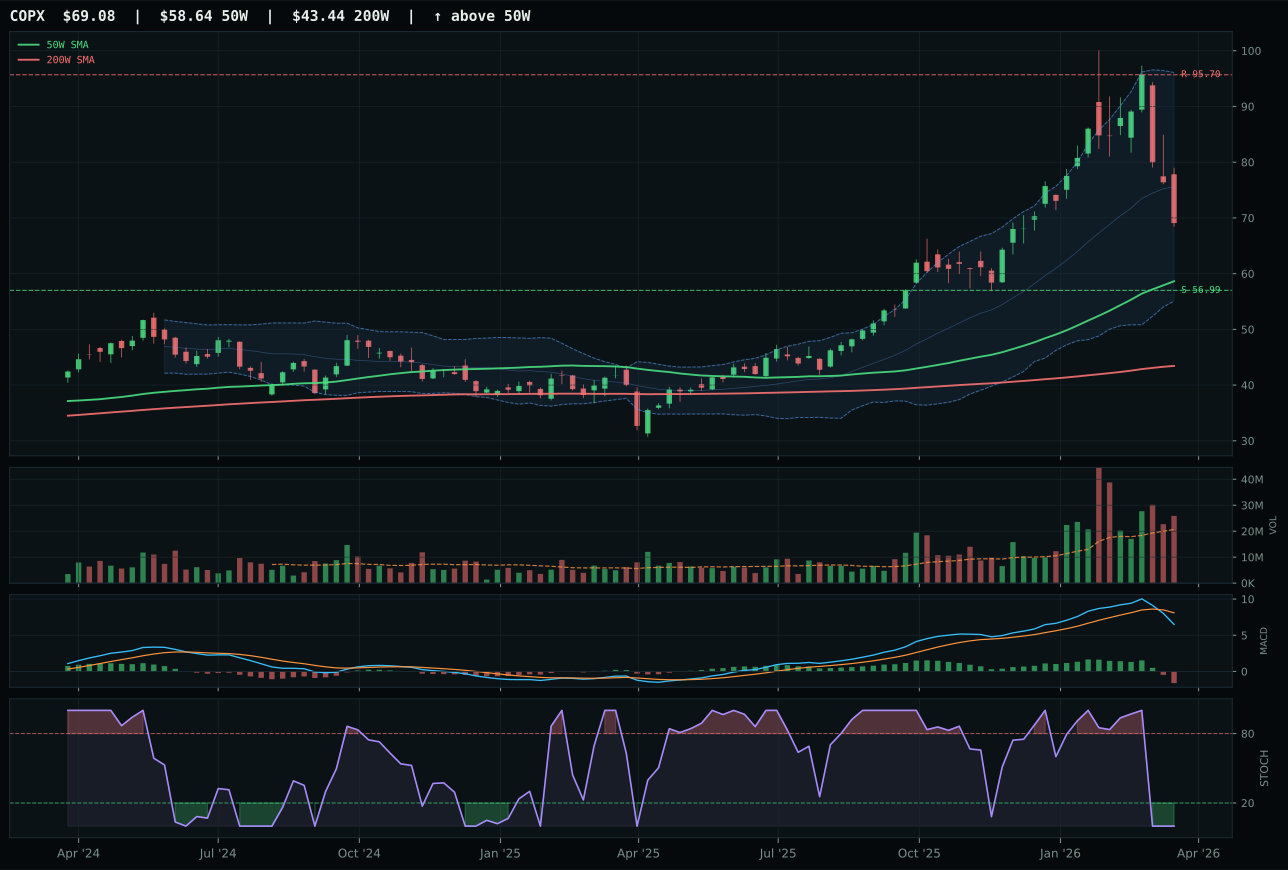
COPX has a vertical extension profile with 3.0% 13-week relative strength versus SPY.
A failed hold above support would weaken the setup.
Actionable but governed by invalidation levels.
REMX wins because it is the only name in the category with positive category-relative strength at plus-5.1, despite being extended 24.4% above the 50W. Rare earth supply shortage is a targeted macro theme (metals scarcity plus-9, supply shortage plus-8) that gives REMX permission to run extended, whereas PICK's neutral structure and 0.0% category RS suggests generalist mining weakness. REMX's vertical extension setup normally signals caution, but the combination of 13W return of 9.0%, RS versus SPY of 13.7%, and above-average breadth within the category overrides the timing penalty. PICK scores higher on composite technical metrics (69 versus 56) but loses on the category-relative proving grounds where REMX's rare-earth positioning offers differentiation that the allocator is willing to pay for via extended price.
Industrial Metals earns 10% on the strength of the third-highest category macro fit at 80.0 out of 100, driven by metals scarcity (plus-14) and commodity breadth (plus-10) that are among the most active descriptors. The technical evidence is weaker at only 31.0, reflecting REMX's extended price and thin volume participation—this is a pure macro allocation against supply-chain bottlenecks and industrial-demand rebound. The category score of 54.3 ranks it comfortably mid-pack, making 10% appropriate. However, the setup depends entirely on macro validation: if supply shortage or metals scarcity descriptors toggle false, REMX's extended technicals become a liability rather than a feature. This allocation should hold as long as the supply-side narrative persists, but it is the most vulnerable to mean-reversion if macro tailwinds shift.
Nuclear Energy — NLR
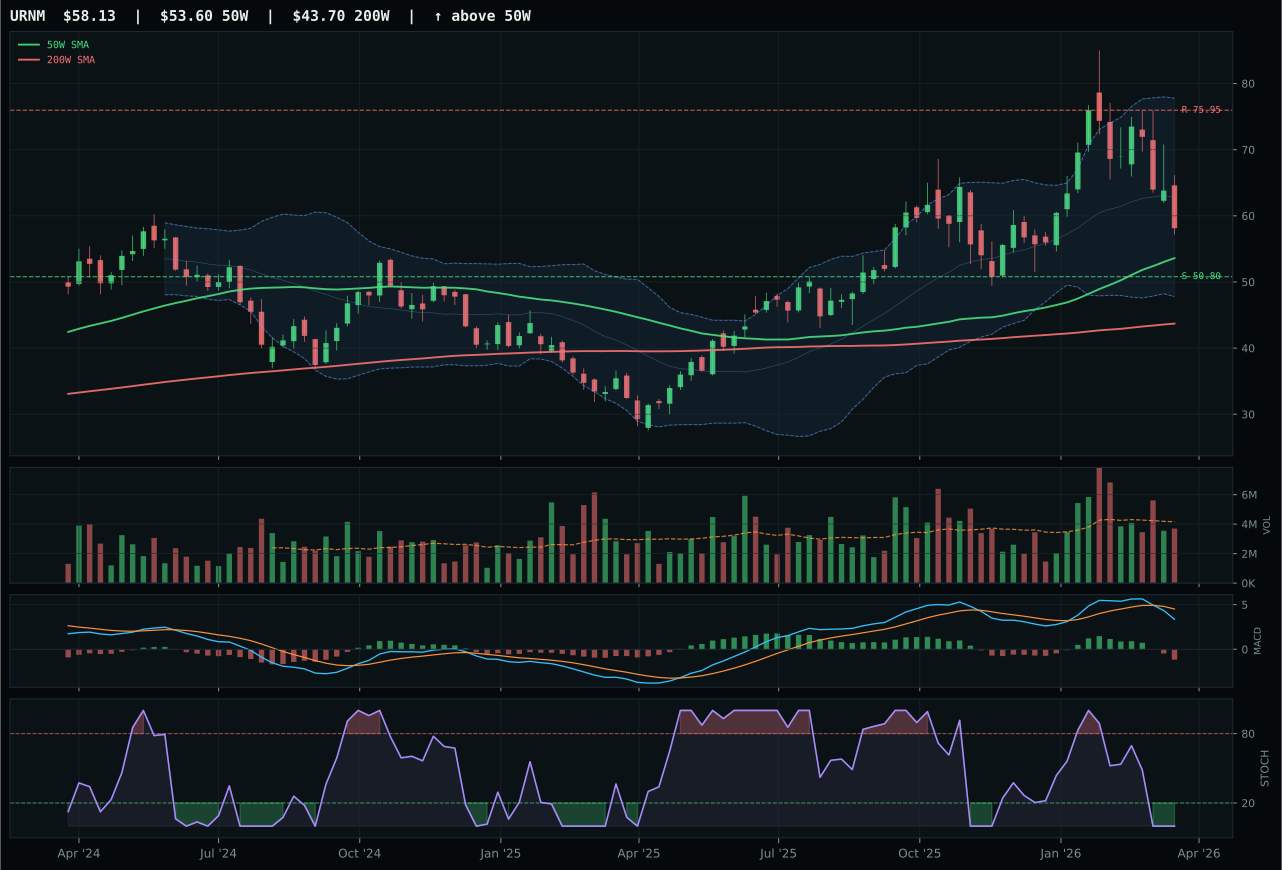
URNM has a neutral structure profile with 9.1% 13-week relative strength versus SPY.
A failed hold above support would weaken the setup.
Actionable but governed by invalidation levels.
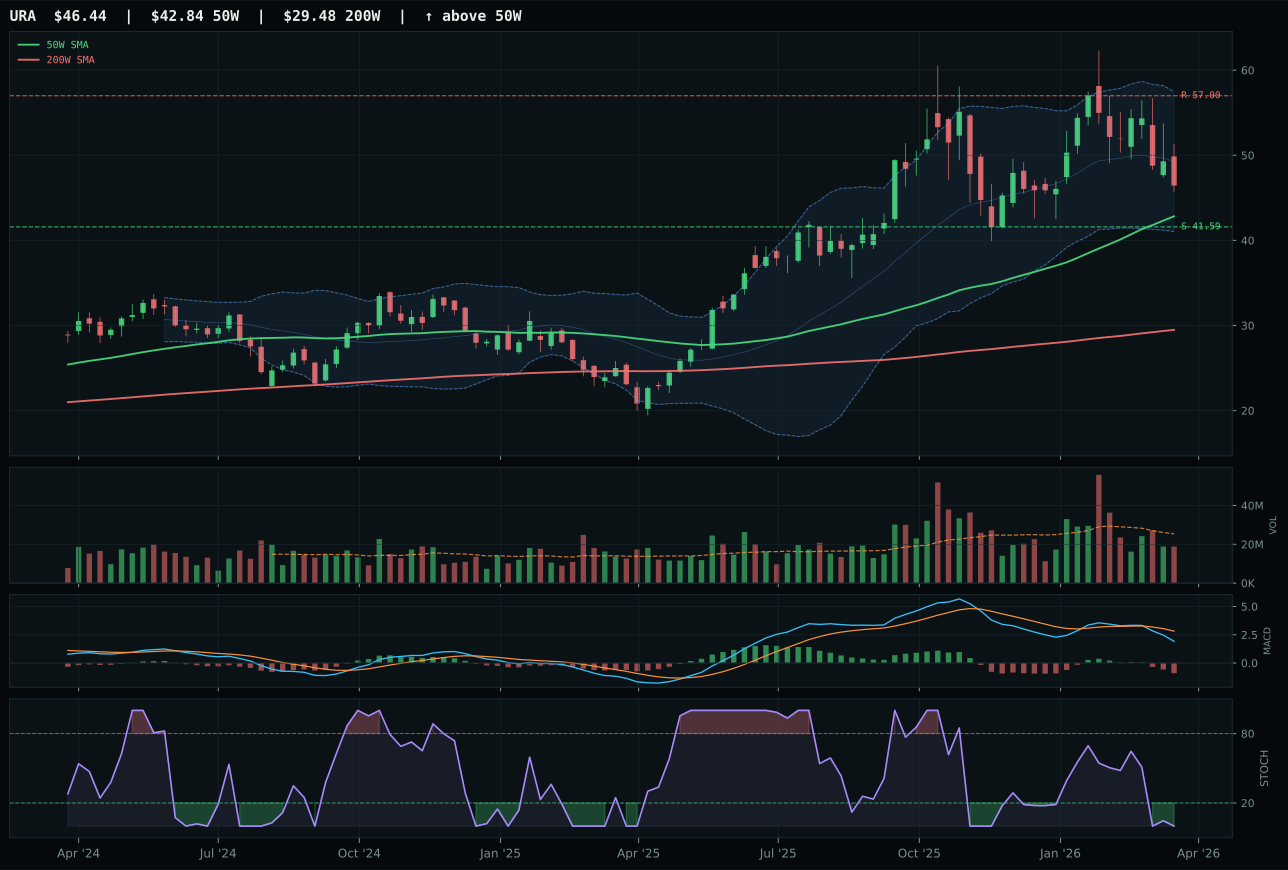
URA has a neutral structure profile with 5.9% 13-week relative strength versus SPY.
A failed hold above support would weaken the setup.
Actionable but governed by invalidation levels.
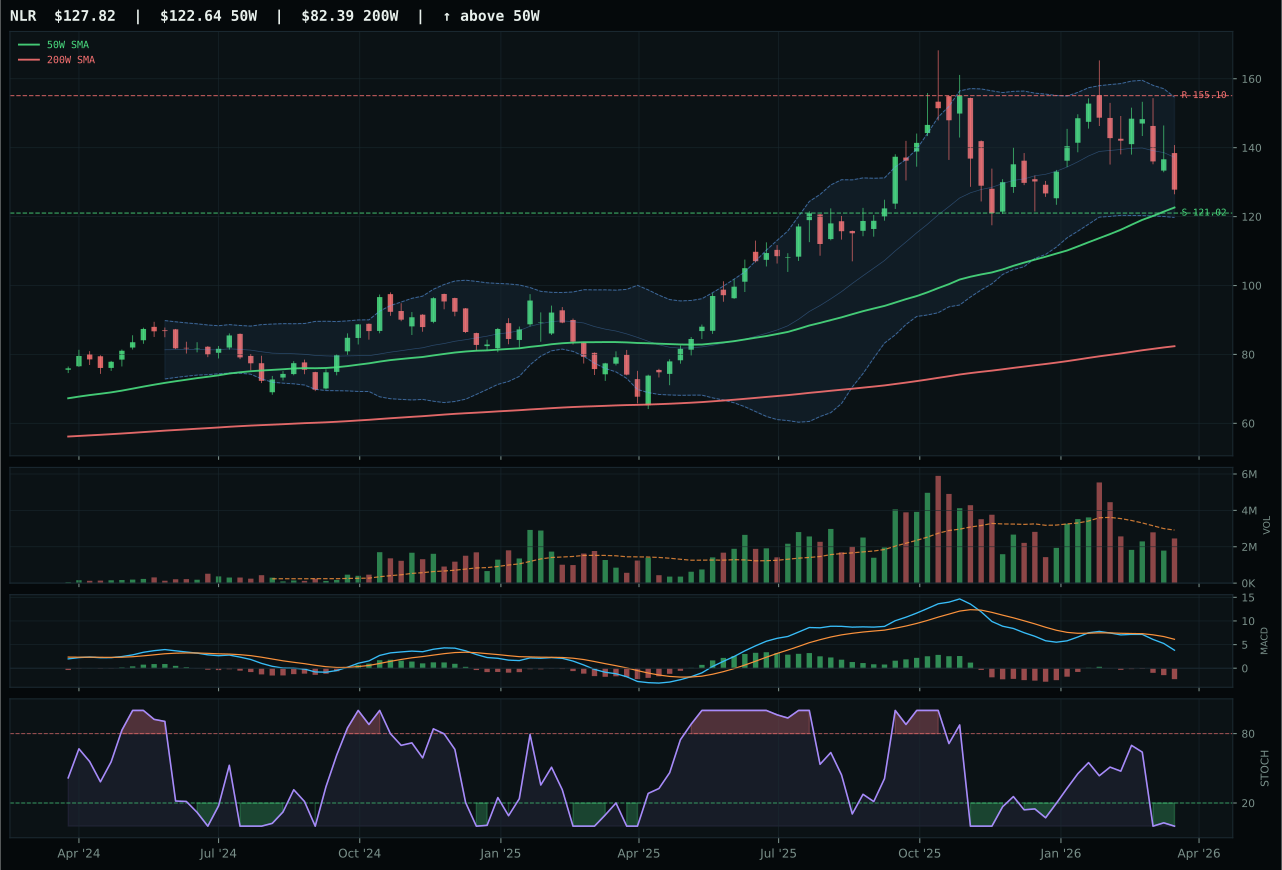
NLR has a neutral structure profile with 2.9% 13-week relative strength versus SPY.
A failed hold above support would weaken the setup.
Actionable but governed by invalidation levels.
NLR wins because it offers the superior timing setup at 92.0 with price just 4.2% above the 50W, putting it in the middle retracement / decision zone rather than extended. The risk-reward score of 83.0 is substantially better than URNM's 59.3, giving new capital a 5.6% downside cushion against 17.6% upside. Both face weak momentum (NLR at 9.8, URNM at 22), but NLR's better structure and timing make the setup less dependent on immediate continuation. URNM's 9.1% RS versus SPY is attractive, but it comes from a setup that is already extended mid-retracement, forcing the allocator to choose between better category-relative strength and safer entry—the scoring system favors safer entry in a defensive macro regime.
Nuclear Energy earns 10% on moderate-to-good macro tailwinds (energy scarcity plus-9, real asset sponsorship plus-7) that justify holding despite a category score of 52.0, which ranks it lower-middle tier. The technical evidence of 37.1 out of 100 is weak, dragged down by momentum confirmation at just 9.8 and volume confirmation at 37.0, reflecting the fact that NLR is not in accumulation—it is a steady hold. The category macro fit of 74.0 out of 100 is solid if not dominant, and the Transition / Mixed regime favors defensive energy plays like nuclear utilities over pure energy beta. This is a 10% defensive hedge that benefits from the same energy scarcity backdrop as the 20% XOP position but with lower volatility and better downside protection. It should be held as long as the energy scarcity descriptor remains active and broad market bear remains in effect.
Emerging Markets — ILF
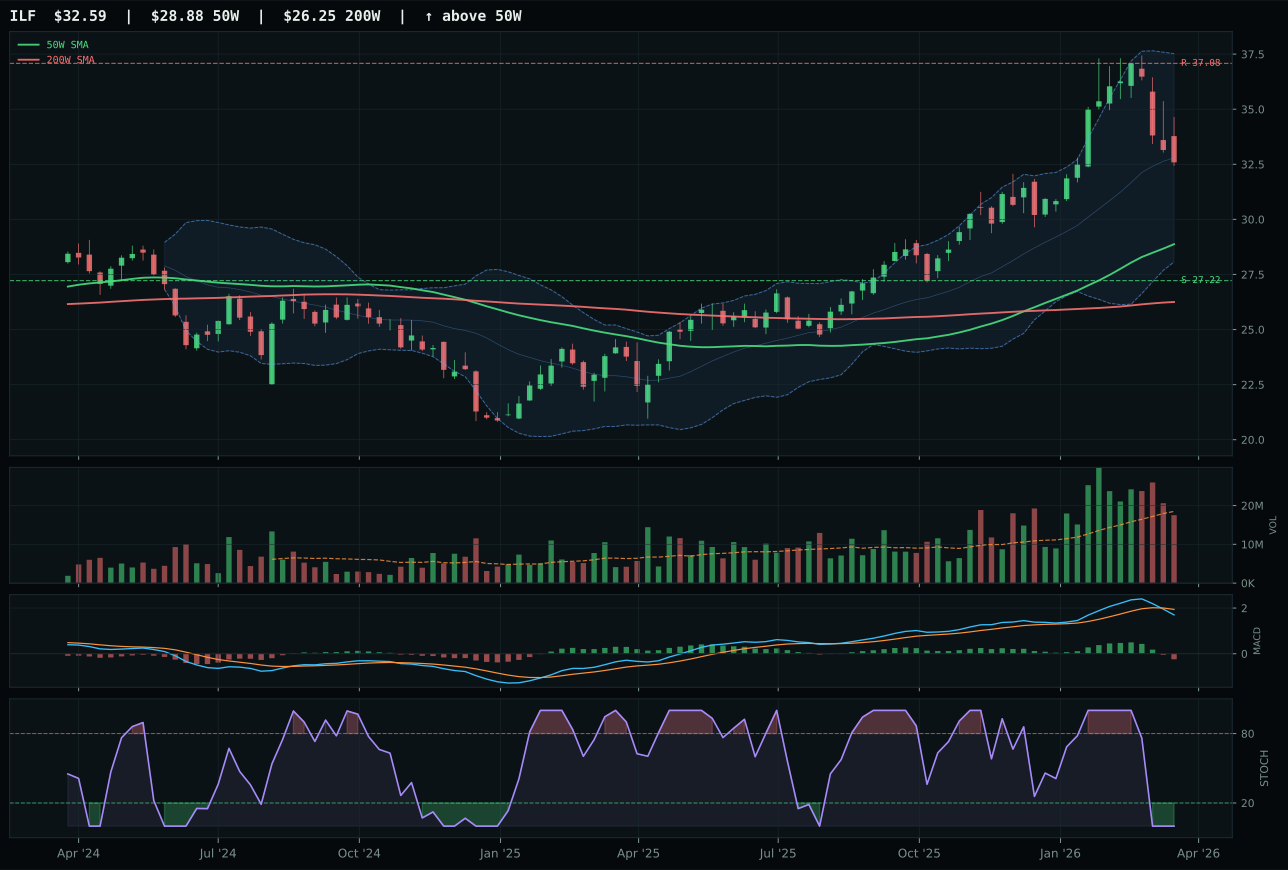
ILF has a neutral structure profile with 12.6% 13-week relative strength versus SPY.
A failed hold above support would weaken the setup.
Actionable but governed by invalidation levels.
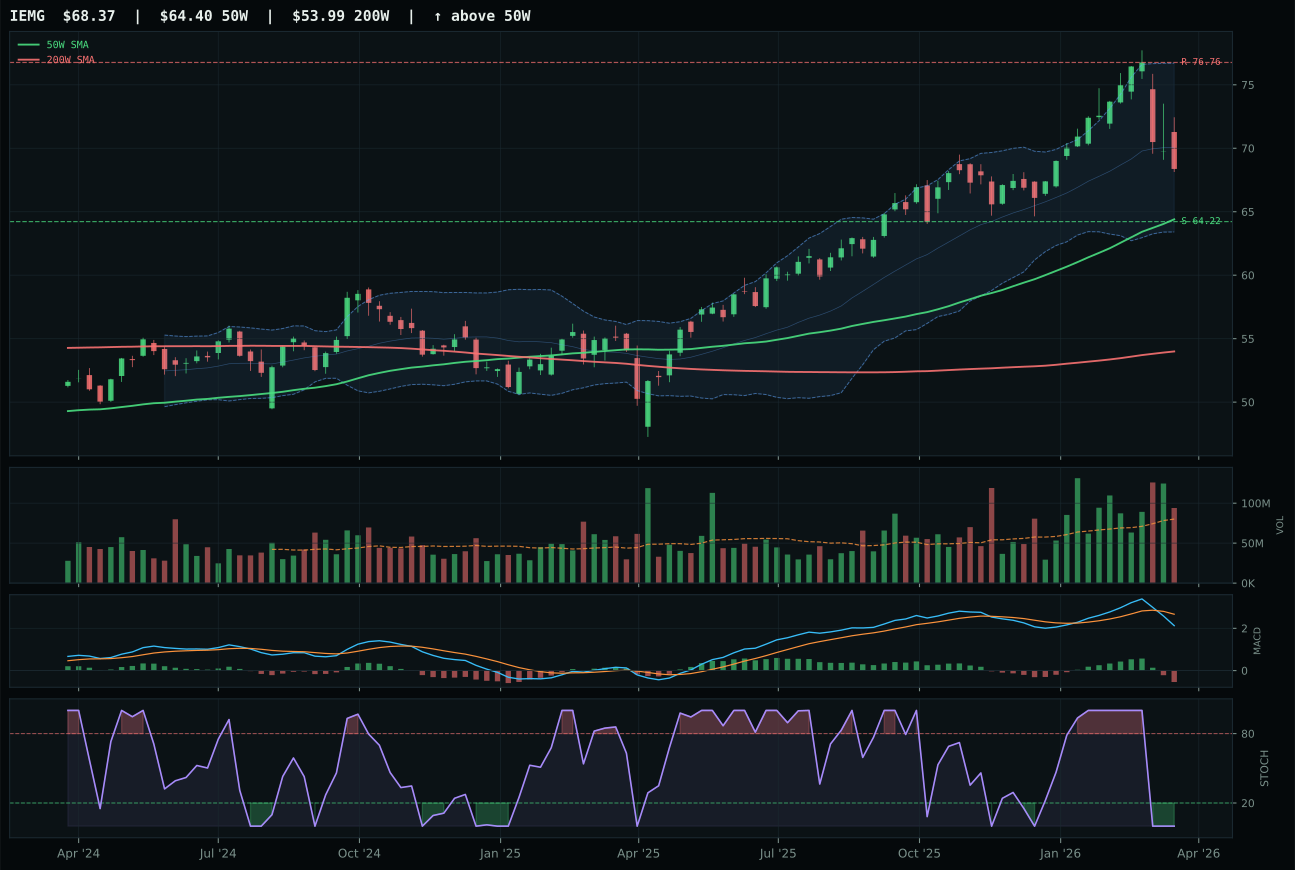
IEMG has a neutral structure profile with 8.2% 13-week relative strength versus SPY.
A failed hold above support would weaken the setup.
Actionable but governed by invalidation levels.
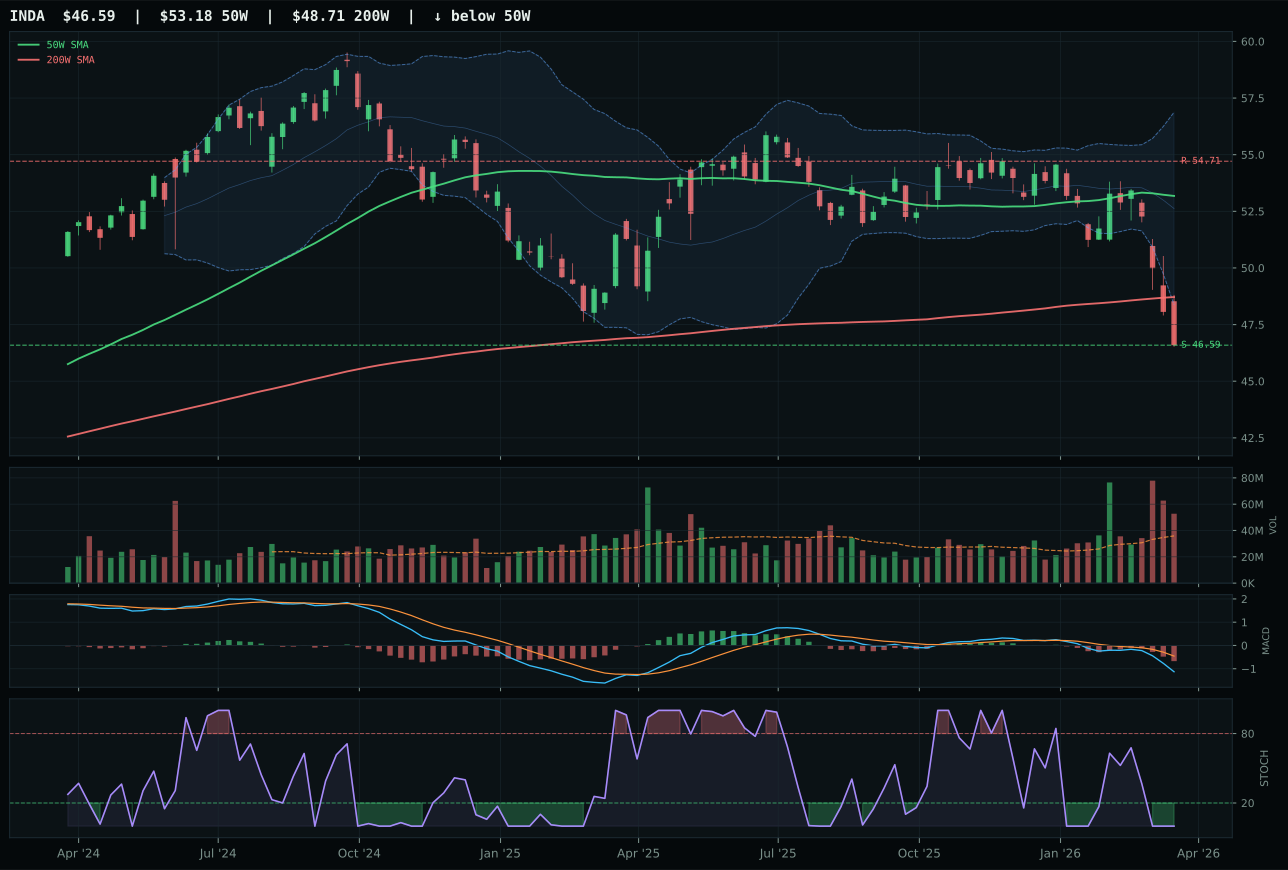
INDA has a pullback into support profile with -9.3% 13-week relative strength versus SPY.
A failed hold above support would weaken the setup.
Actionable but governed by invalidation levels.
ILF wins by delivering 12.6% RS versus SPY and 4.5% category-relative strength, beating IEMG's 8.2% SPY-relative and 0.0% category-relative despite nearly identical structural metrics. Both sit in neutral structure with oversold stochastic RSI and bearish MACD, but ILF's better category standing suggests Latin America commodity beta is accumulating breadth advantage over broader EM exposure. The 13W return of 7.9% and bullish-improving MACD provide modest momentum support, while IEMG's bullish-but-flattening MACD shows deteriorating conviction. The score gap is tight at 2.9 points, making this a call on which EM sub-theme will lead the next leg of the cycle: Latin America's commodity leverage or broad EM liquidity support.
Emerging Markets earns its 10% allocation on the back of strong EM-specific macro tailwinds (EM liquidity support plus-14, liquidity expansion plus-8, risk appetite plus-8) that are offset by significant headwinds from broad market bear at minus-9. The category score of 50.5 ranks it below middle, but the macro fit of 71.0 out of 100 provides reasonable support. The technical evidence is moderate at 52.9 out of 100, so this allocation depends on continued EM liquidity support and emerging-market flows. It should hold as long as the EM liquidity support descriptor remains active and the broad market bear does not intensify. If either condition reverses, this slot becomes vulnerable to reallocation toward stronger categories. The 10% position is tactical rather than strategic, best viewed as a beneficiary of liquidity flows rather than a conviction call on fundamental EM improvement.
Technology — IGV
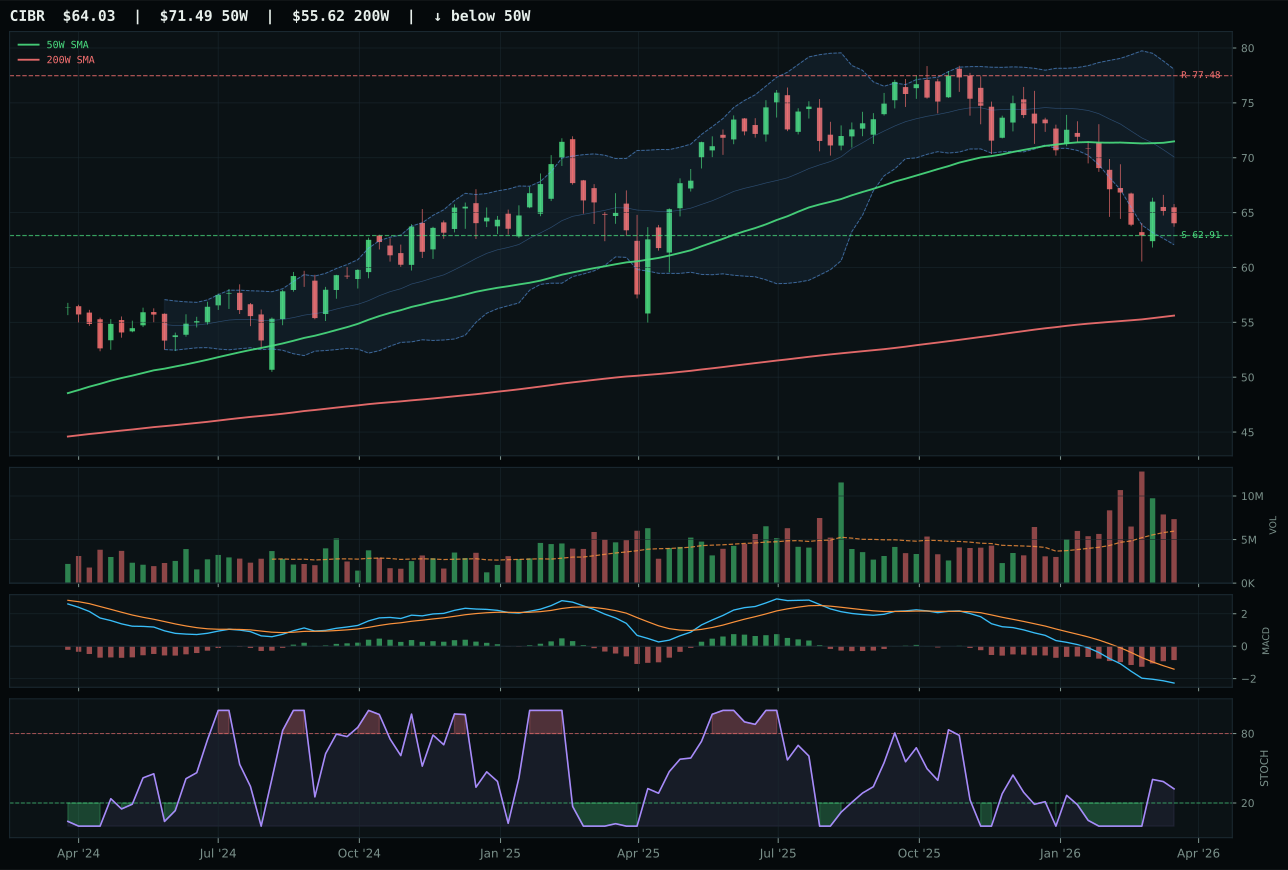
CIBR has a pullback into support profile with -7.7% 13-week relative strength versus SPY.
A failed hold above support would weaken the setup.
Actionable but governed by invalidation levels.
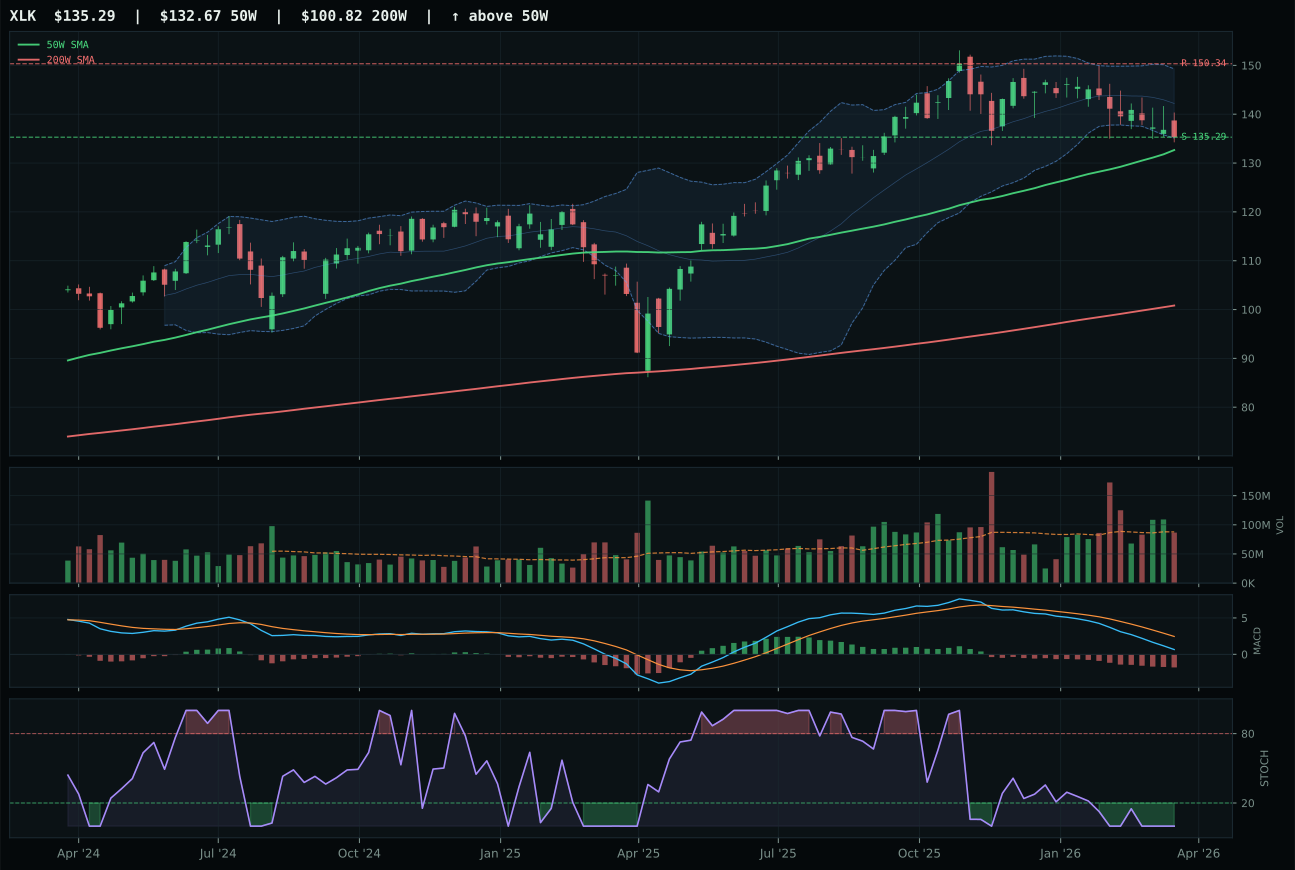
XLK has a pullback into support profile with -1.7% 13-week relative strength versus SPY.
A failed hold above support would weaken the setup.
Actionable but governed by invalidation levels.
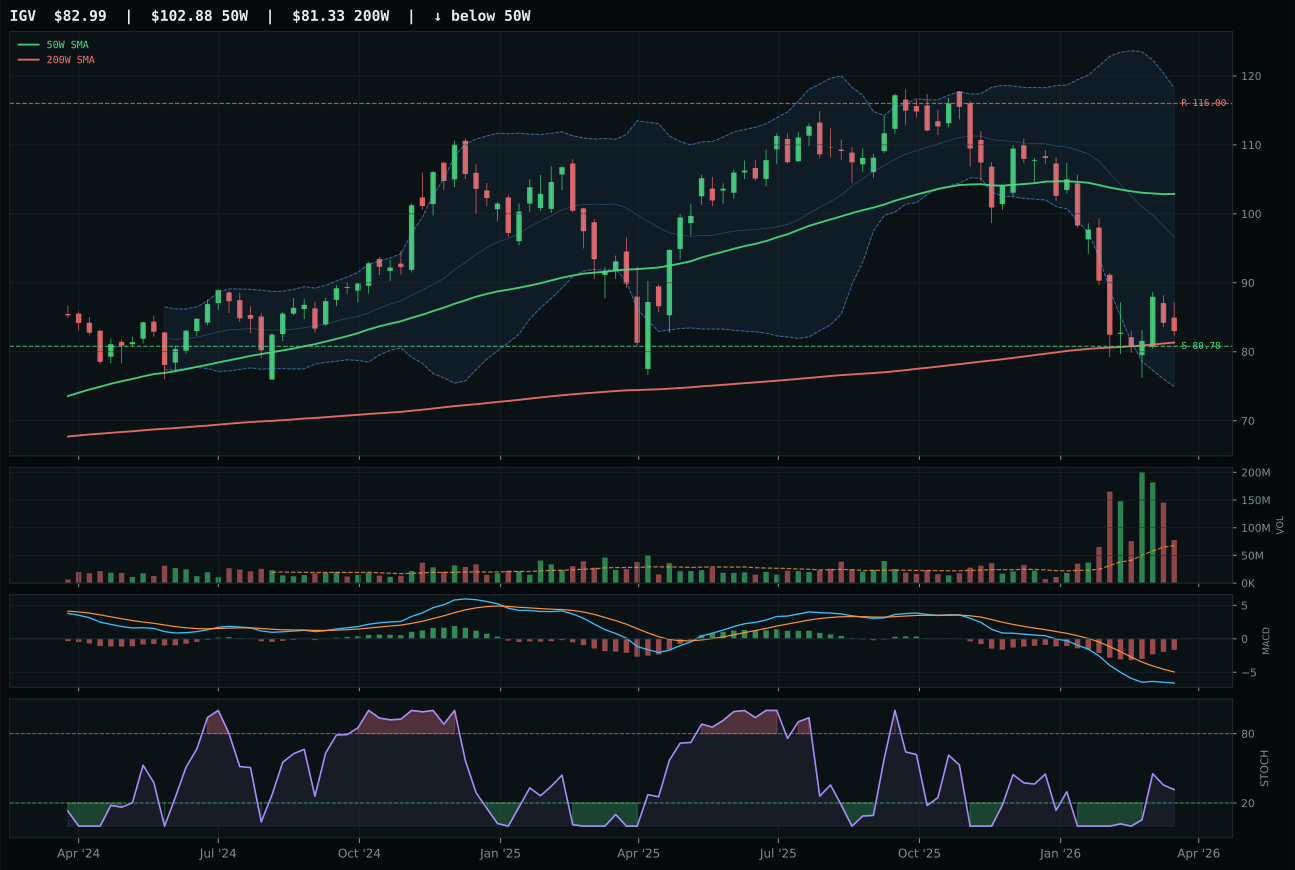
IGV has a pullback into support profile with -18.3% 13-week relative strength versus SPY.
A failed hold above support would weaken the setup.
Actionable but governed by invalidation levels.
IGV wins the Technology category because its pullback into support near 80.78 offers defined downside risk while the chart sits just 19.3% below the 50-week moving average—a genuine reset rather than a chase. The 13-week return of -23.0% and RS versus SPY of -18.3% signal capitulation in enterprise software, but above-average volume participation at 1.15x the 20-week average and a MACD that is bearish but improving suggest accumulation into the weakness. CIBR, the runner-up, suffered from less clean structure (63.1 versus 65.7) and was closer to its 50W at just -10.4%, meaning the risk-reward setup for new capital was less favorable. The score gap of 17.7 points reflects IGV's superior timing and setup quality in a category where price discovery matters more than momentum.
Technology earns its 10% allocation slot as the highest-ranked category below the top-2 tier, driven by liquidity expansion and risk appetite both active in the macro state. The category-level macro fit of 70.0 out of 100 is meaningful but not dominant—this allocation reflects the balance of a neutral-to-positive technical setup (IGV's pullback support) against inflation pressure headwinds that cap the sector's appeal. The Transition / Mixed regime favors neither aggressive tech nor defensive rotation, so the 10% slot serves as a diversifier and a hedge to the energy and utilities concentration in the 20% positions. If breadth confirmation improves or if AI growth sponsorship strengthens further, Technology could graduate to a 10% allocation, but sustained momentum would need to accompany price improvement.
Defense & Aerospace — XAR
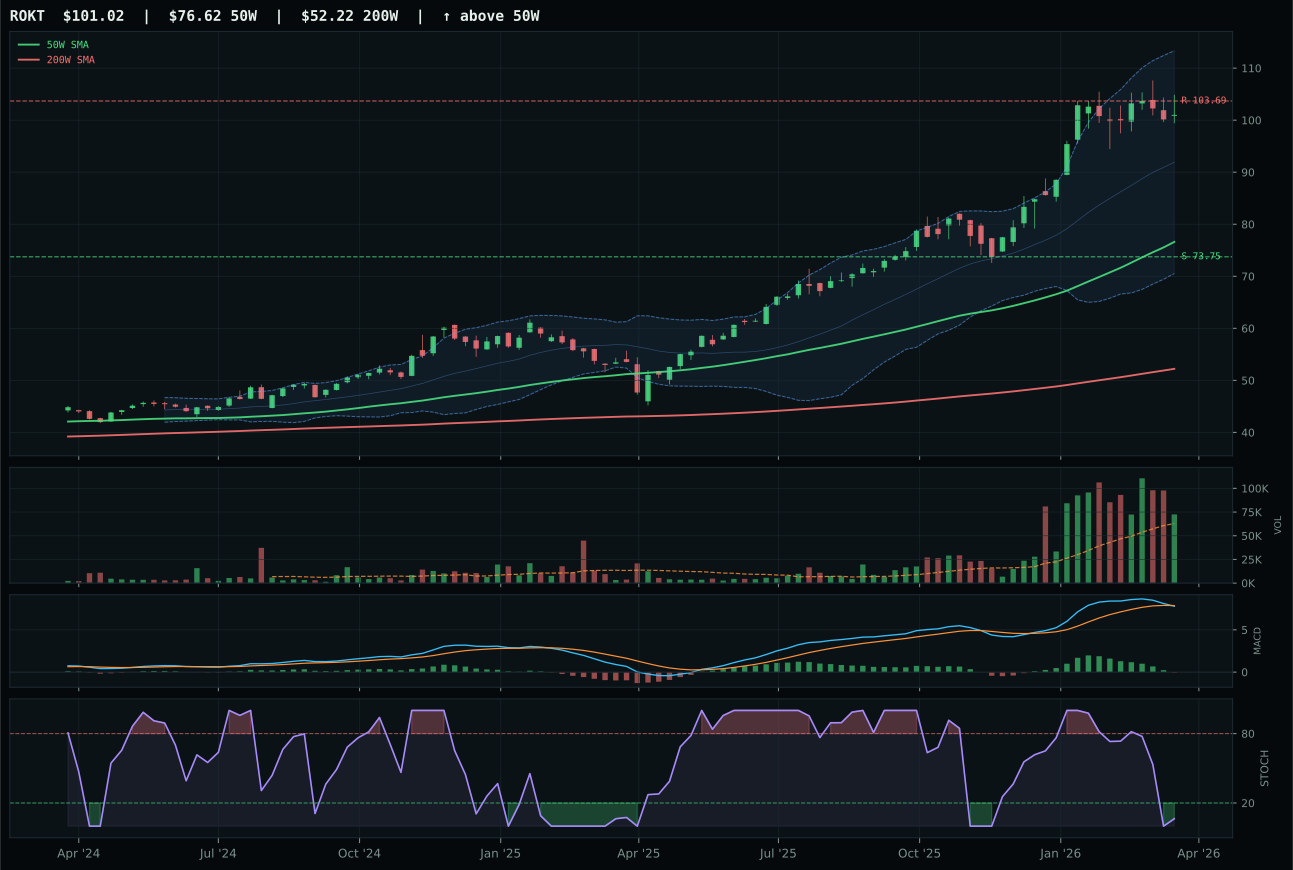
ROKT has a vertical extension profile with 23.8% 13-week relative strength versus SPY.
A failed hold above support would weaken the setup.
Tracked, but not top-2 eligible because: .
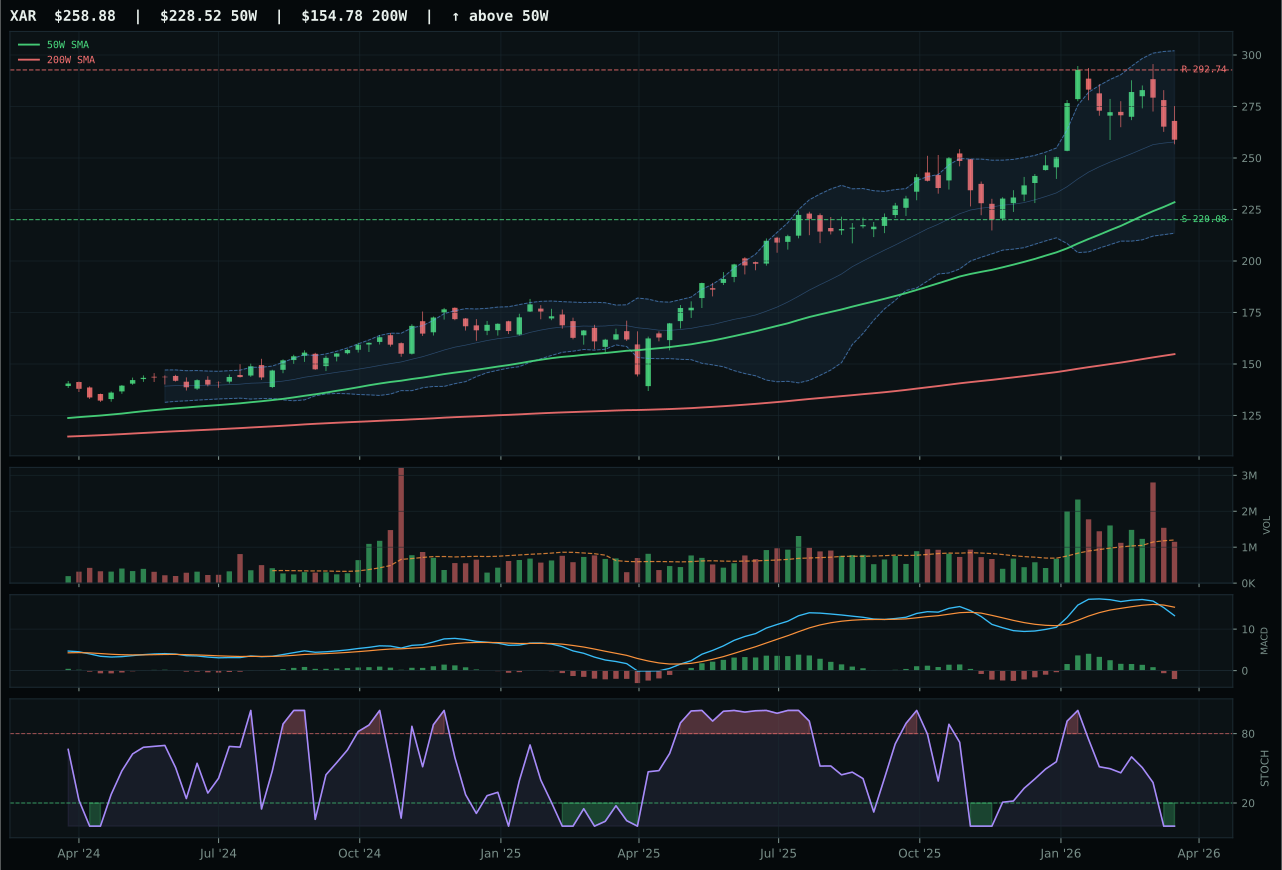
XAR has a neutral structure profile with 12.0% 13-week relative strength versus SPY.
A failed hold above support would weaken the setup.
Actionable but governed by invalidation levels.
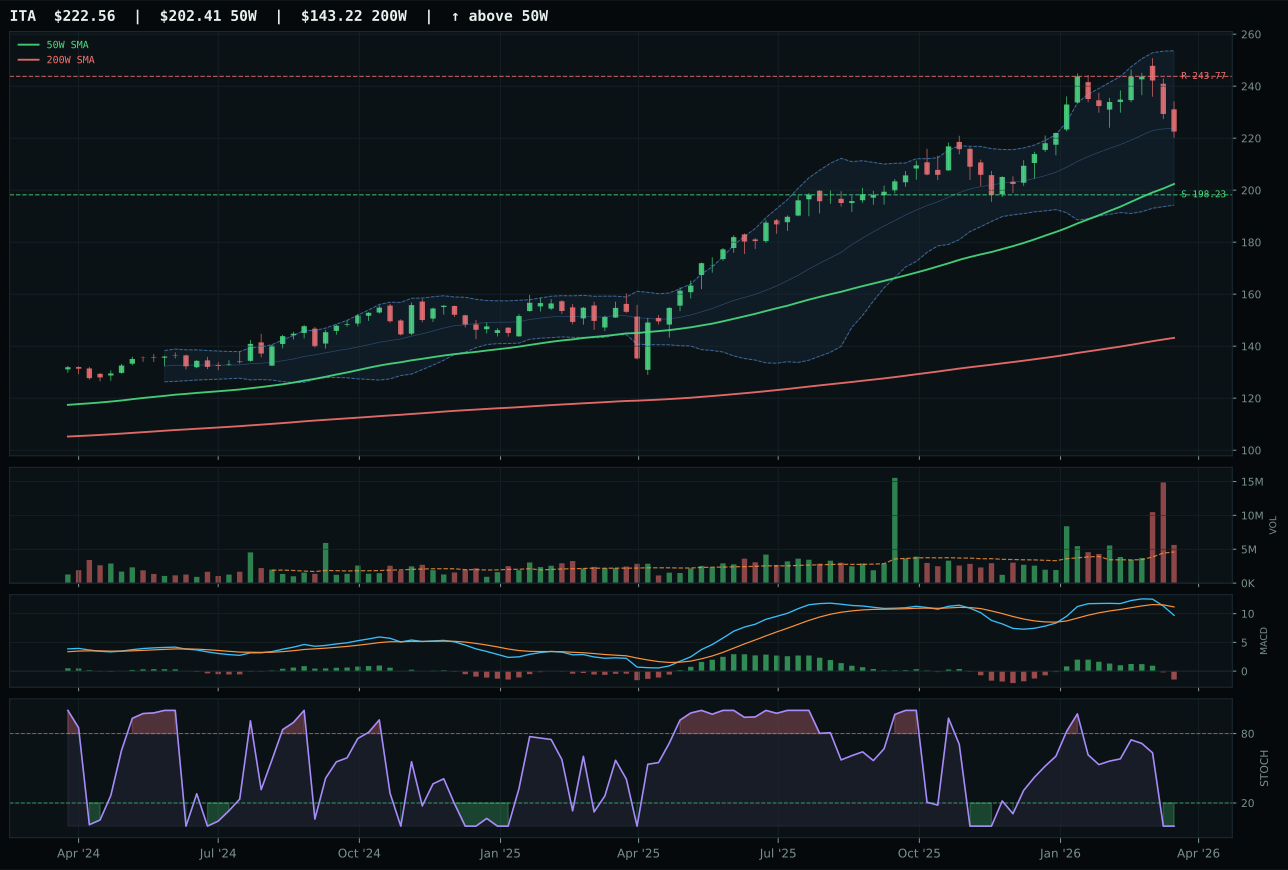
ITA has a neutral structure profile with 8.7% 13-week relative strength versus SPY.
A failed hold above support would weaken the setup.
Actionable but governed by invalidation levels.
XAR wins because it delivers the cleaner risk-reward setup at 56.8 versus ROKT's 46.2, despite both sitting near 50W extremes of extension. XAR's neutral structure with 12.0% RS versus SPY provides steady breadth without the vertical-extension fragility that plagues ROKT at 23.8% RS and 31.8% above the 50W. The defense sector is benefiting from Transition / Mixed macro conditions (plus-3) and defensive rotation (plus-8), but neither creates momentum—both XAR and ROKT register MACD as bearish/weakening and stochastic RSI as oversold. ROKT's 19.1% 13-week return is eye-catching, but it is also stretched further from support, making XAR's more measured +7.3% with 17.6% downside cushion the superior capital deployment decision.
Defense & Aerospace earned 0% allocation this week, ranking ninth or tenth among the ten eligible categories. The 49.5 final score reflects macro headwinds that offset what would normally be respectable charts: the category carries defensive rotation and broad market bear signals (+6 and +8 respectively), creating a structural conflict when measured against the active risk appetite positive descriptor. XAR's trend strength at 92/100 looks impressive on paper, but it arrives without supporting volume confirmation (51.9/100) or momentum evidence (48.2/100), and category macro fit at 50/100 is neutral rather than tailwind. For this allocation slot to flip positive, either the broad market bear signal would need to deactivate or the category would need to demonstrate volume-price confirmation above 70/100 with positive 4W returns. Right now, defensive positioning belongs in XLU and NLR, not in aerospace beta that requires risk appetite to work.
Precious Metals — GLD
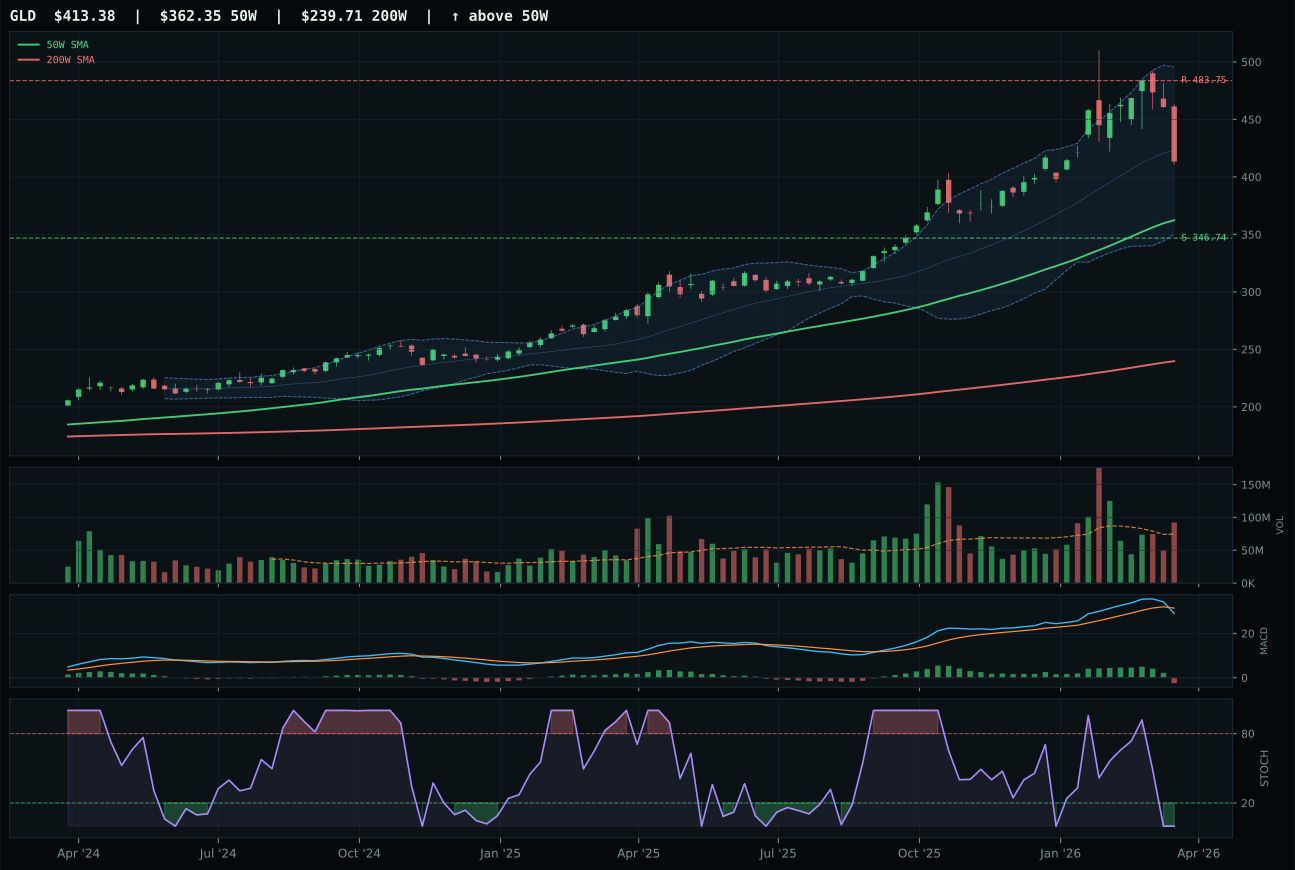
GLD has a neutral structure profile with 8.3% 13-week relative strength versus SPY.
A failed hold above support would weaken the setup.
Actionable but governed by invalidation levels.
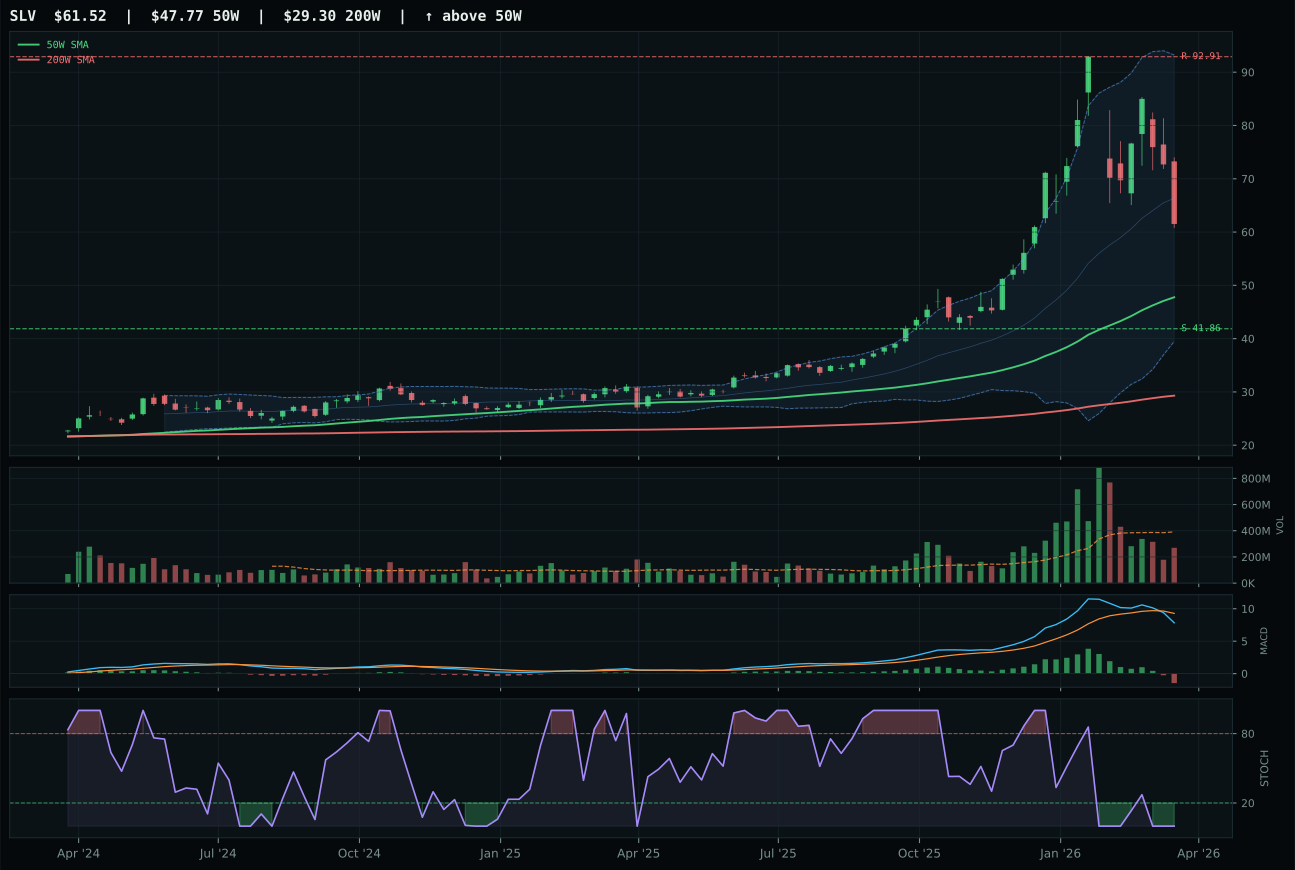
SLV has a vertical extension profile with 5.7% 13-week relative strength versus SPY.
A failed hold above support would weaken the setup.
Actionable but governed by invalidation levels.
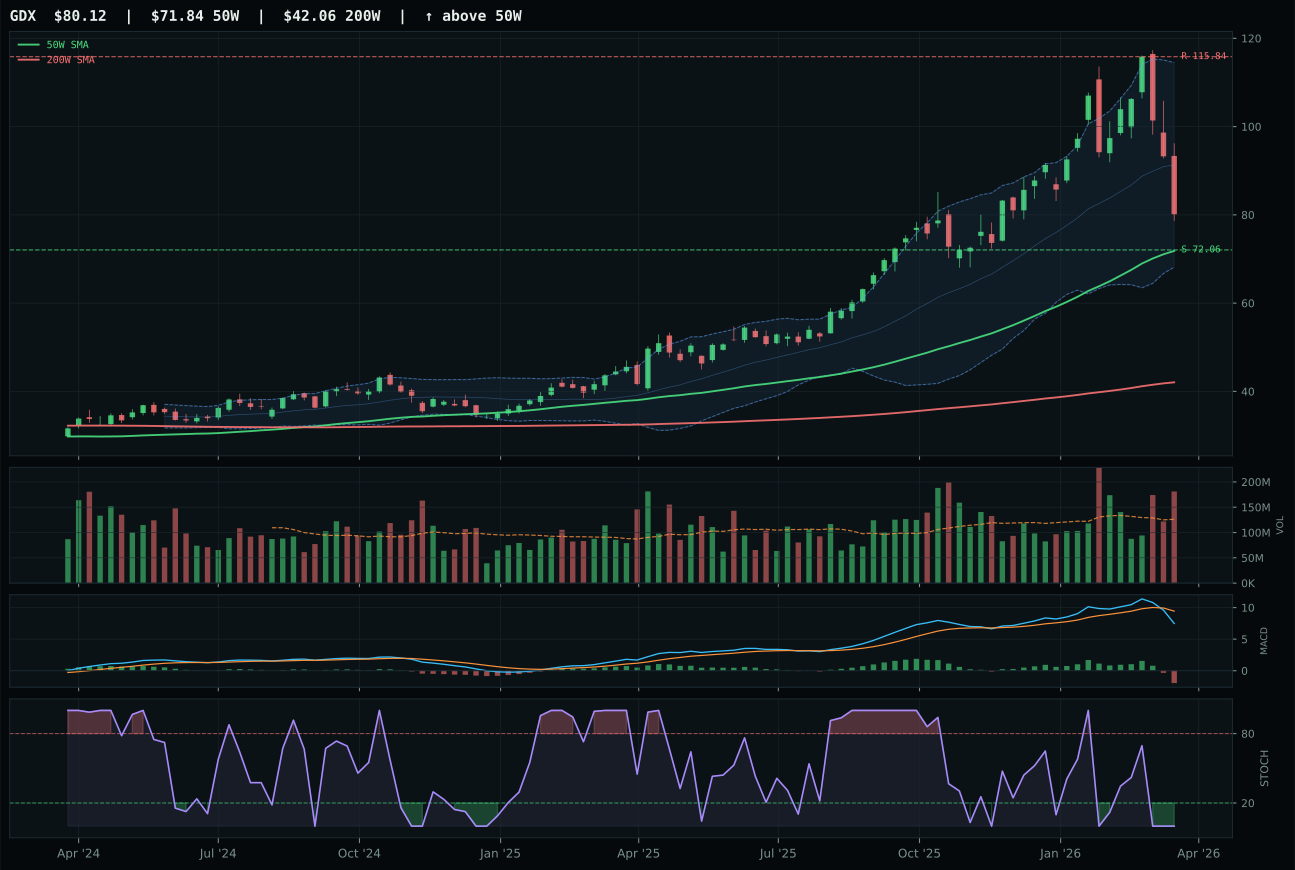
GDX has a neutral structure profile with -4.0% 13-week relative strength versus SPY.
A failed hold above support would weaken the setup.
Actionable but governed by invalidation levels.
GLD wins because it offers the cleanest risk-reward setup at 66.6 with a timing score of 77.0, positioning price 14.1% above the 50W as an early-rebound candidate rather than a late-stage chase. Above-average volume participation at 1.24x the 20W average confirms accumulation, and MACD, while still bearish, is oversold at stochastic RSI 0.00—a classic oversold-bounce candidate. SLV, the runner-up, is stretched 28.8% above the 50W with timing at only 55.0 and thin volume support, placing it in the highest-risk zone of the retracement. The 37.6-point score gap is substantial because GLD's safer entry point and better volume confirmation matter more than SLV's marginally better RS readings in a defensive context where preservation outweighs aggressive positioning.
Precious Metals earned 0% allocation, ranking outside the top eight eligible slots despite 65/100 macro fit from active monetary hedge bid (+14) and defensive rotation (+6). The 42.8 final score is dragged down by technical evidence at 50.1/100 and weak volume-price confirmation at 45.2/100: GLD's timing advantage over SLV is not sufficient to overcome the category's fundamental lack of participation relative to real assets and energy. The macro regime is Transition/Mixed, which reduces the urgency of pure monetary hedges when supply shortage and energy scarcity signals are firing more consistently. GLD would need to break above 483.75 resistance on volume acceleration above 1.5x, or the broad market bear signal would need to intensify into a hard risk-off environment, for this category to earn reallocation. Until then, the allocation prefers commodities with positive momentum (WEAT, REMX, XOP) over the sideways grind of metal equities waiting for macro inflection. Precious metals remain on watch, not in portfolio.