
2026-03-13
Informational purposes only. The content in this report, including allocations, analysis, and commentary, is provided solely for informational and educational purposes. It does not constitute financial advice, investment advice, trading advice, or any other type of advice. Past performance does not guarantee future results. Always conduct your own research and consult a qualified financial professional before making investment decisions.
Weekly Allocation
| Ticker | Category | Weight | Role |
|---|---|---|---|
| XOP | Traditional Energy | 20% | Top-2 (20%) |
| XLU | Utilities & Infrastructure | 20% | Top-2 (20%) |
| COPX | Industrial Metals | 10% | Tier-2 (10%) |
| WEAT | Agriculture & Livestock | 10% | Tier-2 (10%) |
| AIQ | AI | 10% | Tier-2 (10%) |
| SLV | Precious Metals | 10% | Tier-2 (10%) |
| NLR | Nuclear Energy | 10% | Tier-2 (10%) |
| ITA | Defense & Aerospace | 10% | Tier-2 (10%) |
Trade Instructions — Monday Open
Sell the tranche from 2026-02-13 (completing its 4-week hold). Buy the new tranche. Instructions show net portfolio changes — same-asset positions cancel, weight changes show the delta.
| Action | Ticker | Instruction |
|---|---|---|
| SELL | XLE | Sell 25% of XLE position (reduce 20.00% → 15.00%) |
| SELL | COPX | Sell 33% of COPX position (reduce 7.50% → 5.00%) |
| SELL | IGF | Sell entire IGF position (2.50% of portfolio) |
| SELL | ILF | Sell entire ILF position (2.50% of portfolio) |
| SELL | BOTZ | Sell 33% of BOTZ position (reduce 7.50% → 5.00%) |
| SELL | URNM | Sell entire URNM position (2.50% of portfolio) |
| SELL | GLD | Sell 20% of GLD position (reduce 12.50% → 10.00%) |
| BUY | NLR | Buy NLR — 12.50% of freed cash (adds 2.50% to portfolio) |
| BUY | XLU | Buy XLU — 25.00% of freed cash (adds 5.00% to portfolio) |
| BUY | WEAT | Buy WEAT — 12.50% of freed cash (adds 2.50% to portfolio) |
| BUY | XOP | Buy XOP — 25.00% of freed cash (adds 5.00% to portfolio) |
| BUY | AIQ | Buy AIQ — 12.50% of freed cash (adds 2.50% to portfolio) |
| BUY | SLV | Buy SLV — 12.50% of freed cash (adds 2.50% to portfolio) |
Current Portfolio After Trade
Combined holdings across all 4 active tranches. Each tranche is 25% of the portfolio.
| Ticker | % of Portfolio | Weight Bar |
|---|---|---|
| XLE | 15.00% | |
| XLU | 12.50% | |
| GLD | 10.00% | |
| NLR | 10.00% | |
| ITA | 7.50% | |
| REMX | 7.50% | |
| COPX | 5.00% | |
| BOTZ | 5.00% | |
| MOO | 5.00% | |
| IEMG | 5.00% | |
| WEAT | 5.00% | |
| XOP | 5.00% | |
| IGV | 2.50% | |
| AIQ | 2.50% | |
| SLV | 2.50% |
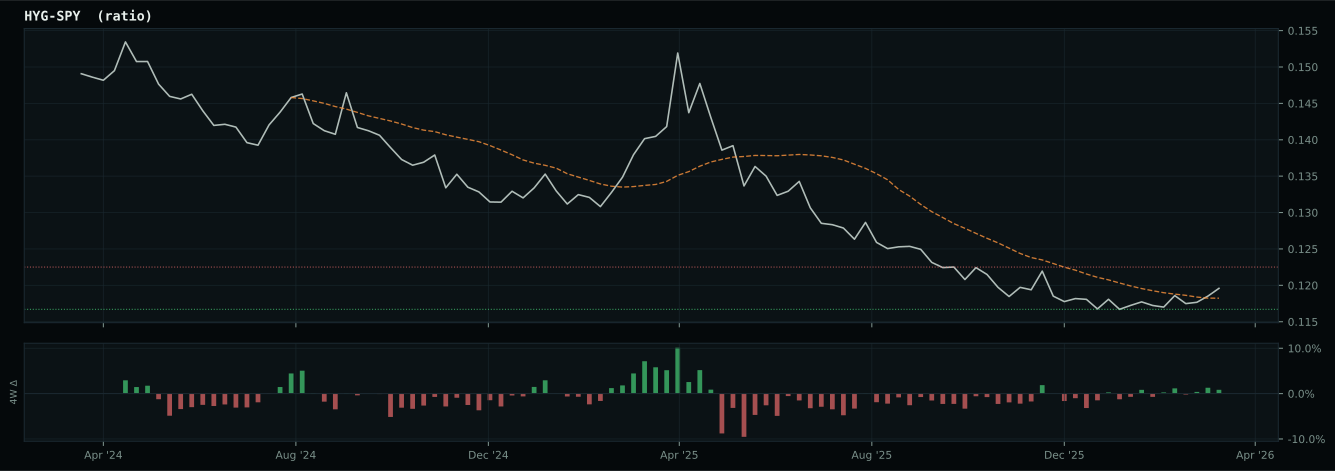
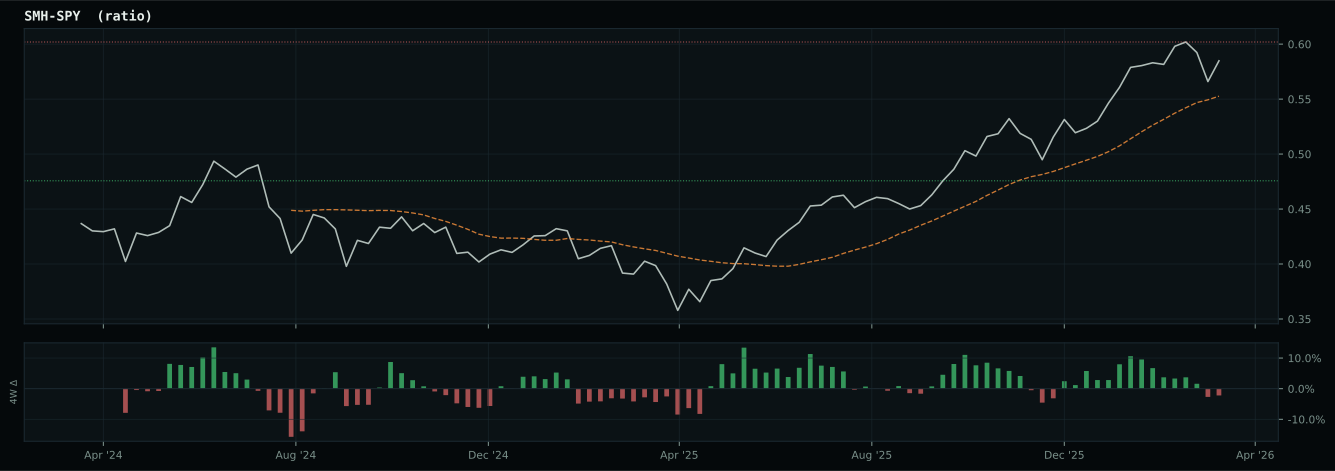
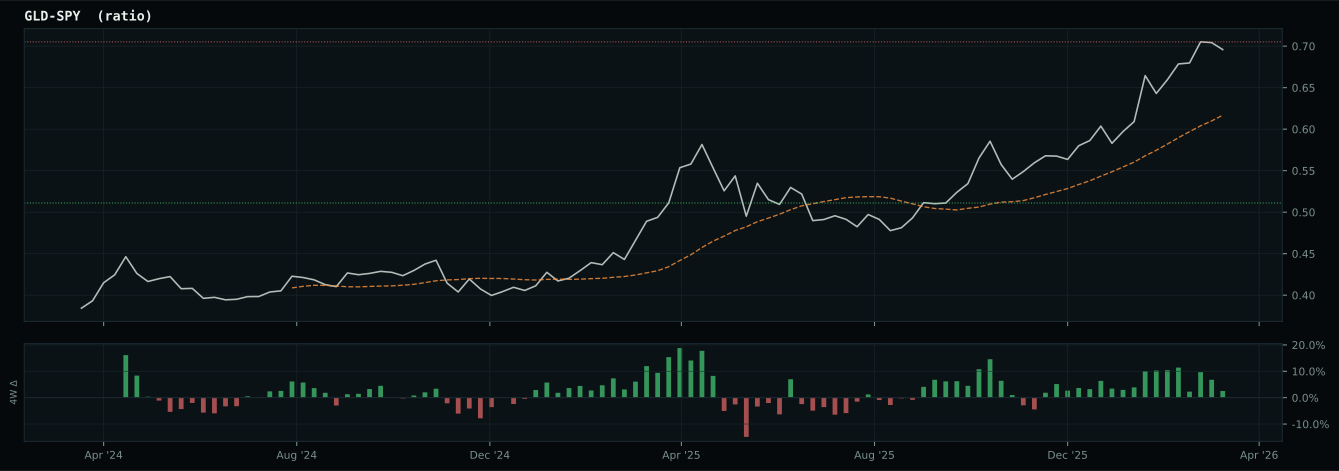
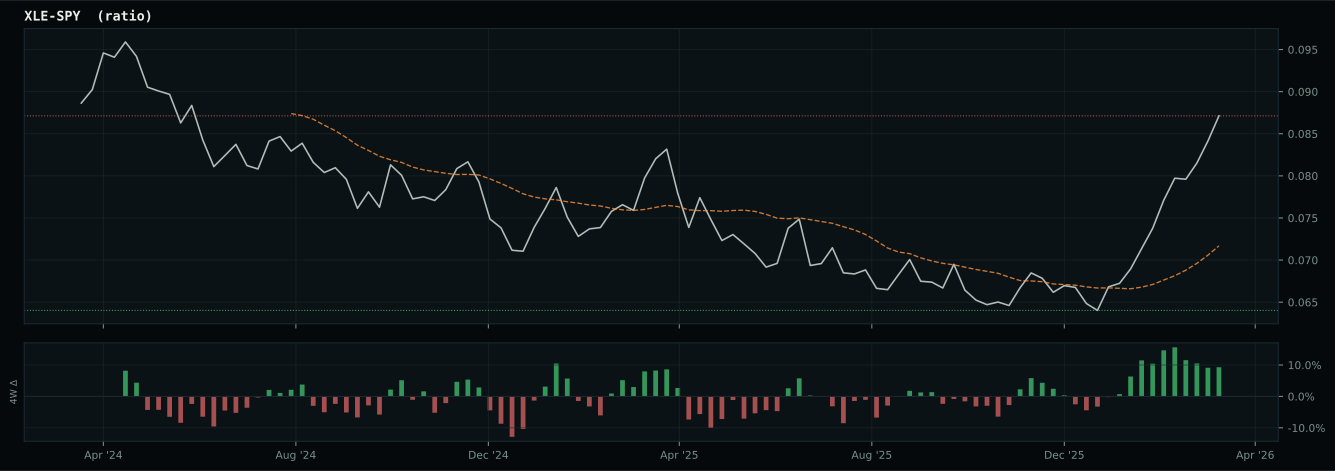
Macro Regime — Transition / Mixed
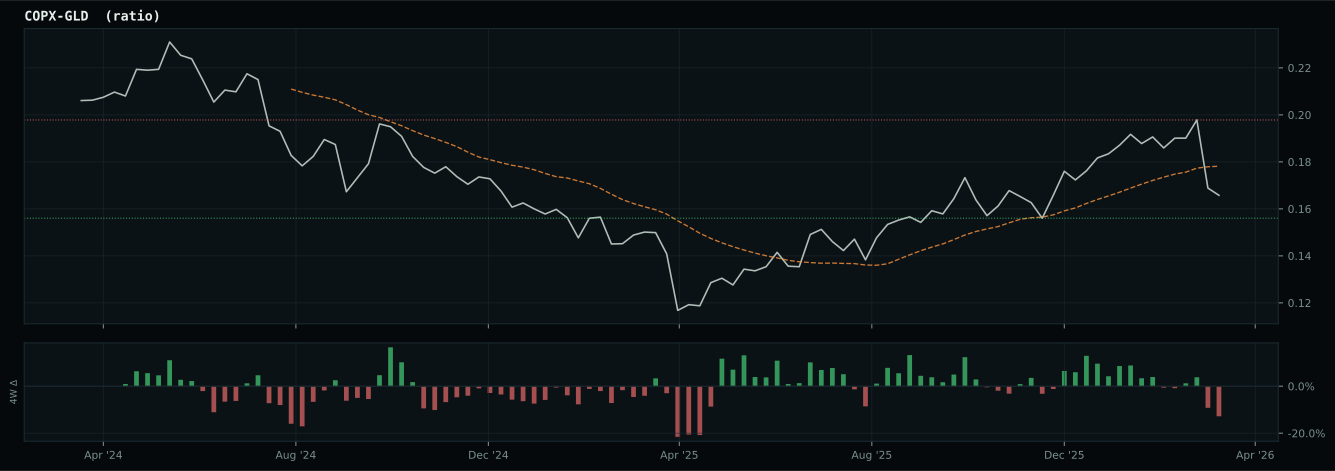
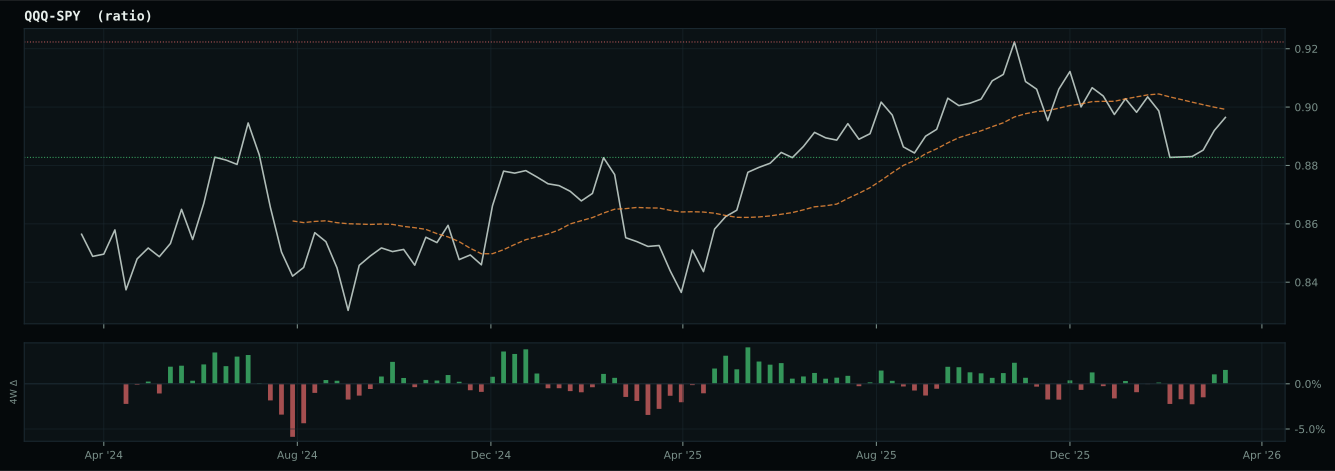
Macro Evidence Charts
Market-implied signals behind the macro regime scores. Each ratio compares two assets; the direction and slope of the ratio is what the macro engine reads.
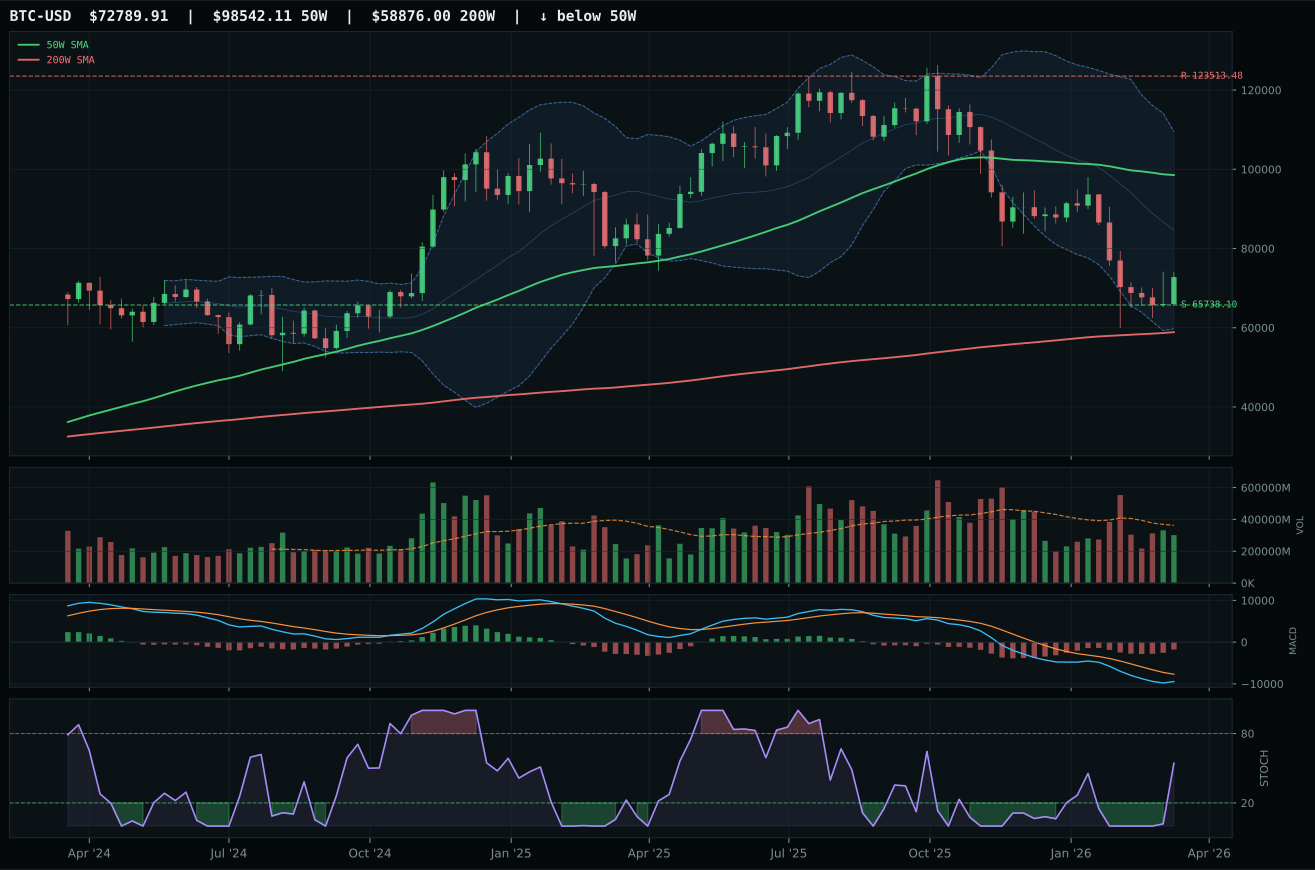
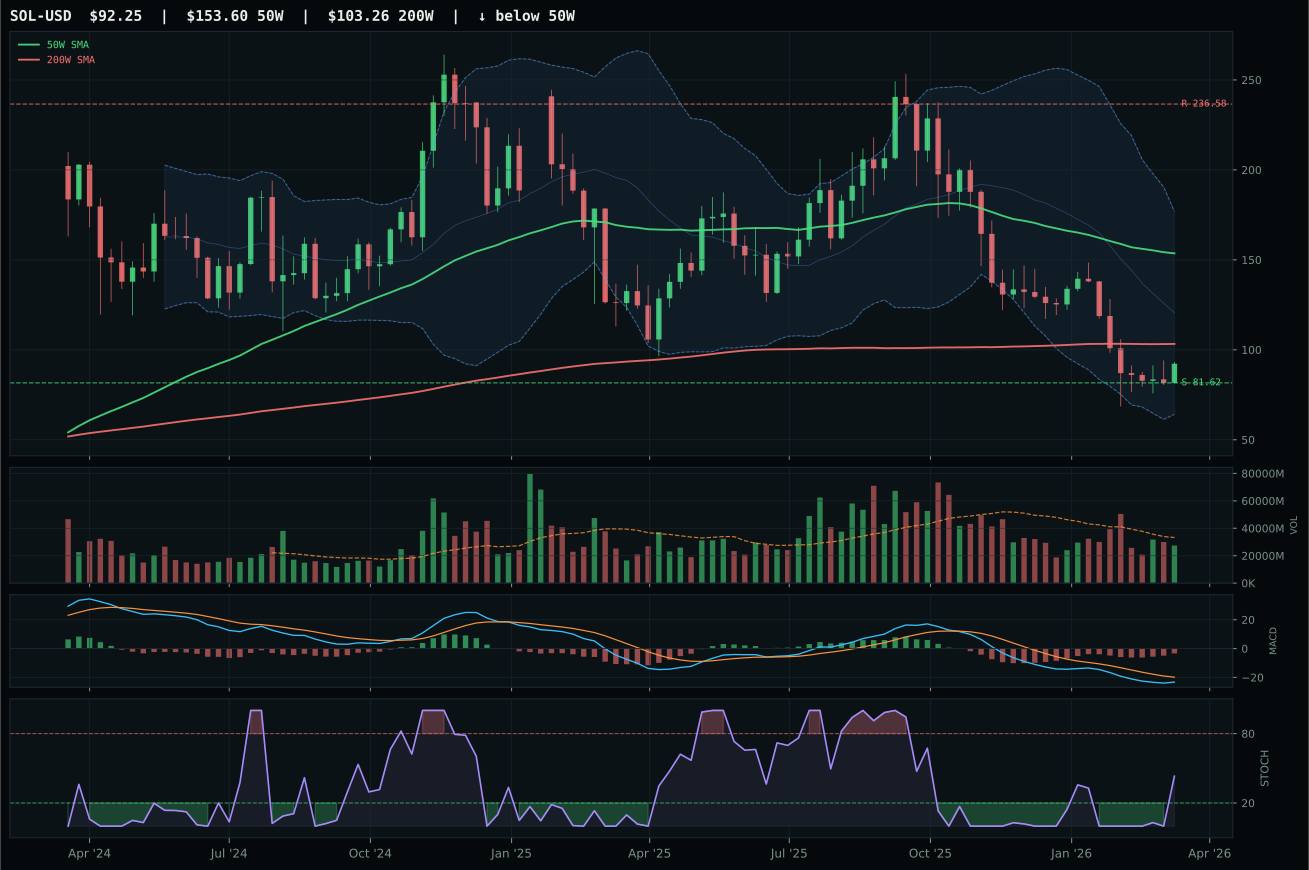
Crypto Regime — NoCrypto
ValueBTC armed by first 200W buy-zone touch, but post-touch range age is 5 weeks; minimum is 12
TrendBTC not confirmed
one or more available conditions failed
Category Rankings
| Rank | Category | Winner | Score | Alloc | 4W Ret | Peers (4W) |
|---|---|---|---|---|---|---|
| 1 | Traditional Energy | XOP | 93.0 | 20% | +1.89% | FCG +2.4% · XLE -0.2% |
| 2 | Utilities & Infrastructure | XLU | 63.3 | 20% | -1.29% | IGF +1.8% · PAVE +6.7% |
| 3 | Industrial Metals | COPX | 58.2 | 10% | +5.87% | REMX +3.7% · PICK +9.1% |
| 4 | Agriculture & Livestock | WEAT | 58.0 | 10% | -4.36% | MOO +1.2% · VEGI +1.4% |
| 5 | AI | AIQ | 55.0 | 10% | -0.04% | SMH +10.0% · BOTZ -0.4% |
| 6 | Precious Metals | SLV | 54.3 | 10% | -8.31% | GLD -5.7% · GDX +5.0% |
| 7 | Nuclear Energy | NLR | 53.0 | 10% | -2.00% | URNM -1.2% · URA +1.0% |
| 8 | Defense & Aerospace | ITA | 44.2 | 10% | -1.12% | XAR -0.3% · ROKT +8.7% |
| 9 | Emerging Markets | IEMG | 43.2 | 0% | +3.38% | ILF +11.6% · INDA +0.7% |
| 10 | Technology | IGV | 42.0 | 0% | -11.64% | XLK +2.6% · CIBR -7.1% |
Traditional Energy — XOP
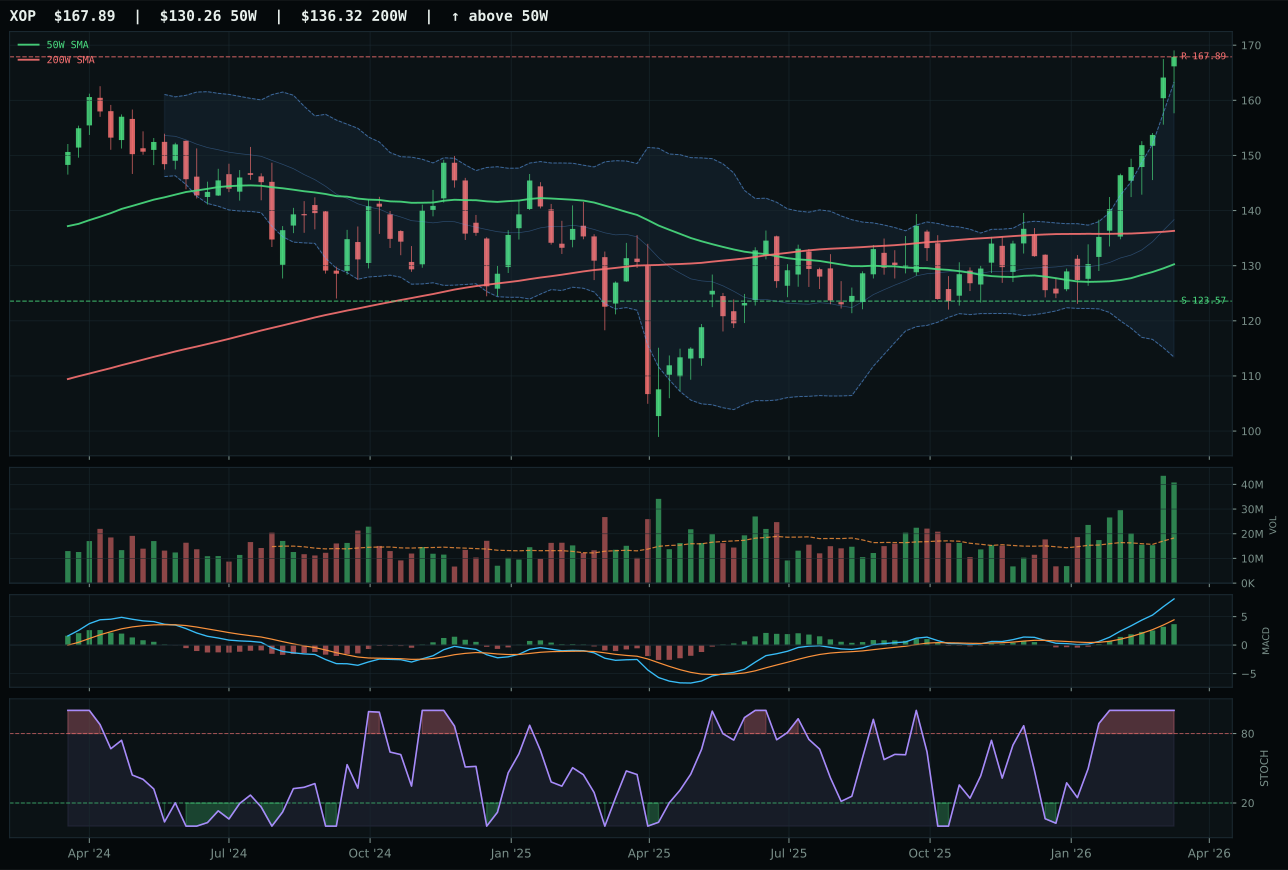
XOP has a vertical extension profile with 30.3% 13-week relative strength versus SPY.
A failed hold above support would weaken the setup.
Actionable but governed by invalidation levels.
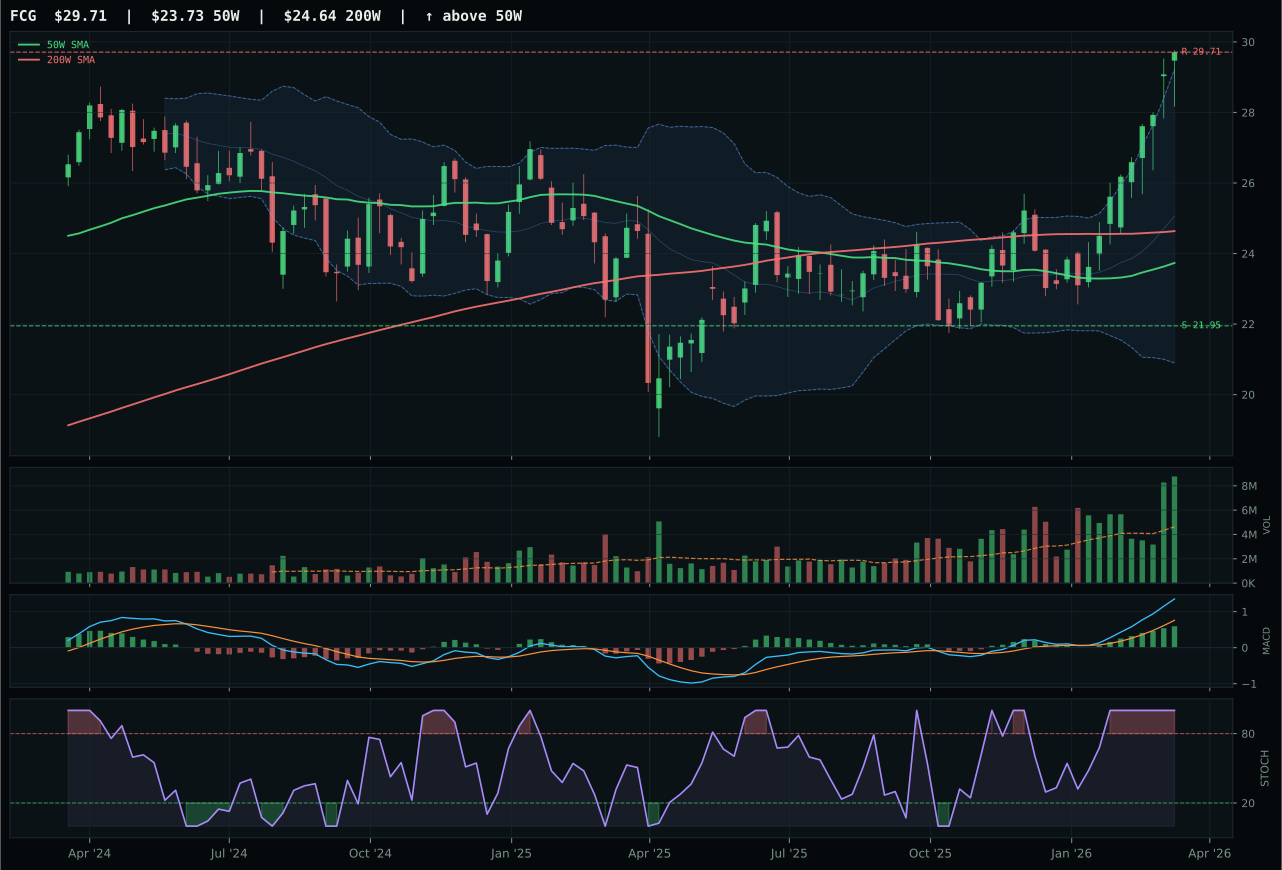
FCG has a vertical extension profile with 26.2% 13-week relative strength versus SPY.
A failed hold above support would weaken the setup.
Actionable but governed by invalidation levels.
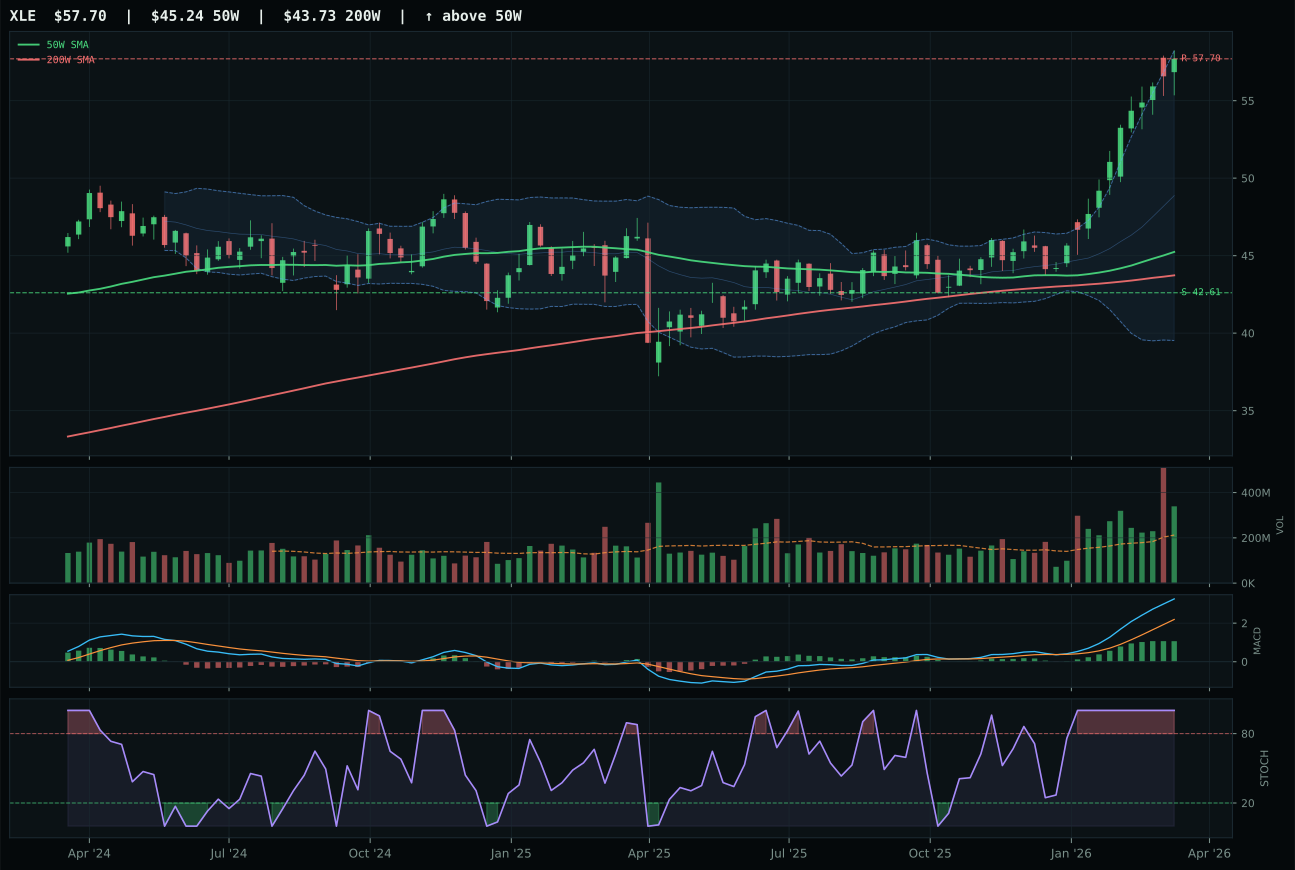
XLE has a vertical extension profile with 29.6% 13-week relative strength versus SPY.
A failed hold above support would weaken the setup.
Actionable but governed by invalidation levels.
XOP wins the Traditional Energy category and earns top-2 status because it combines the category's strongest technical evidence (93.4/100) with clean macro sponsorship and verifiable volume confirmation. Price sits 28.9% above the 50W, which would normally disqualify an entry, but the 2.23x volume accumulation/confirmation and perfect 100/100 momentum score (27.5% 13W return, bullish-improving MACD, overbought stochastic momentum) reveal that institutional demand is still accelerating. The comparison to FCG is instructive: FCG shows identical technical trend (100) and timing (37), but XOP's 30.3% RS versus SPY versus FCG's 26.2% and category-relative strength of 0.7% versus FCG's -3.4% mark XOP as the true leader. When energy sentiment is this strong, category relative strength becomes the tiebreaker—the market is backing XOP specifically as exploration leverage. Structure is genuinely clean (83.3 cleanliness) with defined support at 123.57 and resistance at 167.89; the setup is not a spike but a persistent climb.
Traditional Energy earned 20% allocation and top-2 ranking because the category score of 93.0 is the highest in the portfolio, driven by exceptional macro fit (92/100) and powerful technical evidence. Energy scarcity (+16), inflation pressure (+10), supply shortage (+9), and real asset sponsorship (+7) create a narrative consensus that is nearly impossible to dismiss in a Transition/Mixed regime. XOP's volume-price confirmation at 88.8/100 and persistence at 93.1/100 signal that this is not a bubble-phase spike but a sustained shift in capital allocation toward energy. The 20% allocation is appropriate because it reflects the category's rank among peers while respecting the extended entry price by sizing the position to allow for consolidation without forced additional accumulation. Risk management is built in: XOP's upside to resistance is technically capped at the 52-week high near 167.89, offering a defined exit if macro support reverses. This is the rare category where both technical evidence and macro narrative align strongly enough to justify maximum allocation weight.
Utilities & Infrastructure — XLU
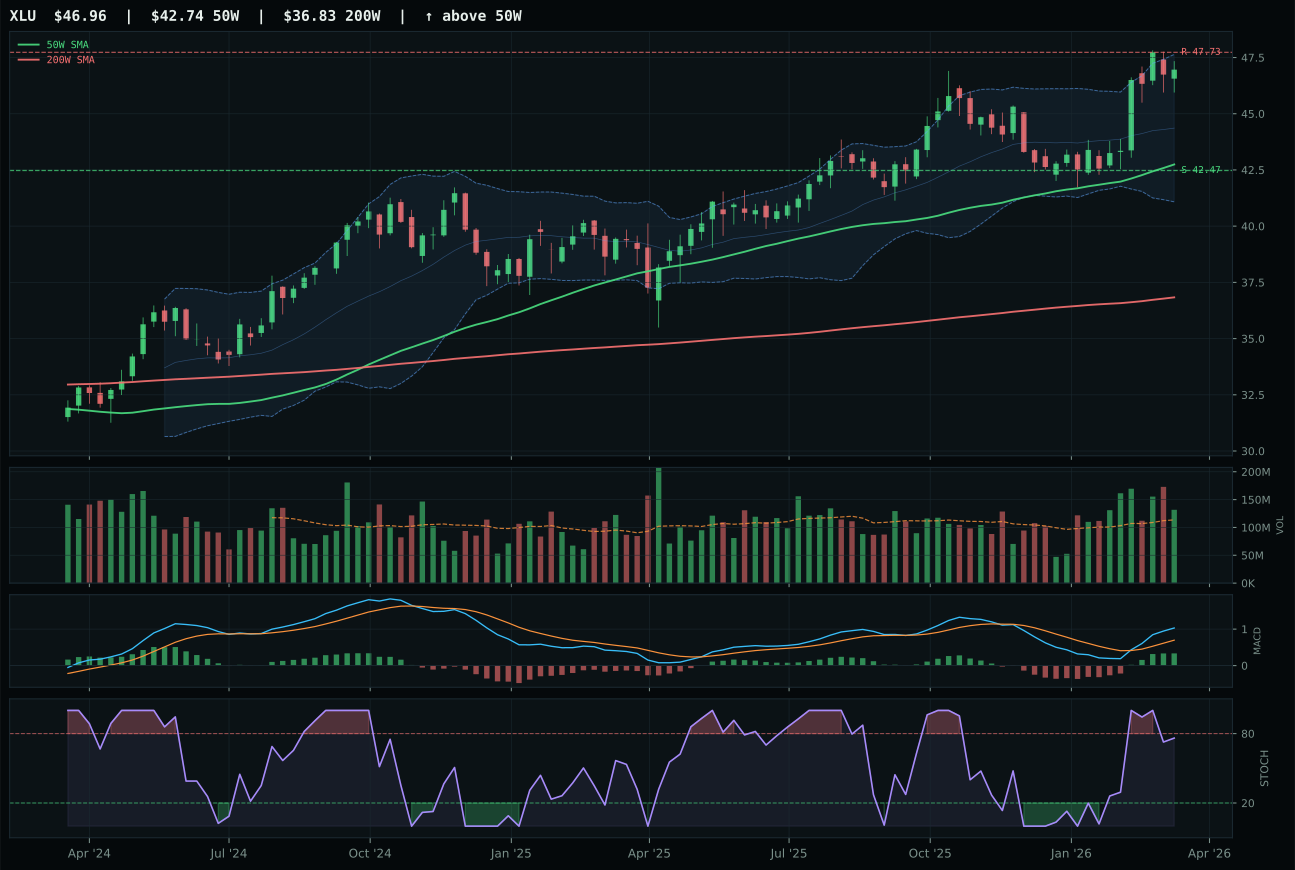
XLU has a neutral structure profile with 12.5% 13-week relative strength versus SPY.
A failed hold above support would weaken the setup.
Actionable but governed by invalidation levels.
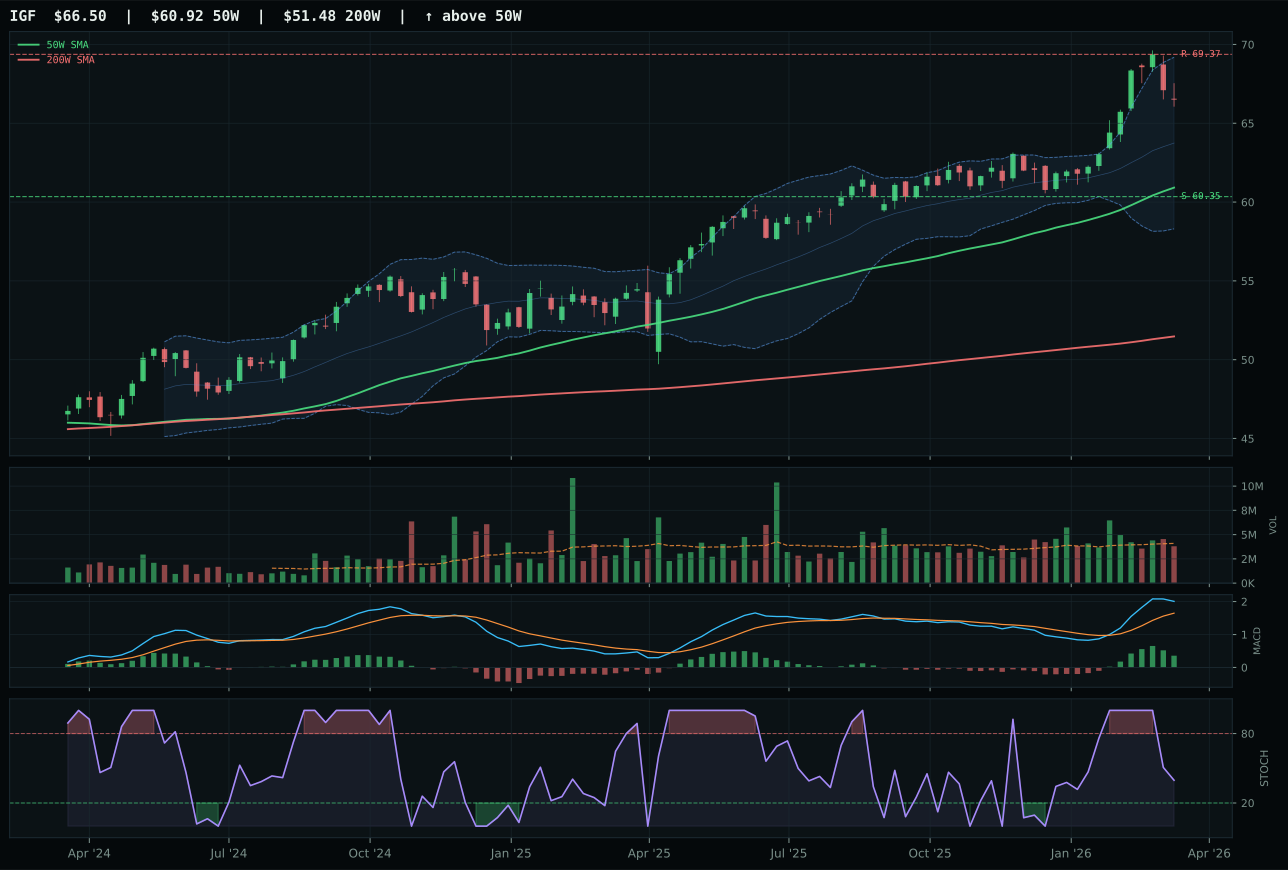
IGF has a neutral structure profile with 10.0% 13-week relative strength versus SPY.
A failed hold above support would weaken the setup.
Actionable but governed by invalidation levels.
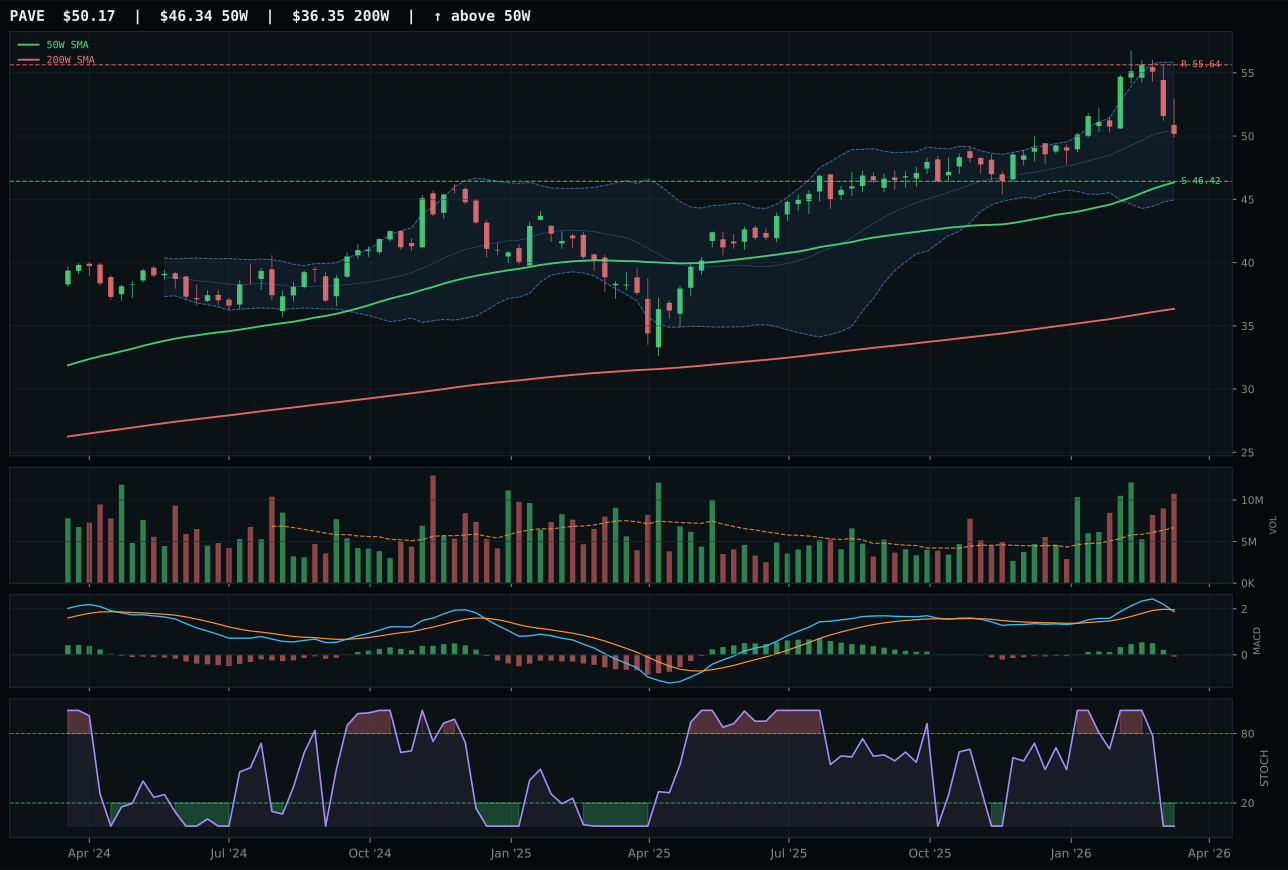
PAVE has a neutral structure profile with 5.1% 13-week relative strength versus SPY.
A failed hold above support would weaken the setup.
Actionable but governed by invalidation levels.
XLU wins Utilities & Infrastructure and earns top-2 status because it combines perfect trend structure (100/100) with confirmed buying pressure and superior oscillator alignment. Price sits 9.9% above the 50W with MACD bullish and improving and stochastic RSI falling/neutral at 0.76—a pattern that allows for further appreciation without requiring fresh overbought extremes. The momentum confirmation score is perfect at 100/100, supported by 9.6% 13-week return and 12.5% RS versus SPY with category-relative strength of 2.5%, confirming that XLU is leading its basket peers IGF and PAVE. IGF shows superior trend (100) but weaker MACD (bullish but flattening) and weaker volume (neutral), creating a setup where momentum is already rolling over. XLU's above-average participation at 1.16x indicates that liquidity is still present to support further price movement. The structure is genuinely neutral—not a violent extension, not a tight compression—allowing for orderly accumulation without panic.
Utilities & Infrastructure earned 20% allocation and top-2 ranking despite modest macro fit (56/100) because technical evidence is exceptional (87.2/100) and the category score of 63.3 ranks second among all ten categories. Defensive rotation (+12) and the Transition/Mixed macro state (+4) provide sufficient narrative support, even as inflation pressure carries a -6 headwind. What elevates XLU to top-2 status is the combination of: perfect trend, bullish-improving MACD, category leadership within the basket, and volume-price confirmation at 82.8/100. This is a category where technical strength is so clear that it overrides modest macro fit. The 20% allocation respects both the technical evidence and the defensive rotation narrative in a regime where equity risk is transitioning. Risk is built-in via tight risk/reward (39.8/100), which means XLU is already fairly valued; the allocation size allows for consolidation without forced follow-up buying. The case for XLU is simple: when trend is perfect and oscillators confirm, size accordingly, regardless of whether macro enthusiasm is at peak.
Industrial Metals — COPX
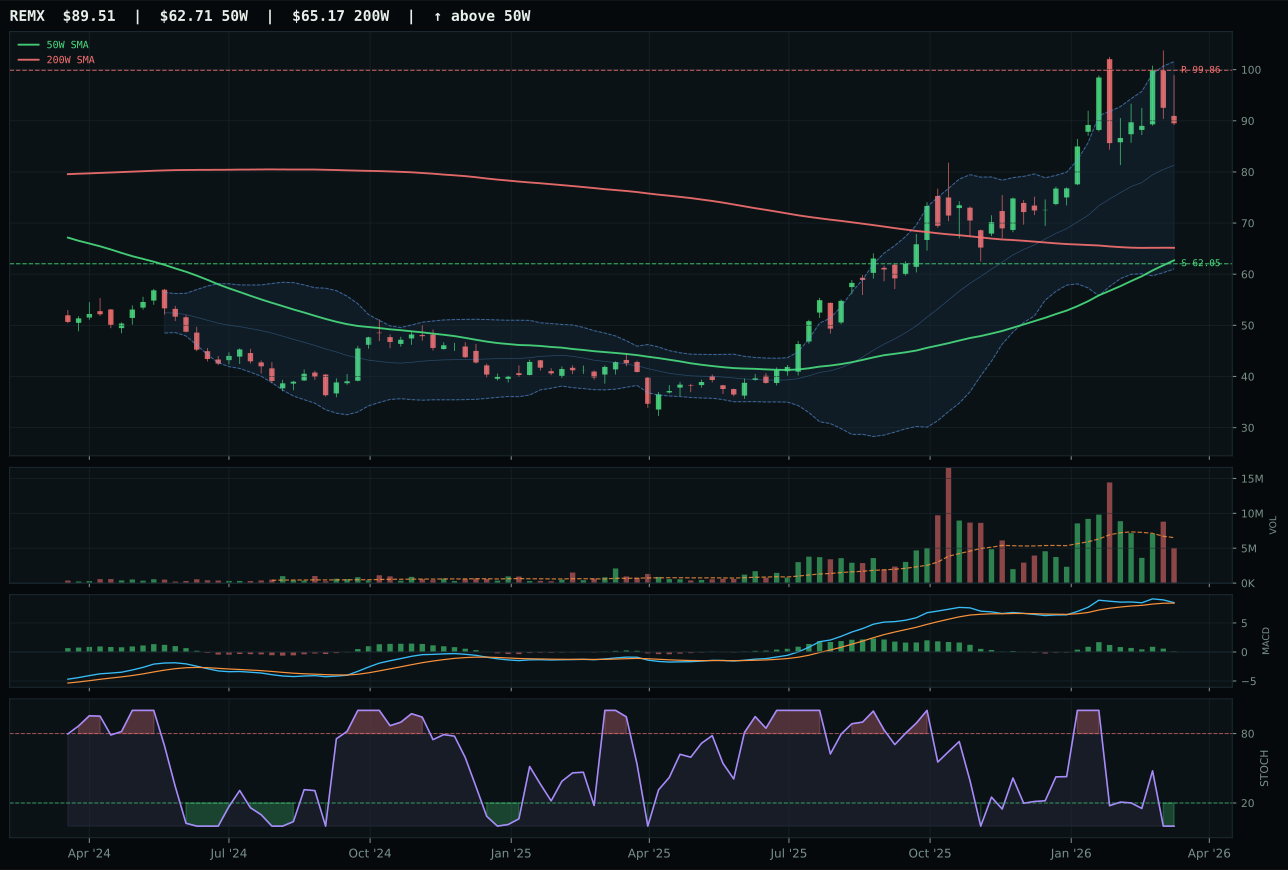
REMX has a vertical extension profile with 26.4% 13-week relative strength versus SPY.
A failed hold above support would weaken the setup.
Actionable but governed by invalidation levels.
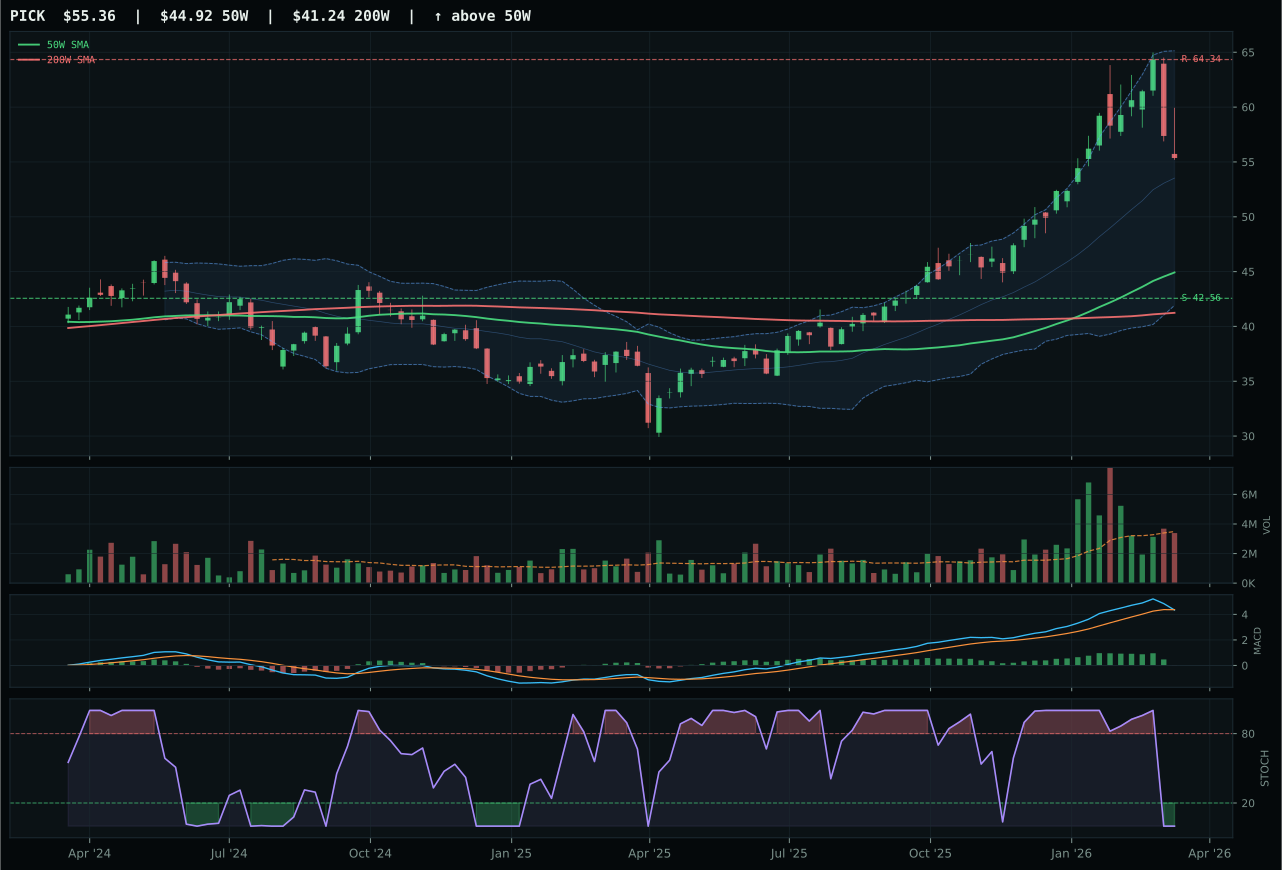
PICK has a vertical extension profile with 14.2% 13-week relative strength versus SPY.
A failed hold above support would weaken the setup.
Actionable but governed by invalidation levels.
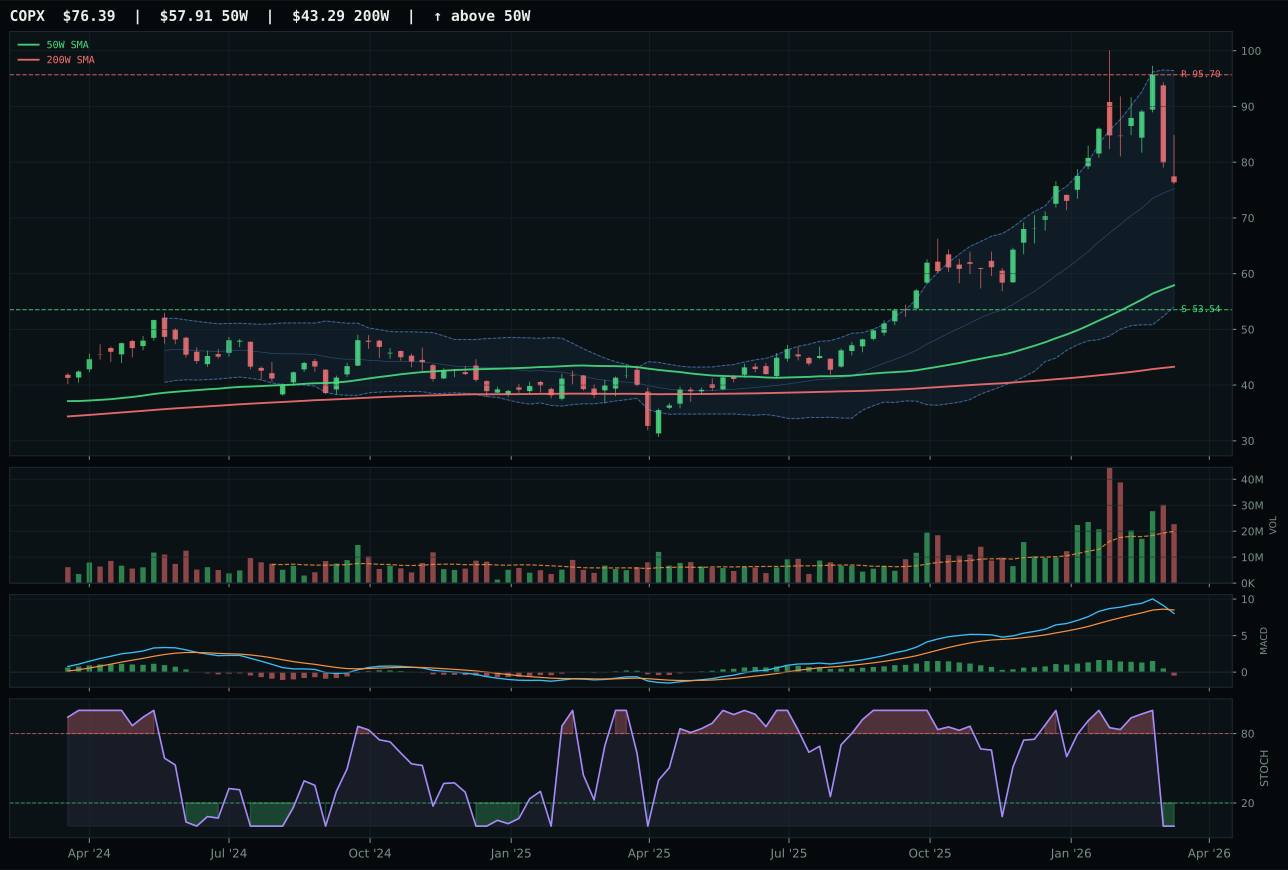
COPX has a vertical extension profile with 15.0% 13-week relative strength versus SPY.
A failed hold above support would weaken the setup.
Actionable but governed by invalidation levels.
COPX wins Industrial Metals despite REMX's superior trend (96 vs 92) and higher momentum (100 vs 53) because risk/reward and volume confirmation favor the less extended choice. COPX trades 31.9% above the 50W with 1.14x above-average participation volume, while REMX extends 42.7% and carries only neutral volume. REMX's bullish-but-flattening MACD is a warning sign—momentum is rolling, which combined with extreme extension creates a setup where any disappointment triggers sharp mean reversion. COPX's bearish/weakening MACD paired with above-average participation suggests accumulation is still functioning; the move has not yet exhausted sponsorship. The risk/reward calculation is stark: COPX offers 20.2% downside to support versus 42.7% for REMX, while upside is capped at similar levels. Metals are scarcity plays, and scarcity should be bought on the less-extended vehicle when oscillators are aligned. REMX's 23.5% 13-week return looks better than COPX's 12.1%, but that outperformance already happened; forward-looking positioning belongs with the name that hasn't yet fully repriced supply concerns.
Industrial Metals earned 10% allocation despite an excellent 80.0/100 macro fit score (metals scarcity at +14, commodity breadth positive at +10) because the category score of 58.2 ranks fourth behind Energy, Utilities, and Agriculture, and because technical evidence is weak at 28.4/100. The macro case is rock-solid: supply shortage, real asset sponsorship, and inflation pressure all support industrial metals demand. However, COPX's entry conditions force the portfolio to choose between macro conviction and timing discipline. Taking 10% respects the supply shortage narrative while refusing to overpay for it on an extended chart. The option to upgrade to 20% exists only if COPX completes a pullback to the 50W (near 74) while maintaining MACD structure, or if REMX corrects sharply and COPX's relative structure improves. This is a category where patience earns a better fill than urgency.
Agriculture & Livestock — WEAT
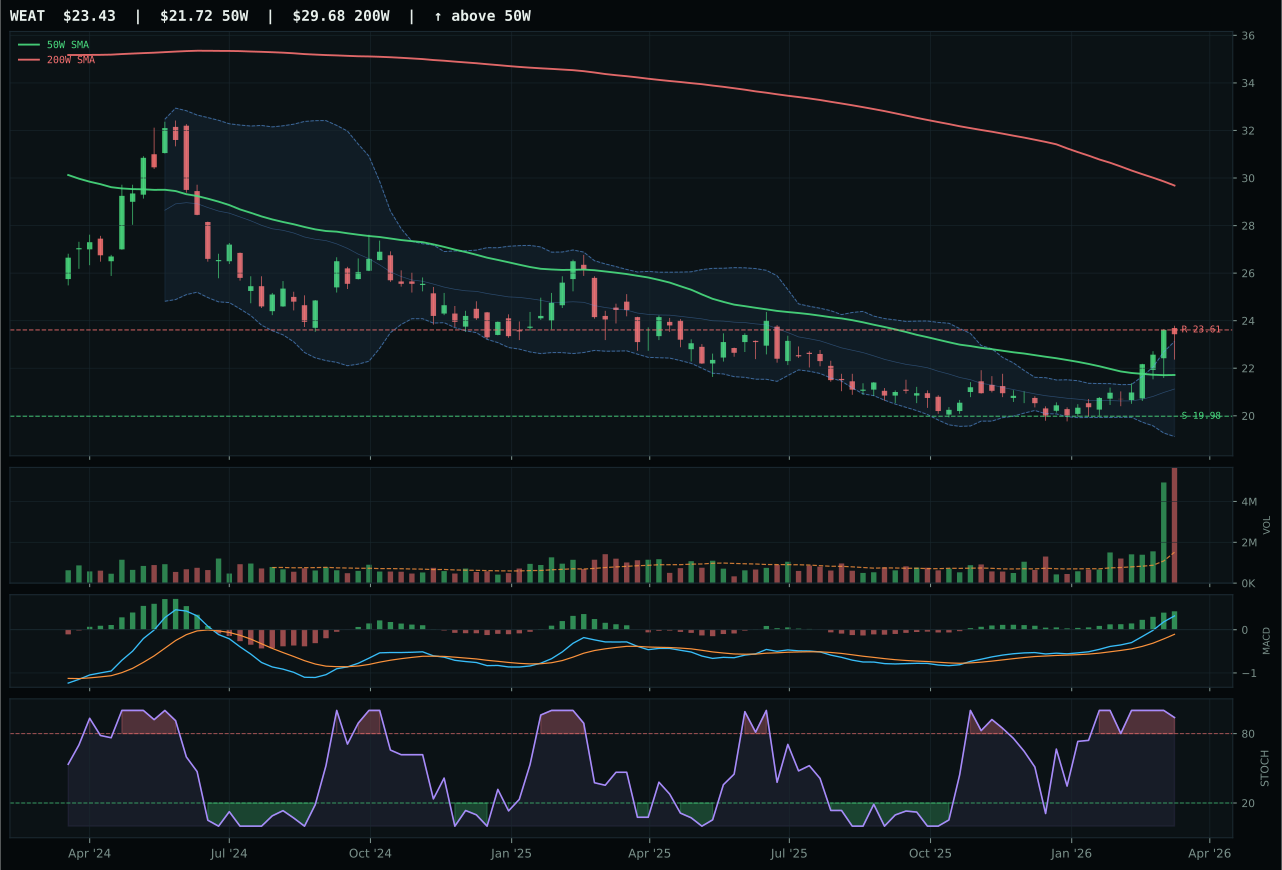
WEAT has a neutral structure profile with 17.0% 13-week relative strength versus SPY.
A failed hold above support would weaken the setup.
Actionable but governed by invalidation levels.
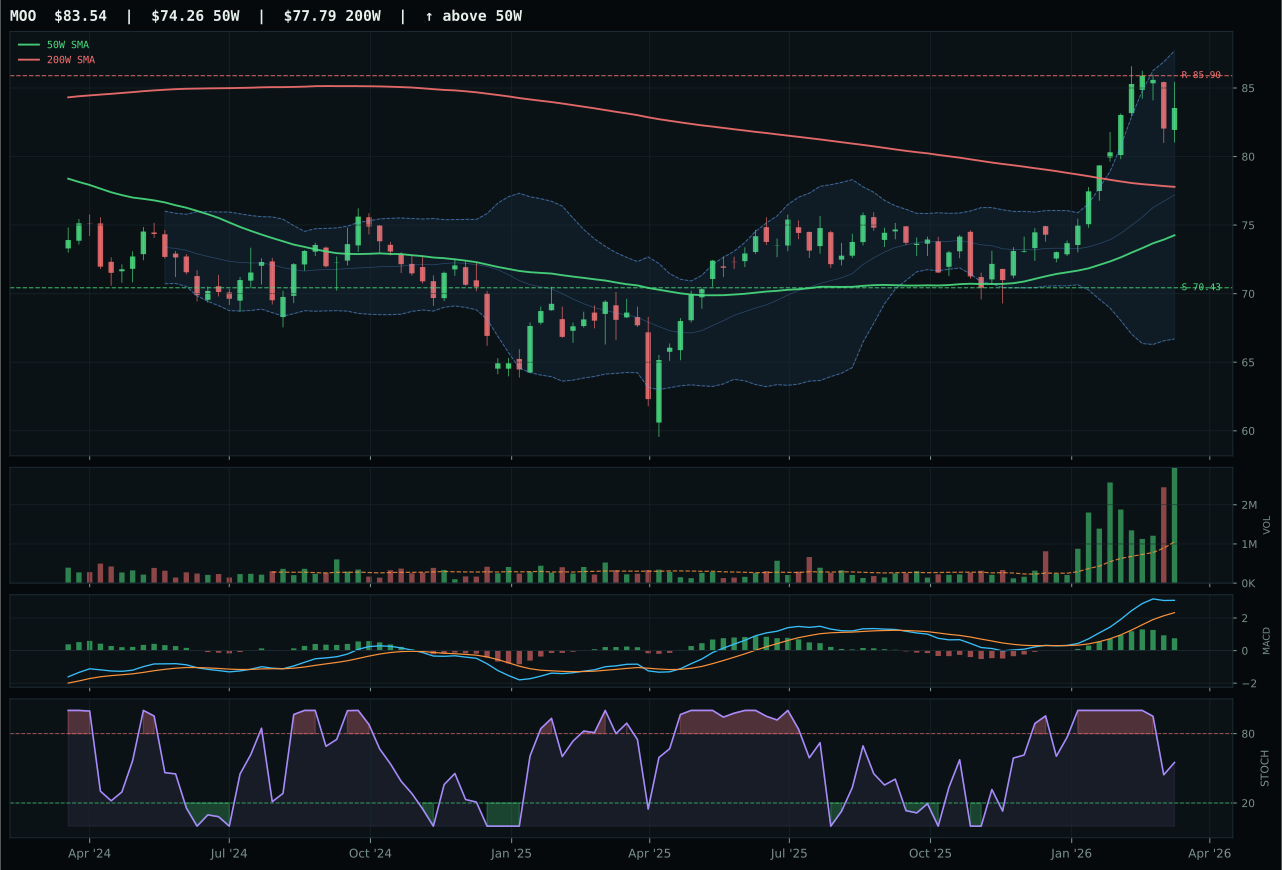
MOO has a neutral structure profile with 15.0% 13-week relative strength versus SPY.
A failed hold above support would weaken the setup.
Actionable but governed by invalidation levels.
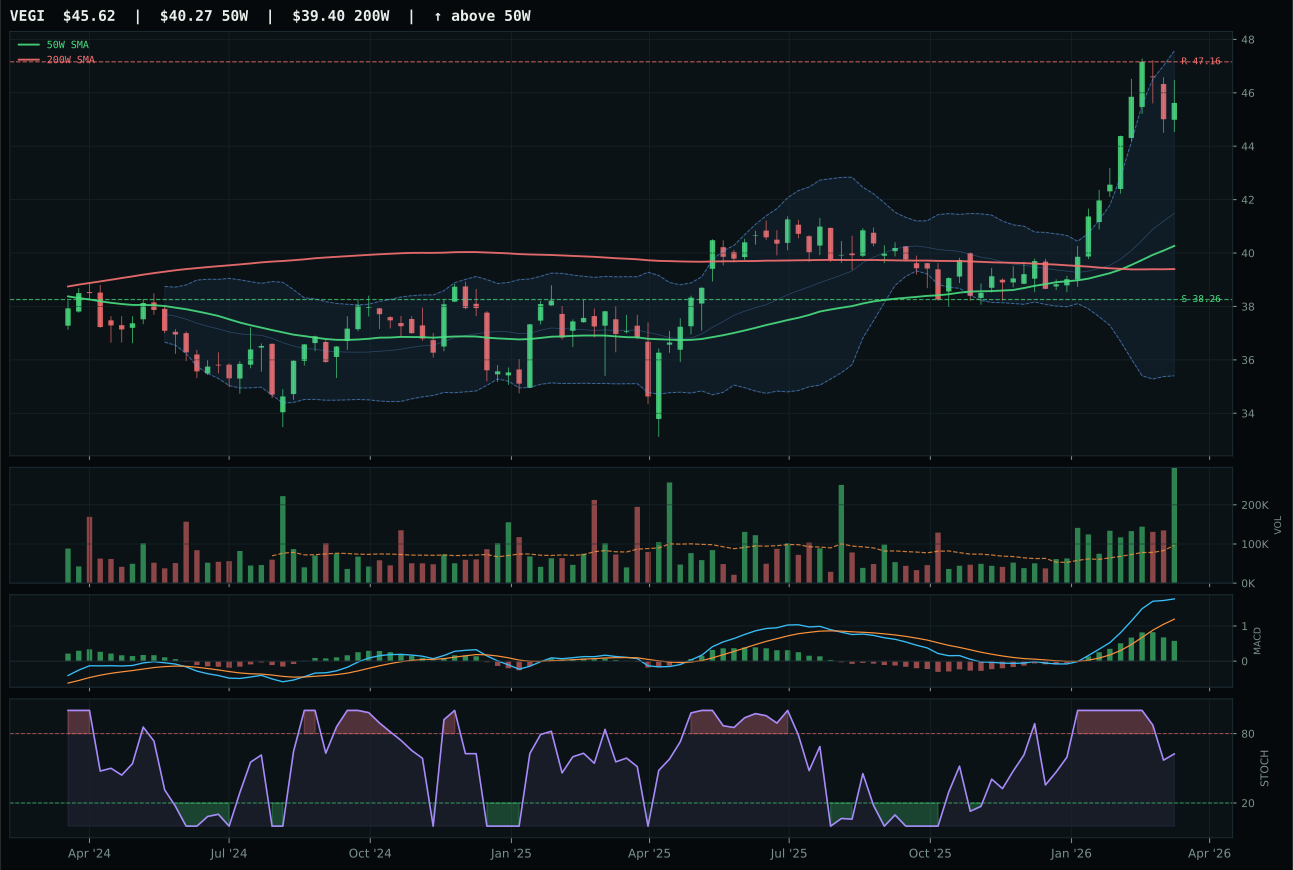
VEGI has a neutral structure profile with 17.8% 13-week relative strength versus SPY.
A failed hold above support would weaken the setup.
Tracked, but not top-2 eligible because: .
WEAT wins Agriculture & Livestock despite MACD and momentum evidence that favors MOO, because category-relative strength alignment and oscillator state matter more in commodity trends than absolute technical superiority. WEAT's momentum confirmation is a perfect 100/100—13W return of 14.1% with MACD bullish and improving and stochastic overbought rolling over—while MOO's momentum is merely 95/100, a subtle but real confirmation difference. MOO is the technical leader on trend (96 vs 80) and risk/reward (53 vs 38), but WEAT maintains category-relative strength at exactly 0.0%, meaning it is neither leading nor lagging the basket, whereas MOO lags at -1.9%. In commodity bulls, the leader often rolls over first; WEAT's neutral category stance with improving MACD suggests the move has further to run. The risk/reward is poor (upside only 0.8% to resistance), which is why momentum confirmation carries extra weight here—if the trend reverses, every penny of extension will be repaid swiftly.
Agriculture & Livestock earned 10% allocation despite a strong 58.0 category score and exceptional 86/100 macro fit because the timing picture remains compromised by extended price and thin downside buffer. Supply shortage, inflation pressure, and real asset sponsorship combined represent perhaps the highest macro conviction in the portfolio, but WEAT's 6.0x volume distribution pressure suggests that institutional buying has already peaked. The category score of 58.0 ranks fourth among ten, below Energy, Utilities, and Industrial Metals, making 10% appropriate rather than greedy. For promotion to 20%, WEAT would need to pull back into support near 19.98 while maintaining MACD structure, which would reset the entry risk from extended to recoil. Alternatively, if commodity breadth broadens and the supply shortage narrative becomes undeniable in real-time, further extension might be forgiven. Current sizing respects the strong macro foundation while acknowledging that timing evidence is deteriorating even as narrative evidence strengthens.
AI — AIQ
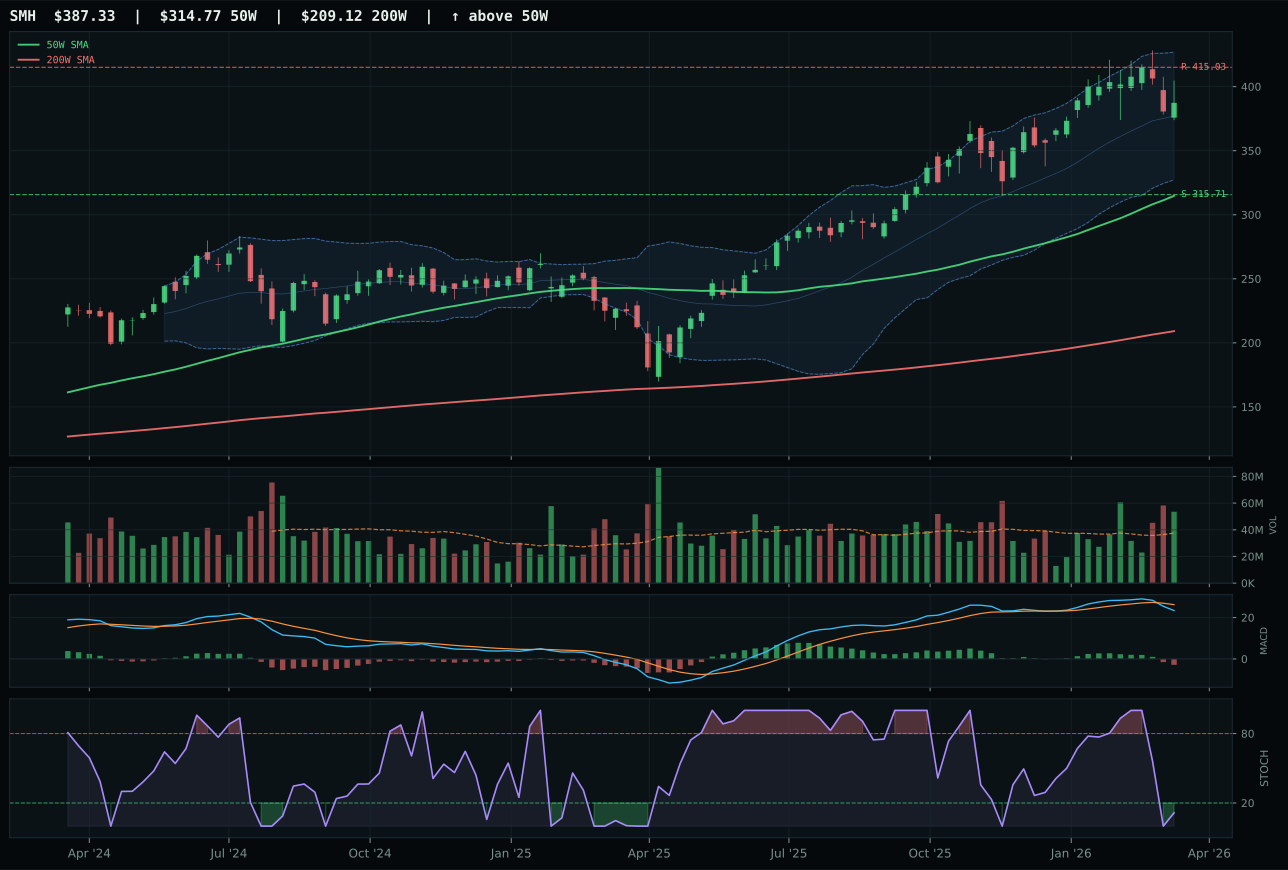
SMH has a vertical extension profile with 12.2% 13-week relative strength versus SPY.
A failed hold above support would weaken the setup.
Actionable but governed by invalidation levels.
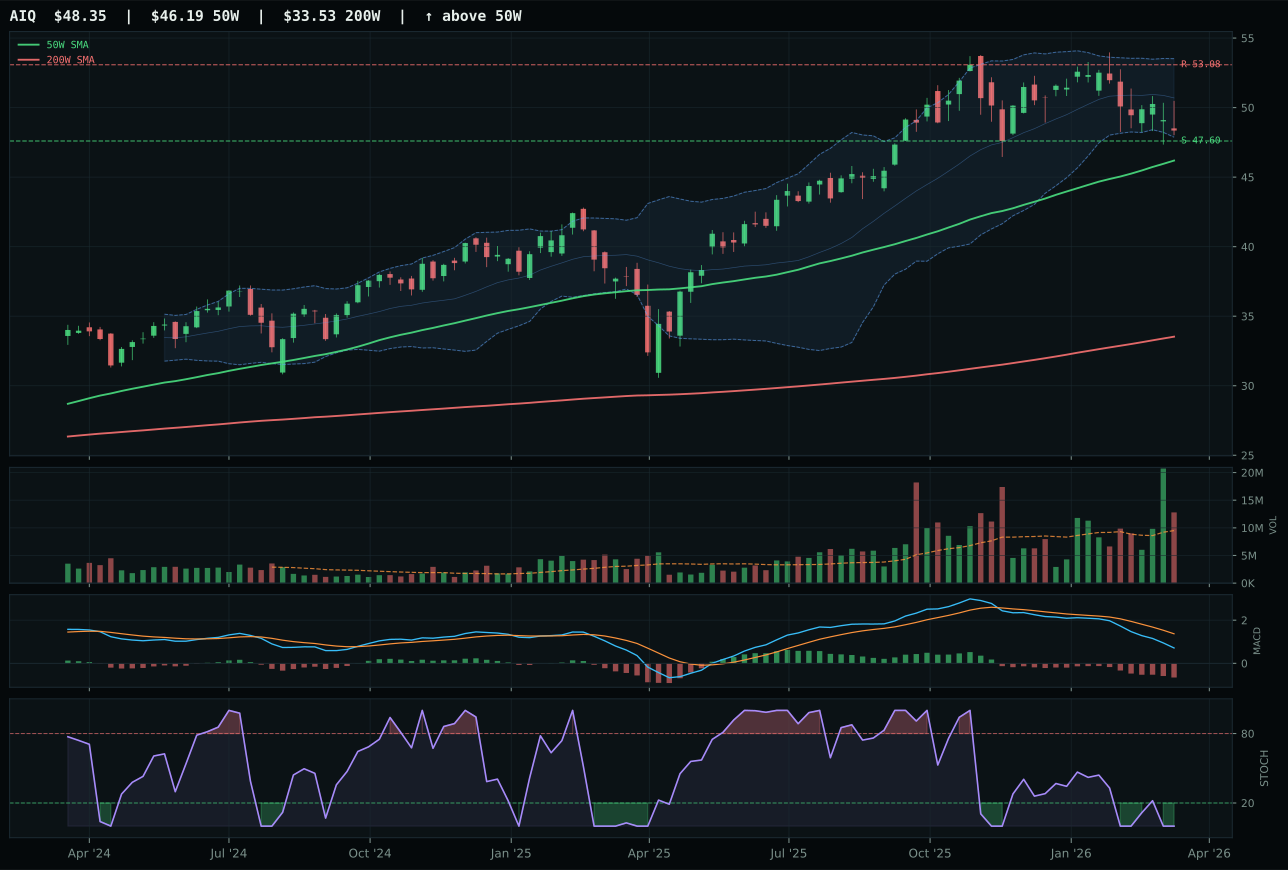
AIQ has a pullback into support profile with -1.4% 13-week relative strength versus SPY.
A failed hold above support would weaken the setup.
Actionable but governed by invalidation levels.
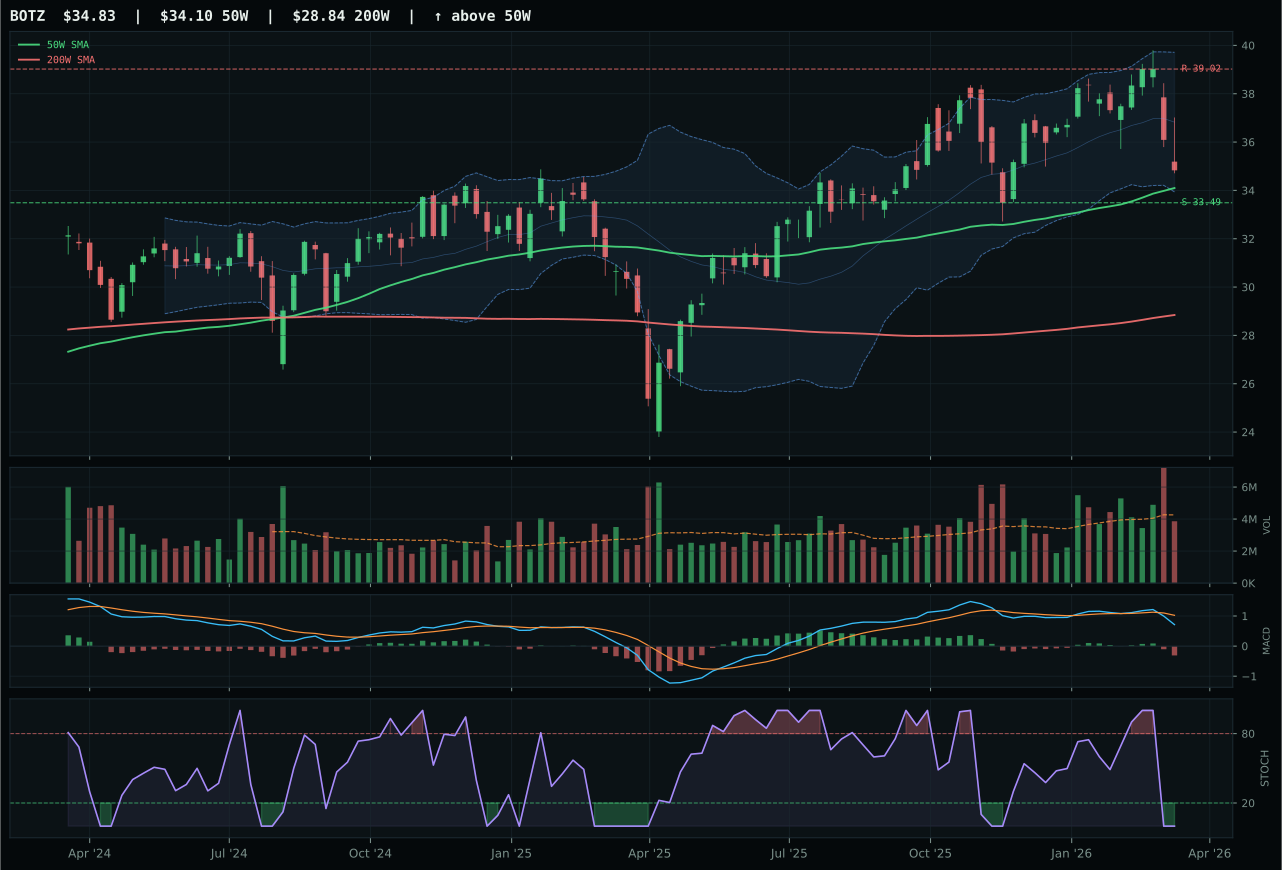
BOTZ has a pullback into support profile with -1.4% 13-week relative strength versus SPY.
A failed hold above support would weaken the setup.
Actionable but governed by invalidation levels.
AIQ defeats SMH in AI because proximity to the 50-week moving average matters more than category-relative strength when oscillators are aligned. AIQ trades 4.7% below the 50W with stochastic RSI oversold at 0.00 and MACD bearish/weakening—a textbook mean-reversion coil offering 1.6% downside to support versus 8.9% upside to resistance. SMH, by contrast, sits 23.1% extended above the 50W in a vertical extension setup; even though SMH's 13-week return is stronger (9.4% vs -4.3%) and category relative strength is positive (12.2%), the risk asymmetry has inverted entirely. The timing score differential is stark: AIQ rates 95/100 because distance plus oscillator alignment screams mean reversion, while SMH scores 48/100 because an extended price in an oversold oscillator state leaves new buyers defenseless against any momentum reversal. Volume distribution pressure on AIQ (1.35x 20W average) is thin but appropriate given the setup; no urgent accumulation is needed when mean reversion is geometrically apparent.
AI holds 10% allocation despite a solid 55.0 category score because two higher-scoring categories (XOP at 93.0 and XLU at 63.3) claimed the top-2 slots. The macro tailwinds are undeniable—AI growth sponsorship is the single strongest descriptor in the framework at +14, and liquidity expansion adds another +10—but technical evidence scores only 41.2/100 at the representative level. This mismatch reveals an important portfolio truth: when macro sponsorship is strong but entry conditions are tepid, the allocation size should match the timing confidence rather than the narrative. Moving AIQ to 20% would require either SMH or BOTZ to show superior timing (less extension, cleaner momentum, volume confirmation), or it would require the oscillators to reset further so that stochastic oversold becomes a genuine washout rather than a range extremity. Current positioning respects the macro case while keeping dry powder for better entry geometry.
Precious Metals — SLV
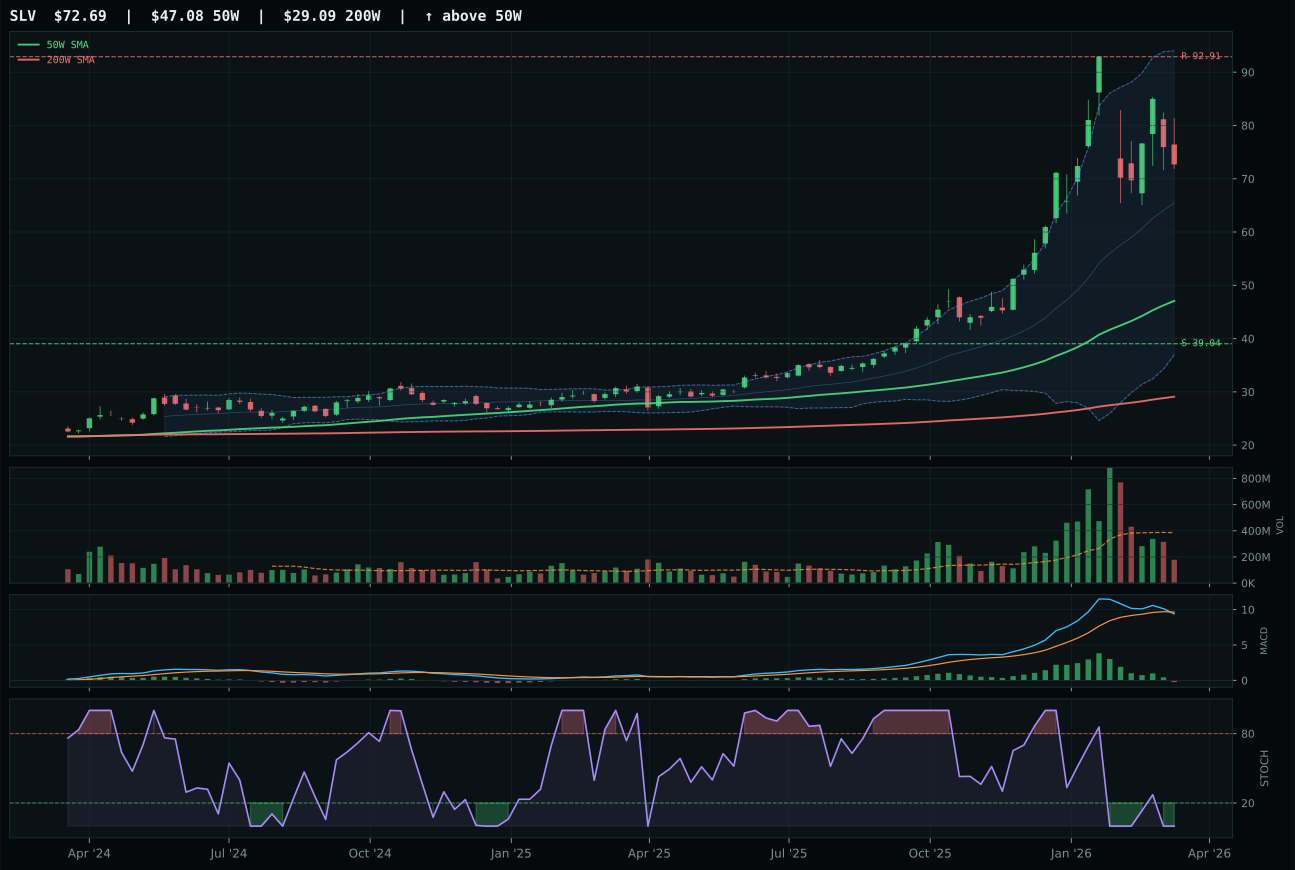
SLV has a vertical extension profile with 32.4% 13-week relative strength versus SPY.
A failed hold above support would weaken the setup.
Actionable but governed by invalidation levels.
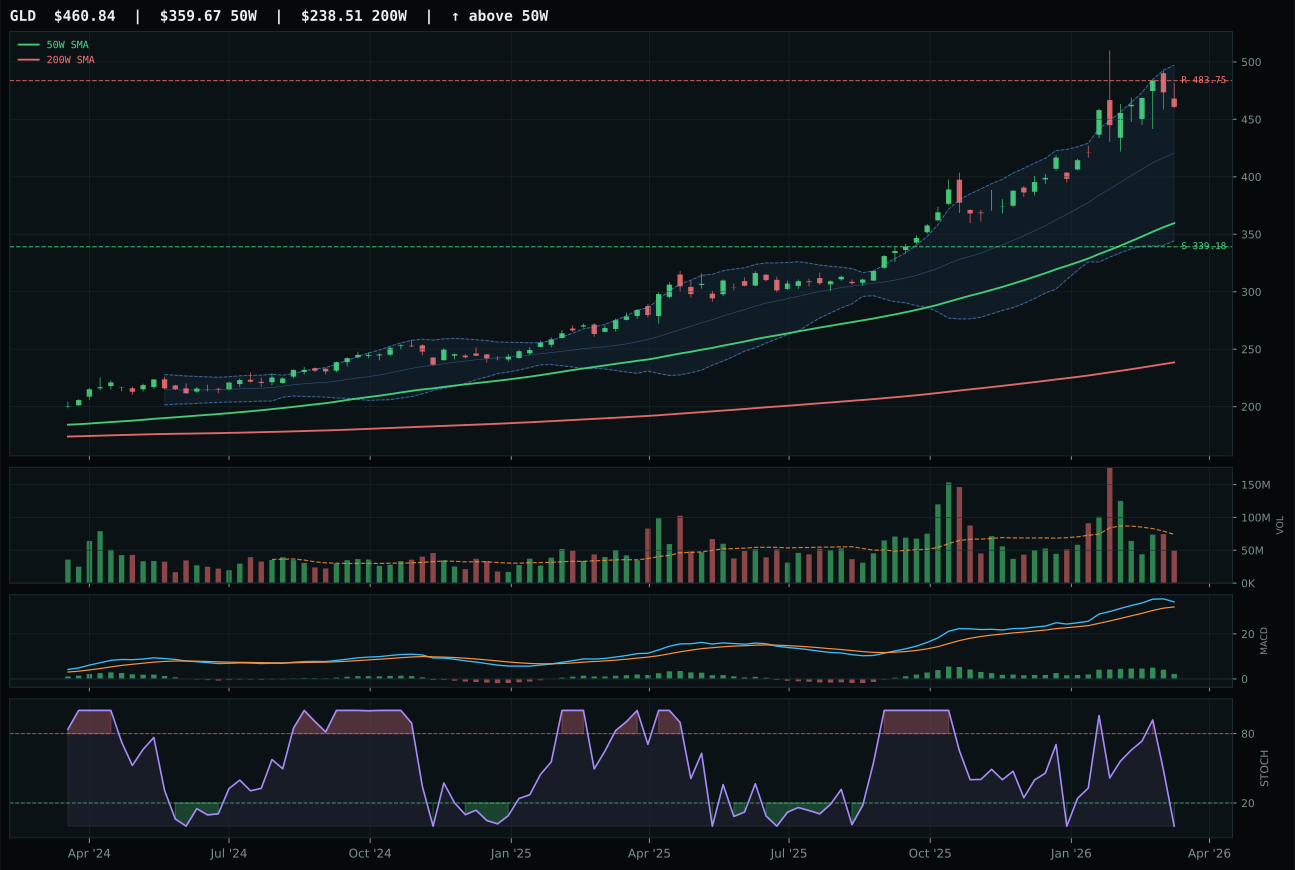
GLD has a vertical extension profile with 19.4% 13-week relative strength versus SPY.
A failed hold above support would weaken the setup.
Actionable but governed by invalidation levels.
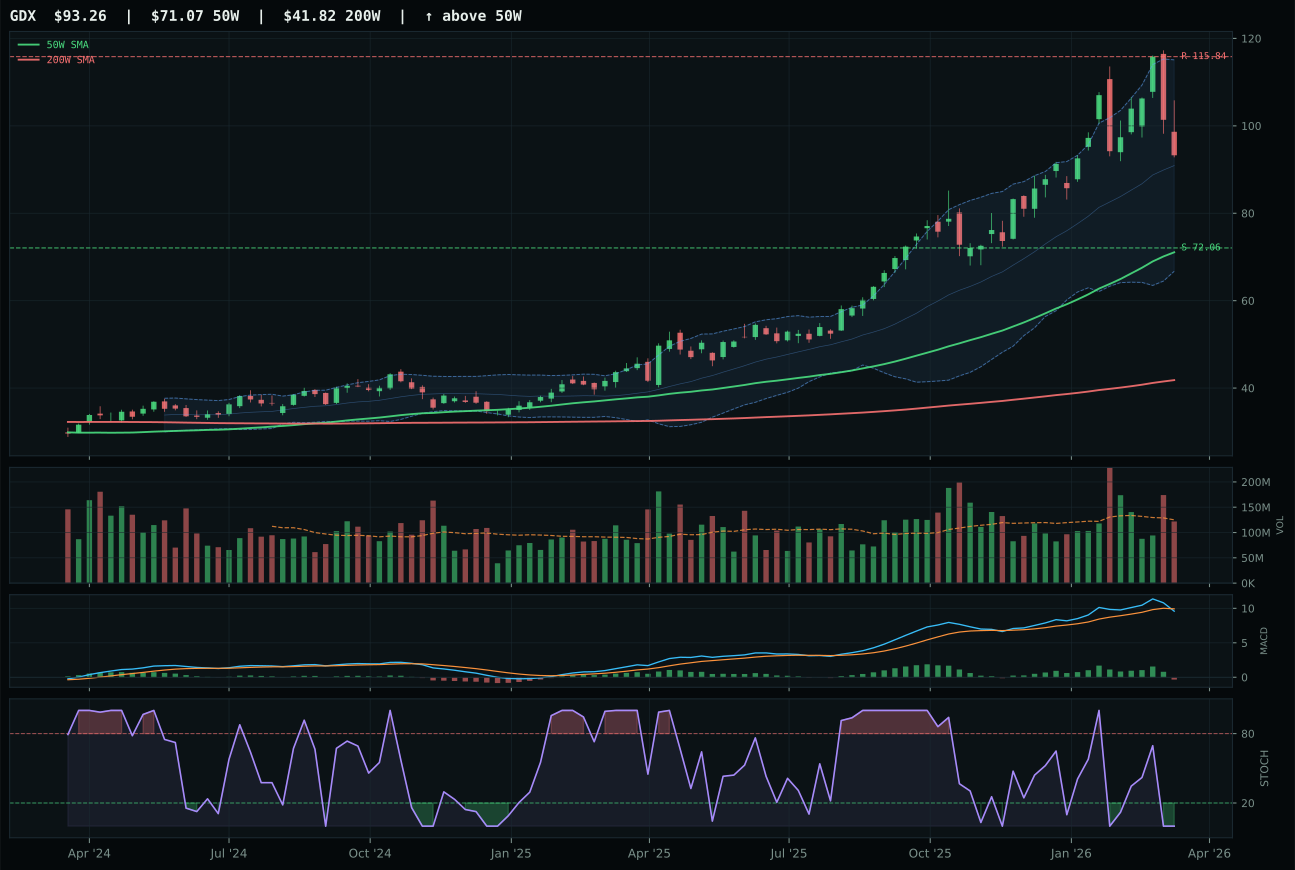
GDX has a vertical extension profile with 11.7% 13-week relative strength versus SPY.
A failed hold above support would weaken the setup.
Actionable but governed by invalidation levels.
SLV defeats GLD in Precious Metals because monetary hedge demand is translating directly into volume persistence on SLV while GLD's volume remains thin despite superior technical setup. SLV's 13-week return of 29.6% with RS versus SPY of 32.4% and category-relative strength of 13.0% shows that real money is rotating into the higher-beta precious metals expression. GLD's 16.5% 13-week return and 19.4% RS versus SPY look solid, but GLD trails in category relative strength (0.0%), meaning it has underperformed the basket despite being the theoretically cleaner monetary hedge. The timing score gap is only 7 points (55 vs 48), but SLV's stochastic RSI at 0.00 with MACD bearish/weakening creates a more defined mean-reversion setup than GLD's bullish-but-flattening MACD and oversold stochastic. SLV sits at the Fib 0.500 midpoint decision zone, a natural pivot point; GLD sits at 0.236 extension, already processed the mean reversion. When volatility is expected and monetary support is active, the market consistently backs the higher-beta vehicle.
Precious Metals holds 10% allocation despite a respectable 54.3 category score because the entry risk on SLV is severe: 54.4% extended above the 50W with only 34.5/100 risk/reward and 0.46x participation volume. The macro narrative is compelling—monetary hedge bid (+7), metals scarcity (+7), inflation pressure (+5)—but the technical evidence contributes only 37.4/100 to the weighted score. This is a category where conviction in the macro story must exceed conviction in the timing, which the 10% slot reflects properly. SLV could hold or even appreciate, but new portfolio money committed at this extension would be betting on acceleration rather than structure. The path to 20% would require either a pullback to test the 50W (resetting entry risk) or clear evidence that the monetary hedge premium is expanding faster than supply shortages can accommodate. Current positioning captures the hedge without forcing capital into the worst part of the rally.
Nuclear Energy — NLR
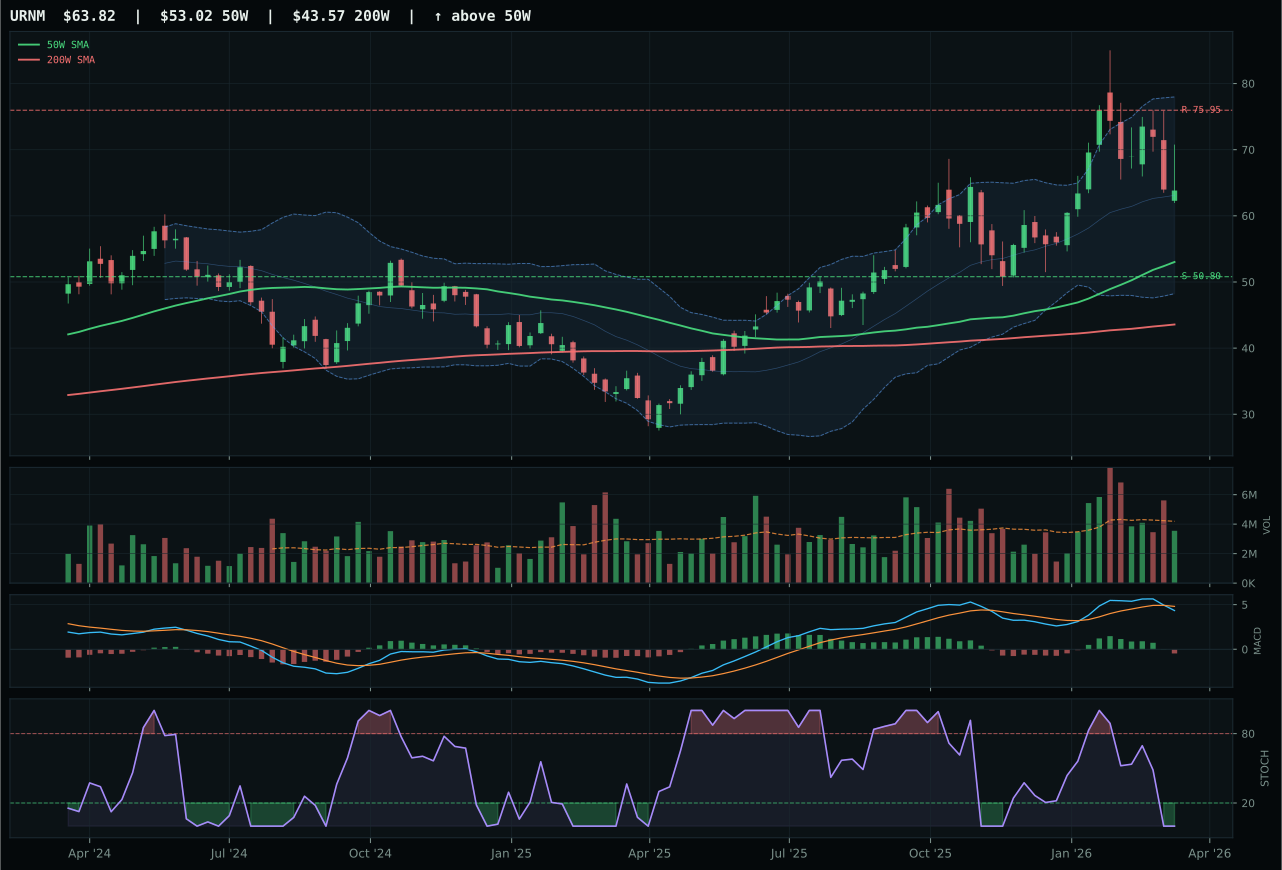
URNM has a vertical extension profile with 15.4% 13-week relative strength versus SPY.
A failed hold above support would weaken the setup.
Actionable but governed by invalidation levels.
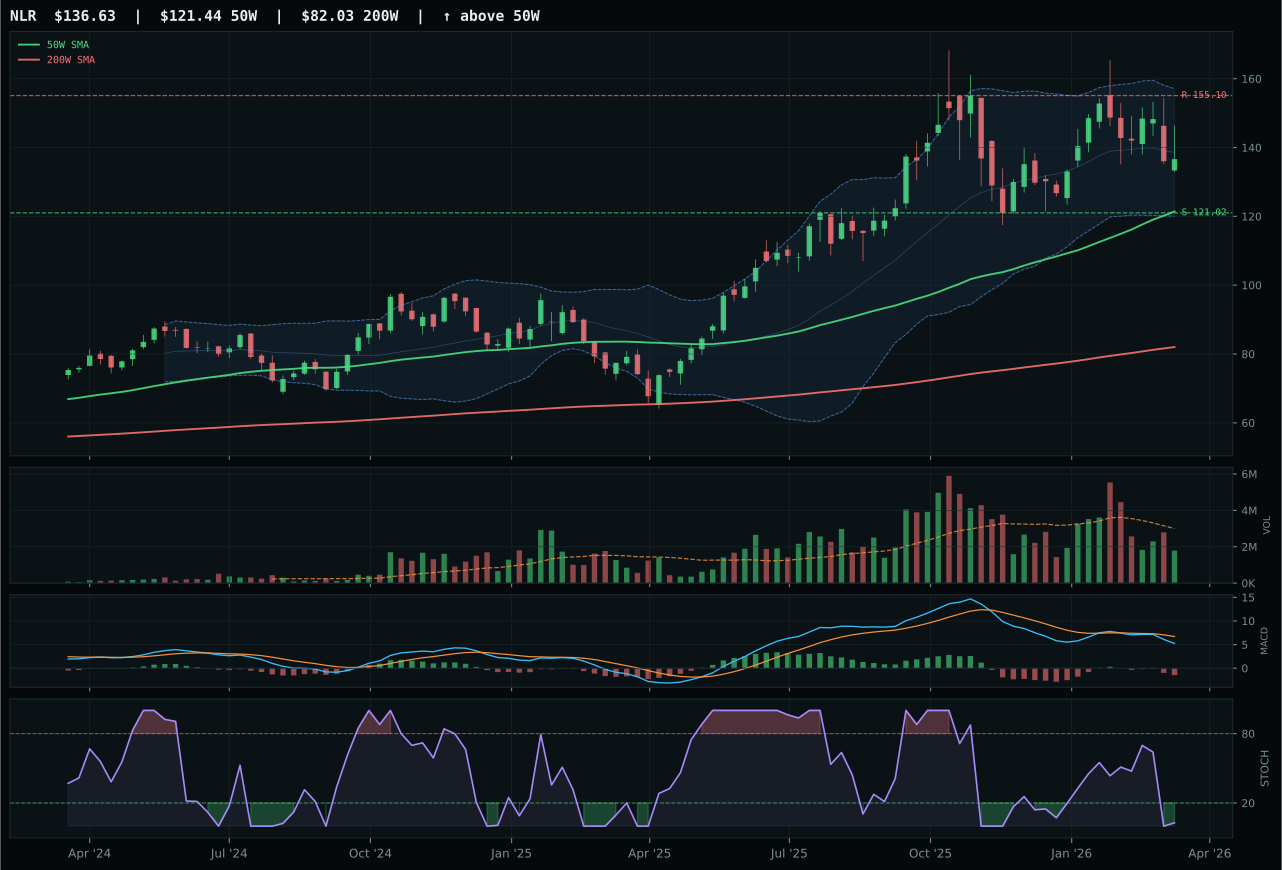
NLR has a neutral structure profile with 8.1% 13-week relative strength versus SPY.
A failed hold above support would weaken the setup.
Actionable but governed by invalidation levels.
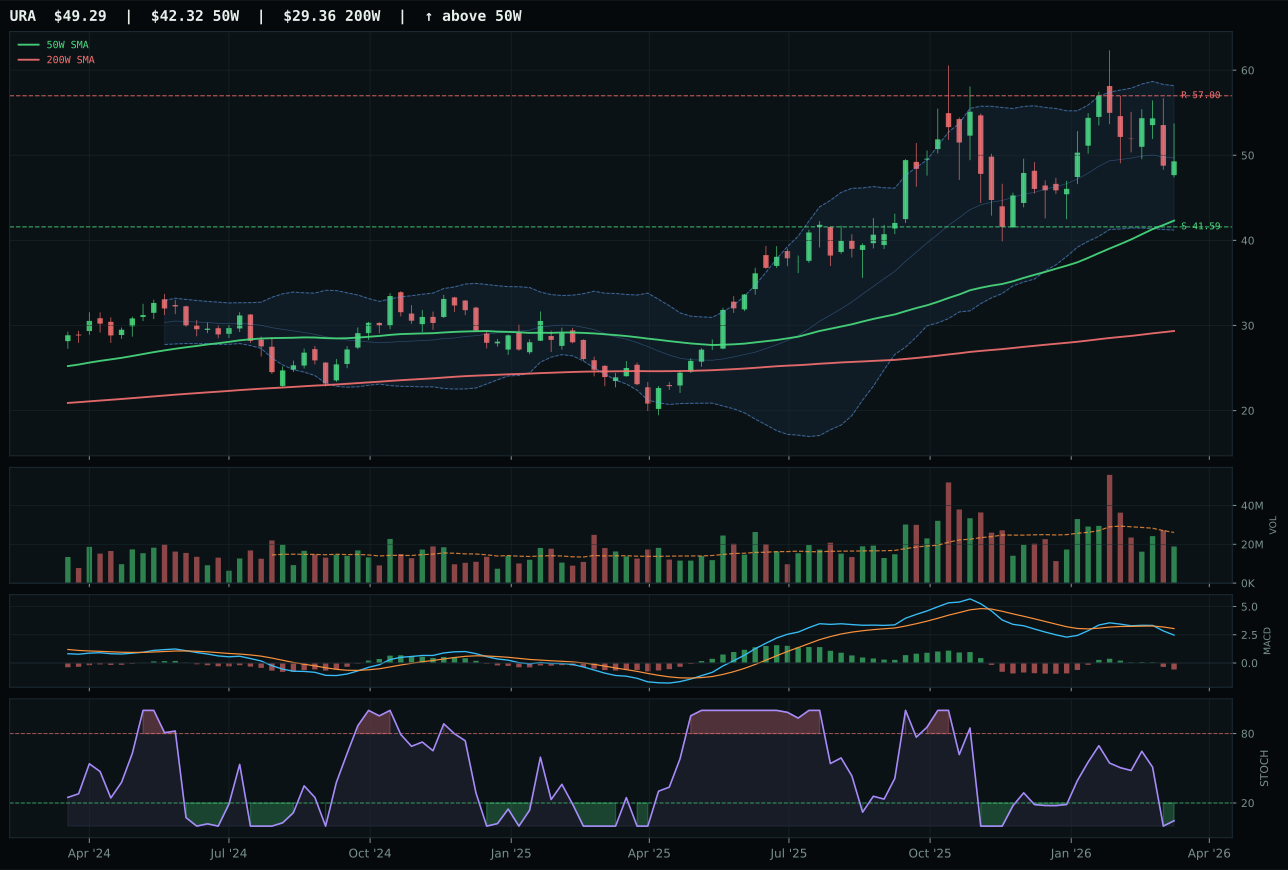
URA has a vertical extension profile with 9.9% 13-week relative strength versus SPY.
A failed hold above support would weaken the setup.
Actionable but governed by invalidation levels.
NLR wins Nuclear Energy because timing and structure create a superior risk geometry compared to URNM's aggressive extension. NLR trades 12.5% above the 50W in a neutral structure setup with a 70/100 timing score reflecting its position in the upper Fib retracement zone with bearish/weakening MACD and oversold stochastic—a textbook coil awaiting resolution. URNM, by contrast, extends 20.4% in a vertical extension setup with only 48/100 timing and thin support, creating a setup where any macro disappointment will cascade. NLR's 13-week return of 5.3% looks pedestrian against URNM's 12.5%, but that underperformance reflects defensive positioning rather than weakness. The category-relative strength gap is minimal (NLR at -1.8% vs URNM at 5.5%), but structure matters more than category rank in a defensive play. NLR's above-50W price with improving positioning makes it the choice for allocators who believe in energy scarcity but are unsure of its timing.
Nuclear Energy holds 10% allocation because the category score of 53.0 ranks sixth among ten categories, and because macro fit is only 62/100 despite energy scarcity being active (+6). The defensive rotation descriptor (+6) helps, but nuclear lacks the supply shortage or inflation pressure sponsorship that lifts true commodity plays. Technical evidence of 41.2/100 is below category median, revealing that timing is uncertain even though the energy narrative is sound. NLR's thin participation (0.60x 20W average) suggests that institutional interest has not yet consolidated into the name. The 10% slot preserves nuclear exposure as a hedge against energy supply shocks while avoiding forced conviction on a setup where timing is ambiguous. For NLR to earn 20%, the category would need either substantial price appreciation accompanied by volume confirmation, or a technical reset that brought the 50W distance closer to zero while sustaining bullish MACD—a combination that would signal institutional confidence rather than mere price appreciation.
Defense & Aerospace — ITA
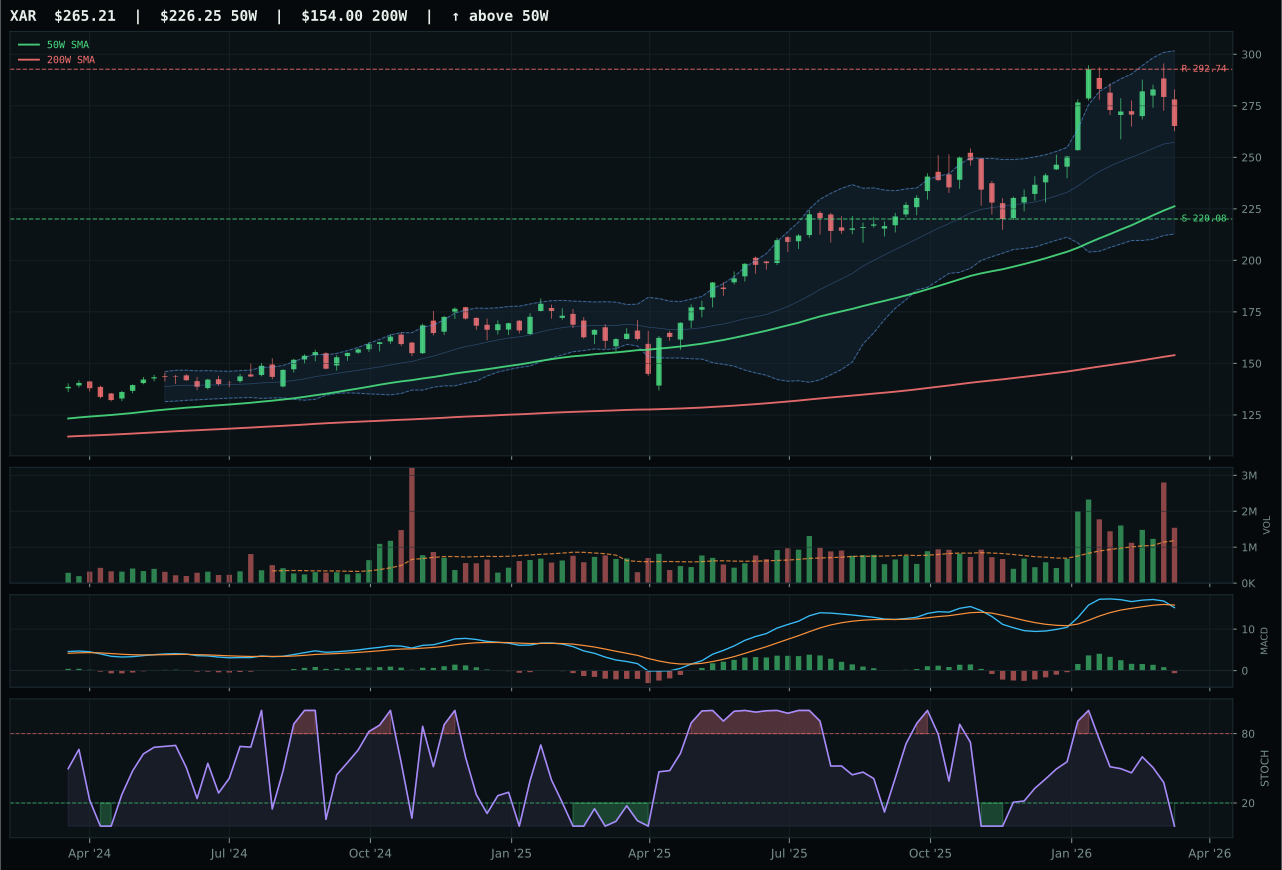
XAR has a vertical extension profile with 14.9% 13-week relative strength versus SPY.
A failed hold above support would weaken the setup.
Actionable but governed by invalidation levels.
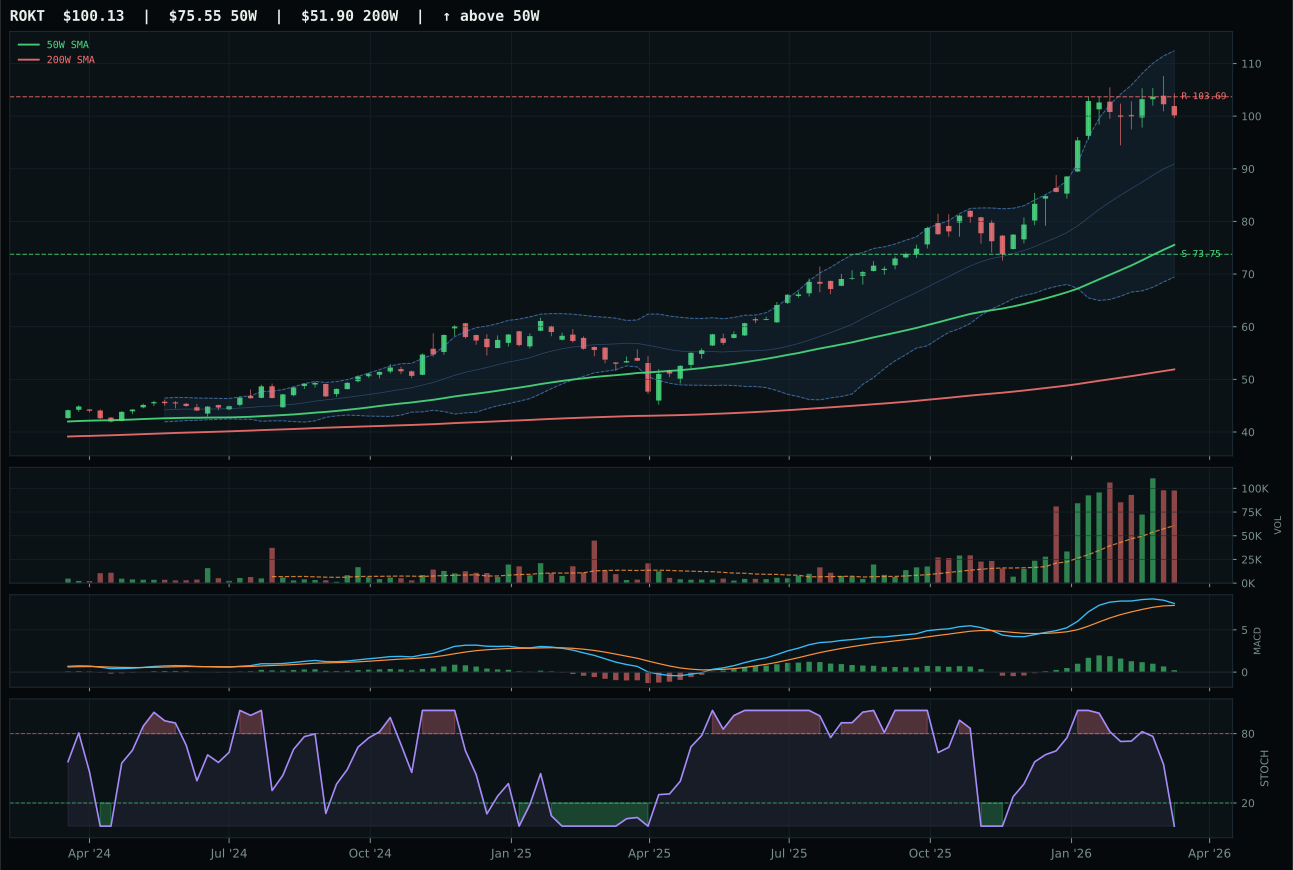
ROKT has a vertical extension profile with 23.0% 13-week relative strength versus SPY.
A failed hold above support would weaken the setup.
Tracked, but not top-2 eligible because: .
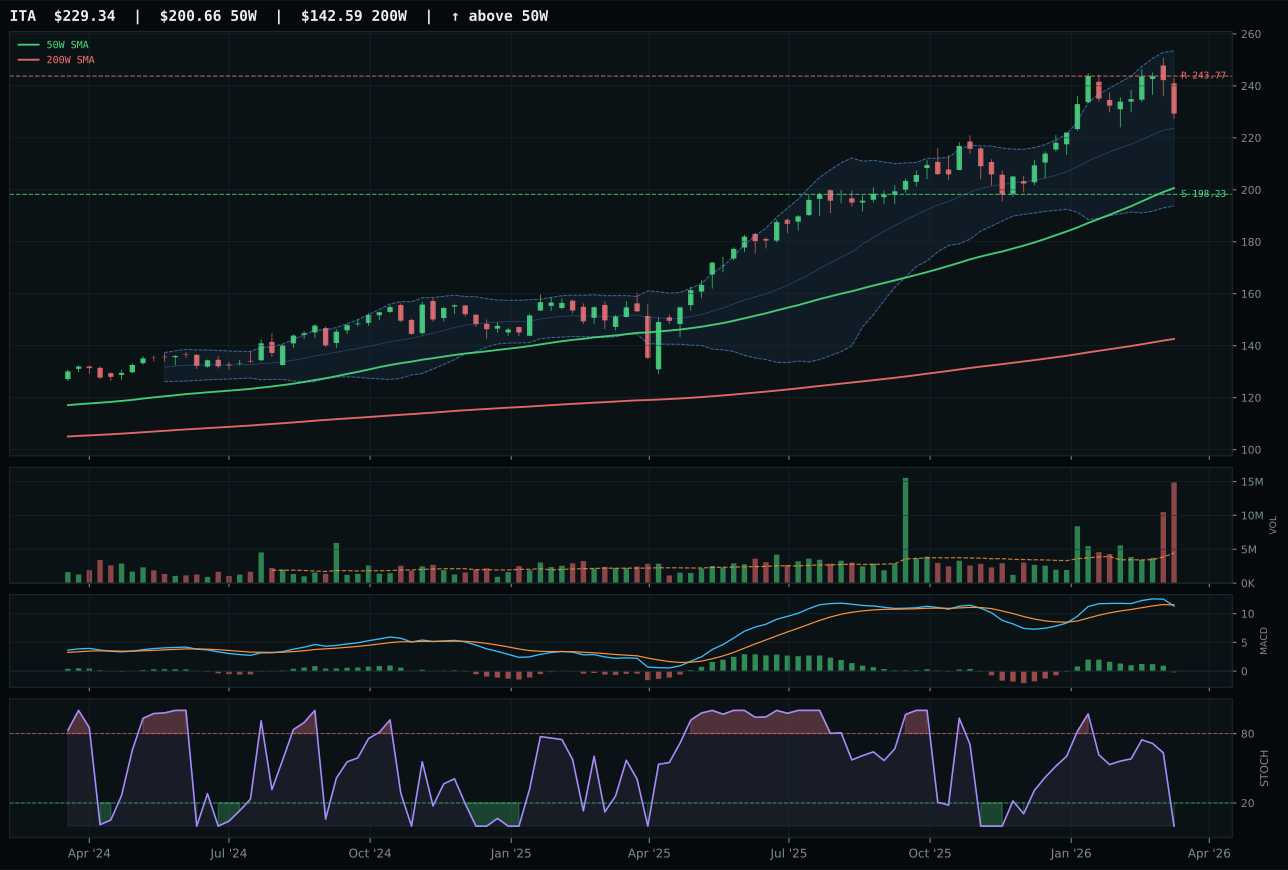
ITA has a neutral structure profile with 12.4% 13-week relative strength versus SPY.
A failed hold above support would weaken the setup.
Actionable but governed by invalidation levels.
ITA wins Defense & Aerospace because its neutral structure forces the score to rest on trend strength and relative strength, and it delivers both: 92/100 trend score with 12.4% RS versus SPY and price 14.3% extended above the 50W. The structure is genuinely neutral—not a pullback, not a vertical extension, but a steady climb with 3.35x volume distribution pressure—which paradoxically becomes a strength when macro tailwinds are light. XAR, the runner-up, shows higher category-relative strength (14.9% vs 12.4% vs SPY) in a vertical extension setup, but its timing score collapses to 48/100 because the extreme extension coupled with distribution pressure signals that the move has already attracted most willing buyers. ITA's 70/100 timing score reflects a sweet spot: extended enough to confirm institutional demand, but not so extended that new participation requires conviction. The technical edge is clean despite tight risk/reward (43.8/100)—ITA is simply the least damaged choice in a category where no ETF presents an ideal setup.
Defense & Aerospace holds 10% because the category score of 44.2 ranks below six other categories and because macro fit is only 61/100. The Transition/Mixed regime provides modest defensive rotation sponsorship (+8), but that alone does not overcome technical evidence that scores only 17.8/100 at the representative level. ITA's setup depends on the defensive narrative remaining in force; if liquidity expansion accelerates or equity risk appetite returns, the extended price becomes a liability rather than a feature. The allocation serves as a defensive hedge against deteriorating macro momentum, but the position size reflects low conviction on timing and structure. For ITA to earn 20%, the category would need a score approaching 70 or the technical evidence would need to improve substantially—perhaps via a pullback that reset stochastic and compressed the distance-to-50W metric while maintaining uptrend integrity.
Emerging Markets — IEMG
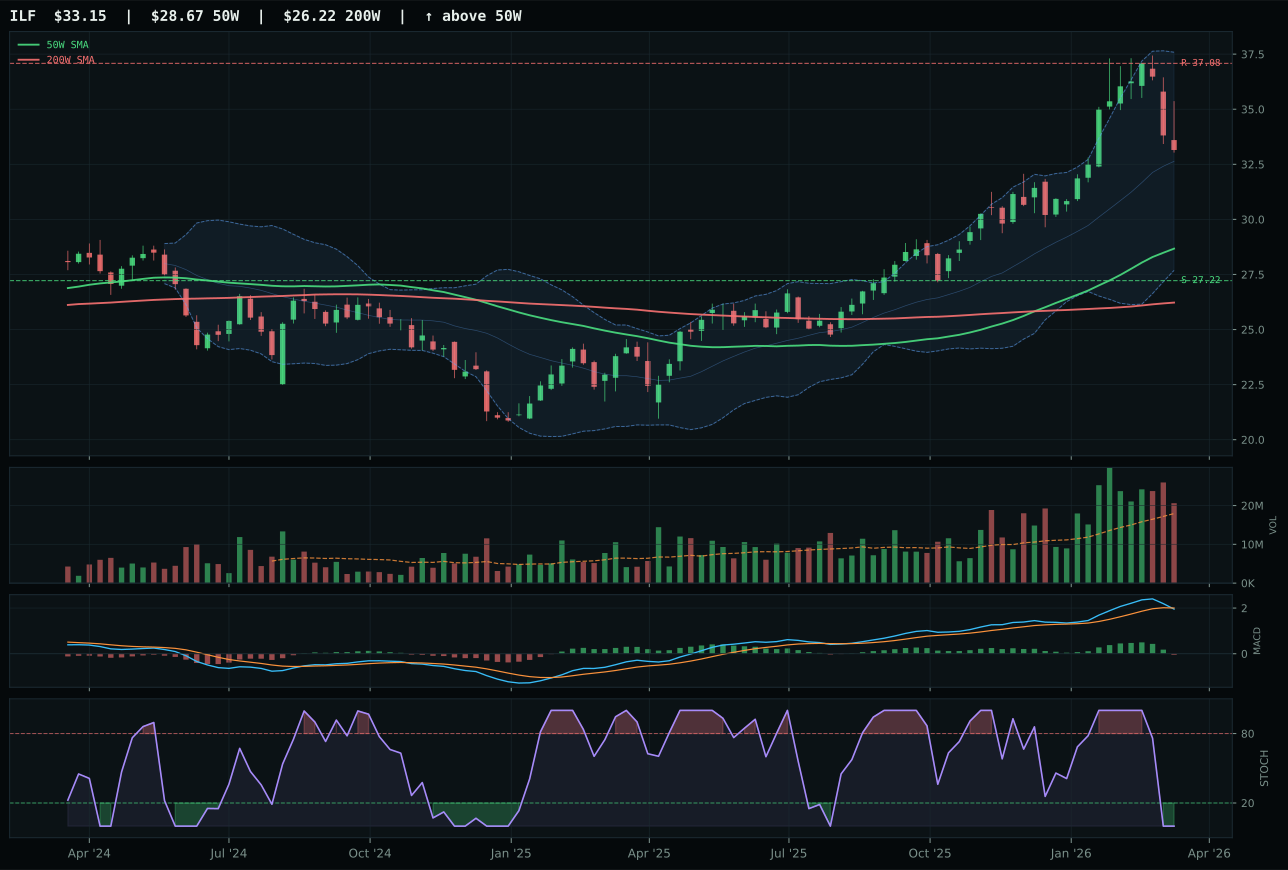
ILF has a vertical extension profile with 8.3% 13-week relative strength versus SPY.
A failed hold above support would weaken the setup.
Actionable but governed by invalidation levels.
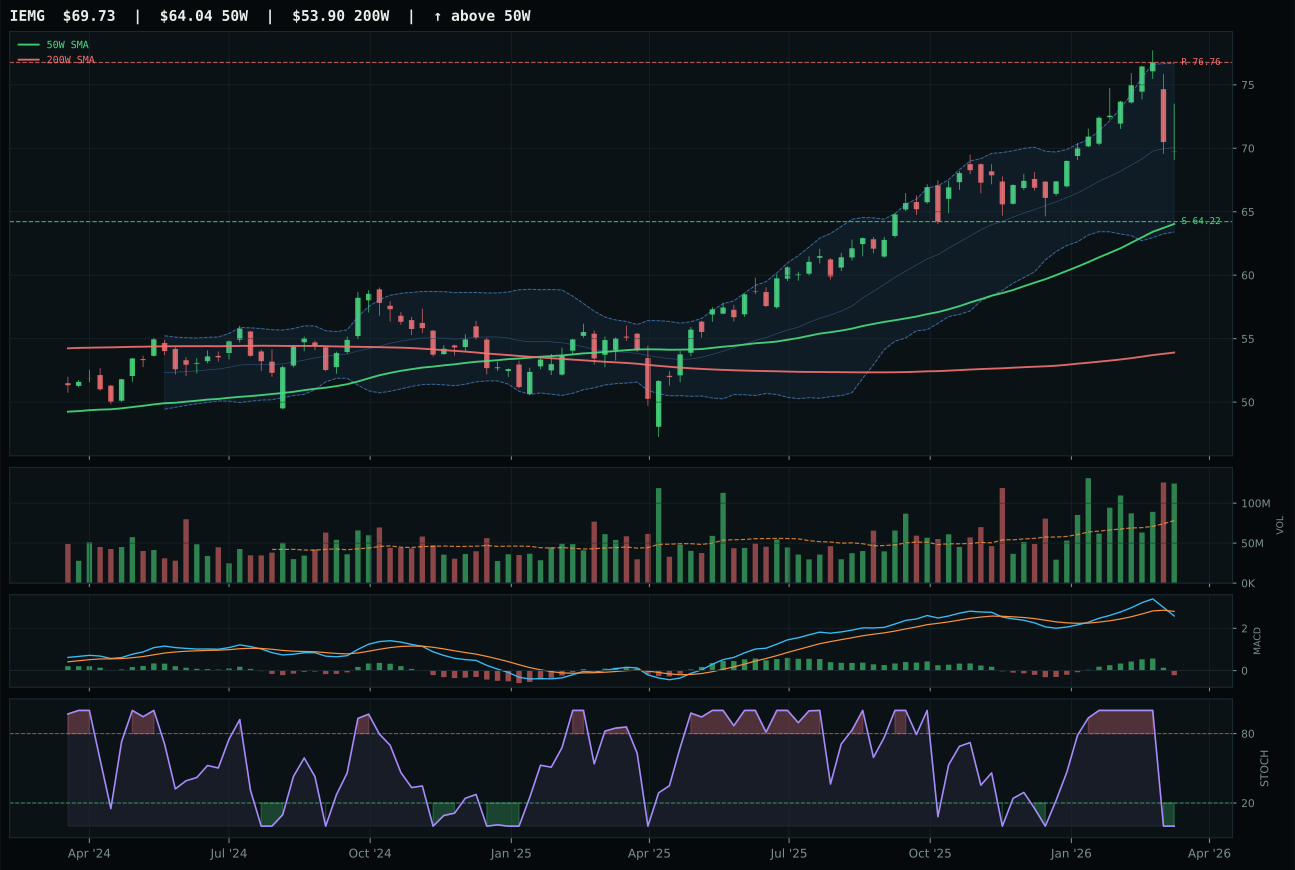
IEMG has a neutral structure profile with 7.1% 13-week relative strength versus SPY.
A failed hold above support would weaken the setup.
Actionable but governed by invalidation levels.
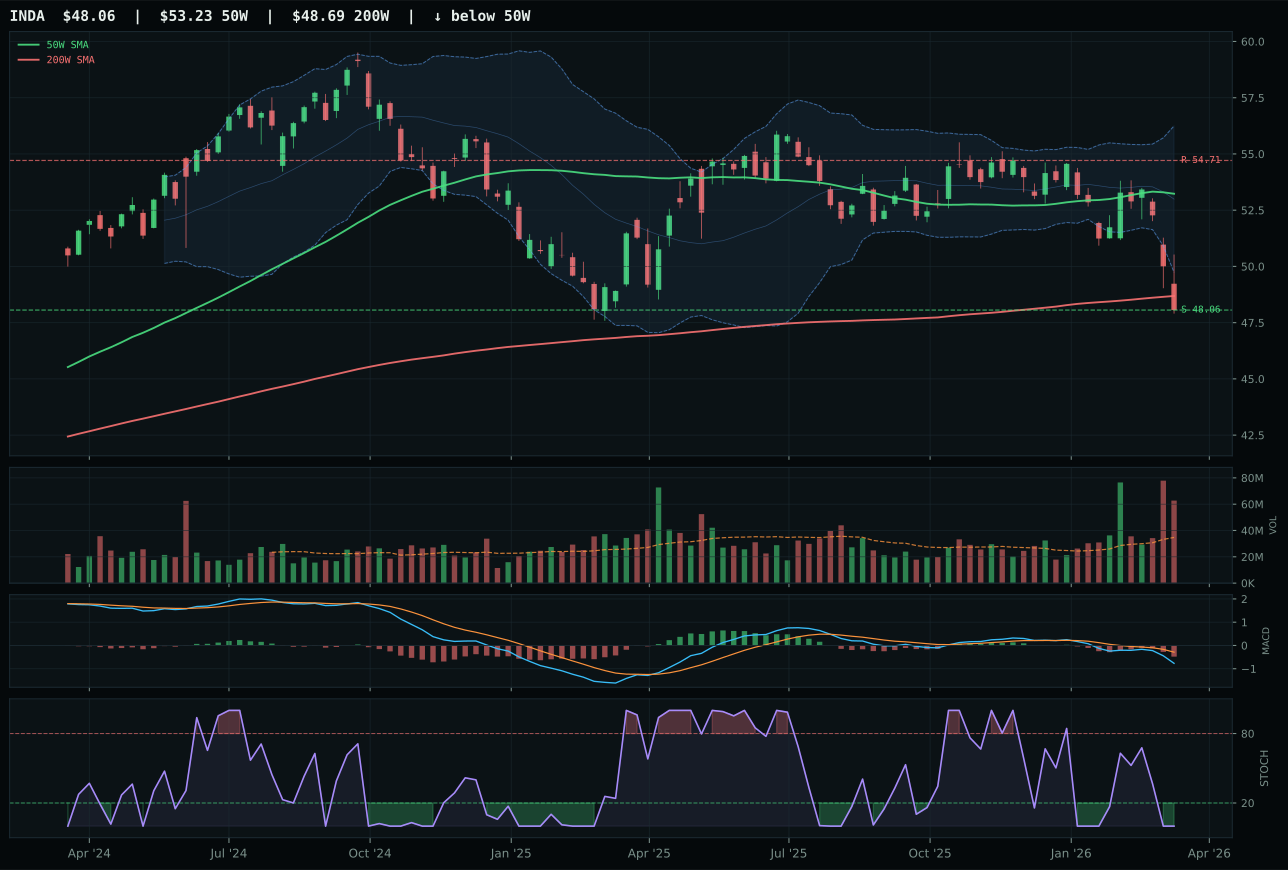
INDA has a pullback into support profile with -6.7% 13-week relative strength versus SPY.
A failed hold above support would weaken the setup.
Actionable but governed by invalidation levels.
IEMG wins Emerging Markets despite ILF's superior trend and momentum scores because timing and volume-price fit matter more when macro conviction is uncertain. IEMG holds a neutral structure setup at 8.9% above the 50W with 70/100 timing; ILF offers vertical extension at 15.6% above the 50W with only 48/100 timing. Both show oversold stochastic RSI, but IEMG's broader pullback structure creates a less punishing entry point. The category-relative strength is tied at 0.0% for IEMG, meaning it is neither leading nor lagging the basket, whereas ILF's 1.2% edge is marginal. ILF's structure (78.0 cleanliness) is nearly as clean as IEMG's (79.3), and its macro fit is superior (74/100 vs 69/100), but the extended price becomes a liability in a regime where EM flows are uncertain. IEMG's 1.59x distribution pressure is concerning but manageable; ILF's above-average participation on an already-extended price is a red flag.
Emerging Markets scores 43.2 and earns zero allocation, ranking 9th or 10th among the ten categories. The category's macro fit is strong at 72.0, driven by EM liquidity support at +14 and liquidity expansion at +8, which historically have supported developing-market outperformance. However, technical evidence across the basket is weak at 34.0 (IEMG) in its reasoning order, dragged down by low momentum confirmation at 27.3 and thin volume-price sponsorship. IEMG's near-zero four-week return and the 7.0% drawdown from the category peak signal momentum exhaustion. In the current macro regime of Transition/Mixed with energy and metals scarcity dominating allocation, EM assets are losing visibility in favor of hard-asset beneficiaries. The category's 43.2 score sits well below the seventh-ranked Nuclear Energy at 53.0, meaning it simply cannot compete for the remaining 10% slot given portfolio constraints. For IEMG to earn allocation, technical evidence would need to improve markedly—either through renewed momentum confirmation, volume accumulation, or a shift in macro descriptors toward higher-conviction EM narratives like commodity supply-chain resilience.
Technology — IGV
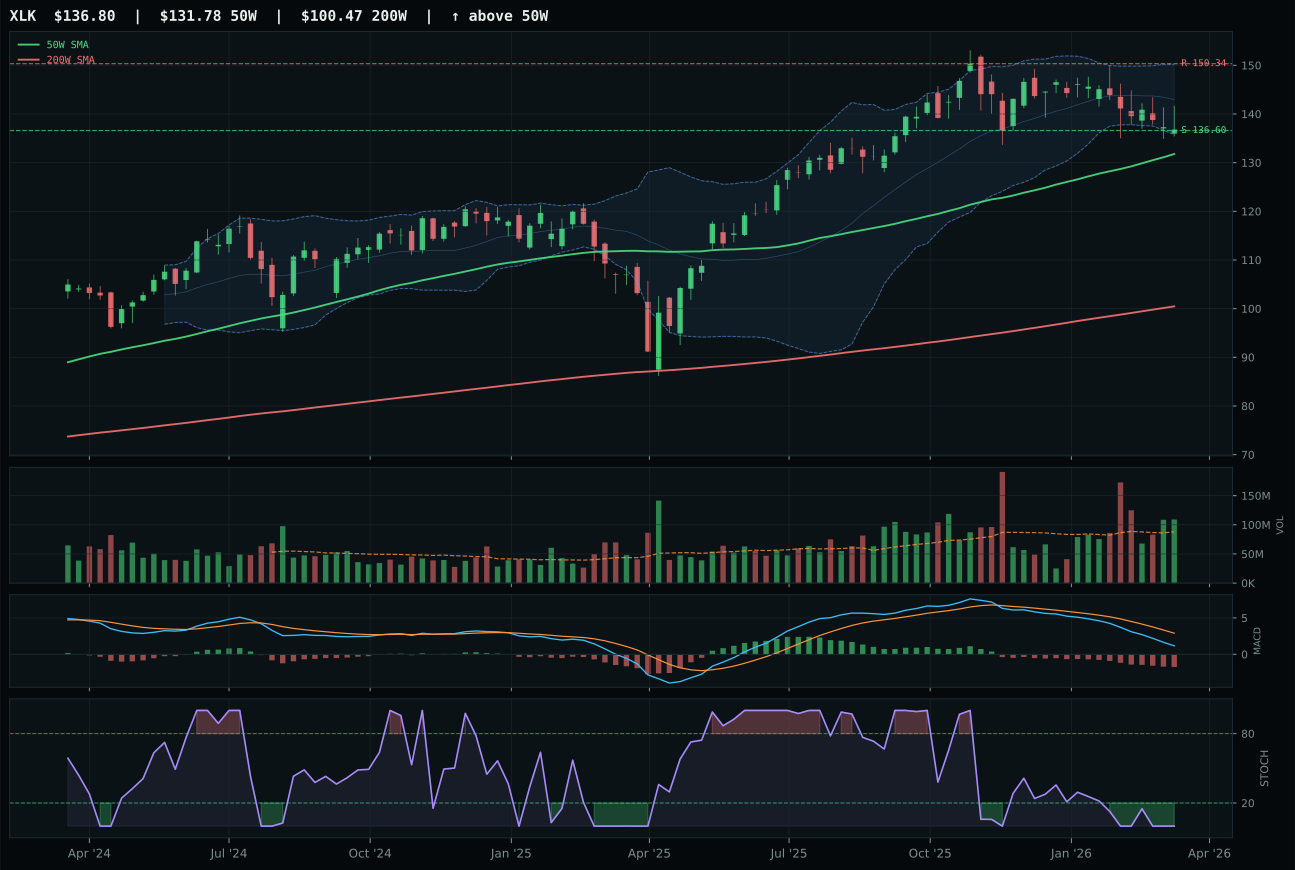
XLK has a pullback into support profile with -1.9% 13-week relative strength versus SPY.
A failed hold above support would weaken the setup.
Actionable but governed by invalidation levels.
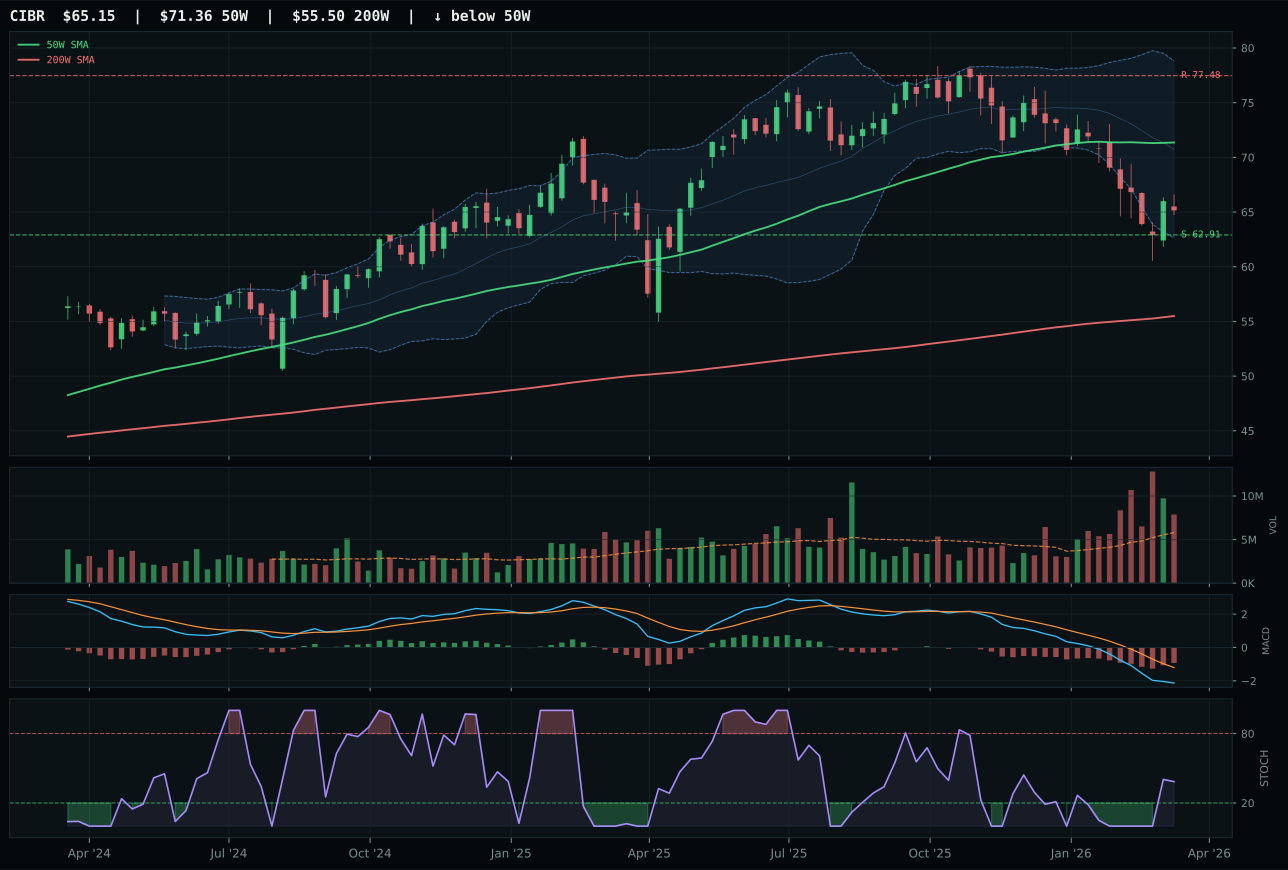
CIBR has a pullback into support profile with -9.0% 13-week relative strength versus SPY.
A failed hold above support would weaken the setup.
Actionable but governed by invalidation levels.
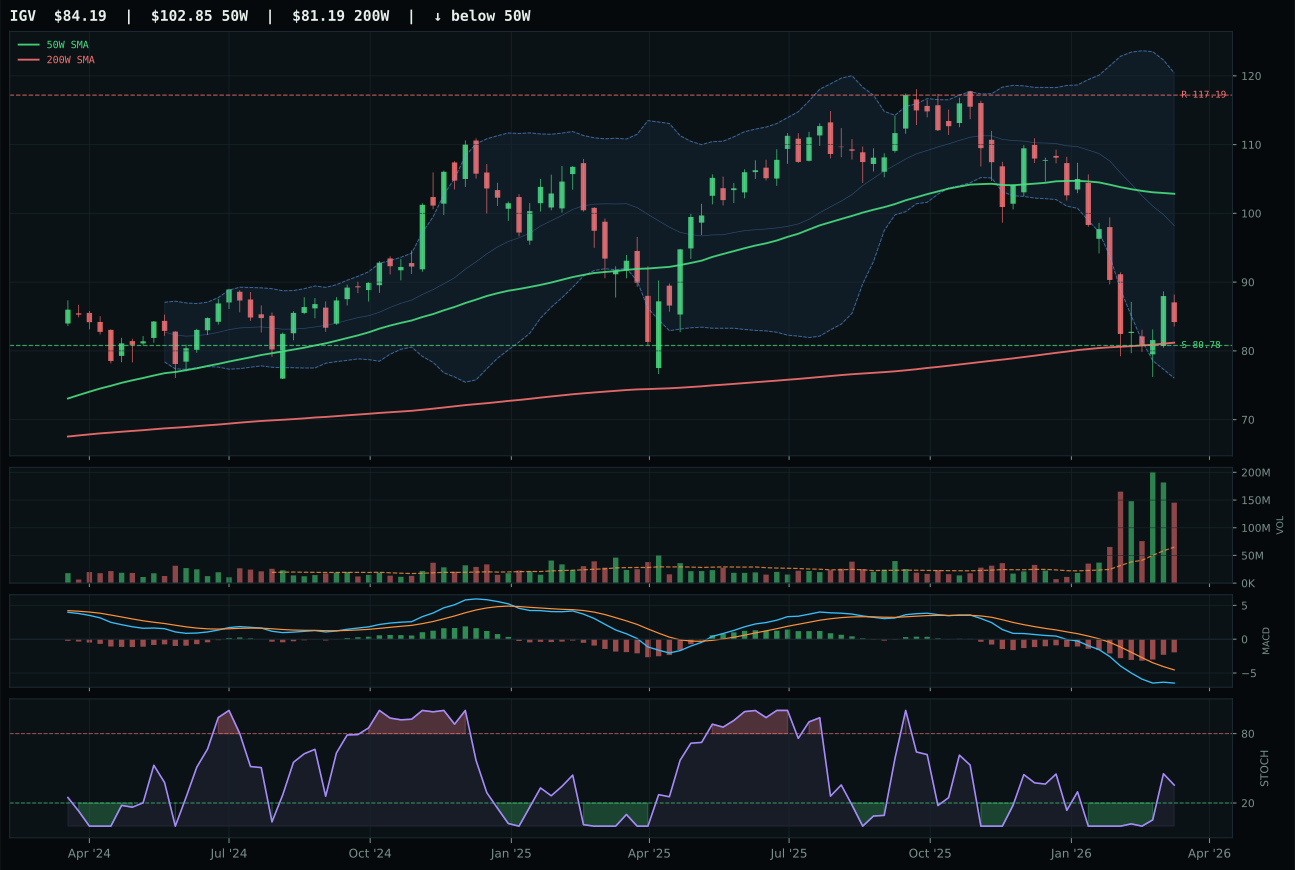
IGV has a pullback into support profile with -19.2% 13-week relative strength versus SPY.
A failed hold above support would weaken the setup.
Actionable but governed by invalidation levels.
IGV wins the Technology category because it presents a reset rather than a chase: the price sits 18.1% below the 50-week moving average while remaining above the 200-week, creating a defined support area at 80.78 with only 4.2% downside risk. The stochastic RSI is rising mid-zone at 0.36 while MACD shows bearish but improving signals, which is precisely the timing pattern that separates viable pullbacks from further deterioration. XLK's technical setup is objectively stronger on trend (79 vs 43), but it trades at only 3.8% below the 50W and with stochastic oversold—a shallower reset that forces new buyers to pay closer to recent highs. The 13-week return gap between the two (IGV at -22%, XLK at -4.8%) reflects two different risk regimes: IGV sits in the 52-week low repair zone where margin of safety exists, while XLK occupies the momentum zone where the next 5% move stings differently.
Technology ranks 9th or 10th among the ten categories this week and earns zero allocation. The category's 42.0 score reflects technical evidence at 49.4 (composite across the three ETFs) weighted heavily against a macro fit of 61.0, which is structurally insufficient in a Transition/Mixed regime where energy scarcity and metals scarcity are driving hard. Both XLK and IGV are trapped below their 50W slopes despite showing distribution volume; neither exhibits the kind of volume-price sponsorship that justifies capital in a macro environment tilted toward real assets. Liquidity expansion and AI growth sponsorship carry some weight (+9 and +6 respectively), but they cannot overcome the fact that this week's two top-2 allocations—Traditional Energy and Utilities—represent 40% of the portfolio and offer cleaner technical setups with stronger relative strength. Technology would need either a decisive price recovery with volume confirmation or a sharp pivot in macro descriptors toward AI growth urgency to reclaim a seat.