
2026-03-06
Informational purposes only. The content in this report, including allocations, analysis, and commentary, is provided solely for informational and educational purposes. It does not constitute financial advice, investment advice, trading advice, or any other type of advice. Past performance does not guarantee future results. Always conduct your own research and consult a qualified financial professional before making investment decisions.
Weekly Allocation
| Ticker | Category | Weight | Role |
|---|---|---|---|
| XLE | Traditional Energy | 20% | Top-2 (20%) |
| GLD | Precious Metals | 20% | Top-2 (20%) |
| REMX | Industrial Metals | 10% | Tier-2 (10%) |
| XLU | Utilities & Infrastructure | 10% | Tier-2 (10%) |
| WEAT | Agriculture & Livestock | 10% | Tier-2 (10%) |
| NLR | Nuclear Energy | 10% | Tier-2 (10%) |
| ITA | Defense & Aerospace | 10% | Tier-2 (10%) |
| IGV | Technology | 10% | Tier-2 (10%) |
Trade Instructions — Monday Open
Sell the tranche from 2026-02-06 (completing its 4-week hold). Buy the new tranche. Instructions show net portfolio changes — same-asset positions cancel, weight changes show the delta.
| Action | Ticker | Instruction |
|---|---|---|
| SELL | ILF | Sell 67% of ILF position (reduce 7.50% → 2.50%) |
| SELL | COPX | Sell 25% of COPX position (reduce 10.00% → 7.50%) |
| SELL | URNM | Sell 50% of URNM position (reduce 5.00% → 2.50%) |
| SELL | PAVE | Sell entire PAVE position (2.50% of portfolio) |
| SELL | SMH | Sell entire SMH position (2.50% of portfolio) |
| SELL | MOO | Sell 33% of MOO position (reduce 7.50% → 5.00%) |
| BUY | GLD | Buy GLD — 14.29% of freed cash (adds 2.50% to portfolio) |
| BUY | ITA | Buy ITA — 14.29% of freed cash (adds 2.50% to portfolio) |
| BUY | NLR | Buy NLR — 14.29% of freed cash (adds 2.50% to portfolio) |
| BUY | XLU | Buy XLU — 14.29% of freed cash (adds 2.50% to portfolio) |
| BUY | REMX | Buy REMX — 14.29% of freed cash (adds 2.50% to portfolio) |
| BUY | WEAT | Buy WEAT — 14.29% of freed cash (adds 2.50% to portfolio) |
| BUY | IGV | Buy IGV — 14.29% of freed cash (adds 2.50% to portfolio) |
Current Portfolio After Trade
Combined holdings across all 4 active tranches. Each tranche is 25% of the portfolio.
| Ticker | % of Portfolio | Weight Bar |
|---|---|---|
| XLE | 20.00% | |
| GLD | 12.50% | |
| COPX | 7.50% | |
| BOTZ | 7.50% | |
| ITA | 7.50% | |
| NLR | 7.50% | |
| XLU | 7.50% | |
| REMX | 7.50% | |
| MOO | 5.00% | |
| IEMG | 5.00% | |
| ILF | 2.50% | |
| URNM | 2.50% | |
| IGF | 2.50% | |
| WEAT | 2.50% | |
| IGV | 2.50% |
Macro Regime — Transition / Mixed
Macro Evidence Charts
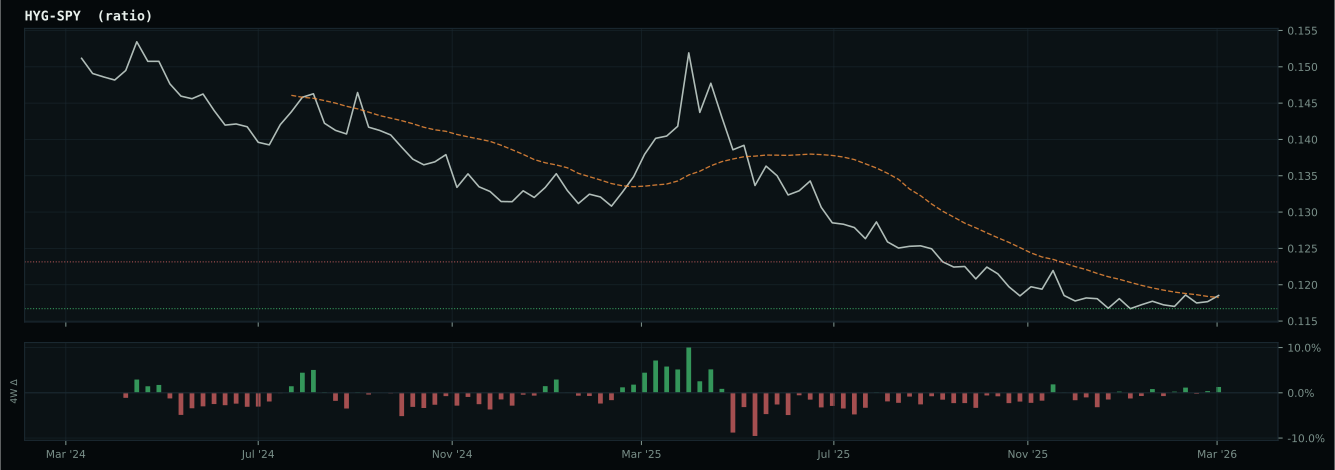
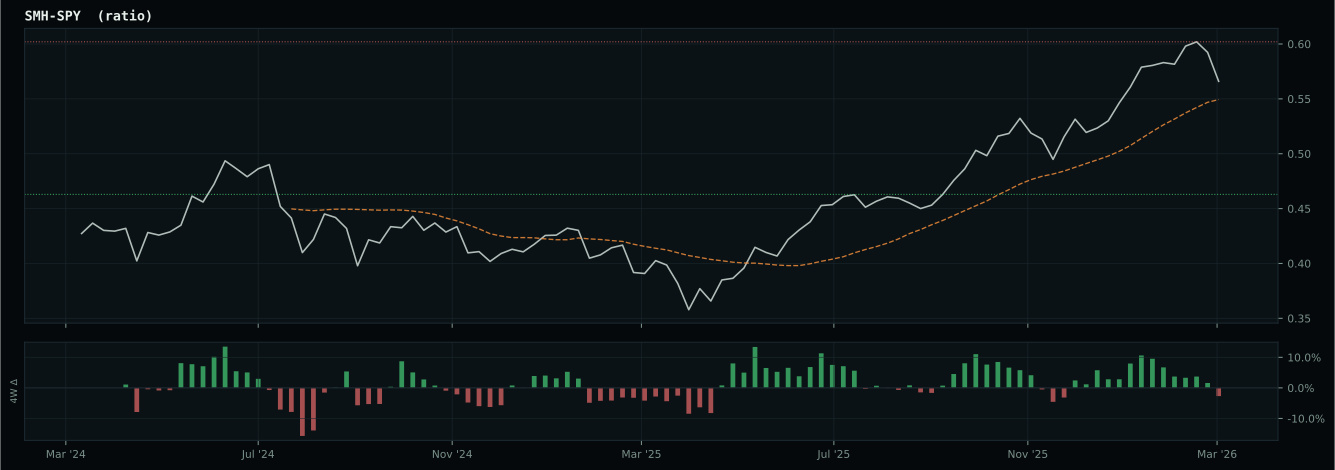
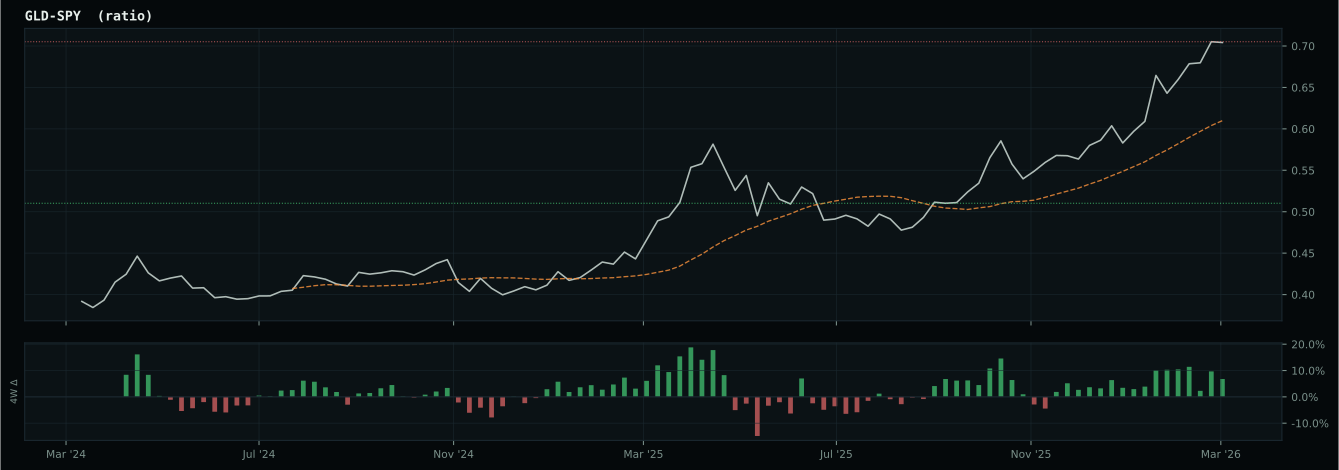
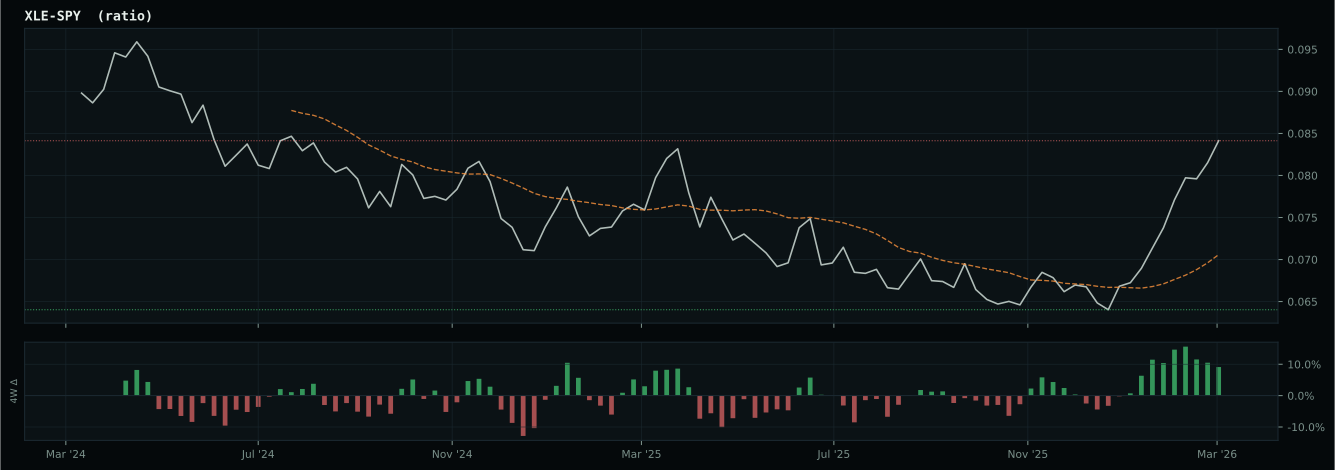
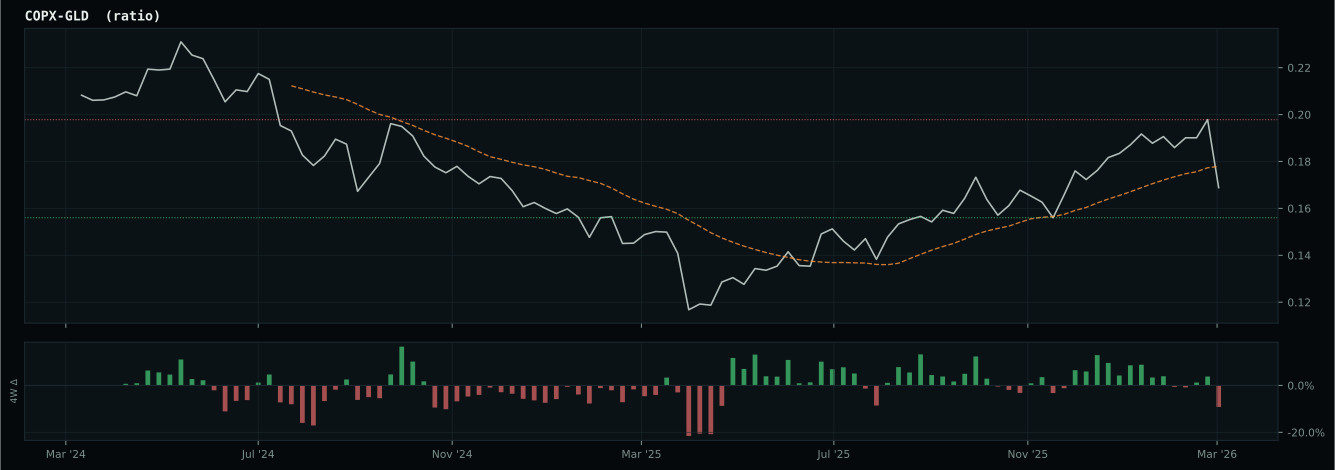
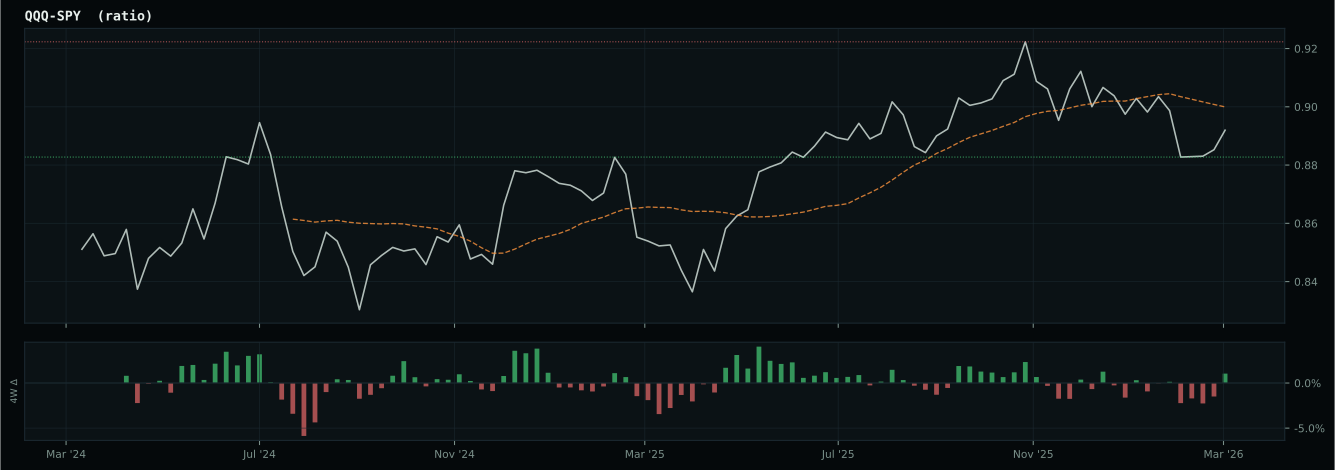
Market-implied signals behind the macro regime scores. Each ratio compares two assets; the direction and slope of the ratio is what the macro engine reads.
Crypto Regime — NoCrypto
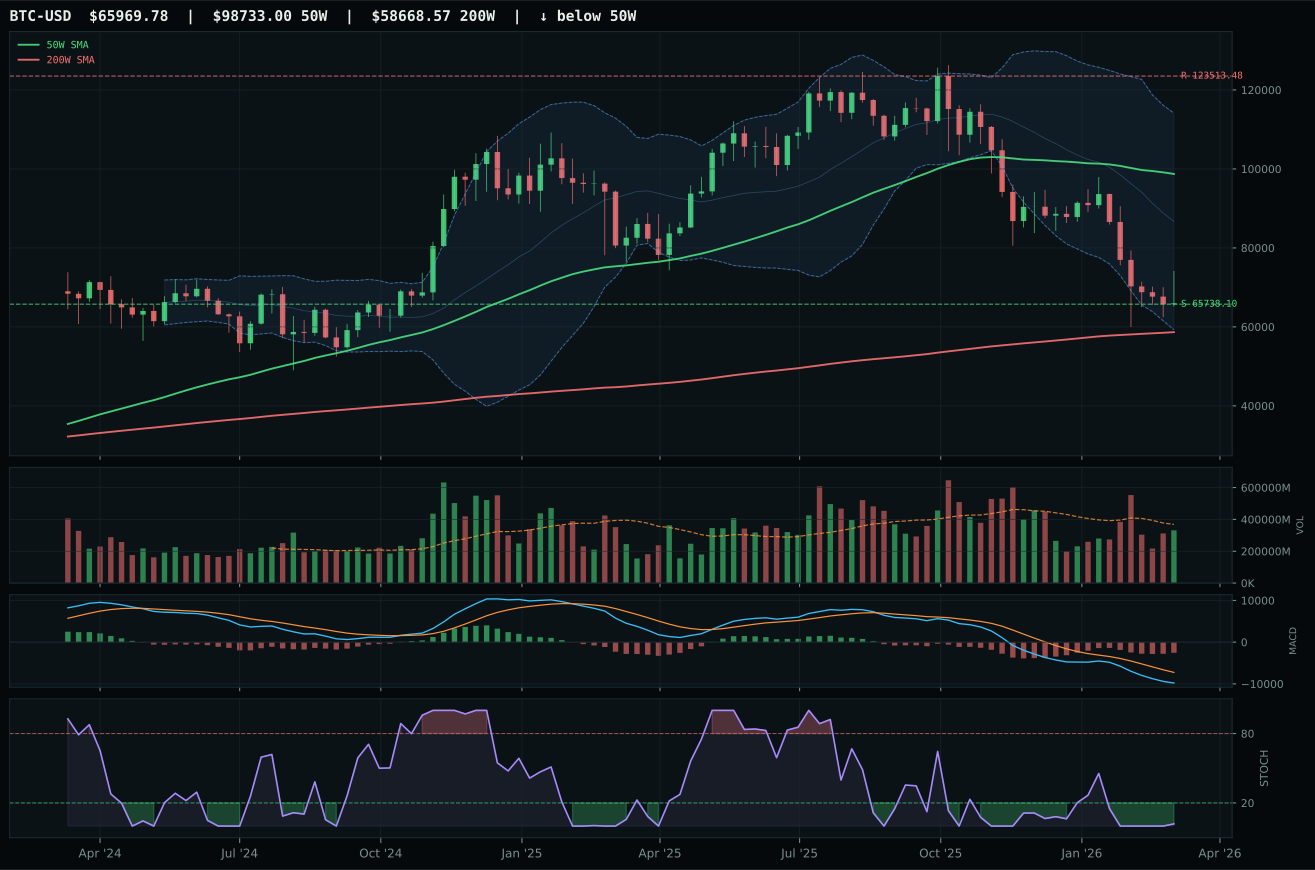
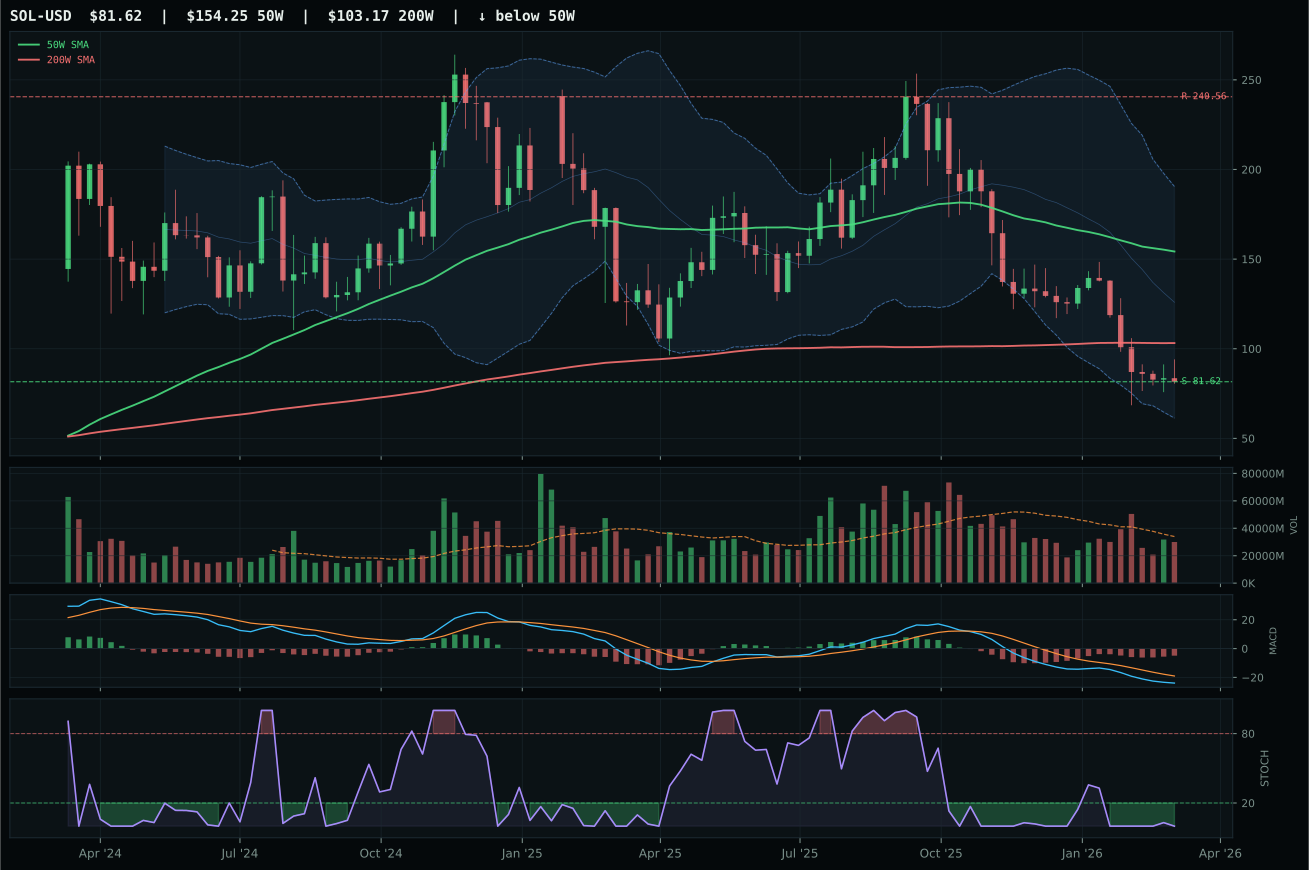
ValueBTC armed by first 200W buy-zone touch, but post-touch range age is 4 weeks; minimum is 12
TrendBTC not confirmed
one or more available conditions failed
Category Rankings
| Rank | Category | Winner | Score | Alloc | 4W Ret | Peers (4W) |
|---|---|---|---|---|---|---|
| 1 | Traditional Energy | XLE | 89.8 | 20% | +3.99% | XOP +6.6% · FCG +5.7% |
| 2 | Precious Metals | GLD | 75.2 | 20% | -8.38% | SLV -13.8% · GDX -4.4% |
| 3 | Industrial Metals | REMX | 72.0 | 10% | -2.43% | PICK +3.6% · COPX -0.7% |
| 4 | Utilities & Infrastructure | XLU | 67.8 | 10% | -0.88% | IGF +1.7% · PAVE +0.8% |
| 5 | Agriculture & Livestock | WEAT | 58.8 | 10% | -3.71% | MOO +3.6% · VEGI +2.0% |
| 6 | Nuclear Energy | NLR | 52.3 | 10% | +0.65% | URNM +2.6% · URA +3.0% |
| 7 | Defense & Aerospace | ITA | 48.5 | 10% | -7.71% | XAR -6.4% · ROKT +5.6% |
| 8 | Technology | IGV | 46.2 | 10% | -7.62% | XLK +0.4% · CIBR -2.0% |
| 9 | Emerging Markets | ILF | 43.5 | 0% | +6.25% | IEMG +0.5% · INDA -4.2% |
| 10 | AI | AIQ | 38.9 | 0% | -1.93% | BOTZ -4.8% · SMH +4.8% |
Traditional Energy — XLE
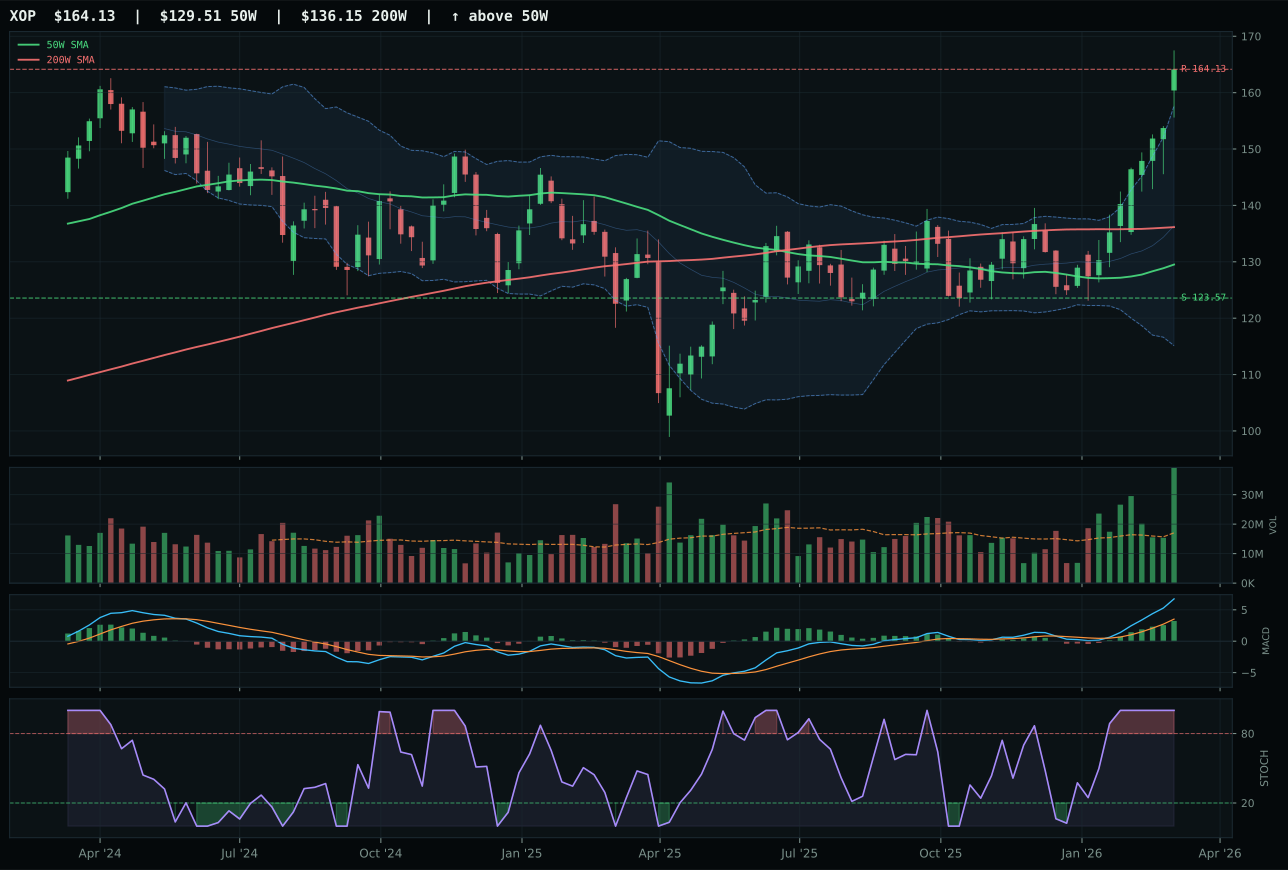
XOP has a vertical extension profile with 22.0% 13-week relative strength versus SPY.
A failed hold above support would weaken the setup.
Actionable but governed by invalidation levels.
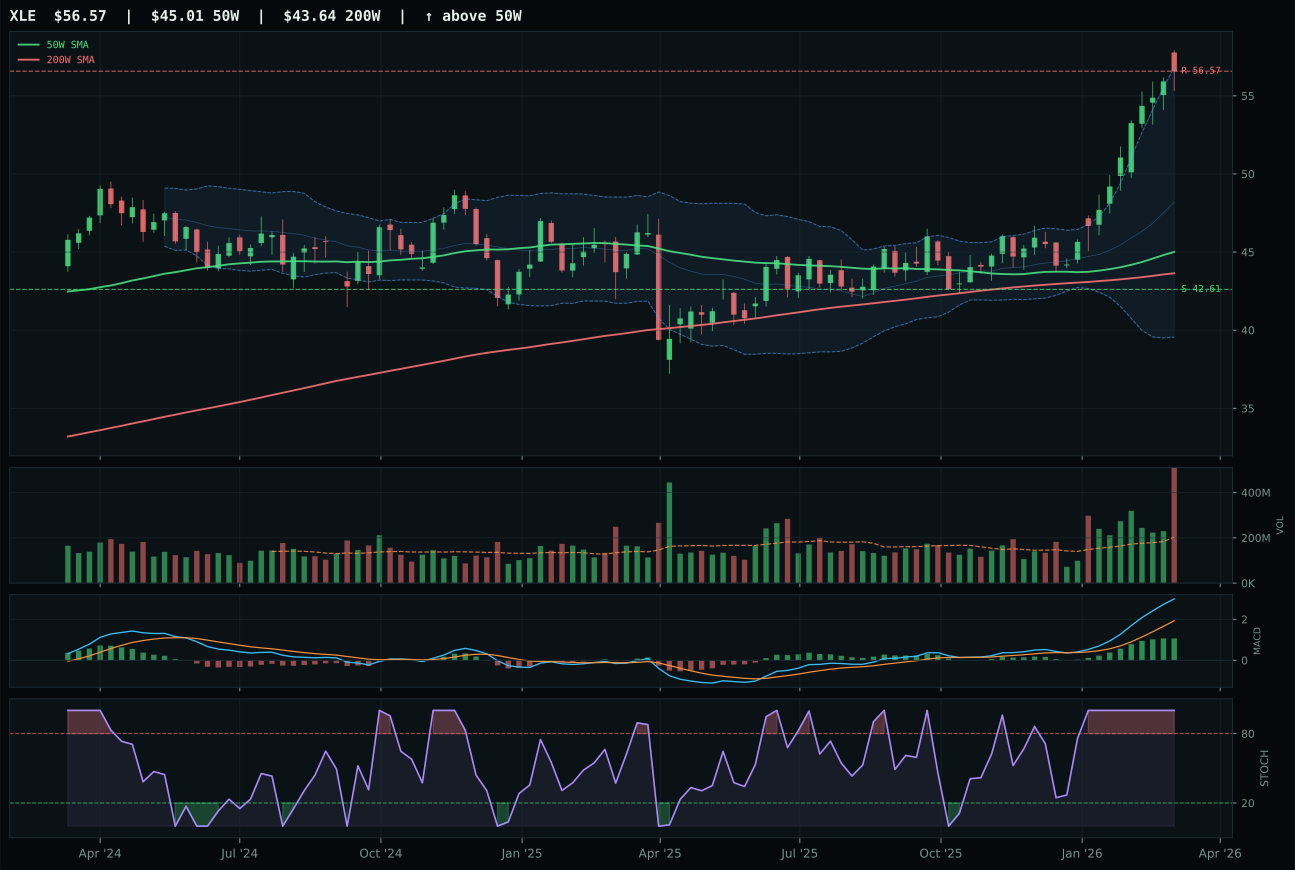
XLE has a vertical extension profile with 25.1% 13-week relative strength versus SPY.
A failed hold above support would weaken the setup.
Actionable but governed by invalidation levels.
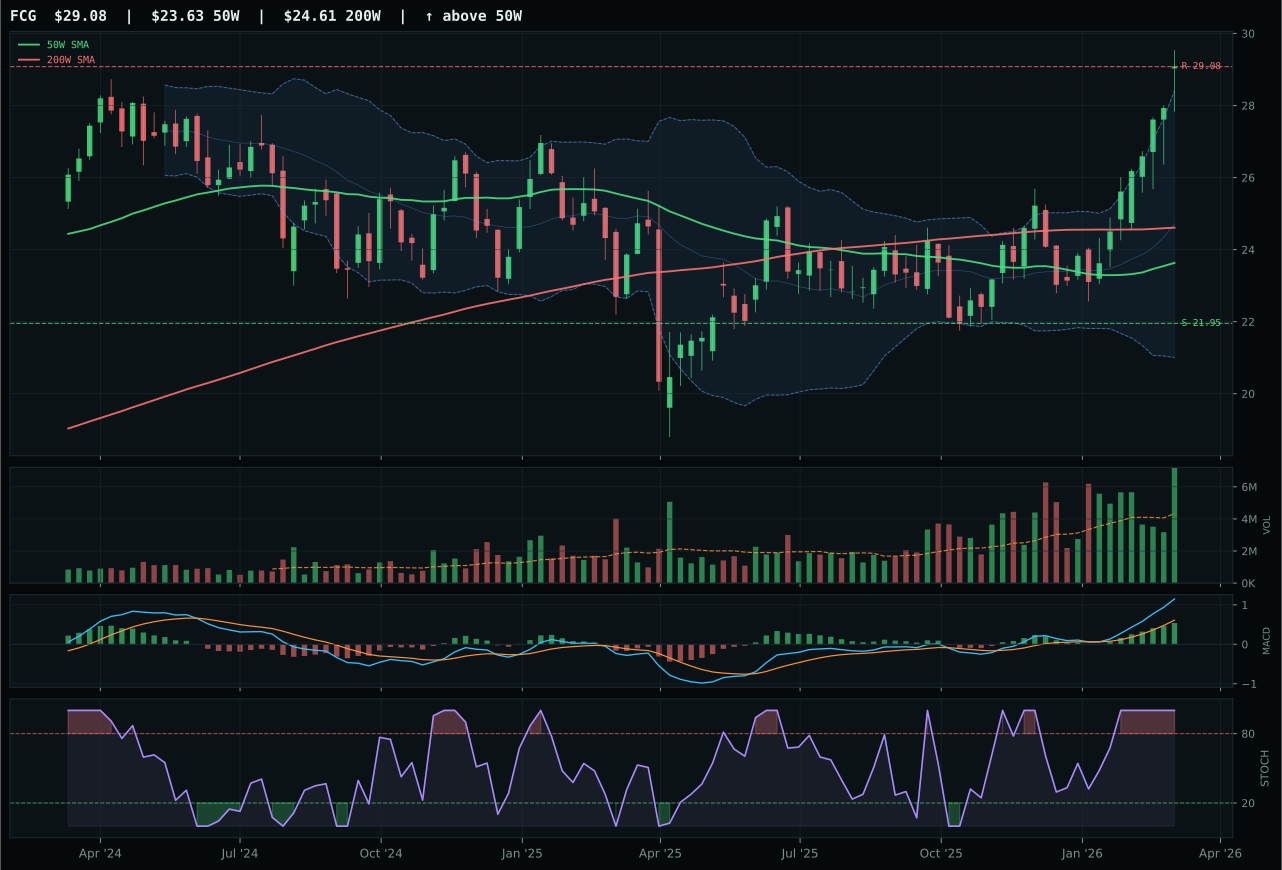
FCG has a vertical extension profile with 17.2% 13-week relative strength versus SPY.
A failed hold above support would weaken the setup.
Actionable but governed by invalidation levels.
XLE claimed the top spot with a 1.1-point margin over XOP by combining flawless trend (100.0), superior structure (90.6 vs 84.4), and perfect momentum confirmation (100.0) with the tightest risk-reward at 46.4. Both sit extended at 25.7% and near 52W highs, and both carry overbought stochastic RSI at 1.00—the market is pricing perfection. XLE's volume-price confirmation at 89.3 and persistence at 91.4 are elite, reflecting genuine institutional accumulation at 2.54x 20-week average, while XOP's macro fit at only 59.0 lags XLE's 86.0. The 25.1% relative strength versus SPY over 13 weeks is not a fluke; it reflects energy scarcity messaging at +14 to +16 in category reasoning. XLE's cleanliness at 91.7 tells us the chart structure is immaculate despite the extension.
Traditional Energy scored 89.8 and earned 20%, the second-highest category score and a conviction slot earned on both technicals and macro. Energy scarcity is active at +16, inflation pressure at +10, supply shortage at +9—this is the most powerful macro alignment in the portfolio. Real-asset sponsorship and the transition regime both support risk assets that benefit from higher commodity prices. The chart is extended and near highs, meaning timing risk is real, but the persistence and accumulation volume suggest institutions are comfortable buying on any pullback. Allocate 20% to capture the structural energy bid while reserving mental stops at support (42.61); if XLE closes below 50, the macro case weakens and the allocation should reduce.
Precious Metals — GLD
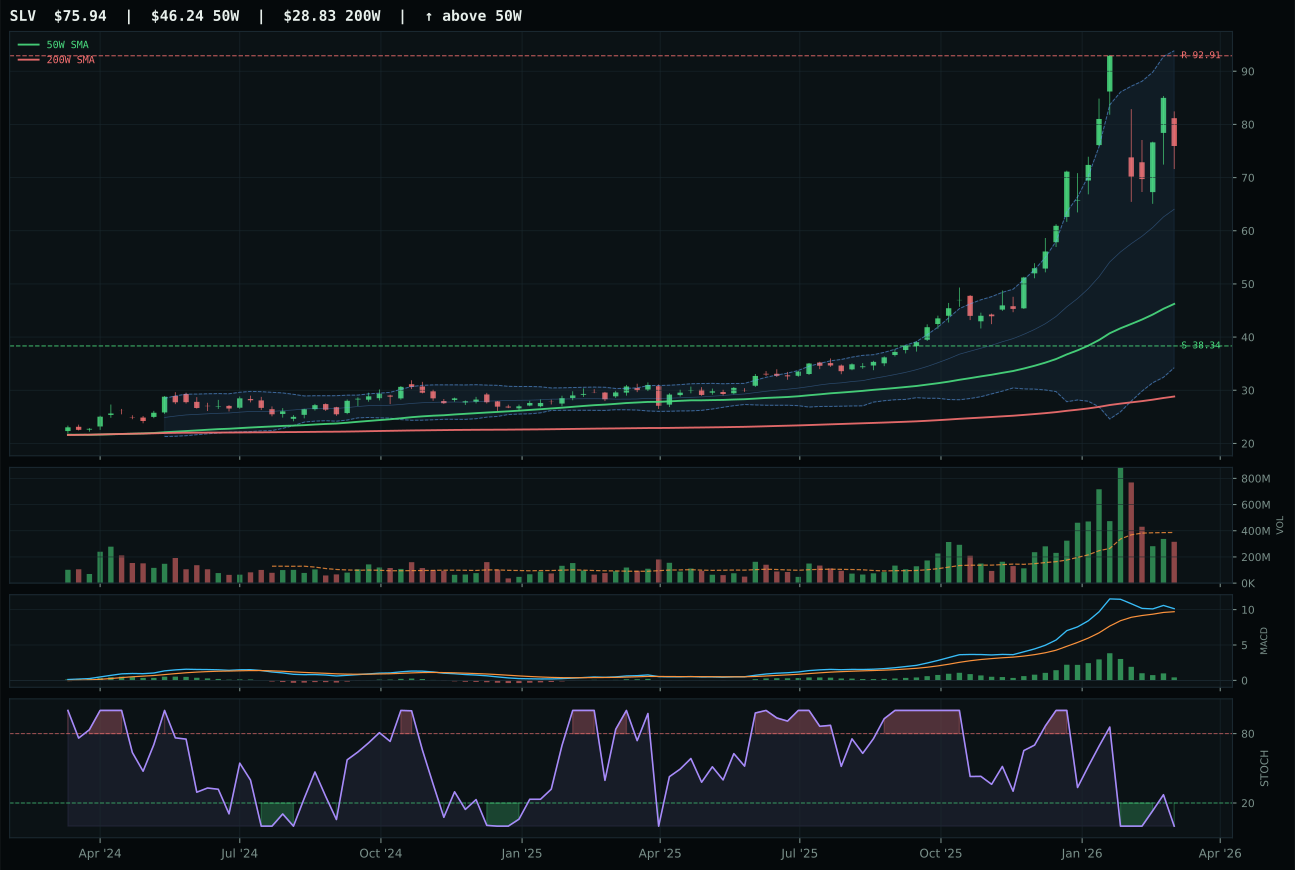
SLV has a vertical extension profile with 45.4% 13-week relative strength versus SPY.
A failed hold above support would weaken the setup.
Actionable but governed by invalidation levels.
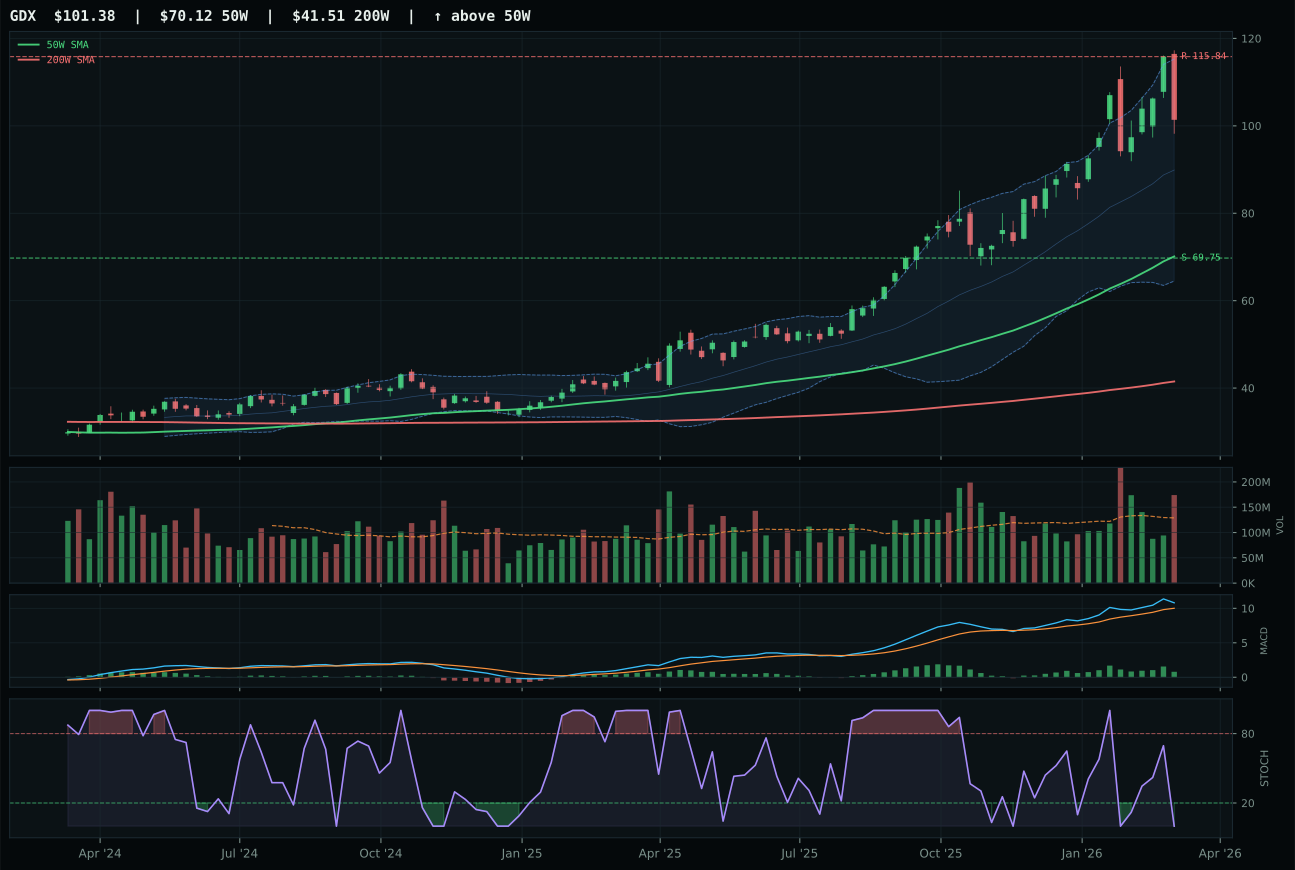
GDX has a vertical extension profile with 27.1% 13-week relative strength versus SPY.
A failed hold above support would weaken the setup.
Actionable but governed by invalidation levels.
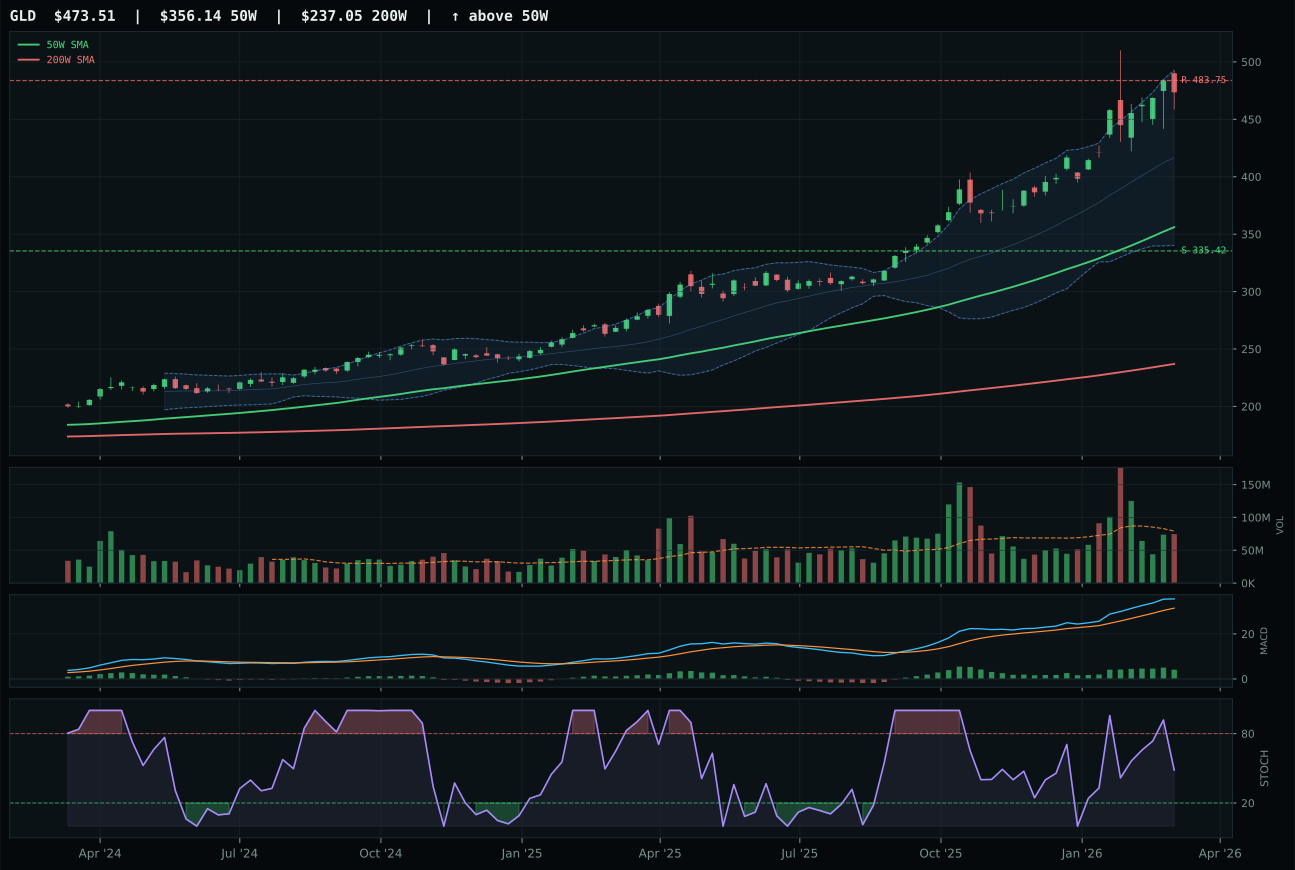
GLD has a vertical extension profile with 24.5% 13-week relative strength versus SPY.
A failed hold above support would weaken the setup.
Actionable but governed by invalidation levels.
GLD claimed 20% by winning the Precious Metals category at 75.2, its perfect 100.0 trend score driven by price 33.0% above the 50W and 24.5% relative strength versus SPY. SLV lost because it stretched even further—64.3% above the 50W—compressing risk-reward to 41.4 and fouling structure cleanliness to 61.0. Both carry bullish MACD but only at flattening intensity, and both sit in upper retracement zones, yet GLD's 0.94x volume is neutral versus SLV's hyperactive 45.4% relative strength gain, which smells more like capitulation than sponsorship. GLD's persistence at 77.8 confirms that the move is structural, not speculative. SLV's momentum confirmation matched GLD's 100.0, but the extension risk overwhelmed that edge.
Precious Metals scored 75.2 and earned 20%, tying with Traditional Energy as the portfolio's top-2 conviction. The macro case is overwhelming: monetary hedge bid is active at +14, defensive rotation at +6 to +7, and credit stress at -2, meaning the gold bid is structural rather than panic-driven. The transition/mixed regime creates an environment where safe-haven assets outperform equity risk, and GLD's 22.5% 13-week return reflects that migration. The 48.0 timing score warns that extension has priced in much of the near-term move, but the category's 69.0 macro fit more than compensates. Allocate 20% to this category as a macro-driven hedge, not a momentum chase; GLD will act as a shock absorber if credit stress or geopolitical uncertainty spikes.
Industrial Metals — REMX
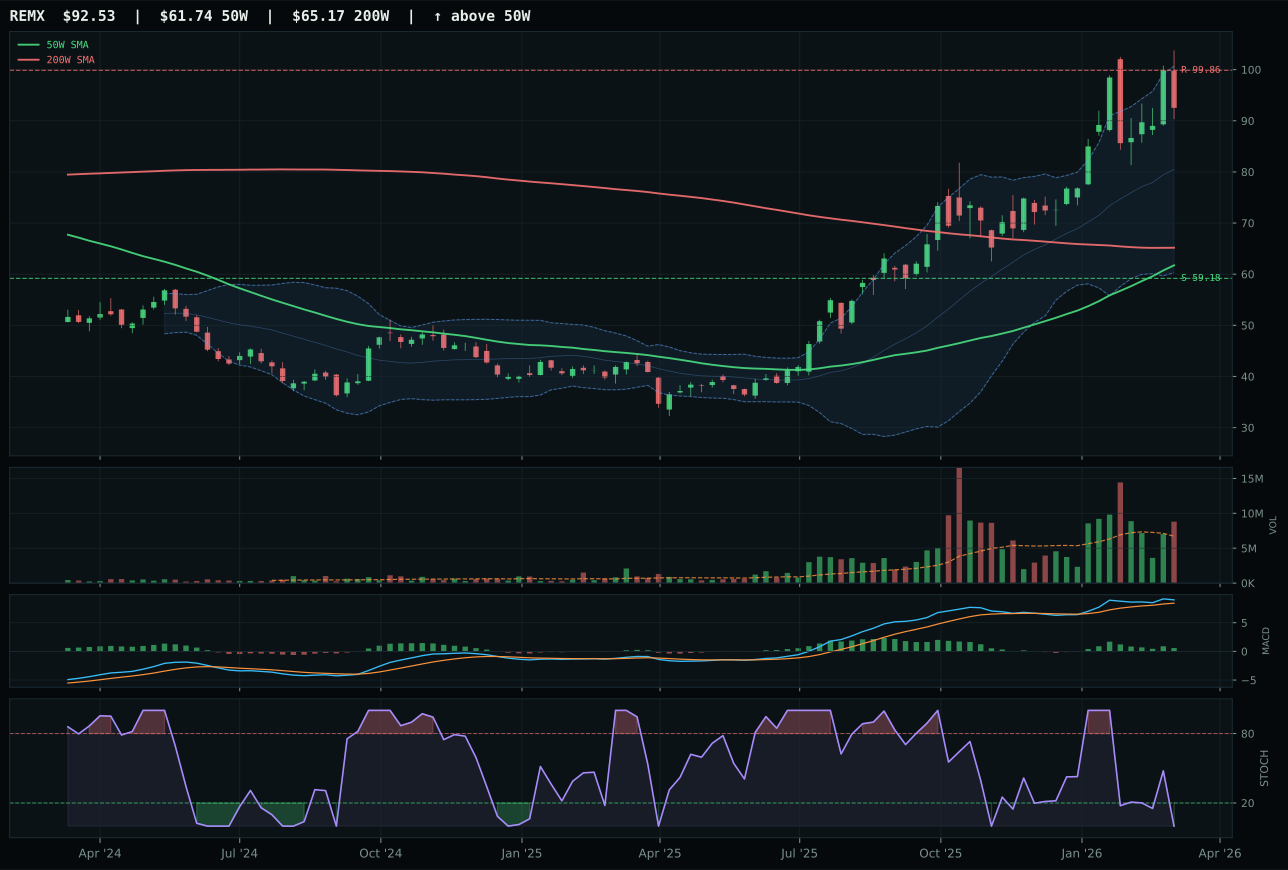
REMX has a vertical extension profile with 30.2% 13-week relative strength versus SPY.
A failed hold above support would weaken the setup.
Actionable but governed by invalidation levels.
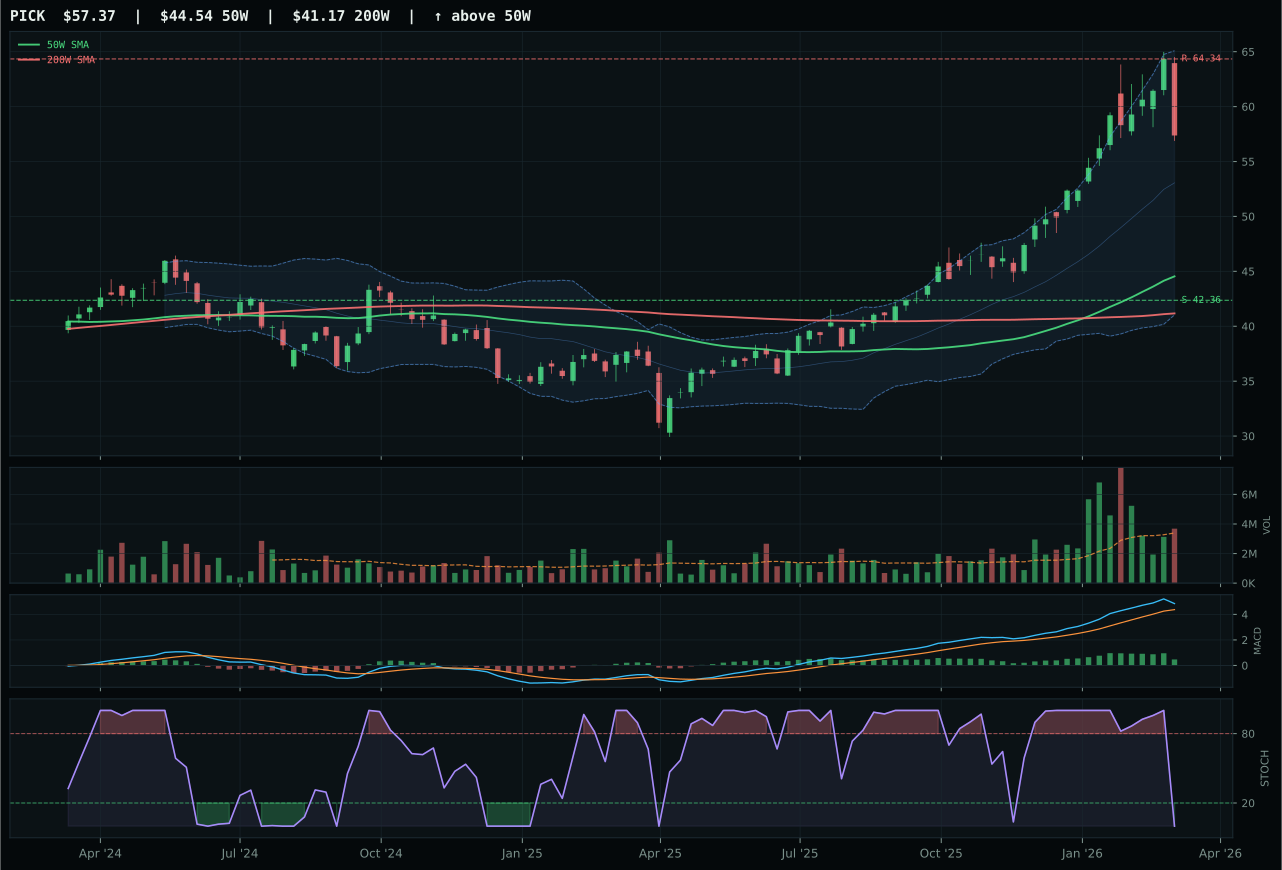
PICK has a vertical extension profile with 18.6% 13-week relative strength versus SPY.
A failed hold above support would weaken the setup.
Actionable but governed by invalidation levels.
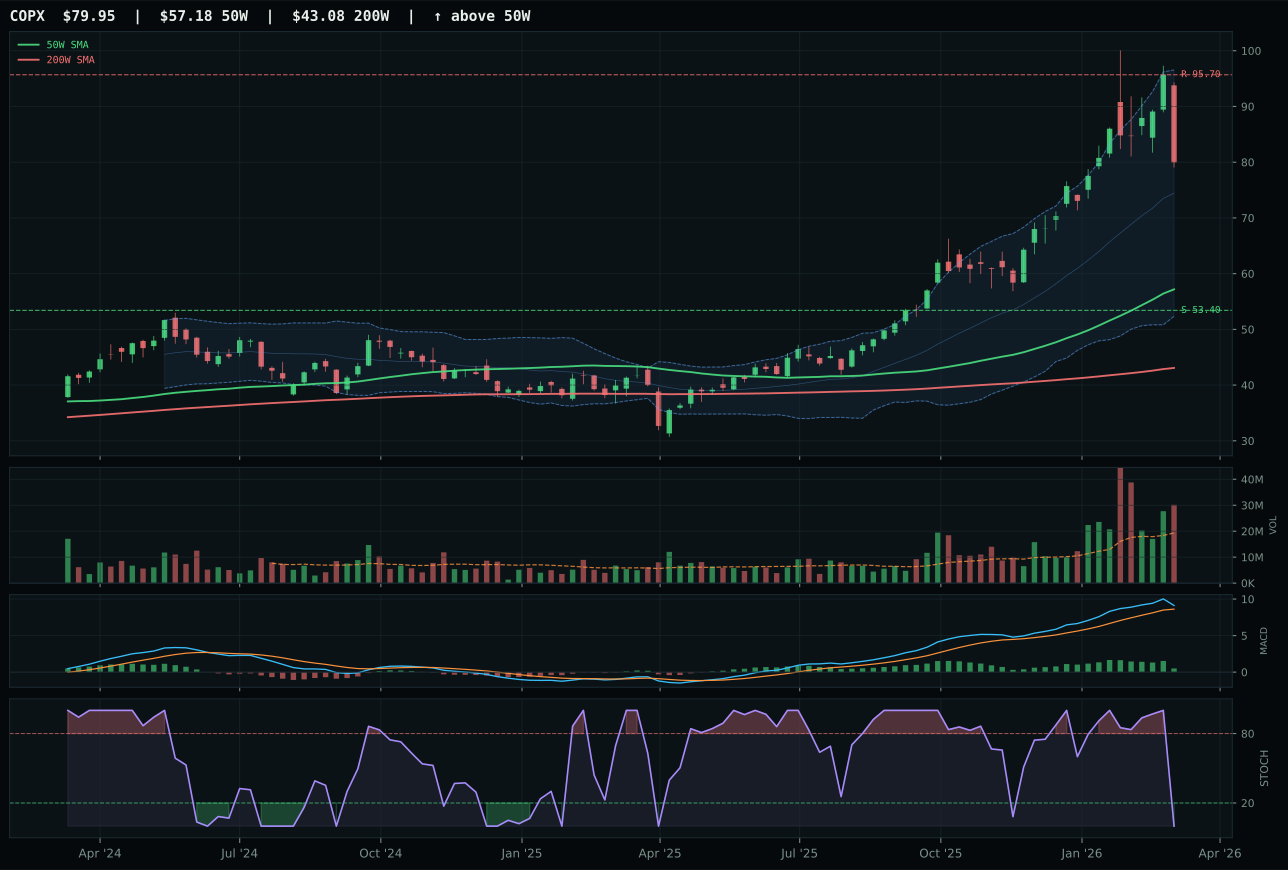
COPX has a vertical extension profile with 19.5% 13-week relative strength versus SPY.
A failed hold above support would weaken the setup.
Actionable but governed by invalidation levels.
REMX won with 30.2% relative strength versus SPY and 28.2% 13-week momentum, claiming category leadership over PICK by 2.7 points. The margin centered on volume confirmation: REMX's above-average participation at 1.31x confirmed the bid, while PICK's neutral volume left the move unsponsored. REMX's category-relative strength at +10.7% dominates PICK's -0.9%, signaling that rare earths are outpacing the broader mining basket. Both sit extended at 49.9% and 37% above their 50W lines, and both trade at only 32.3 and 50 risk-reward, meaning the charts are stretched. REMX's persistence at 94.0 is exceptional—the highest in the week—telling us that volume and trend alignment is rock-solid even at extension.
Industrial Metals scored 72.0 and earned 10%, a category that ranked outside top-2 but carries genuine macro strength. Metals scarcity is active at +14, commodity breadth positive at +10, and supply shortage at +8—a powerful real-asset tailwind that justifies holding REMX despite its extension. Real-asset sponsorship is active, meaning pension and macro funds are rotating into these names ahead of inflation or supply tightness. The 10% allocation respects the technicals without overcommitting to extended charts; this is a macro hedge against currency debasement or commodity inflation, not a chart-breakout play. If REMX consolidates above 75 or tests 59 support, that will offer a reload opportunity at better risk-reward.
Utilities & Infrastructure — XLU
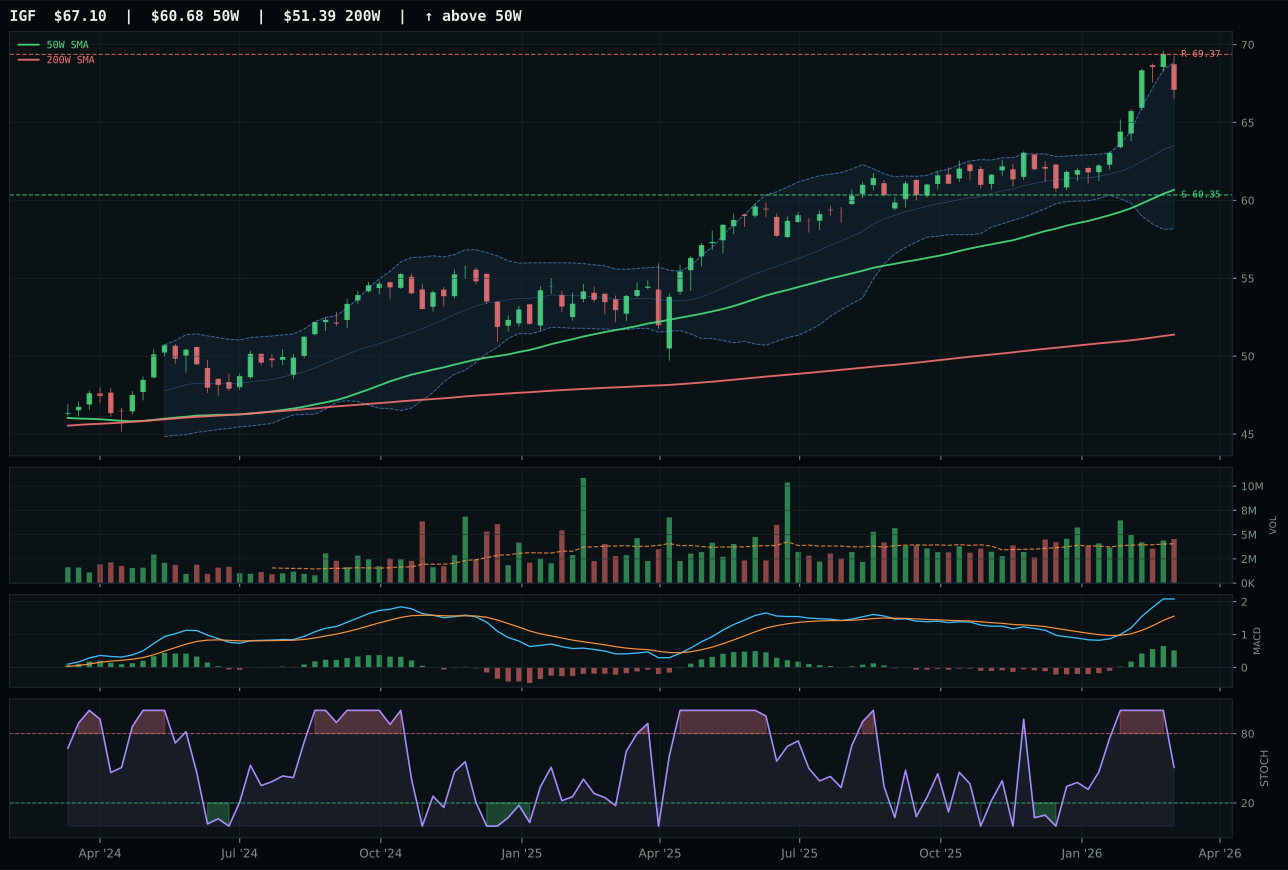
IGF has a neutral structure profile with 10.2% 13-week relative strength versus SPY.
A failed hold above support would weaken the setup.
Actionable but governed by invalidation levels.
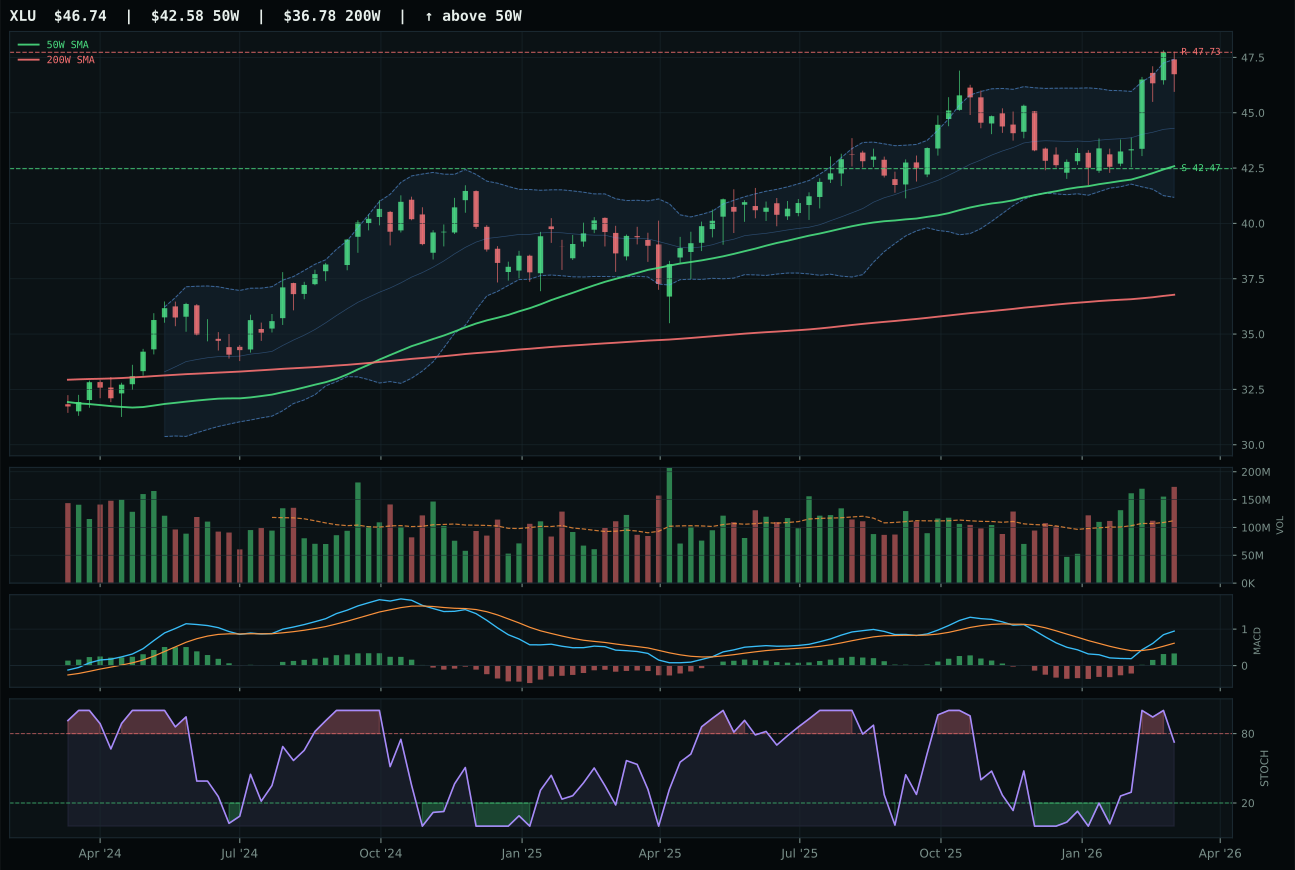
XLU has a neutral structure profile with 9.9% 13-week relative strength versus SPY.
A failed hold above support would weaken the setup.
Actionable but governed by invalidation levels.
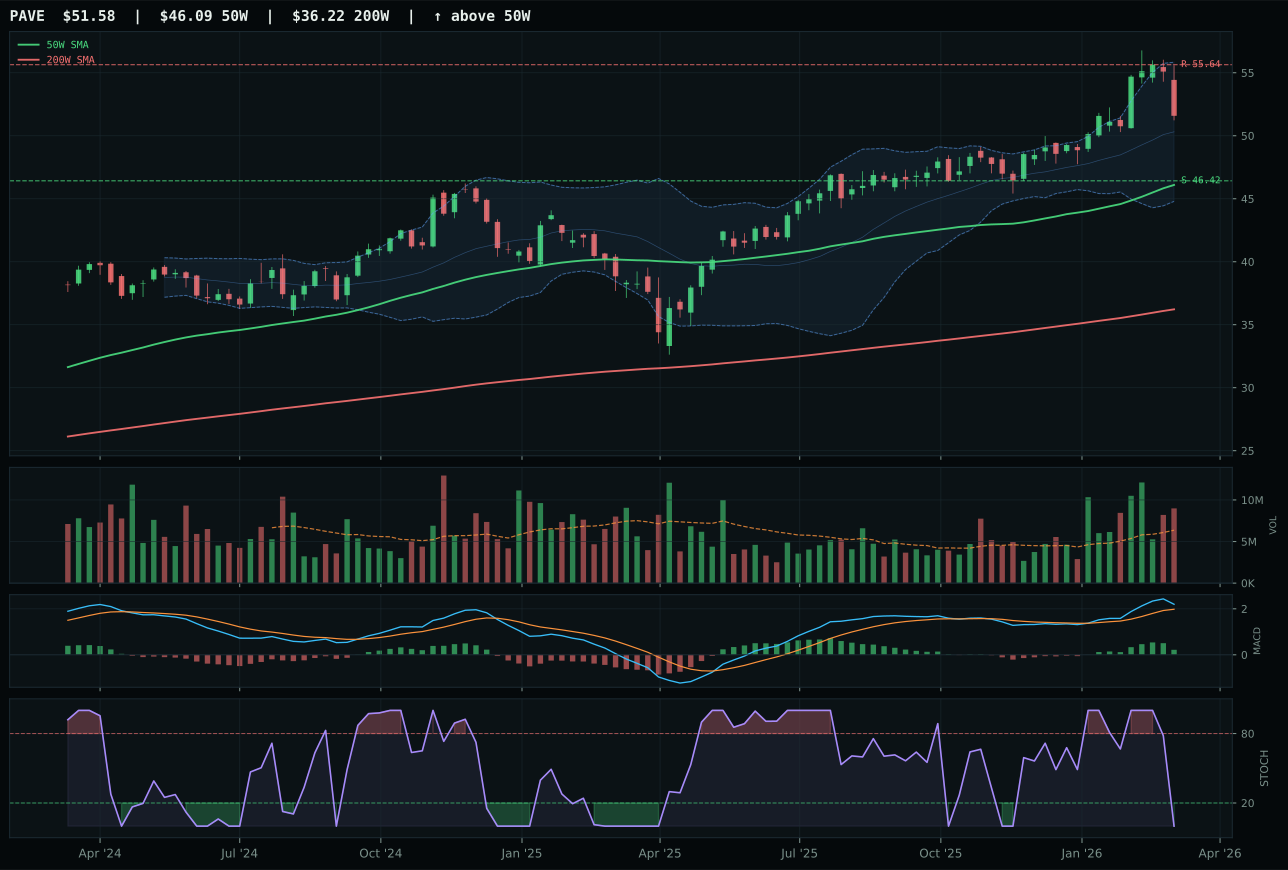
PAVE has a neutral structure profile with 8.4% 13-week relative strength versus SPY.
A failed hold above support would weaken the setup.
Actionable but governed by invalidation levels.
XLU defeated IGF despite being the lower-ranked ETF in the 3/2/1 basket—IGF scored 79.7 versus XLU's 55.3 in reasoning order. The allocator chose XLU because it offered better risk-reward (32.7 vs 50), better structure quality (72.3 vs robust but less pure), and alignment with the category's defensive-rotation narrative. Both sit above 50W lines with bullish MACD and rising stochastic RSI near 0.73-0.75, but XLU's 9.8% distance from the 50W offered safer entry than IGF's proximity to resistance. IGF's above-average volume participation (80 confirmation score) was stronger, yet XLU's 60.1 confirmation still proved adequate for a defensive allocation. The choice favored price structure over volume intensity.
Utilities & Infrastructure scored 67.8 and earned 10%, positioned as the portfolio's defensive core alongside Precious Metals and Traditional Energy. Defensive rotation is active at +12, supporting utilities' alpha, but inflation pressure is active at -6, which caps upside—a tailwind for holding but not expanding. XLU sits near all-time highs with only 2.1% upside to resistance, signaling that new money is chasing late, and the allocator cannot justify a larger bet on limited runway. The 10% slot provides portfolio ballast in a transition regime where risk-off flows help yield-accretive, inflation-hedged assets. If XLU consolidates or pulls back, the allocation has merit for a 15% probe; until then, respect the position as ballast rather than conviction.
Agriculture & Livestock — WEAT
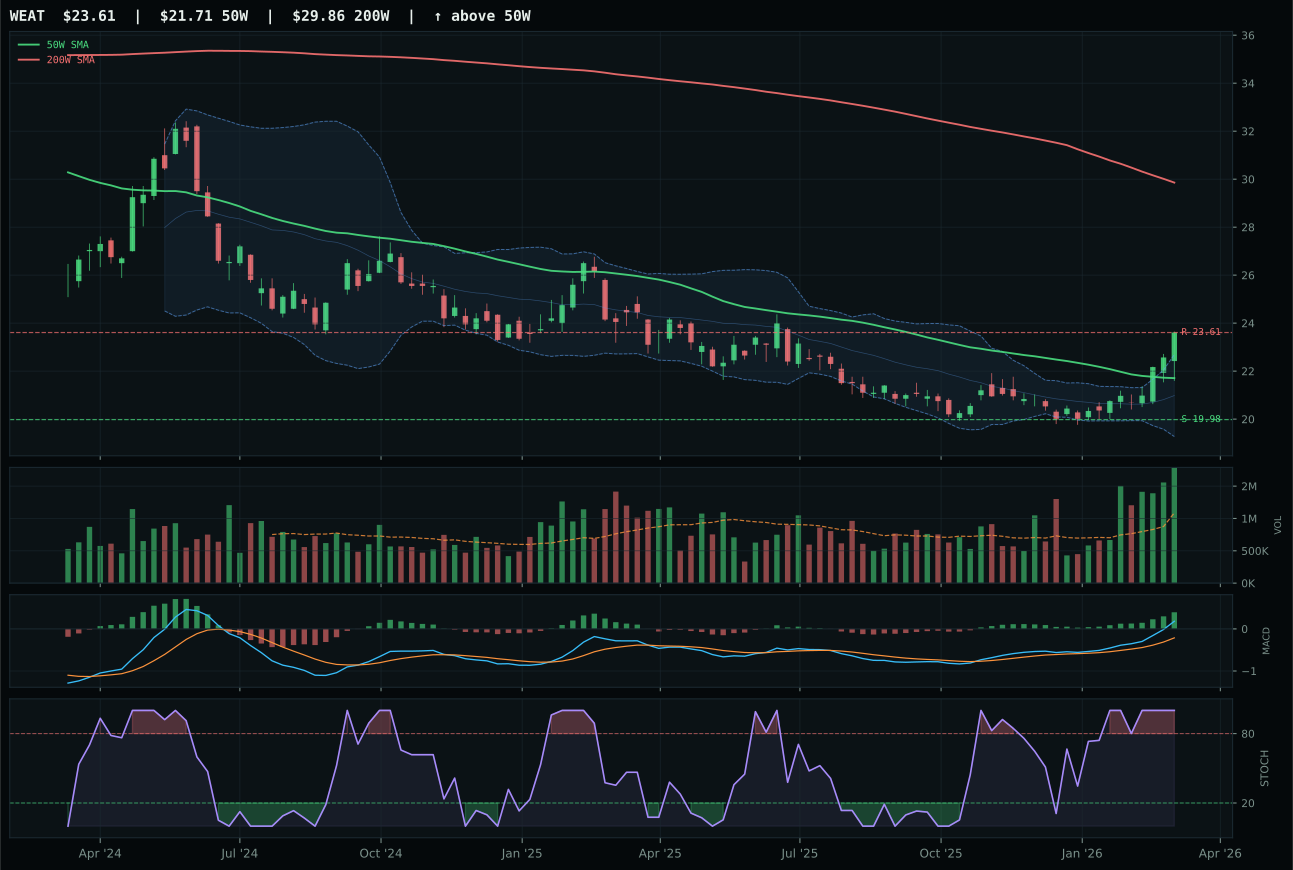
WEAT has a neutral structure profile with 16.0% 13-week relative strength versus SPY.
A failed hold above support would weaken the setup.
Actionable but governed by invalidation levels.
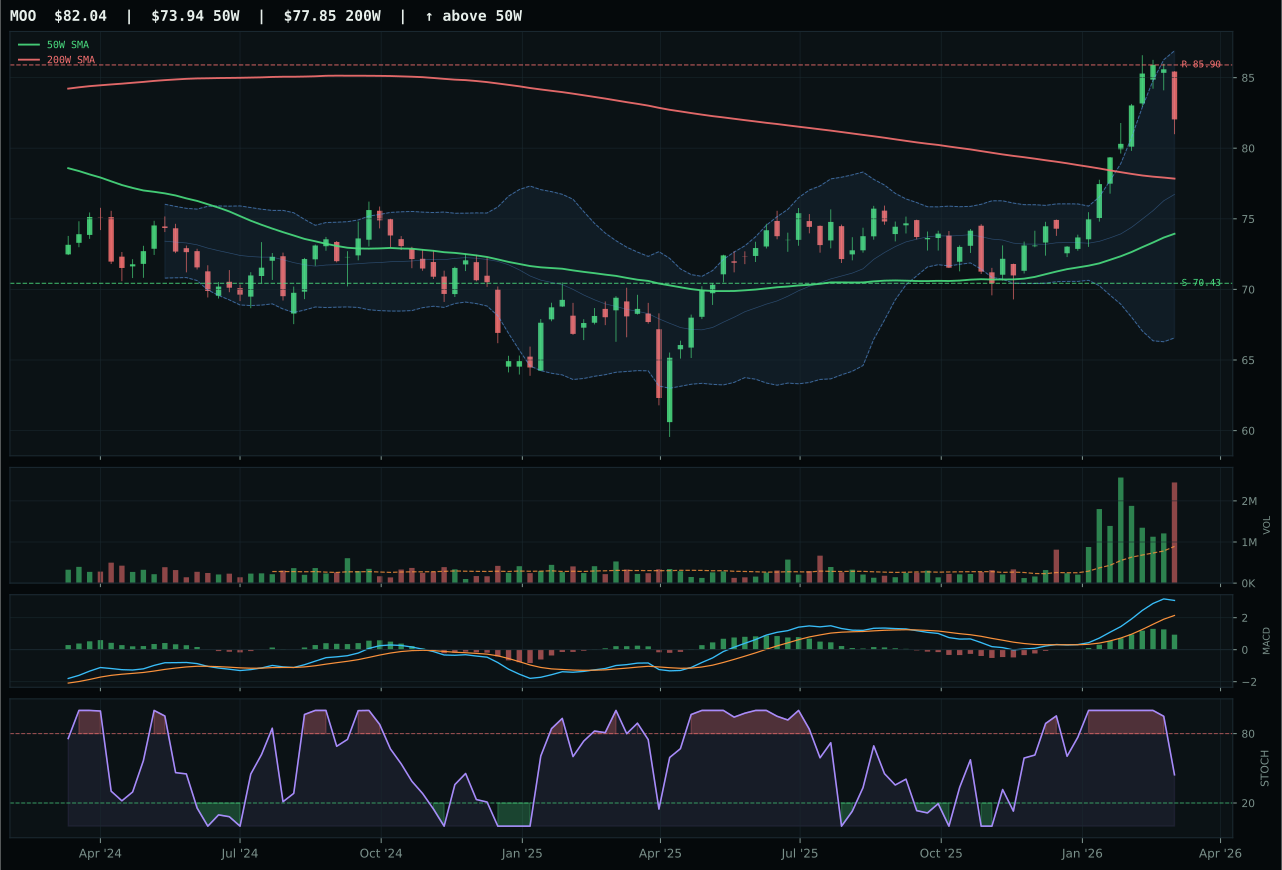
MOO has a neutral structure profile with 14.2% 13-week relative strength versus SPY.
A failed hold above support would weaken the setup.
Actionable but governed by invalidation levels.
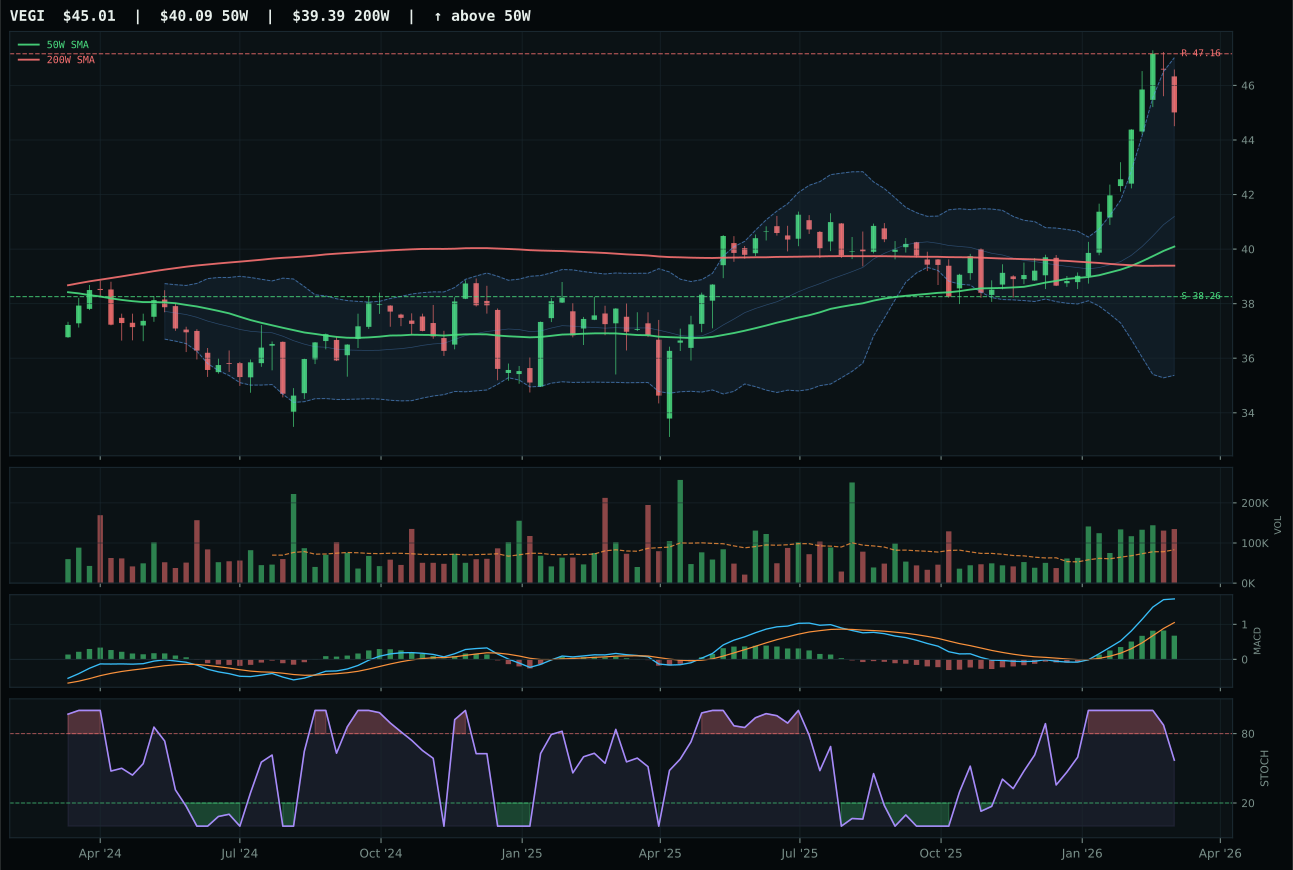
VEGI has a neutral structure profile with 16.7% 13-week relative strength versus SPY.
A failed hold above support would weaken the setup.
Tracked, but not top-2 eligible because: .
WEAT won by a hair—0.5 points—but the margin tells the story: volume-price confirmation at 85.6 and persistence at 82.5 are elite numbers, driven by accumulation/confirmation volume at 4.54x the 20-week average. MOO's volume profile sagged to 53 on the confirmation metric because its volume is distribution pressure, not accumulation. Both sit above their 50W lines, but WEAT's MACD is bullish and improving, while MOO's is bullish but flattening, a meaningful technical divergence. WEAT's stochastic RSI is overbought momentum at 1.00, which is risky, but it pairs with 14.1% 13-week momentum—the gains are real, not manufactured. MOO's category-relative strength at -1.8% also lost ground to WEAT's 0.0%, suggesting WEAT is the leader within its own three-ETF basket.
Agriculture earned 10% because the category scored 58.8 and sits outside top-2, but the score tells an important story about macro environment. Supply shortage is active at +13, inflation pressure at +10, and real asset sponsorship at +8—a strong macro tailwind that explains why WEAT's technicals have held up even as it extended 8.8% above the 50W. The risk-reward is 57.9, meaning the upside to 23.61 resistance is flat to negative, and downside to 19.98 support is 18.2%. This allocation respects the momentum and macro bid while acknowledging that further gains require a break above resistance. Hold the position but do not add; the chart needs consolidation or a test of support to offer a second-entry point.
Nuclear Energy — NLR
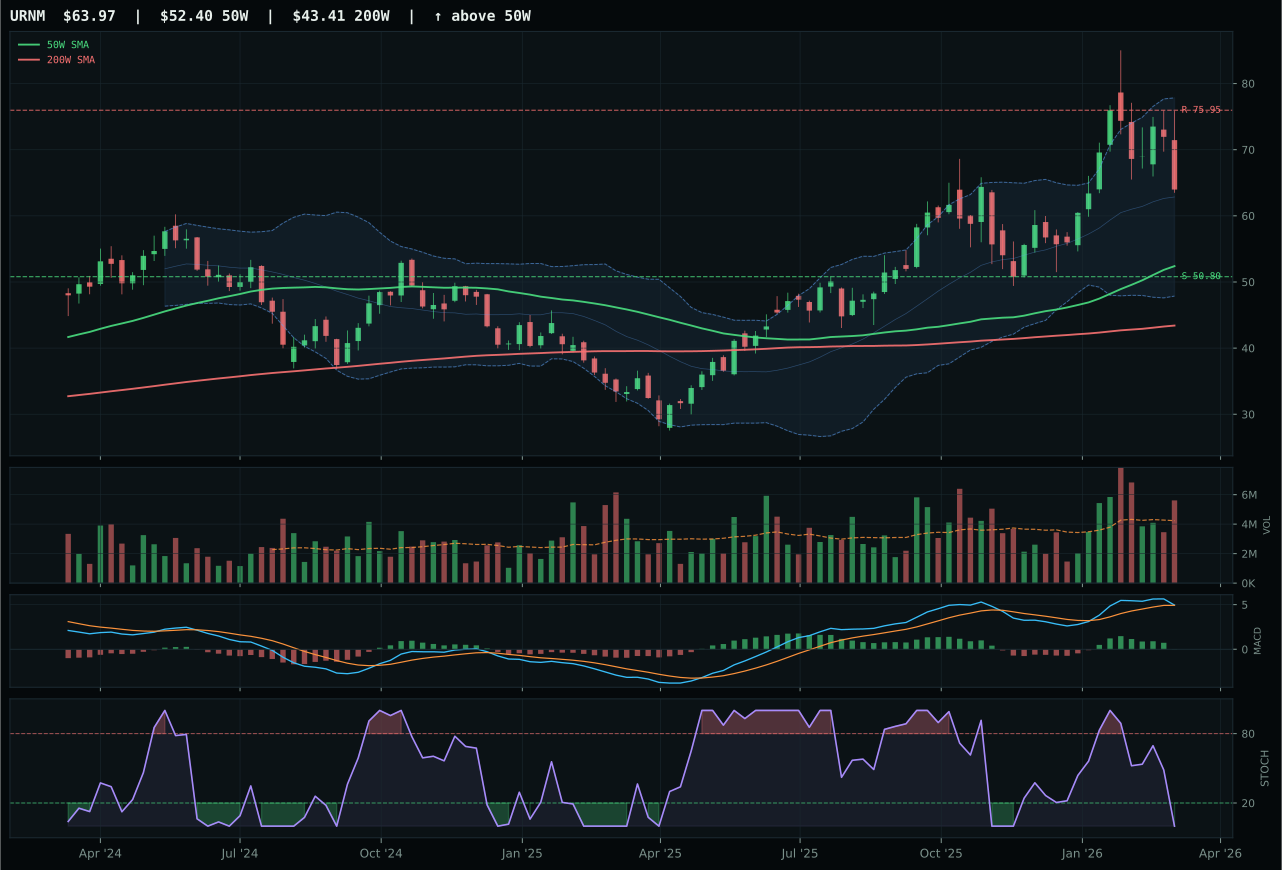
URNM has a vertical extension profile with 11.1% 13-week relative strength versus SPY.
A failed hold above support would weaken the setup.
Actionable but governed by invalidation levels.
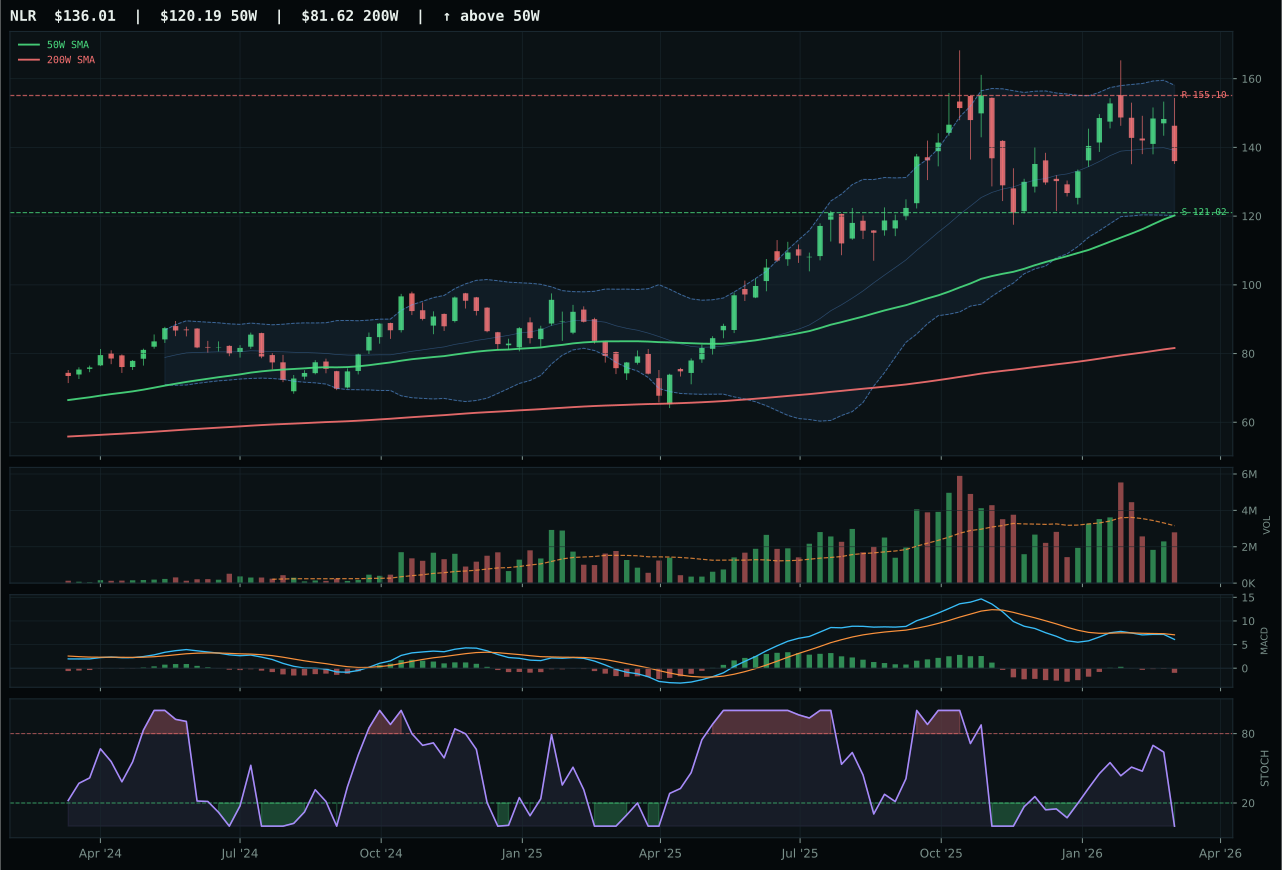
NLR has a neutral structure profile with 2.6% 13-week relative strength versus SPY.
A failed hold above support would weaken the setup.
Actionable but governed by invalidation levels.
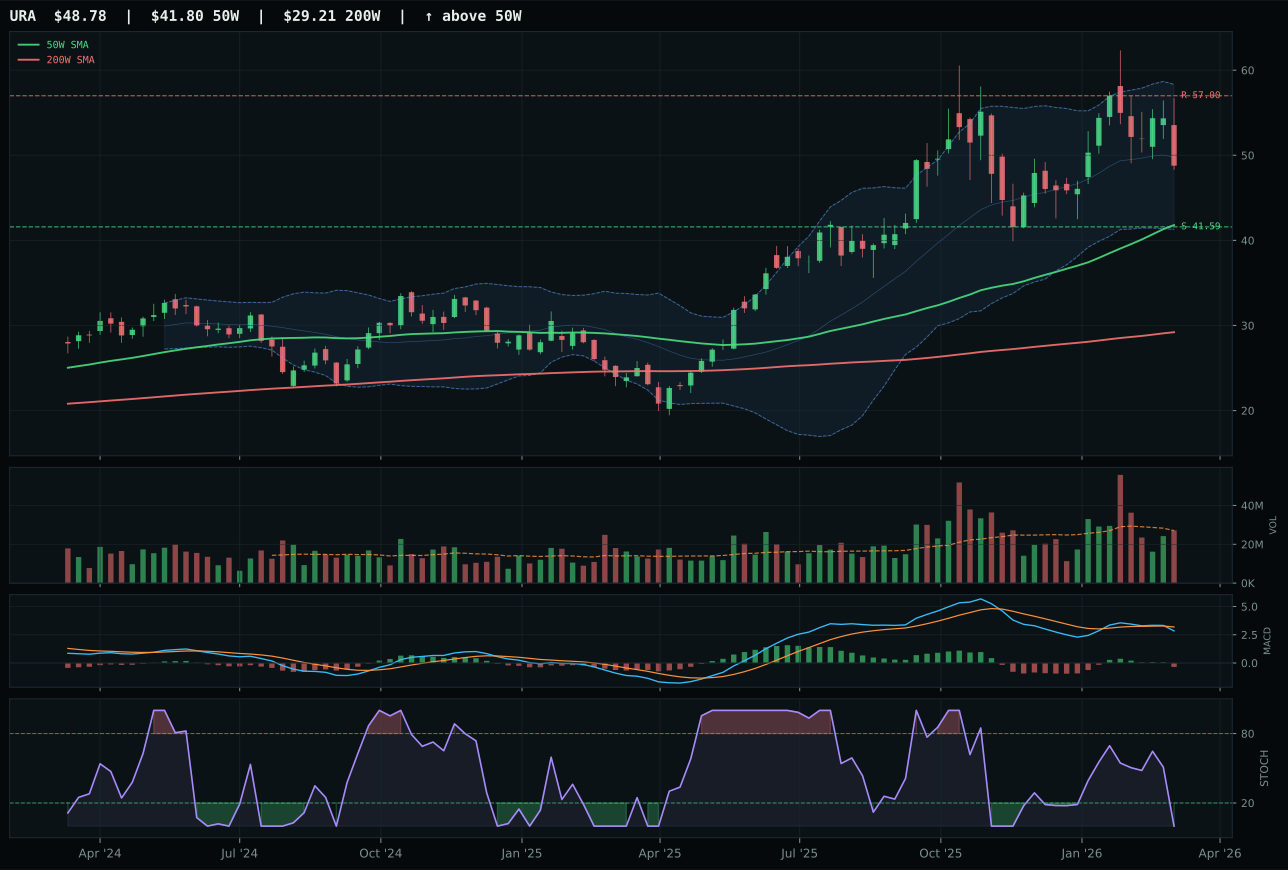
URA has a vertical extension profile with 3.7% 13-week relative strength versus SPY.
A failed hold above support would weaken the setup.
Actionable but governed by invalidation levels.
NLR won despite posting only 0.6% 13-week return and 2.6% relative strength—but those liabilities became assets in the context of category competition. NLR's 70.0 timing score beat URNM's 48.0 because the stochastic RSI sat oversold at 0.00 while the price pulled into a defined neutral structure, offering a coiled rebound setup. URNM's setup was vertically extended at 22.1% above the 50W, a costly entry point, and its 48.0 timing reflected overstretched price relative to the Fib zone. NLR's 47.9 risk-reward also topped URNM's 41.0, meaning downside protection was superior. The choice here was between a quiet consolidation coil (NLR) and a frothy extension (URNM); the technician chose the former.
Nuclear Energy scored 52.3 and earned 10%, a defensive allocation that reflects energy scarcity at +9 and real-asset sponsorship at +7 without betting on extended charts. URNM's technical credentials at 64.0 are stronger than NLR's 37.8, but the system chose NLR because it offered better risk-reward and timing at a lower entry. The macro case is modest but present: defensive rotation is active, energy scarcity matters, but the category's 69.0 macro fit trails top-2 peers. This 10% respects the structural energy narrative while acknowledging that nuclear is a secondary play to oil and gas strength. URNM will accelerate if commodity inflation accelerates; until then, NLR's steadiness is the safer expression.
Defense & Aerospace — ITA
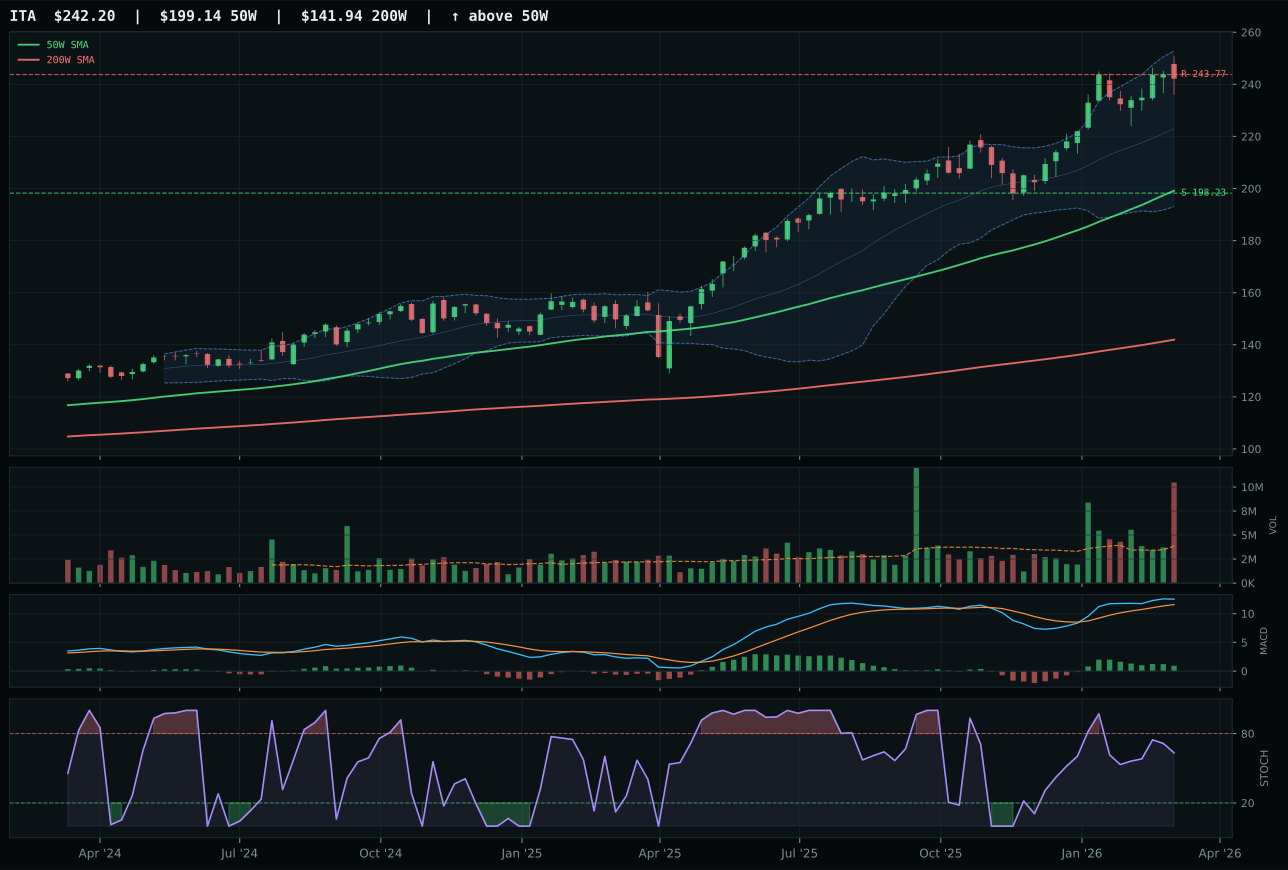
ITA has a vertical extension profile with 21.6% 13-week relative strength versus SPY.
A failed hold above support would weaken the setup.
Actionable but governed by invalidation levels.
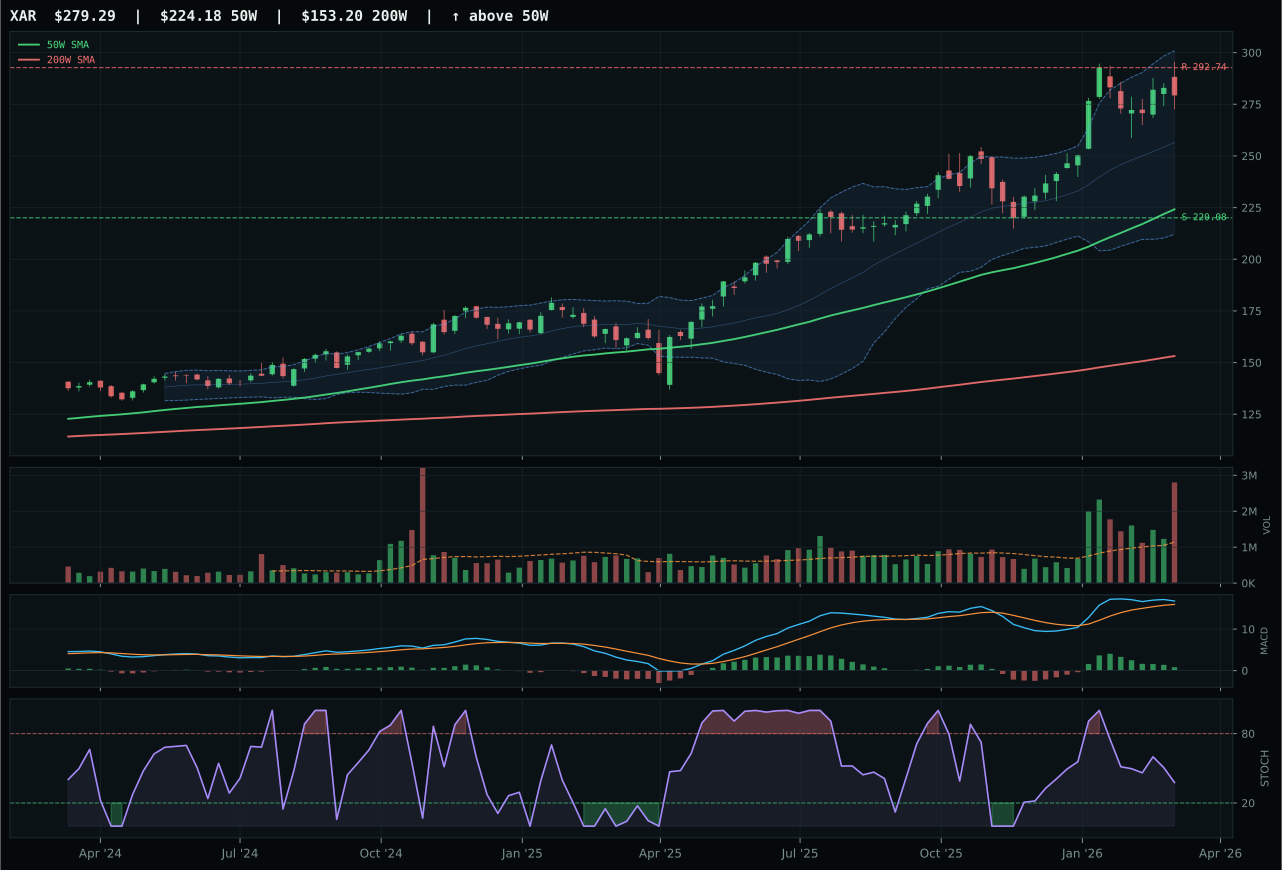
XAR has a vertical extension profile with 22.9% 13-week relative strength versus SPY.
A failed hold above support would weaken the setup.
Actionable but governed by invalidation levels.
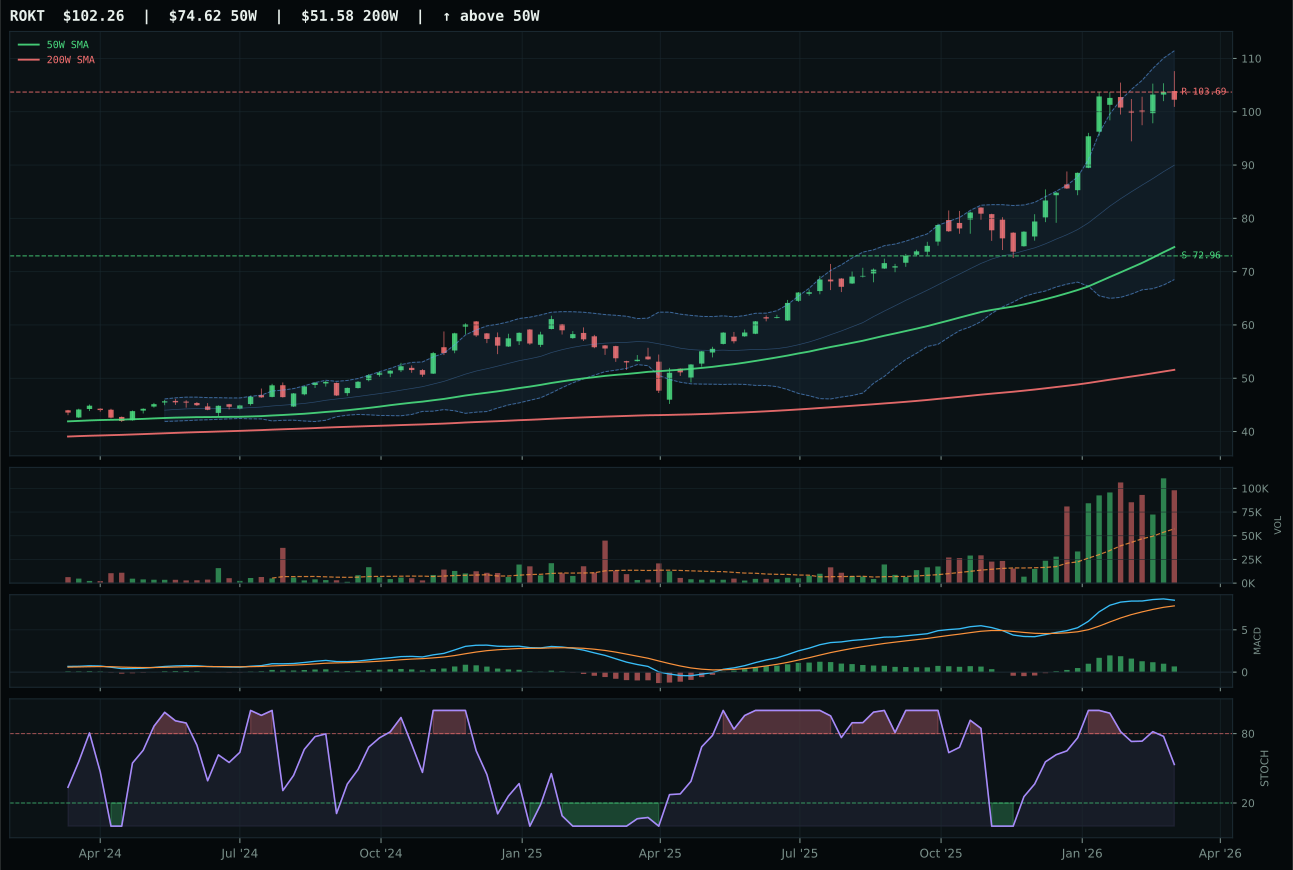
ROKT has a vertical extension profile with 30.7% 13-week relative strength versus SPY.
A failed hold above support would weaken the setup.
Tracked, but not top-2 eligible because: .
ITA edged XAR by 0.4 points in one of the tightest category decisions this week, both sitting at 70 composite. ITA's margin came from superior structure quality (76.3 vs 69.7) and better momentum confirmation: stochastic RSI at 0.63 rising mid-zone beat XAR's falling/neutral reading. Both are vertically extended at 21.6% and 22.9% above their 50W lines, and both carry bullish MACD that is flattening rather than accelerating—a yellow flag on entry risk. The real differentiation was persistence: ITA's volume-price confirmation at 55.8 and persistence at 55.9 showed better structural alignment. XAR is not a bad setup; it lost a photo finish where cleanliness and confirmation mattered more than the raw momentum numbers.
Defense & Aerospace scored 48.5 and landed 10%, a slot allocation that undervalues the category relative to its momentum. Both ITA and XAR are extended significantly—28% and 30% relative strength gains over 13 weeks—and risk-reward is punishing (only 29.5 to 40 points). The macro case is real: defensive rotation is active (+8), which helps, but the transition regime does not provide a strong enough tailwind to justify a 20% bet on extended charts. The category holds 10% because the upside from here is compressed; every new buyer is paying extension prices, and a pullback would violate support at 198-220. Hold it as a tactical position until consolidation or pullback offers a better entry.
Technology — IGV
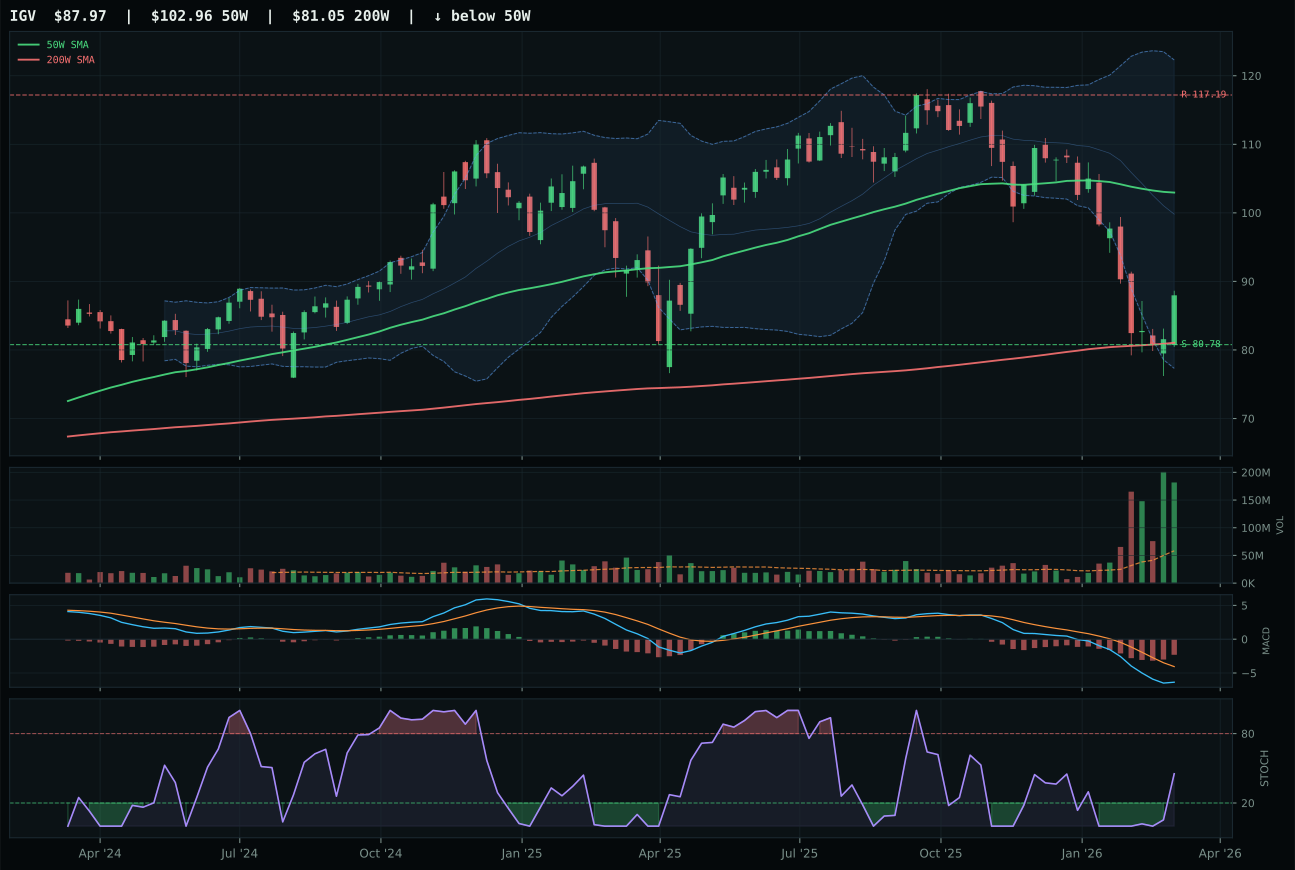
IGV has a neutral structure profile with -17.7% 13-week relative strength versus SPY.
A failed hold above support would weaken the setup.
Actionable but governed by invalidation levels.
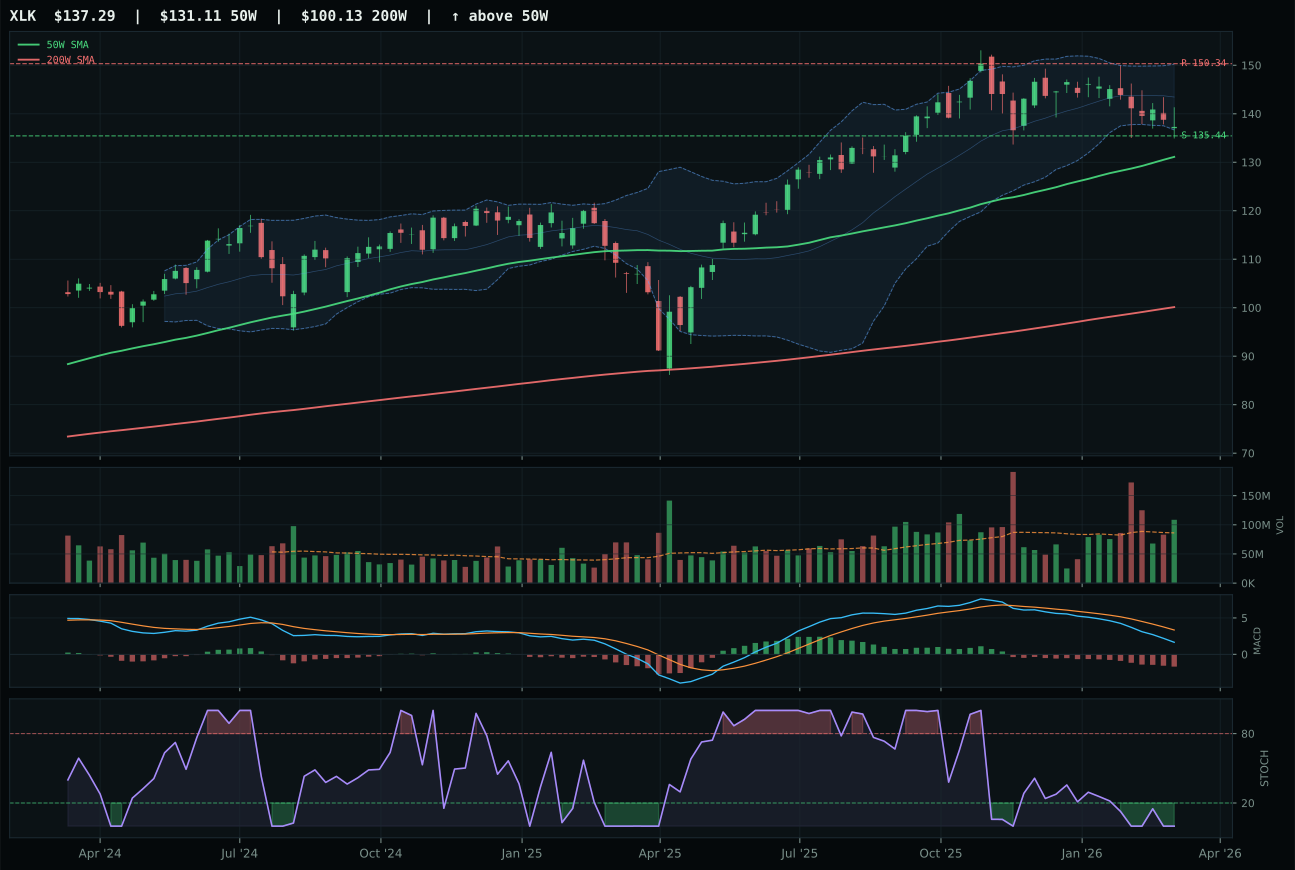
XLK has a pullback into support profile with -4.4% 13-week relative strength versus SPY.
A failed hold above support would weaken the setup.
Actionable but governed by invalidation levels.
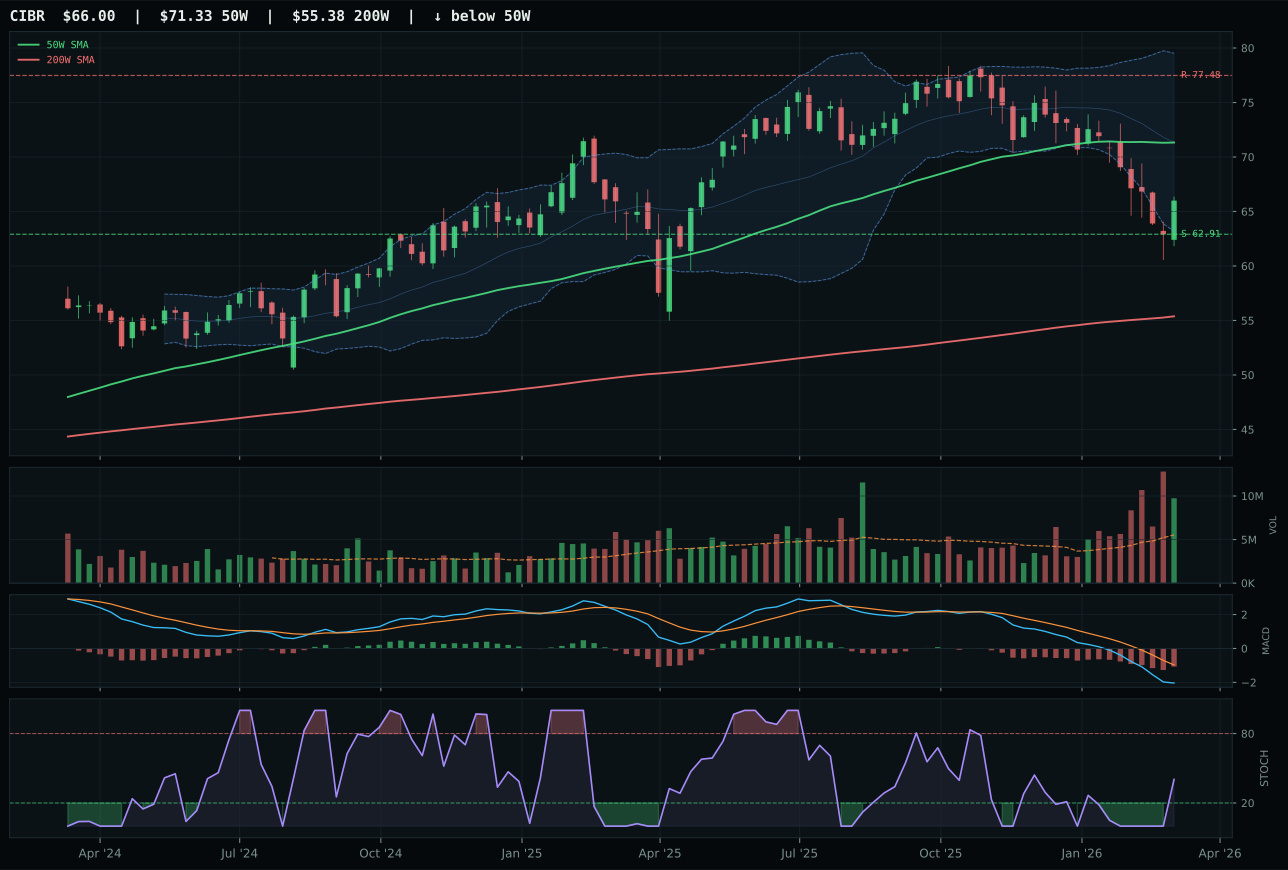
CIBR has a pullback into support profile with -10.0% 13-week relative strength versus SPY.
A failed hold above support would weaken the setup.
Actionable but governed by invalidation levels.
IGV claimed the category by trading below its 50-week moving average while holding above the 200-week line—a reset setup rather than a chase. The -14.6% pullback from the 50W created breathing room, and volume at 3.11x the 20-week average confirmed accumulation rather than panic selling. XLK lost on cleaner structure (72.1 vs 69.3), better timing (70.0 vs 95.0 distance), and a stochastic RSI that had bottomed and was rising mid-zone at 0.45, whereas XLK remained oversold. The gap was decisive: IGV's risk-reward weighed heavily in its favor, with 8.9% downside to support but 24.9% upside to resistance, a rare asymmetry in a category where both leaders have been battered this quarter.
Technology earned 10% because the category score of 46.2 ranked outside the top two, but the allocation acknowledges that IGV has positioned itself in a defensible location after sustained weakness. Neither the macro regime nor the active descriptors—liquidity expansion and credit stress running opposite each other—justify a larger commitment. The real opportunity here is structural: price is consolidating near support with improving technicals and rising stochastic RSI, which means the setup could flip quickly if volume participation accelerates or if the macro turn toward liquidity becomes self-reinforcing. The category remains a waiting game; 10% respects the setup without betting on redemption yet.
Emerging Markets — ILF
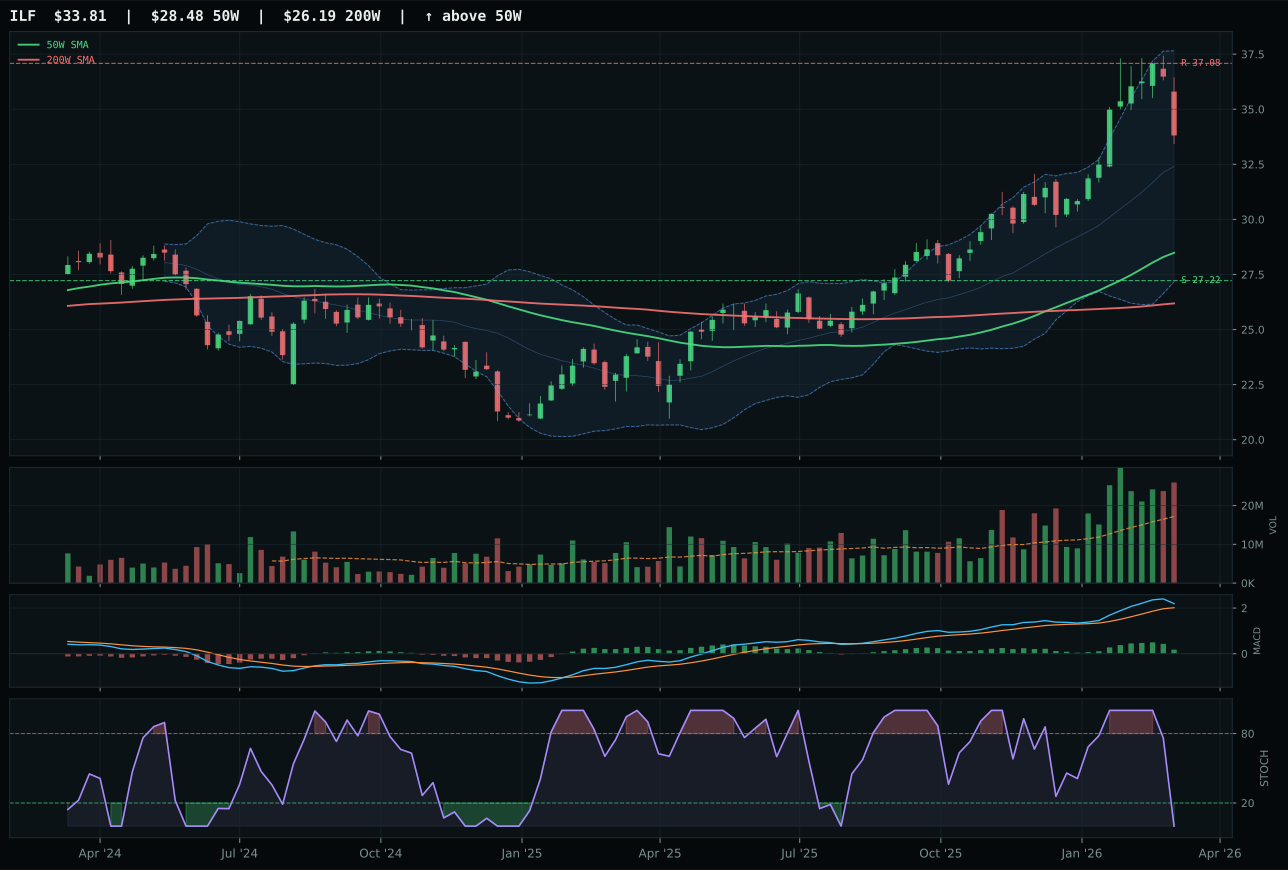
ILF has a vertical extension profile with 12.2% 13-week relative strength versus SPY.
A failed hold above support would weaken the setup.
Actionable but governed by invalidation levels.
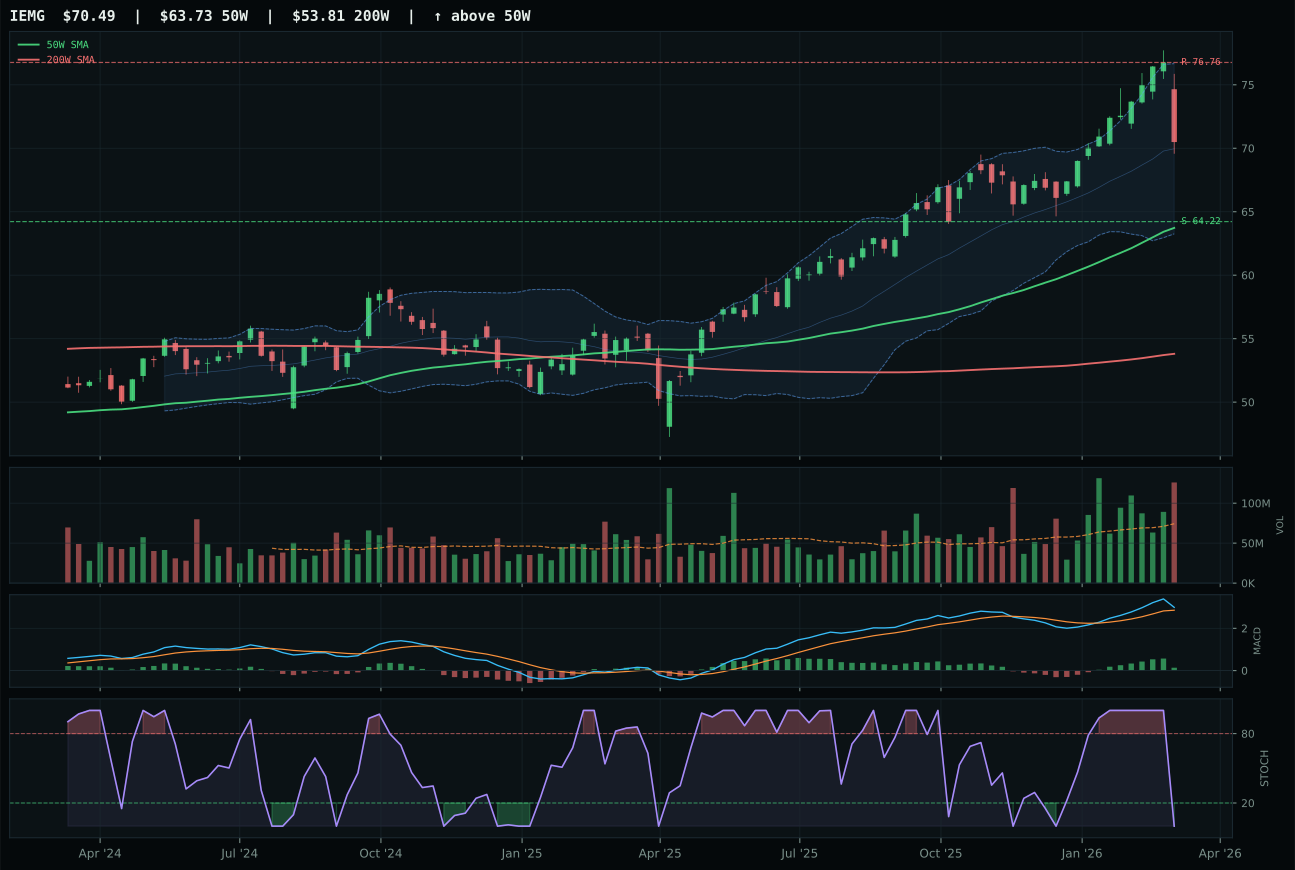
IEMG has a neutral structure profile with 6.5% 13-week relative strength versus SPY.
A failed hold above support would weaken the setup.
Actionable but governed by invalidation levels.
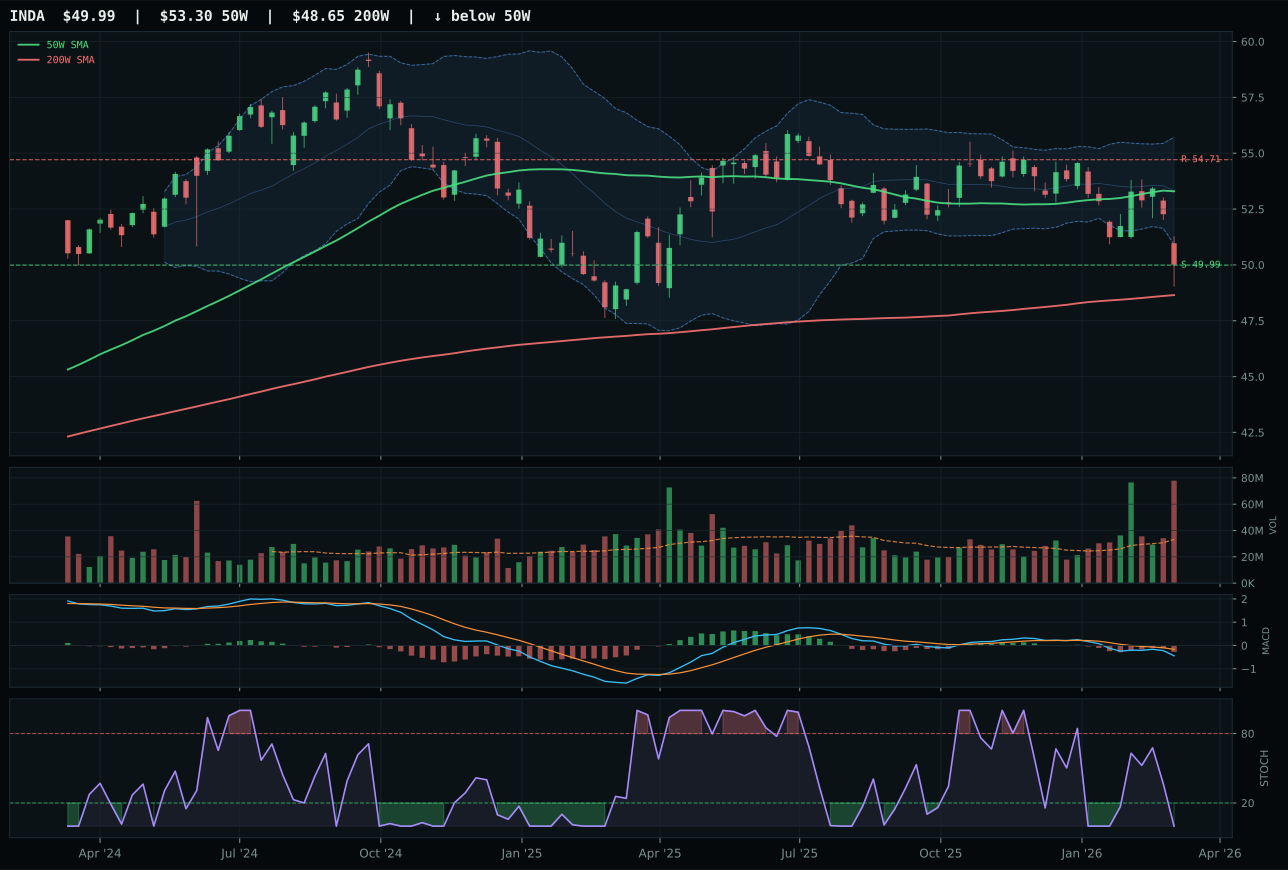
INDA has a pullback into support profile with -5.4% 13-week relative strength versus SPY.
A failed hold above support would weaken the setup.
Actionable but governed by invalidation levels.
ILF won by 9.7 points over IEMG despite being the weaker technical candidate, a reminder that category leadership is relative and contextual. ILF's 100.0 trend score (price above 50W and 200W) beat IEMG's neutral structure by one dimension, and ILF's 5.7% category-relative strength outpaced IEMG's 0.0%, making ILF the leadership name within the three-ETF basket. Both carry bullish MACD but both are flattening, and both sit extended at 18.7% and climbing. IEMG's macro fit at 61.0 exceeds ILF's 66.0 (broad EM liquidity support matters), but the technician weighted ILF's trend and relative strength as the tiebreaker. This is a fine margin; IEMG is nearly as good a candidate.
Emerging markets receives 0% allocation this week, ranking 9th or 10th among the 10 categories with a 43.5 final score that falls well below the allocation threshold. Technical evidence at 36.2 is weak across all three names, and while macro/narrative fit at 66.0 includes support from EM liquidity support (+14), liquidity expansion (+8), and commodity breadth positive themes (+8), credit stress at -10 is a hard constraint that overrides these tailwinds at the weighted 38% macro contribution. The fundamental problem is momentum confirmation: ILF's 4-week return is -6.2%, a clear contradiction to its 13-week strength, signaling that the short-term trend is rolling over even though intermediate direction remains higher. IEMG's 4-week return is -3.0%, another negative divergence. Both are extended moves where volume is shifting from accumulation to distribution, the universal warning sign that the party is ending. The category would require a decisive reset—price back below the 50-week moving average on all three names, MACD resetting lower and then turning higher, and volume shifting to accumulation confirmation—before earning even a 10% allocation slot. For now, the allocator is treating emerging markets as overleveraged to late-cycle transitions and deferring capital toward groups with fresher technicals and stronger momentum persistence.
AI — AIQ
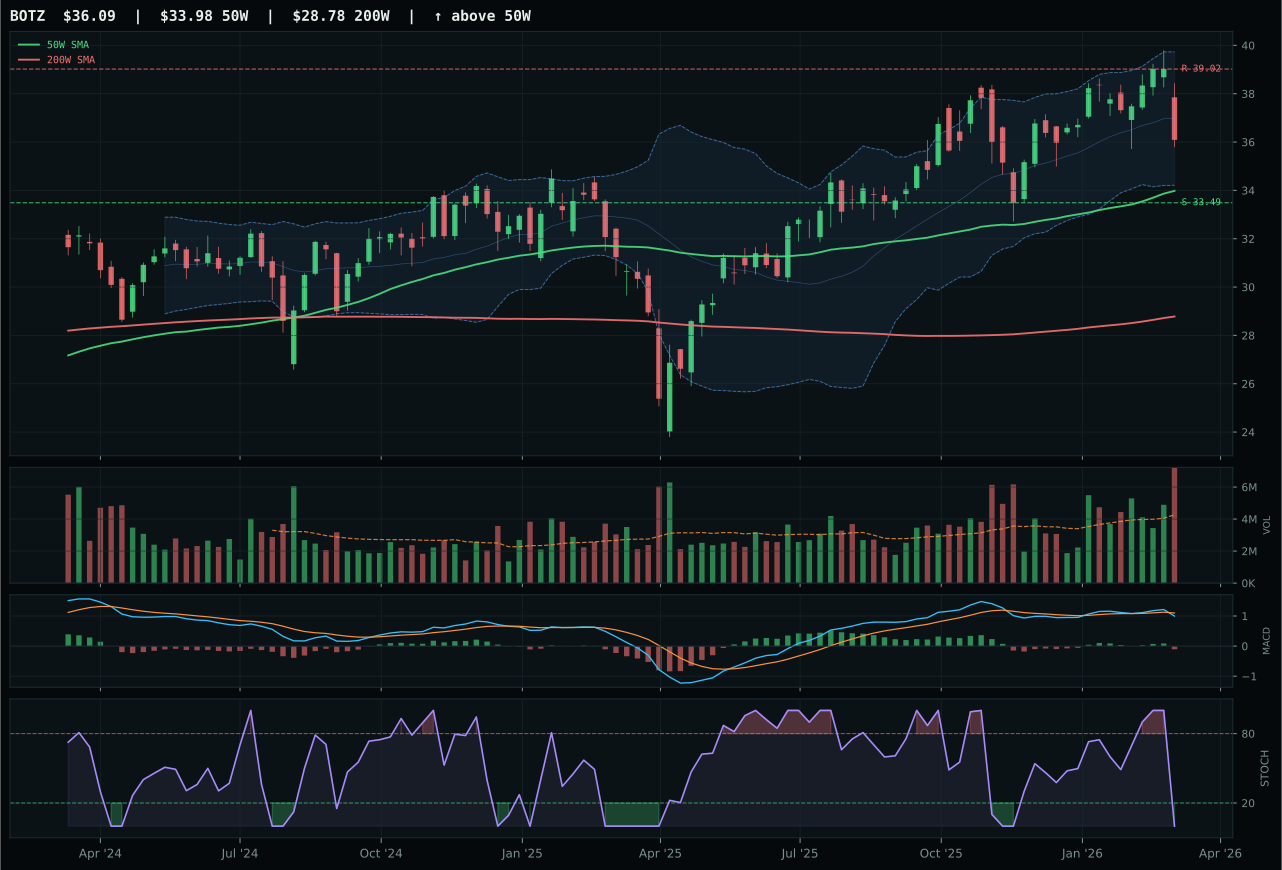
BOTZ has a neutral structure profile with 0.1% 13-week relative strength versus SPY.
A failed hold above support would weaken the setup.
Actionable but governed by invalidation levels.
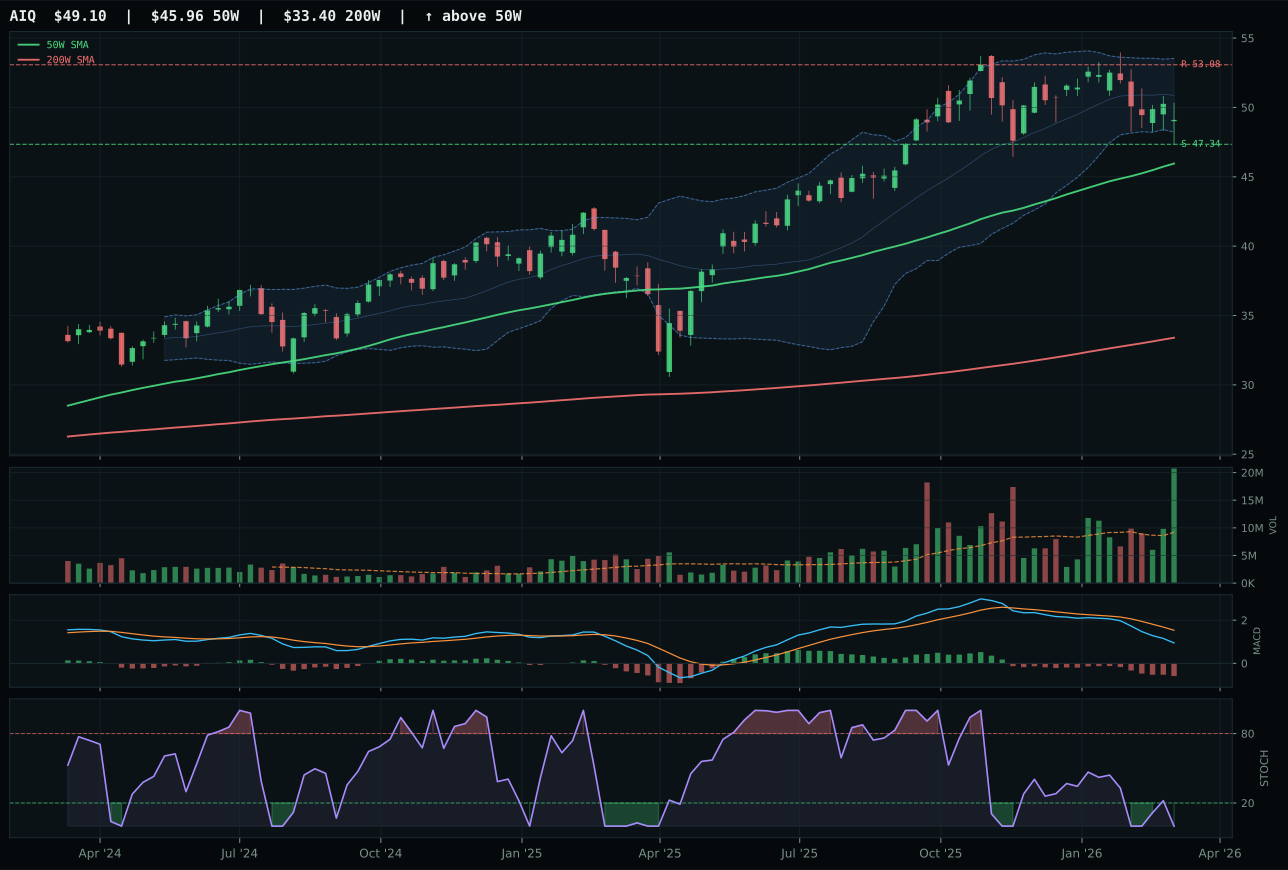
AIQ has a pullback into support profile with -2.7% 13-week relative strength versus SPY.
A failed hold above support would weaken the setup.
Actionable but governed by invalidation levels.
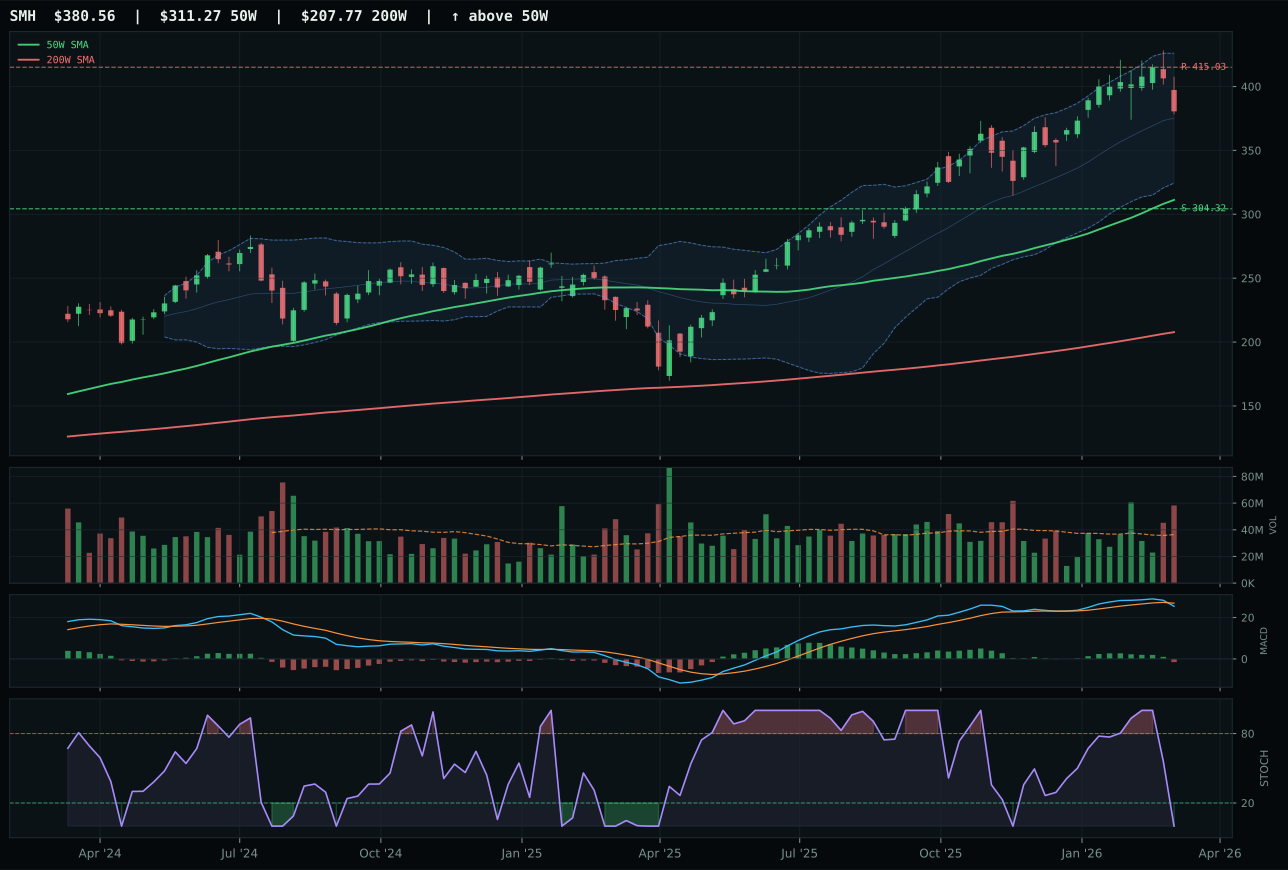
SMH has a vertical extension profile with 6.4% 13-week relative strength versus SPY.
A failed hold above support would weaken the setup.
Actionable but governed by invalidation levels.
AIQ won because it pulled into defined support at 47.34 with a clear invalidation point, whereas BOTZ sat in neutral structure with more diffuse risk. AIQ's 13-week return of -4.6% and -2.7% relative strength versus SPY are not impressive numbers, but the 80.0 timing score reflects stochastic RSI oversold and price near the Fib 0.236 retracement zone—a measurable bounce setup. BOTZ failed to generate edge here: its 54.4 risk-reward compared poorly to AIQ's 73.3, and its neutral structure left multiple escape routes, making it harder to define a thesis. Both carry bearish MACD and distribution-pressure volume, but AIQ's pullback-into-support pattern gives the allocator a clear trade, not a guess.
AI receives 0% allocation this week and ranks either 9th or 10th among the 10 categories with a final score of 38.9. The category-level technical evidence is catastrophic at 6.2 for the winner, reflected in macro/narrative fit of 62.0 that cannot carry the load at 36% weighting. Credit stress is actively penalizing AI growth narratives at -8 points, and while liquidity expansion and AI growth sponsorship each add material support, their combined effect is drowning in a backdrop where the entire basket is below or collapsed relative to its 50-week moving averages. SMH, the reasoned second choice, is showing 4.4% 13-week returns and positive 6.4% RS versus SPY, but its setup is a vertical extension with distribution pressure volume and oversold stochastic RSI—a dangerous combination suggesting late buyers are trapped. The category would need to see momentum confirmation (4-week returns turning decisively positive across all three names) and volume shift from distribution to accumulation before earning any allocation. Currently it is structurally weak and macro-disadvantaged.