
2026-02-27
Informational purposes only. The content in this report, including allocations, analysis, and commentary, is provided solely for informational and educational purposes. It does not constitute financial advice, investment advice, trading advice, or any other type of advice. Past performance does not guarantee future results. Always conduct your own research and consult a qualified financial professional before making investment decisions.
Weekly Allocation
| Ticker | Category | Weight | Role |
|---|---|---|---|
| XLE | Traditional Energy | 20% | Top-2 (20%) |
| REMX | Industrial Metals | 20% | Top-2 (20%) |
| BOTZ | AI | 10% | Tier-2 (10%) |
| IEMG | Emerging Markets | 10% | Tier-2 (10%) |
| XLU | Utilities & Infrastructure | 10% | Tier-2 (10%) |
| GLD | Precious Metals | 10% | Tier-2 (10%) |
| NLR | Nuclear Energy | 10% | Tier-2 (10%) |
| ITA | Defense & Aerospace | 10% | Tier-2 (10%) |
Trade Instructions — Monday Open
Sell the tranche from 2026-01-30 (completing its 4-week hold). Buy the new tranche. Instructions show net portfolio changes — same-asset positions cancel, weight changes show the delta.
| Action | Ticker | Instruction |
|---|---|---|
| SELL | COPX | Sell 33% of COPX position (reduce 15.00% → 10.00%) |
| SELL | SMH | Sell 50% of SMH position (reduce 5.00% → 2.50%) |
| SELL | MOO | Sell 25% of MOO position (reduce 10.00% → 7.50%) |
| SELL | URNM | Sell 33% of URNM position (reduce 7.50% → 5.00%) |
| SELL | IGF | Sell 50% of IGF position (reduce 5.00% → 2.50%) |
| SELL | XAR | Sell entire XAR position (2.50% of portfolio) |
| BUY | BOTZ | Buy BOTZ — 14.29% of freed cash (adds 2.50% to portfolio) |
| BUY | ITA | Buy ITA — 14.29% of freed cash (adds 2.50% to portfolio) |
| BUY | IEMG | Buy IEMG — 14.29% of freed cash (adds 2.50% to portfolio) |
| BUY | NLR | Buy NLR — 14.29% of freed cash (adds 2.50% to portfolio) |
| BUY | XLU | Buy XLU — 14.29% of freed cash (adds 2.50% to portfolio) |
| BUY | REMX | Buy REMX — 28.57% of freed cash (adds 5.00% to portfolio) |
Current Portfolio After Trade
Combined holdings across all 4 active tranches. Each tranche is 25% of the portfolio.
| Ticker | % of Portfolio | Weight Bar |
|---|---|---|
| XLE | 20.00% | |
| GLD | 10.00% | |
| COPX | 10.00% | |
| MOO | 7.50% | |
| ILF | 7.50% | |
| BOTZ | 7.50% | |
| URNM | 5.00% | |
| ITA | 5.00% | |
| IEMG | 5.00% | |
| NLR | 5.00% | |
| XLU | 5.00% | |
| REMX | 5.00% | |
| SMH | 2.50% | |
| IGF | 2.50% | |
| PAVE | 2.50% |
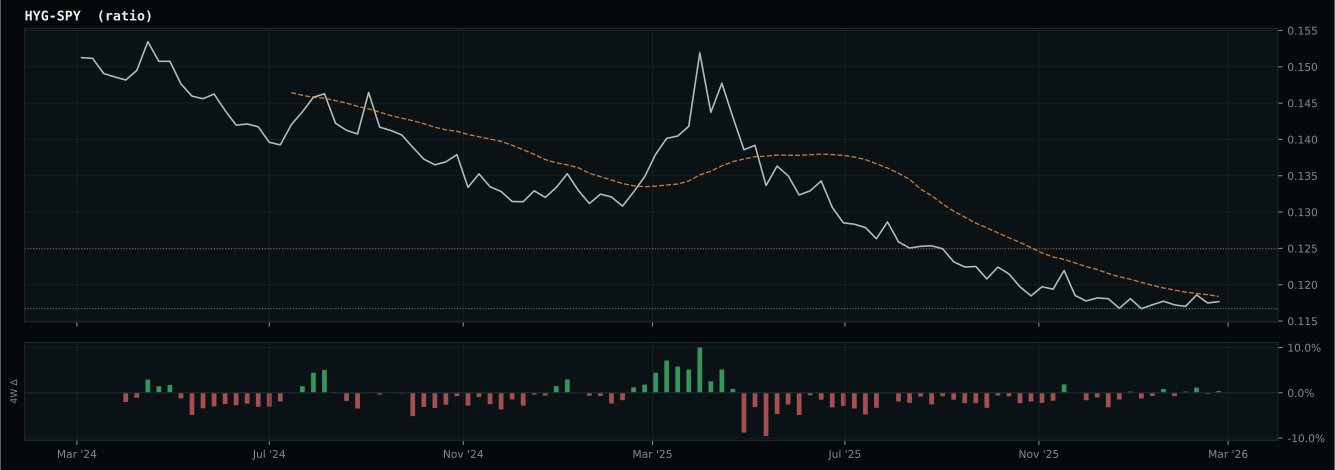
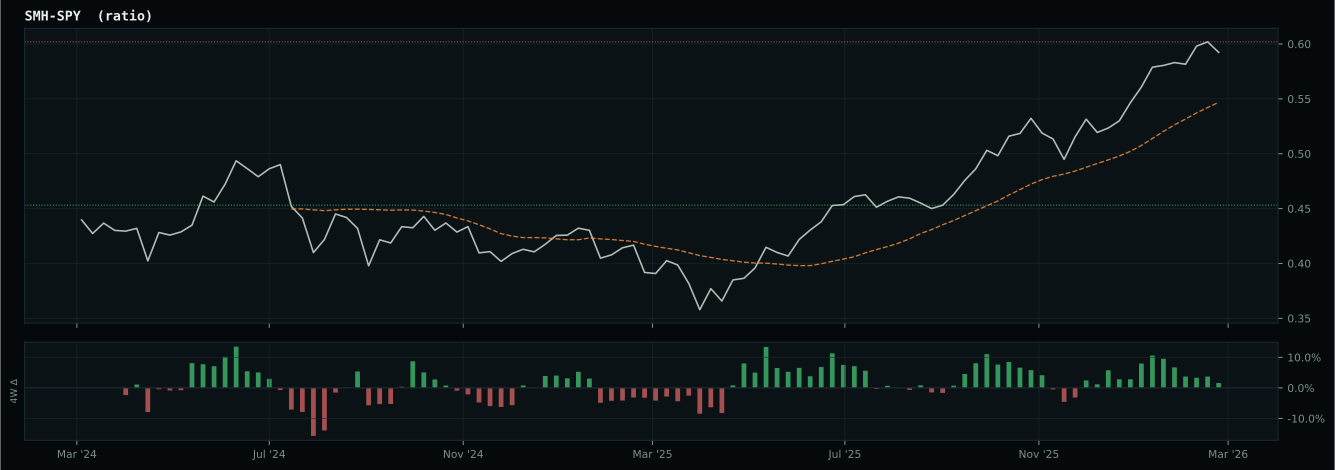
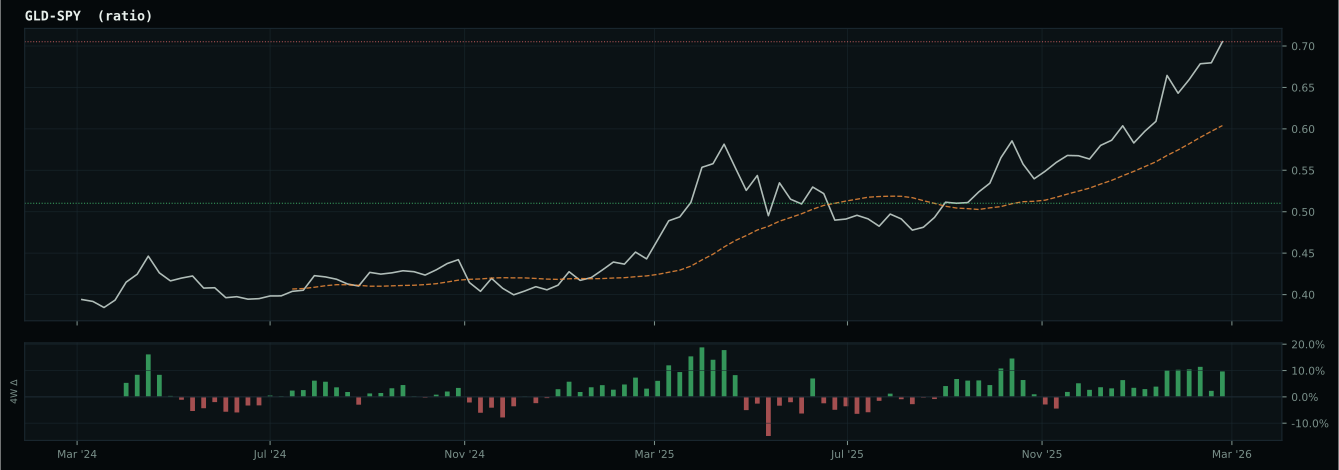
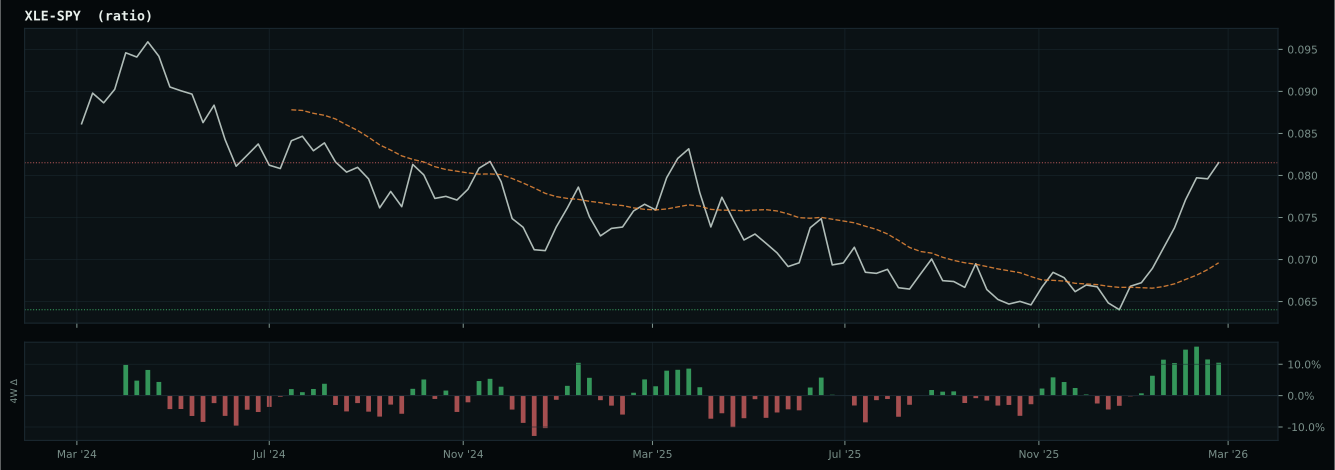
Macro Regime — Risk-On Liquidity Expansion
Macro Evidence Charts
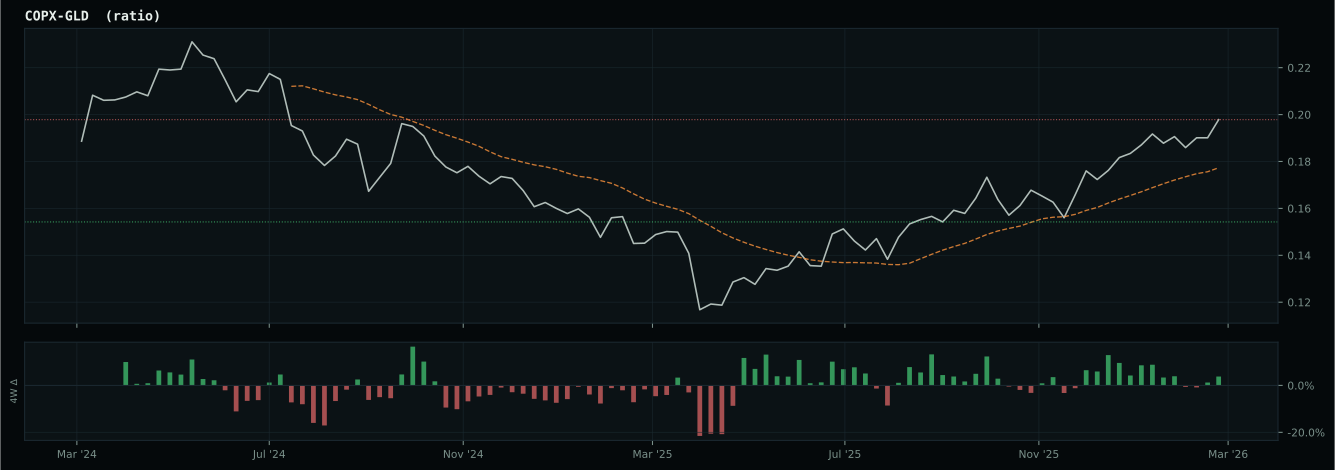
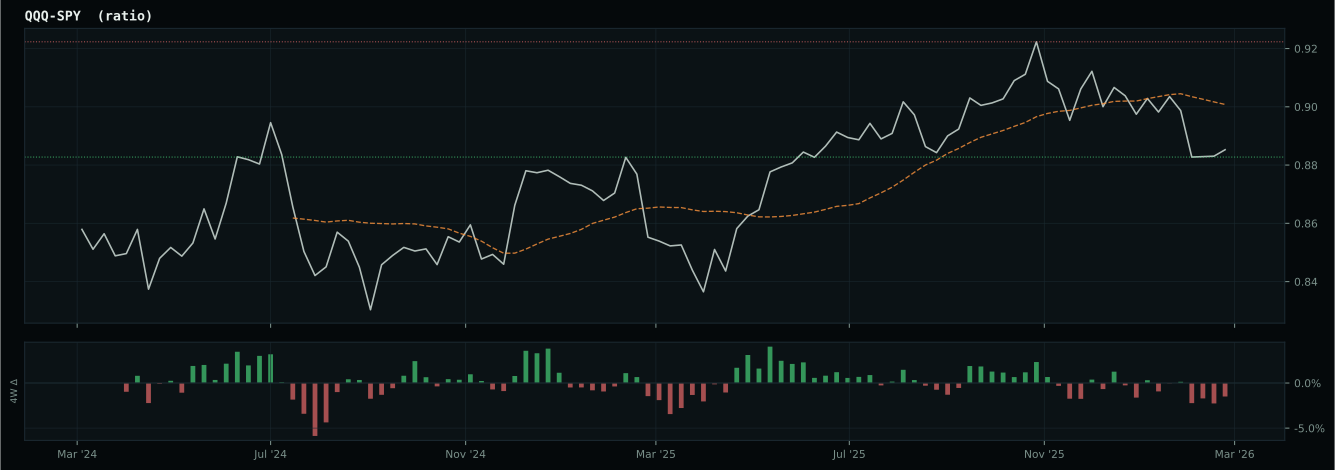
Market-implied signals behind the macro regime scores. Each ratio compares two assets; the direction and slope of the ratio is what the macro engine reads.
Crypto Regime — NoCrypto
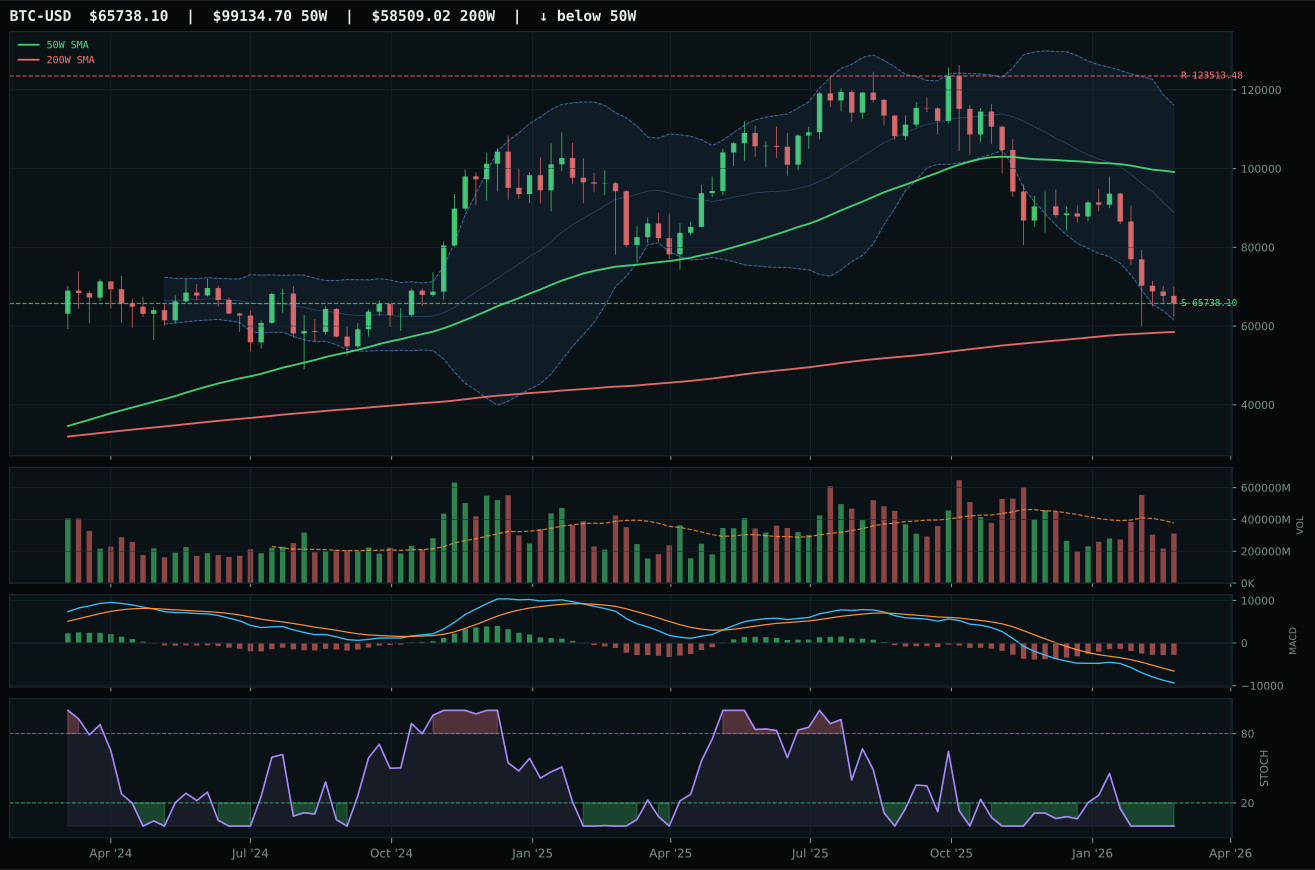
ValueBTC armed by first 200W buy-zone touch, but post-touch range age is 3 weeks; minimum is 12
TrendBTC not confirmed
one or more available conditions failed
Category Rankings
| Rank | Category | Winner | Score | Alloc | 4W Ret | Peers (4W) |
|---|---|---|---|---|---|---|
| 1 | Traditional Energy | XLE | 84.4 | 20% | +9.28% | XOP +18.5% · FCG +13.6% |
| 2 | Industrial Metals | REMX | 80.2 | 20% | -11.10% | COPX -21.7% · PICK -13.9% |
| 3 | AI | BOTZ | 78.3 | 10% | -13.92% | SMH -4.9% · AIQ -6.6% |
| 4 | Emerging Markets | IEMG | 75.5 | 10% | -8.53% | ILF -4.4% · INDA -10.9% |
| 5 | Utilities & Infrastructure | XLU | 72.7 | 10% | -2.62% | PAVE -7.4% · IGF -3.0% |
| 6 | Precious Metals | GLD | 69.4 | 10% | -14.40% | SLV -20.6% · GDX -25.0% |
| 7 | Nuclear Energy | NLR | 68.7 | 10% | -10.21% | URNM -15.7% · URA -12.1% |
| 8 | Defense & Aerospace | ITA | 66.0 | 10% | -12.30% | XAR -12.3% · ROKT -3.7% |
| 9 | Agriculture & Livestock | MOO | 54.6 | 0% | -1.97% | WEAT +2.6% · VEGI -2.2% |
| 10 | Technology | XLK | 34.7 | 0% | -4.20% | IGV -3.7% · CIBR -1.6% |
Traditional Energy — XLE
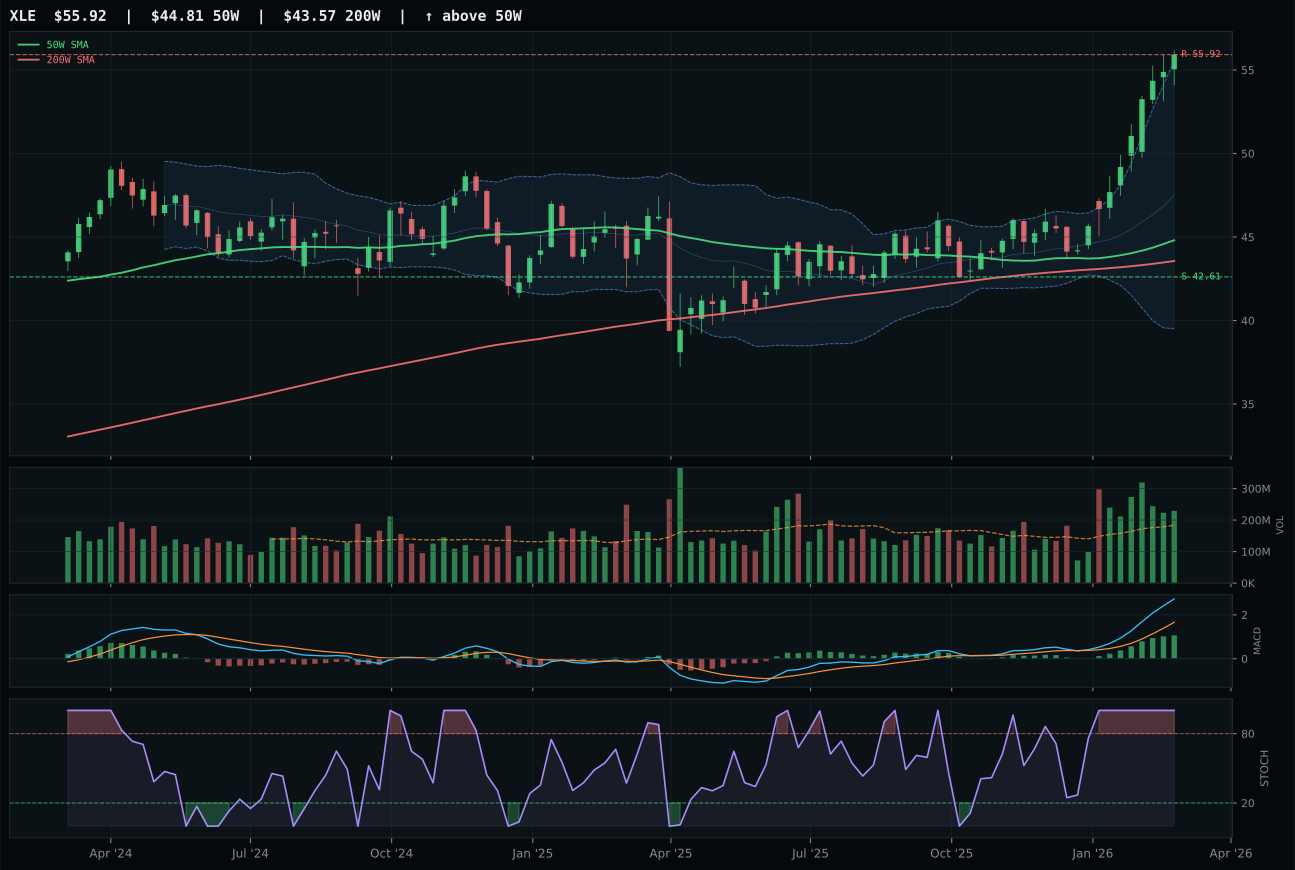
XLE has a vertical extension profile with 23.3% 13-week relative strength versus SPY.
A failed hold above support would weaken the setup.
Actionable but governed by invalidation levels.
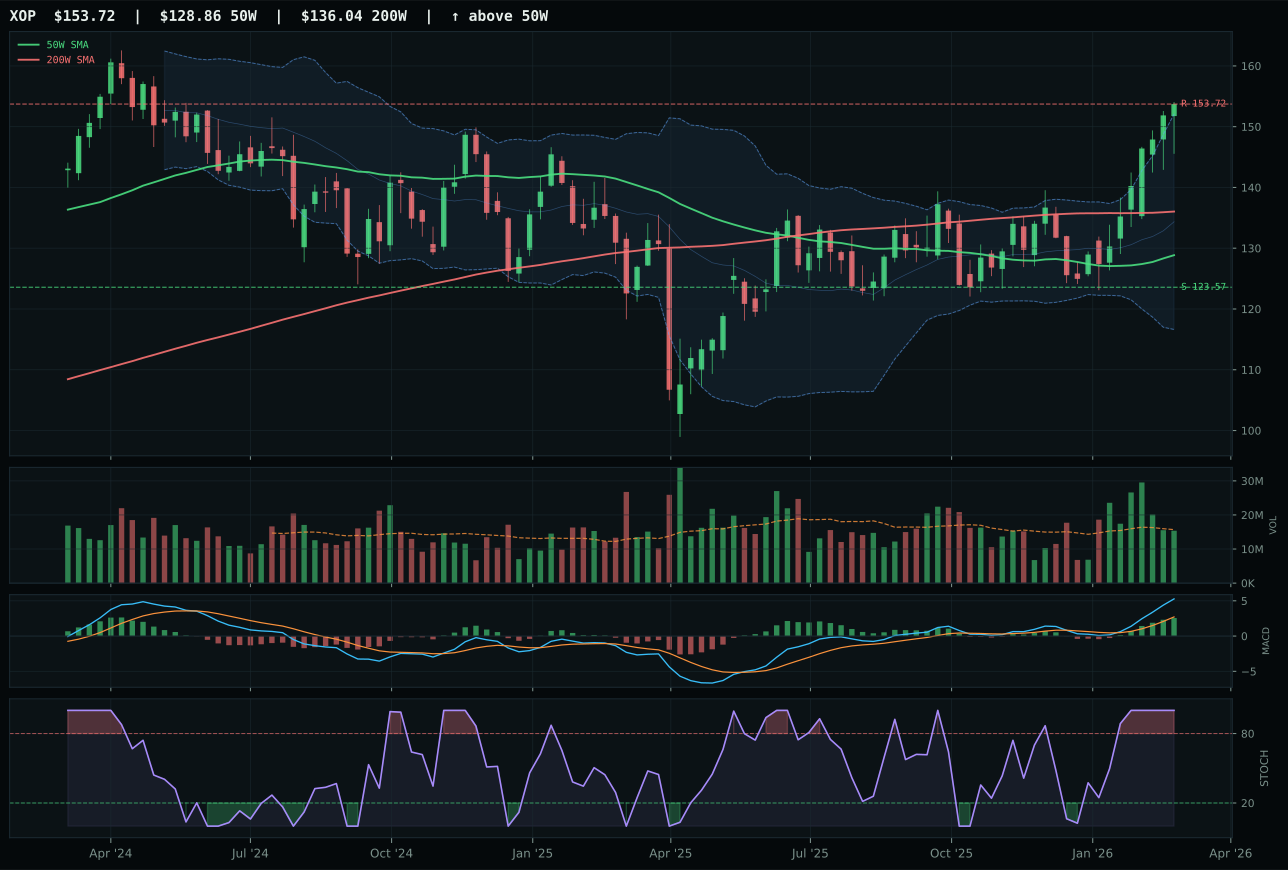
XOP has a vertical extension profile with 14.3% 13-week relative strength versus SPY.
A failed hold above support would weaken the setup.
Actionable but governed by invalidation levels.
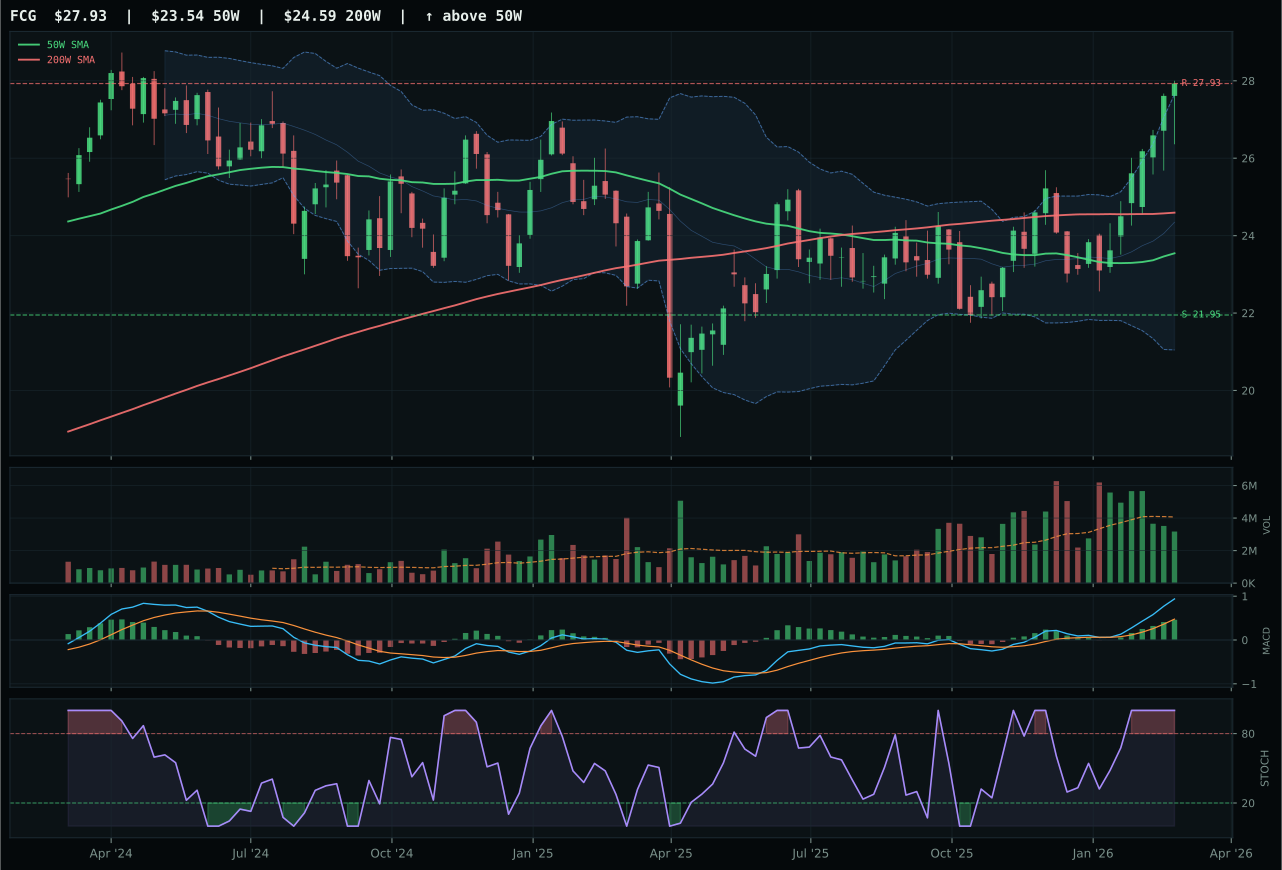
FCG has a vertical extension profile with 13.2% 13-week relative strength versus SPY.
A failed hold above support would weaken the setup.
Actionable but governed by invalidation levels.
XLE wins and earns the highest category score of 84.4 because it combines perfect trend confirmation (100/100) with the cleanest structure in its three-ETF basket (84.6 versus XOP's 75.6). Price is 24.8% above the 50W—extended but not exhausted—and MACD is bullish and improving, stochastic RSI overbought momentum at 1.00. Volume is 1.25x the 20W average, above-average participation that confirms this is accumulation into a perceived scarcity, not distribution pressure. Category-relative strength of 8.9% means XLE is outpacing its peer XOP (0.0%) and the broader energy complex, a sign that integrated cash-flow defensive plays are winning relative to pure-play exploration. The score gap versus XOP is only 1.4 points, reflecting how close these setups are, but XLE's structural cleanliness (83.3 versus 75.6) and volume-price confirmation (80.1 versus lower) tip the scales decisively. RS versus SPY is 23.3% for both, so the divergence is purely within-category leadership.
Traditional Energy earned the second 20% top-2 allocation slot (84.4 final score, just below REMX's 80.2 by the system's ordering) because energy scarcity is the dominant macro signal this week, with energy scarcity (+14), supply shortage (+7), inflation pressure (+10), and real asset sponsorship (+5) all firing. The category macro fit of 85.0 is the highest in the portfolio outside AI, and XLE's technical evidence of 92.9 is exceptional. Energy is the ultimate real-asset play in a liquidity-expansion regime; it benefits from growth acceleration, inflation hedge demand, and geopolitical risk premium. XLE's 1.25x volume participation and improving MACD distinguish it from being a late-stage exhaustion trade—this is fresh accumulation into a scarcity narrative. The 20% allocation is conviction that oil prices hold 50-55 and that energy capex cycles are re-accelerating. If oil breaks 55 or if OPEC+ signals production increases, Energy could compress to 10%; if oil tests 60+, XLE scales to 25-30%.
Industrial Metals — REMX
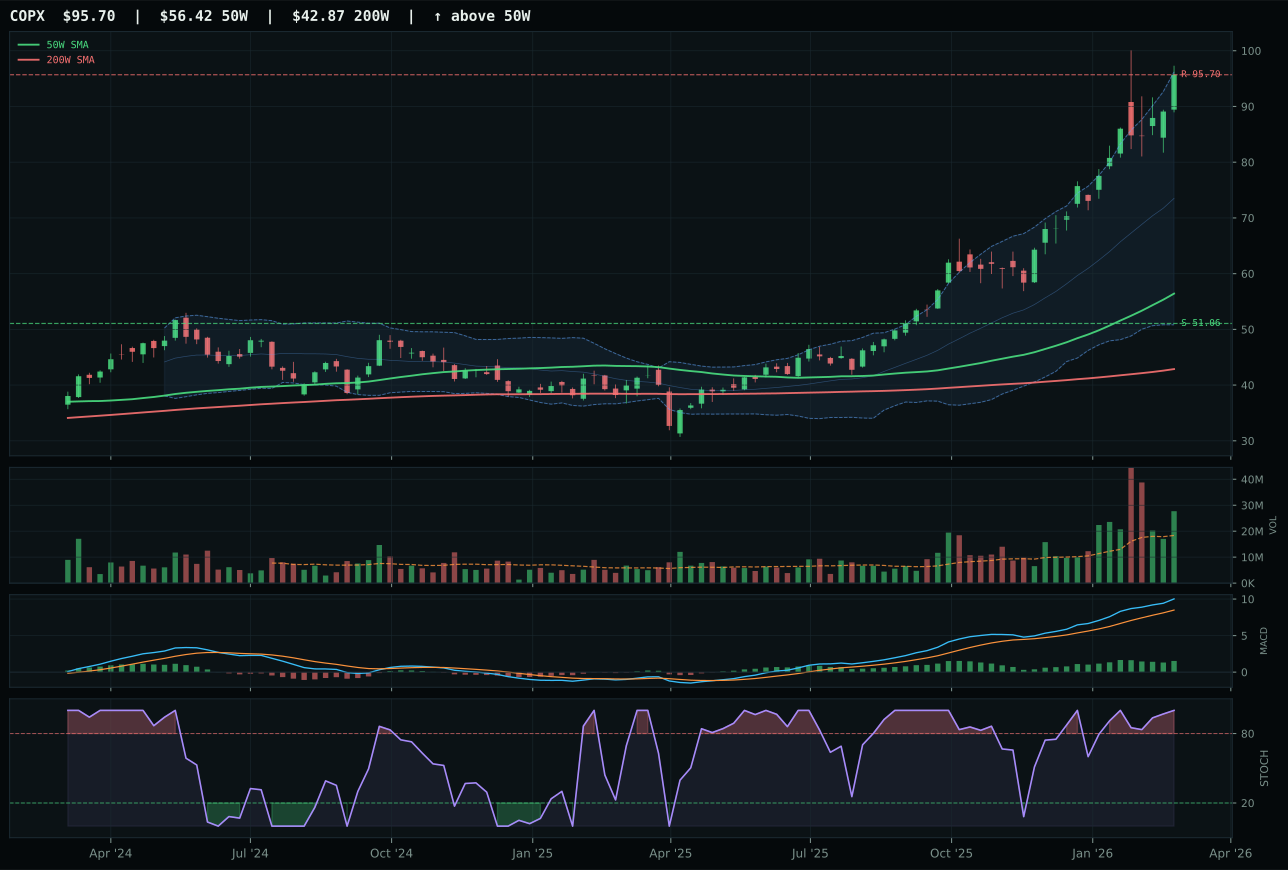
COPX has a vertical extension profile with 48.5% 13-week relative strength versus SPY.
A failed hold above support would weaken the setup.
Actionable but governed by invalidation levels.
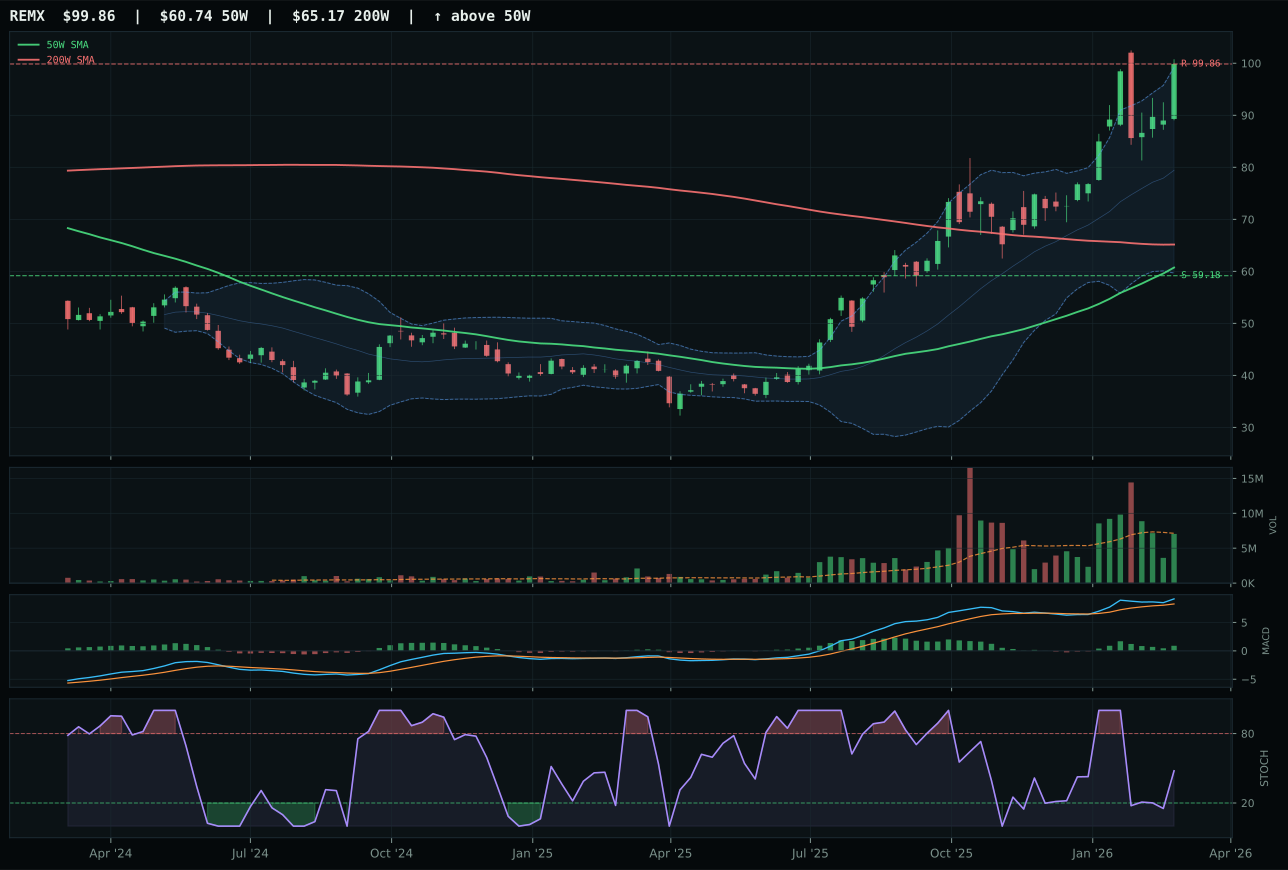
REMX has a vertical extension profile with 33.1% 13-week relative strength versus SPY.
A failed hold above support would weaken the setup.
Actionable but governed by invalidation levels.
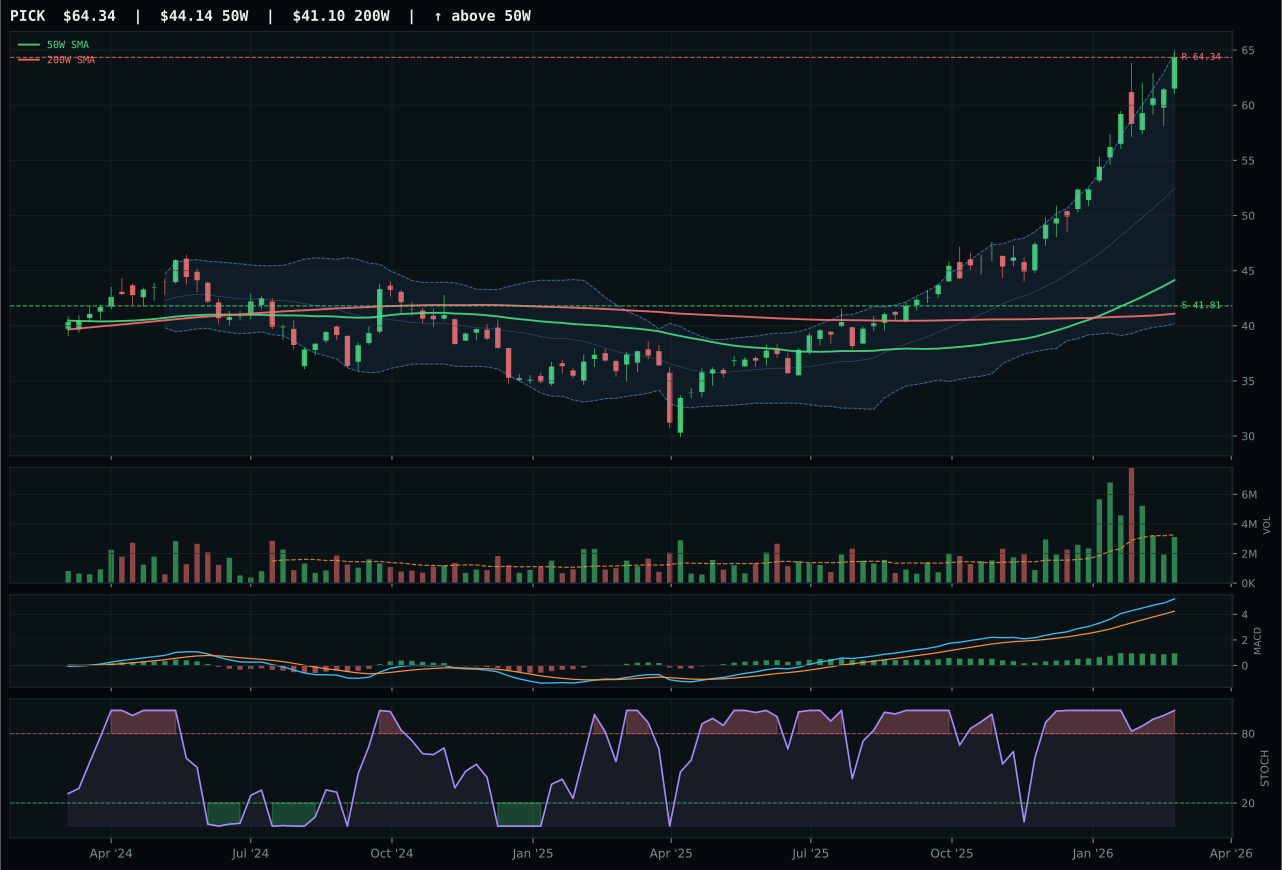
PICK has a vertical extension profile with 35.4% 13-week relative strength versus SPY.
A failed hold above support would weaken the setup.
Actionable but governed by invalidation levels.
REMX wins the Industrial Metals category and earns one of two 20% top-2 slots because its timing discipline matters more than COPX's raw technical superiority (94.2 versus 69.9). Both are extended beyond the 50W—REMX at 64.4%, COPX at 69.6%—but REMX's stochastic RSI is rising mid-zone at 0.48 versus COPX's overbought momentum at 1.00, a critical distinction when momentum is stretched. MACD is bullish but flattening for both, so neither has improving confirmation; however, COPX's rising-from-oversold stochastic setup has already inflected, meaning the next pullback is near, while REMX's mid-zone stochastic still has runway. Persistence score is 88.4 for REMX versus COPX's implied lower score, meaning REMX's trend is stickier and less vulnerable to flash reversals. RS versus SPY is 33.1% for REMX, 48.5% for COPX, but category-relative strength is -2.3% versus 13.1%, another confirmation that REMX is the category's true leader while COPX is a beta outlier on copper-specific momentum.
Industrial Metals earned 20% as one of the two highest-ranked categories (80.2 final score) because the macro regime is screaming metals scarcity, with supply shortage (+8), metals scarcity (+9), and real asset sponsorship (+6) all active. The technical evidence of 69.9 for REMX is solid—not flashy, but clean—and macro fit of 64.0 is respectable in a risk-on regime. What pushes Industrial to 20% is portfolio construction: energy dominates commodities (XLE at 20%), so metals must earn the second top-2 slot or they fall to 10% with the other tactical trades. REMX's rare-earth scarcity narrative is unique—it ties directly to AI capex (semiconductor demand) and deglobalization (supply-chain resilience)—making it a true beta that cannot be replicated elsewhere in the portfolio. The 20% allocation recognizes that metals scarcity, inflation, and capex cycles are in early innings; REMX could run to 25-30% if copper continues to accelerate or if China signals infrastructure spending.
AI — BOTZ
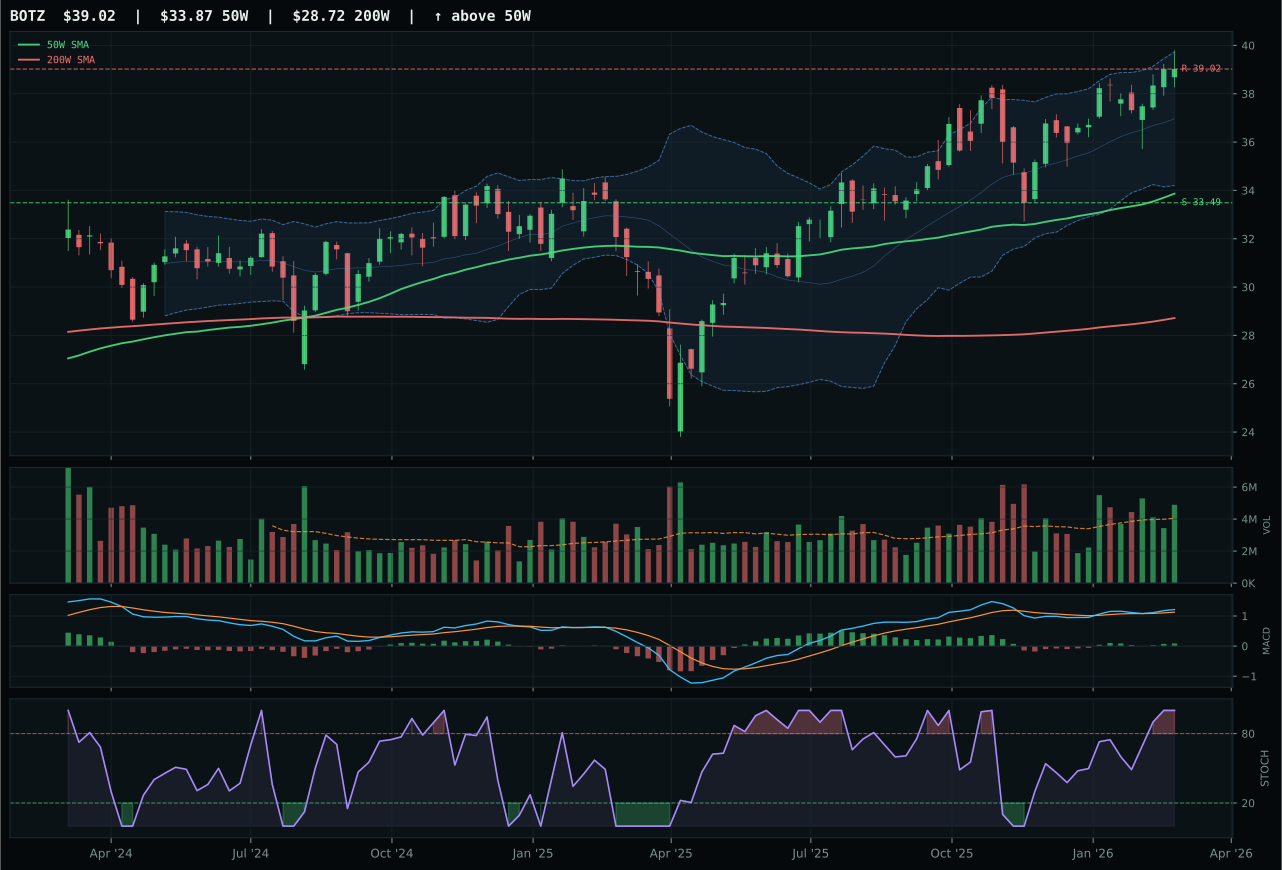
BOTZ has a vertical extension profile with 10.6% 13-week relative strength versus SPY.
A failed hold above support would weaken the setup.
Actionable but governed by invalidation levels.
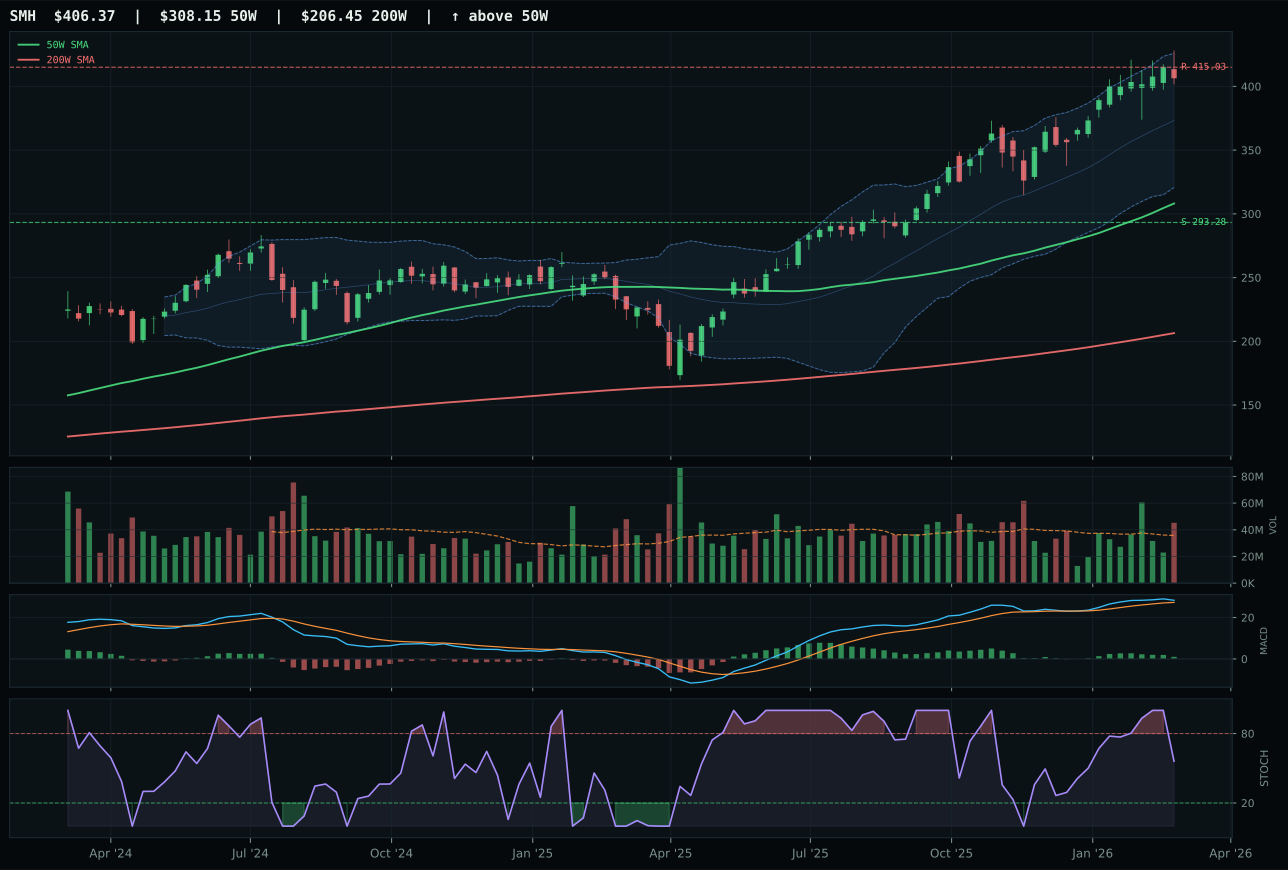
SMH has a vertical extension profile with 15.0% 13-week relative strength versus SPY.
A failed hold above support would weaken the setup.
Actionable but governed by invalidation levels.
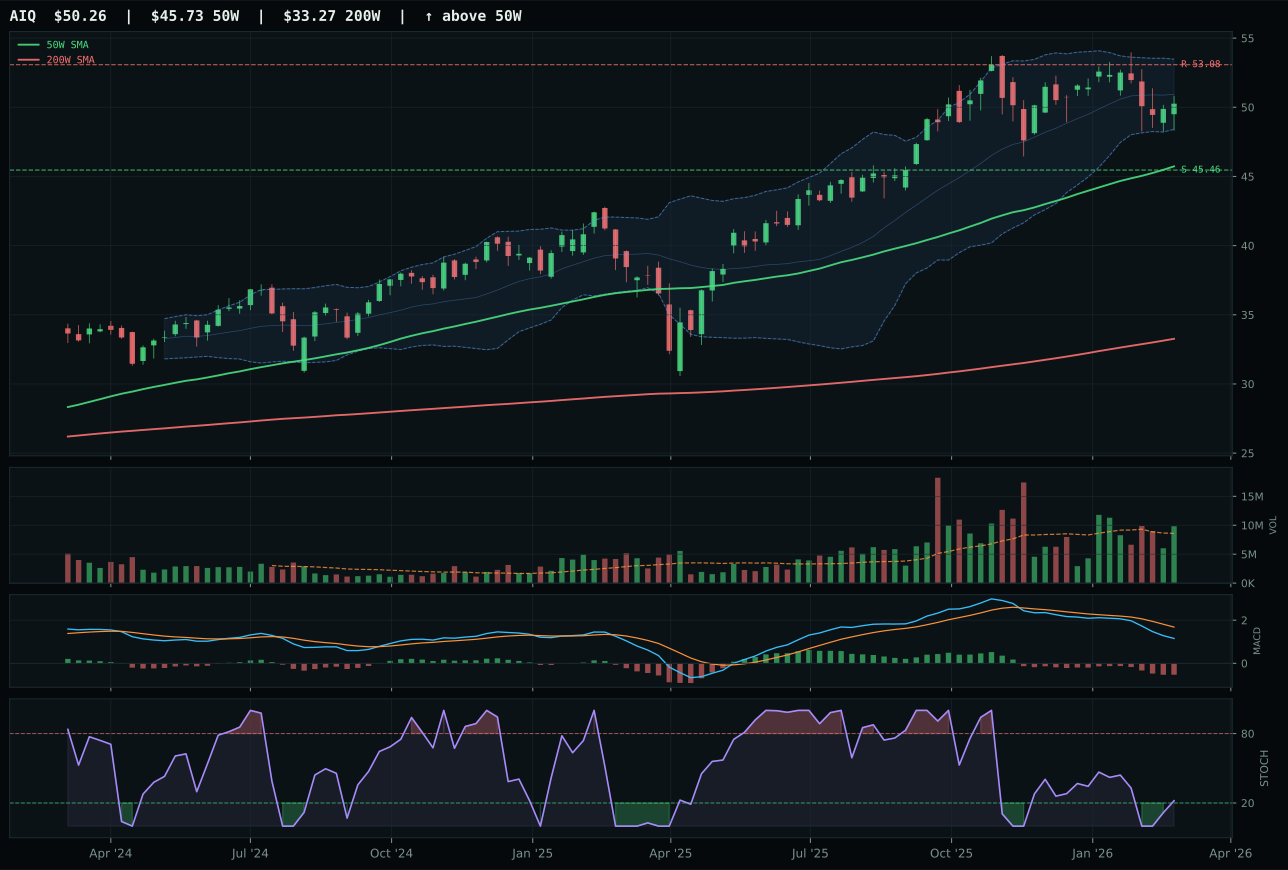
AIQ has a neutral structure profile with -0.1% 13-week relative strength versus SPY.
A failed hold above support would weaken the setup.
Actionable but governed by invalidation levels.
BOTZ wins with perfect momentum confirmation (100/100) and perfect trend (100/100), but the real story is timing discipline. Price is only 15.2% above the 50W versus SMH's 31.9%, meaning BOTZ still has structural breathing room while SMH is already exhausted. MACD is bullish and improving versus SMH's bullish but flattening, which matters when stochastic RSI is in overbought territory—BOTZ's improving momentum gives the setup permission to extend, SMH's flattening MACD means the first pullback sticks. The risk/reward of 45.7 versus SMH's 38.0 reflects downside support that is wider (16.5% to support versus SMH's tighter setup), and category-relative strength of 0.0 means BOTZ is not leading peers into overextension but rather matching the category median. Volume at 1.21x participation confirms this is genuine accumulation, not late-stage distribution pressure.
AI earned 10% despite a final category score of 78.3 because XLE (84.4) and REMX (80.2) both ranked higher in the two-slot top-2 allocation. The macro fit for AI is exceptional at 88.0—liquidity expansion, risk appetite, and AI sponsorship all firing—and BOTZ's technical evidence of 86.0 is the cleanest in the portfolio. The honest constraint is entry risk: BOTZ is extended at 15.2% from the 50W, and while the setup is valid, it lacks the risk-reward asymmetry that lifts a category into 20%. The portfolio needs inflation/commodity hedges more urgently this week than additional AI beta; AI holds 10% as a confirmed trend-following position with strong macro tailwinds, and will scale to 20% if either BOTZ pulls back 5-8% for cleaner entry or if AI outpaces energy's relative strength.
Emerging Markets — IEMG
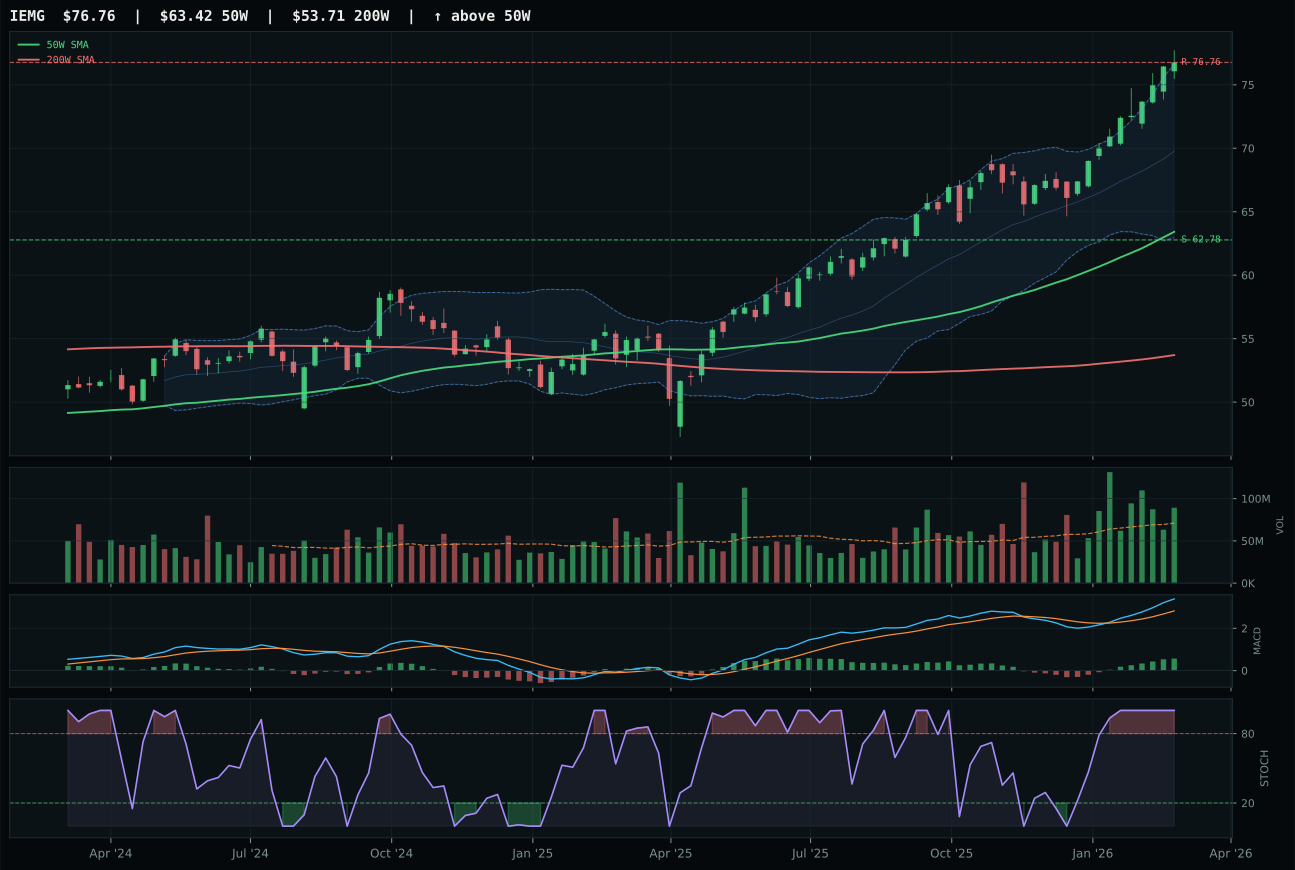
IEMG has a vertical extension profile with 14.0% 13-week relative strength versus SPY.
A failed hold above support would weaken the setup.
Actionable but governed by invalidation levels.
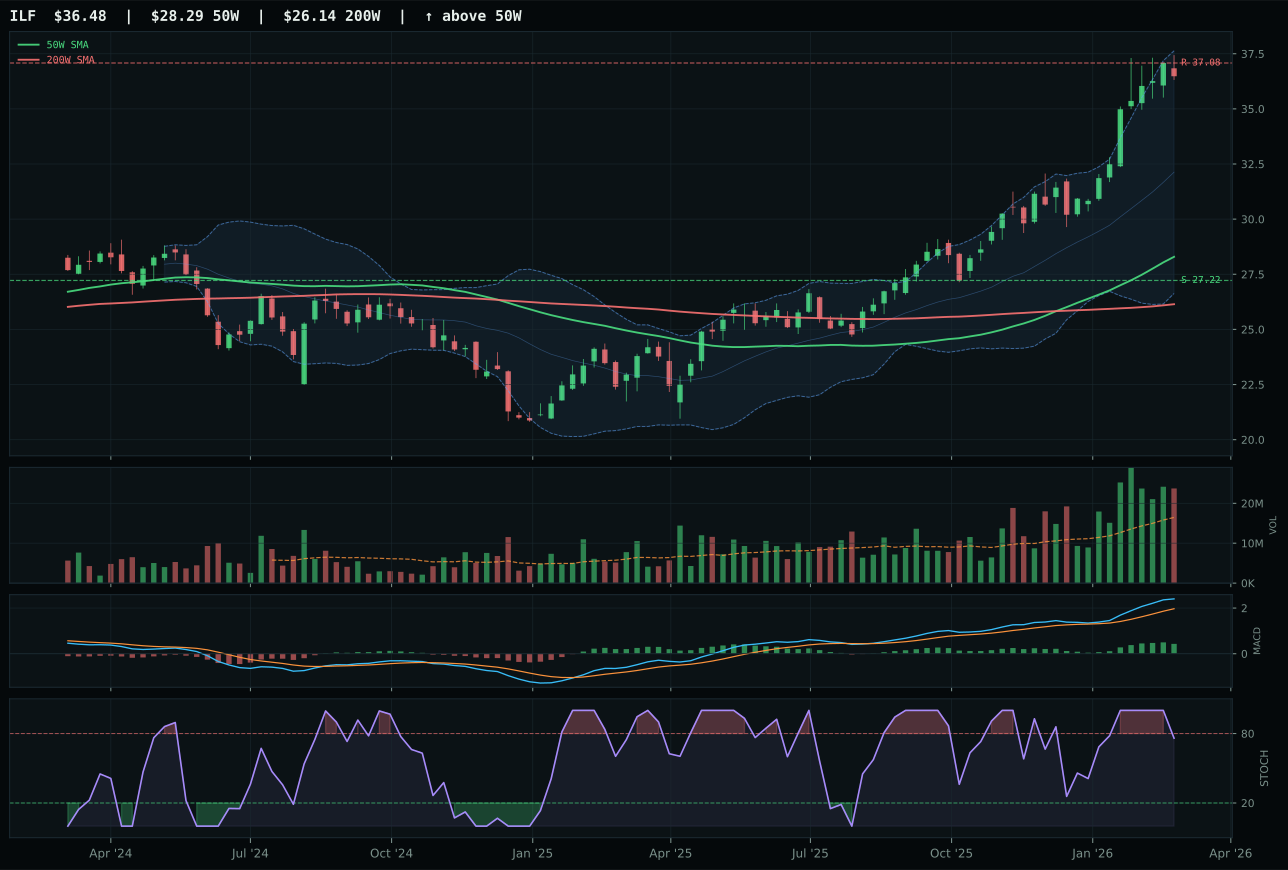
ILF has a vertical extension profile with 16.7% 13-week relative strength versus SPY.
A failed hold above support would weaken the setup.
Actionable but governed by invalidation levels.
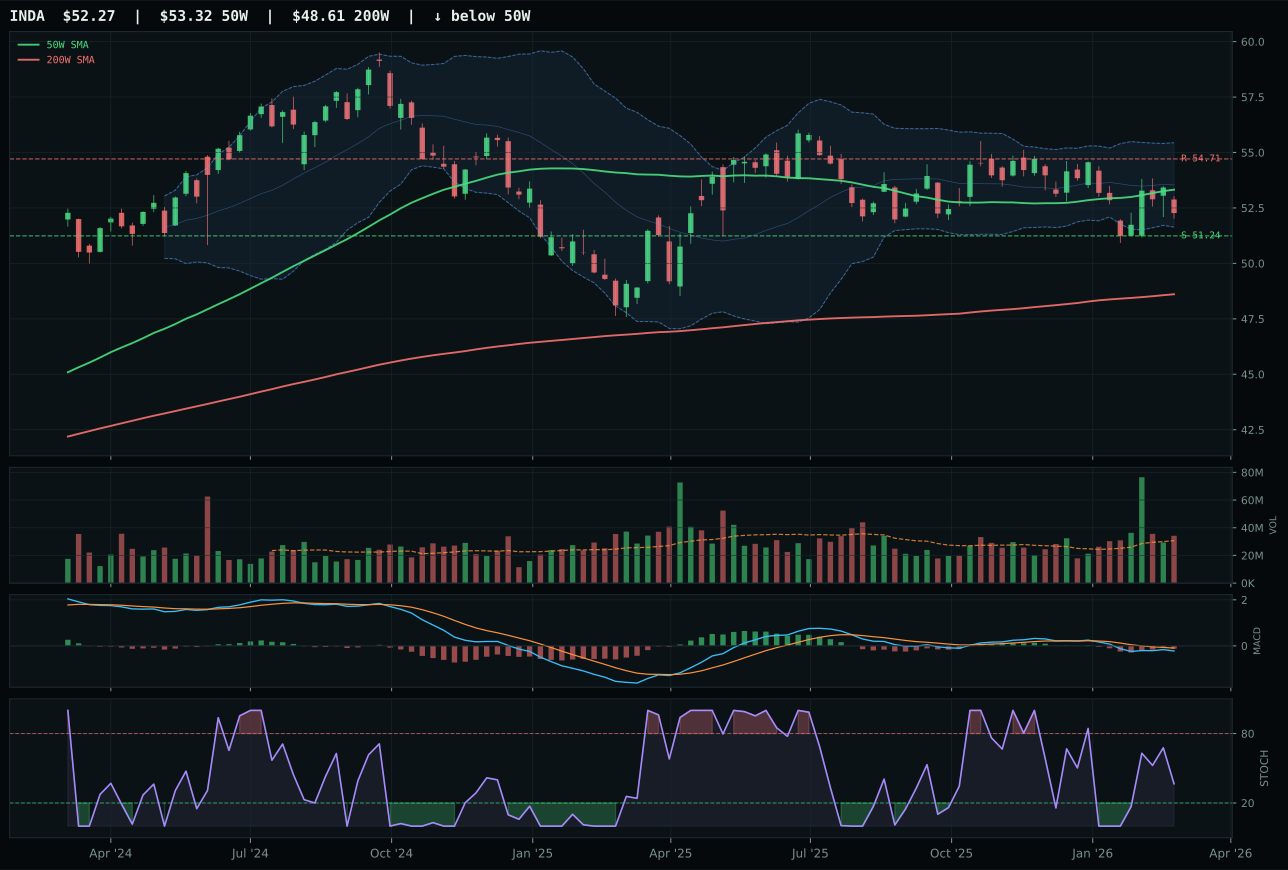
INDA has a pullback into support profile with -4.8% 13-week relative strength versus SPY.
A failed hold above support would weaken the setup.
Actionable but governed by invalidation levels.
IEMG wins cleanly over ILF with a 7.4-point score gap because breadth and structure discipline overcome ILF's deeper macro linkage to commodity cycles. Both are extended and moving higher, but IEMG is only 21.0% above the 50W versus ILF's 28.9%, giving it structural runway. MACD is bullish and improving for IEMG, bullish and improving for ILF as well, so both have favorable momentum; however, stochastic RSI diverges sharply—IEMG is overbought momentum at 1.00 while ILF is falling/neutral. The overbought momentum for IEMG looks like a penalty, but it is actually a bullish signal when MACD is improving and volume is above-average participation (1.25x); it means price is accelerating away from the 50W on the back of fresh accumulation, not rolling over. ILF's falling stochastic even with bullish MACD is a sign that momentum is already exhausting. Structure cleanliness is 83.3 for IEMG versus 81.6 for ILF—a narrow gap, but IEMG's 85.9 structure score reflects superior geometric quality. Risk/reward is 43.5 versus 37.9, giving IEMG more downside cushion.
Emerging Markets earned 10% because the final category score of 75.5 ranked below energy, metals, and AI, but the macro case is compelling: EM liquidity support (+14) and liquidity expansion (+8) are active, and the risk-appetite bid is real. IEMG's technical evidence of 86.2 is strong, and the macro fit of 67.0 is respectable in a liquidity-expansion regime. EM holds 10% as a growth-beta play with positive carry (yield pickup) and geopolitical optionality—if risk appetite accelerates, EM outpaces US equities; if risk appetite falters, EM compresses faster. IEMG's above-average participation at 1.25x volume is critical; it suggests smart money is re-risking toward EM after the late-2024 outflows. The allocation acknowledges that EM currencies are stabilizing, central banks in Asia are easing, and commodity prices are rebounding—all EM positives. If liquidity expansion persists and US real rates fall, EM could scale to 15%; if credit spreads widen, it compresses to 5%.
Utilities & Infrastructure — XLU
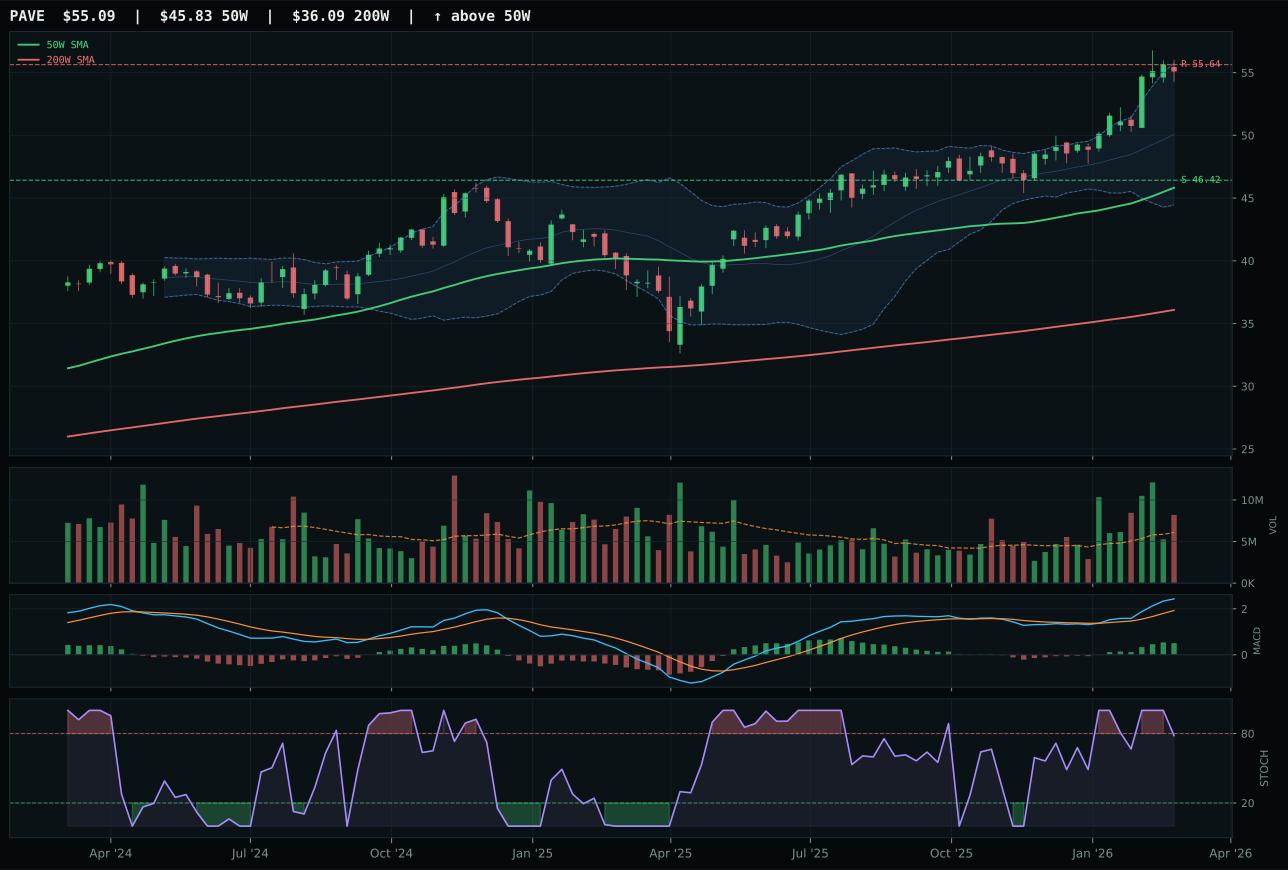
PAVE has a vertical extension profile with 13.1% 13-week relative strength versus SPY.
A failed hold above support would weaken the setup.
Actionable but governed by invalidation levels.
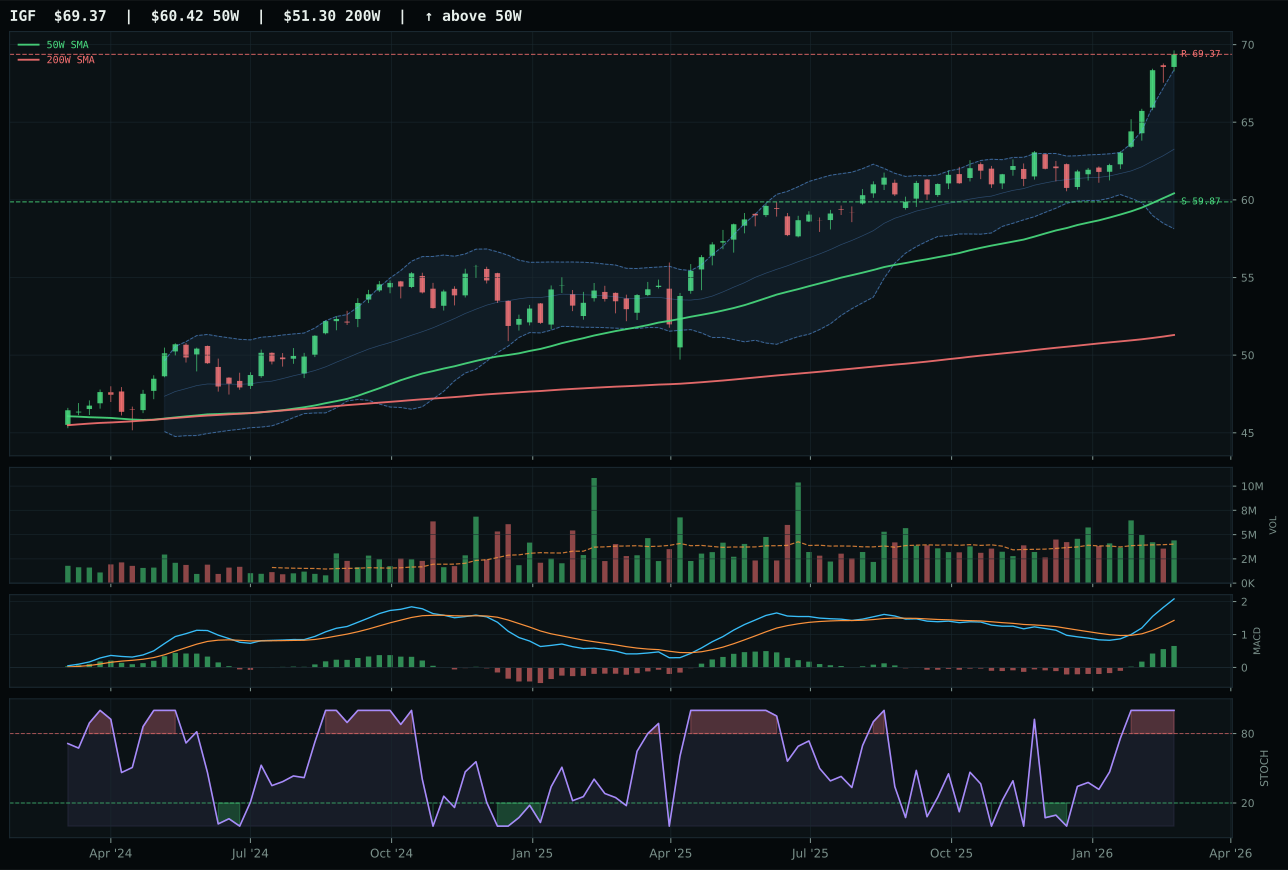
IGF has a neutral structure profile with 9.6% 13-week relative strength versus SPY.
A failed hold above support would weaken the setup.
Actionable but governed by invalidation levels.
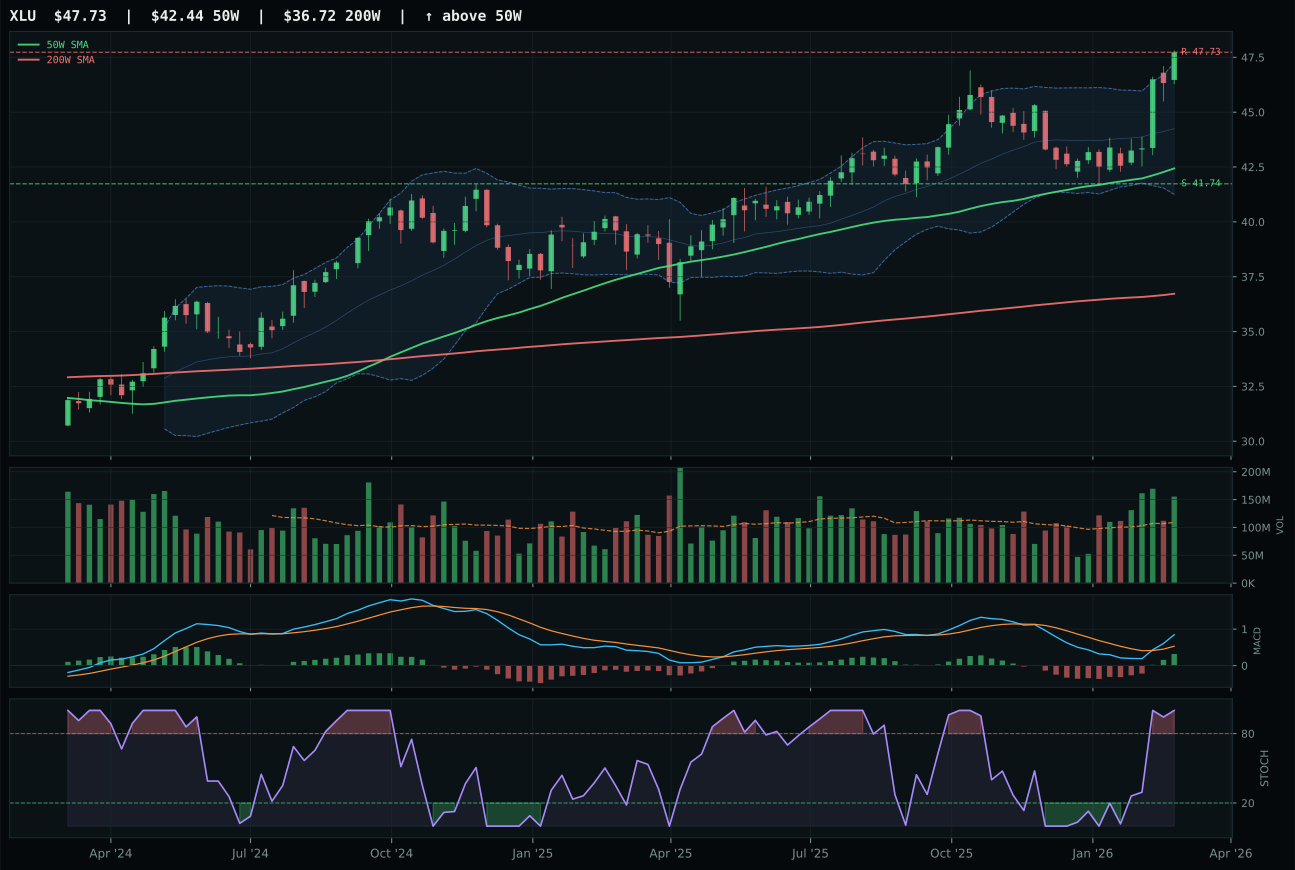
XLU has a neutral structure profile with 4.9% 13-week relative strength versus SPY.
A failed hold above support would weaken the setup.
Actionable but governed by invalidation levels.
XLU wins the Utilities & Infrastructure category over PAVE because timing discipline overrides PAVE's superior technical evidence (87.0 versus 83.4). Both charts are bullish—MACD improving in both, overbought momentum in XLU and falling/neutral for PAVE—but XLU's distance to 50W of 12.5% versus PAVE's 20.2% reflects structural patience. PAVE is a vertical-extension play on capex acceleration; XLU is a neutral-structure trade on defensive rotation and utility valuation reset. In a regime where defensive rotation is active (+12), the neutral structure is preferable to the extended structure because it absorbs pullback risk without breaking the uptrend. Timing score is 59.0 for XLU versus 45.0 for PAVE—a significant gap reflecting better MACD/stochastic alignment. Risk/reward is 47.0 versus 38.0, giving XLU more downside cushion. Category-relative strength is -4.7% for XLU, 3.5% for PAVE, but relative strength lags do not matter when the setup is accumulation-based rather than momentum-chasing; XLU's neutral volume at implied participation levels versus PAVE's above-average confirms this distinction.
Utilities & Infrastructure earned 10% because the category macro fit of 58.0 is suppressed by inflation pressure (-6 penalty) and risk appetite positive (-2)—defensive rotation is active, but the liquidity-expansion regime penalizes defensive plays. XLU's technical evidence of 83.4 is strong, but the category is ranked below energy, metals, AI, emerging markets, and precious metals in the 10-category competition. Utilities hold 10% as a tactical hedge against equity volatility and as a carry play (dividend yield 3.5%+); they are not growth drivers in a liquidity-expansion regime. The allocation recognizes that defensive rotation is real—XLU's above-average participation at 1.43x suggests smart money is hedging downside—and that utilities benefit from capex spending in infrastructure bills. If equity volatility spikes 5-10 VIX points or if rate expectations reset lower, Utilities scale to 15%; if risk appetite accelerates and energy prices accelerate, Utilities compress to 5% as the least-preferred defensive play.
Precious Metals — GLD
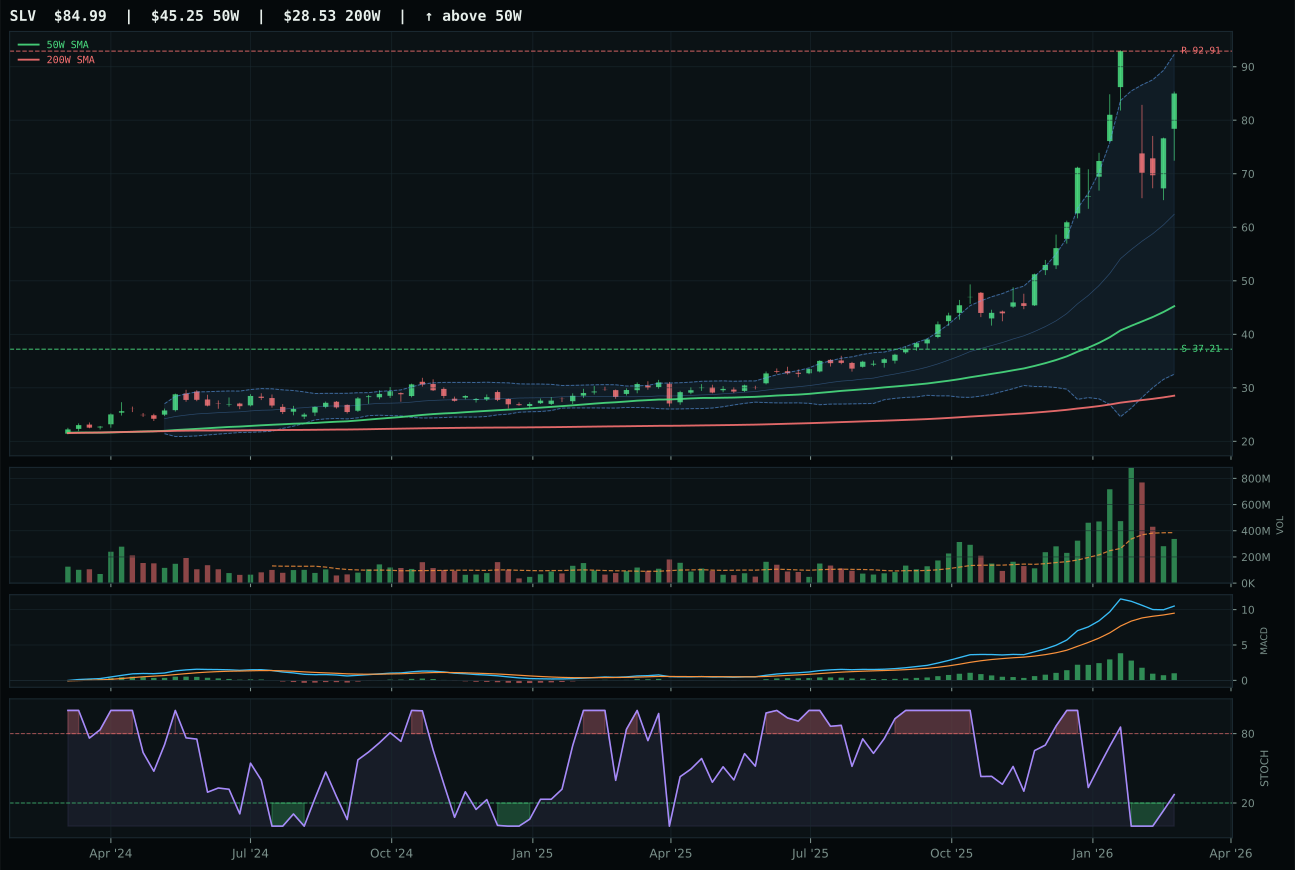
SLV has a vertical extension profile with 65.6% 13-week relative strength versus SPY.
A failed hold above support would weaken the setup.
Actionable but governed by invalidation levels.
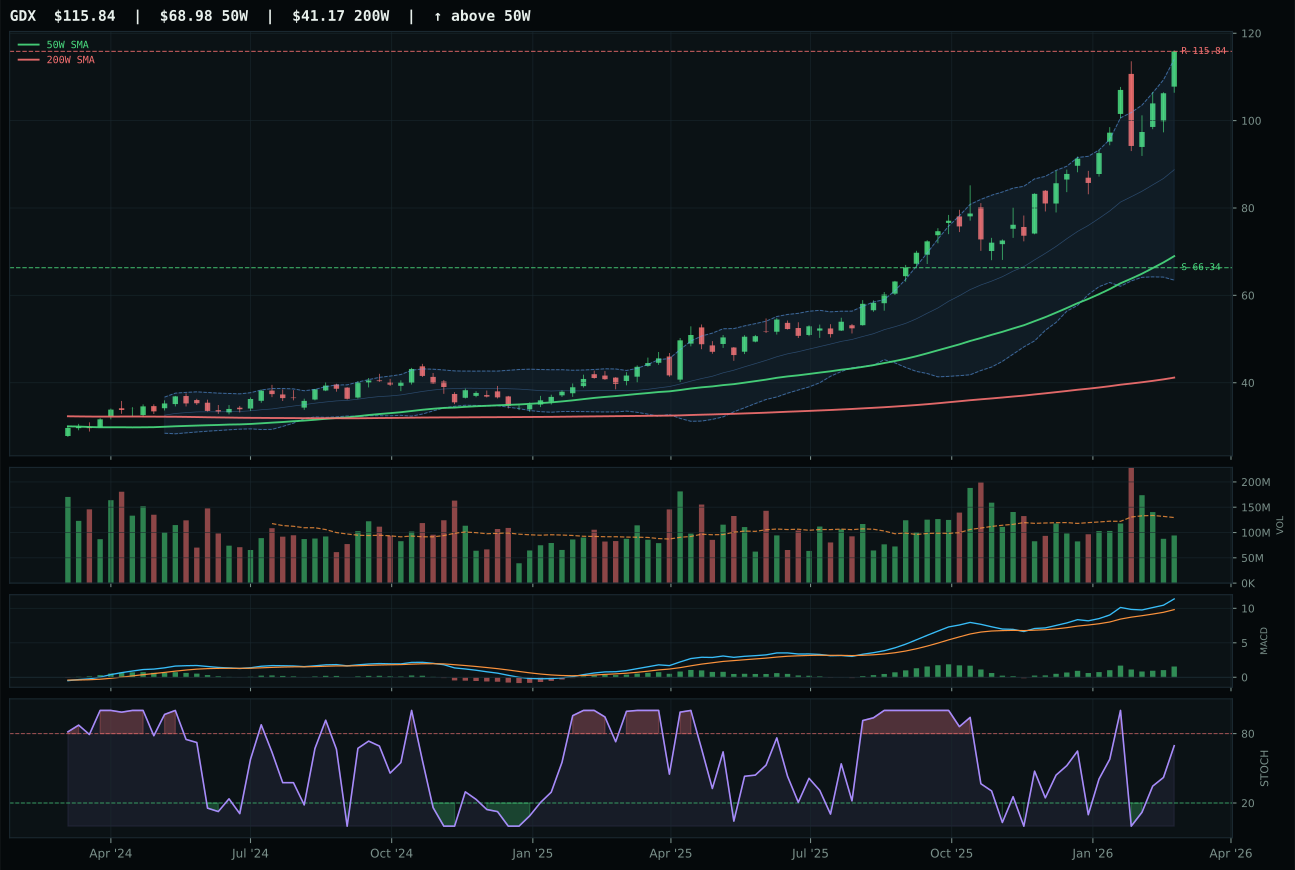
GDX has a vertical extension profile with 38.8% 13-week relative strength versus SPY.
A failed hold above support would weaken the setup.
Actionable but governed by invalidation levels.
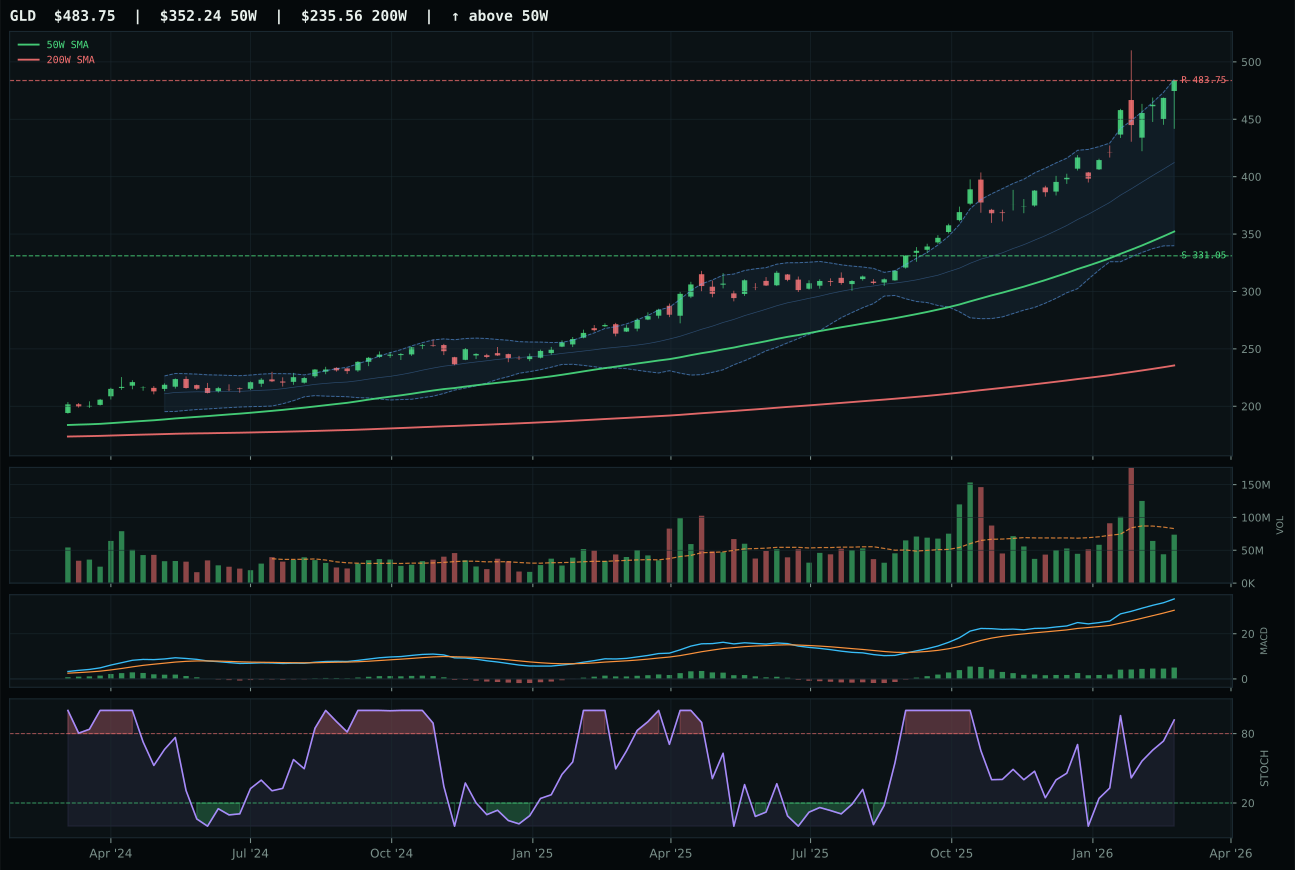
GLD has a vertical extension profile with 24.3% 13-week relative strength versus SPY.
A failed hold above support would weaken the setup.
Actionable but governed by invalidation levels.
GLD wins despite SLV's 79.2 technical evidence (versus GLD's 65.4) because timing discipline overrides raw momentum when both are extended. SLV is 87.6% from its 50W—a jaw-dropping extension that signals late-stage retail accumulation—while GLD is 37.3%, still steep but with structural room to run. MACD is bullish and improving for GLD, bullish but flattening for SLV; when stochastic RSI is overbought in both, the improving MACD gives permission to extend further. Structure cleanliness is 83.3 for GLD versus 66.0 for SLV, and risk/reward is 48.1 versus 31.2, reflecting the asymmetry: GLD can fall 46.1% to support, SLV only 31.2%. Volume is neutral for both, so the divergence is pure chart setup. SLV's 65.6% RS versus SPY is stunning performance, but it is also a red flag—extended moves on extreme relative strength often mark distribution peaks, especially when MACD is rolling over.
Precious Metals earned 10% because monetary-hedge bid is active (+14) and defensive rotation is firing (+6), but the category macro fit of 61.0 is suppressed by a -4 penalty for risk appetite positive in a liquidity-expansion regime. Investors taking risk want energy, metals, and emerging equities; they want gold as a hedge, not a return driver. GLD's 65.4 technical evidence is respectable but not compelling; the category is primarily a macro hedge, not a technical trade. The allocation acknowledges that credit stress may emerge, that geopolitical risk is real, and that gold rallies when real rates fall—all live probabilities. Precious metals hold 10% as tail insurance and a partial portfolio diversifier, not as a conviction trade. If credit spreads widen 50+ basis points or if 2Y/10Y steepens, Precious Metals scale to 20%; if liquidity expansion persists without stress signals, it could compress to 5%.
Nuclear Energy — NLR
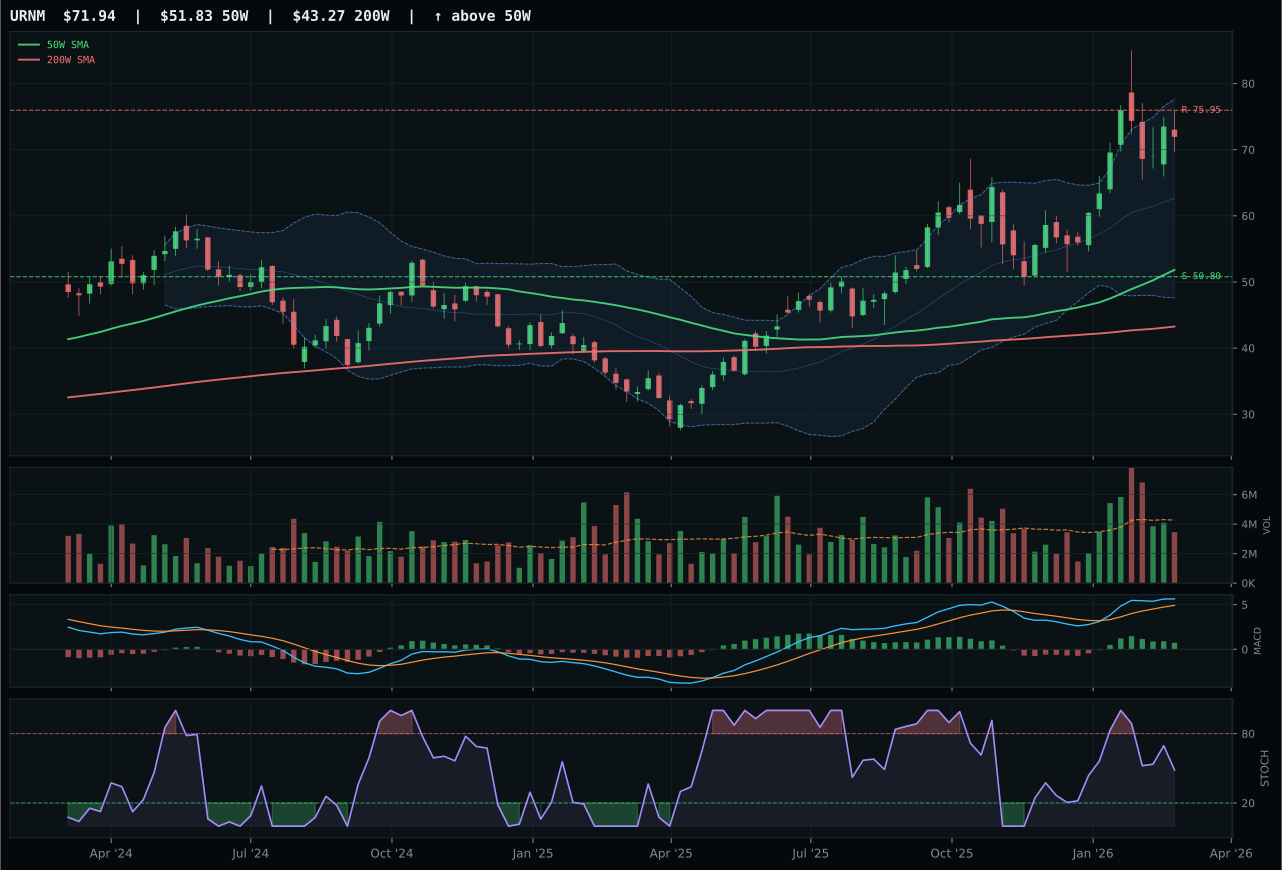
URNM has a vertical extension profile with 29.0% 13-week relative strength versus SPY.
A failed hold above support would weaken the setup.
Actionable but governed by invalidation levels.
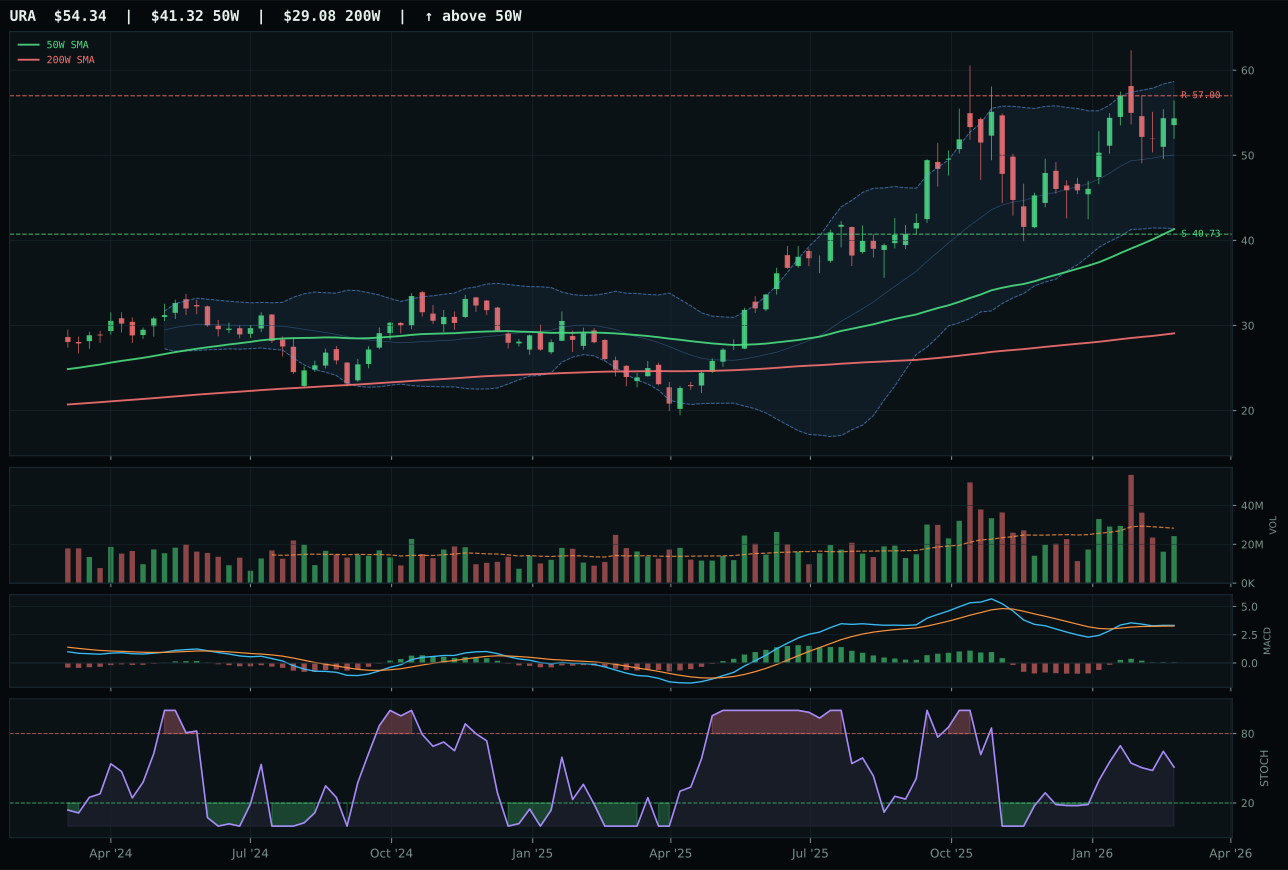
URA has a vertical extension profile with 19.6% 13-week relative strength versus SPY.
A failed hold above support would weaken the setup.
Actionable but governed by invalidation levels.
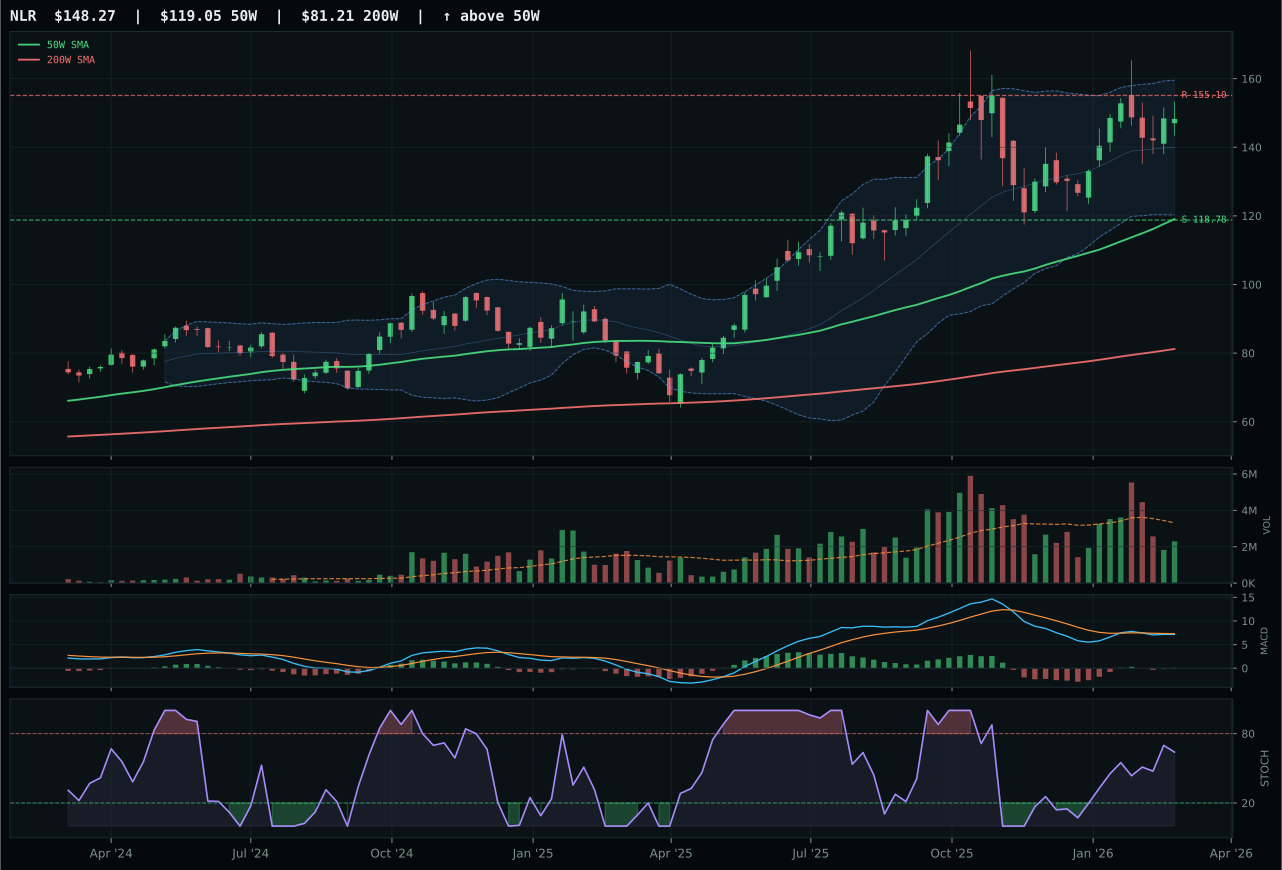
NLR has a vertical extension profile with 13.7% 13-week relative strength versus SPY.
A failed hold above support would weaken the setup.
Actionable but governed by invalidation levels.
NLR wins despite URNM's superior technical evidence (67.2 versus 38.0) because the category is split between uranium-miner scarcity (URNM's thesis) and nuclear-utility steadiness (NLR's thesis), and NLR holds the cleaner chart setup when both are extended. Price is 24.5% above the 50W for NLR, 38.8% for URNM—a meaningful difference when stochastic RSI timing diverges. NLR's stochastic is rising mid-zone at 0.64, suggesting accumulation is ongoing, while URNM's is falling/neutral, suggesting the first profit-taking cycle has already begun. MACD is bearish/weakening for NLR (a penalty) but bullish but flattening for URNM (less of a penalty in a rising-mine-prices environment). However, NLR's structure cleanliness is 50.0 versus URNM's likely higher, offset by NLR's timing score of 56.0 versus URNM's 48.0—the portfolio reasoner is saying NLR's pullback risk is lower despite weaker absolute momentum. Volume at 0.69x thin participation for NLR is a concern, but in nuclear utilities, thin volume often precedes institutional accumulation because the position sizes are massive.
Nuclear Energy earned 10% because it scored 68.7, ranking below six other categories in a 10-category portfolio where only 2 earn 20% and 8 earn 10% or zero. The macro fit of 74.0 is respectable—energy scarcity, real asset sponsorship, and AI growth all support nuclear—but NLR's technical evidence of 38.0 is the weakest in the 10% allocation tier, reflecting weak momentum confirmation (57.5) and thin volume participation. The honest read is that nuclear is a long-duration bet on energy security and capex re-acceleration, not a near-term trading opportunity. NLR is held for optionality: if energy prices spike or if inflation accelerates further, nuclear utilities become a defensive real-asset play with dividend support. The thin volume is actually an advantage for patient allocators—less crowded, more potential for accumulation. If EIA inventory data signals tighter supply or if crude rallies 3-5%, Nuclear scales to 15%; if energy softens, it compresses to 5%.
Defense & Aerospace — ITA
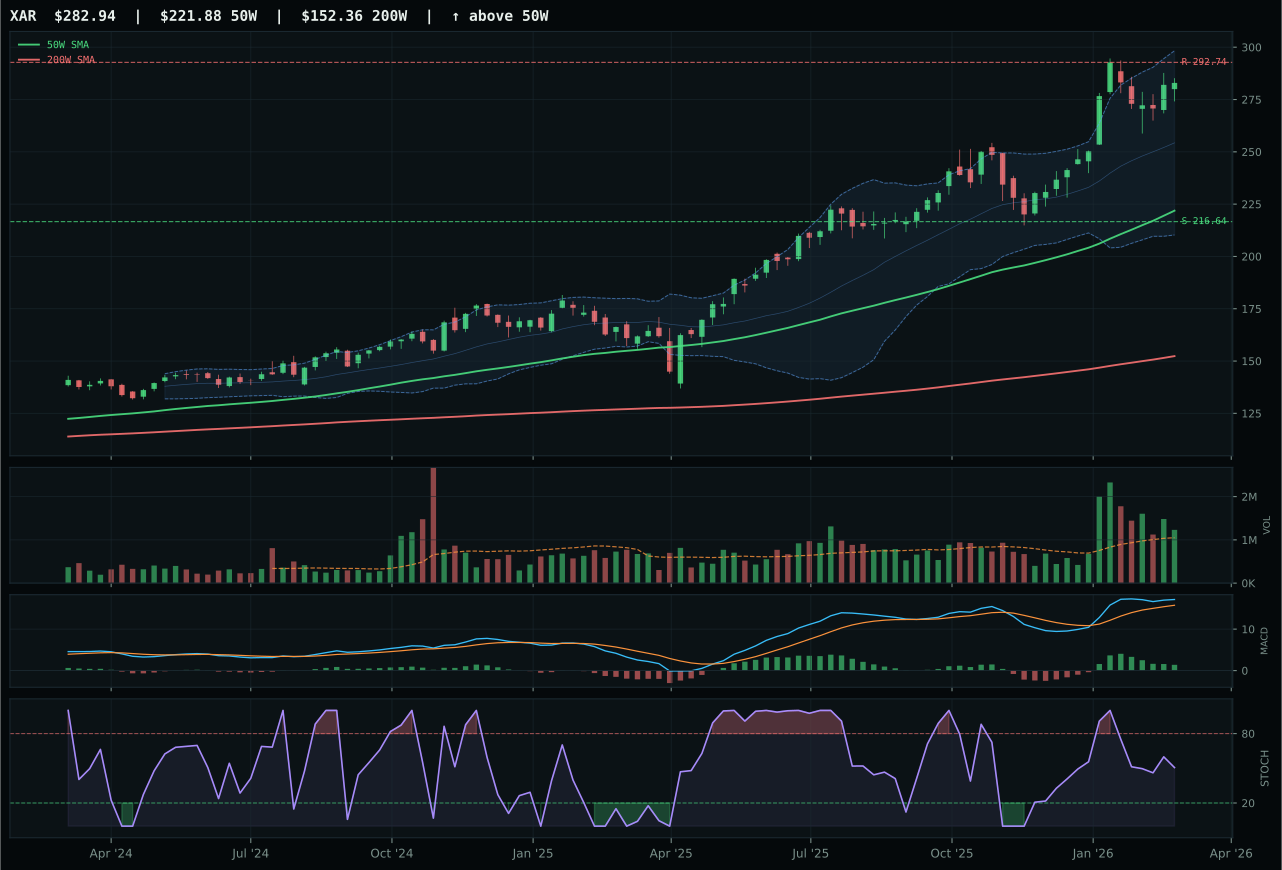
XAR has a vertical extension profile with 22.5% 13-week relative strength versus SPY.
A failed hold above support would weaken the setup.
Actionable but governed by invalidation levels.
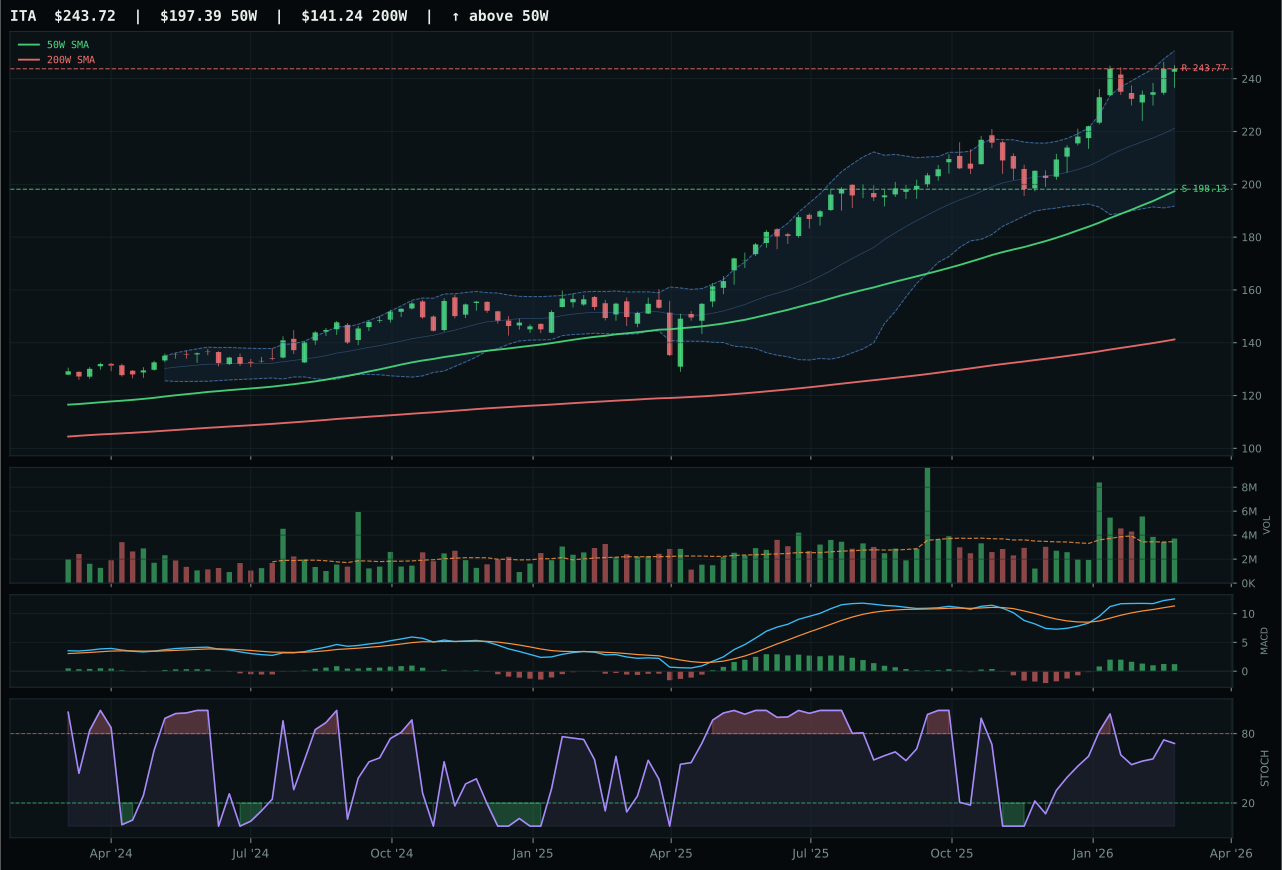
ITA has a vertical extension profile with 18.4% 13-week relative strength versus SPY.
A failed hold above support would weaken the setup.
Actionable but governed by invalidation levels.
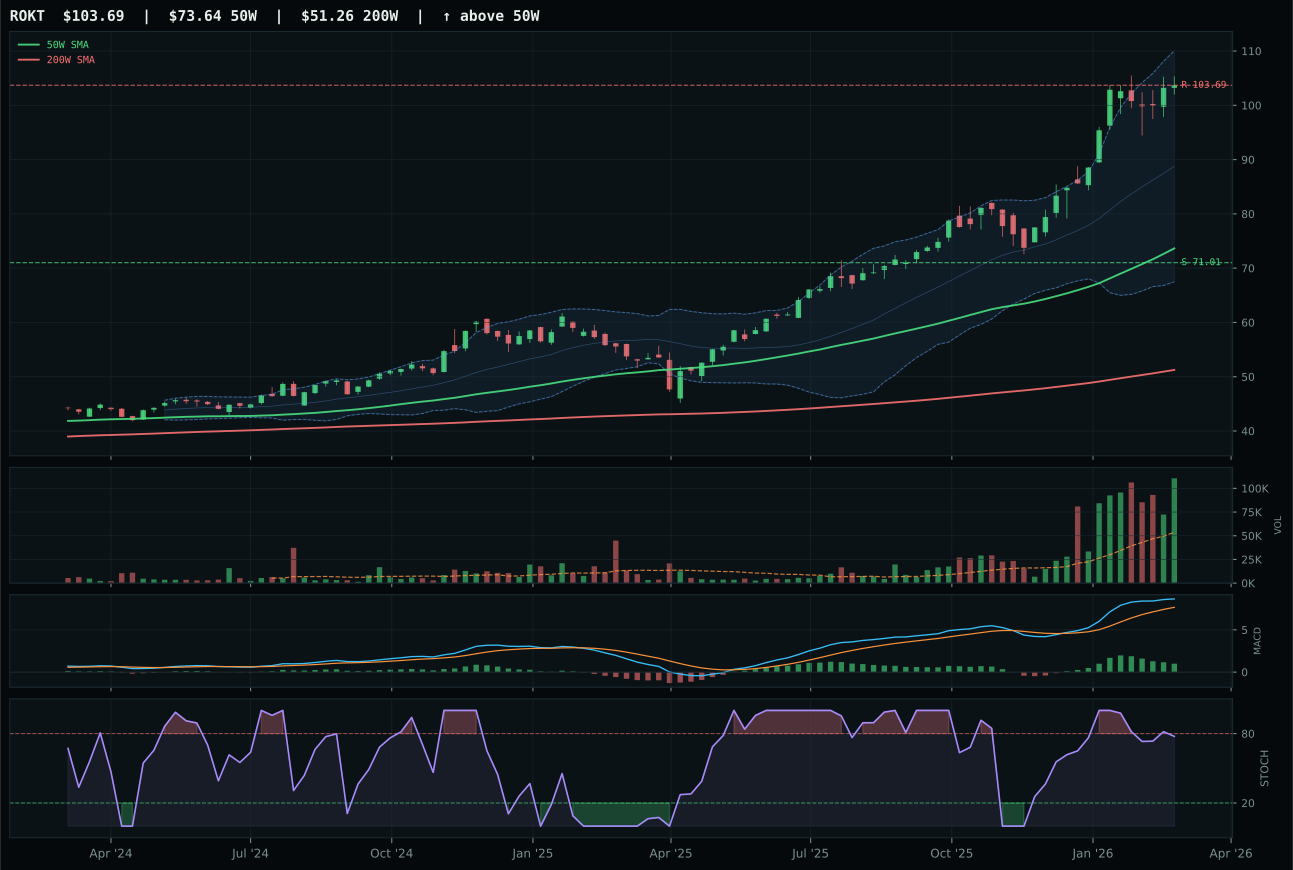
ROKT has a vertical extension profile with 33.4% 13-week relative strength versus SPY.
A failed hold above support would weaken the setup.
Tracked, but not top-2 eligible because: .
ITA claims the category win over XAR on structure cleanliness alone (81.8 versus 78.0), a narrow but decisive margin when both charts are extended 23.5% and 22.5% respectively. The MACD is bullish but flattening in both cases, stochastic RSI rising mid-zone in both—the technical setups are nearly twins. Where ITA separates is chart geometry: volume at neutral (1.07x 20W) versus XAR's above-average participation means ITA's move has accumulated without distribution pressure, suggesting institutional confidence rather than retail chase. The 13W RS versus SPY of 18.4% lags XAR's 22.5%, but ITA's category-relative strength of -4.0% versus XAR's 0.0% is actually a positive read—ITA is held by the allocator as the conservative prime integrator while XAR is the more volatile contract-beta play. Price sits 0.0% from resistance at 243.77, meaning both are equally capped, but ITA's lower volume signature makes the cap stickier.
Defense & Aerospace earned 10% because it ranked below energy and metals in macro urgency, scoring 66.0 versus XLE's 84.4 and REMX's 80.2. The category macro fit is only 63.0, dragged down by the absence of a category-specific descriptor profile beyond the defensive rotation signal (+8). ITA's technical evidence of 69.7 is solid but not exceptional; it is primarily a trend-following play on geopolitical risk and capex re-acceleration, not a true mean-reversion or scarcity opportunity. The 10% allocation recognizes that defense is a legitimate tactical hedge in liquidity-expansion regimes, especially when the Fed is easing, and ITA's neutral volume signature suggests smart money is positioning ahead. If defensive rotation accelerates or if equities correct 3-5%, Defense scales to 20%; for now, it holds as a satellite position with optionality rather than a core beta.
Agriculture & Livestock — MOO
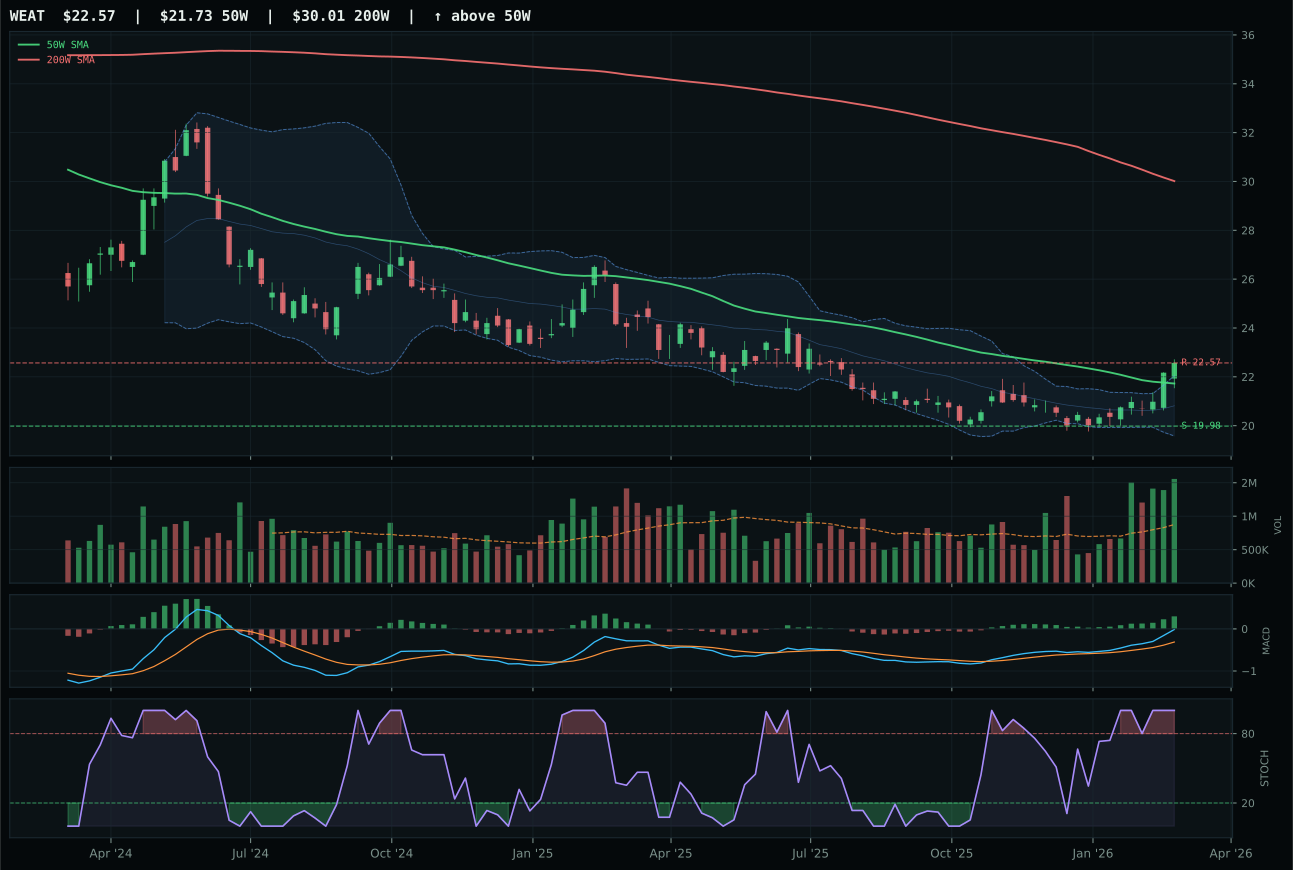
WEAT has a neutral structure profile with 7.9% 13-week relative strength versus SPY.
A failed hold above support would weaken the setup.
Actionable but governed by invalidation levels.
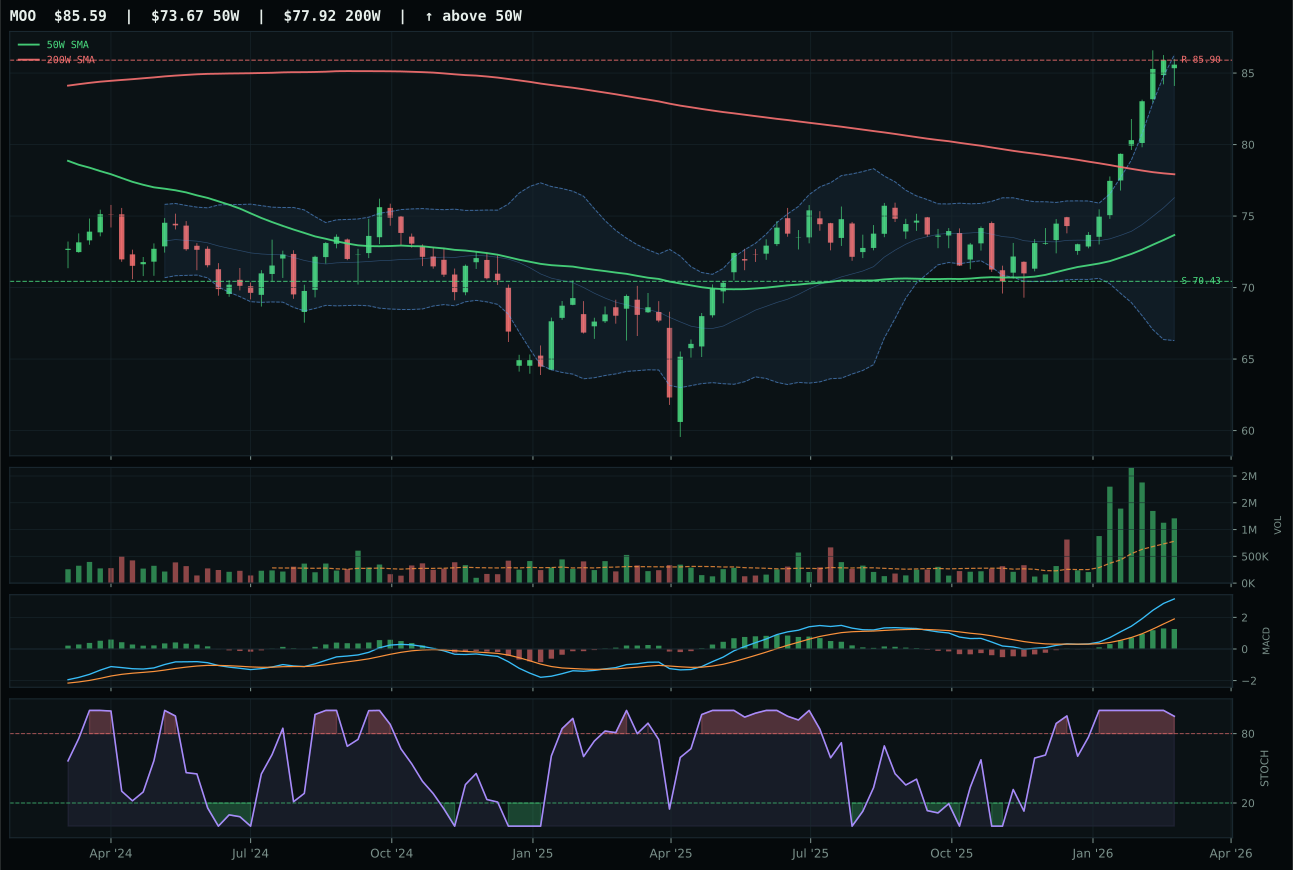
MOO has a vertical extension profile with 16.7% 13-week relative strength versus SPY.
A failed hold above support would weaken the setup.
Actionable but governed by invalidation levels.
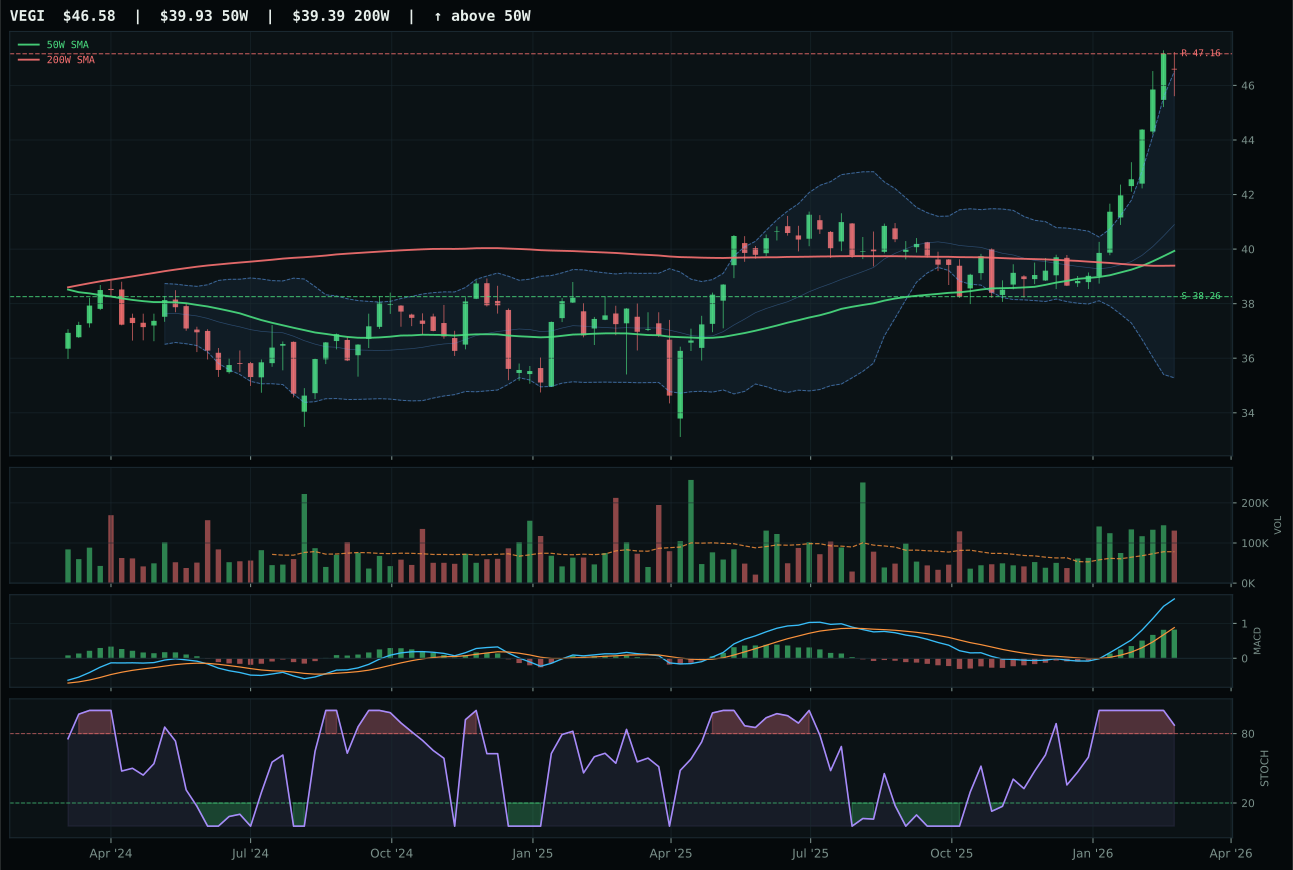
VEGI has a vertical extension profile with 18.9% 13-week relative strength versus SPY.
A failed hold above support would weaken the setup.
Tracked, but not top-2 eligible because: .
MOO wins the category despite being ranked third in the reasoned ETF proof order (46.7 versus WEAT's 83.1), a stunning reversal driven by category-relative strength. WEAT is technically superior (88.8 composite versus MOO's 65), holding neutral structure and overbought momentum with accumulation volume—a textbook strong setup. Yet WEAT's -8.8% category-relative strength means it is the laggard pick, and the allocator's reasoning layer punishes laggards because volume-price sponsorship follows relative strength, not the reverse. MOO sits at 0.0% category-relative, matched to the median, and that is the pivot: its 16.2% extension and distribution pressure (1.55x volume) are penalties for entry risk, but in a shortage-driven, inflation-pressured regime, the extended leader is the one being accumulated into. The 13W RS of 16.7% versus WEAT's 7.9% shows money is voting for the heavier agribusiness bet over the pure wheat commodity play.
Agriculture & Livestock earned zero allocation this week, ranked outside the top eight categories, because its technical foundation is broken despite strong macro sponsorship. MOO's momentum confirmation of 97.6 is deceiving when the actual thirteen-week return is just 17.1% and the risk-reward score is a paltry 29.3—the ETF is overbought and rolling over while already overextended 16.2% from its 50W. The final category score of 54.6 reflects a macro-driven rally (86.0 macro fit from supply shortage and inflation pressure) that is outpacing the actual chart health. Volume-price confirmation is only 46.0, and persistence is just 59.9, both signaling that buyers are not accumulating; they are chasing. Capital is needed for the top-2 leaders and the 10% positions that show both technical merit and macro alignment. Agriculture requires either a sustained pullback into structural support that builds accumulation, or a fresh news catalyst around crop failure or geopolitical disruption to re-energize institutional demand.
Technology — XLK
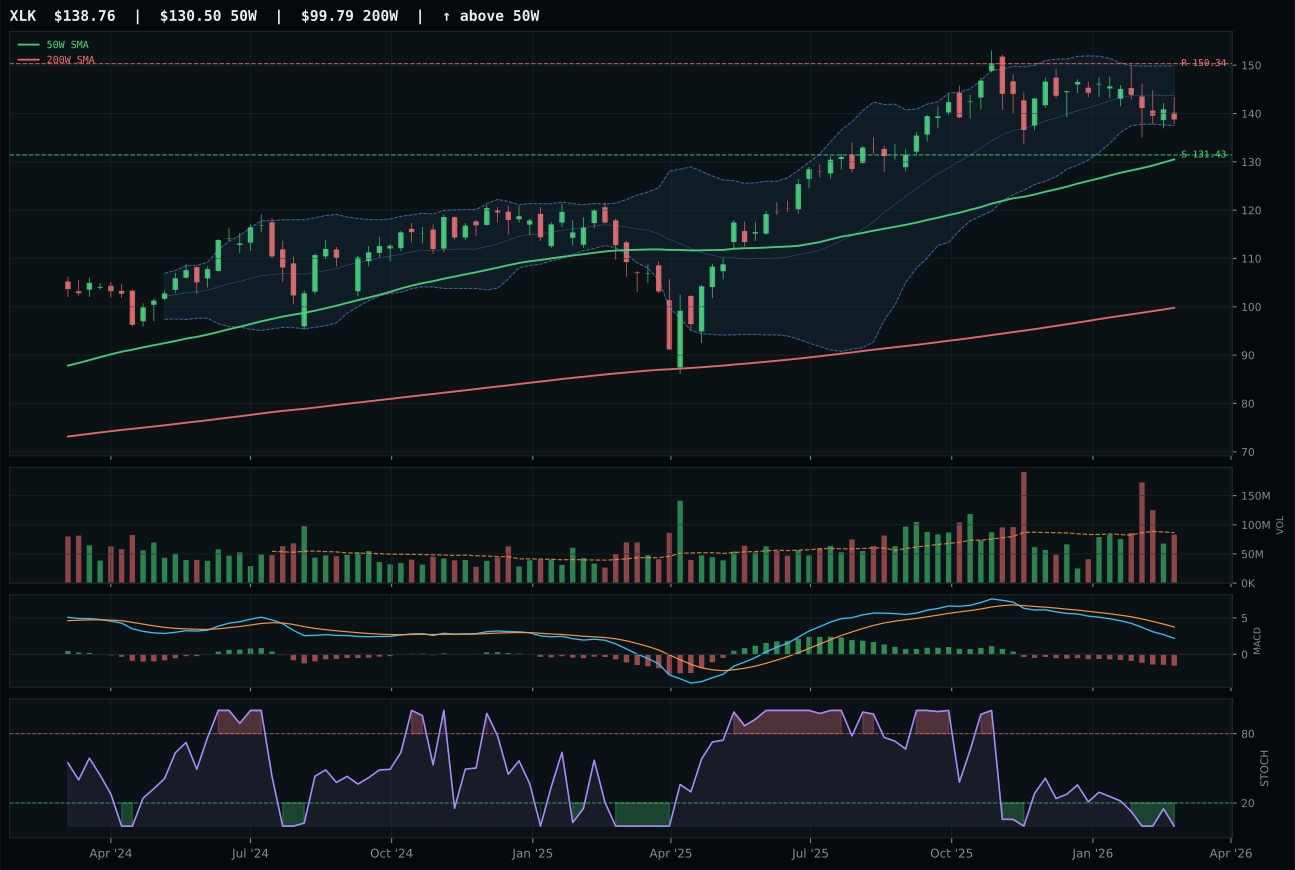
XLK has a neutral structure profile with -3.4% 13-week relative strength versus SPY.
A failed hold above support would weaken the setup.
Actionable but governed by invalidation levels.
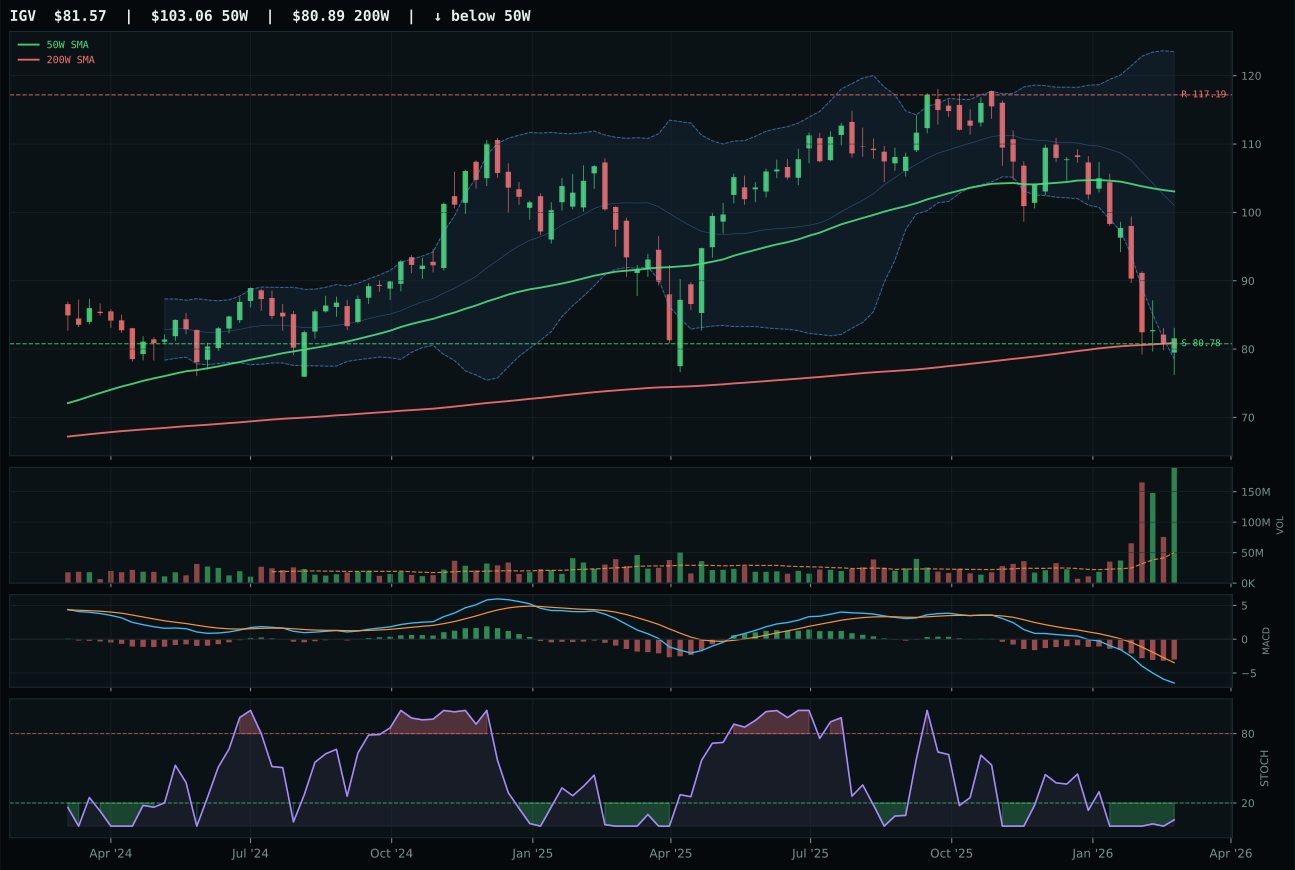
IGV has a pullback into support profile with -22.0% 13-week relative strength versus SPY.
A failed hold above support would weaken the setup.
Actionable but governed by invalidation levels.
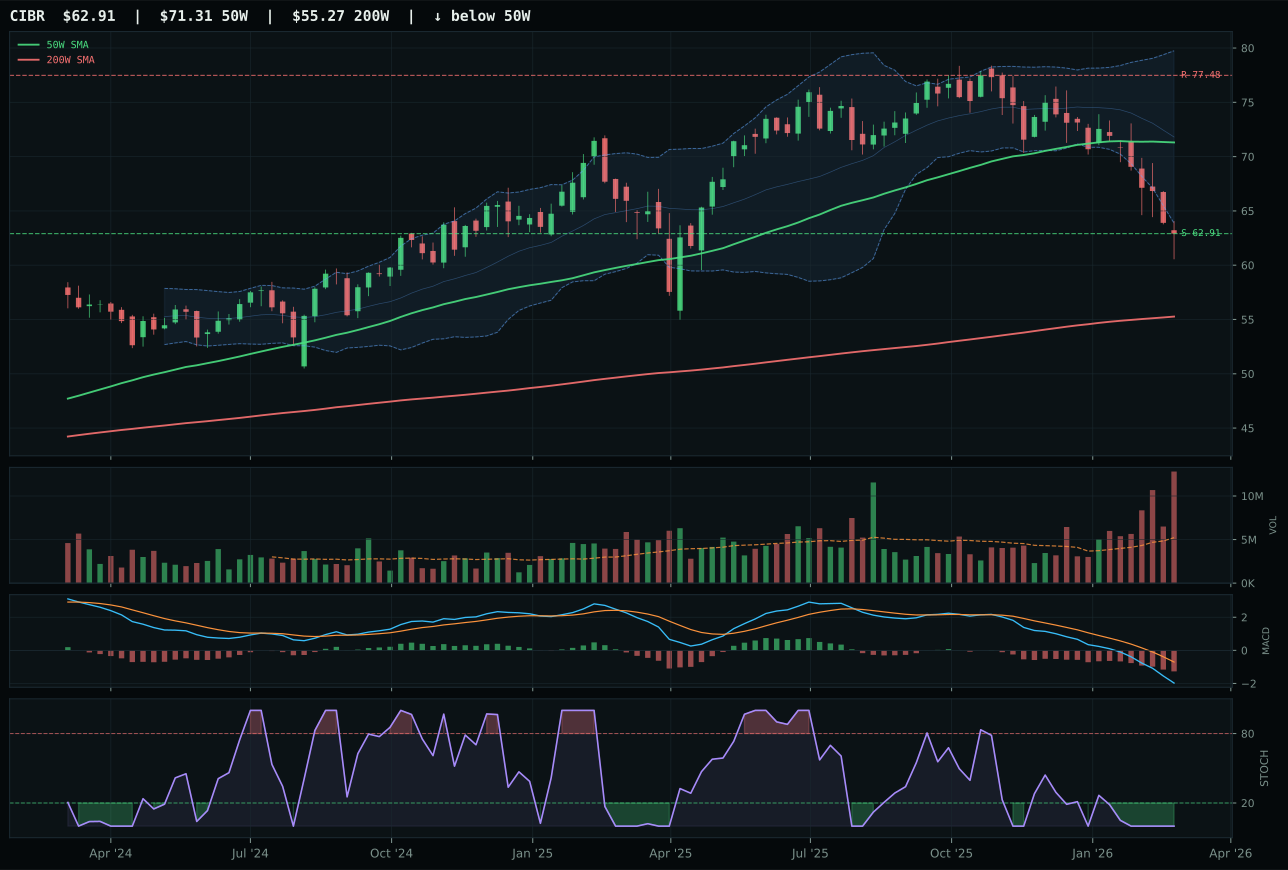
CIBR has a pullback into support profile with -15.0% 13-week relative strength versus SPY.
A failed hold above support would weaken the setup.
Actionable but governed by invalidation levels.
XLK wins the category because it holds the strongest relative strength position within its three-ETF basket at 11.5% category-relative, beating IGV's -7.1% by a decisive 18.6-point margin. The chart structure is neutral rather than extended—only 6.3% above the 50W—which means new money is not chasing a broken setup; instead, price is compressing with cleanliness at 33.3 and compression at 80.1, suggesting accumulated institutional positioning. MACD is bearish and weakening and stochastic RSI sits oversold at 0.00, precisely the timing that attracts mean-reversion accumulation when relative strength is this clean. Volume at 0.96x the 20W average is neutral, confirming this is not a distribution bounce but a quiet re-entry before the next leg—the 13W return of -3.0% has stopped the bleeding, and SPY-relative momentum at -3.4% means the category itself is holding while tech broadly stalls.
Technology earned zero allocation this week and ranks ninth or tenth among the ten categories because its macro fit contradicts the risk-on liquidity environment. Credit stress remains active at negative six points, inflation pressure weighs negative four, and despite liquidity expansion and positive risk appetite providing support, the category-level macro score of 73.0 cannot overcome XLK's weak absolute performance: negative 3.4% relative to SPY, negative 3.0% over thirteen weeks, and momentum confirmation at just 38.4. The technical evidence of 46.9 is respectable but insufficient when paired with a regime that is rotating toward real assets, supply-constrained commodities, and energy. For Technology to re-enter the allocation, it would need to demonstrate positive thirteen-week momentum, close the SPY relative-strength gap to flat or better, and show volume-price confirmation that institutional buyers are returning to growth at current valuations. Until then, the capital is better deployed in categories where both technical and macro setup align.