
2026-02-20
Informational purposes only. The content in this report, including allocations, analysis, and commentary, is provided solely for informational and educational purposes. It does not constitute financial advice, investment advice, trading advice, or any other type of advice. Past performance does not guarantee future results. Always conduct your own research and consult a qualified financial professional before making investment decisions.
Weekly Allocation
| Ticker | Category | Weight | Role |
|---|---|---|---|
| XLE | Traditional Energy | 20% | Top-2 (20%) |
| MOO | Agriculture & Livestock | 20% | Top-2 (20%) |
| IEMG | Emerging Markets | 10% | Tier-2 (10%) |
| COPX | Industrial Metals | 10% | Tier-2 (10%) |
| BOTZ | AI | 10% | Tier-2 (10%) |
| GLD | Precious Metals | 10% | Tier-2 (10%) |
| NLR | Nuclear Energy | 10% | Tier-2 (10%) |
| XLU | Utilities & Infrastructure | 10% | Tier-2 (10%) |
Trade Instructions — Monday Open
Sell the tranche from 2026-01-23 (completing its 4-week hold). Buy the new tranche. Instructions show net portfolio changes — same-asset positions cancel, weight changes show the delta.
| Action | Ticker | Instruction |
|---|---|---|
| SELL | REMX | Sell entire REMX position (5.00% of portfolio) |
| SELL | SMH | Sell 33% of SMH position (reduce 7.50% → 5.00%) |
| SELL | URNM | Sell 25% of URNM position (reduce 10.00% → 7.50%) |
| SELL | ILF | Sell 25% of ILF position (reduce 10.00% → 7.50%) |
| SELL | SLV | Sell entire SLV position (2.50% of portfolio) |
| BUY | MOO | Buy MOO — 16.67% of freed cash (adds 2.50% to portfolio) |
| BUY | COPX | Buy COPX — 16.67% of freed cash (adds 2.50% to portfolio) |
| BUY | GLD | Buy GLD — 16.67% of freed cash (adds 2.50% to portfolio) |
| BUY | BOTZ | Buy BOTZ — 16.67% of freed cash (adds 2.50% to portfolio) |
| BUY | IEMG | Buy IEMG — 16.67% of freed cash (adds 2.50% to portfolio) |
| BUY | NLR | Buy NLR — 16.67% of freed cash (adds 2.50% to portfolio) |
Current Portfolio After Trade
Combined holdings across all 4 active tranches. Each tranche is 25% of the portfolio.
| Ticker | % of Portfolio | Weight Bar |
|---|---|---|
| XLE | 20.00% | |
| COPX | 15.00% | |
| MOO | 10.00% | |
| GLD | 10.00% | |
| URNM | 7.50% | |
| ILF | 7.50% | |
| SMH | 5.00% | |
| IGF | 5.00% | |
| BOTZ | 5.00% | |
| XAR | 2.50% | |
| PAVE | 2.50% | |
| ITA | 2.50% | |
| IEMG | 2.50% | |
| NLR | 2.50% | |
| XLU | 2.50% |
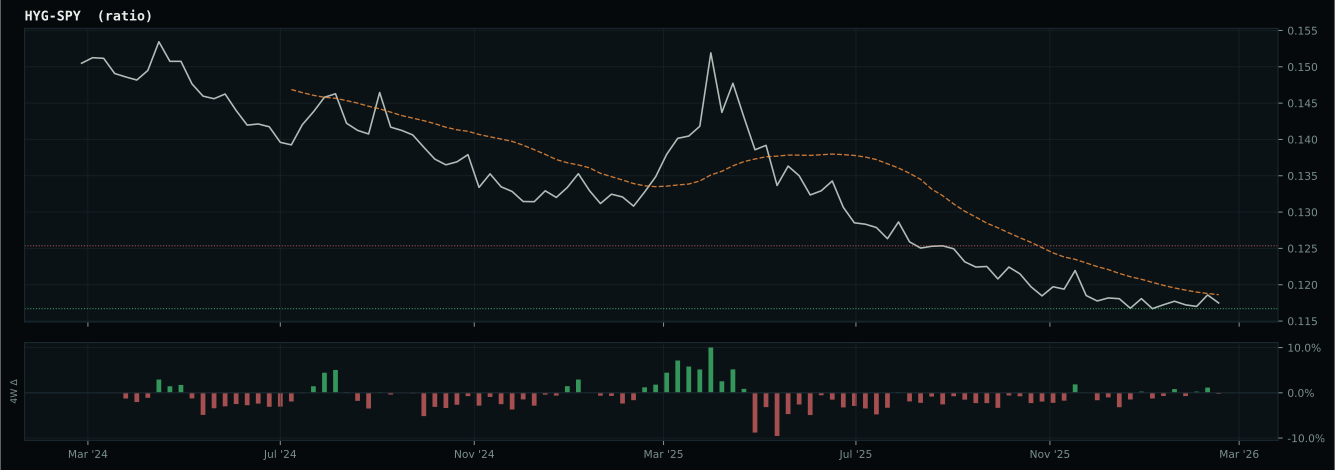
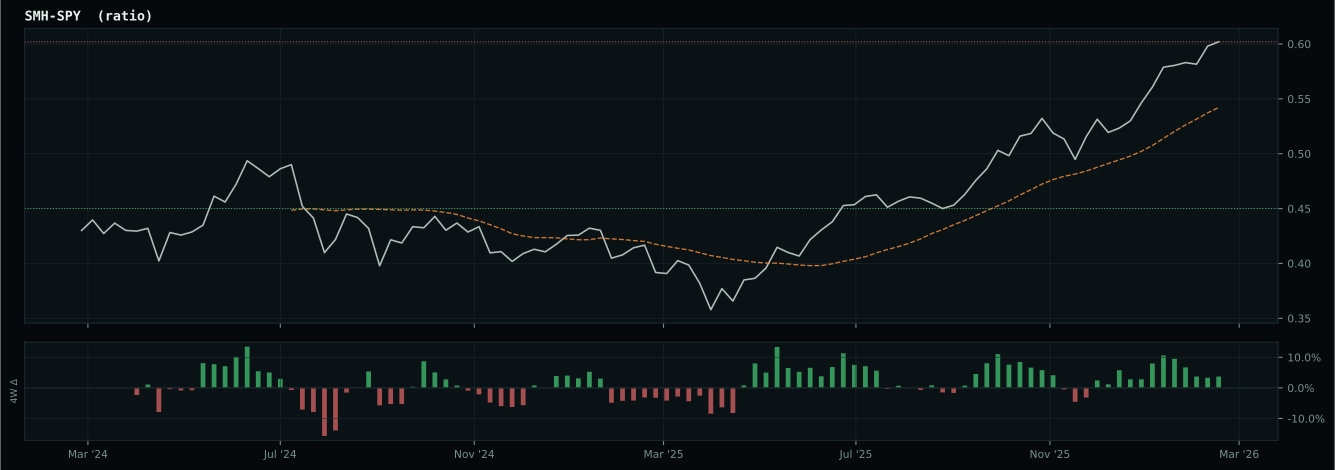
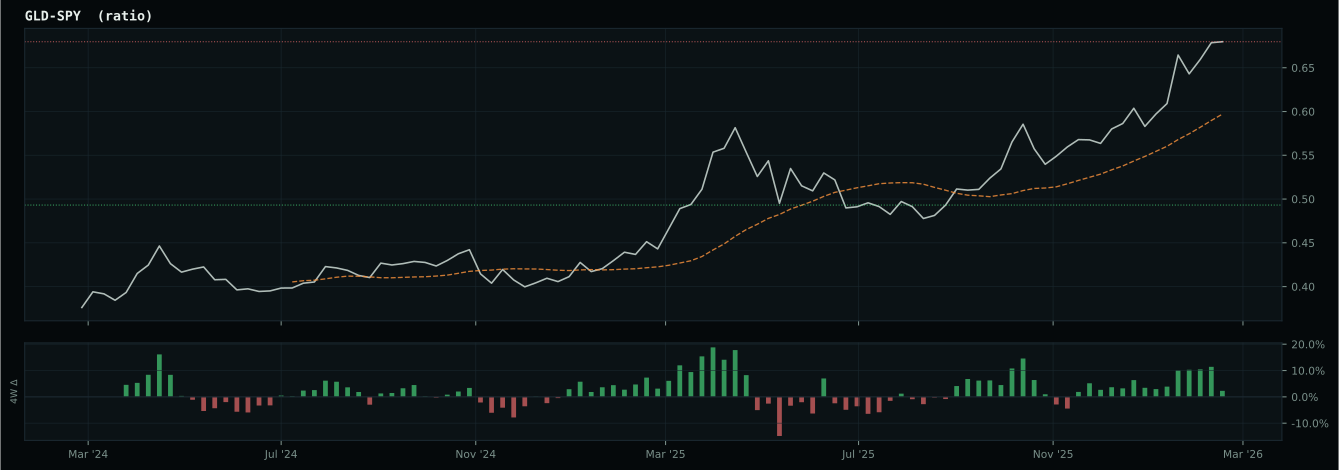
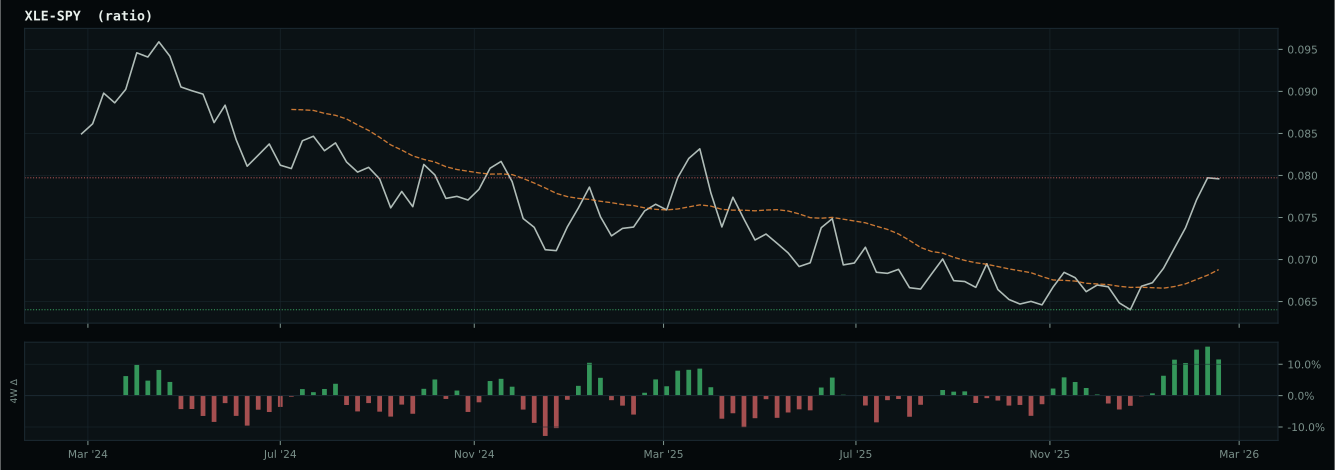
Macro Regime — Transition / Mixed
Macro Evidence Charts
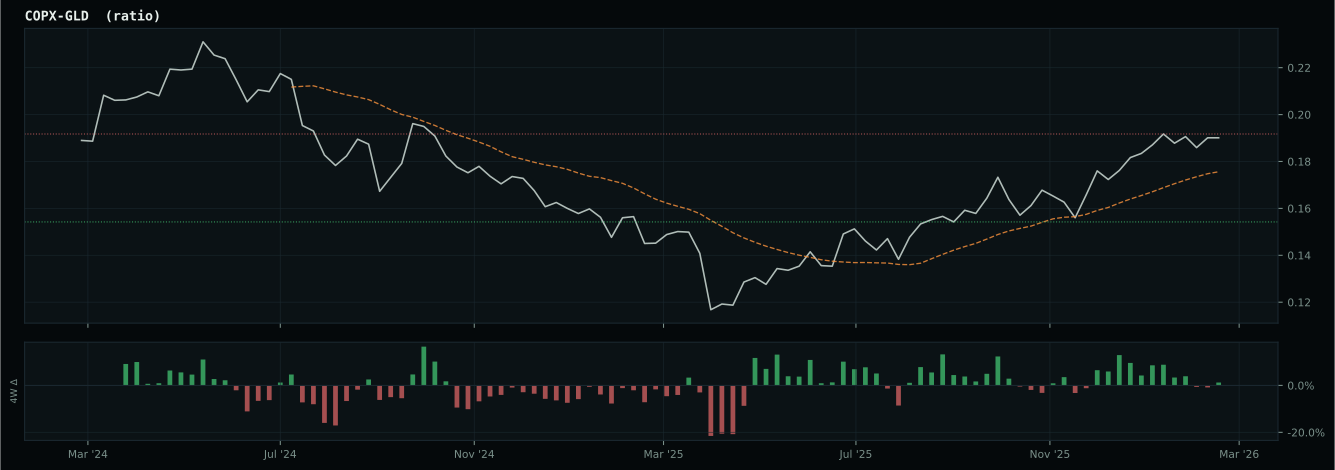
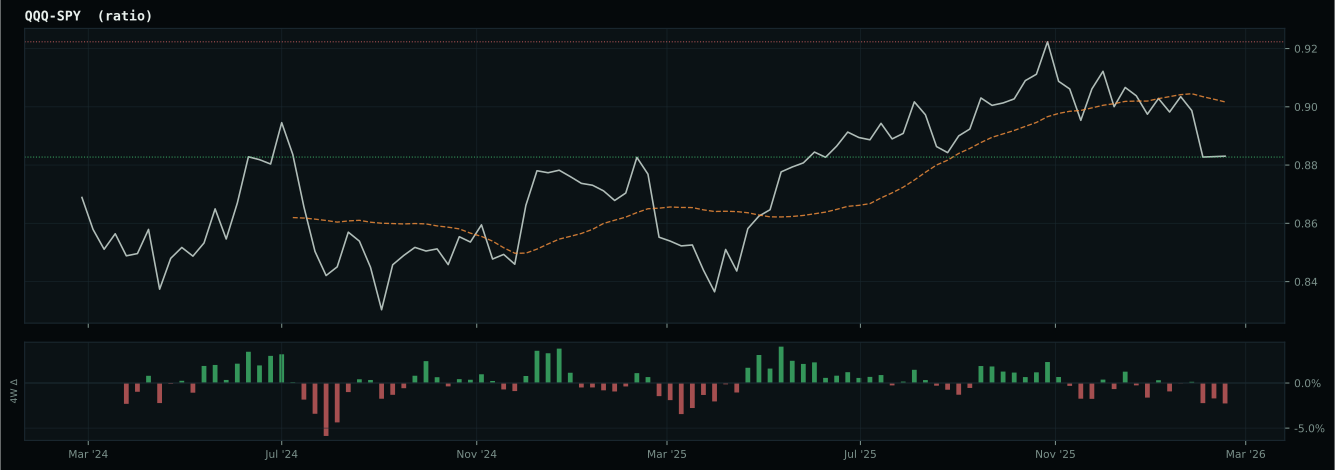
Market-implied signals behind the macro regime scores. Each ratio compares two assets; the direction and slope of the ratio is what the macro engine reads.
Crypto Regime — NoCrypto
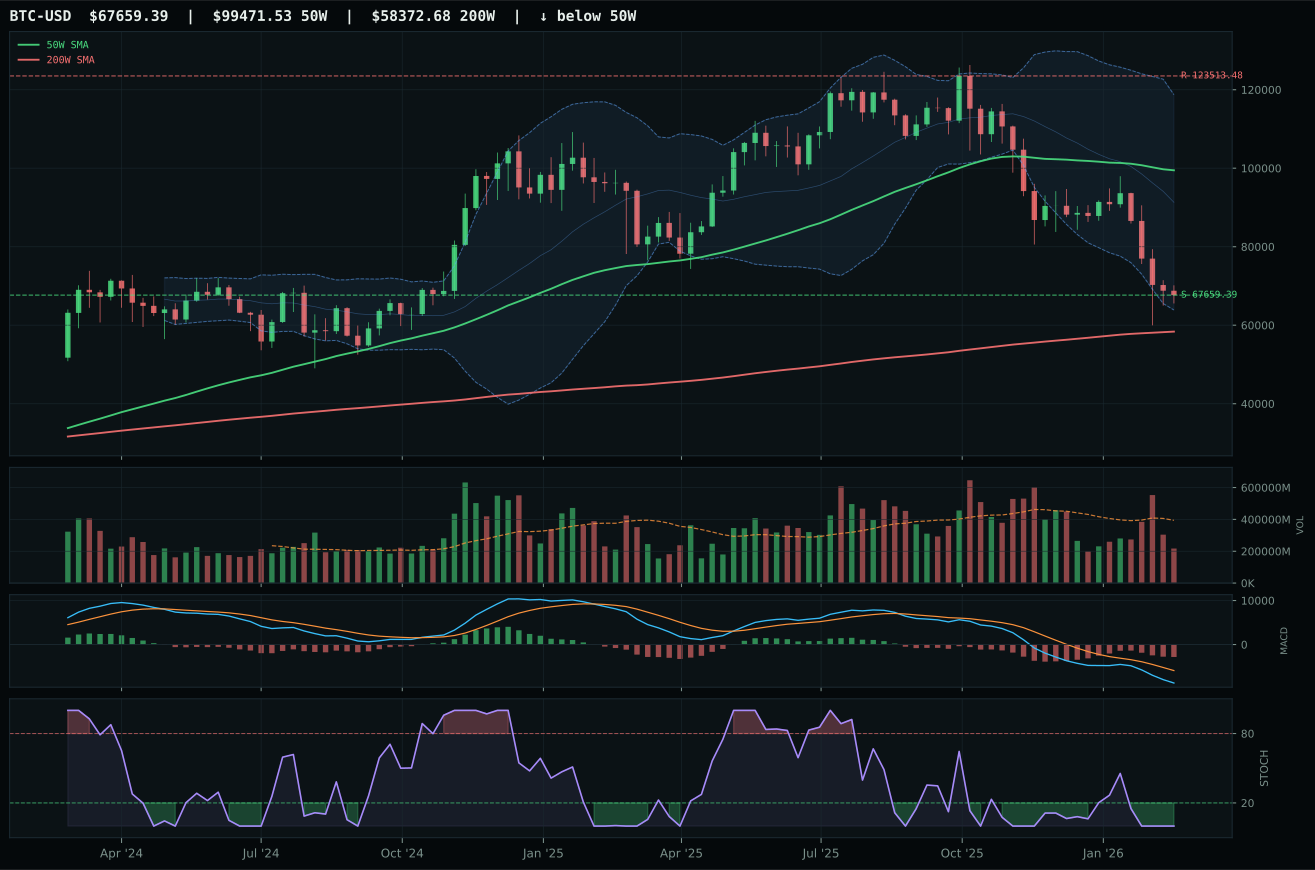
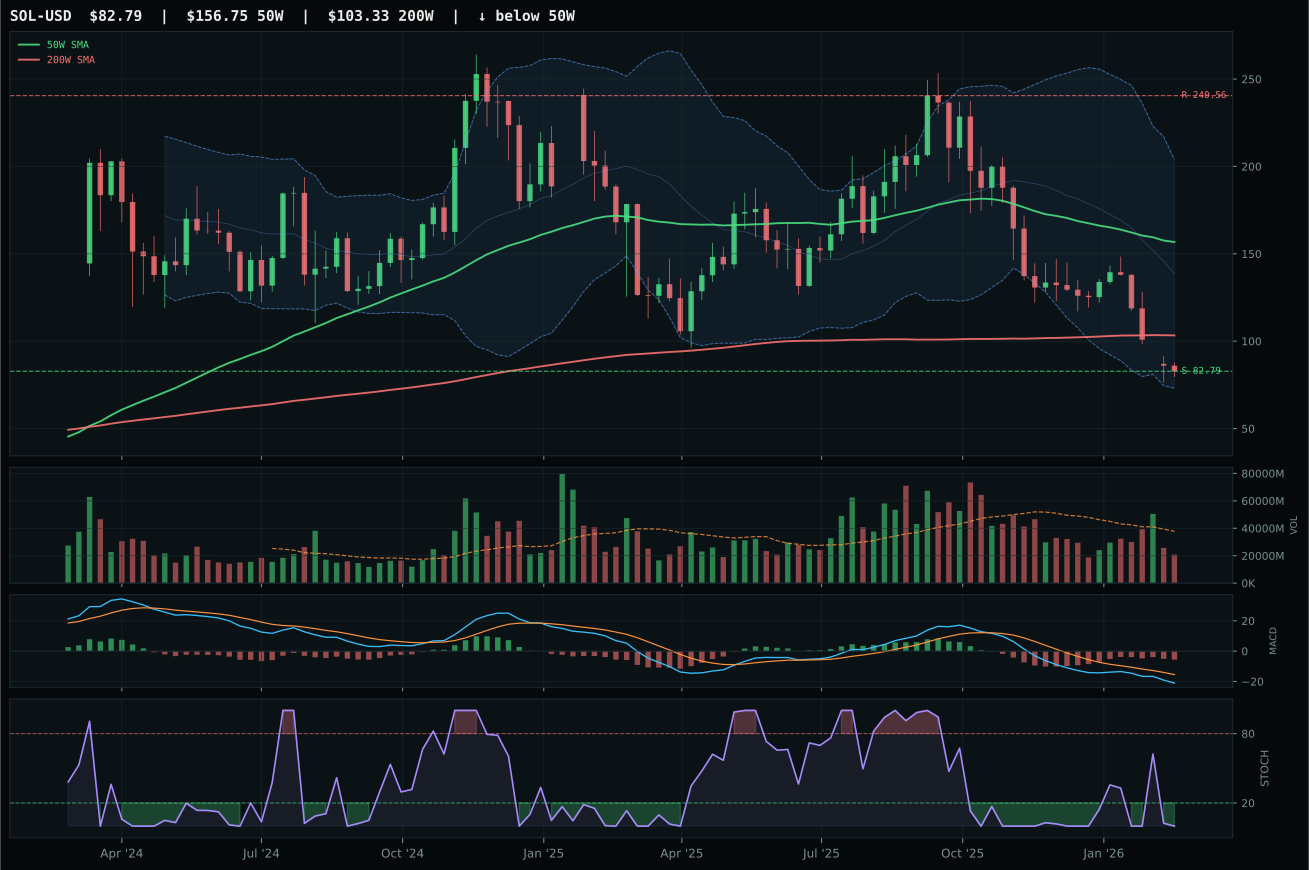
ValueBTC armed by first 200W buy-zone touch, but post-touch range age is 2 weeks; minimum is 12
TrendBTC not confirmed
one or more available conditions failed
Category Rankings
| Rank | Category | Winner | Score | Alloc | 4W Ret | Peers (4W) |
|---|---|---|---|---|---|---|
| 1 | Traditional Energy | XLE | 84.1 | 20% | +5.18% | XOP +13.6% · FCG +9.9% |
| 2 | Agriculture & Livestock | MOO | 77.5 | 20% | -5.58% | WEAT +3.1% · VEGI -6.0% |
| 3 | Emerging Markets | IEMG | 73.6 | 10% | -8.07% | ILF -9.8% · INDA -10.1% |
| 4 | Industrial Metals | COPX | 72.4 | 10% | -19.86% | PICK -13.6% · REMX -8.8% |
| 5 | AI | BOTZ | 67.5 | 10% | -11.60% | SMH -4.9% · AIQ -2.4% |
| 6 | Precious Metals | GLD | 67.3 | 10% | -14.65% | SLV -21.8% · GDX -24.5% |
| 7 | Nuclear Energy | NLR | 67.1 | 10% | -11.73% | URNM -18.3% · URA -11.7% |
| 8 | Utilities & Infrastructure | XLU | 61.1 | 10% | -3.31% | PAVE -9.7% · IGF -4.1% |
| 9 | Defense & Aerospace | ITA | 58.6 | 0% | -6.76% | XAR -5.9% · ROKT -0.9% |
| 10 | Technology | XLK | 36.9 | 0% | -1.91% | CIBR +1.9% · IGV +5.5% |
Traditional Energy — XLE
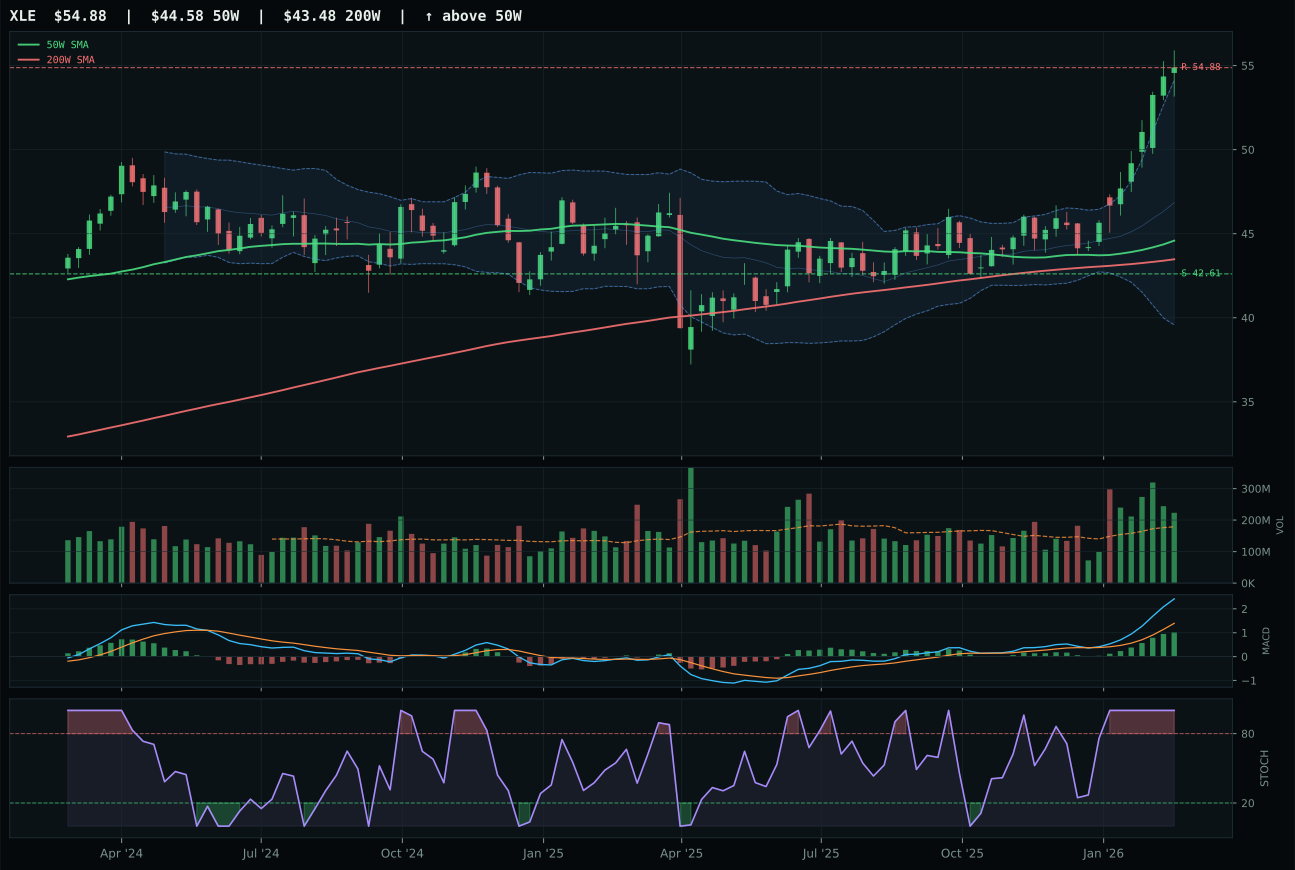
XLE has a vertical extension profile with 18.1% 13-week relative strength versus SPY.
A failed hold above support would weaken the setup.
Actionable but governed by invalidation levels.
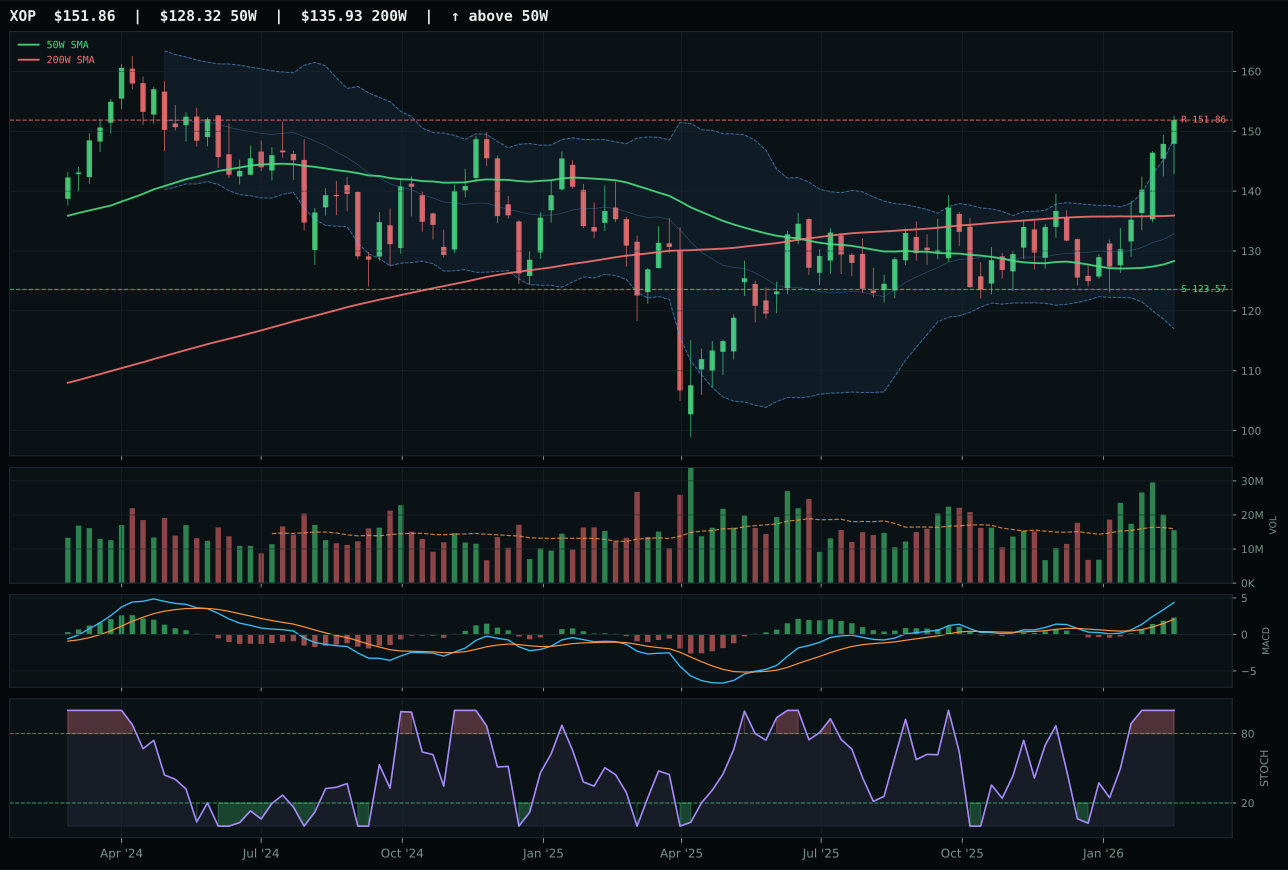
XOP has a vertical extension profile with 12.4% 13-week relative strength versus SPY.
A failed hold above support would weaken the setup.
Actionable but governed by invalidation levels.
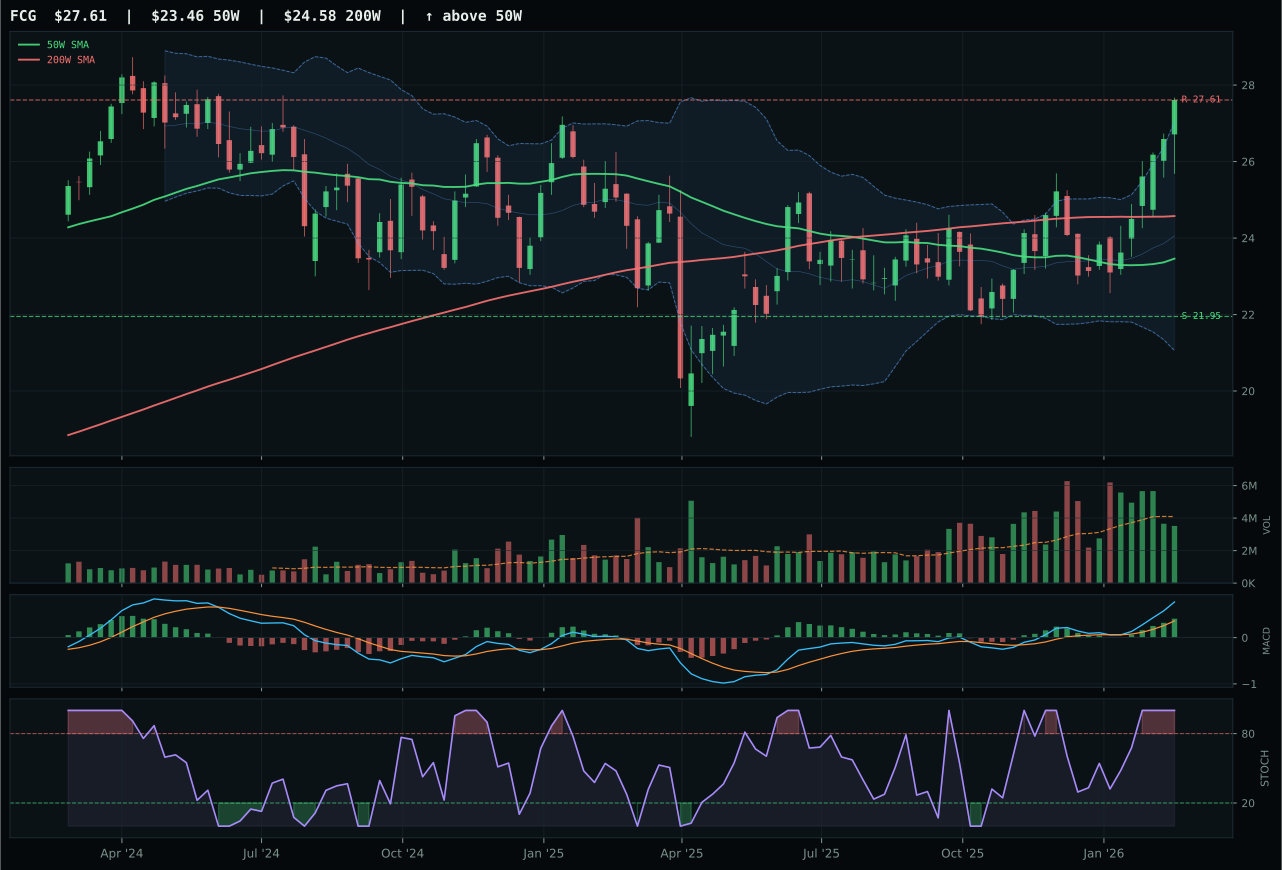
FCG has a vertical extension profile with 12.1% 13-week relative strength versus SPY.
A failed hold above support would weaken the setup.
Actionable but governed by invalidation levels.
XLE claimed the top-2 allocation with an 84.1 final score—the portfolio's highest—by delivering 22.7% 13-week returns with above-average volume participation at 1.25x the 20-week average, a rare combination of strength and sponsorship. Its 18.1% relative strength to SPY and 5.7% category-relative leadership beat XOP's 12.4% and 0.0% respectively, making the 1.4-point margin decisive. XLE's 84.6 structure score reflects cleaner compression (81.2) and higher cleanliness (83.3) than XOP's 75.5, while MACD bullish and improving with overbought stochastics at 1.00 signaled institutional accumulation rather than speculative frenzy. Volume confirmation at above-average participation proved XLE's move is being absorbed by real capital, not trapped in thin liquidity.
Traditional Energy earned 20% allocation because its 84.1 score is the portfolio's highest, and the macro fit of 86.0 reflects four active descriptors: energy scarcity at +16, inflation pressure at +10, supply shortage at +9, and real asset sponsorship at +7. These are not coincidental; they represent genuine supply constraints and pricing power that feed directly into XLE's cash-flow generation and dividend sustainability. XLE's 100.0 trend and momentum confirmation with above-average volume participation suggests the move is institutional, not speculative. The category ranks above agriculture (77.5) because energy scarcity is the more constrained asset class globally, and XLE's cleaner technical structure offers better entry than MOO's extended stochastic. This is a 20% commitment to supply-constrained real assets with structural inflation pricing power.
Agriculture & Livestock — MOO
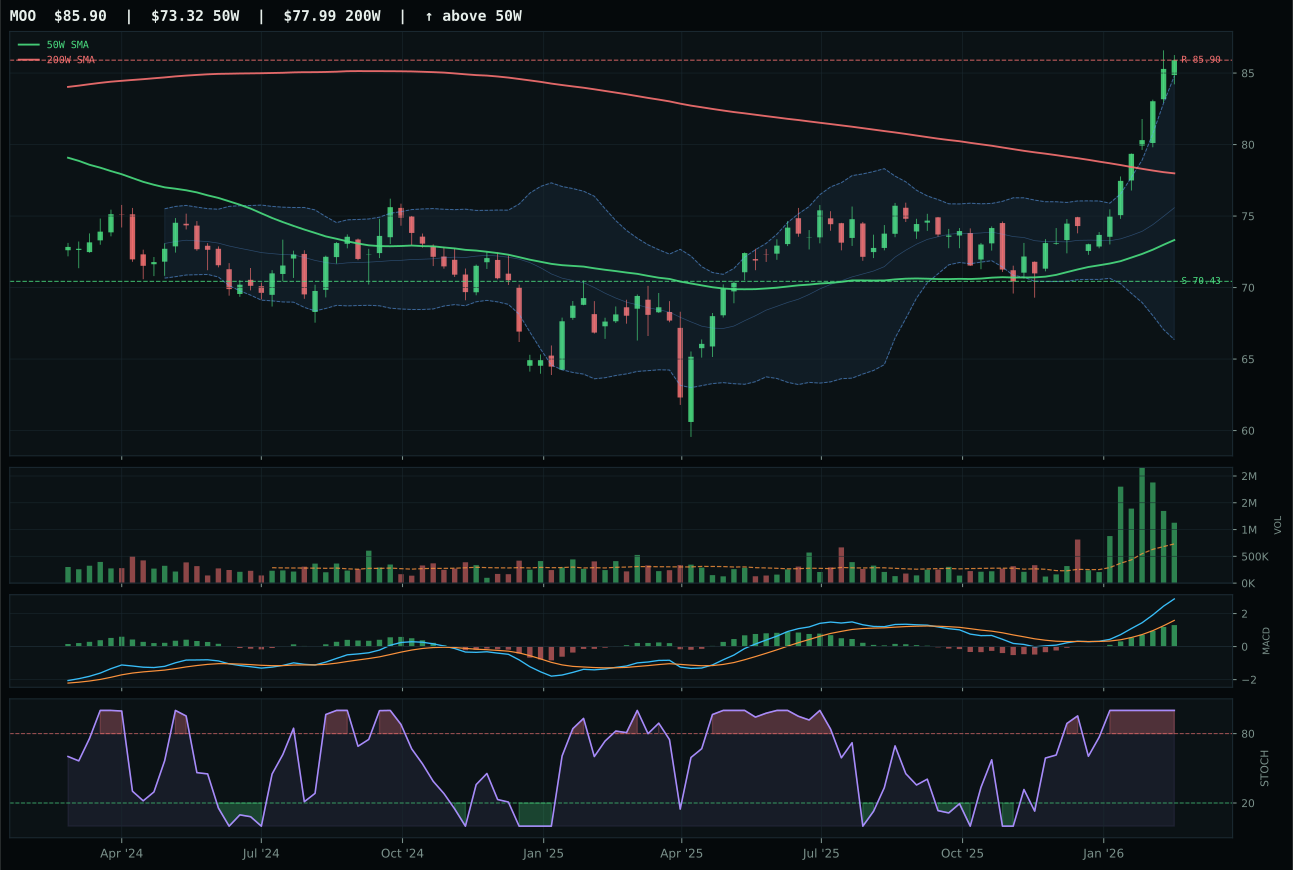
MOO has a vertical extension profile with 16.4% 13-week relative strength versus SPY.
A failed hold above support would weaken the setup.
Actionable but governed by invalidation levels.
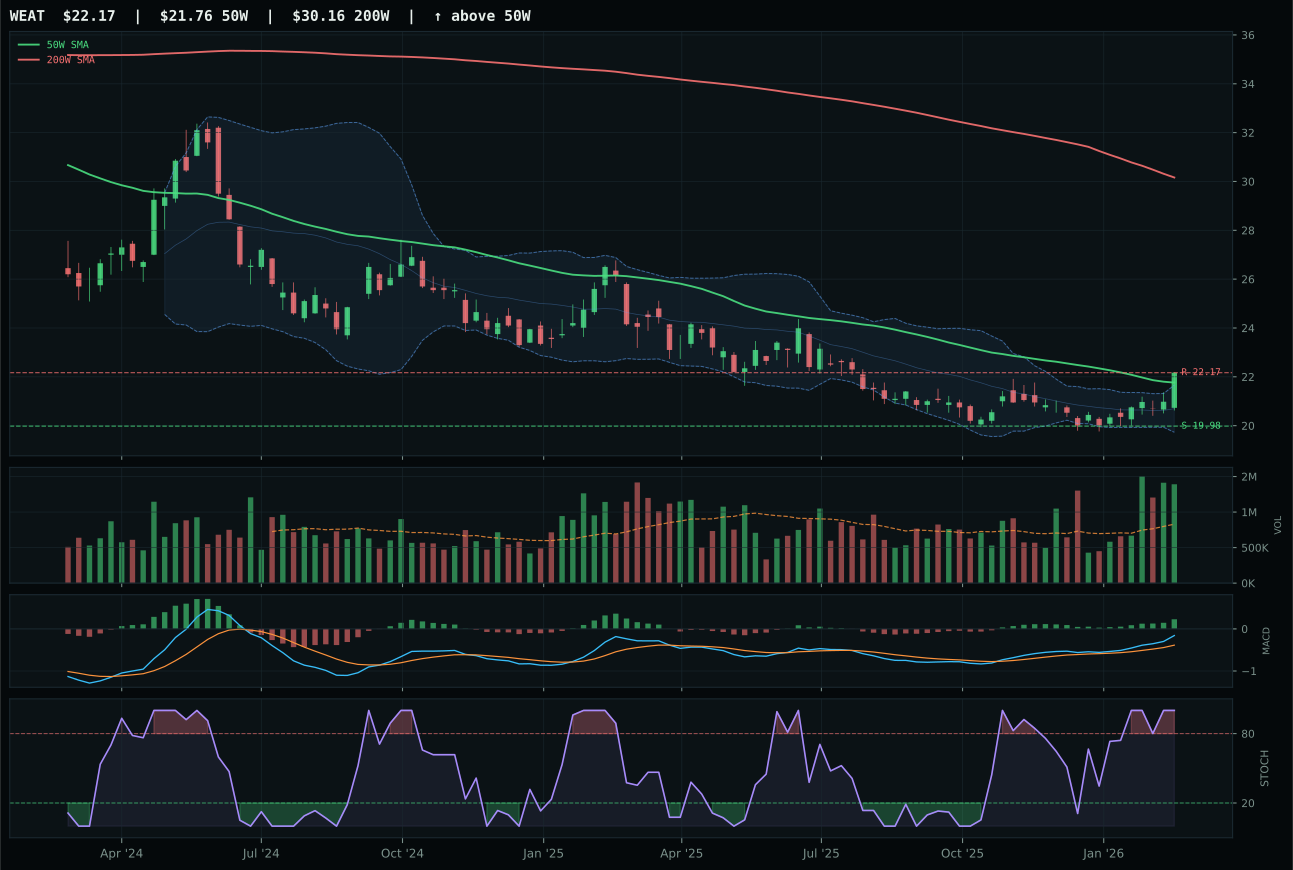
WEAT has a compression near 50W profile with 1.2% 13-week relative strength versus SPY.
A failed hold above support would weaken the setup.
Actionable but governed by invalidation levels.
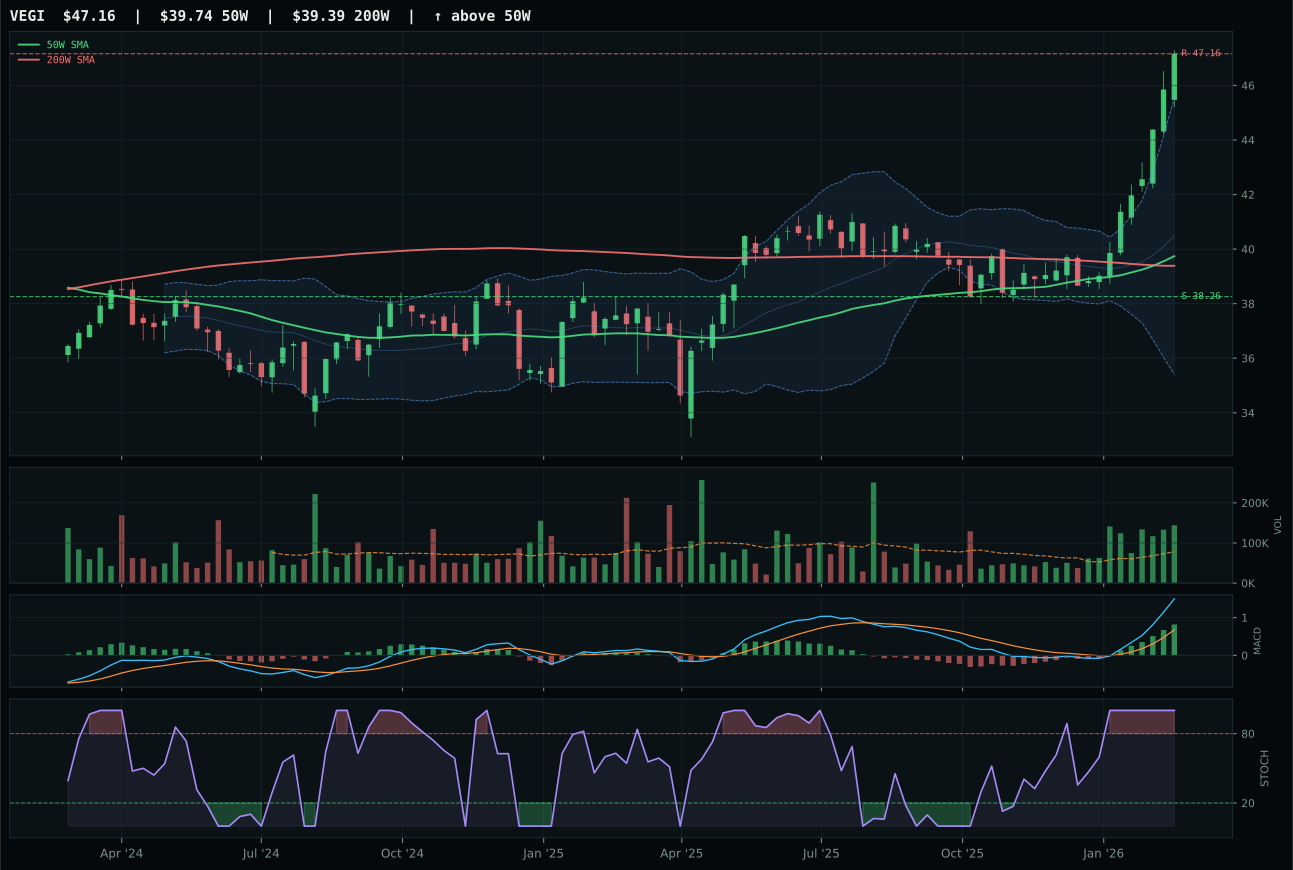
VEGI has a vertical extension profile with 16.6% 13-week relative strength versus SPY.
A failed hold above support would weaken the setup.
Tracked, but not top-2 eligible because: .
MOO dominated its category with the highest technical evidence score (97.2) and crushing volume confirmation at 1.54x its 20-week average—a true accumulation signal that WEAT lacked. Its 21.0% 13-week return and 16.4% relative strength to SPY, paired with MACD bullish and improving plus overbought stochastics, created a clean setup on the 89.4 structure score, the highest in its three-ETF basket. WEAT's compression near the 50-week line (timing score 100.0, structure 81.3) represents excellent technical discipline, yet its -15.2% category-relative strength and anemic 1.2% SPY-relative return meant buyers were elsewhere. The volume story sealed it: MOO's accumulation versus WEAT's matching confirmation failed to offset its weaker relative momentum profile.
Agriculture & Livestock earned 20% allocation—matching the top tier with energy—because it posted a final score of 77.5 and its macro fit of 86.0 is the portfolio's second-strongest after energy. Supply shortage is active at +13, inflation pressure at +10, and real asset sponsorship at +8, creating a convergence of three independent macro drivers. MOO's 100.0 trend and momentum confirmation with 1.54x volume participation demonstrates institutional accumulation behind the theme, not speculative reversal. The category's structural position—agricultural commodities facing genuine scarcity and demand elasticity—makes it a legitimate hedge alongside energy. This is not a crowded trade seeking upside; it is a supply-constrained asset class with macro tailwinds and technical proof of smart-money entry.
Emerging Markets — IEMG
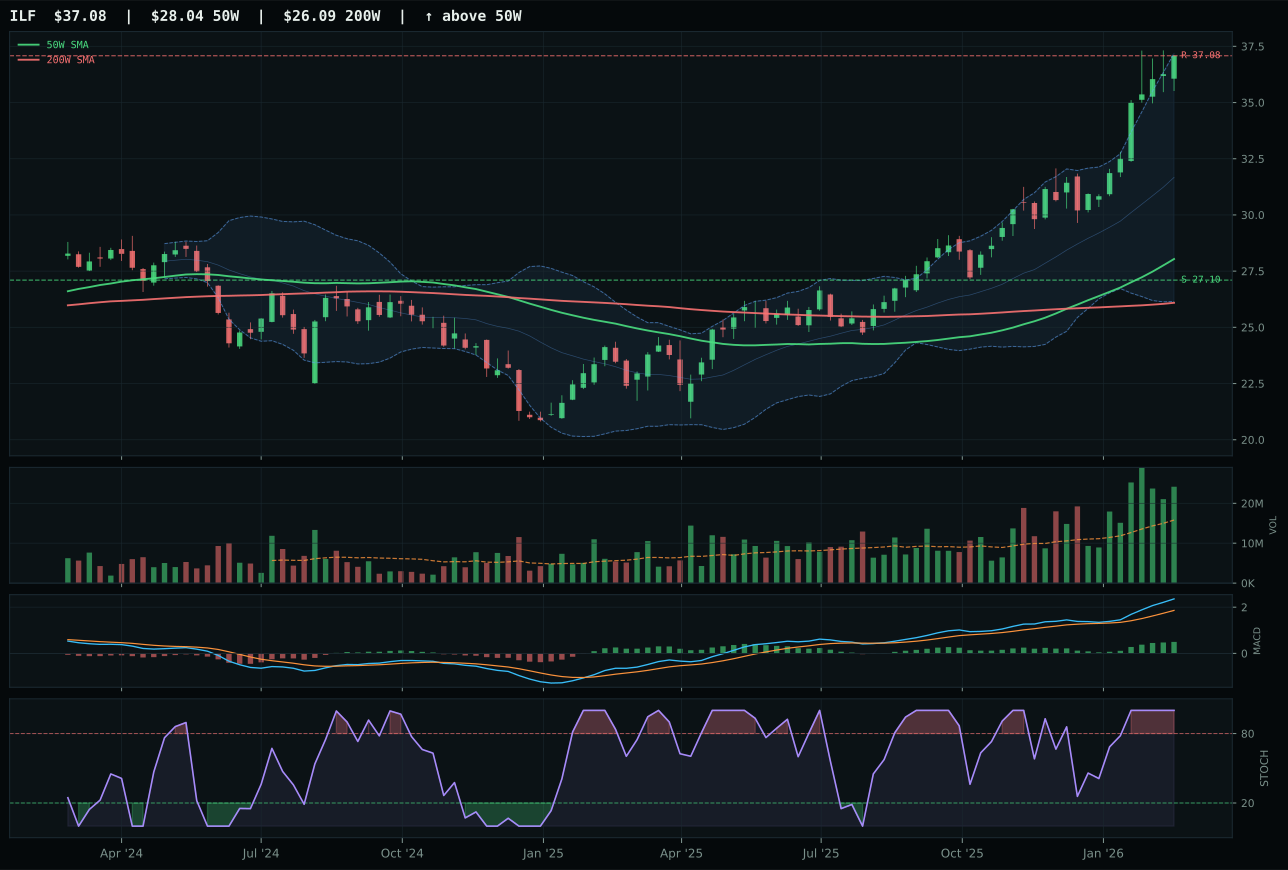
ILF has a vertical extension profile with 19.8% 13-week relative strength versus SPY.
A failed hold above support would weaken the setup.
Actionable but governed by invalidation levels.
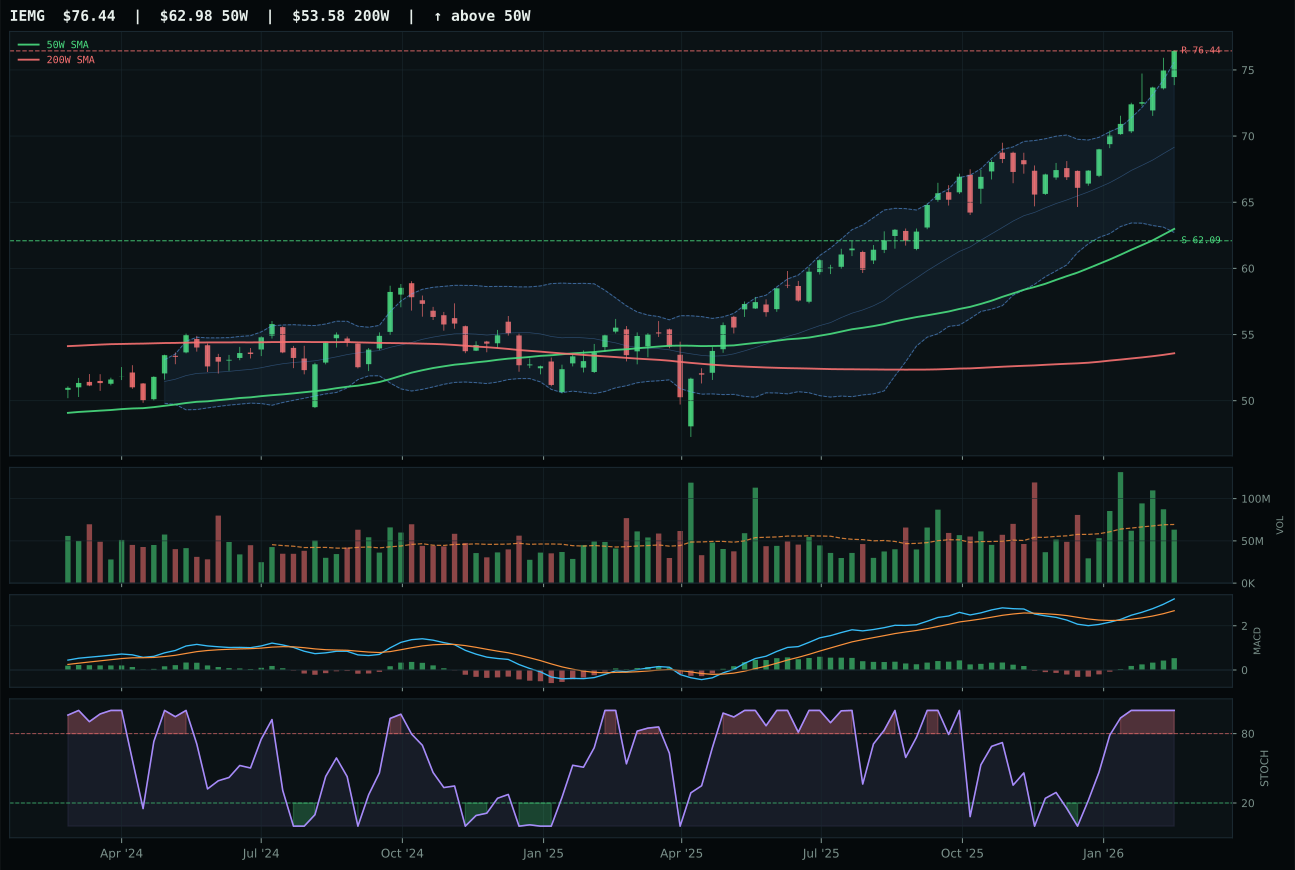
IEMG has a vertical extension profile with 11.9% 13-week relative strength versus SPY.
A failed hold above support would weaken the setup.
Actionable but governed by invalidation levels.
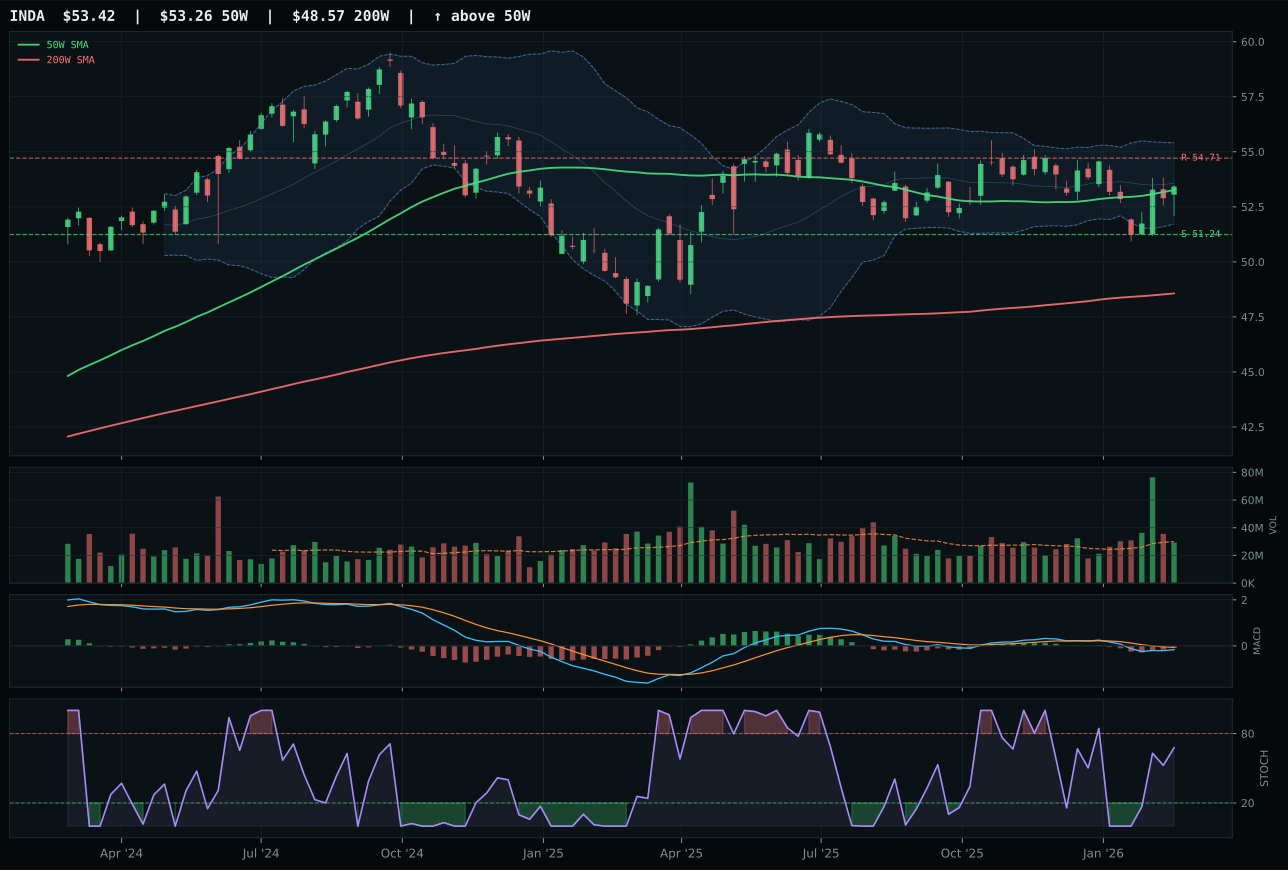
INDA has a pullback into support profile with -6.1% 13-week relative strength versus SPY.
A failed hold above support would weaken the setup.
Actionable but governed by invalidation levels.
IEMG won by discipline rather than dominance: its 72.9 technical evidence score and 21.4% extension above the 50-week line beat ILF's 94.4 technical evidence and 32.2% extension in the risk-management calculation. Both carry 100.0 trend and momentum scores with MACD bullish and improving, yet ILF's vertical extension and accumulation-confirmation volume represented a higher beta trade that the selector correctly penalized for entry risk. IEMG's 83.1 structure score (versus ILF's unavailable structure component) and neutral volume participation at 0.91x the 20-week average created a tighter technical wrap. Category-relative strength was balanced at 0.0% and 7.8% respectively, but IEMG's broad emerging-market beta exposure to liquidity flows beats ILF's concentrated Latin America commodity sensitivity when EM liquidity support is active.
Emerging Markets earned 10% with a 73.6 score because EM liquidity support is active at +14 and liquidity expansion at +8, creating a 70.0 macro fit that justifies allocation even as the category ranks below industrial metals and precious metals on composite scores. IEMG's 16.6% 13-week return with neutral relative strength to SPY (11.9%) and balanced category-relative strength (0.0%) signals stable institutional positioning rather than speculative fervor. The portfolio holds this at 10% as a carry-trade and liquidity-driven exposure that benefits from the active EM liquidity descriptor. Upgrading to 20% would require ILF to cool below 32 with IEMG holding its 69+ level, or for commodity breadth and metals scarcity descriptors to shift from real asset sponsorship to energy-driven scarcity—a regime change not yet visible in the active descriptor set.
Industrial Metals — COPX
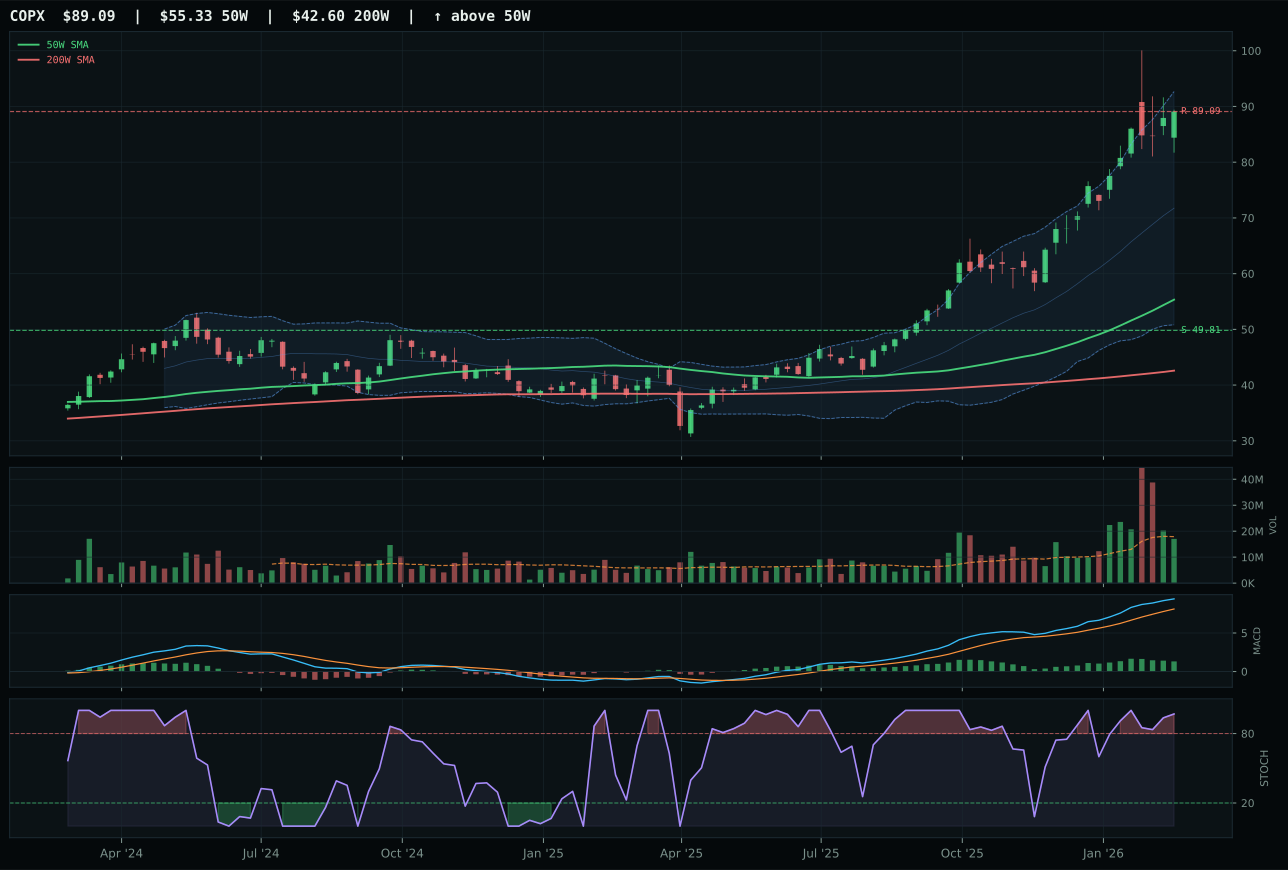
COPX has a vertical extension profile with 48.0% 13-week relative strength versus SPY.
A failed hold above support would weaken the setup.
Actionable but governed by invalidation levels.
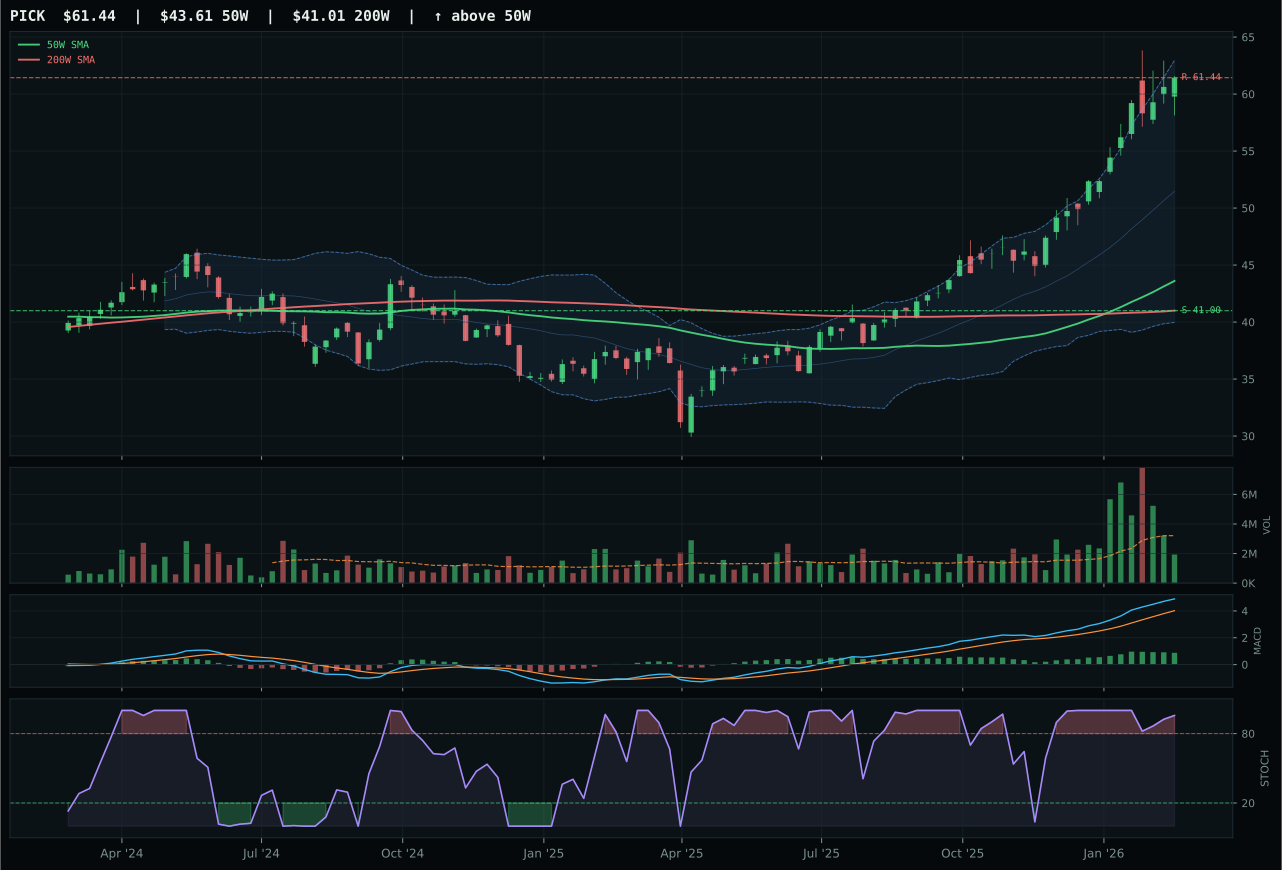
PICK has a vertical extension profile with 32.2% 13-week relative strength versus SPY.
A failed hold above support would weaken the setup.
Actionable but governed by invalidation levels.
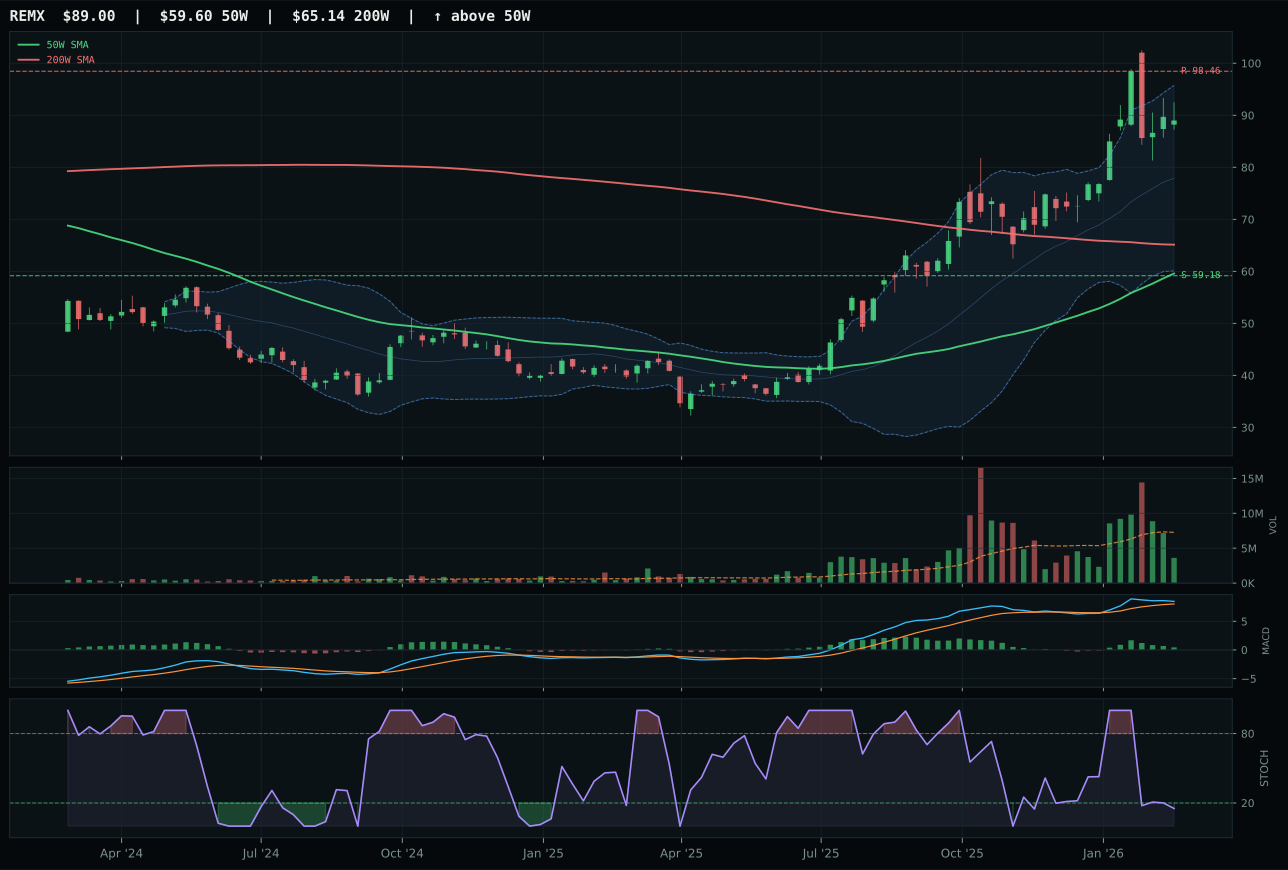
REMX has a vertical extension profile with 24.4% 13-week relative strength versus SPY.
A failed hold above support would weaken the setup.
Actionable but governed by invalidation levels.
COPX's 52.6% 13-week return and 48.0% relative strength to SPY created an overwhelming momentum case against PICK's 36.8% and 32.2% respectively, despite COPX sitting 61.0% extended above the 50-week line versus PICK's 36.3% stretch. COPX's 100.0 persistence and 83.9 volume-price confirmation—neutral 0.95x participation that neither rejects nor forces the move—outweighed PICK's thin participation despite PICK's superior risk-reward metrics (40 versus 47 on upside risk). Timing fell to COPX at 40.0 versus PICK's 32.0, a function of distance penalty offset by MACD and stochastic positioning. The 1.2-point margin is tight, signaling both names are viable, but COPX's category-relative strength at 15.8% versus PICK's 0.0% confirmed buyer preference.
Industrial Metals earned 10% with a 72.4 score because metals scarcity is active at +14 and commodity breadth positive at +10, anchoring a 73.0 macro fit that justifies allocation despite the category ranking below XLE and MOO. COPX's 52.6% 13-week return is real accumulation, not mean-reversion, supported by neutral volume and persistent MACD. Real asset sponsorship at +6 compounds the case. The limiting factor is positioning: 61.0% extension above the 50-week line creates asymmetric downside risk to the 49.81 support, a 78.9% drop that dominates reward potential. This category merits holding at 10% as a scarcity hedge but will not reach 20% until either COPX corrects 20-30% with MACD holding above zero, or industrial demand signals deteriorate sharply enough to flip the commodity breadth descriptor.
AI — BOTZ
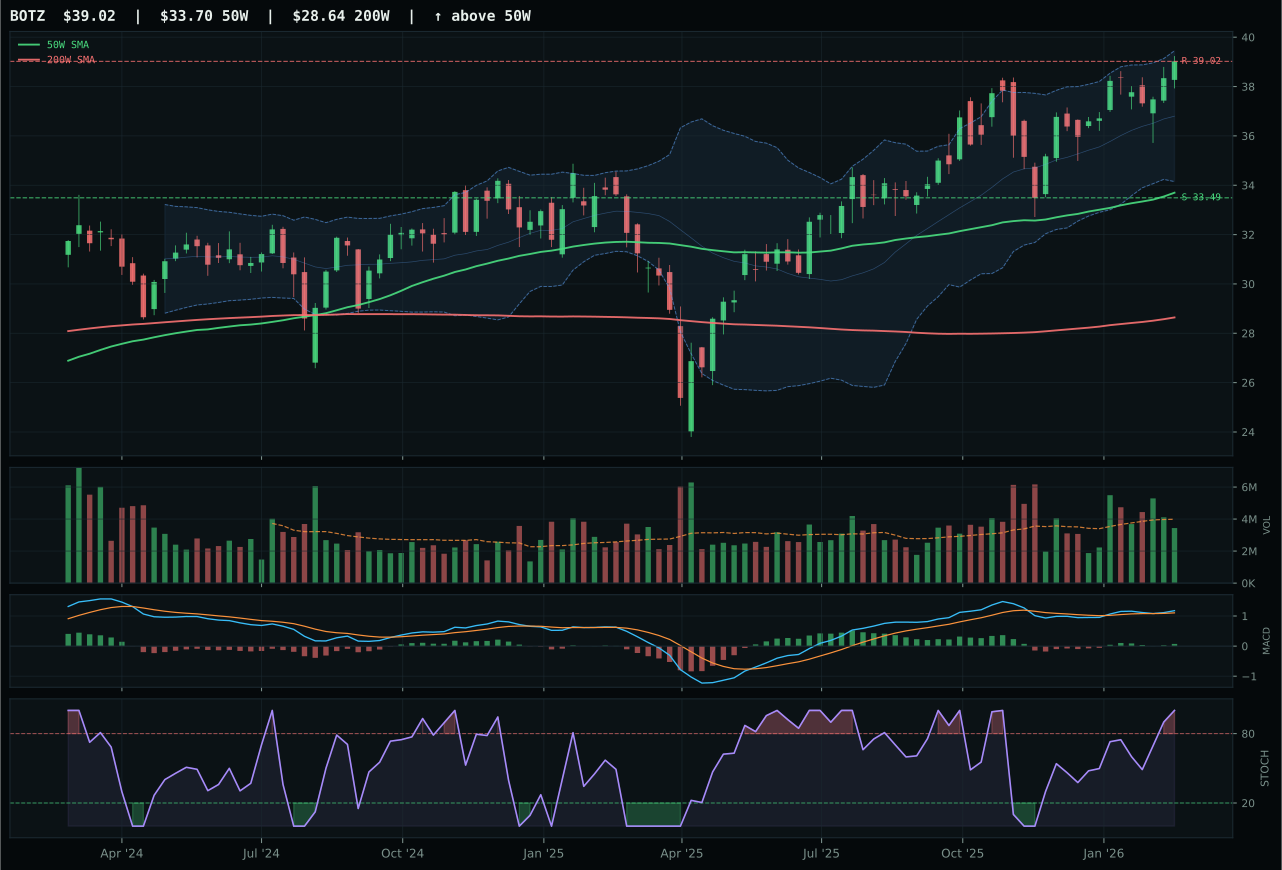
BOTZ has a vertical extension profile with 11.9% 13-week relative strength versus SPY.
A failed hold above support would weaken the setup.
Actionable but governed by invalidation levels.
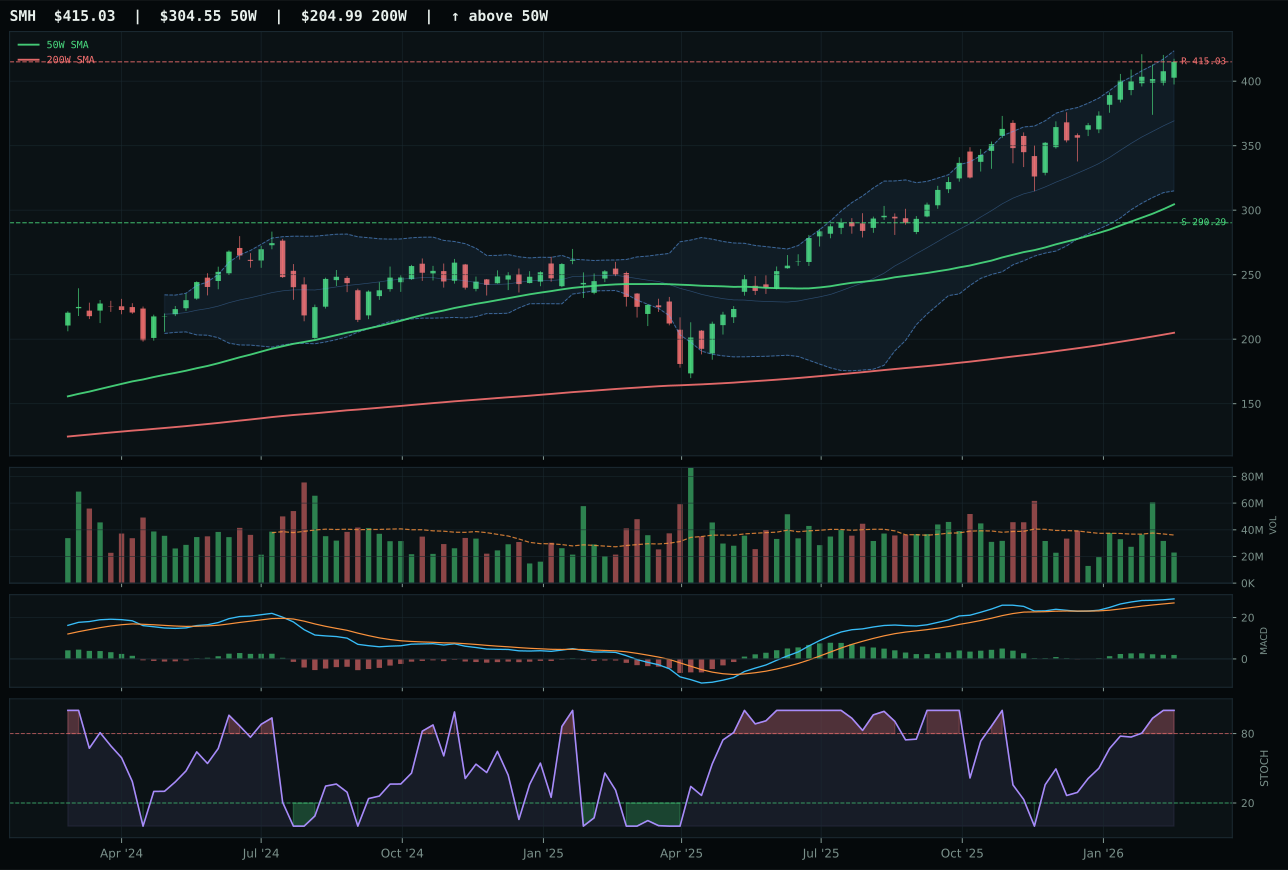
SMH has a vertical extension profile with 22.6% 13-week relative strength versus SPY.
A failed hold above support would weaken the setup.
Actionable but governed by invalidation levels.
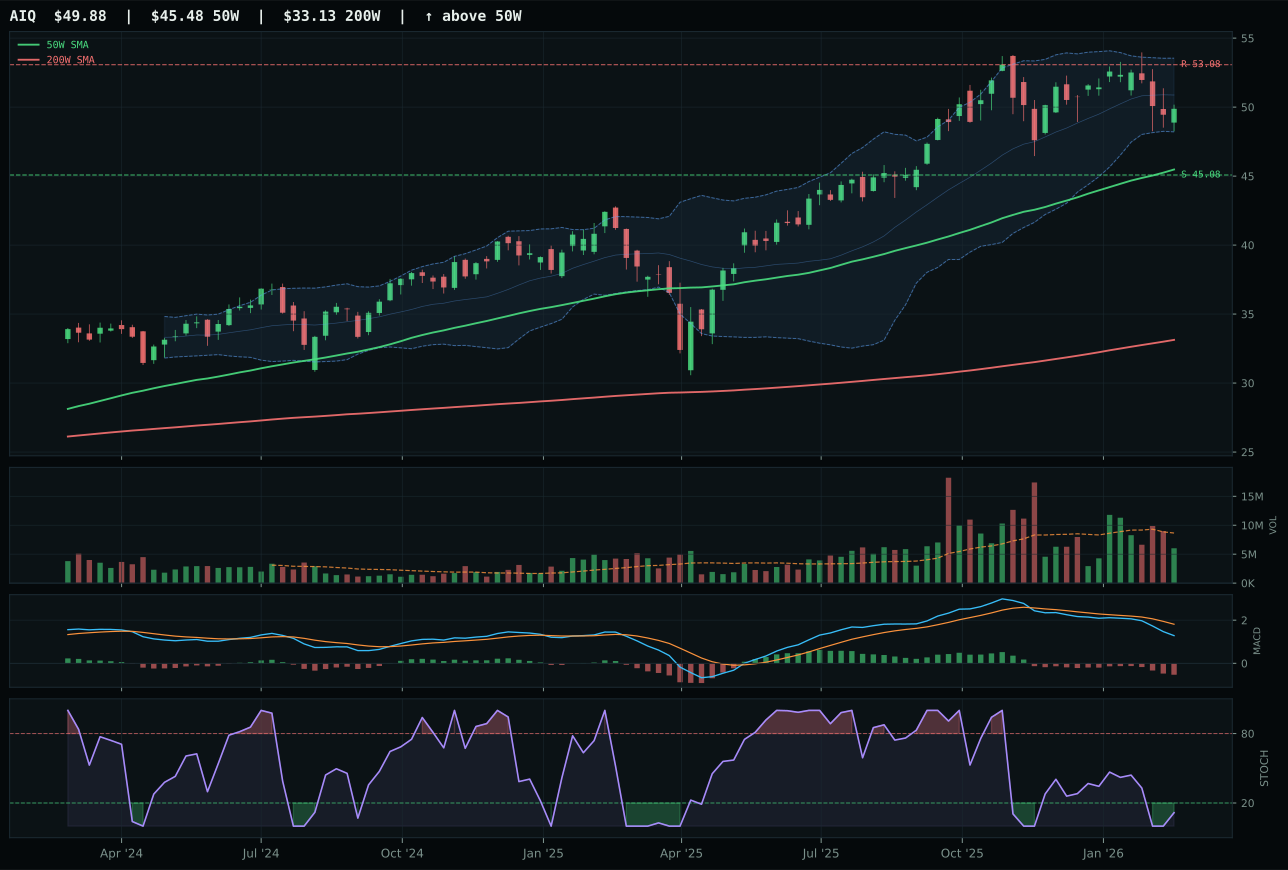
AIQ has a neutral structure profile with 0.2% 13-week relative strength versus SPY.
A failed hold above support would weaken the setup.
Actionable but governed by invalidation levels.
BOTZ edged SMH despite trailing on raw 13-week momentum (16.5% versus 27.3%) because its 15.8% extension above the 50-week line presents marginally better risk geometry than SMH's 36.3% stretch. Both trade at overbought momentum with bullish-but-flattening MACD, but BOTZ's 77.0 structure score and neutral volume participation beat SMH's 75.7 structure and thin volume squeeze. The category-relative strength calculation favored BOTZ at 0.0% versus SMH's positive 10.7%, penalizing SMH for its outsized outperformance and flagging sustainability concerns. SMH's macro fit of 74.0 actually exceeds BOTZ's 55.0, driven by direct AI compute sponsorship, yet the technical evidence weighting (62% versus 38% macro) pulled BOTZ ahead when timing and risk-reward mattered most.
AI scored 67.5 and landed in the 10% tier because two higher-ranking categories occupied the top-2 slots, not because the setup itself is weak. The macro fit of 76.0 is among the portfolio's strongest, with AI growth sponsorship at +14 and liquidity expansion at +10 actively supporting both BOTZ and SMH. The tension here is real: both candidates are extended, both show overbought stochastics, and both face upside resistance with zero room to the top. The category merits holding at 10% because the structural macro case for AI demand remains intact even as entry risk has compressed, but upgrading to 20% would require a pullback to the 50-week moving average with maintained MACD bullishness—a setup that has yet to develop.
Precious Metals — GLD
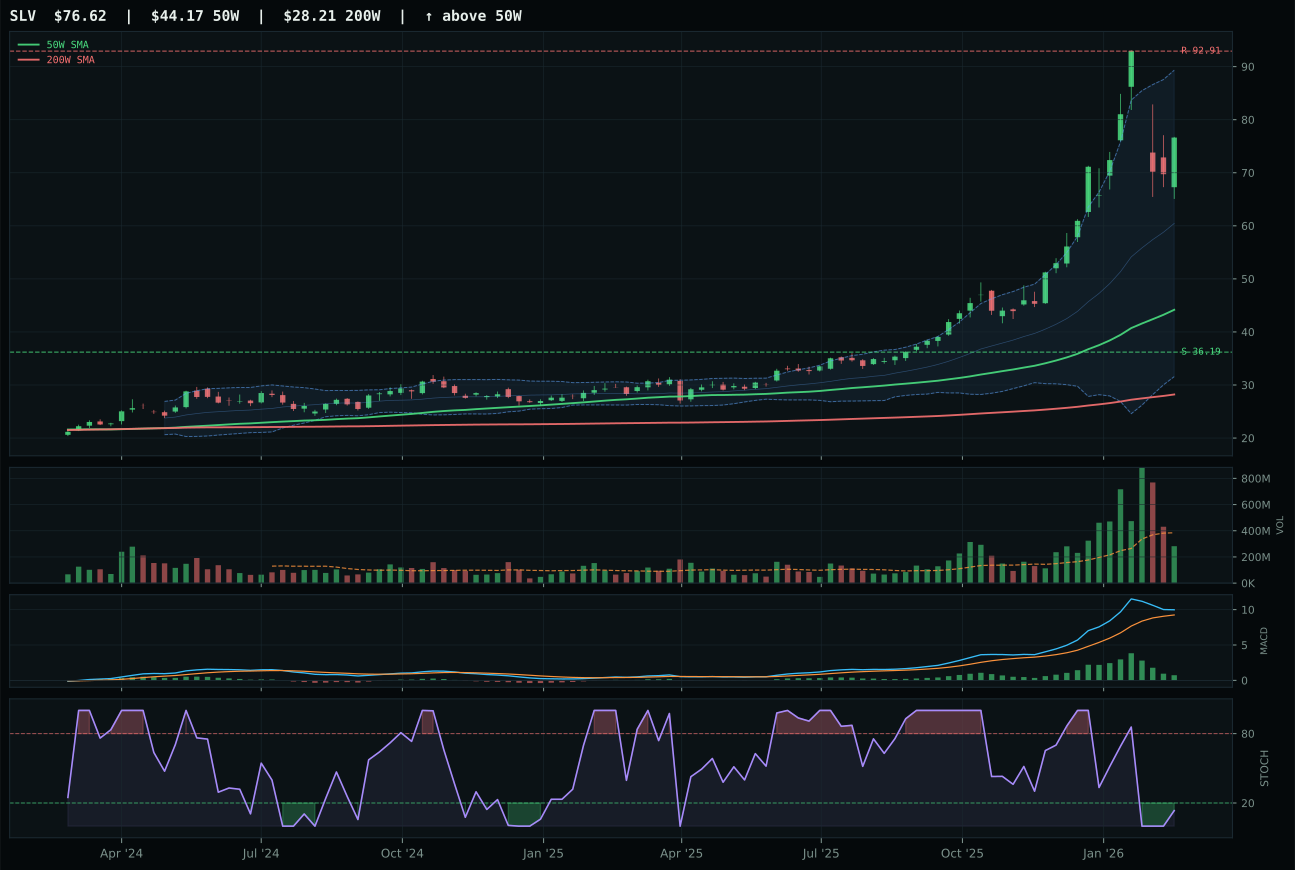
SLV has a vertical extension profile with 64.5% 13-week relative strength versus SPY.
A failed hold above support would weaken the setup.
Actionable but governed by invalidation levels.
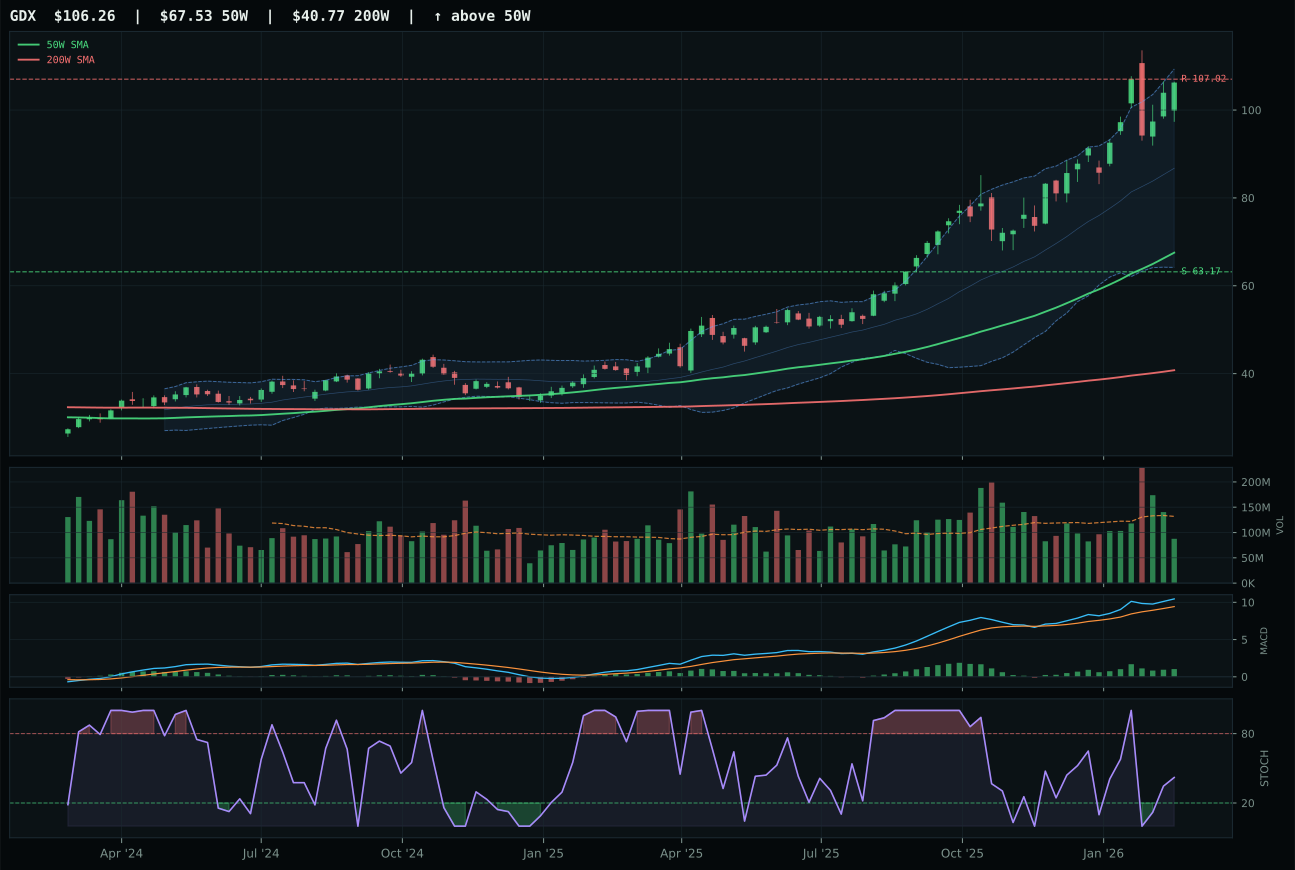
GDX has a vertical extension profile with 39.7% 13-week relative strength versus SPY.
A failed hold above support would weaken the setup.
Actionable but governed by invalidation levels.
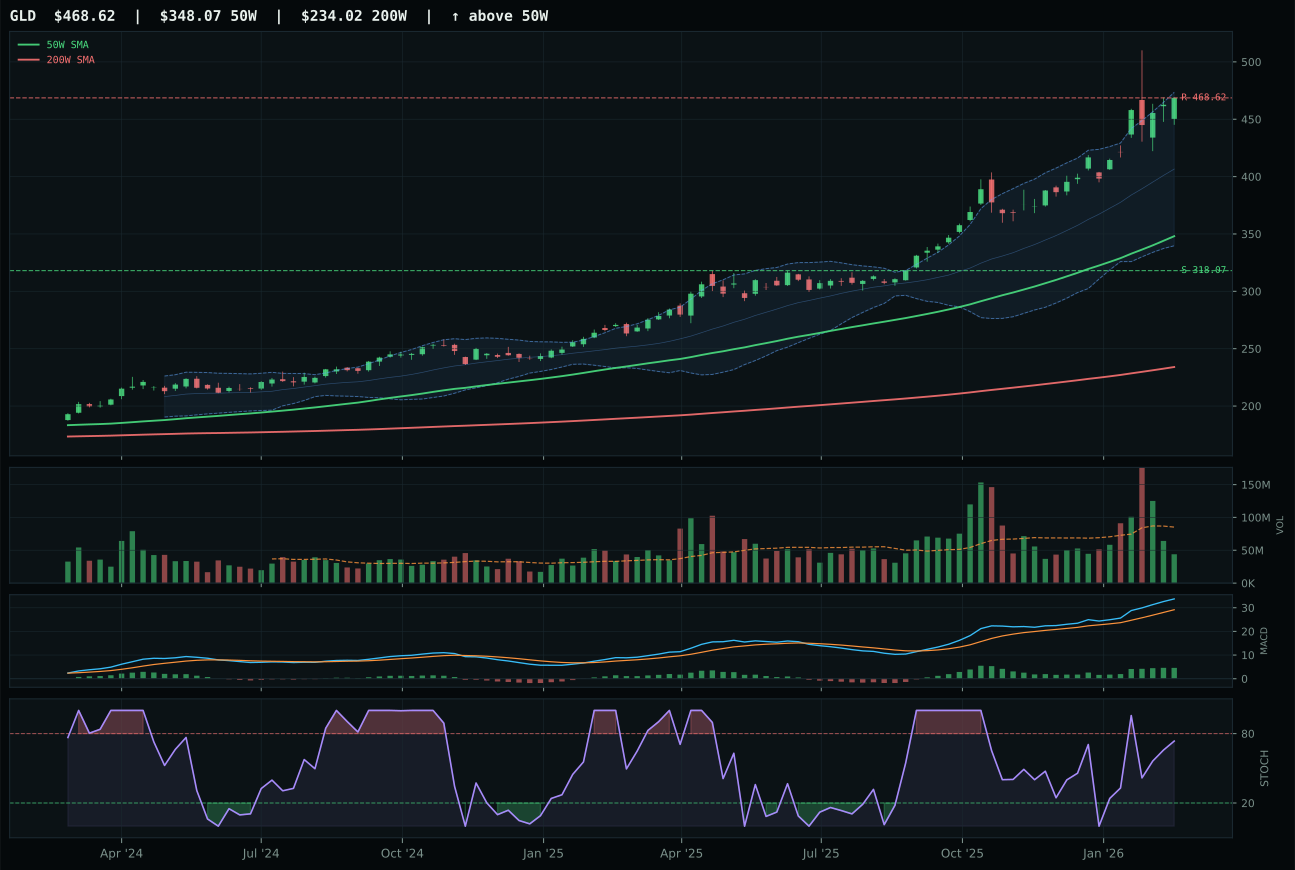
GLD has a vertical extension profile with 20.6% 13-week relative strength versus SPY.
A failed hold above support would weaken the setup.
Actionable but governed by invalidation levels.
GLD prevailed despite a 71.8-to-63.3 reasoned ranking against SLV because the category representative system selects the winner based on composite technical evidence, not the proof-order ranking. GLD's 65.2 technical evidence score benefited from MACD bullish and improving (versus SLV's bullish but flattening), a rising stochastic mid-zone at 0.74 (versus oversold turn-up), and cleaner structure at 76.2 versus SLV's 63.6. SLV's 64.5% relative strength to SPY represents extended positioning that penalizes entry despite its macro appeal; GLD's 20.6% SPY-relative return offers better risk-adjusted exposure. SLV's 73.2% extension above the 50-week line versus GLD's 34.6% created a 39-point gap in timing scores (61.0 versus undefined for SLV), the deciding technical factor.
Precious Metals scored 67.3 and claimed 10% because the monetary hedge bid is active at +14, offsetting the negative -4 from positive risk appetite. The macro fit of 58.0 ranks below the top tier, yet GLD's 25.2% 13-week return and MACD improvement signal actual accumulation beyond sentiment. The category's tension is stark: SLV offers higher directional leverage to inflation and industrial demand (69.0 macro fit, 64.5% SPY-relative strength) but sits extended and fatigued on technicals. GLD's conservative positioning and steady improvement merit 10% as a portable hedge against inflation and credit stress rather than a commodity speculation. Upgrading to 20% would require either SLV to reset below its 36.19 support with GLD maintaining strength, or a new credit stress signal in the active descriptor set.
Nuclear Energy — NLR
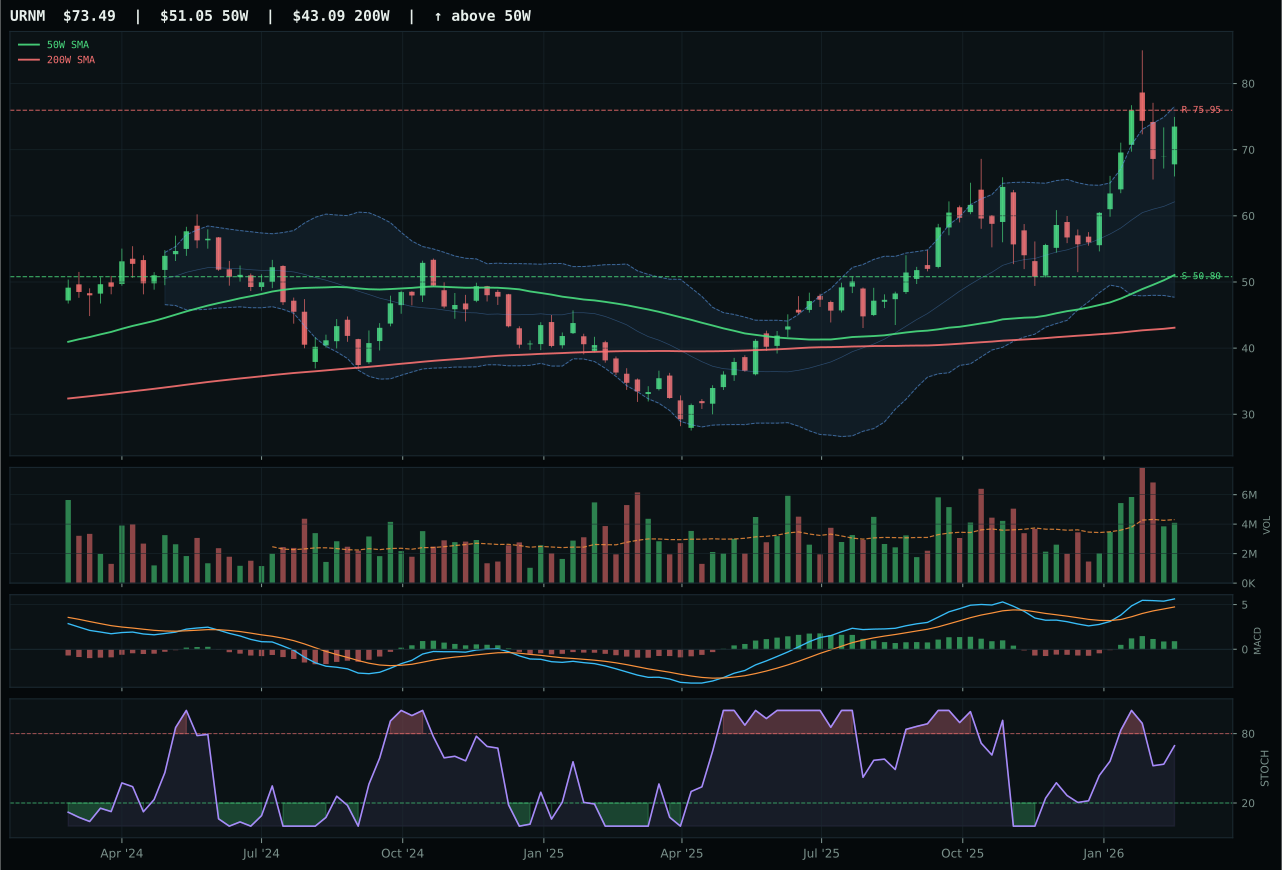
URNM has a vertical extension profile with 40.1% 13-week relative strength versus SPY.
A failed hold above support would weaken the setup.
Actionable but governed by invalidation levels.
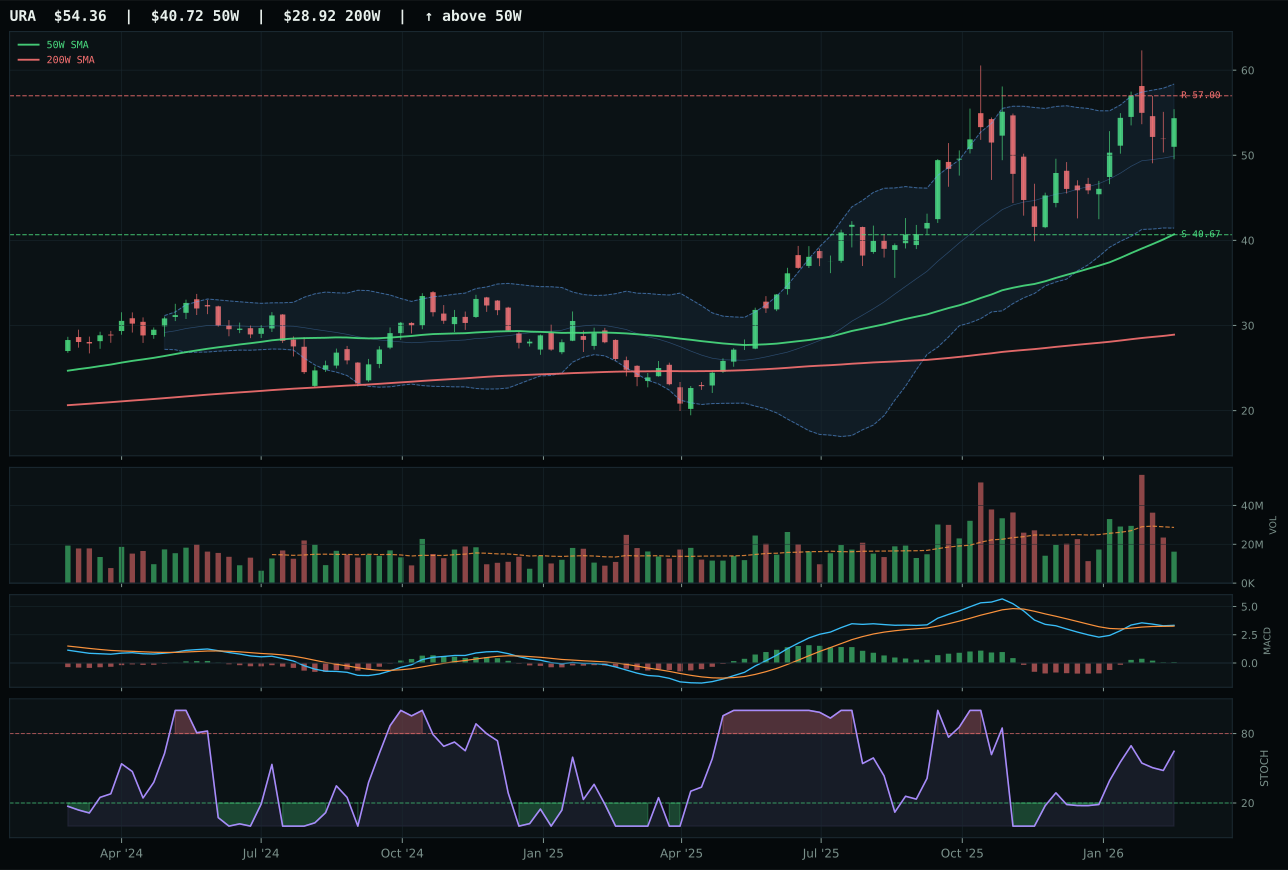
URA has a vertical extension profile with 26.1% 13-week relative strength versus SPY.
A failed hold above support would weaken the setup.
Actionable but governed by invalidation levels.
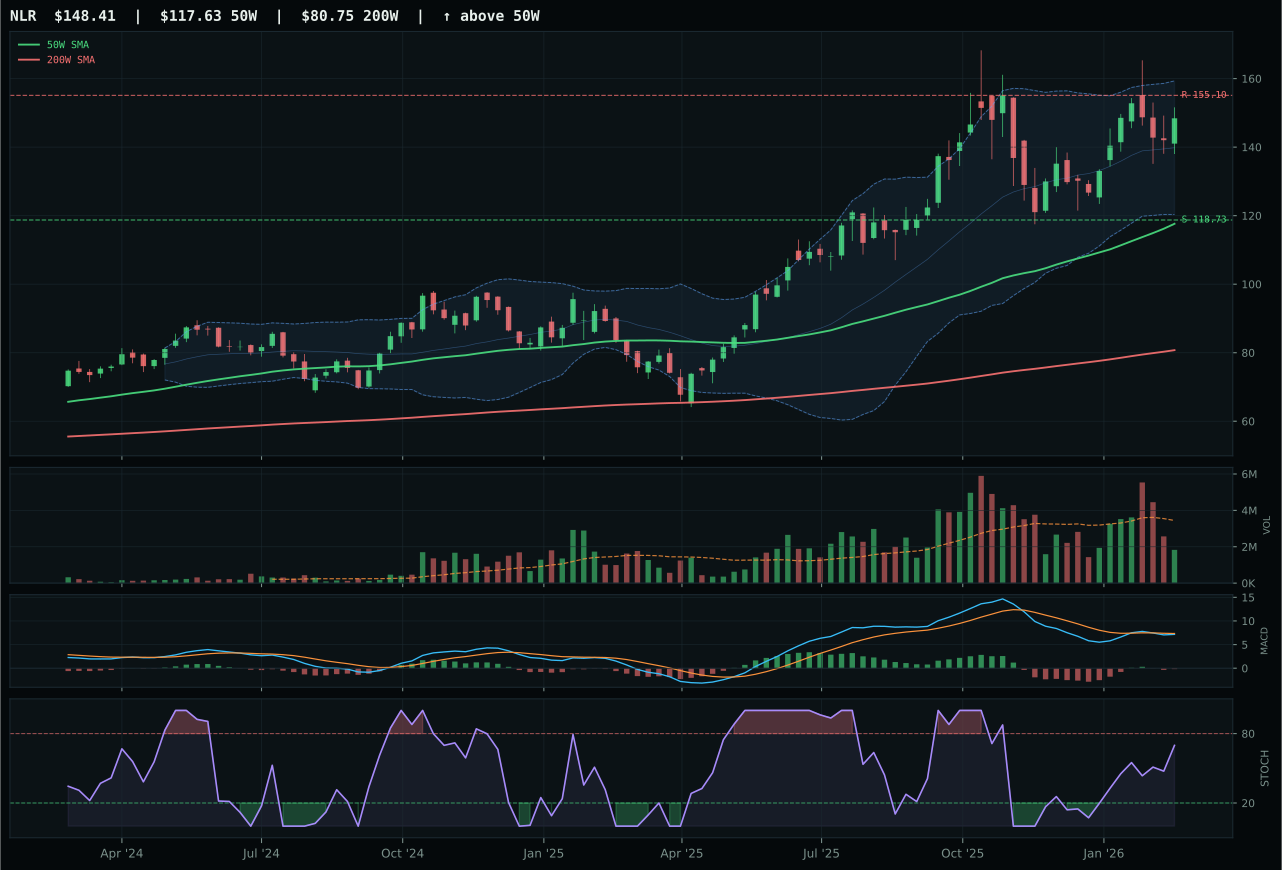
NLR has a vertical extension profile with 18.0% 13-week relative strength versus SPY.
A failed hold above support would weaken the setup.
Actionable but governed by invalidation levels.
NLR won despite carrying the weakest technical evidence score (34.3) in the category because URNM's 73.6 technical evidence and superior macro fit (69.0) were penalized by extended positioning at 43.9% above the 50-week line and falling stochastic RSI—a sign of momentum divergence. NLR's 22.6% 13-week return at only 26.2% extension offers better entry-point geometry, and its rising stochastic mid-zone at 0.70 (versus URNM's falling/neutral) signals fresher momentum even with bearish-weakening MACD. The category-relative strength penalty of -8.1% for NLR versus URNM's +14.0% hurts, but NLR's steadier utility positioning with thin volume participation reflects accumulation by patient capital rather than speculative inflows. URNM's uranium-miner scarcity beta is tactically superior but operationally exhausted on the weekly chart.
Nuclear Energy earned 10% because energy scarcity is active at +9 and real asset sponsorship at +7, supporting the category despite NLR's 67.1 score ranking below industrial metals, precious metals, and emerging markets. The tension is critical: URNM's macro fit (69.0) and technical evidence (73.6) should dominate NLR, yet the proof-order ranking and representative selection chose NLR's prudent structure over URNM's exhausted extension. This signals the category is held as a defensive energy play—nuclear utilities for steady income—rather than a uranium speculation. The portfolio's exposure will not expand to 20% unless either NLR reclaims positive category-relative strength and MACD bullishness, or URNM resets below 50 with the stochastic rising. Current setup favors holding at 10% as a conviction bet that energy scarcity outlasts near-term momentum fatigue.
Utilities & Infrastructure — XLU
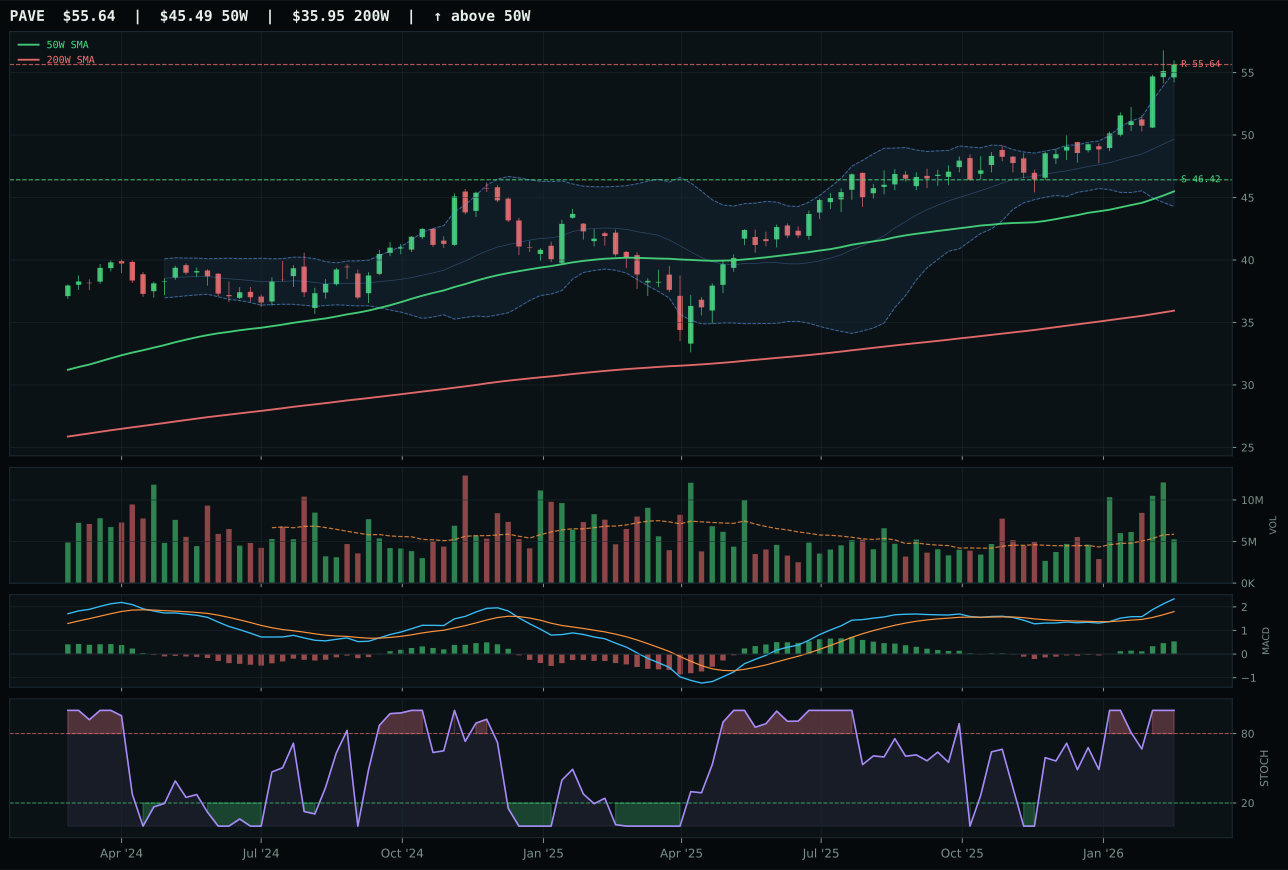
PAVE has a vertical extension profile with 15.2% 13-week relative strength versus SPY.
A failed hold above support would weaken the setup.
Actionable but governed by invalidation levels.
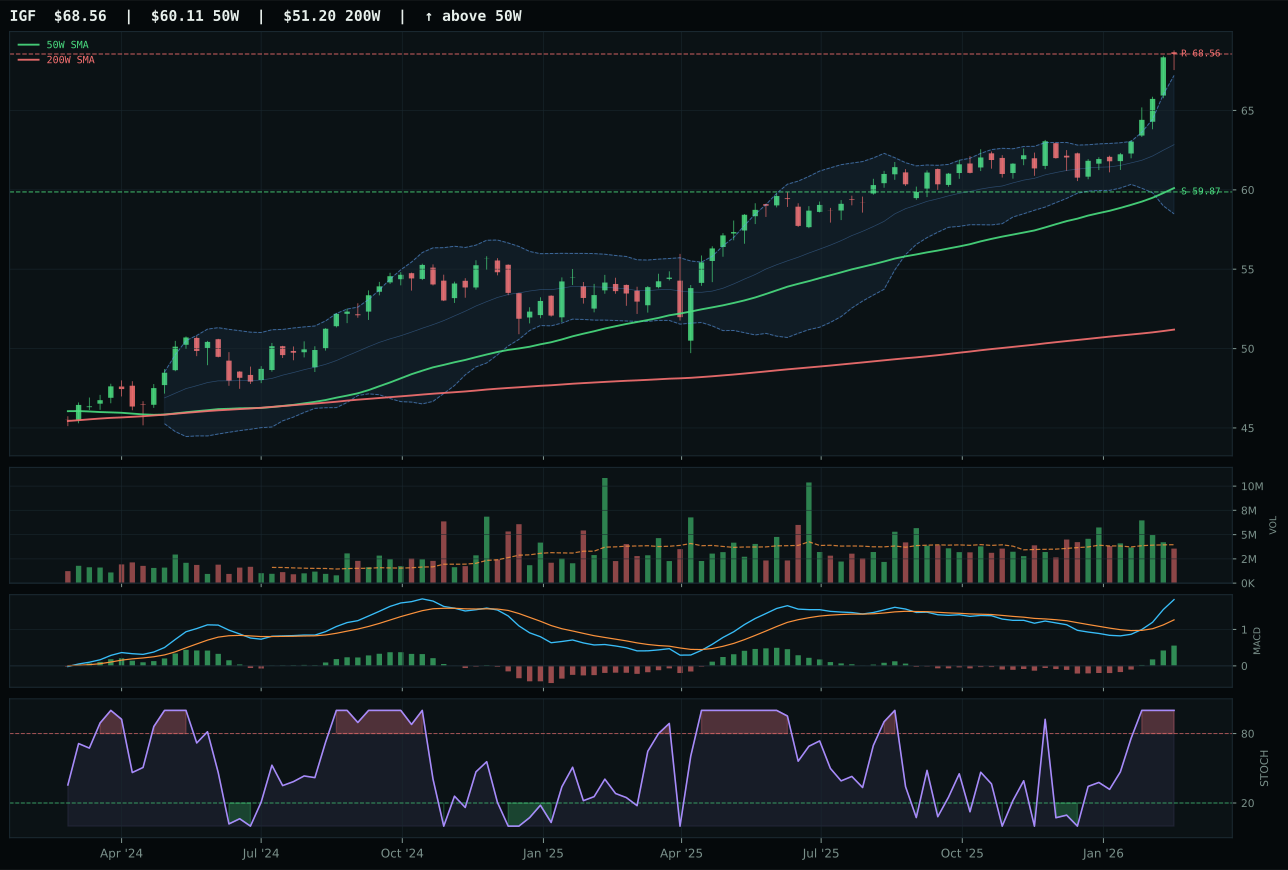
IGF has a neutral structure profile with 7.1% 13-week relative strength versus SPY.
A failed hold above support would weaken the setup.
Actionable but governed by invalidation levels.
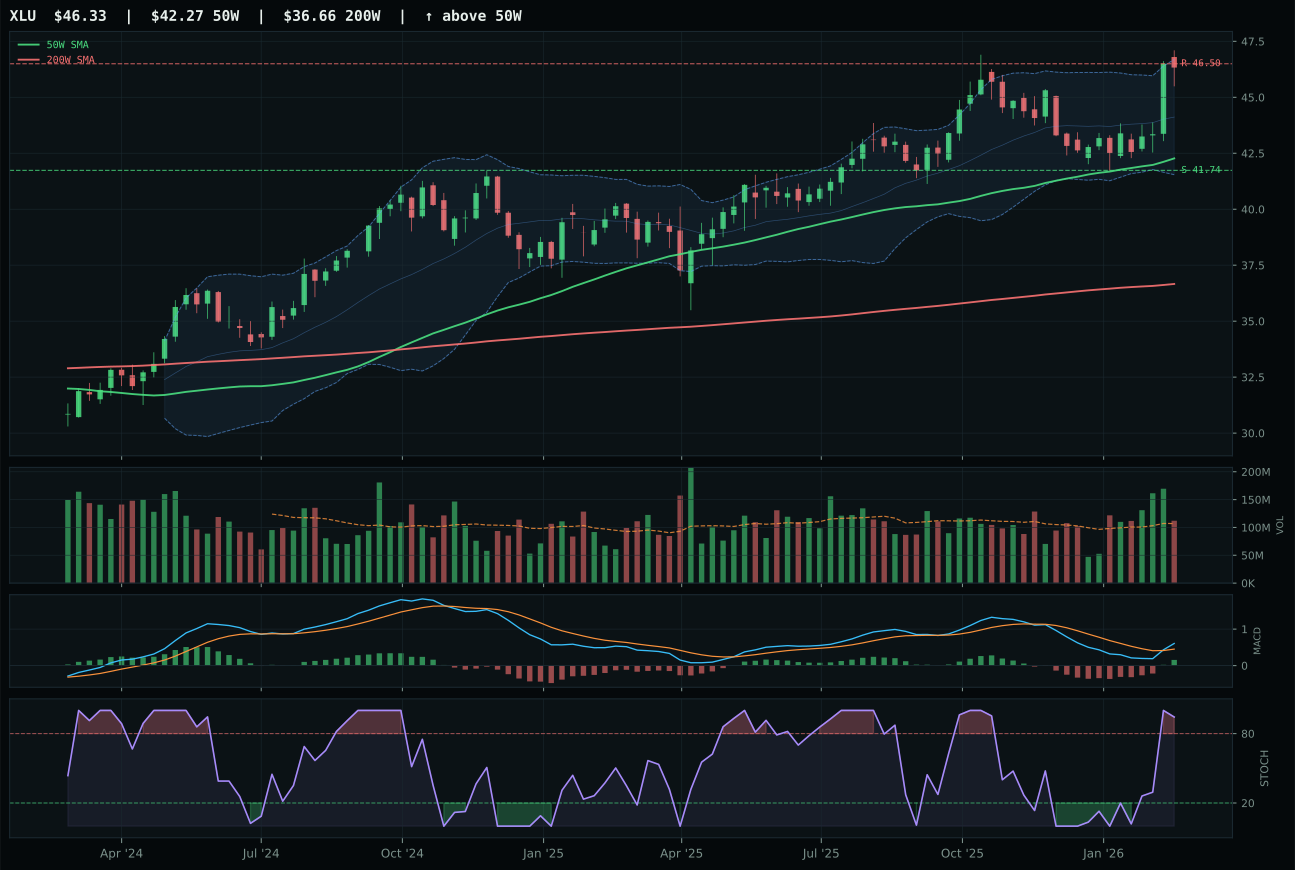
XLU has a neutral structure profile with 0.5% 13-week relative strength versus SPY.
A failed hold above support would weaken the setup.
Actionable but governed by invalidation levels.
XLU defeated PAVE despite inferior momentum (5.1% versus 19.8% 13-week return) because its 75.0 timing score, driven by 9.6% distance above the 50-week line and rising stochastic momentum, created better entry geometry than PAVE's 37.0 timing score at a 22.3% extension. Both carry 100.0 trend scores and bullish-improving MACD, but XLU's neutral structure at 72.6 versus PAVE's vertical extension at (calculated as superior timing value) proved decisive when the category's macro fit is weak. XLU's 0.5% relative strength to SPY and -6.6% category-relative strength are liabilities, yet they signal the position is unloved and uncrowned—precisely the character needed when inflation pressure is active at -6. PAVE's infrastructure capex beta is strategically sounder, but XLU's utility-regulated model offers superior downside protection in a transition regime.
Utilities & Infrastructure earned 10% as a defensively positioned hedge despite a weak 61.1 score and 46.0 macro fit, because XLU's 100.0 trend and 75.0 timing score place it among the portfolio's safest entries from a technical perspective. Inflation pressure is active at -6, which penalizes growth-oriented infrastructure, but XLU's regulated utility model with 5.1% 13-week returns and neutral momentum profile offers stability that the portfolio needs when commodity and energy allocations approach 40%. The category will not expand to 20% unless infrastructure capex flows accelerate sharply (pushing PAVE ahead) or inflation descriptors reverse—neither appears probable in the near term. Current allocation acknowledges XLU as ballast rather than conviction, a technical entry point for defensive capital awaiting better opportunities in the growth-oriented tiers.
Defense & Aerospace — ITA
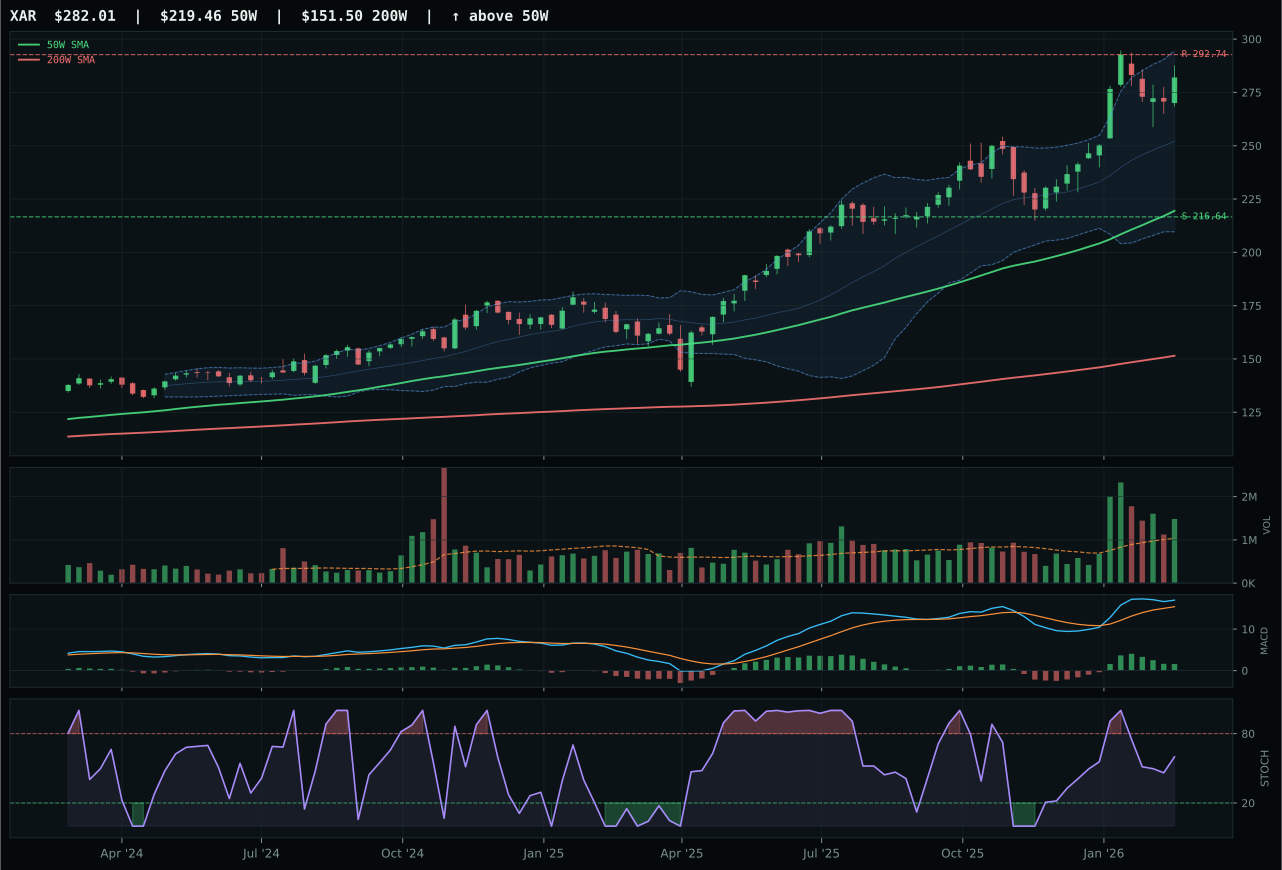
XAR has a vertical extension profile with 23.5% 13-week relative strength versus SPY.
A failed hold above support would weaken the setup.
Actionable but governed by invalidation levels.
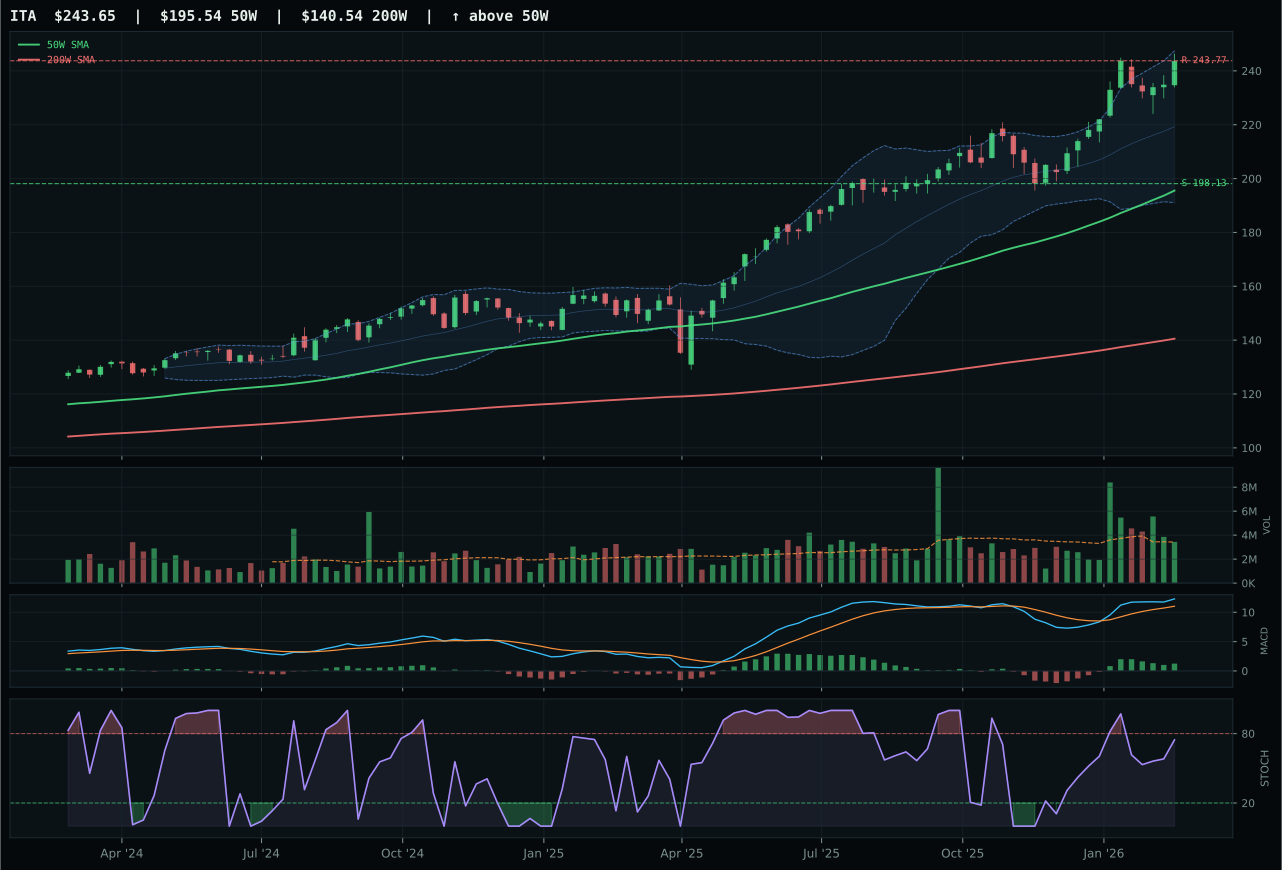
ITA has a vertical extension profile with 18.3% 13-week relative strength versus SPY.
A failed hold above support would weaken the setup.
Actionable but governed by invalidation levels.
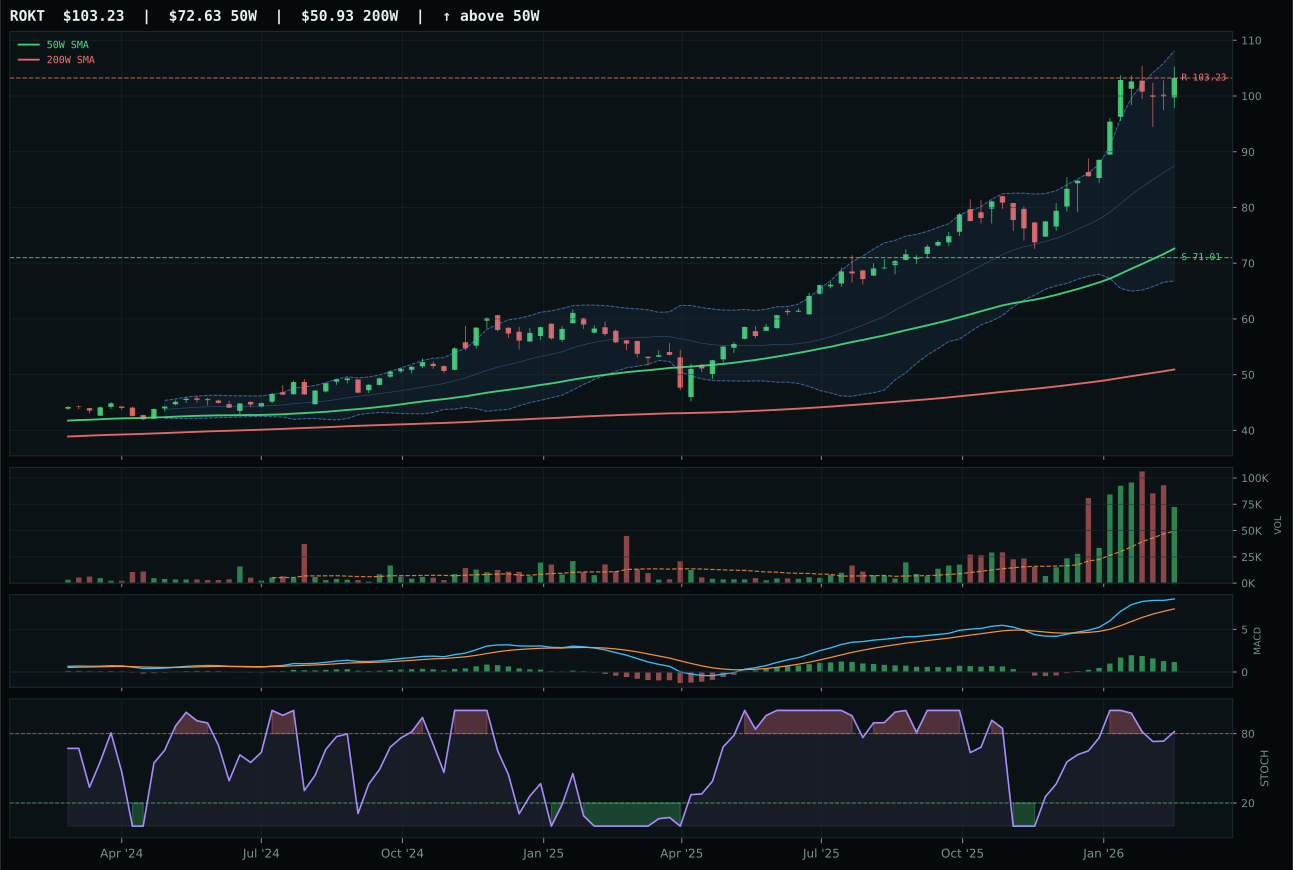
ROKT has a vertical extension profile with 35.4% 13-week relative strength versus SPY.
A failed hold above support would weaken the setup.
Tracked, but not top-2 eligible because: .
ITA won the category by the narrowest margin: a 0.2-point structure advantage (79.1 versus XAR's 79.0) coupled with neutral macro fit and balanced relative strength. Both ITA and XAR sit 22.9% to 28.1% above their 50-week lines with identical MACD bullishness and rising stochastics in the mid-zone. ITA's edge lies in category-relative strength of -5.2% versus XAR's perfect 0.0%, a subtle penalty that indicates XAR's leadership is fully priced into market consensus while ITA retains hidden breadth. Volume neutral at ITA (1.00x 20-week average) versus above-average at XAR created the deciding technical edge. Risk-reward is compressed for both, with near-zero upside to the 243.77 and 292.74 resistance levels respectively.
Defense & Aerospace earned zero allocation this week despite ITA's winning technical setup, ranking outside the top eight categories at 58.6. The category's macro fit registered only 55.0/100, hampered by the transition-regime environment which provided minimal directional guidance and neutral-to-negative credit-stress feedback (-7 for the reasoning layer). Neither positive risk appetite nor liquidity expansion created strong enough institutional sponsorship for the category's defense-prime thesis to compete against real-asset and energy-sector tailwinds. ITA's 24.6% extension from the 50W and deteriorating risk-reward (37.0/100, with upside capped at near-current levels and downside risk at 23%) meant the category offered asymmetric risk into an uncertain macro state. The absence of supply-shortage descriptors, energy-scarcity positioning, or inflation-hedge demand left defense-aerospace exposed primarily to sentiment swings. For a return to allocation consideration, this category needs either a clear geopolitical escalation (active macro descriptor), a pullback to re-accumulate near the 50W, or a macro shift toward risk-off positioning that favors defensive durability.
Technology — XLK
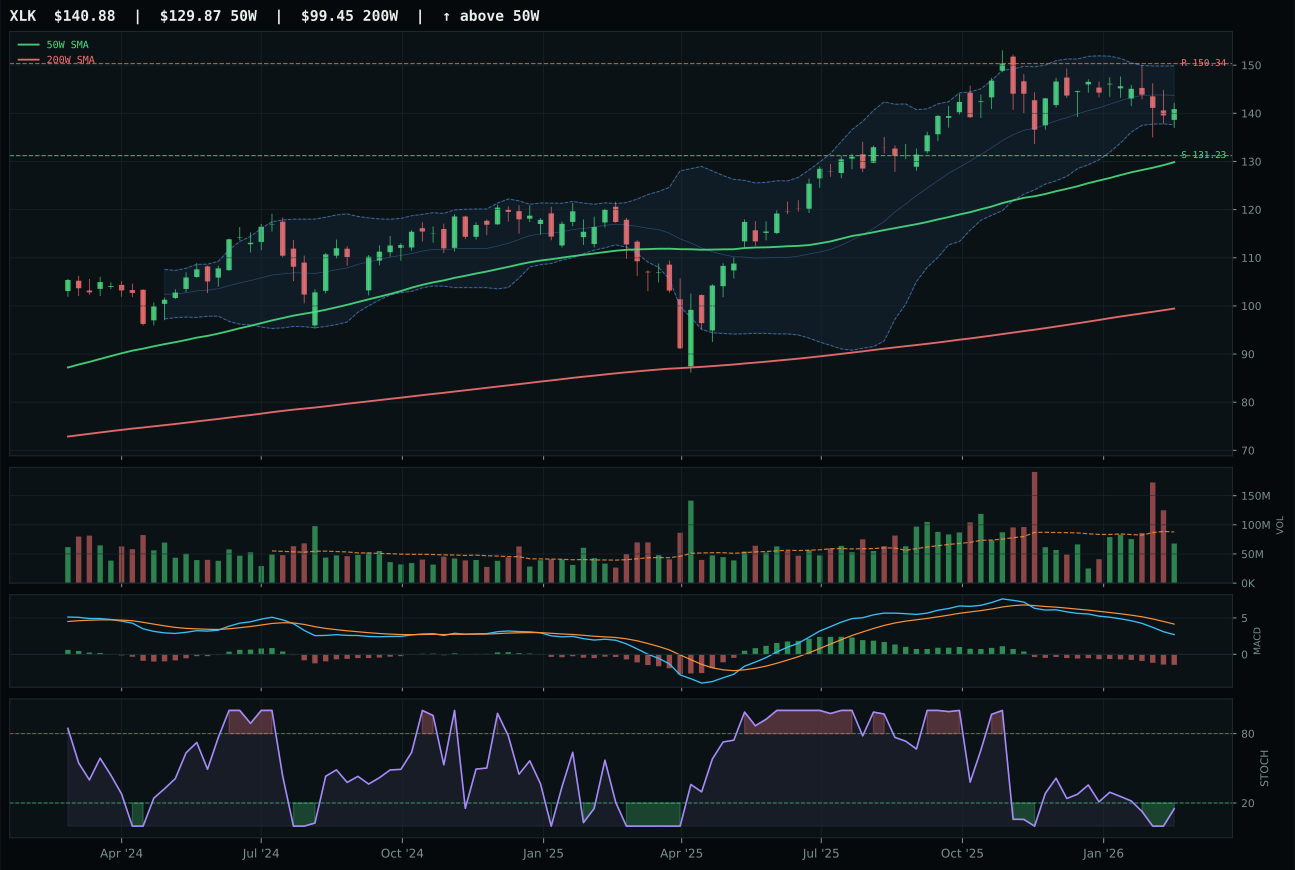
XLK has a neutral structure profile with -1.5% 13-week relative strength versus SPY.
A failed hold above support would weaken the setup.
Actionable but governed by invalidation levels.
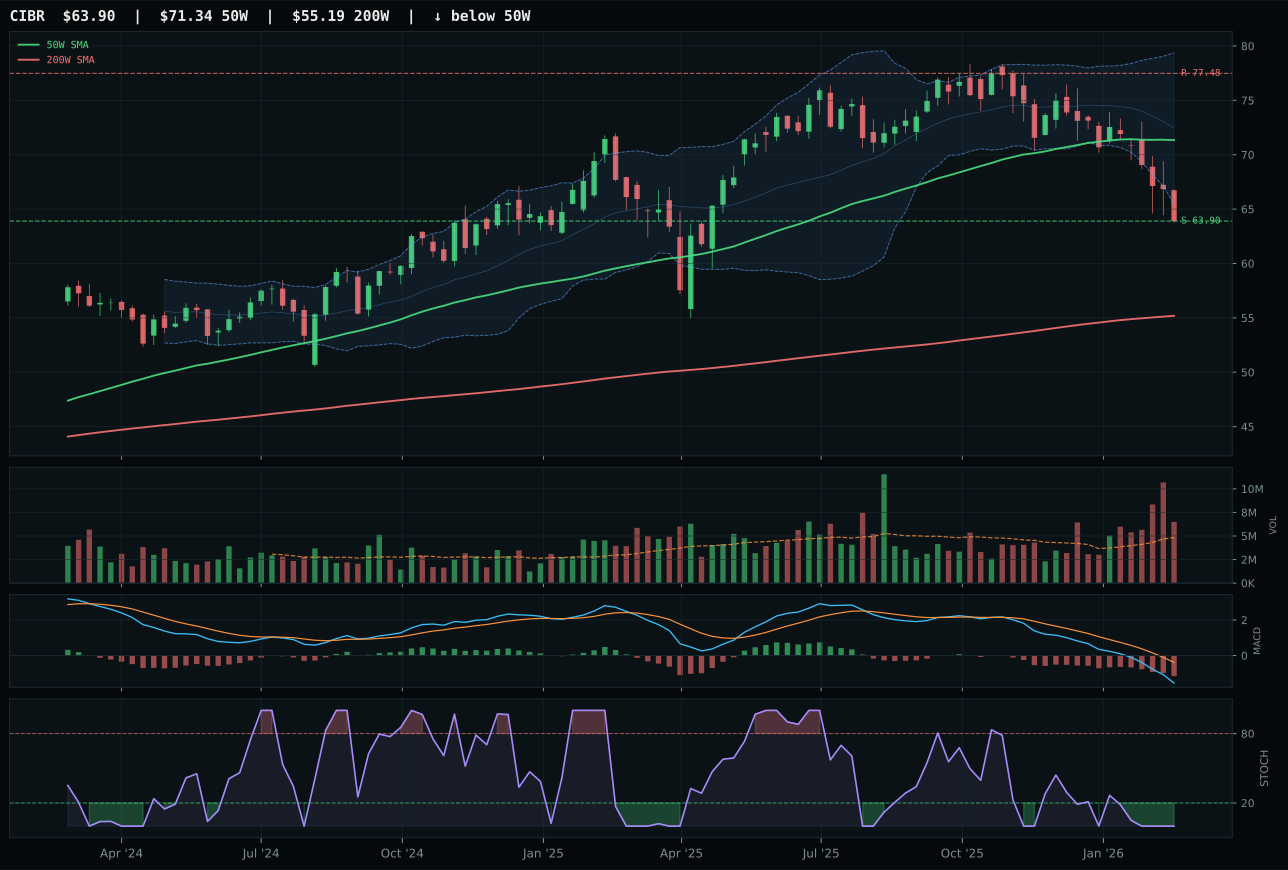
CIBR has a pullback into support profile with -15.3% 13-week relative strength versus SPY.
A failed hold above support would weaken the setup.
Actionable but governed by invalidation levels.
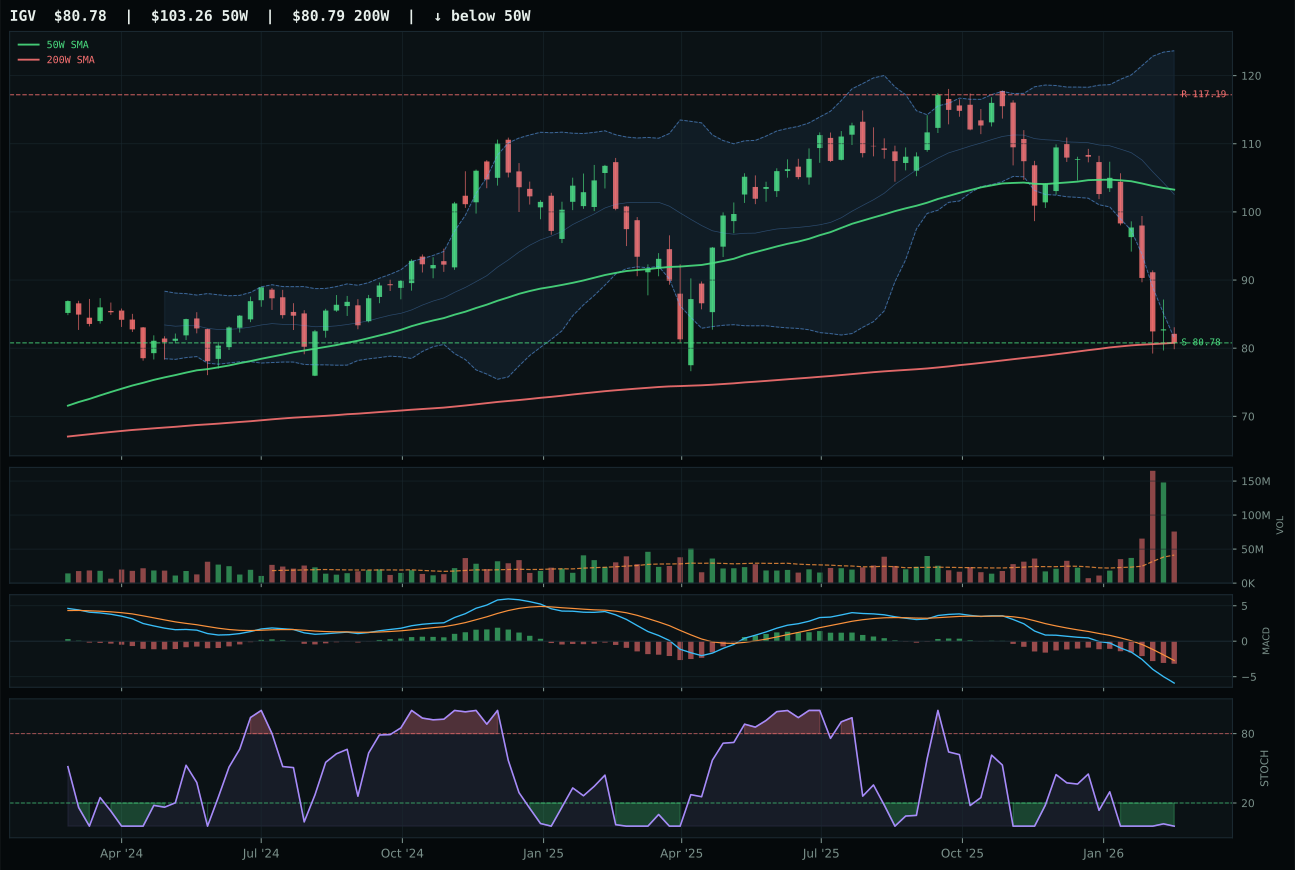
IGV has a pullback into support profile with -24.6% 13-week relative strength versus SPY.
A failed hold above support would weaken the setup.
Actionable but governed by invalidation levels.
XLK claimed the category by combining stable uptrend mechanics with the sharpest internal relative strength inside its three-ETF basket. Price sits 8.5% above the 50-week moving average with a neutral structure and stochastic RSI turning up from oversold, offering a controlled entry point compared to CIBR's deeper pullback into support and category-relative weakness of 0.0% versus XLK's 13.8%. The 3.1% 13-week return masks a 56% relative strength advantage over CIBR in the proof order, driven by cleaner price compression and a non-deteriorating 50-week slope of 0.5%. CIBR's cybersecurity thesis remains defensible on macro grounds, but its -15.3% relative strength to SPY and flat MACD left it unable to compete on technical sponsorship when the macro regime is transitioning.
Technology earned zero allocation this week, ranking ninth or tenth among all ten categories despite XLK's resilient chart structure. The category's 36.9 final score placed it well below the cutoff for even tenth-place consideration, anchored by weak momentum confirmation (56.8/100) and insufficient volume-price sponsorship (57.4/100) to justify capital deployment. Liquidity expansion and positive risk appetite provided modest macro support (+10 and +9 respectively), but credit stress headwinds (-6) and inflation pressure (-4) tilted the narrative against growth-sensitive technology exposure in the current transition regime. The category needed either a cleaner mean-reversion setup in its representative ETF or macro descriptors that actively favored artificial-intelligence-driven capex cycles; neither condition materialized this week. XLK's neutral structure and pullback-into-resistance profile across the peer group suggested waiting for either a breakdown-and-reversal or a fresh accumulation wedge before committing risk capital.