
2026-02-13
Informational purposes only. The content in this report, including allocations, analysis, and commentary, is provided solely for informational and educational purposes. It does not constitute financial advice, investment advice, trading advice, or any other type of advice. Past performance does not guarantee future results. Always conduct your own research and consult a qualified financial professional before making investment decisions.
Weekly Allocation
| Ticker | Category | Weight | Role |
|---|---|---|---|
| XLE | Traditional Energy | 20% | Top-2 (20%) |
| COPX | Industrial Metals | 20% | Top-2 (20%) |
| IGF | Utilities & Infrastructure | 10% | Tier-2 (10%) |
| ILF | Emerging Markets | 10% | Tier-2 (10%) |
| BOTZ | AI | 10% | Tier-2 (10%) |
| URNM | Nuclear Energy | 10% | Tier-2 (10%) |
| GLD | Precious Metals | 10% | Tier-2 (10%) |
| ITA | Defense & Aerospace | 10% | Tier-2 (10%) |
Trade Instructions — Monday Open
Sell the tranche from 2026-01-16 (completing its 4-week hold). Buy the new tranche. Instructions show net portfolio changes — same-asset positions cancel, weight changes show the delta.
| Action | Ticker | Instruction |
|---|---|---|
| SELL | REMX | Sell 50% of REMX position (reduce 10.00% → 5.00%) |
| SELL | SMH | Sell 40% of SMH position (reduce 12.50% → 7.50%) |
| SELL | SLV | Sell 50% of SLV position (reduce 5.00% → 2.50%) |
| SELL | IEMG | Sell entire IEMG position (2.50% of portfolio) |
| SELL | XAR | Sell 50% of XAR position (reduce 5.00% → 2.50%) |
| SELL | XLU | Sell 50% of XLU position (reduce 5.00% → 2.50%) |
| BUY | XLE | Buy XLE — 12.50% of freed cash (adds 2.50% to portfolio) |
| BUY | ILF | Buy ILF — 12.50% of freed cash (adds 2.50% to portfolio) |
| BUY | COPX | Buy COPX — 25.00% of freed cash (adds 5.00% to portfolio) |
| BUY | GLD | Buy GLD — 12.50% of freed cash (adds 2.50% to portfolio) |
| BUY | IGF | Buy IGF — 12.50% of freed cash (adds 2.50% to portfolio) |
| BUY | BOTZ | Buy BOTZ — 12.50% of freed cash (adds 2.50% to portfolio) |
| BUY | ITA | Buy ITA — 12.50% of freed cash (adds 2.50% to portfolio) |
Current Portfolio After Trade
Combined holdings across all 4 active tranches. Each tranche is 25% of the portfolio.
| Ticker | % of Portfolio | Weight Bar |
|---|---|---|
| XLE | 20.00% | |
| COPX | 12.50% | |
| URNM | 10.00% | |
| ILF | 10.00% | |
| MOO | 7.50% | |
| GLD | 7.50% | |
| SMH | 7.50% | |
| REMX | 5.00% | |
| IGF | 5.00% | |
| SLV | 2.50% | |
| XAR | 2.50% | |
| XLU | 2.50% | |
| PAVE | 2.50% | |
| BOTZ | 2.50% | |
| ITA | 2.50% |
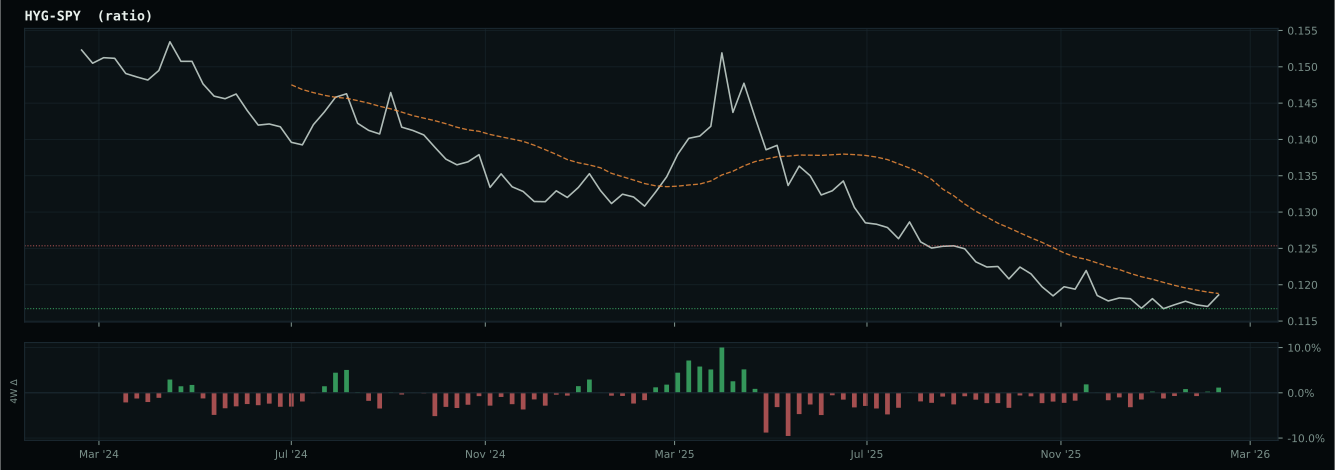
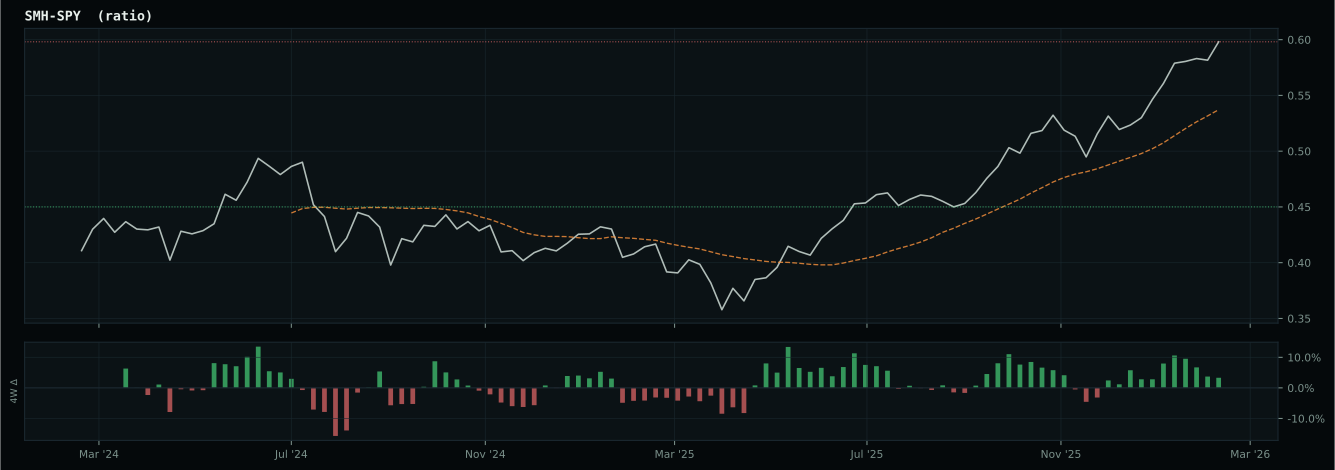
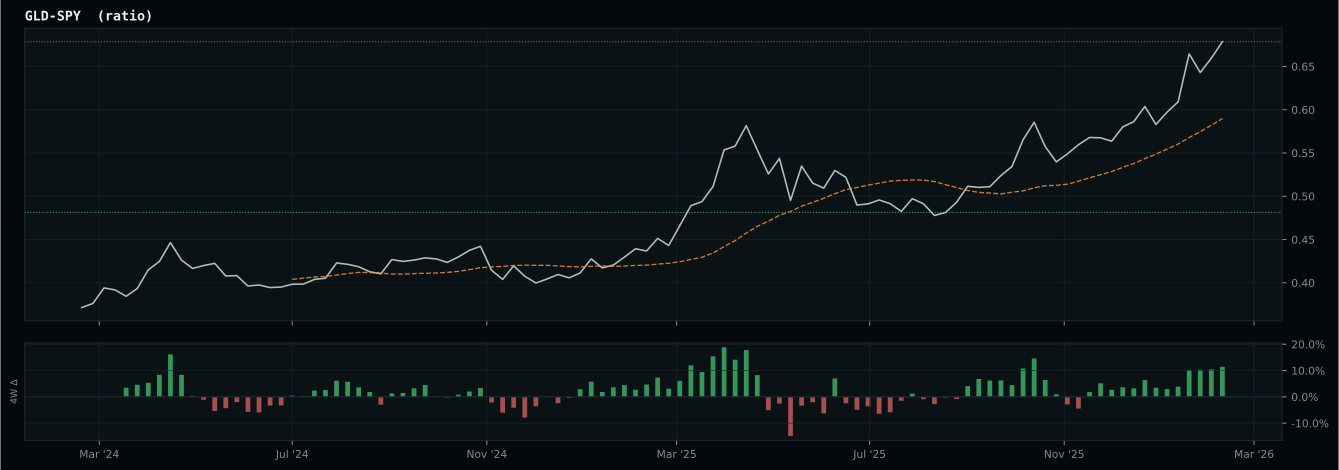
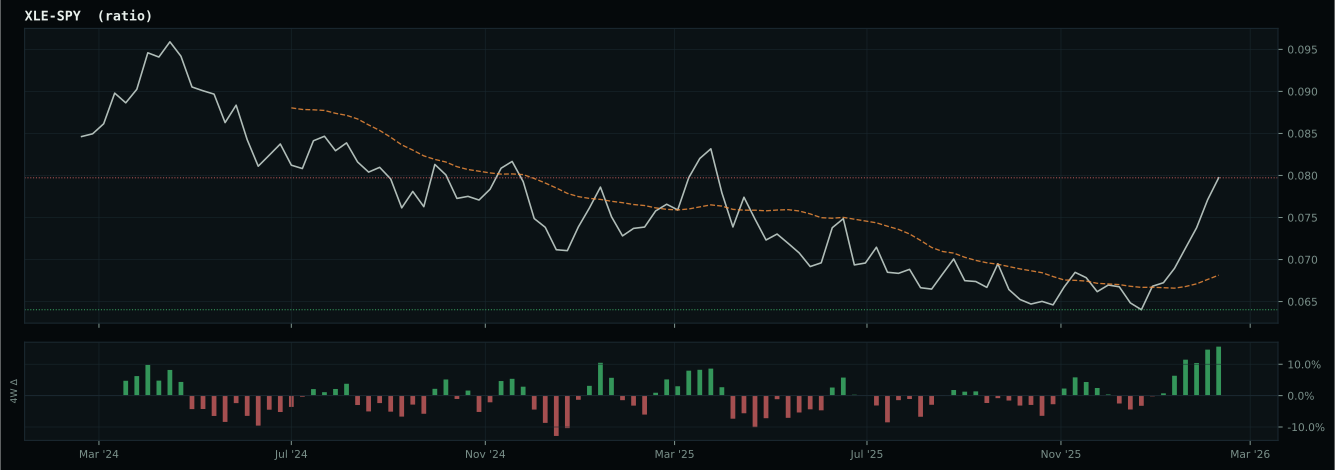
Macro Regime — Risk-On Liquidity Expansion
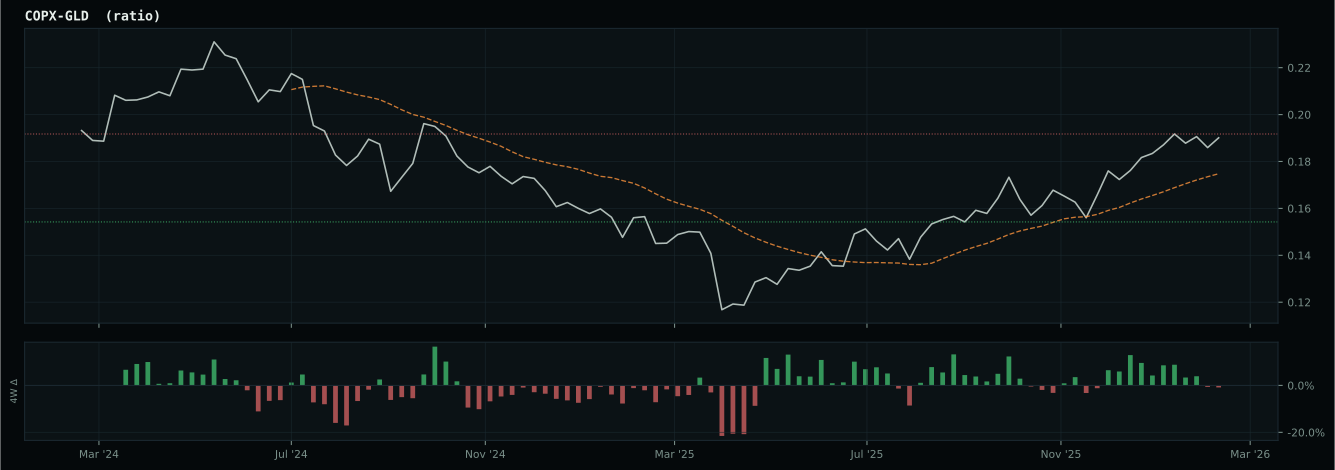
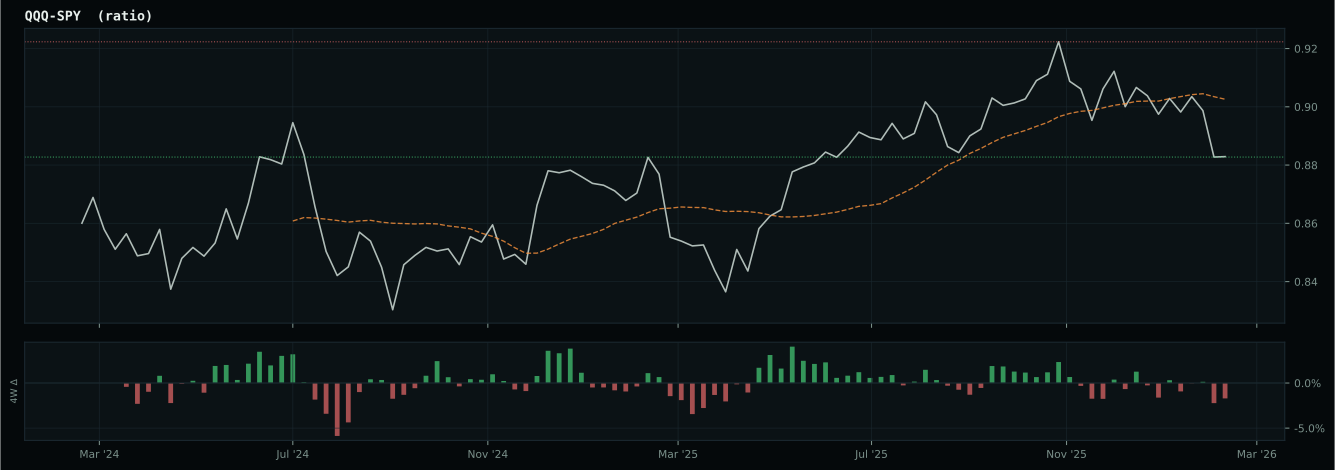
Macro Evidence Charts
Market-implied signals behind the macro regime scores. Each ratio compares two assets; the direction and slope of the ratio is what the macro engine reads.
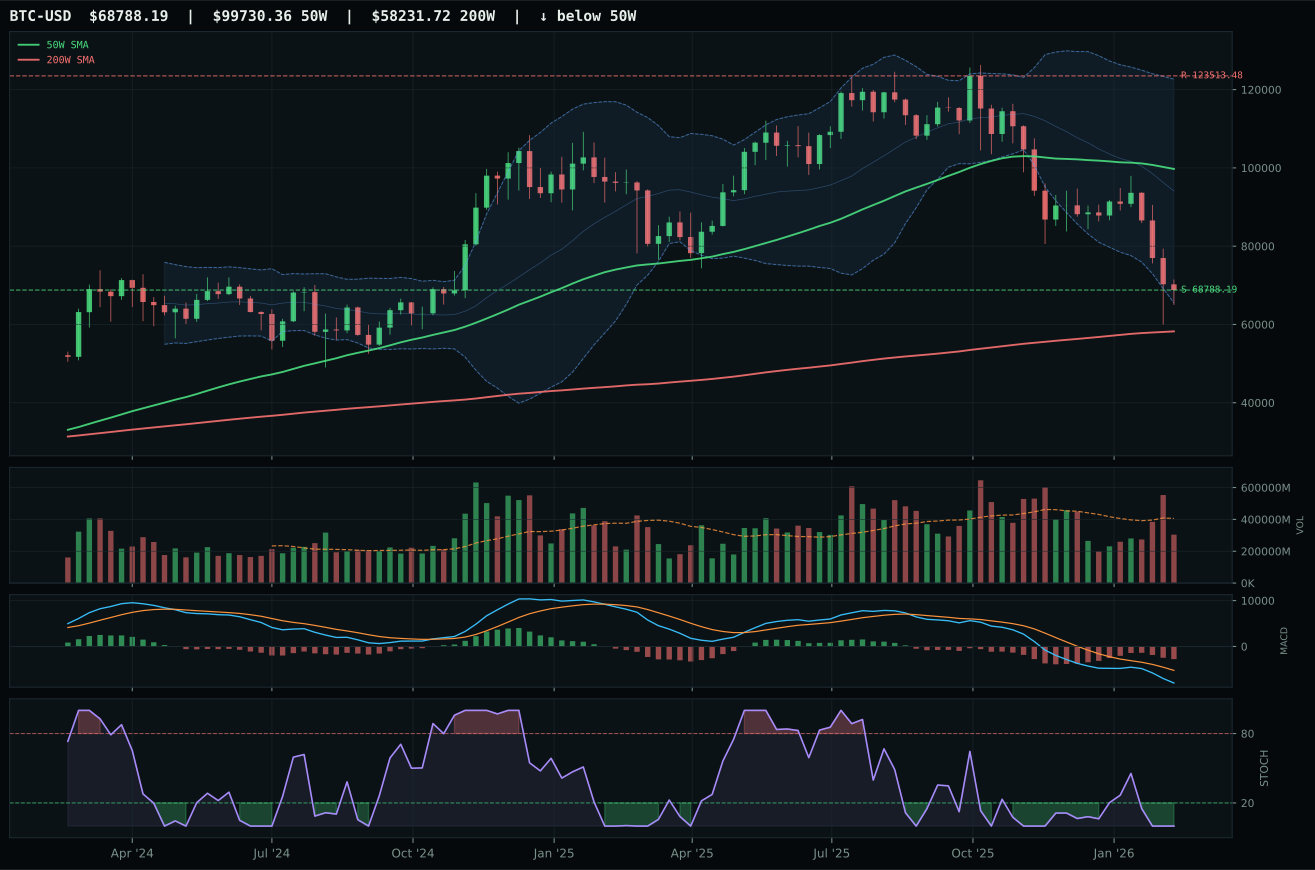
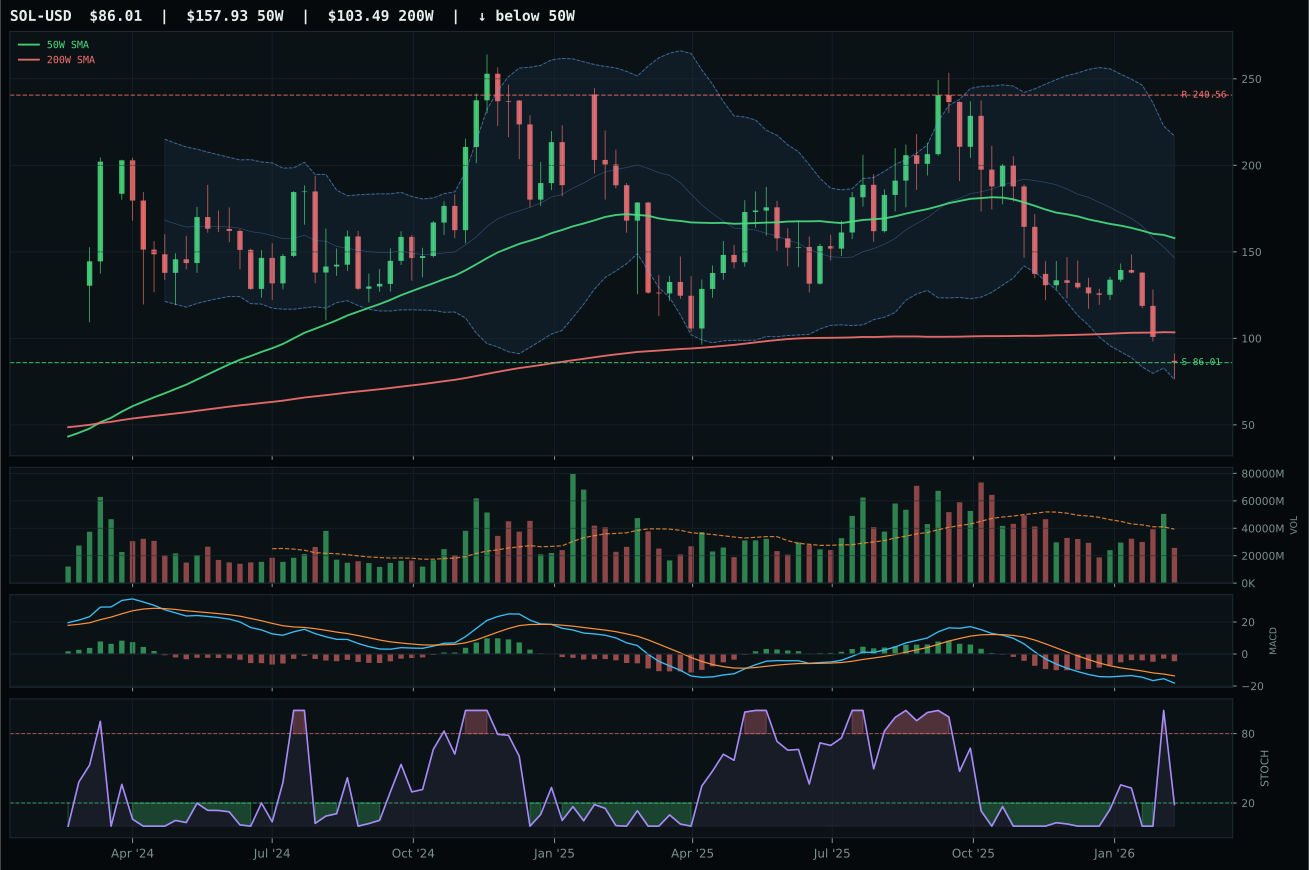
Crypto Regime — NoCrypto
ValueBTC armed by first 200W buy-zone touch, but post-touch range age is 1 weeks; minimum is 12
TrendBTC not confirmed
one or more available conditions failed
Category Rankings
| Rank | Category | Winner | Score | Alloc | 4W Ret | Peers (4W) |
|---|---|---|---|---|---|---|
| 1 | Traditional Energy | XLE | 86.5 | 20% | +5.87% | XOP +13.3% · FCG +11.0% |
| 2 | Industrial Metals | COPX | 75.6 | 20% | -7.78% | PICK -6.3% · REMX +2.6% |
| 3 | Utilities & Infrastructure | IGF | 75.2 | 10% | -2.33% | PAVE -6.7% · XLU +1.4% |
| 4 | Emerging Markets | ILF | 73.9 | 10% | -6.32% | IEMG -4.3% · INDA -8.5% |
| 5 | AI | BOTZ | 72.4 | 10% | -7.66% | SMH -1.9% · AIQ +0.8% |
| 6 | Nuclear Energy | URNM | 69.1 | 10% | -4.69% | URA -2.2% · NLR -1.8% |
| 7 | Precious Metals | GLD | 67.0 | 10% | +2.45% | GDX -6.5% · SLV +8.9% |
| 8 | Defense & Aerospace | ITA | 60.9 | 10% | -1.51% | ROKT +1.1% · XAR -0.7% |
| 9 | Agriculture & Livestock | MOO | 50.0 | 0% | -0.87% | VEGI +0.6% · WEAT +11.9% |
| 10 | Technology | XLK | 35.6 | 0% | +0.06% | CIBR -1.9% · IGV +3.4% |
Traditional Energy — XLE
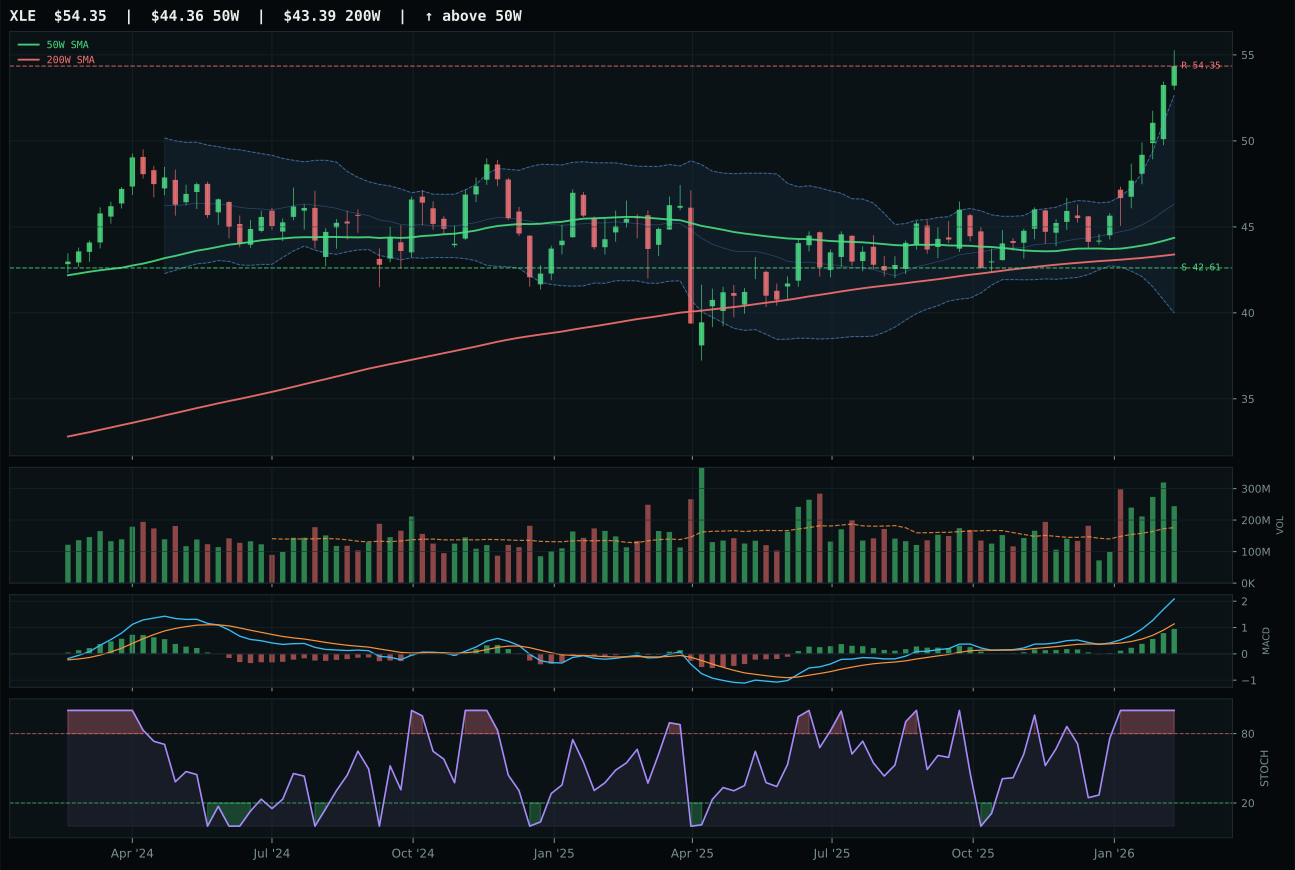
XLE has a vertical extension profile with 16.7% 13-week relative strength versus SPY.
A failed hold above support would weaken the setup.
Actionable but governed by invalidation levels.
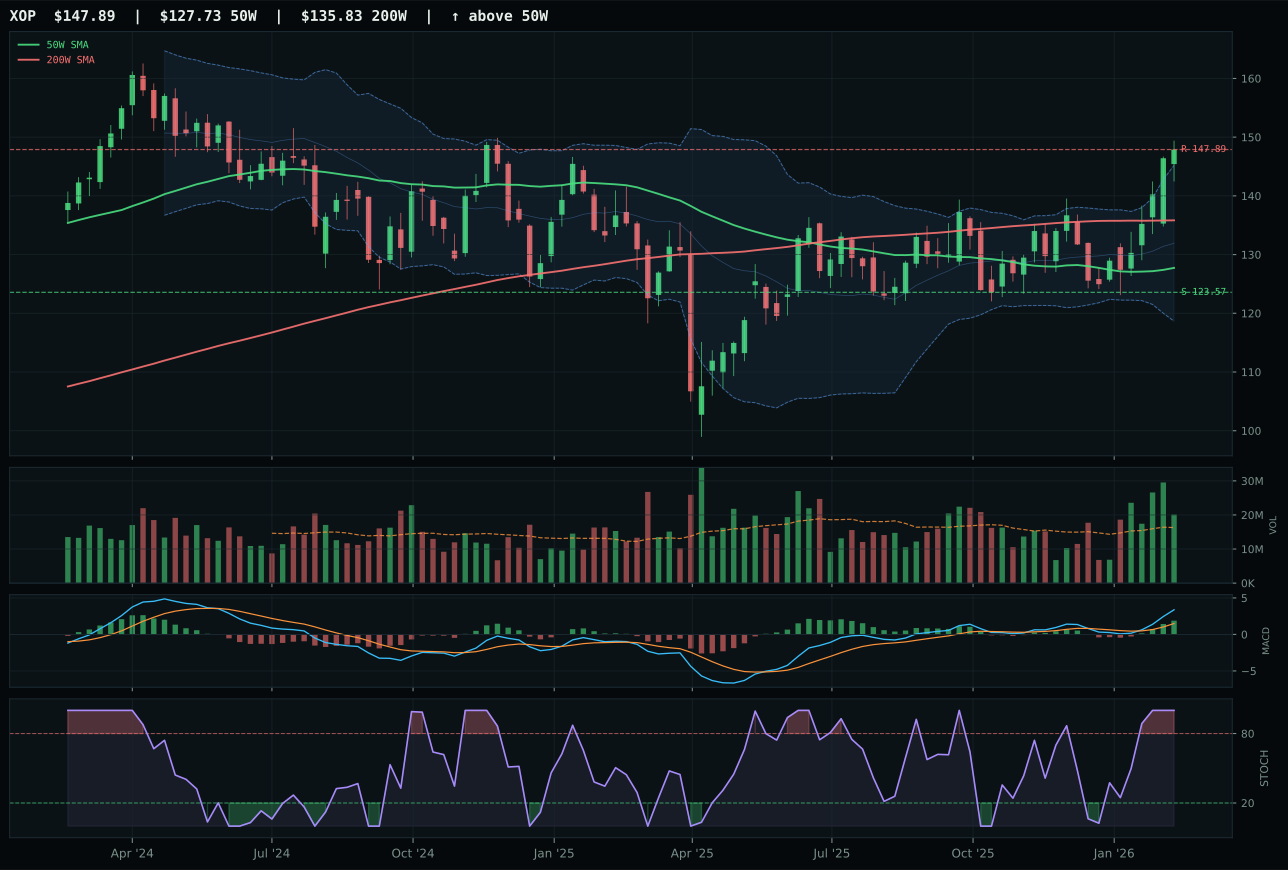
XOP has a vertical extension profile with 8.9% 13-week relative strength versus SPY.
A failed hold above support would weaken the setup.
Actionable but governed by invalidation levels.
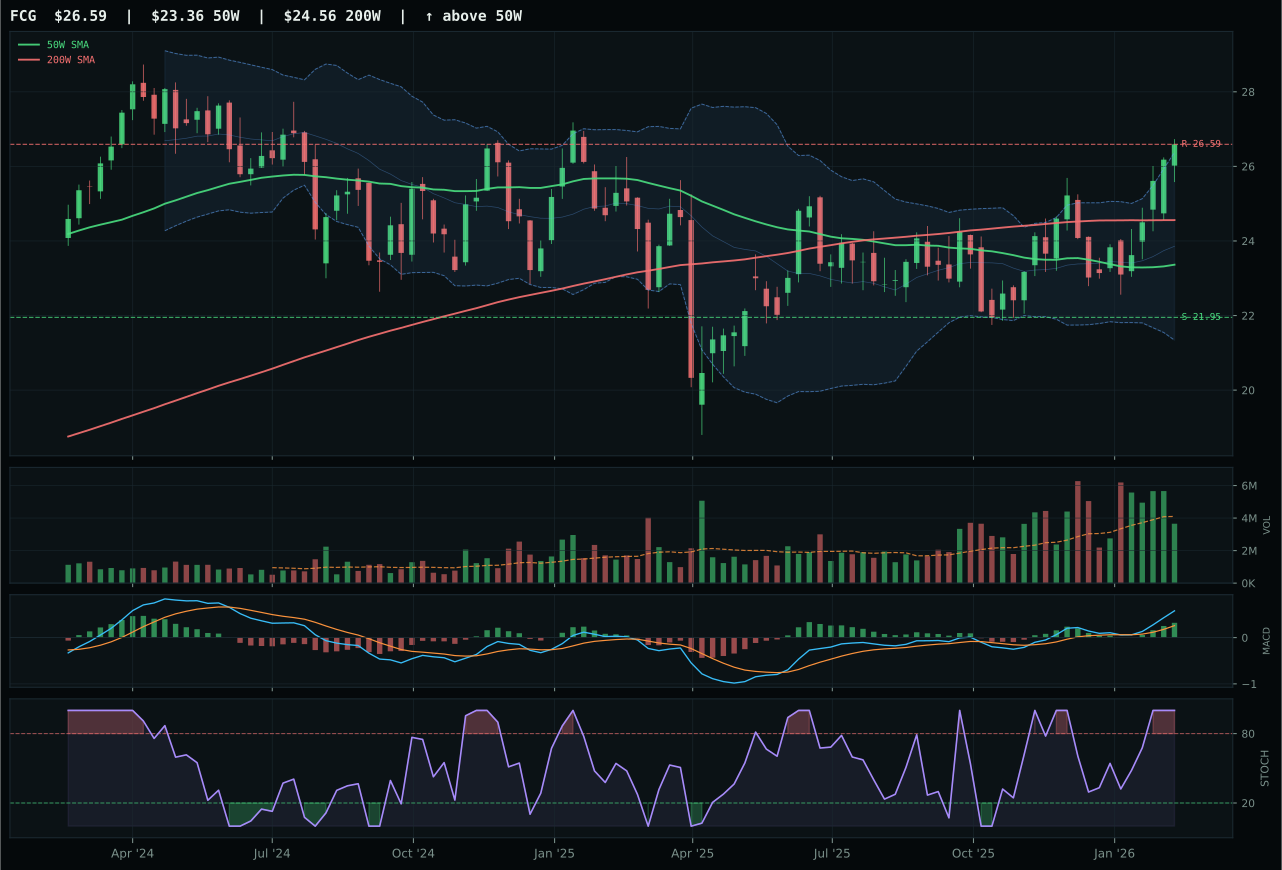
FCG has a neutral structure profile with 8.7% 13-week relative strength versus SPY.
A failed hold above support would weaken the setup.
Actionable but governed by invalidation levels.
XLE wins the category outright with superior category-relative strength (7.8% versus 0.0% for XOP) and cleaner structure (84.7 versus 78.2), despite near-identical trend and momentum scores. XOP's 8.9% SPY-relative return and 10.4% 13-week performance appear close until you isolate the category edge: XLE's leadership premium reveals institutional capital is choosing integrated energy (cash flow + dividend protection) over pure exploration beta. XLE's MACD is bullish and improving with volume at 1.39x average; XOP matches the momentum but with neutral volume, signaling commitment divergence. The 0.8-point score gap translates to a clear category ranking: both sit in vertical extension, both own overbought momentum, but only XLE is being accumulated by institutions building positions for duration.
Traditional Energy earned 20% (tied for top-2) because it scored 86.5, the second-highest across all 10 categories, combining exceptional technical setup with overwhelming macro tailwind. Energy scarcity (+16 macro points), inflation pressure (+10), and real asset sponsorship (+7) create a convergence that XLE's 100 trend score and 16.7% SPY-relative return fully validate. The category would be top-1 if not for its entry risk: 22.5% extension above the 50W means downside is asymmetric relative to upside if risk appetite reverses. Yet the macro case is too strong to underweight—supply constraints are structural, not cyclical, and energy remains the most inflation-resistant real asset in this regime. XLE stays at 20% as long as geopolitical supply uncertainty persists and the Fed maintains liquidity support; it would drop to 10% only if oil prices approached resistance above $60/barrel or if Fed tightening signals reversed.
Industrial Metals — COPX
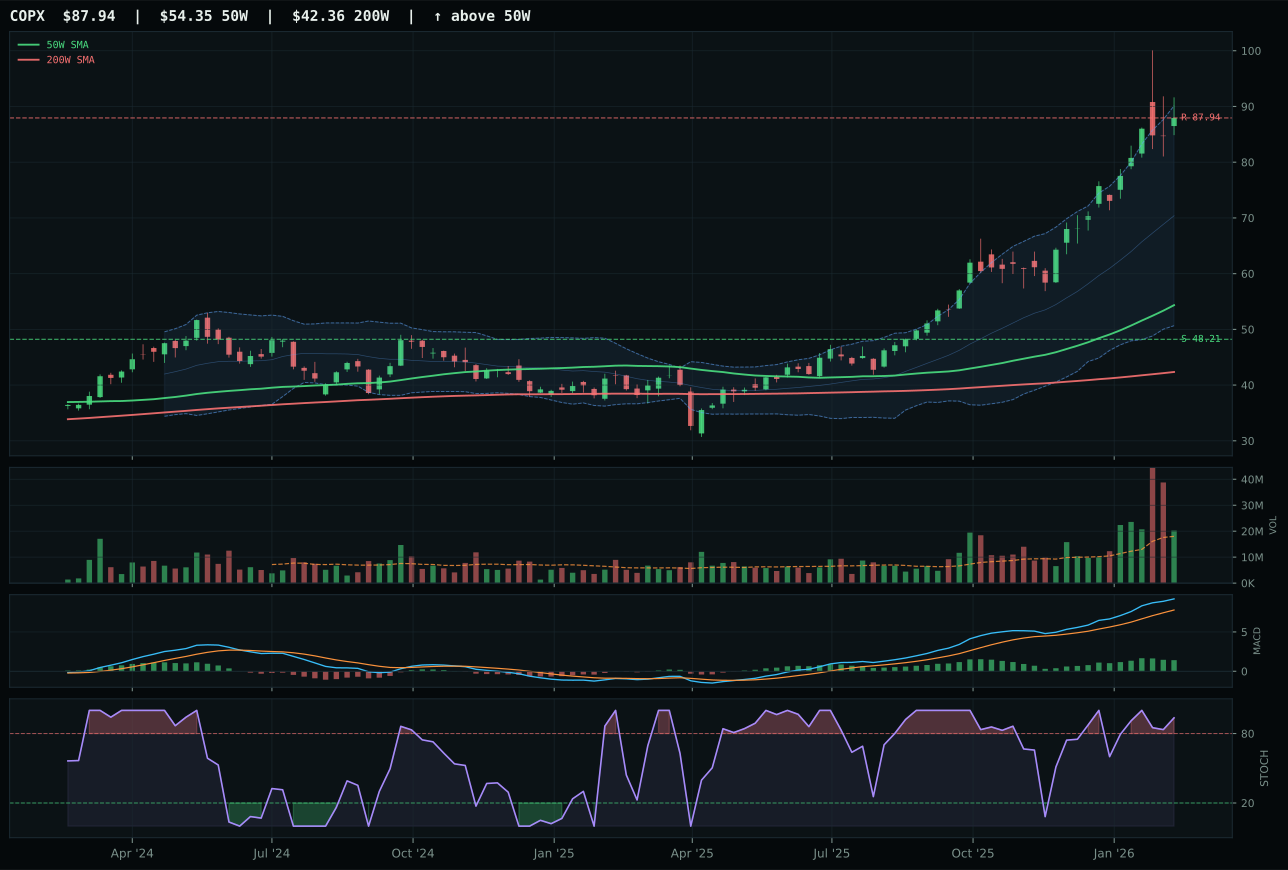
COPX has a vertical extension profile with 42.3% 13-week relative strength versus SPY.
A failed hold above support would weaken the setup.
Actionable but governed by invalidation levels.
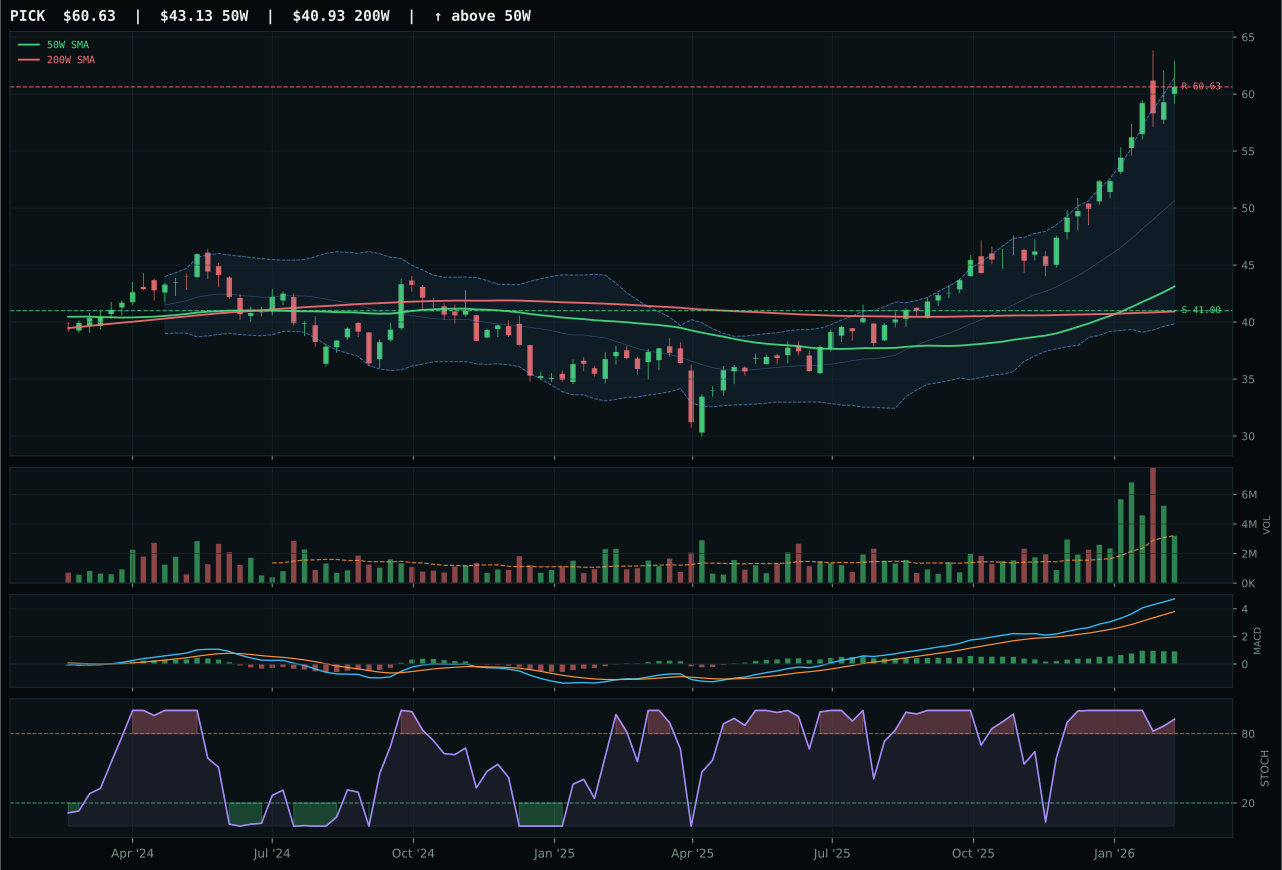
PICK has a vertical extension profile with 29.8% 13-week relative strength versus SPY.
A failed hold above support would weaken the setup.
Actionable but governed by invalidation levels.
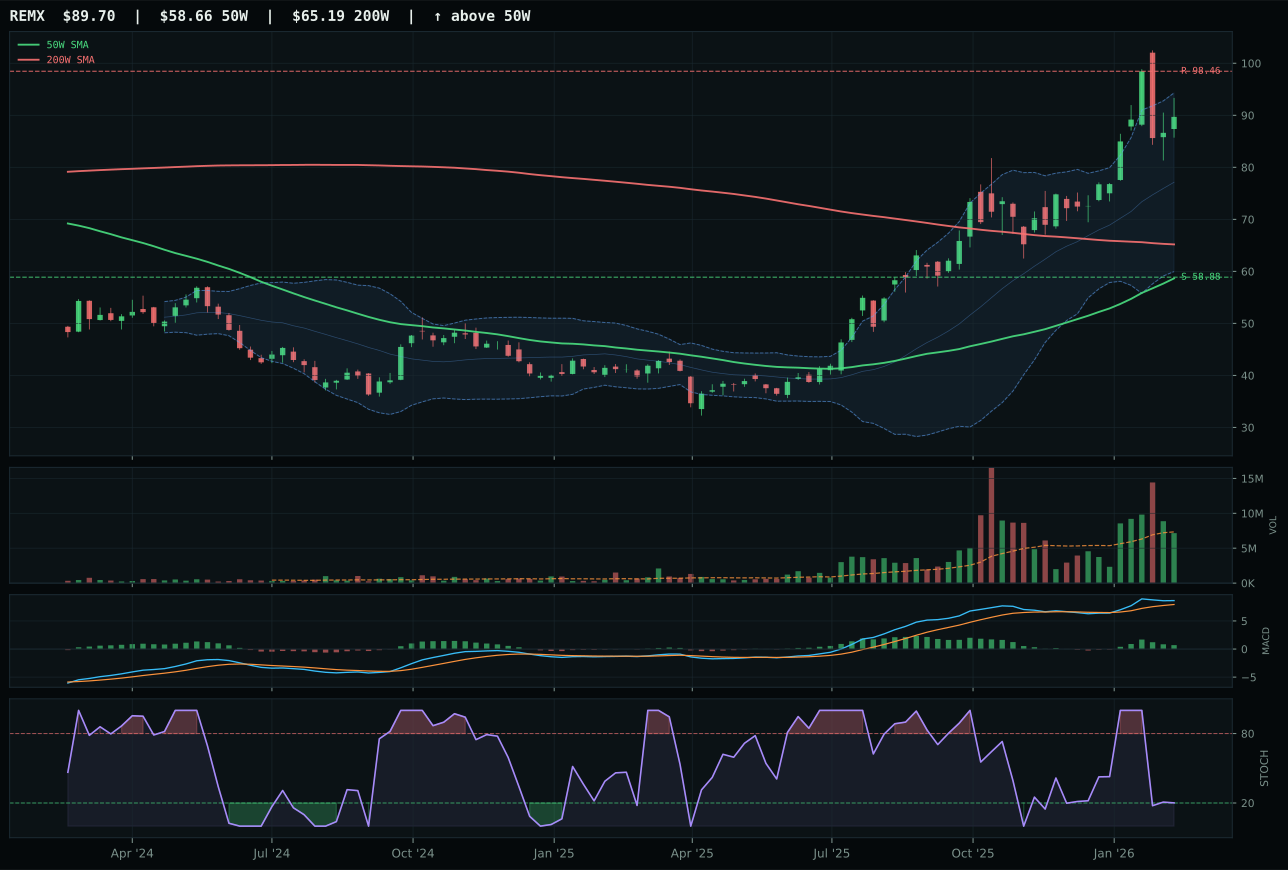
REMX has a vertical extension profile with 26.3% 13-week relative strength versus SPY.
A failed hold above support would weaken the setup.
Actionable but governed by invalidation levels.
COPX wins with the highest SPY-relative return (42.3%) and category-relative strength (12.5%) in the field, backed by a 100.0 persistence score that proves this move is being accumulated rather than vacuumed. PICK's 29.8% SPY-relative return appears competitive until you measure timing: COPX's 35.0 timing score versus PICK's 27.0 reveals COPX still has technical room despite 61.8% extension, while PICK's extension at unknown distance has already consumed its entry window. COPX's bullish-improving MACD with volume at 1.12x average proves institutional money is rotating into copper directly, not through mining equity proxies. The 1.3-point score margin belies a decisive advantage in sponsorship; both are extended, but one is still being bought.
Industrial Metals earned 20% (tied for top-2) because it scored 75.6, reflecting the perfect storm of technical + macro alignment in the current regime. Metals scarcity (+14 macro points), commodity breadth positive (+10), and real asset sponsorship (+6) converge with COPX's 100 momentum confirmation and 42.3% SPY-relative strength. This is the rare category where both technical excellence and macro favorability align without contradiction. The allocation reflects not just COPX's leadership but the category's rank among all 10 contenders; energy and industrial metals are the regime's twin pillars because they combine scarcity (supply-side constraint), inflation-hedging (demand-side protection), and liquidity sponsorship (macro stimulus). The risk: 61.8% extension means any reversal will be violent. COPX stays at 20% only as long as copper inventory stays tight and risk appetite remains supported.
Utilities & Infrastructure — IGF
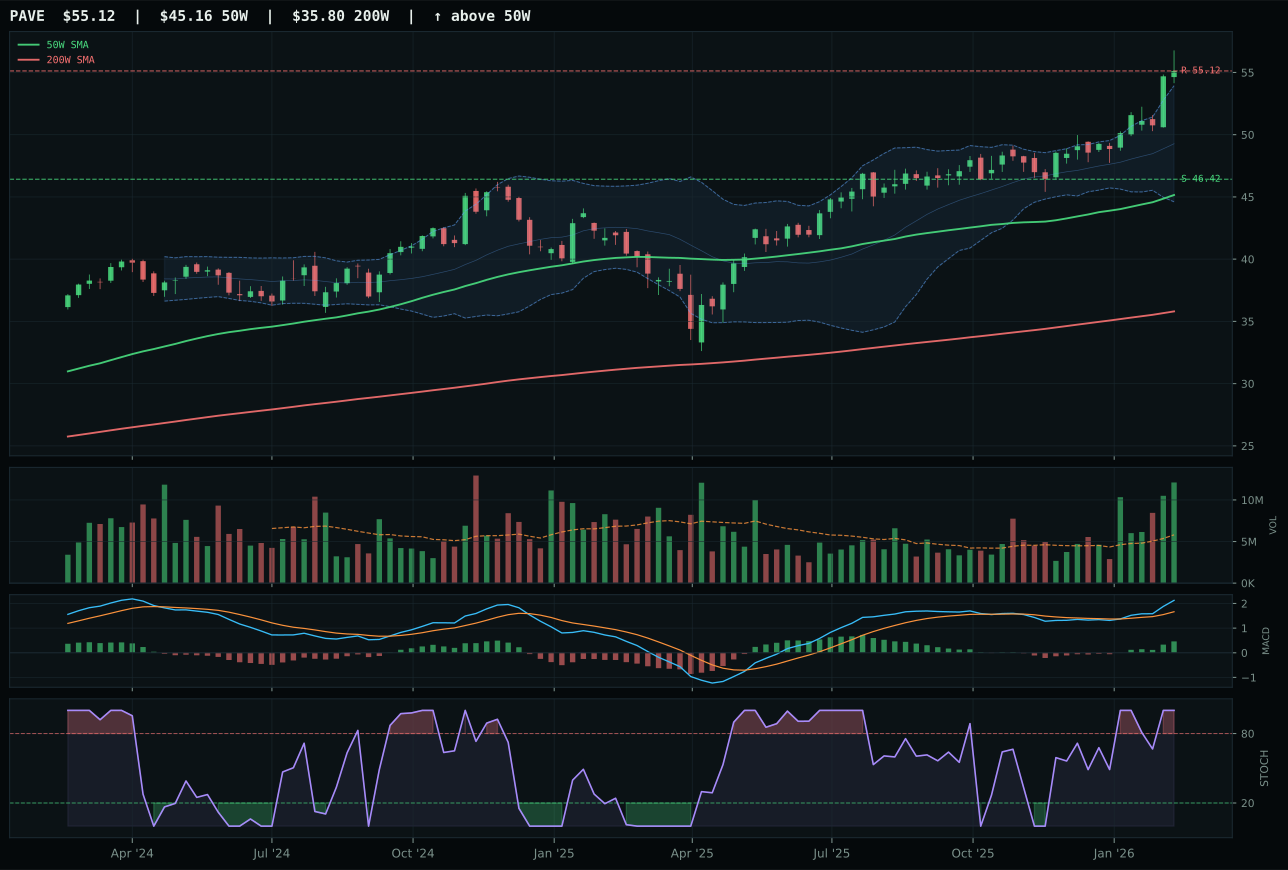
PAVE has a vertical extension profile with 15.8% 13-week relative strength versus SPY.
A failed hold above support would weaken the setup.
Actionable but governed by invalidation levels.
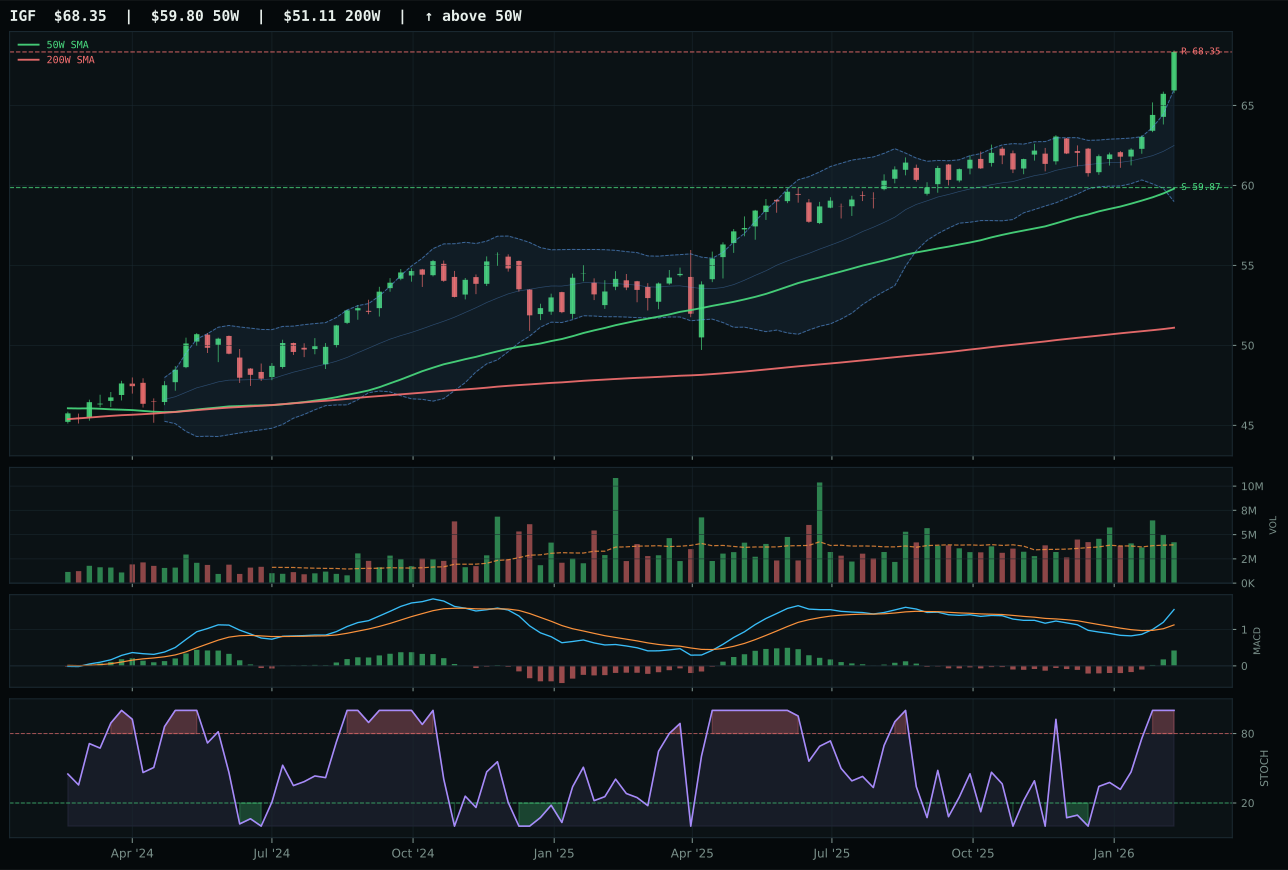
IGF has a neutral structure profile with 8.5% 13-week relative strength versus SPY.
A failed hold above support would weaken the setup.
Actionable but governed by invalidation levels.
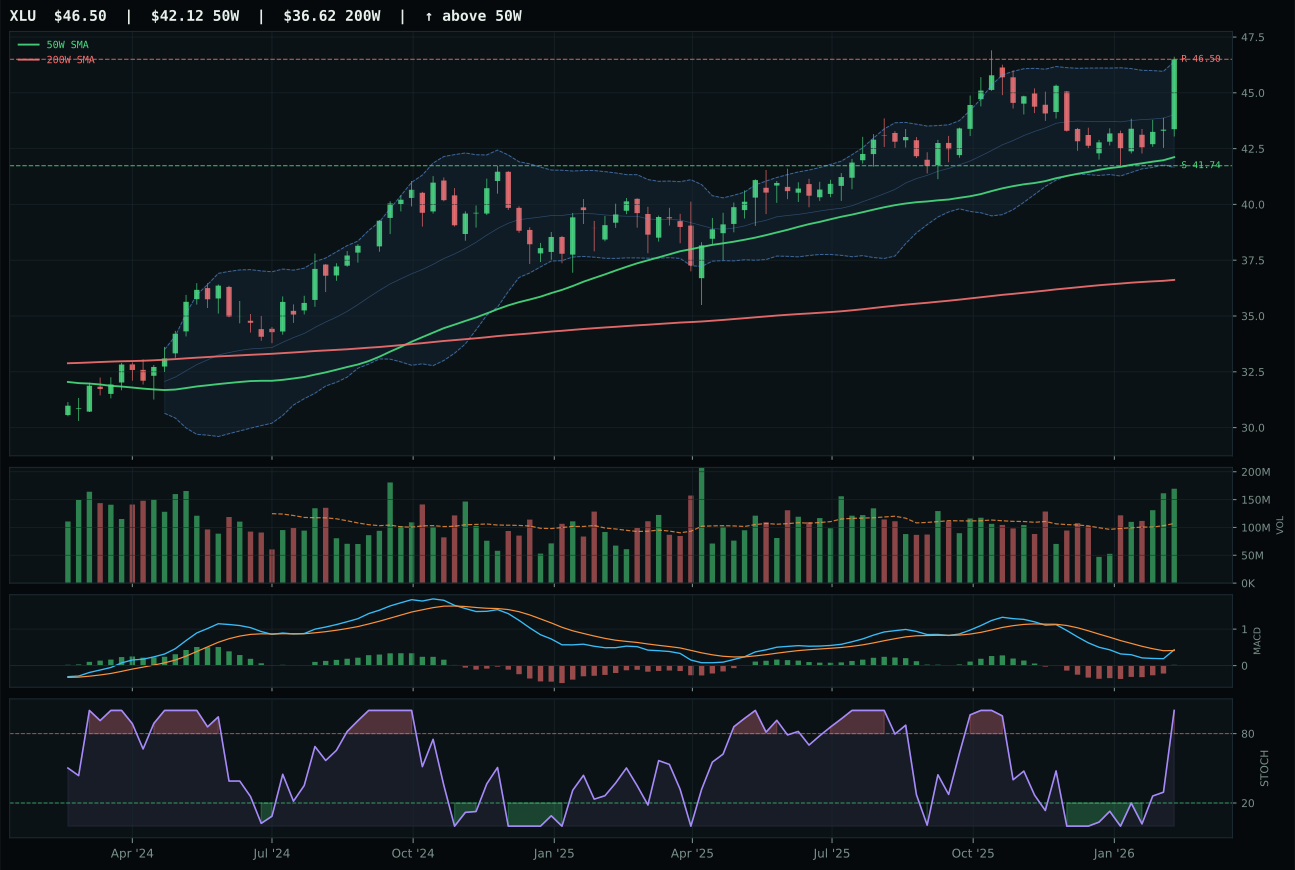
XLU has a neutral structure profile with 3.3% 13-week relative strength versus SPY.
A failed hold above support would weaken the setup.
Actionable but governed by invalidation levels.
IGF wins the category with superior timing (59.0 versus 37.0 for PAVE) and structure cleanliness (81.2) by sitting in neutral structure rather than vertical extension, allowing it to hold 14.3% above the 50W without triggering catastrophic timing penalties. PAVE's 17.3% 13-week return and higher technical score (100.0 from PAVE's more extended momentum) look superior until you measure entry geometry: PAVE at 22.1% extension forces new buyers to assume margin-of-error risk that IGF avoids. Both own identical 100 momentum confirmation and bullish-improving MACD, yet IGF's neutral positioning versus PAVE's vertical extension creates a 22-point timing divergence. PAVE sacrifices entry quality for absolute momentum; IGF trades pure momentum advantage for position safety. In a category this extended, the latter decision matters.
Utilities & Infrastructure earned 10% because the category's 75.2 score ranks well outside top-2 despite IGF's solid technical setup. Defensive rotation (+12 macro points) supports infrastructure, yet risk appetite positive carries -2 points and inflation pressure inflicts -6, creating real headwinds that energy and metals avoid. The macro fit of 58.0 reveals this category serves as a portfolio hedge rather than a return driver—it works when growth falters, not when liquidity expansion is active. IGF's 8.5% SPY-relative return and clean structure justify the 10% anchor as steady-state allocation, but the allocation would require genuine growth concerns or credit stress widening to justify moving to 20%. For now, utilities lock in defensive premium without capital commitment; they're held because macro shock preparedness matters, not because the current regime favors them.
Emerging Markets — ILF
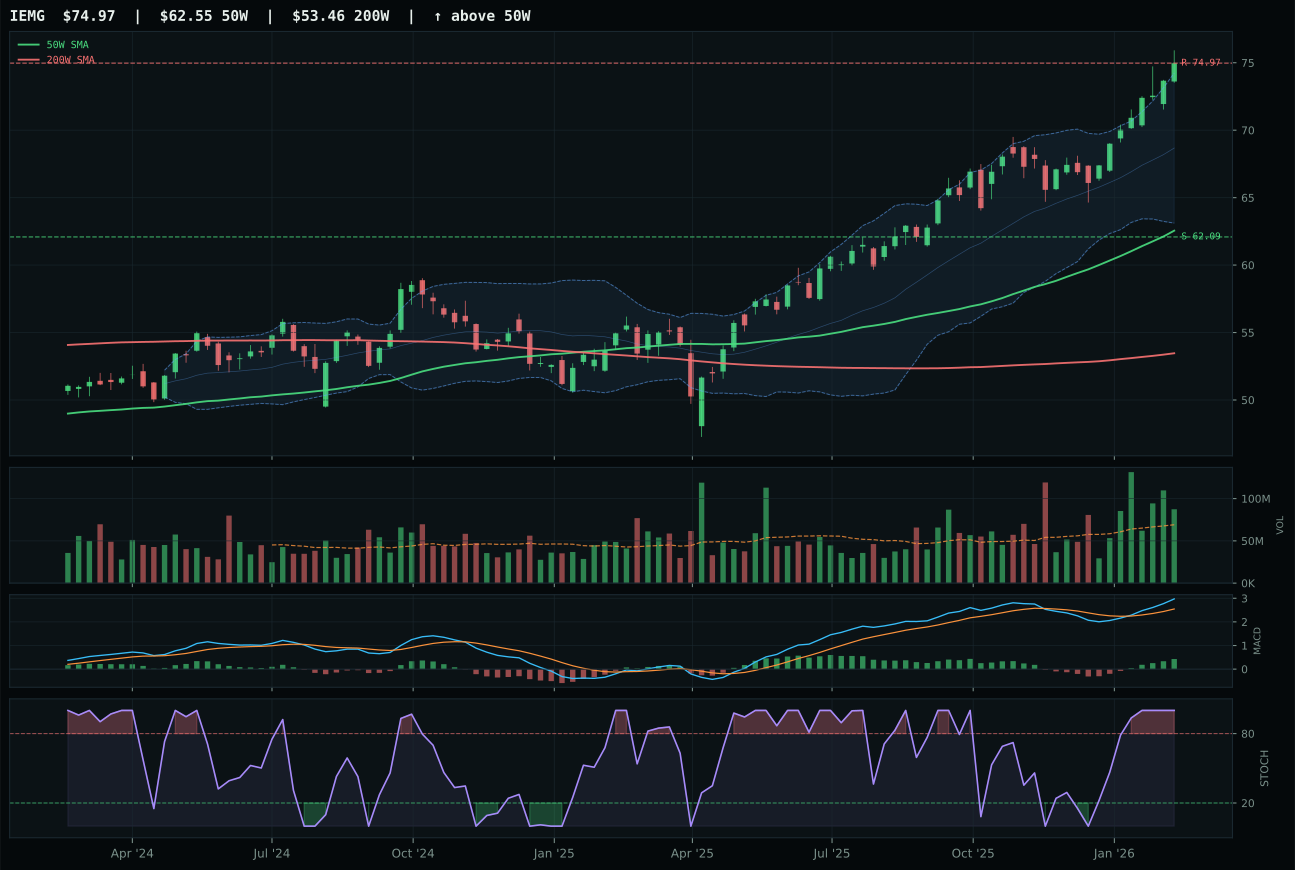
IEMG has a vertical extension profile with 9.0% 13-week relative strength versus SPY.
A failed hold above support would weaken the setup.
Actionable but governed by invalidation levels.
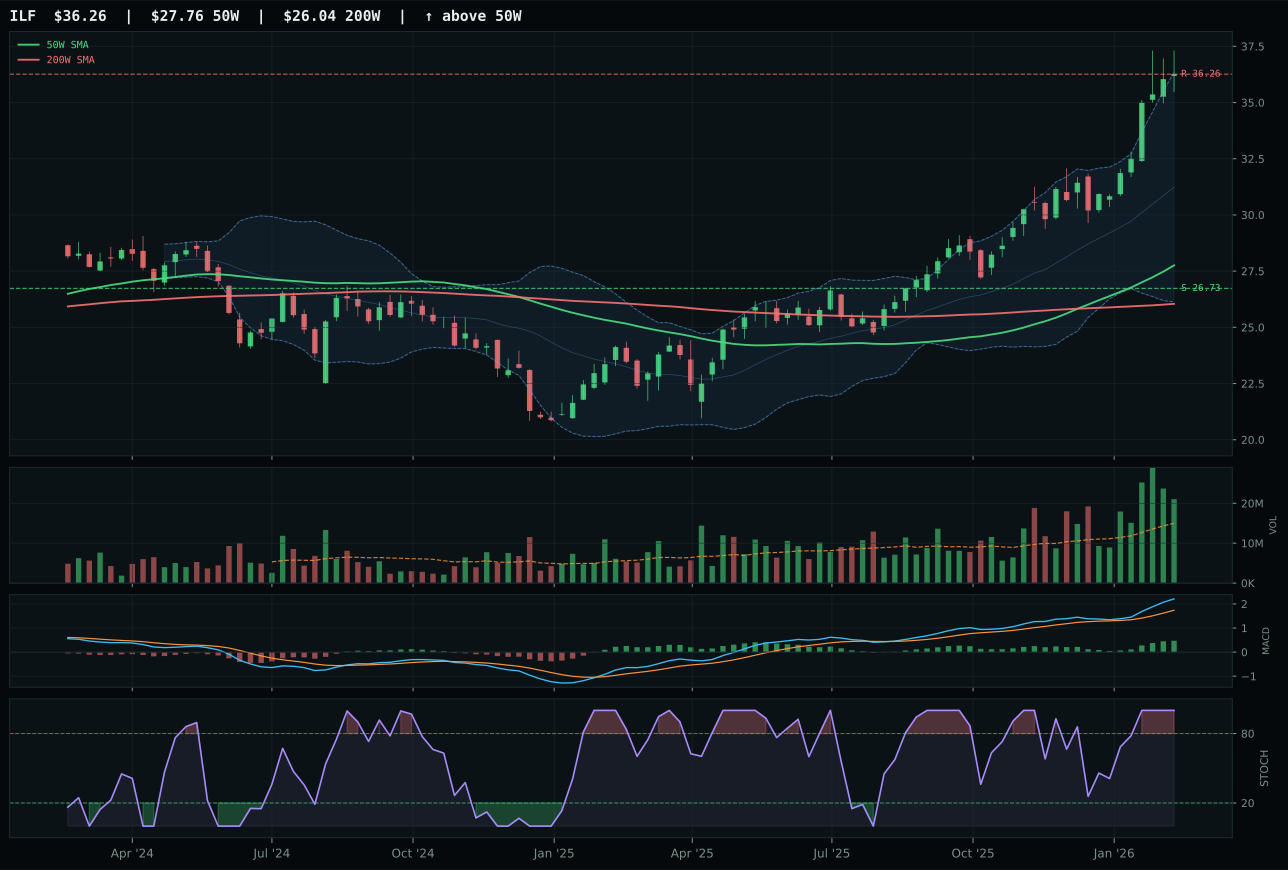
ILF has a vertical extension profile with 17.3% 13-week relative strength versus SPY.
A failed hold above support would weaken the setup.
Actionable but governed by invalidation levels.
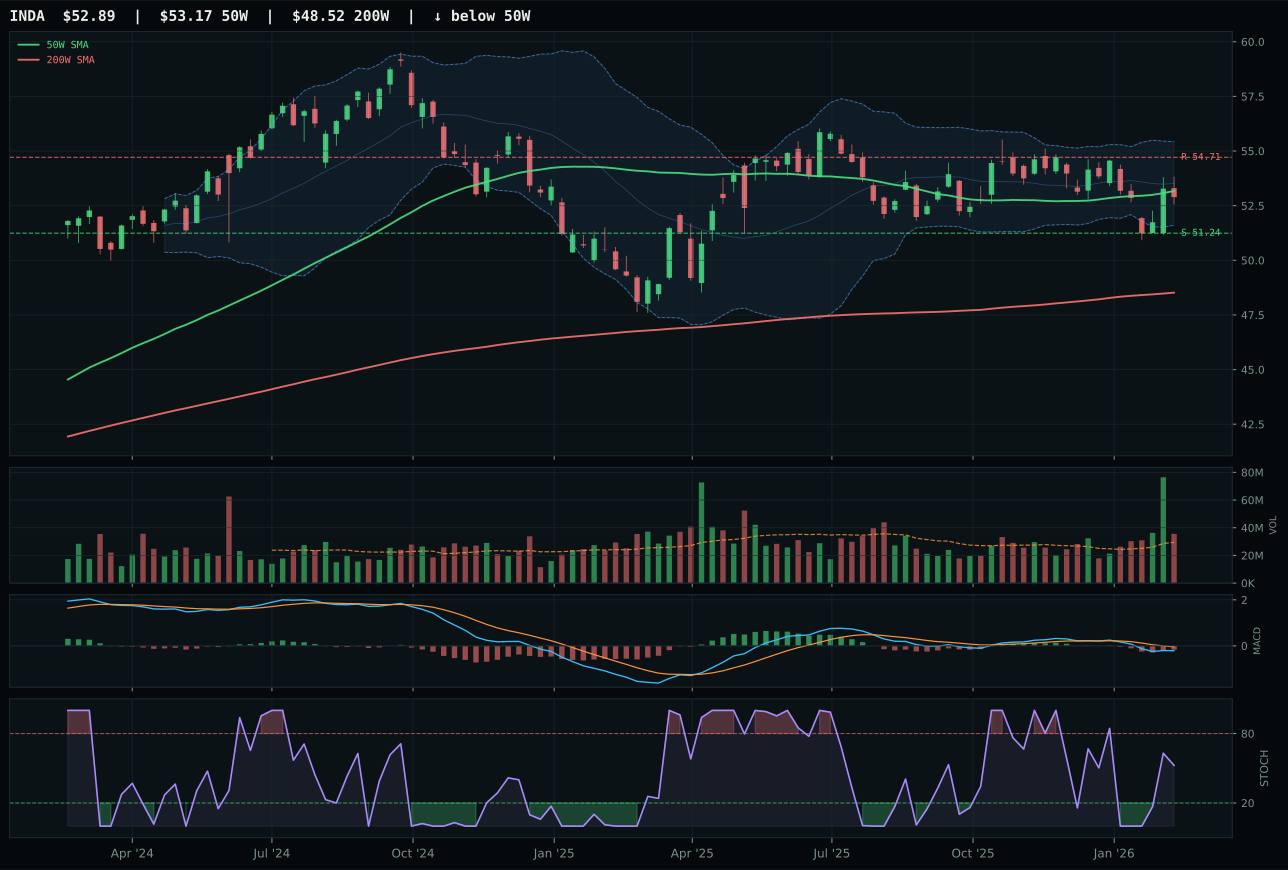
INDA has a pullback into support profile with -4.6% 13-week relative strength versus SPY.
A failed hold above support would weaken the setup.
Actionable but governed by invalidation levels.
ILF wins despite losing the direct technical race to IEMG (86.0 technical evidence versus ILF's 81.1) because of category-relative strength: ILF's 8.3% premium over the category median versus IEMG's 0.0% reveals where fresh capital is actually flowing. IEMG's broader emerging-market exposure and marginally better technical score cannot overcome the fact that Latin America commodity beta (ILF) is outperforming broad EM (IEMG) in a regime where commodity breadth is actively positive. Both own identical 100 momentum confirmation and overbought technical setups; the difference is that ILF investors are choosing higher-conviction plays while IEMG absorbs general EM rotation. The 8.2-point score reversal (ILF wins despite worse technical evidence) proves macro sponsorship and category-relative flows matter more than pristine chart mechanics.
Emerging Markets earned 10% because while ILF shows solid 73.9 category score with strong technical foundation, the broader EM category carries macro headwinds that constrain its capital weight. EM liquidity support (+14 macro points) and risk appetite positive (+8) are genuine, yet credit stress remains active at -10 points, creating internal tension. The category's 80.0 macro fit—strong in isolation—falls well behind energy (85.0) and metals (73.0) in the current hierarchy. ILF's specific advantage is commodity-beta tilting that overlaps with metals/agriculture themes, but broad EM exposure lacks the urgency that scarcity-driven themes command. The category would move to 20% if either EM-specific credit spreads tightened sharply (signaling capital availability) or if commodity demand explicitly accelerated via China stimulus. Until then, ILF's 17.3% SPY-relative return anchors the allocation as a secondary play on real-asset strength, not a primary risk-on bet.
AI — BOTZ
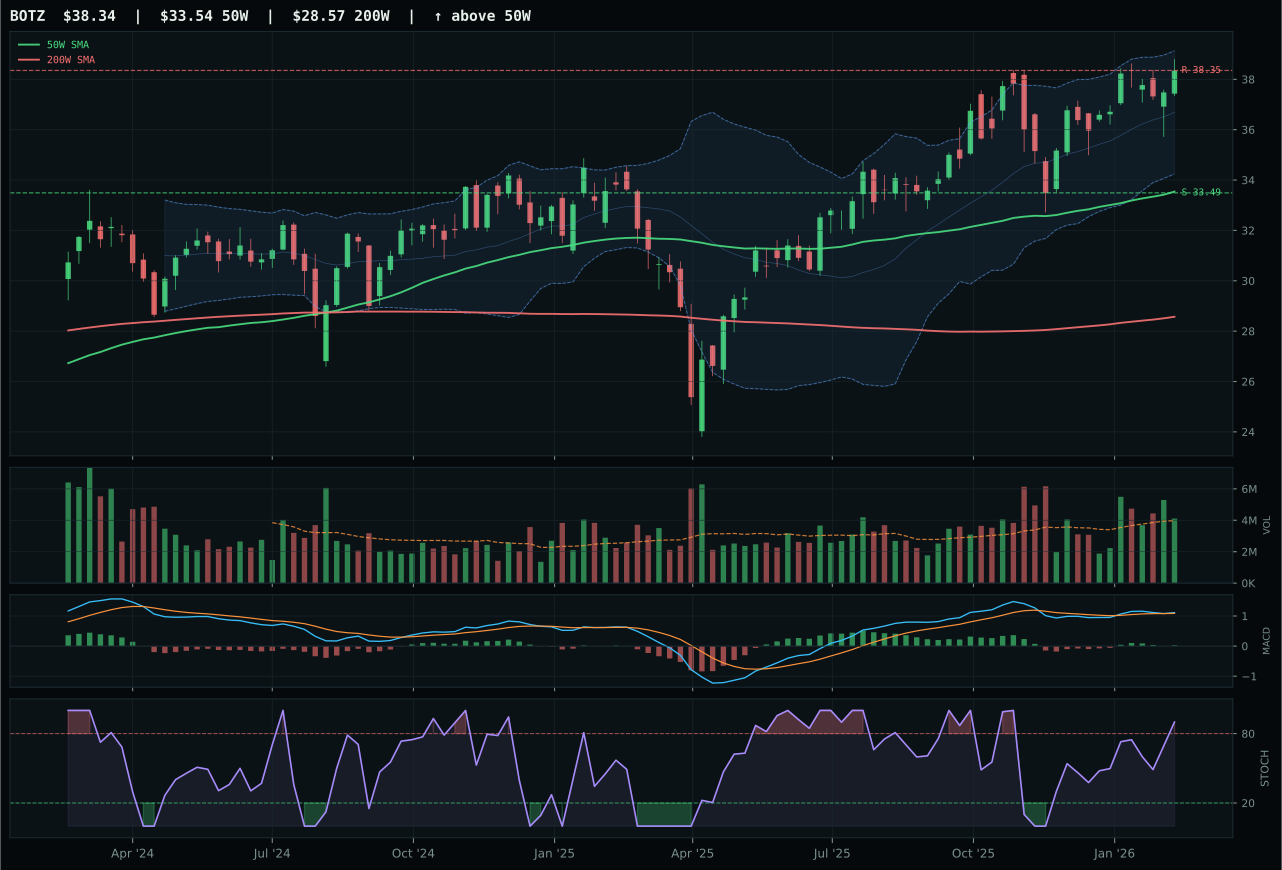
BOTZ has a neutral structure profile with 7.6% 13-week relative strength versus SPY.
A failed hold above support would weaken the setup.
Actionable but governed by invalidation levels.
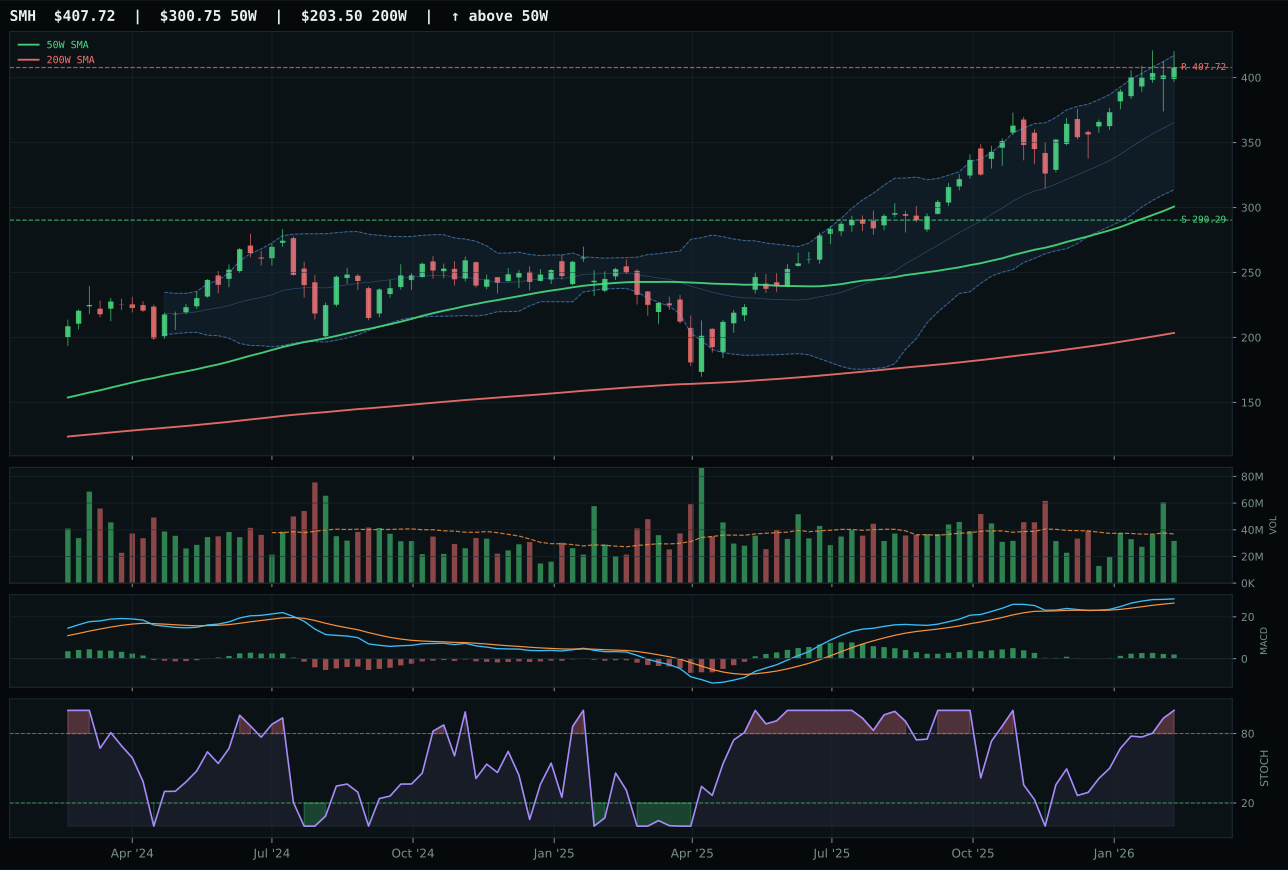
SMH has a vertical extension profile with 16.7% 13-week relative strength versus SPY.
A failed hold above support would weaken the setup.
Actionable but governed by invalidation levels.
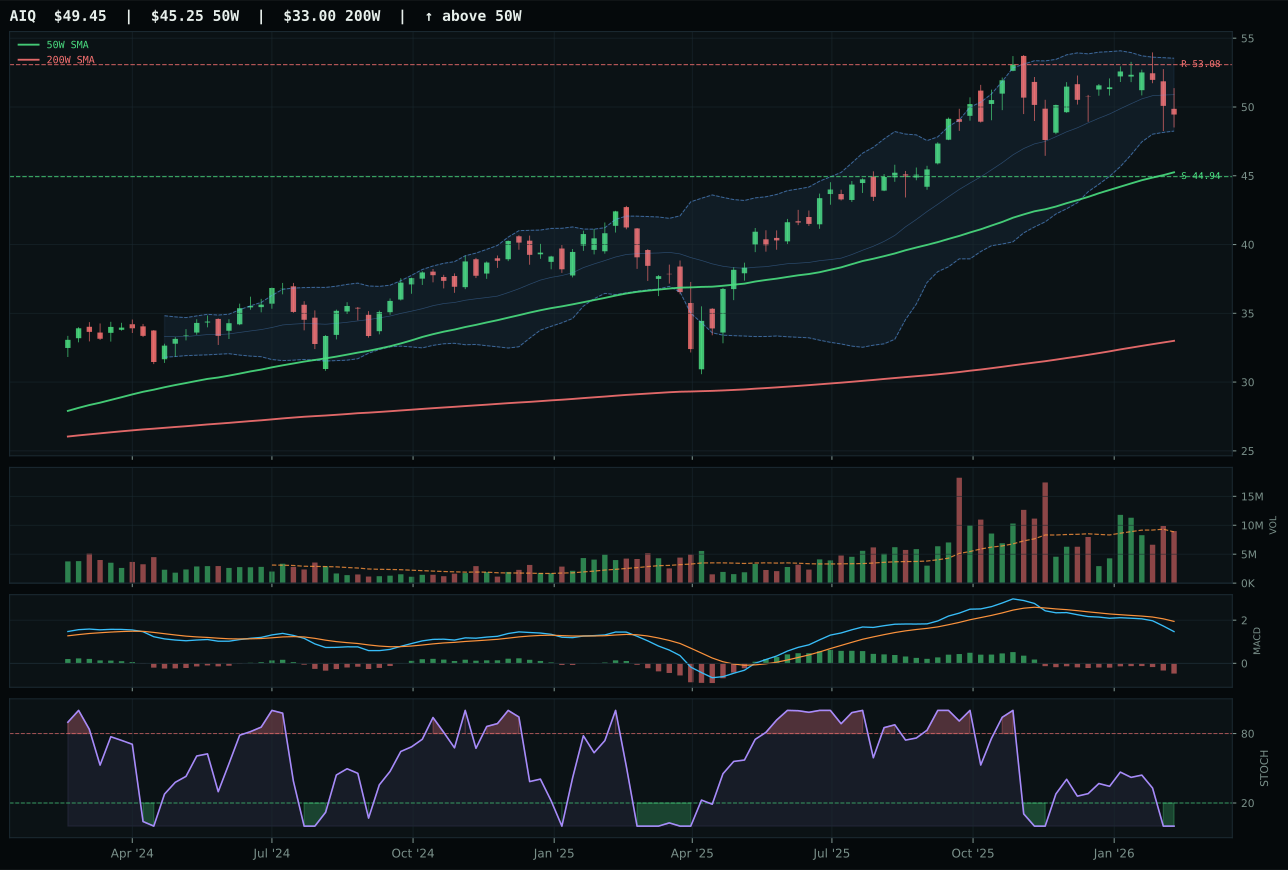
AIQ has a neutral structure profile with -2.9% 13-week relative strength versus SPY.
A failed hold above support would weaken the setup.
Actionable but governed by invalidation levels.
BOTZ wins with a perfect 100 trend score and 7.6% SPY-relative return while staying only 14.3% above the 50-week line—a rare combination of leadership without maximum overextension. SMH's 16.7% relative strength looks superior until you see it lives 35.6% above the 50W, meaning every fresh buyer paid a vastly higher entry tax for nearly identical MACD behavior (bullish but flattening in both cases). BOTZ's 54.0 timing score versus SMH's 32.0 isn't semantic; it measures how much runway remains before margin pressure hits the momentum traders. The real edge: BOTZ sits in a cleaner structure (76.8 vs neutral is tighter) with better risk-reward geometry, giving it the quality setup that macro strength alone cannot buy.
AI earned 10% allocation despite a 72.4 category score because it ranks behind energy and metals in the current macro regime. The AI growth sponsorship descriptor fires at +14 points for SMH and +5 for BOTZ, yet the Risk-On environment still weights energy scarcity and commodity breadth more heavily. Both leading contenders face identical timing pressure: SMH is already 35.6% extended, BOTZ sits at 14.3% extension. The category would move into top-2 if either credit stress reversed (it's currently penalizing AI at -8 points) or if the liquidity expansion macro shifted to explicitly favor capex-intensive computing. Until then, AI holds its allocation as the strongest technical name in a category that macro headwinds are keeping contained relative to harder commodities.
Nuclear Energy — URNM
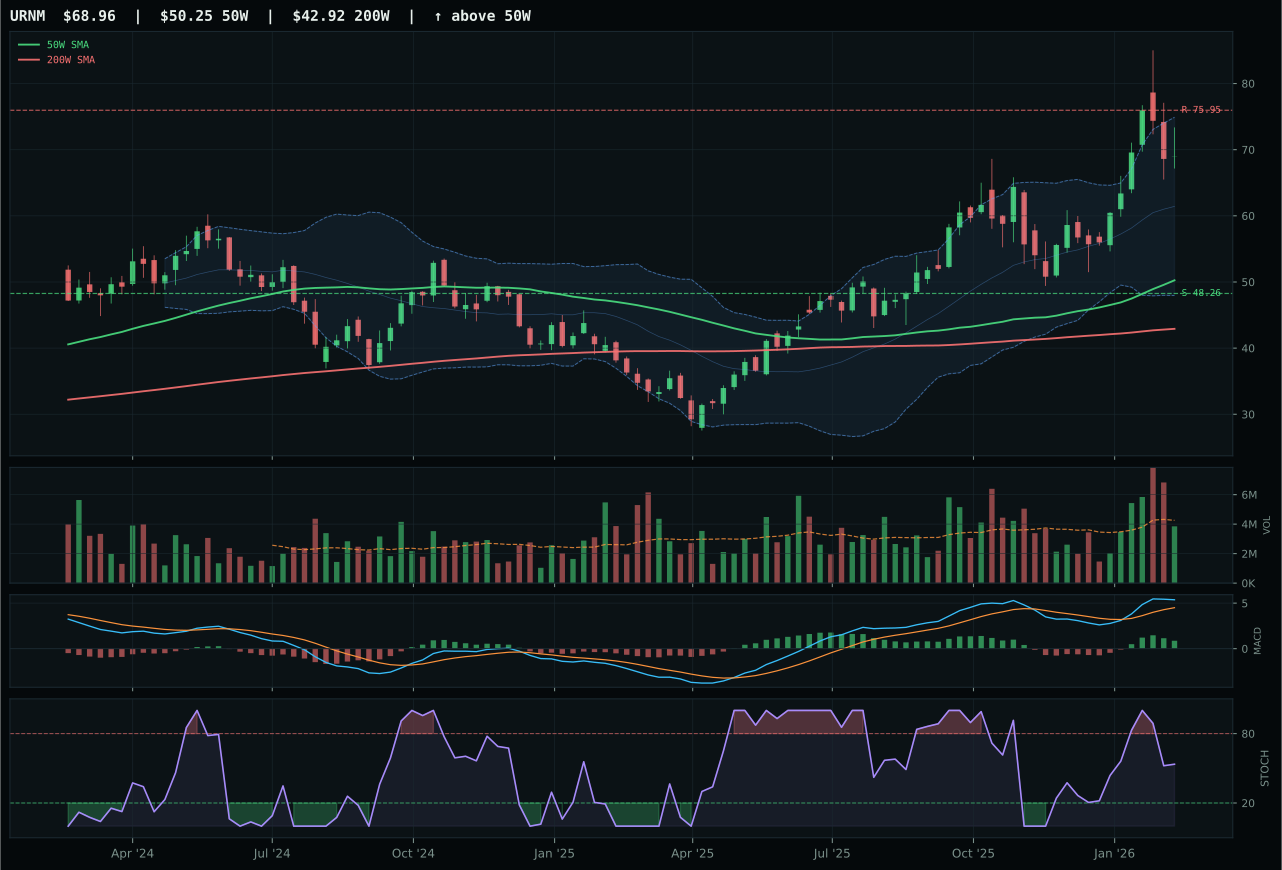
URNM has a vertical extension profile with 26.1% 13-week relative strength versus SPY.
A failed hold above support would weaken the setup.
Actionable but governed by invalidation levels.
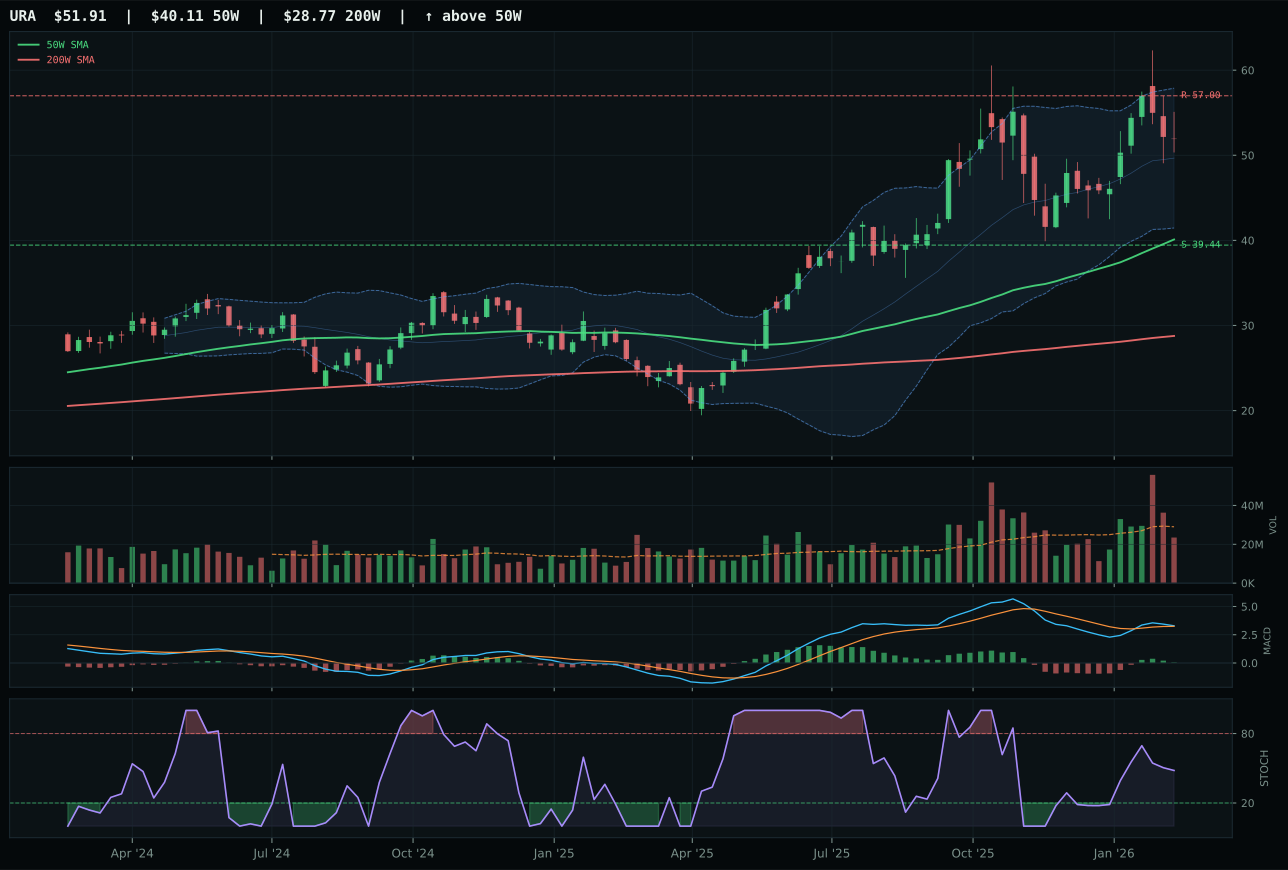
URA has a vertical extension profile with 14.5% 13-week relative strength versus SPY.
A failed hold above support would weaken the setup.
Actionable but governed by invalidation levels.
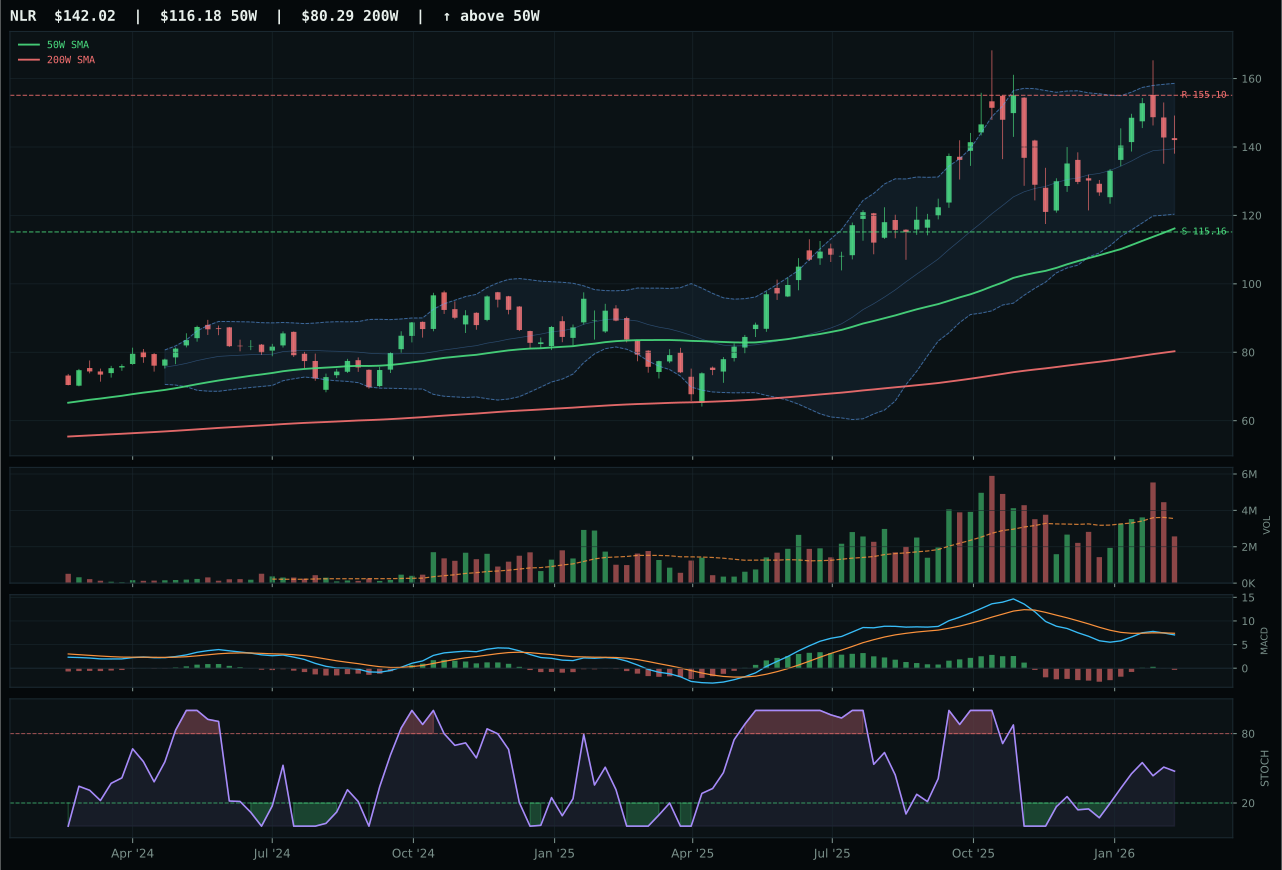
NLR has a vertical extension profile with 8.7% 13-week relative strength versus SPY.
A failed hold above support would weaken the setup.
Actionable but governed by invalidation levels.
URNM wins a tight race against URA (1.9-point margin) with superior category-relative strength (11.6% versus 0.0%) and cleaner structure (70.3 versus 64.8), despite both sitting in identical vertical extension at the same distance from the 50W. URNM's 100 momentum confirmation backed by 27.6% 13-week return and bullish-improving MACD reveals uranium-miner names are attracting fresh institutional allocation, while URA's equally bullish setup struggles to maintain relative advantage. Both trade at dangerous extension (37.2%), yet URNM's volume-price confirmation (78.9%) edges URA's lower reading, suggesting URNM's move carries more structural sponsorship. The category-relative strength divergence—12.5% versus 0%—is the tiebreaker; in a category this extended, only the name with visible insider or institutional accumulation deserves the allocation.
Nuclear Energy earned 10% because while the technical setup (69.1 category score) is strong, the macro support remains nascent relative to energy and metals. Energy scarcity (+9), real asset sponsorship (+7), and AI growth sponsorship (+5 for URNM specifically) provide genuine tailwinds, yet the category's 74.0 macro fit trails both energy (85.0) and industrial metals (73.0). More critically, URNM's 37.2% extension above the 50W paired with -9.2% upside-to-resistance ratio means the risk-reward is inverted; every dollar gained requires betting against mean reversion. The category would advance to 20% if uranium production capacity constraints became consumer-visible (data center demand, electrification capex acceleration) or if energy prices corrected, making nuclear's cost advantage more obvious. Until then, URNM holds a satellite allocation as a real-asset play without yet proving sufficient macro urgency.
Precious Metals — GLD
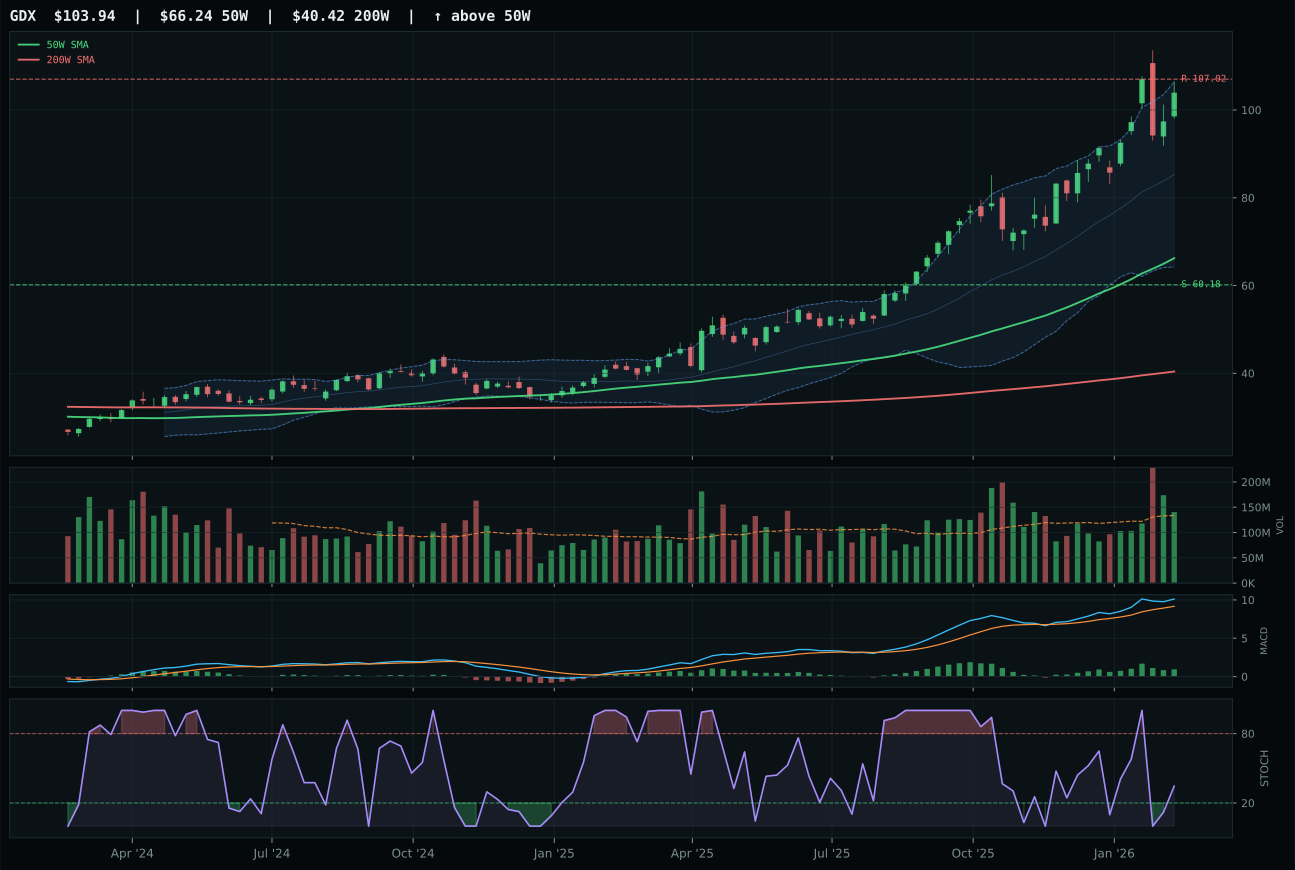
GDX has a vertical extension profile with 35.0% 13-week relative strength versus SPY.
A failed hold above support would weaken the setup.
Actionable but governed by invalidation levels.
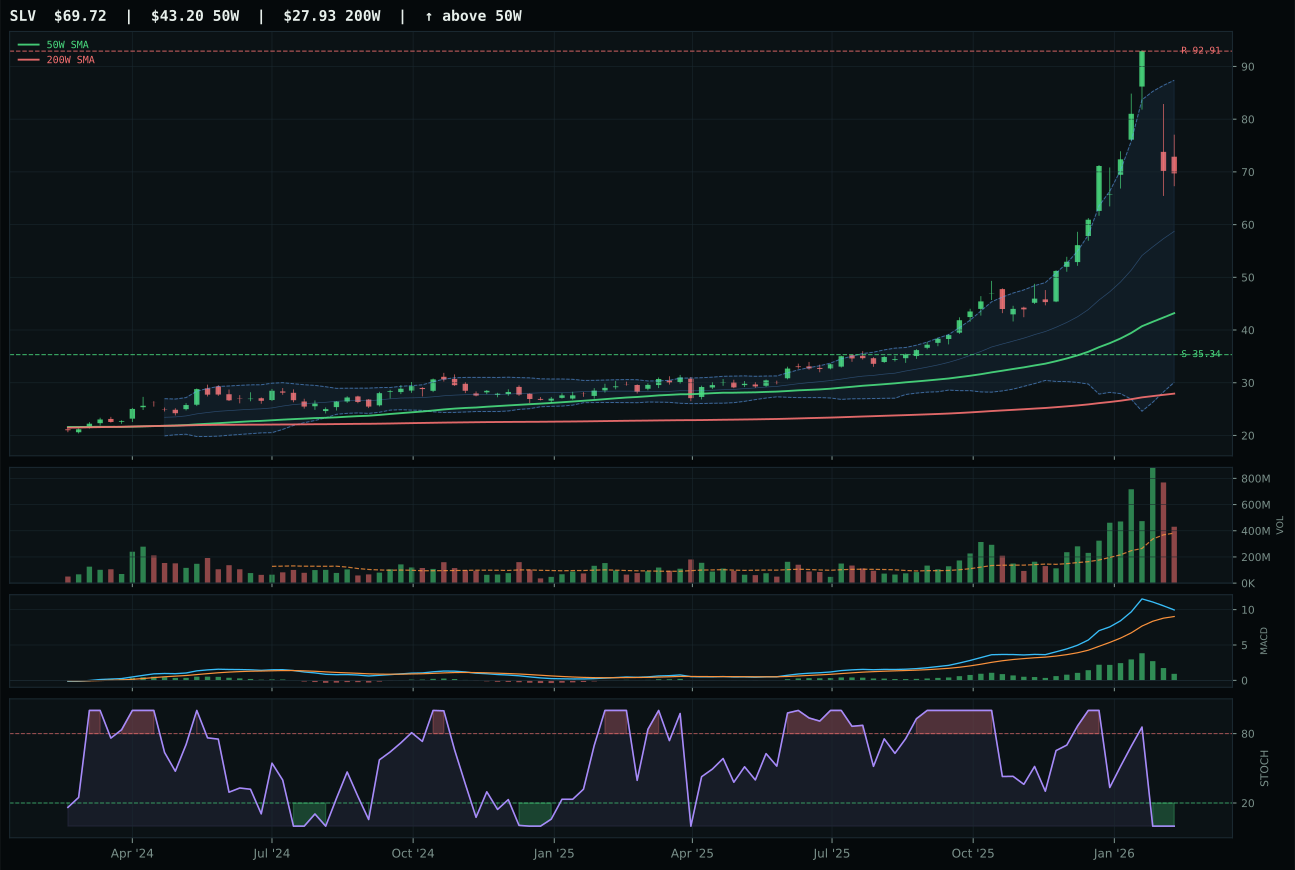
SLV has a vertical extension profile with 50.2% 13-week relative strength versus SPY.
A failed hold above support would weaken the setup.
Actionable but governed by invalidation levels.
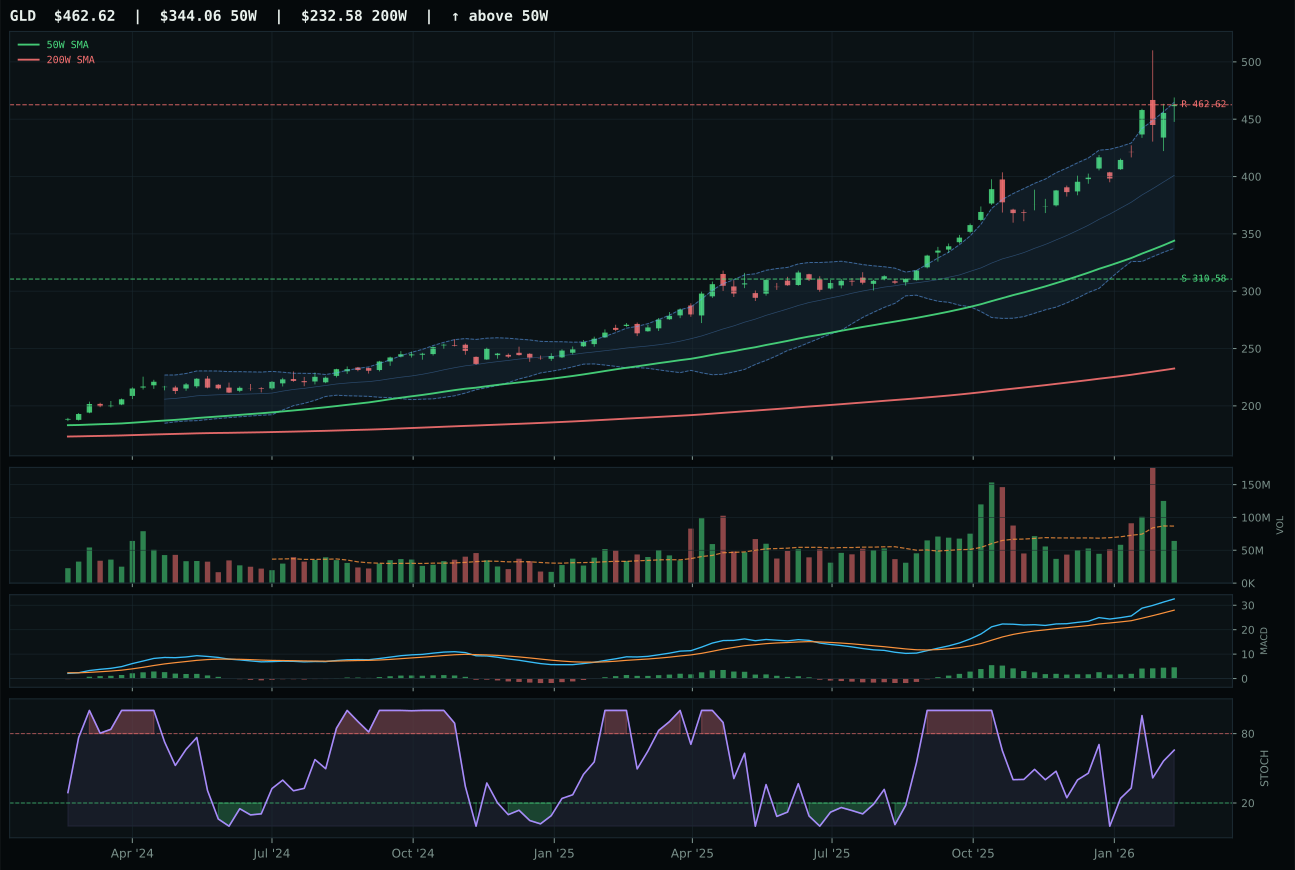
GLD has a vertical extension profile with 21.6% 13-week relative strength versus SPY.
A failed hold above support would weaken the setup.
Actionable but governed by invalidation levels.
GLD wins a razor-thin decision over GDX with superior MACD confirmation (bullish and improving versus bullish but flattening) despite living at an extreme 34.5% extension above the 50W. The real technical edge: GLD's 53.0 timing score versus GDX's 48.0 reflects better Fibonacci positioning and momentum mechanics, not just distance metrics. GDX's 35.0% relative strength looks superior until you measure the cost: GDX sits 56.9% above the 50W, forcing every buyer to assume catastrophic downside risk. GLD's structure cleanliness of 76.2 versus GDX's 74.7, combined with thin-but-orderly volume (0.74x), suggests this extension is held by longer-dated accumulation rather than panic-chase buying. The 2.6-point score gap barely masks a category where both leaders are extended; GLD simply arrived there with better sponsorship.
Precious Metals earned 10% allocation because the monetary hedge bid (+14 macro points) and defensive rotation (+6) are real, but risk appetite positive still carries -4 points, restraining category enthusiasm. GLD's 100 momentum confirmation backed by 21.6% SPY-relative return shows genuine strength, yet the category's 61.0 macro fit trails energy (85.0) and metals (73.0) dramatically. The Risk-On environment actively penalizes traditional safe-haven assets; gold is rising because credit stress exists, not because growth has disappeared. The category would move to 20% if either credit spreads widened sharply or equity volatility spiked above fear thresholds. Until then, gold holds a defensive allocation anchored to hedging rather than return generation, justified by the monetary hedge signal but capped by a macro regime that still favors risk-assets.
Defense & Aerospace — ITA
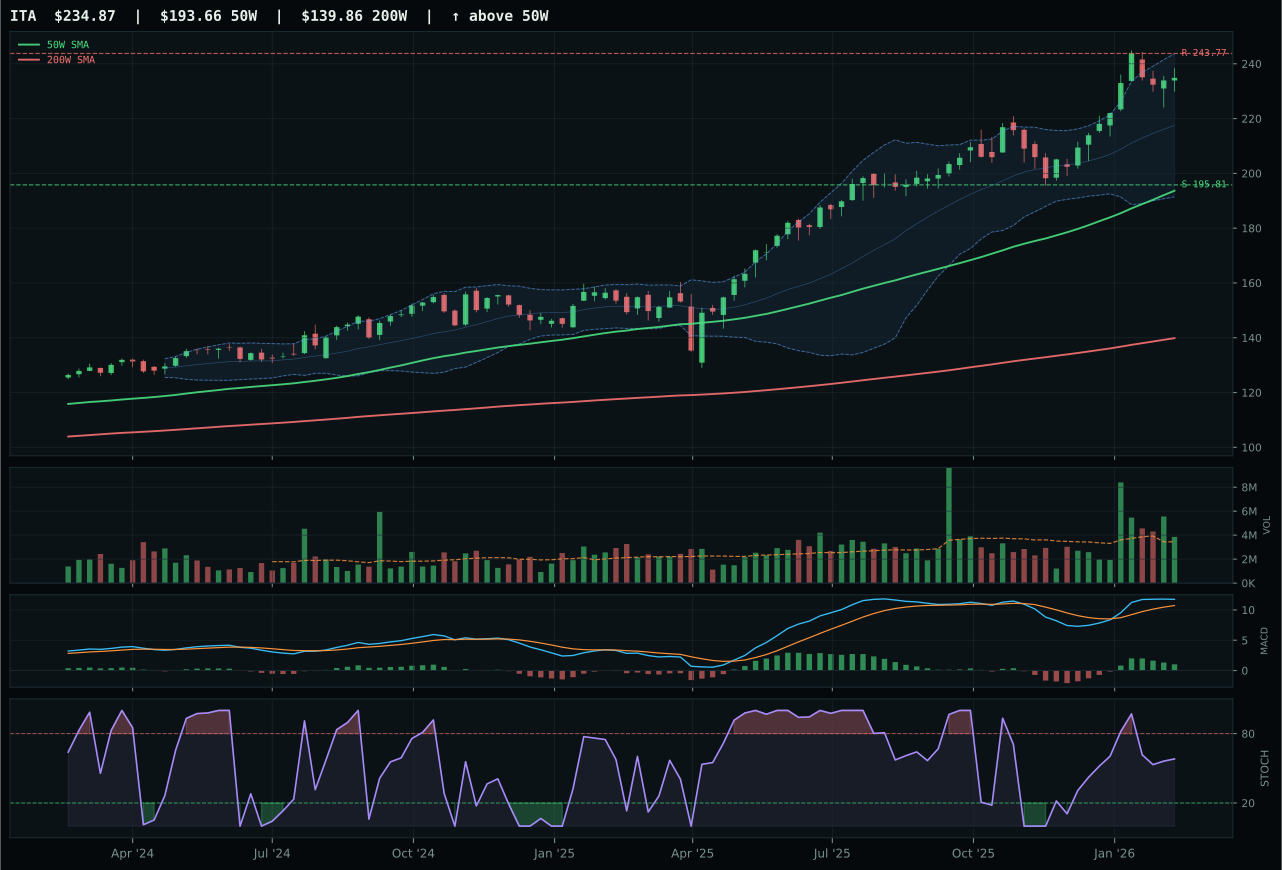
ITA has a vertical extension profile with 12.6% 13-week relative strength versus SPY.
A failed hold above support would weaken the setup.
Actionable but governed by invalidation levels.
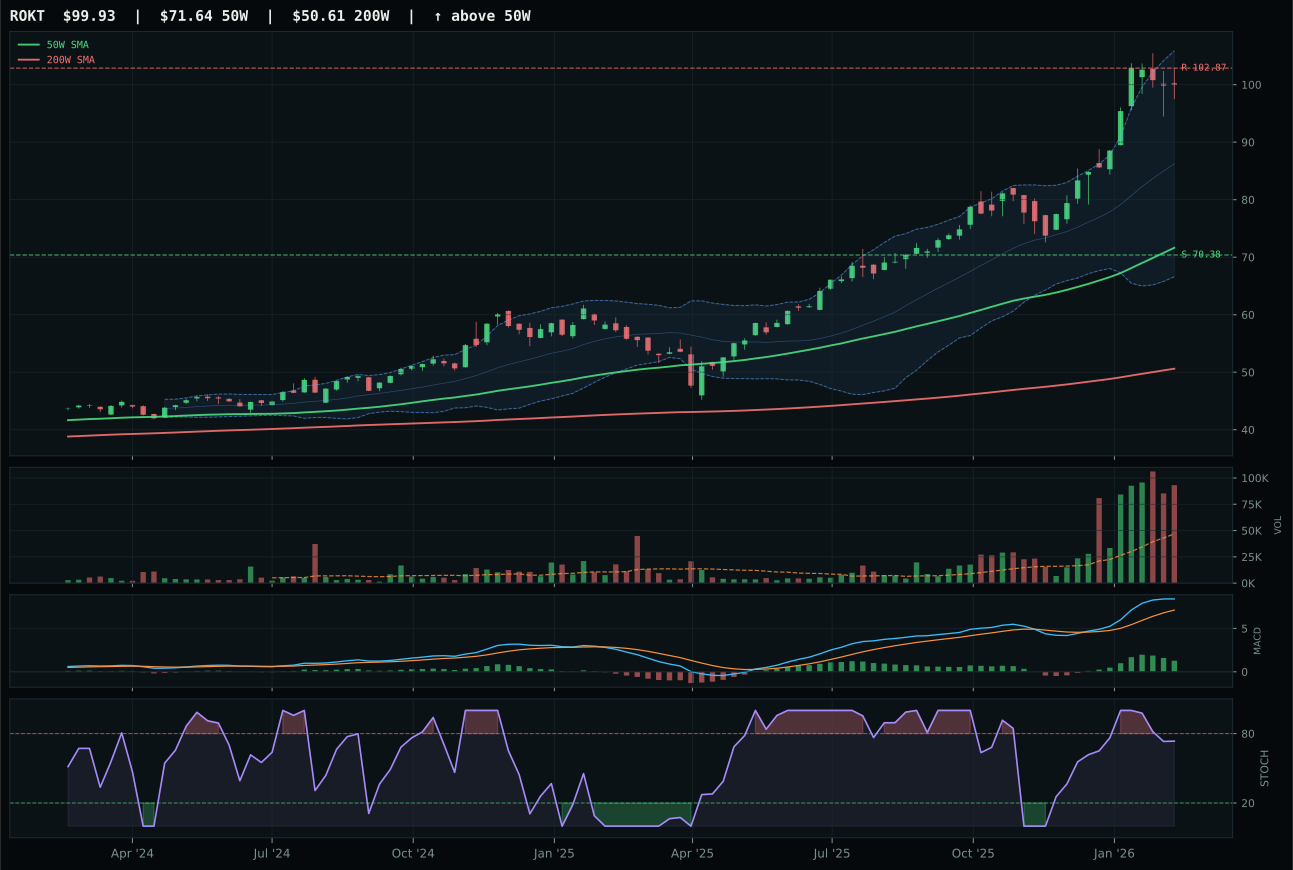
ROKT has a vertical extension profile with 29.6% 13-week relative strength versus SPY.
A failed hold above support would weaken the setup.
Tracked, but not top-2 eligible because: .
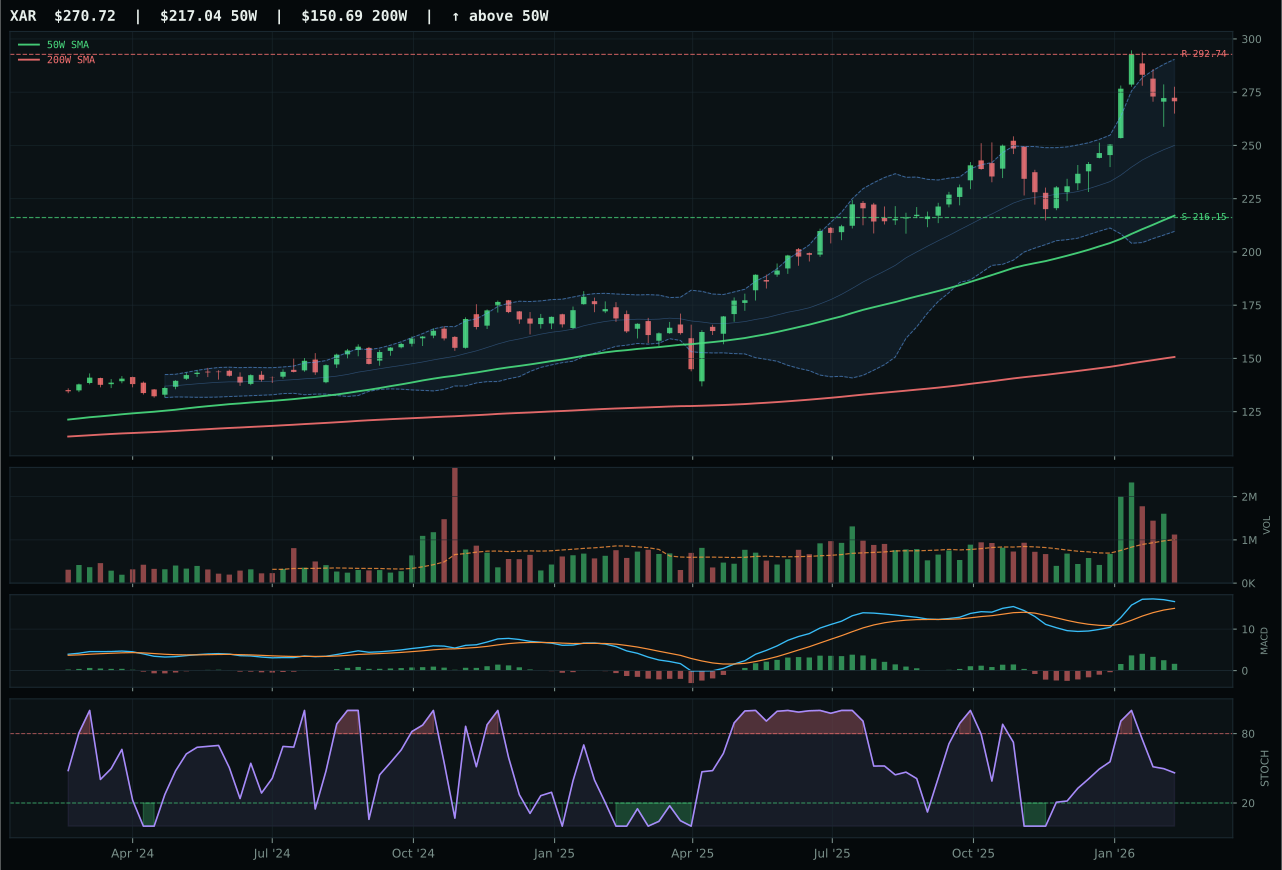
XAR has a vertical extension profile with 17.3% 13-week relative strength versus SPY.
A failed hold above support would weaken the setup.
Actionable but governed by invalidation levels.
ITA wins the category despite being more extended (21.3% vs 39.5% for ROKT) because timing and structure matter more than stretch in a bullish regime. ITA's 40.0 timing score reflects a still-viable entry window—ROKT at the same 40.0 is illusory because it's already paid the price of 39.5% extension. ITA's 81.8 structure score, driven by vertical extension cleanliness and tighter compression, reveals which move is being accumulated versus which is running on fumes. ROKT's 29.6% category-relative strength appears dominant until you realize it's pure momentum beta without the institutional foundation ITA carries. The score gap of 23.4 points collapses the apparent margin: ROKT is a stretched trade, ITA is a managed uptrend.
Defense & Aerospace earned 10% because the category's 60.9 score ranks well outside the top-2 threshold in a macro environment that rewards energy and industrial metals far more. Defensive rotation is actively supporting this category at +8 macro points, yet it's insufficient to overcome the dominance of real-asset scarcity themes. The category would advance into 10% allocation only if credit stress reversed sharply (currently a -6 headwind for ITA) or if risk appetite collapsed, triggering genuine flight-to-quality. For now, ITA's 12.6% SPY outperformance and clean vertical extension warrant the 10% anchor, but macro regime positioning keeps it behind energy and metals where supply constraints carry higher real-economy cost.
Agriculture & Livestock — MOO
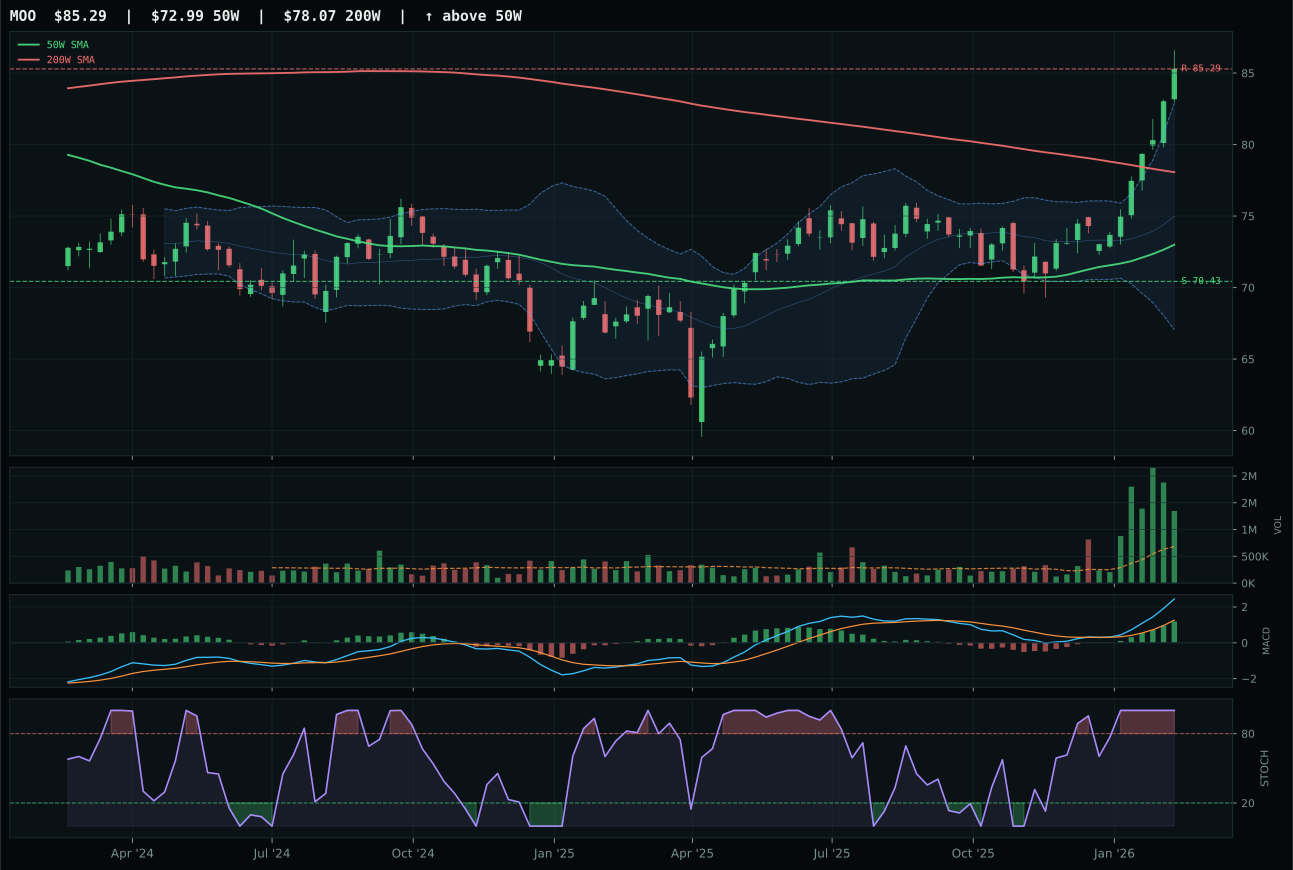
MOO has a vertical extension profile with 16.7% 13-week relative strength versus SPY.
A failed hold above support would weaken the setup.
Actionable but governed by invalidation levels.
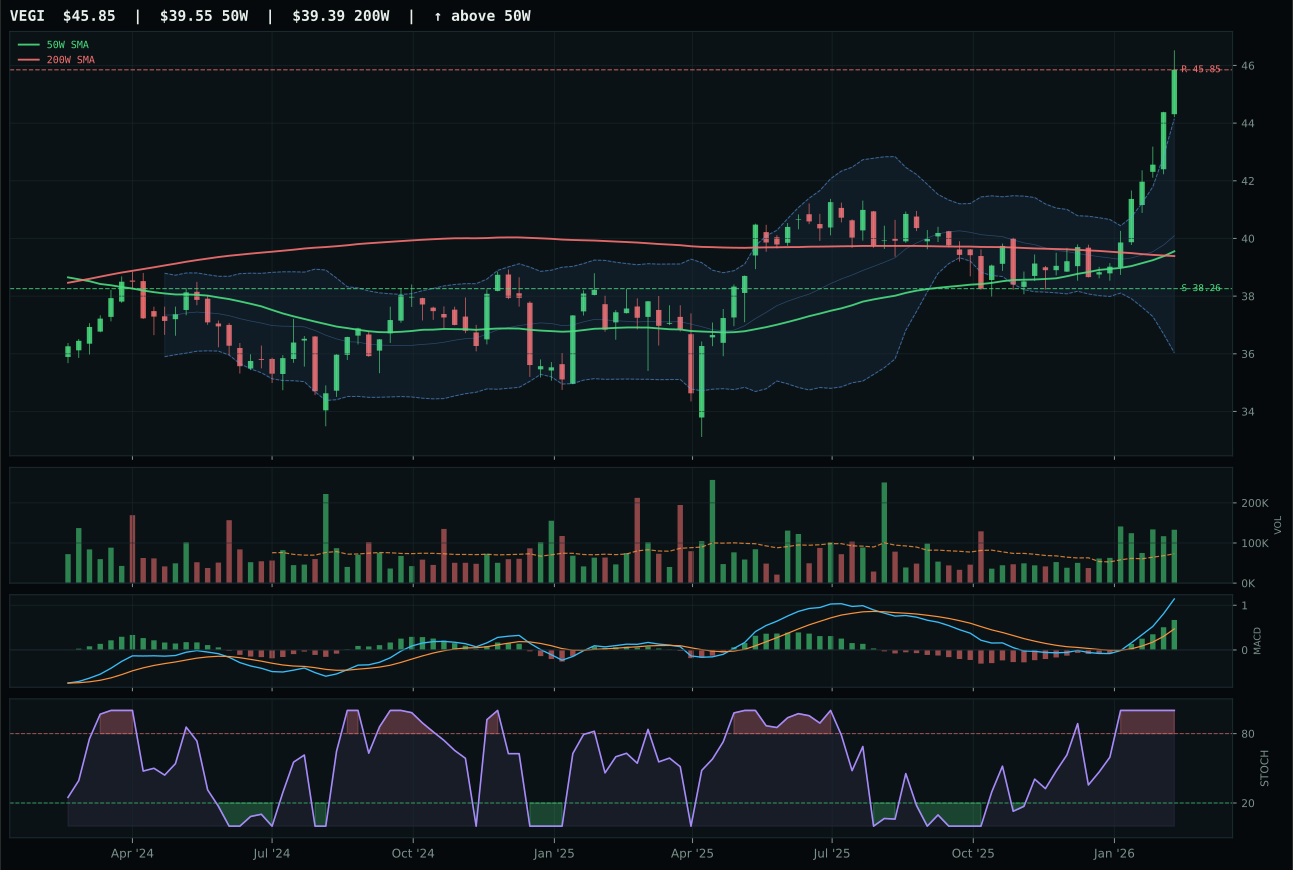
VEGI has a vertical extension profile with 15.7% 13-week relative strength versus SPY.
A failed hold above support would weaken the setup.
Tracked, but not top-2 eligible because: .
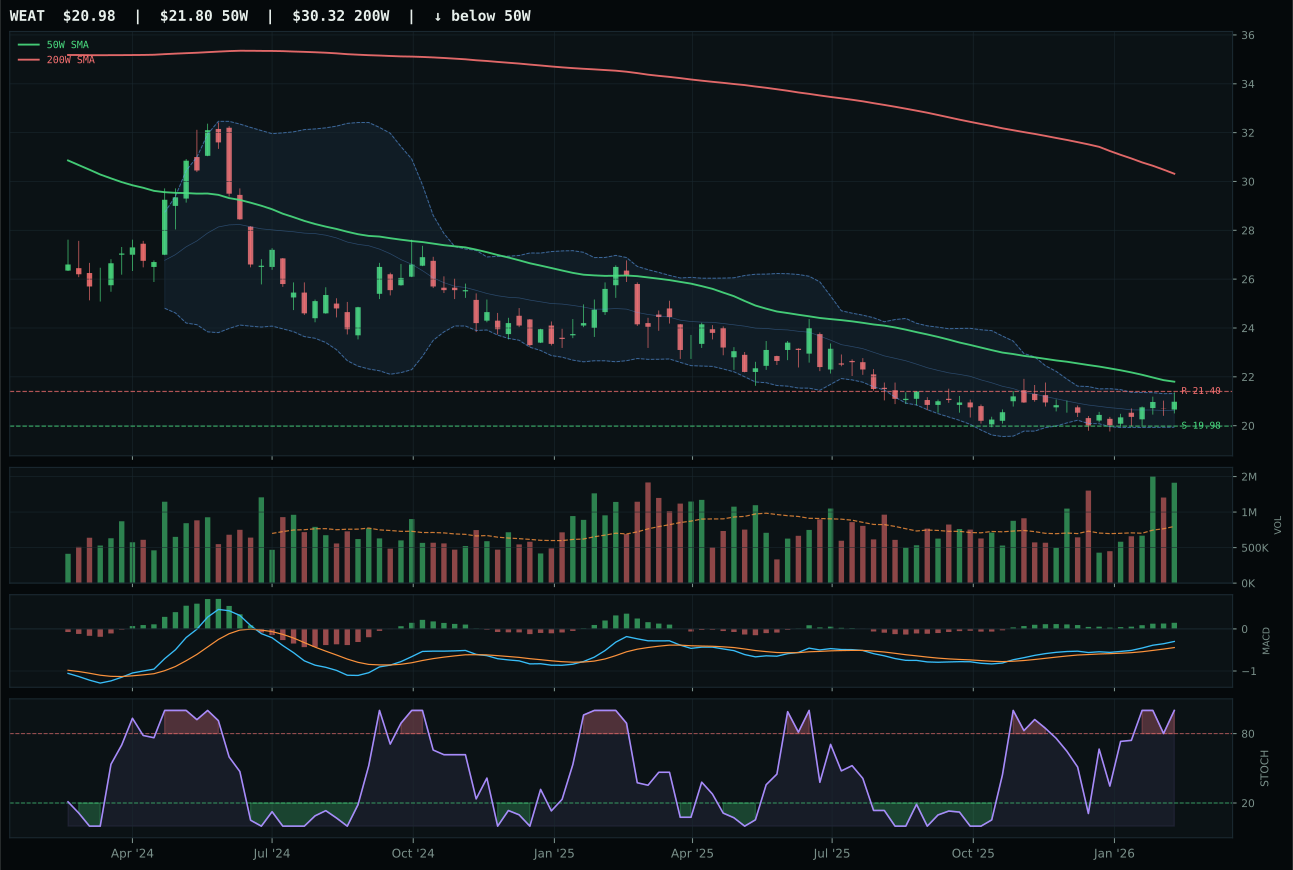
WEAT has a neutral structure profile with -1.8% 13-week relative strength versus SPY.
Extension and support failure are the main tactical risks.
Tracked, but not top-2 eligible because: structurally broken.
MOO crushes this category with perfect 100 scores in both momentum confirmation and trend, backed by 1.97x volume participation—the only ETF in this space where accumulation is visibly occurring. VEGI's near-identical momentum and MACD readings cannot overcome its 0.0% category-relative strength, a technical failure that signals MOO alone is attracting fresh capital. MOO's 18.2% 13-week return and bullish-improving MACD diverge sharply from WEAT's moribund -0.3% performance, yet VEGI splits the difference without earning either the volume or the relative strength. The 19.5-point score separation reflects MOO's monopoly on institutional sponsorship in this category; every other candidate is technically sound but commercially abandoned.
Agriculture & Livestock scores 50.0 and receives 0% allocation, ranking 9th or 10th among the ten categories. The macro fit is exceptional at 86.0—supply shortage is active at +13, inflation pressure at +10, and real asset sponsorship at +8—yet the category still loses the capital allocation race. The reason is entry risk asymmetry: MOO's momentum confirmation of 100.0 is perfect, but timing is only 37.0 because the chart is already extended to 16.8% above the 50W with stochastic RSI pegged at overbought and upside to resistance near 0.0%. In a regime where energy (86.5), metals (75.6), and emerging markets (73.9) offer better risk/reward setups, agricultural commodities cannot justify a top-tier allocation despite macro tailwinds. The category would need a pullback to reset entry risk, or a commodity breadth divergence that shows agriculture lagging metals despite equal supply-shock sponsorship, to earn a position above 0%.
Technology — XLK
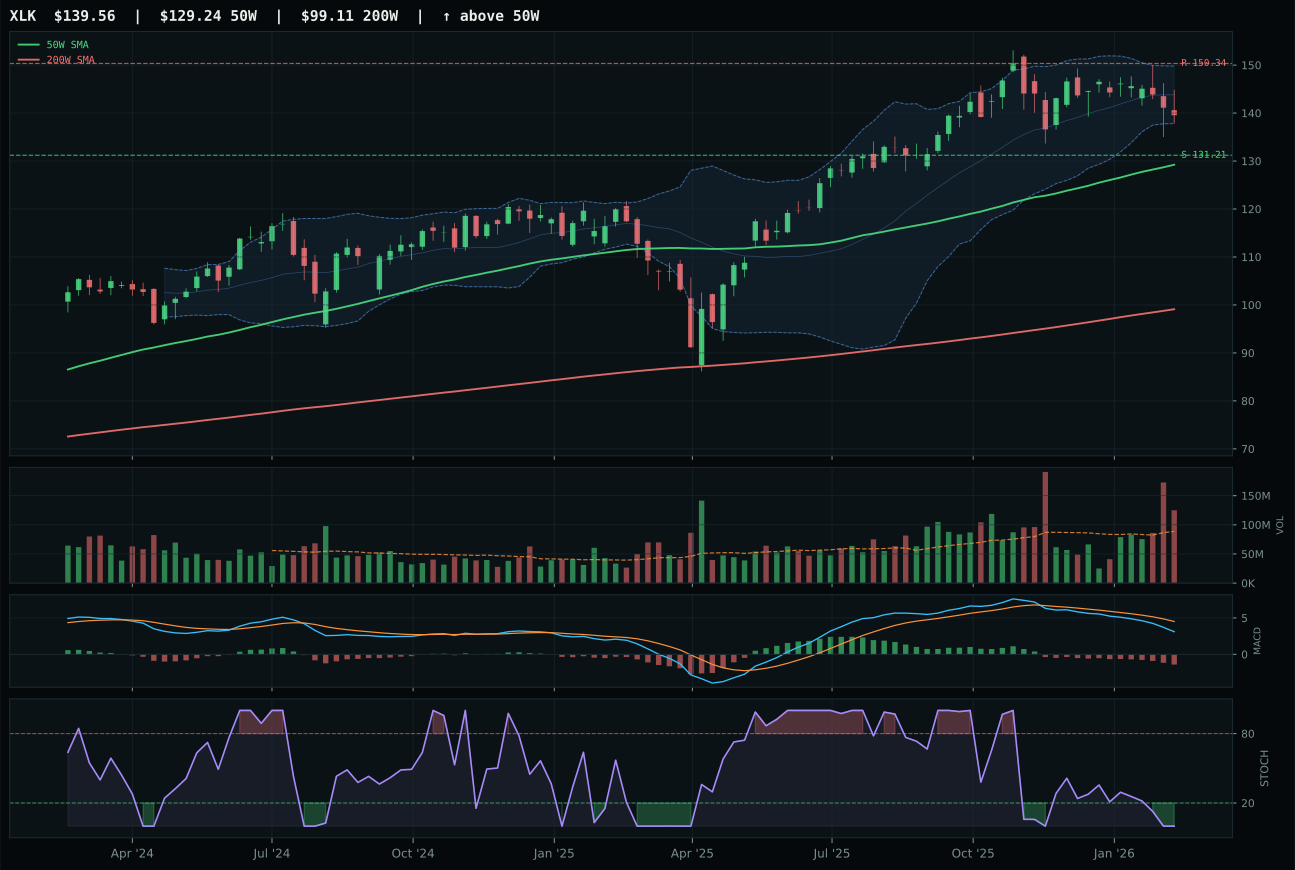
XLK has a neutral structure profile with -4.6% 13-week relative strength versus SPY.
A failed hold above support would weaken the setup.
Actionable but governed by invalidation levels.
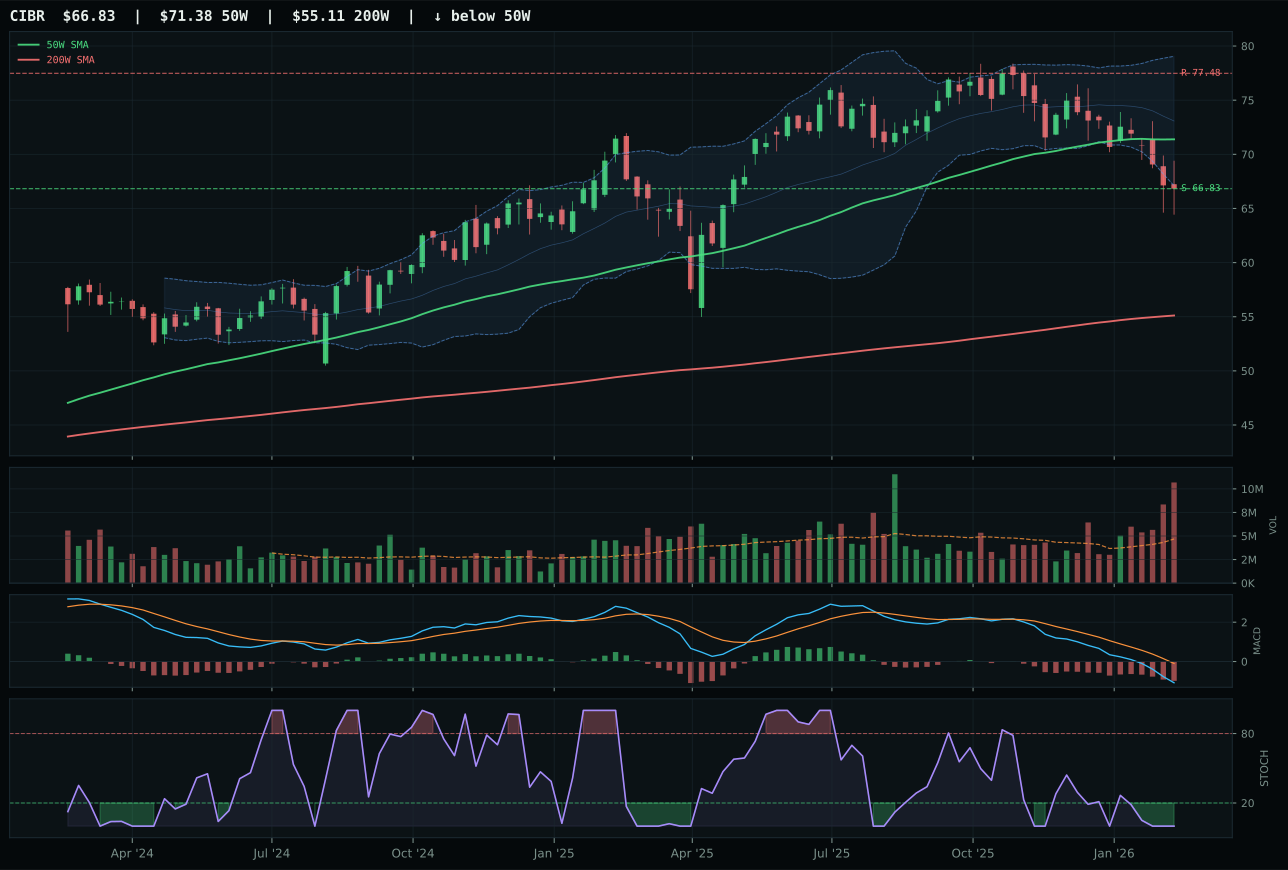
CIBR has a pullback into support profile with -12.0% 13-week relative strength versus SPY.
A failed hold above support would weaken the setup.
Actionable but governed by invalidation levels.
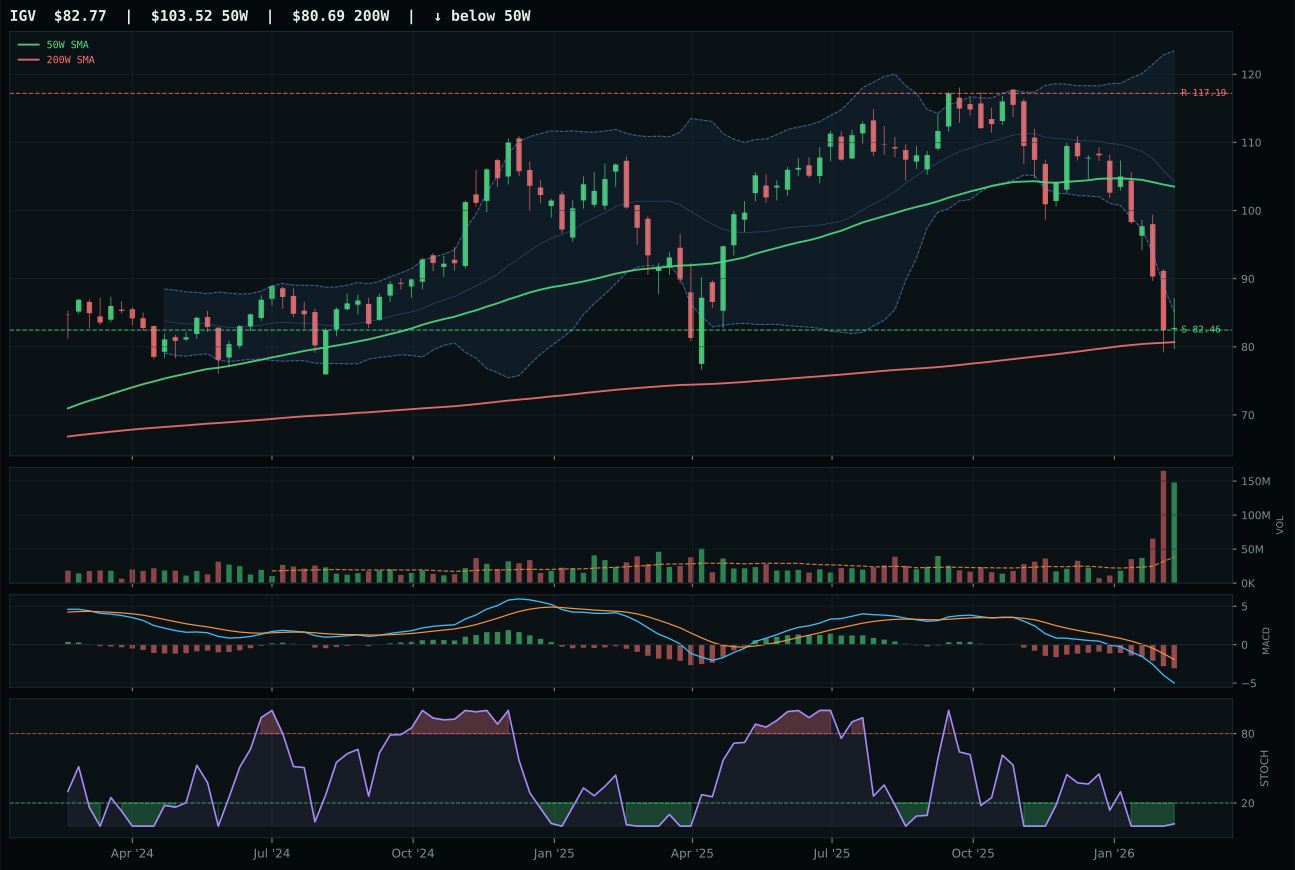
IGV has a pullback into support profile with -24.4% 13-week relative strength versus SPY.
A failed hold above support would weaken the setup.
Actionable but governed by invalidation levels.
XLK wins the category because it owns the only above-average volume participation in a field where all three candidates are fighting weak momentum and deteriorating breadth. While CIBR sits lower in support with better timing scores, its distribution pressure on volume and -12.0% relative strength versus SPY tell a different story: fewer institutional hands are willing to accumulate at current levels. XLK's 7.4% category-relative strength combined with neutral structure and 1.41x average volume participation proves this is the only name buyers are defending. The 22.8-point gap to CIBR reflects not marginal technical differences but a clear divergence in sponsorship; one ETF is being purchased into weakness, the other rejected into it.
Technology ranks 9th among the ten categories this week and receives 0% allocation. A 35.6 final score cannot compete in a risk-on liquidity expansion regime where energy, metals, and emerging-market currencies are capturing the capital flows. The category's macro fit is only 73.0/100—dragged down by active credit stress and weak risk-appetite sponsorship for pure software and semiconductor names. While XLK's trend score of 75.1 and structure of 71.4 are solid on their own, the momentum confirmation of just 33.0 reveals the real problem: this category is posting negative thirteen-week returns (-3.1%) and losing to SPY. In a regime where real assets and cyclicals are advancing hard, technology's defensive posture and valuation-sensitive nature place it outside the allocation entirely. A meaningful shift would require SPY-relative momentum to turn positive or category-relative strength to consolidate above peers, neither of which shows evidence this week.