
2026-02-06
Informational purposes only. The content in this report, including allocations, analysis, and commentary, is provided solely for informational and educational purposes. It does not constitute financial advice, investment advice, trading advice, or any other type of advice. Past performance does not guarantee future results. Always conduct your own research and consult a qualified financial professional before making investment decisions.
Weekly Allocation
| Ticker | Category | Weight | Role |
|---|---|---|---|
| XLE | Traditional Energy | 20% | Top-2 (20%) |
| ILF | Emerging Markets | 20% | Top-2 (20%) |
| COPX | Industrial Metals | 10% | Tier-2 (10%) |
| URNM | Nuclear Energy | 10% | Tier-2 (10%) |
| GLD | Precious Metals | 10% | Tier-2 (10%) |
| PAVE | Utilities & Infrastructure | 10% | Tier-2 (10%) |
| SMH | AI | 10% | Tier-2 (10%) |
| MOO | Agriculture & Livestock | 10% | Tier-2 (10%) |
Trade Instructions — Monday Open
Sell the tranche from 2026-01-09 (completing its 4-week hold). Buy the new tranche. Instructions show net portfolio changes — same-asset positions cancel, weight changes show the delta.
| Action | Ticker | Instruction |
|---|---|---|
| SELL | REMX | Sell 33% of REMX position (reduce 15.00% → 10.00%) |
| SELL | SMH | Sell 17% of SMH position (reduce 15.00% → 12.50%) |
| SELL | IEMG | Sell 50% of IEMG position (reduce 5.00% → 2.50%) |
| SELL | SLV | Sell 33% of SLV position (reduce 7.50% → 5.00%) |
| SELL | XAR | Sell 33% of XAR position (reduce 7.50% → 5.00%) |
| SELL | XLK | Sell entire XLK position (2.50% of portfolio) |
| BUY | XLE | Buy XLE — 28.57% of freed cash (adds 5.00% to portfolio) |
| BUY | ILF | Buy ILF — 28.57% of freed cash (adds 5.00% to portfolio) |
| BUY | MOO | Buy MOO — 14.29% of freed cash (adds 2.50% to portfolio) |
| BUY | COPX | Buy COPX — 14.29% of freed cash (adds 2.50% to portfolio) |
| BUY | GLD | Buy GLD — 14.29% of freed cash (adds 2.50% to portfolio) |
Current Portfolio After Trade
Combined holdings across all 4 active tranches. Each tranche is 25% of the portfolio.
| Ticker | % of Portfolio | Weight Bar |
|---|---|---|
| XLE | 17.50% | |
| SMH | 12.50% | |
| REMX | 10.00% | |
| URNM | 10.00% | |
| ILF | 7.50% | |
| MOO | 7.50% | |
| COPX | 7.50% | |
| SLV | 5.00% | |
| XAR | 5.00% | |
| XLU | 5.00% | |
| GLD | 5.00% | |
| IEMG | 2.50% | |
| IGF | 2.50% | |
| PAVE | 2.50% |
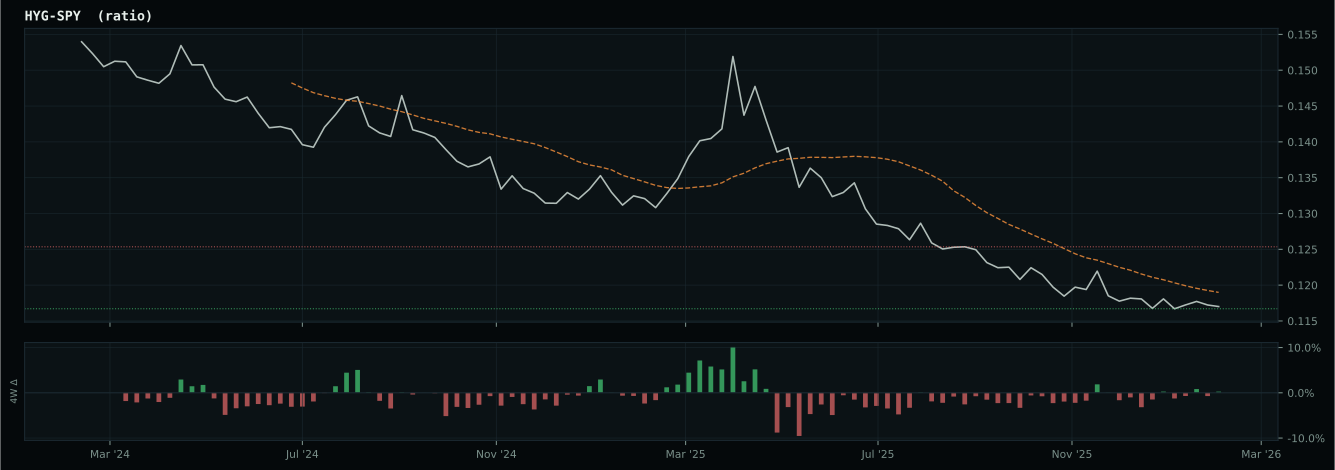
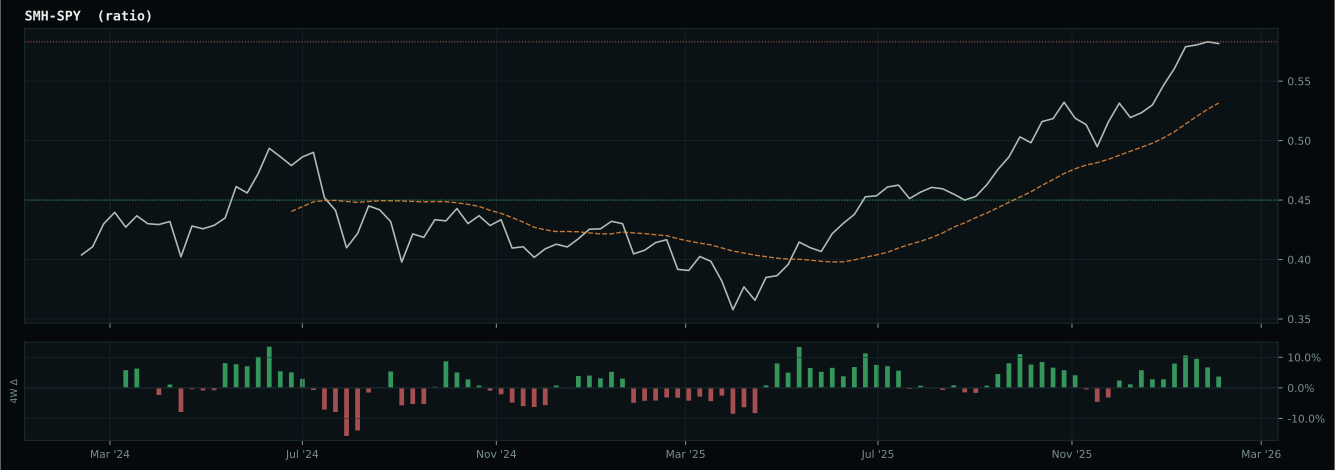
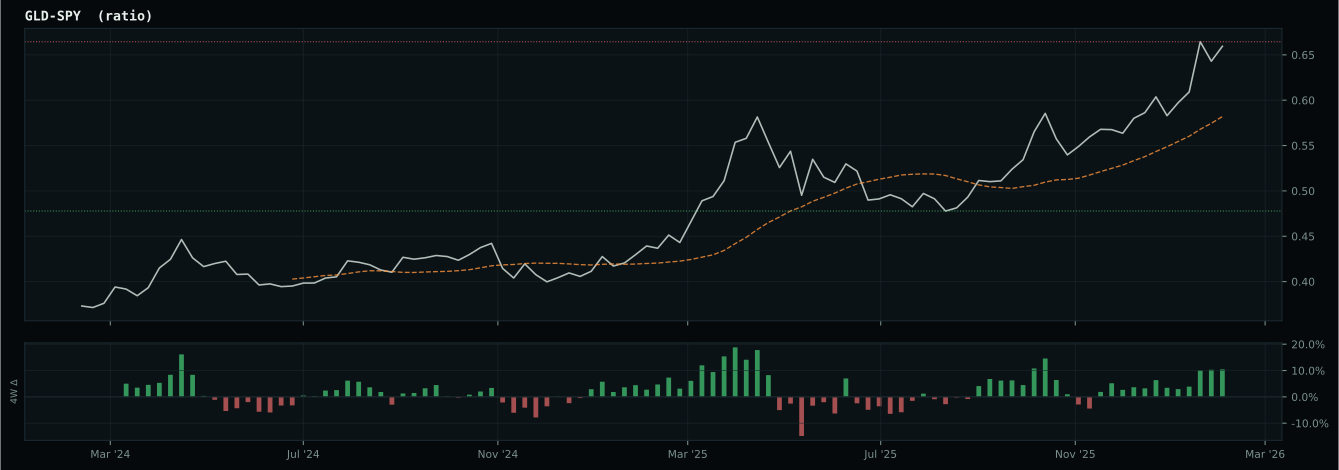
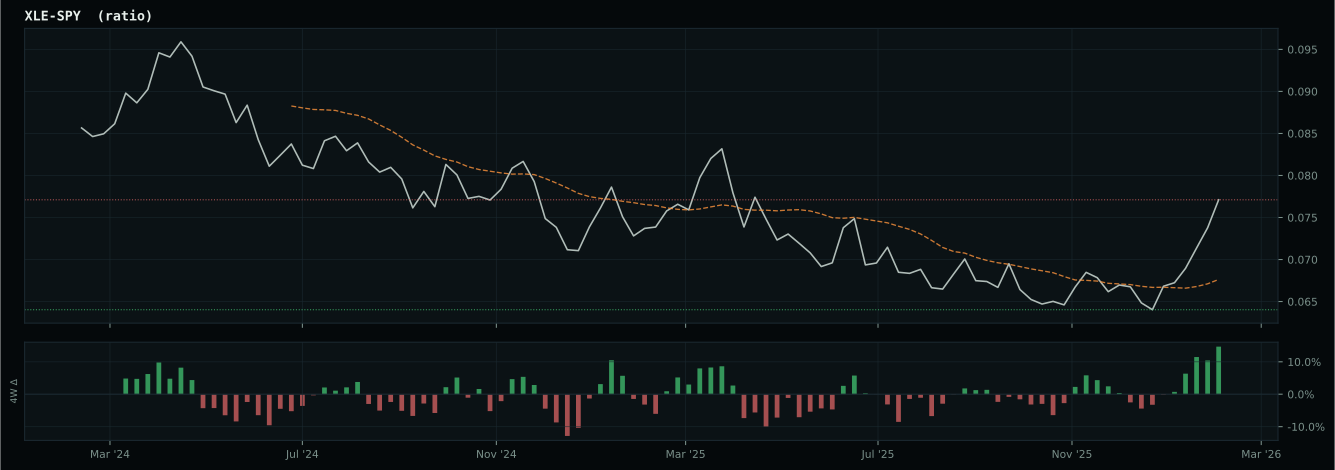
Macro Regime — Risk-On Liquidity Expansion
Macro Evidence Charts
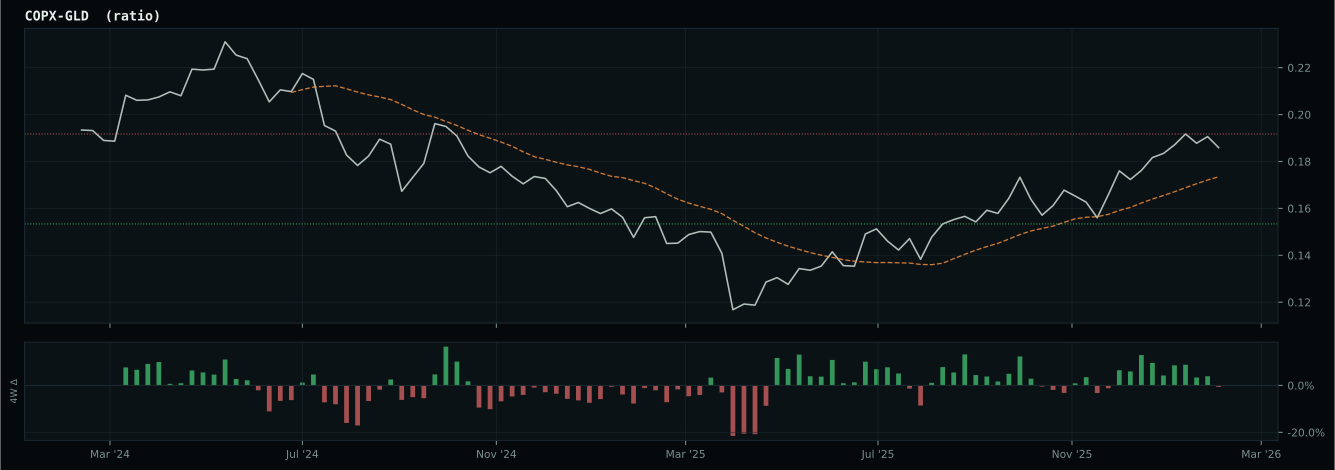
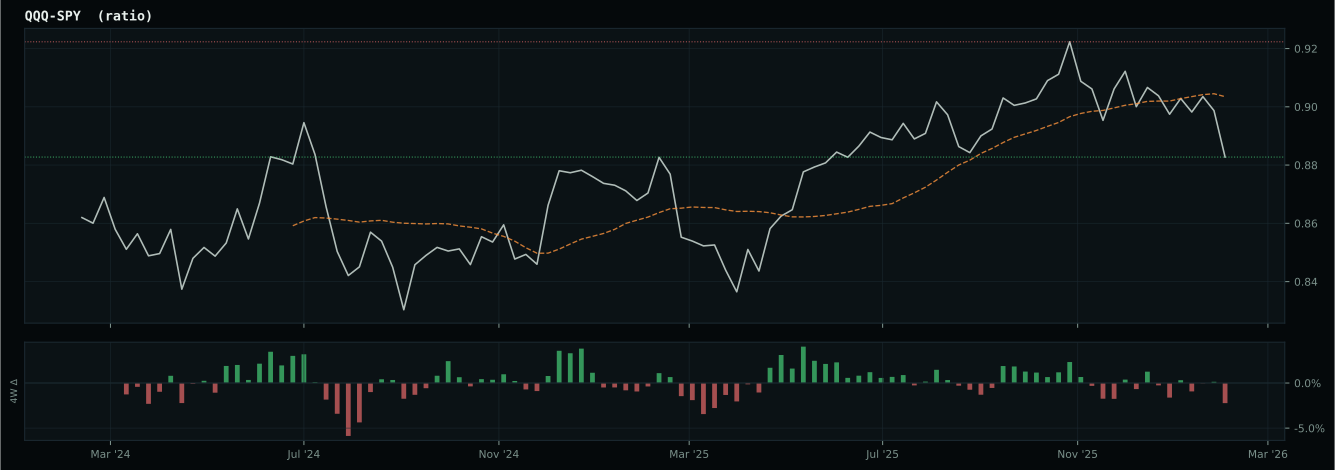
Market-implied signals behind the macro regime scores. Each ratio compares two assets; the direction and slope of the ratio is what the macro engine reads.
Crypto Regime — NoCrypto
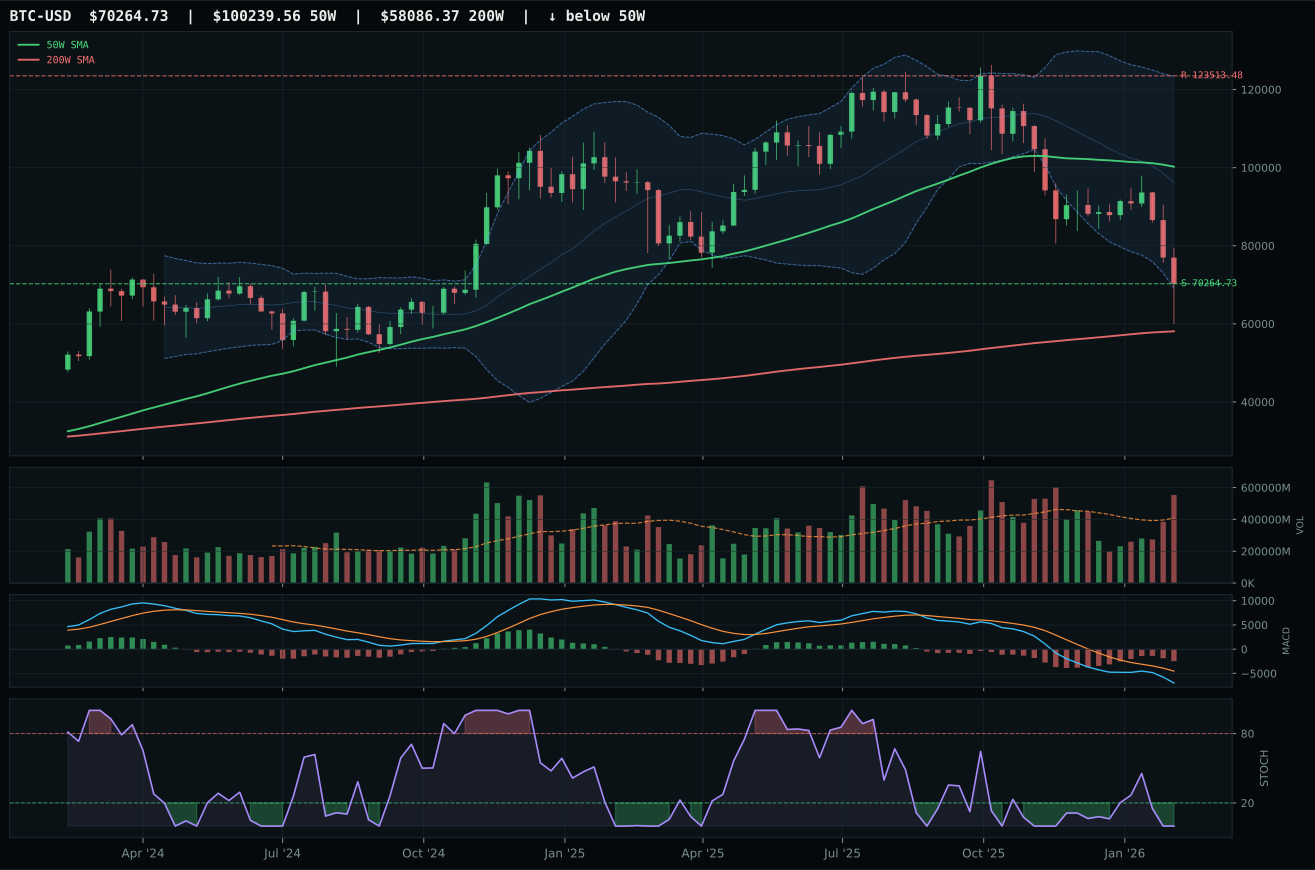
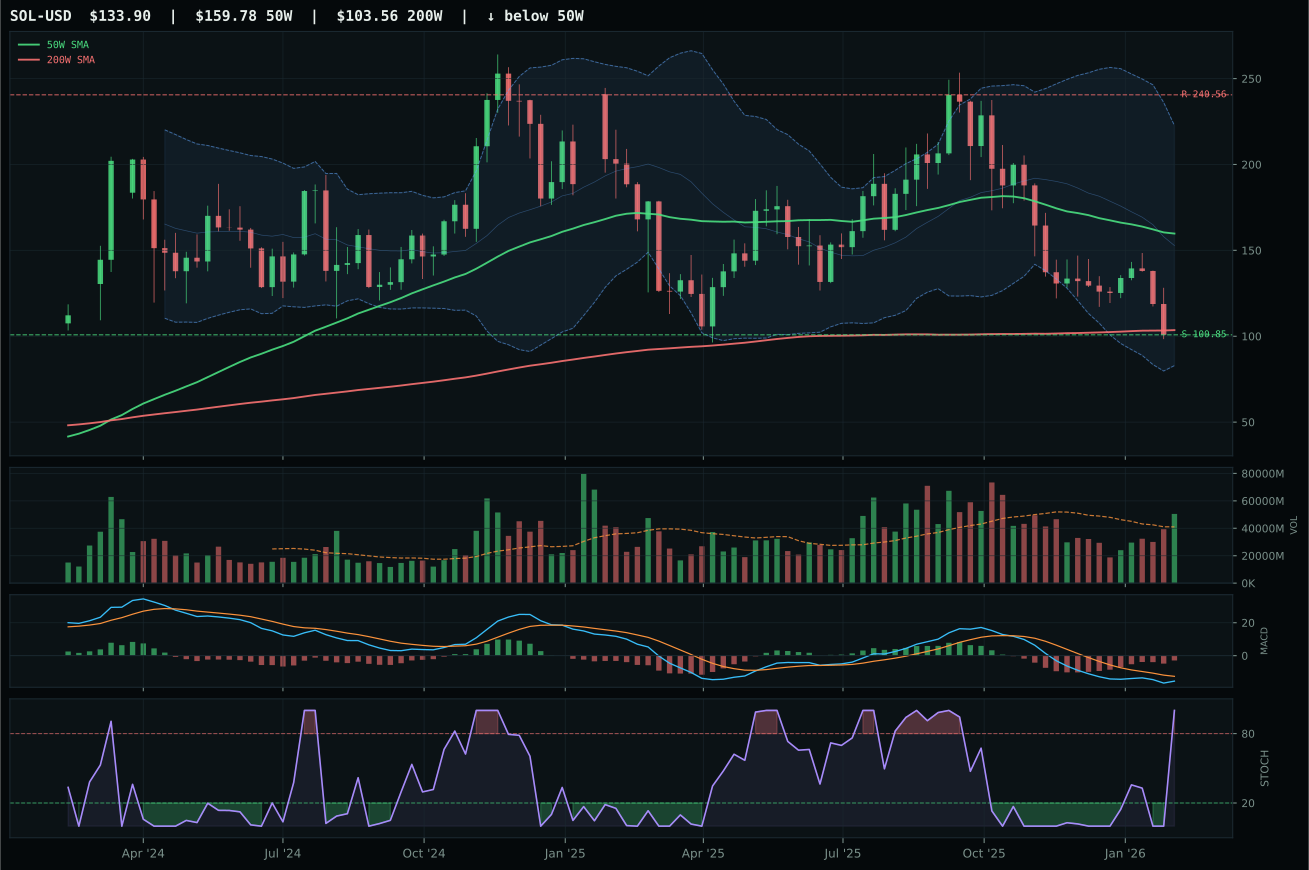
ValueBTC not armed: BTC has not made the first post-breakdown touch of the 200W buy zone after losing the 50W
TrendBTC not confirmed
one or more available conditions failed
Category Rankings
| Rank | Category | Winner | Score | Alloc | 4W Ret | Peers (4W) |
|---|---|---|---|---|---|---|
| 1 | Traditional Energy | XLE | 90.6 | 20% | +6.82% | XOP +14.3% · FCG +13.3% |
| 2 | Emerging Markets | ILF | 81.0 | 20% | -7.13% | IEMG -5.3% · INDA -7.6% |
| 3 | Industrial Metals | COPX | 75.7 | 10% | -10.44% | PICK -7.1% · REMX +4.1% |
| 4 | Nuclear Energy | URNM | 70.5 | 10% | -9.66% | URA -8.2% · NLR -6.5% |
| 5 | Precious Metals | GLD | 65.8 | 10% | +1.45% | GDX +0.1% · SLV +4.9% |
| 6 | Utilities & Infrastructure | PAVE | 63.6 | 10% | -6.86% | IGF +0.9% · XLU +7.4% |
| 7 | AI | SMH | 62.9 | 10% | -5.80% | BOTZ -6.0% · AIQ -2.7% |
| 8 | Agriculture & Livestock | MOO | 46.2 | 10% | -1.48% | VEGI +1.5% · WEAT +14.7% |
| 9 | Defense & Aerospace | ITA | 40.6 | 0% | +3.01% | XAR +2.1% · ROKT +1.7% |
| 10 | Technology | XLK | 36.3 | 0% | -3.29% | CIBR -2.6% · IGV +5.4% |
Traditional Energy — XLE
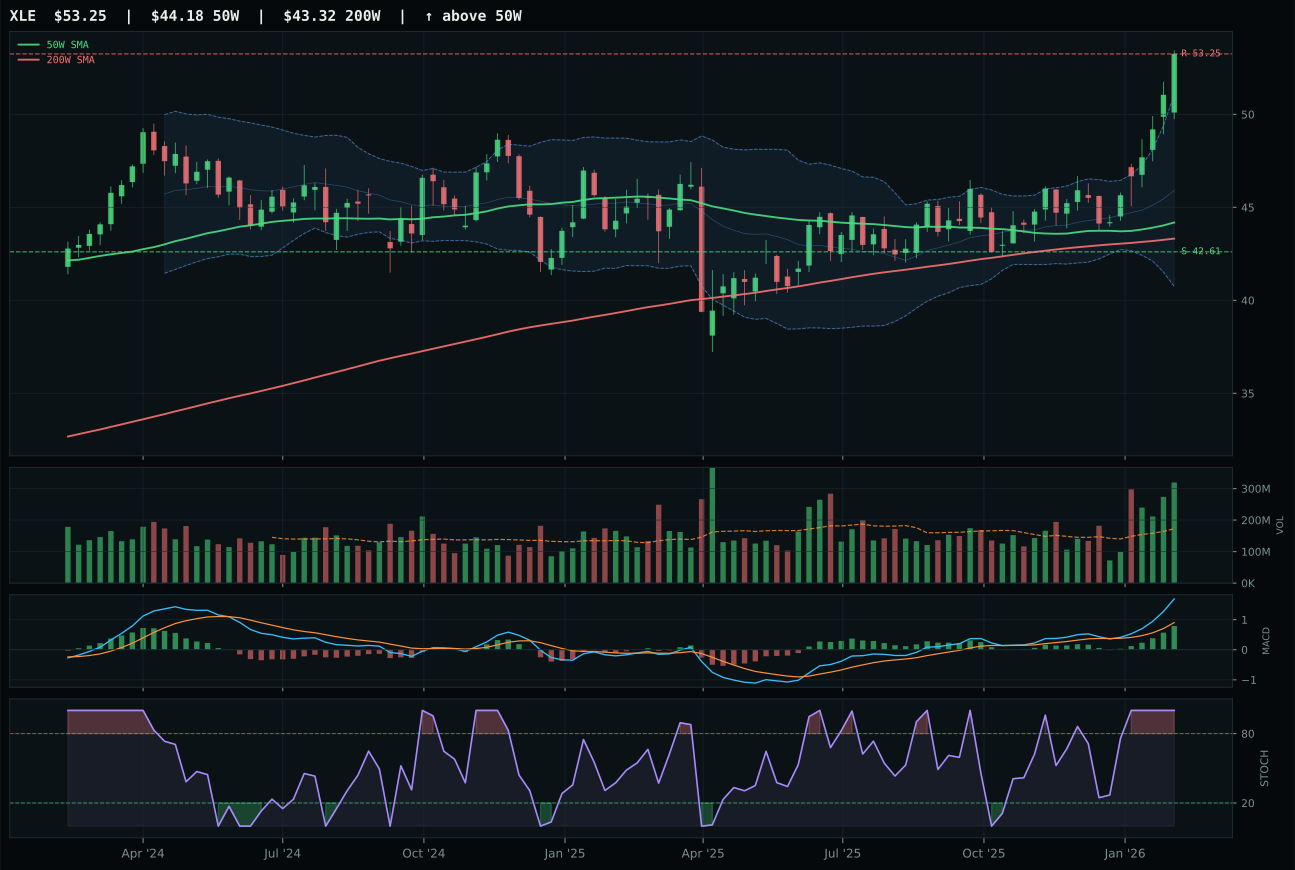
XLE has a vertical extension profile with 16.0% 13-week relative strength versus SPY.
A failed hold above support would weaken the setup.
Actionable but governed by invalidation levels.
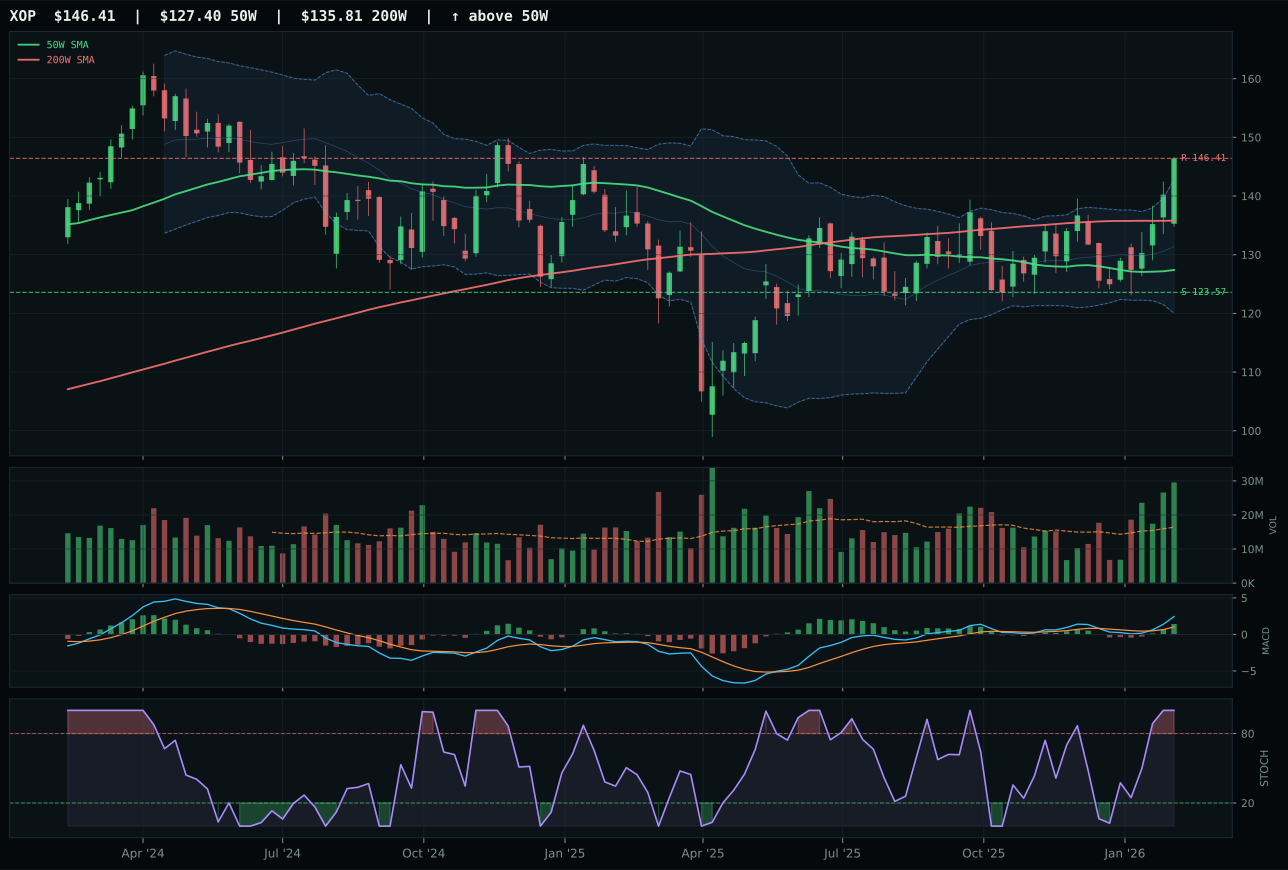
XOP has a neutral structure profile with 10.1% 13-week relative strength versus SPY.
A failed hold above support would weaken the setup.
Actionable but governed by invalidation levels.
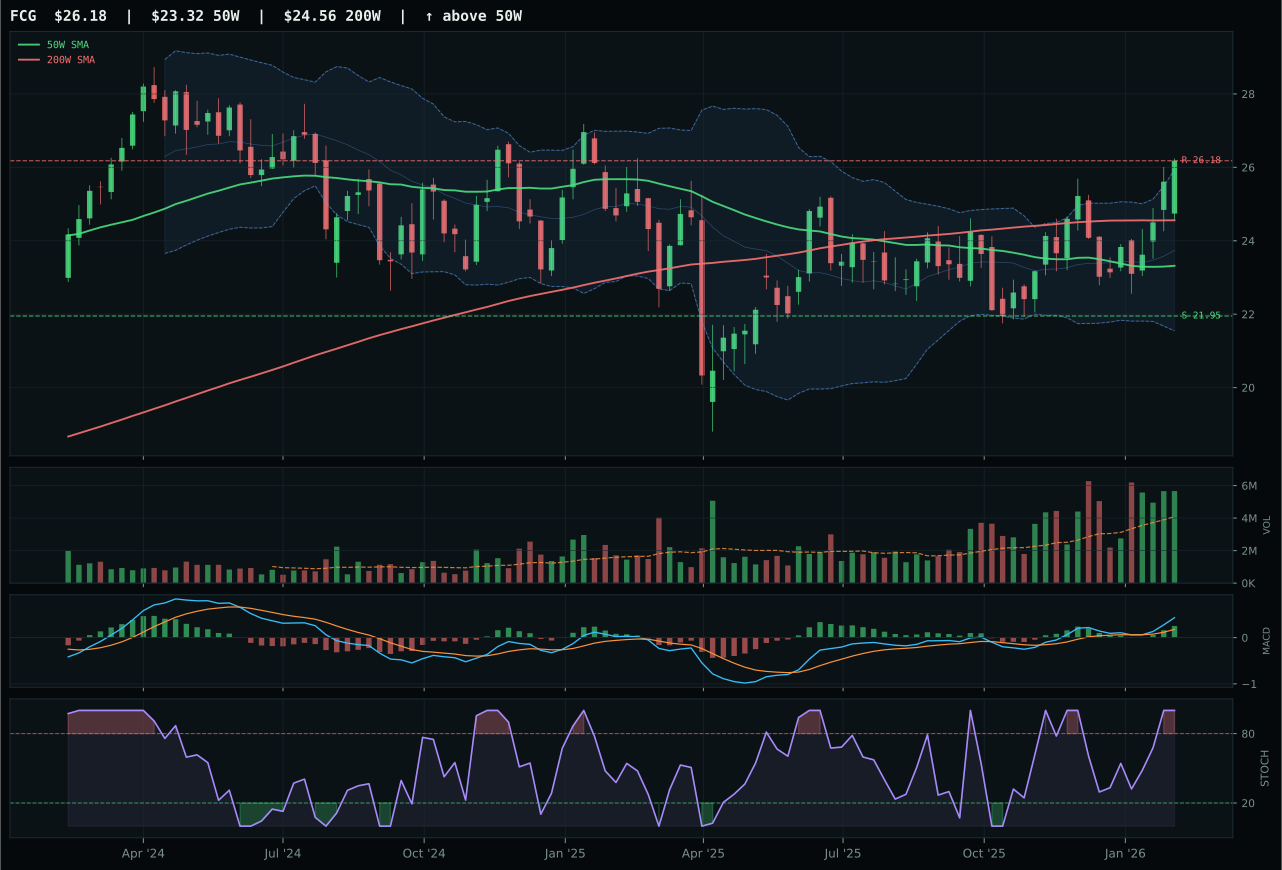
FCG has a neutral structure profile with 10.1% 13-week relative strength versus SPY.
A failed hold above support would weaken the setup.
Actionable but governed by invalidation levels.
XLE earned the top-2 spot (20% allocation) by dominating with 100.0 trend, 100.0 momentum confirmation, and exceptional volume-price sponsorship (89.9), anchored by accumulation/confirmation volume at 1.85x the 20W average. The 18.9% 13W return and 16.0% SPY-relative strength were paired with category leadership (5.9% category-relative), proving that institutional capital was choosing integrated energy's durability over exploration beta. XOP displayed slightly higher risk/reward (50 vs 48) and better timing (59 vs 37) due to its neutral structure versus XLE's vertical extension, but failed on the critical points: structure cleanliness favored XLE at 85.8 versus 79.3, and category-relative strength lagged at 0.0% versus XLE's 5.9%. XLE's MACD actively improving and stochastic RSI overbought at 1.00 signaled that late-phase buyers were still accumulating rather than distributing. Price at $49.60 sat just 0.0% from resistance at $53.25, eliminating upside buffer, yet the trade had survived intact because cash-flow durability (integrated energy) was being bid by momentum players seeking inflation hedges.
Traditional Energy earned top-2 status (20%) with a 90.6 category score and 100.0 technical evidence from XLE, grounded in overwhelming macro sponsorship: energy scarcity (+16), inflation pressure (+10), supply shortage (+9), and real asset sponsorship (+7) created a +36 macro tailwind that dominated the portfolio. The macro environment was purpose-built for energy strength; liquidity expansion (+8) and risk appetite (+8) both favored the trade. XLE's 85.8 structure integrity, 100.0 momentum, and 89.9 volume-price confirmation combined to form the highest-quality technical setup in the portfolio outside emerging markets. Risk/reward at 47.8 and timing at 37.0 reflected the 20.5% extension, creating entry-point tension, yet the category's 85.0 macro fit (second only to agriculture) justified committing 20% of capital. Energy's dominance reflects both technical leadership and macro regime tailwinds; this is a conviction position built on durable structural supply constraints and inflation protection, not a bounce trade.
Emerging Markets — ILF
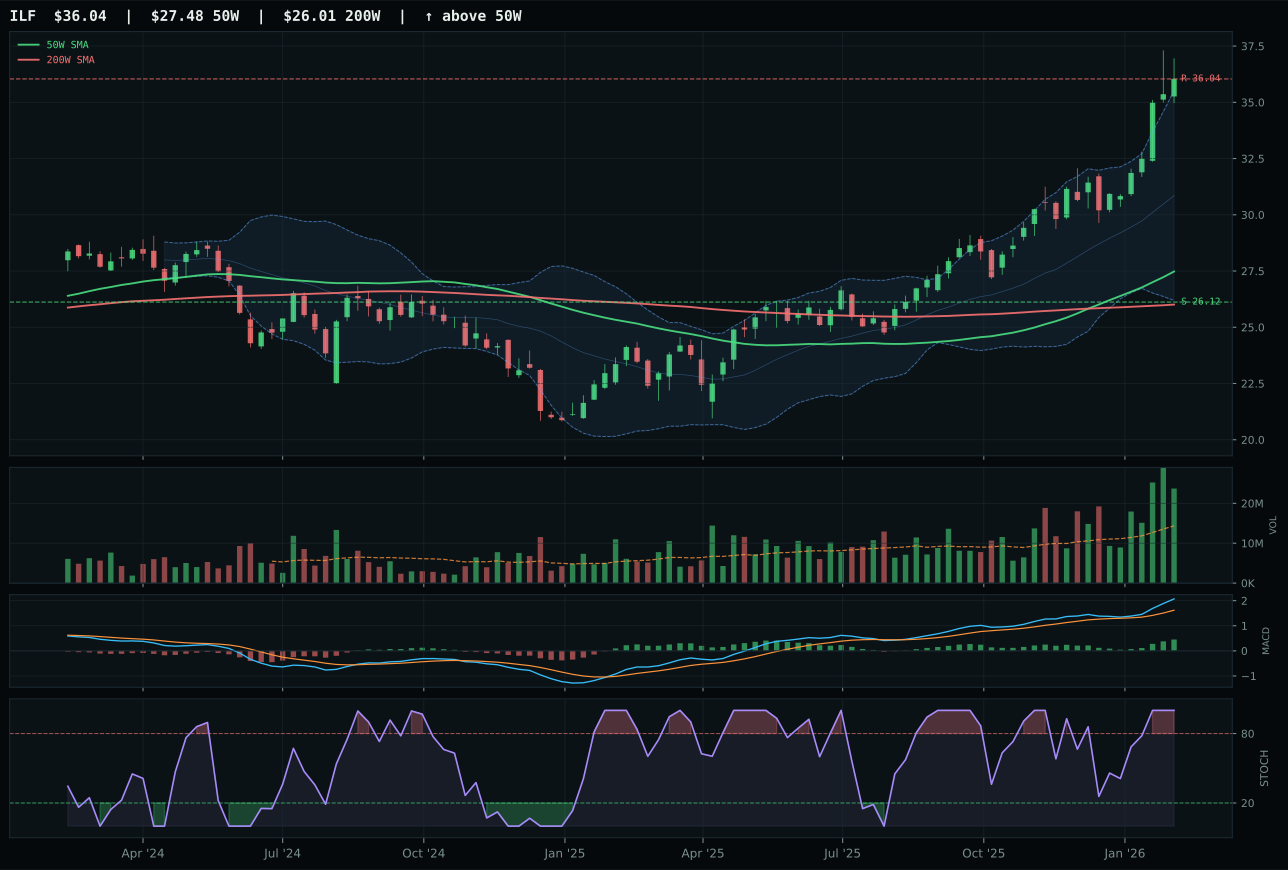
ILF has a vertical extension profile with 16.2% 13-week relative strength versus SPY.
A failed hold above support would weaken the setup.
Actionable but governed by invalidation levels.
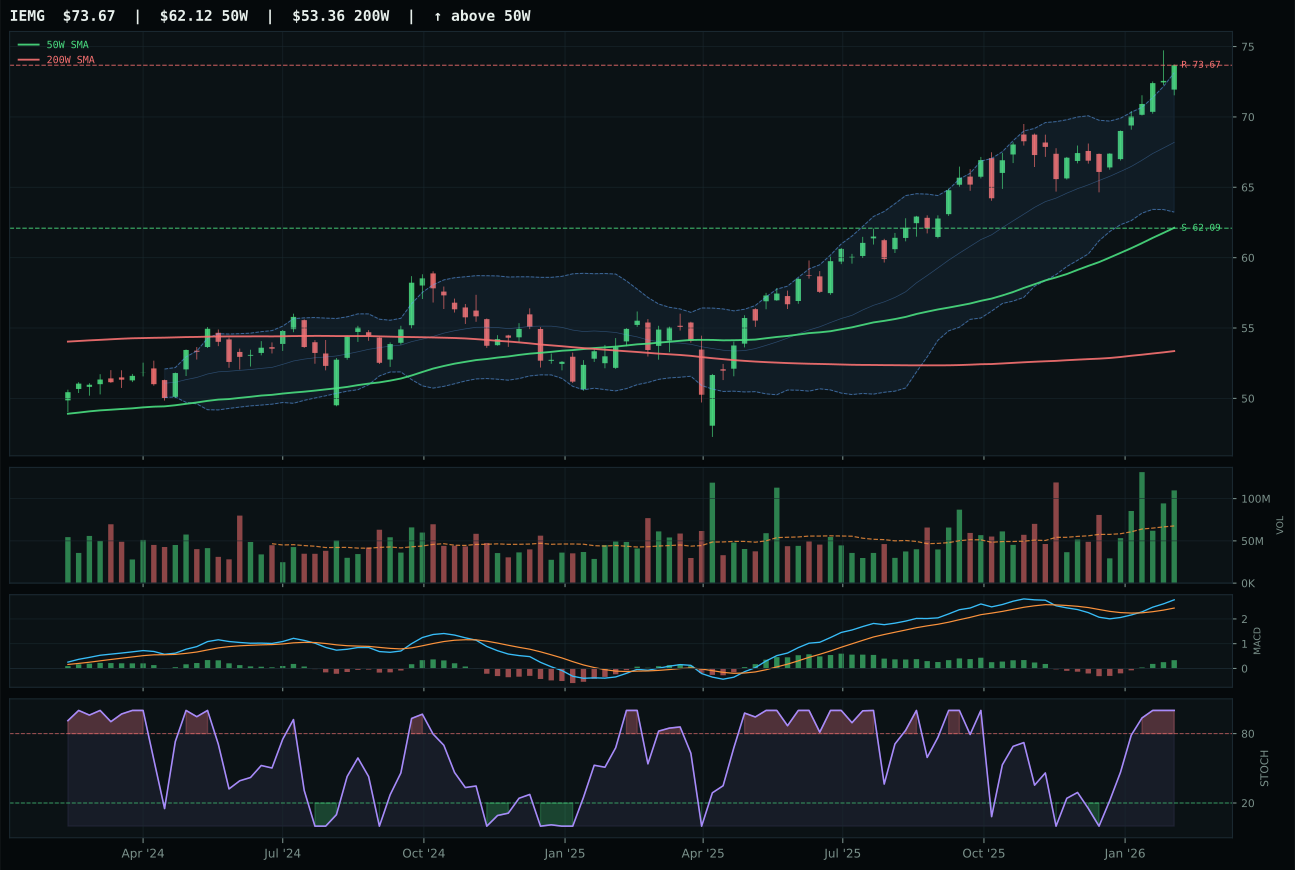
IEMG has a vertical extension profile with 6.6% 13-week relative strength versus SPY.
A failed hold above support would weaken the setup.
Actionable but governed by invalidation levels.
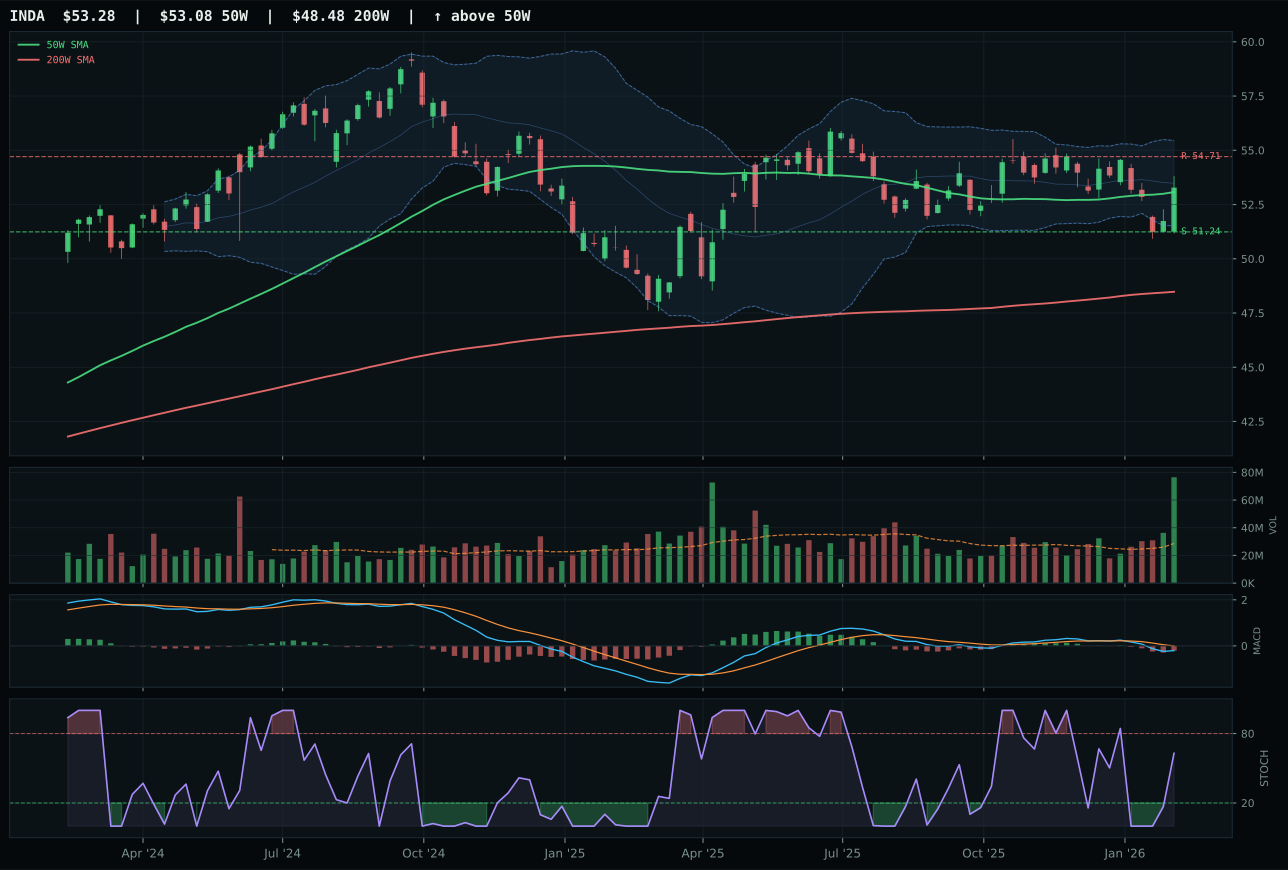
INDA has a pullback into support profile with -3.8% 13-week relative strength versus SPY.
A failed hold above support would weaken the setup.
Actionable but governed by invalidation levels.
ILF earned the top-2 spot (20% allocation) by posting 93.8 technical evidence with perfect trend (100.0) and momentum (100.0), anchored by 91.7 volume-price confirmation and exceptional persistence (93.2)—the highest persistence score in the entire portfolio. The 19.1% 13W return was paired with 16.2% SPY-relative strength and 9.7% category-relative strength, revealing that institutional capital was choosing Latin America's commodity-and-value beta over IEMG's broad diversification and INDA's single-country concentration. IEMG displayed higher composite score (74 vs 66) and superior risk/reward (50 vs 46), yet fell short on the decisive metric: category-relative strength of 0.0% versus ILF's 9.7%, proving that real money understood that Latin America's commodity linkage provided superior leverage to supply shortage and metals scarcity themes. Both MACD signals were bullish and improving; both stochastic RSI were overbought; the difference was pure sponsorship. ILF's accumulation/confirmation volume at 1.65x the 20W average and 31.2% extension above the 50W signaled that buyers were still committed despite stretched entry mechanics, validating the category-relative strength lead.
Emerging Markets earned top-2 status (20%) with an 81.0 category score anchored in macro tailwinds: em liquidity support (+14), liquidity expansion (+8), risk appetite (+9), and commodity breadth (+8) created a +39 macro foundation that rivaled energy's sponsorship. ILF's 93.8 technical evidence and 66.0 macro fit combined to form the second-highest category score in the portfolio, behind energy's 90.6. The regime of Risk-On Liquidity Expansion was explicitly favorable to emerging markets: central banks were accommodating, carry trades were attractive, and commodity-linked EM economies benefited from scarcity themes. Risk/reward at 45.8 reflected the 31.2% extension, yet timing at 37.0 was offset by the 100.0 momentum confirmation and 91.7 volume-price sponsorship—technical evidence that participation remained authentic. ILF's 9.7% category-relative outperformance proved institutional conviction; the allocation reflects both macro regime alignment and technical leadership. EM requires monitoring for signs of momentum roll-over (stochastic overbought at 1.00), but current accumulation/confirmation volume justifies the 20% commitment as a tactical satellite equal in weight to energy.
Industrial Metals — COPX
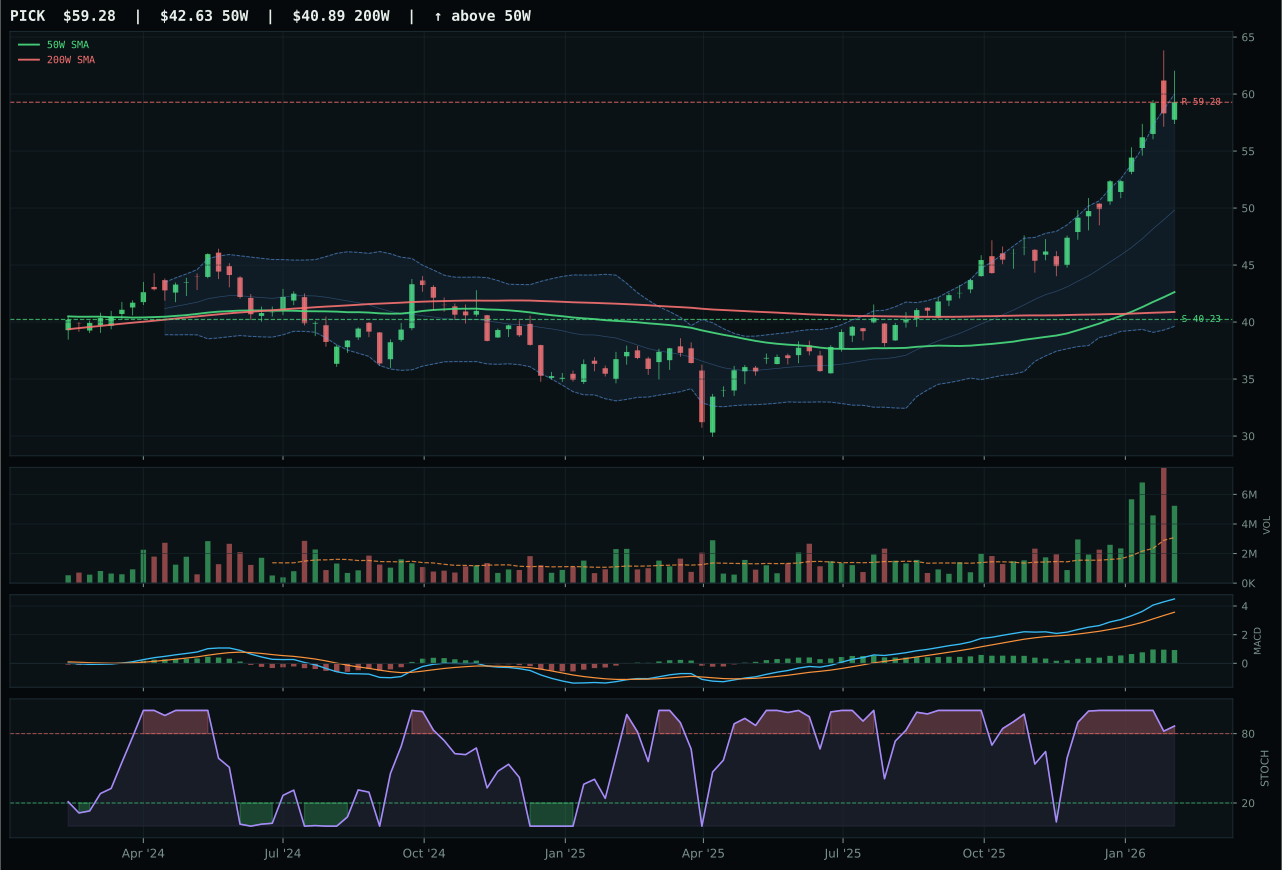
PICK has a vertical extension profile with 27.7% 13-week relative strength versus SPY.
A failed hold above support would weaken the setup.
Actionable but governed by invalidation levels.
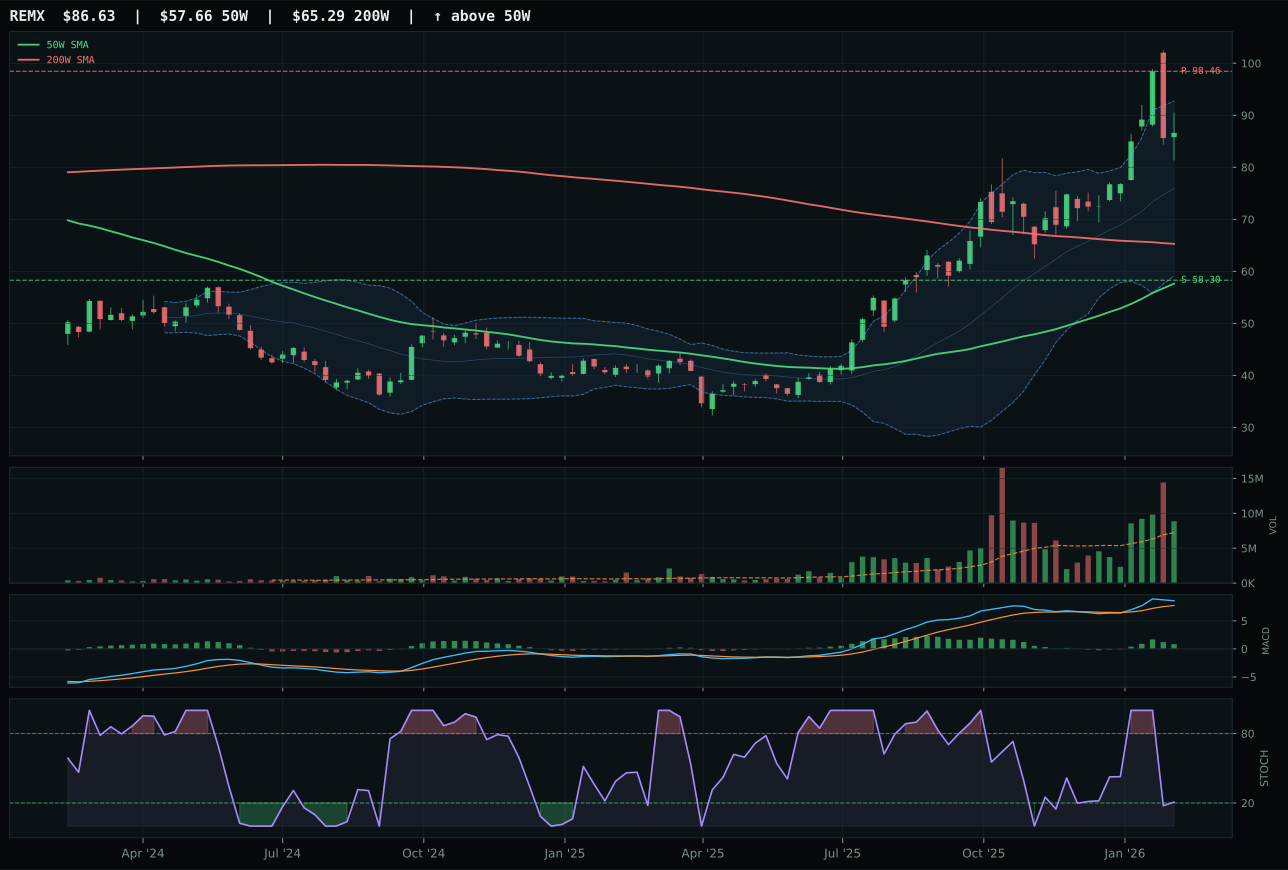
REMX has a vertical extension profile with 29.9% 13-week relative strength versus SPY.
A failed hold above support would weaken the setup.
Actionable but governed by invalidation levels.
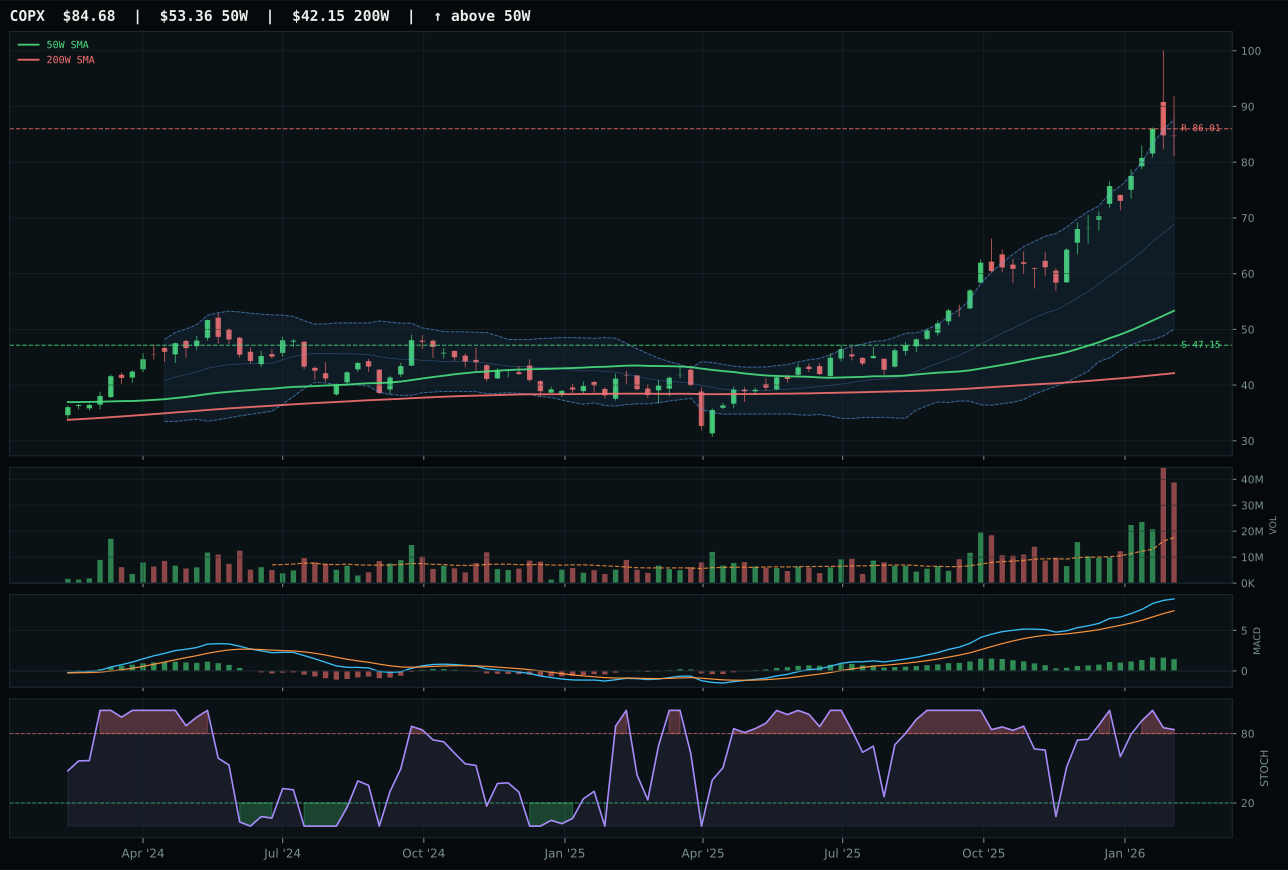
COPX has a vertical extension profile with 36.2% 13-week relative strength versus SPY.
A failed hold above support would weaken the setup.
Actionable but governed by invalidation levels.
COPX won by capturing the highest SPY-relative strength (36.2%) and 13W return (39.1%) in the entire portfolio, proving that copper's scarcity narrative was driving genuine institutional capital rotation. The 58.7% extension above the 50W was extreme, yet the score gap versus runner-up PICK was only -5.4 points—not a clean victory—because timing penalized both leaders heavily (both at 35.0) and structure diverged (COPX 70.2 vs PICK 68.0). The clincher was category-relative strength: COPX's 6.3% outperformance versus the basket signaled that market makers were choosing COPX's pure-copper-miner beta over PICK's diversified mining breadth, even as both MACD signals were bullish and improving. Volume distribution pressure (2.20x average) on COPX was significant and suggested profit-taking, yet persistence at 86.3 proved the underlying trend had durability. Stochastic RSI rolling over at 0.83 was the only warning; timing risk was real, but sponsorship from metals scarcity (+14) and commodity breadth (+10) made this a rare category where a massively extended leader still had institutional backing.
Industrial Metals scored 75.7 and earned 10% because it ranked fourth overall and lacked the macro sponsorship to justify top-2 status despite exceptional technical leadership from COPX. Metals scarcity (+14) was powerfully active, but risk appetite and liquidity expansion—the portfolio's dominant themes—did not provide specific tailwinds; commodity breadth (+10) helped, yet real asset sponsorship only added +6. COPX's 38.5 technical evidence masked a brutal truth: timing at 35.0 meant every new buyer faced a 58.7% haircut risk to the 50W, and risk/reward at 37.4 offered only 79.6% downside cushion against 1.5% upside. The category earned allocation because supply-shortage narratives are durable and copper will be essential for energy transition infrastructure, but the entry point is poor and momentum is rolling over. COPX would need to consolidate above support at 47.15 or break above the $86.01 resistance to reset timing and generate new conviction; until then, it's a belief holding rather than a reward holding.
Nuclear Energy — URNM
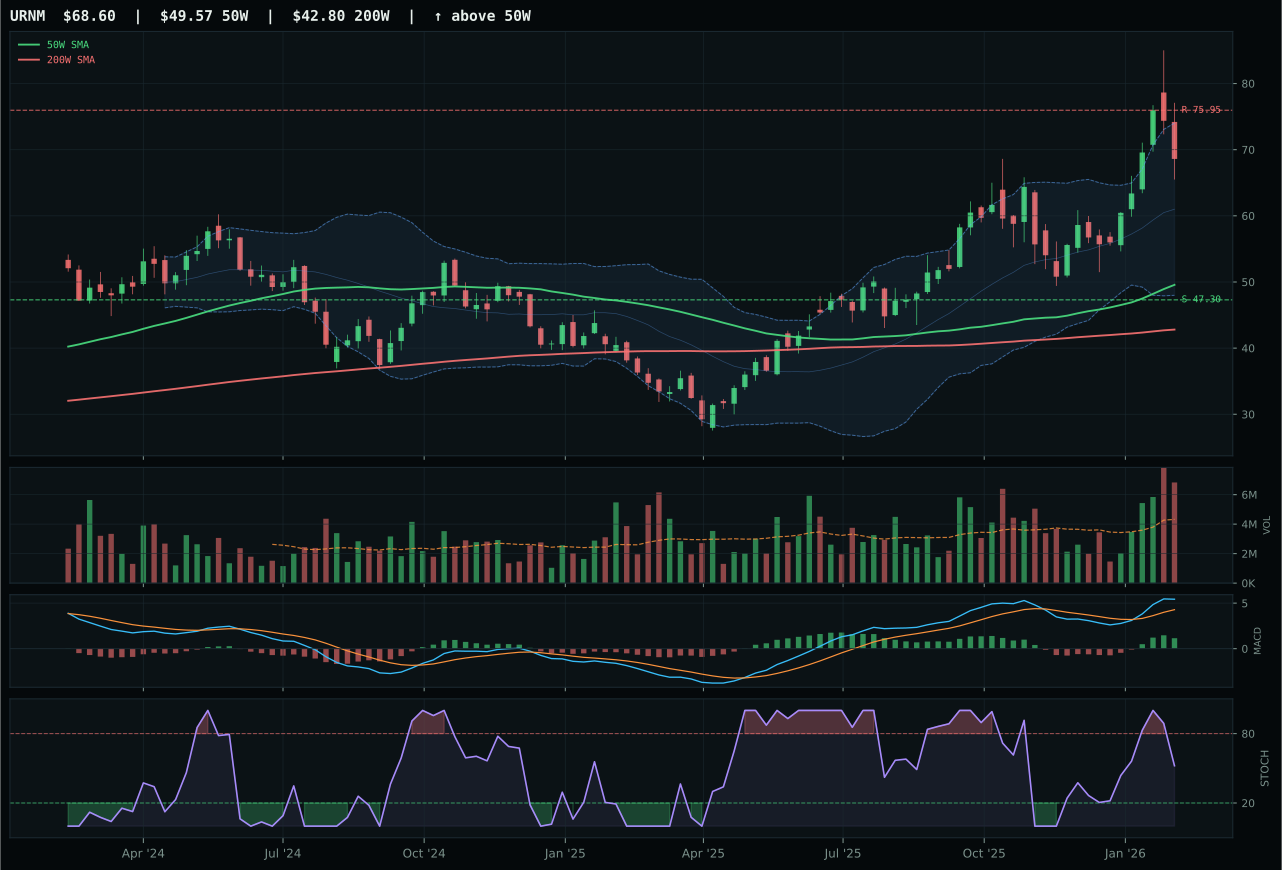
URNM has a vertical extension profile with 20.3% 13-week relative strength versus SPY.
A failed hold above support would weaken the setup.
Actionable but governed by invalidation levels.
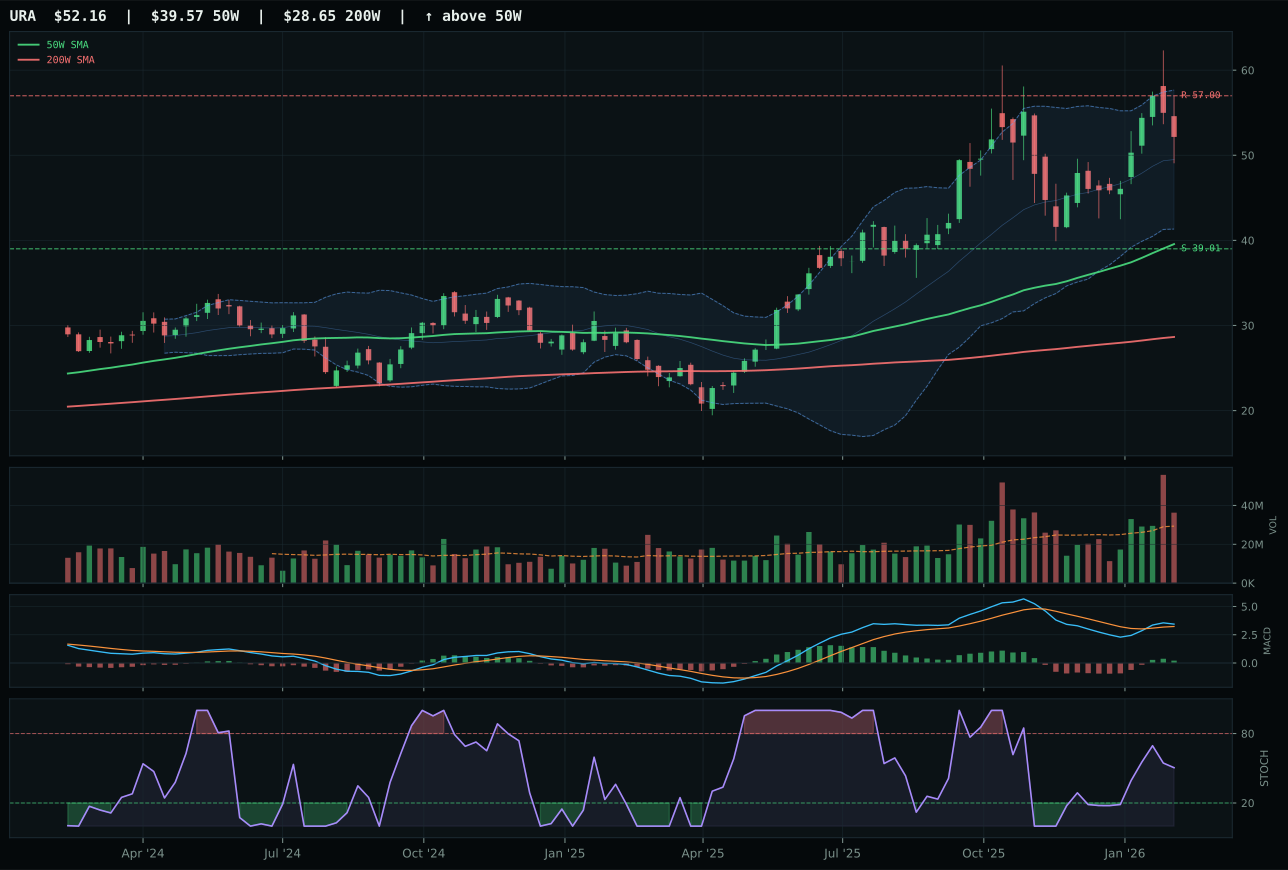
URA has a vertical extension profile with 6.1% 13-week relative strength versus SPY.
A failed hold above support would weaken the setup.
Actionable but governed by invalidation levels.
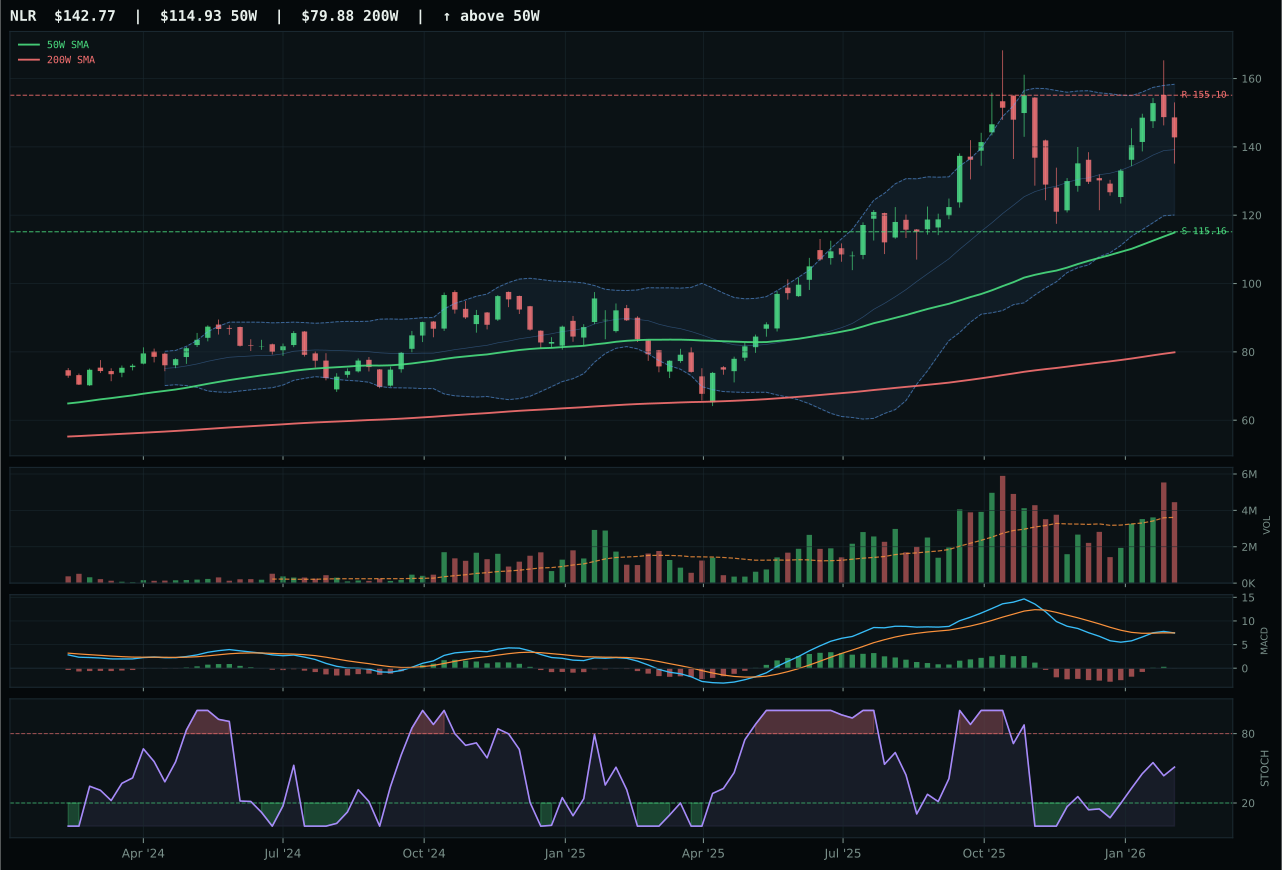
NLR has a vertical extension profile with 1.4% 13-week relative strength versus SPY.
A failed hold above support would weaken the setup.
Actionable but governed by invalidation levels.
URNM won by generating 14.1% category-relative strength versus URA's flat 0.0%, despite holding nearly identical MACD (both bullish and improving) and stochastic RSI (both falling/neutral) signals. The divergence lay in pure sponsorship: URNM's 20.3% SPY-relative gain and 23.2% 13W return proved that uranium-miner levered beta was accumulating, while URA's broad uranium-focused approach captured only 6.1% SPY-relative return, signaling institutional preference for equity leverage over commodity-exposed funds. Both were extended (38.4% and within bounds), both had improving MACD, yet URNM's 100.0 momentum confirmation and superior category relative strength earned the category win. Structure favored URNM at 64.5 versus URA's neutral setup; timing was identical at 53.0 because both charts sat in the upper retracement zone. Volume distribution pressure (1.58x average) on URNM versus above-average participation (1.71x) on URA suggested rotation from broad uranium funds into leveraged mining beta—a tactical shift revealing where real money saw more optionality.
Nuclear Energy scored 70.5 and earned 10% because energy scarcity (+9), real asset sponsorship (+7), and AI growth sponsorship (+5) provided genuine tailwinds, yet lacked the overwhelming macro support that elevated energy and emerging markets to top-2 status. URNM's 39.6 technical evidence was weak—driven entirely by trend and momentum, with timing at 53.0 and risk/reward at only 25.9 due to the 38.4% extension and tight resistance at $75.95 leaving zero upside buffer. The category's 74.0 macro fit was respectable but required belief in durable energy-transition demand and uranium scarcity, not a consensus macro thesis. URNM was extended, with distribution pressure and risk/reward that limited new entry enthusiasm; the 10% allocation reflects a satellite position in an emerging structural theme rather than a core conviction. To move higher, URNM would need to consolidate and reset timing, or benefit from accelerating AI power-demand narratives that eclipse current macro sponsorship—a longer-term levered bet that fits the portfolio as a measured hedge, not a momentum driver.
Precious Metals — GLD
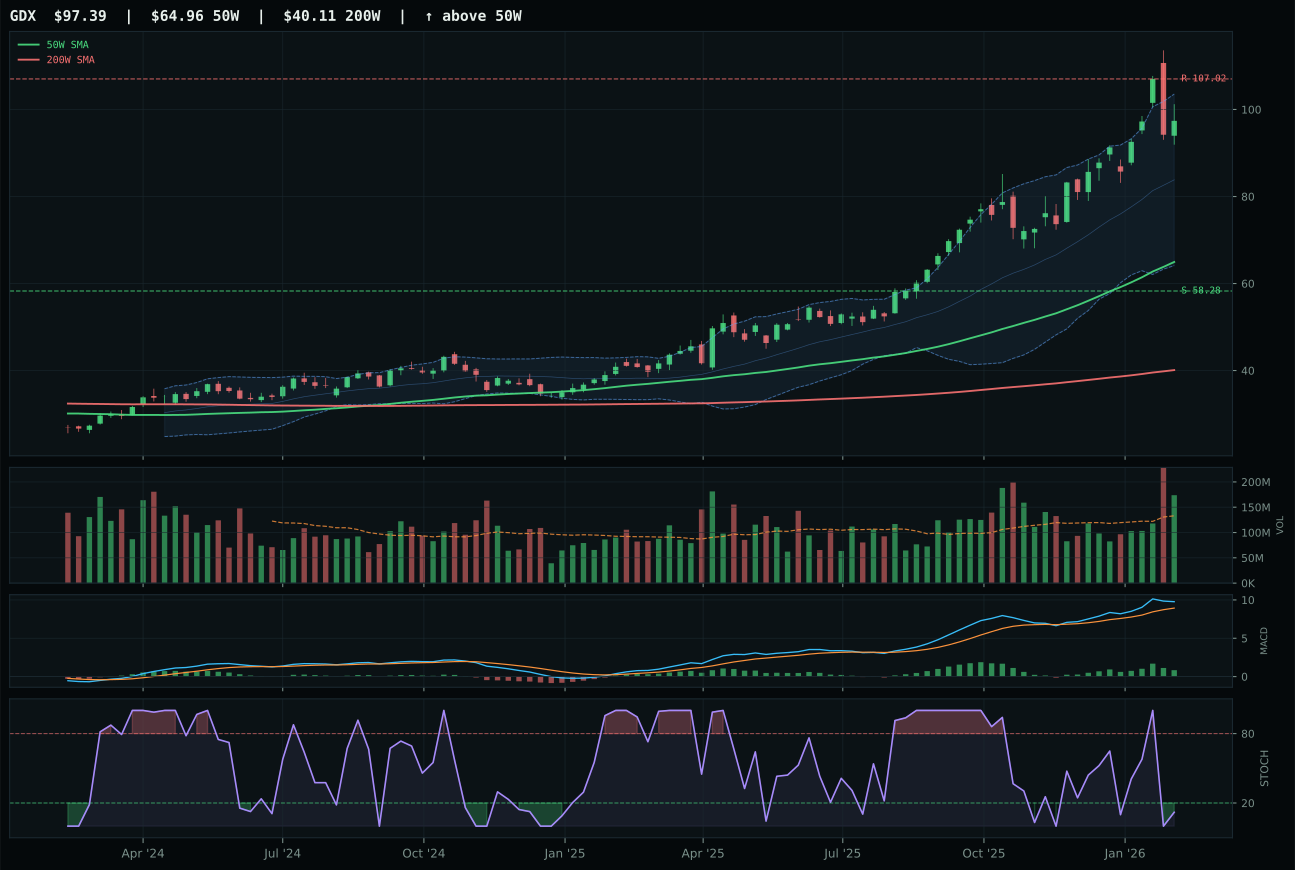
GDX has a vertical extension profile with 31.3% 13-week relative strength versus SPY.
A failed hold above support would weaken the setup.
Actionable but governed by invalidation levels.
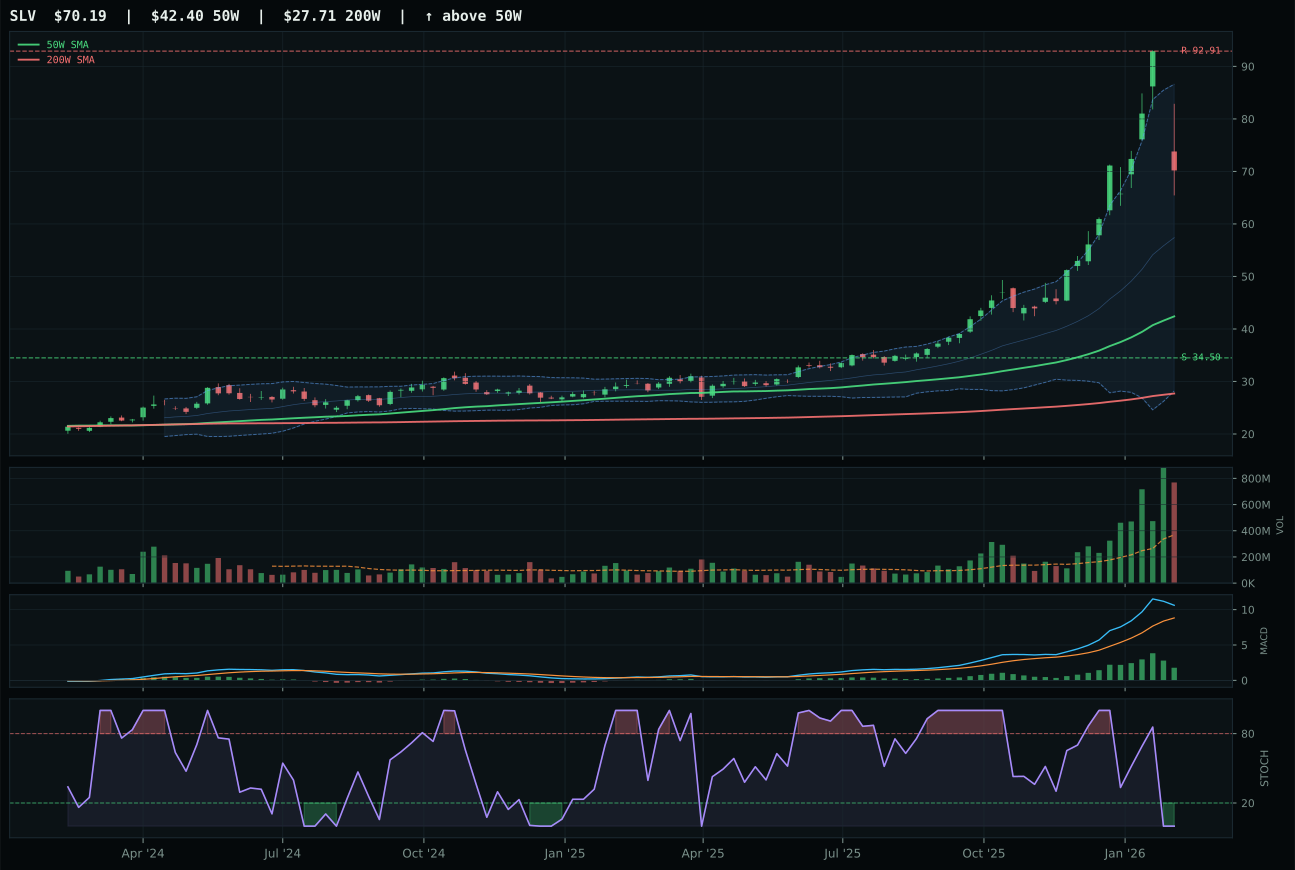
SLV has a vertical extension profile with 56.9% 13-week relative strength versus SPY.
A failed hold above support would weaken the setup.
Actionable but governed by invalidation levels.
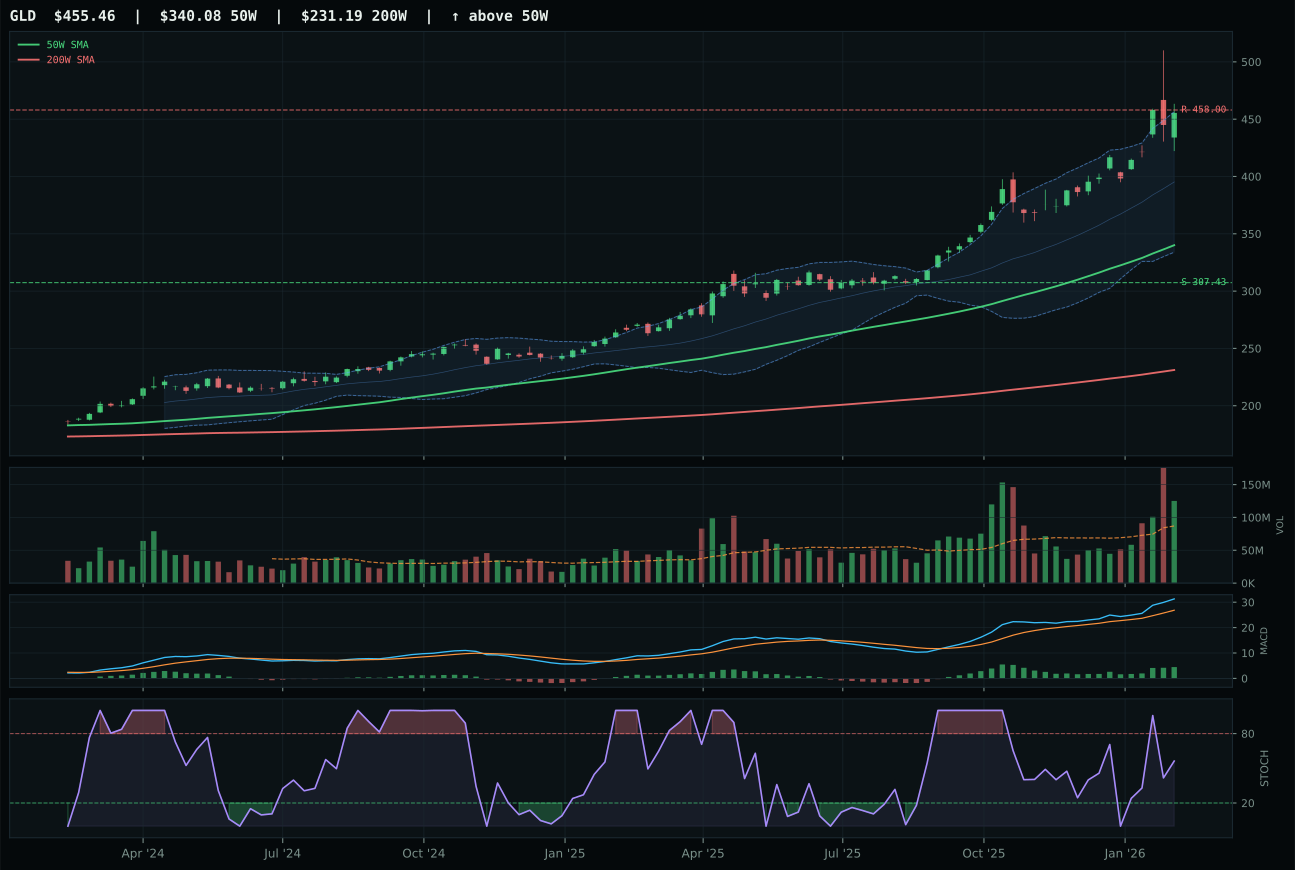
GLD has a vertical extension profile with 20.7% 13-week relative strength versus SPY.
A failed hold above support would weaken the setup.
Actionable but governed by invalidation levels.
GLD won by offering measured timing and superior structure (78.3 vs GDX's 74.7) within a category where both leaders were extended and both MACD signals were improving. GLD's 33.9% distance from the 50W was stretched, but stochastic RSI rising mid-zone at 0.56 provided better entry mechanics than GDX's oversold 0.00 reading, which signaled a mean-reversion bounce rather than fresh conviction buying. The critical divergence: GDX's 31.3% SPY-relative strength and 34.2% 13W return were seductive, but achieved at 49.9% extension above the 50W—almost twice GLD's risk—with only 32.4% risk/reward versus GLD's 45.2%, revealing that GDX buyers had already paid a leverage premium. GLD's category-relative strength of -10.6 meant it was lagging peers, yet it won because both peers were overbought; the winner was simply less overbought. Monetary hedge bid (+14) pulled both higher, but GLD's above-average participation (1.44x) versus GDX's same volume suggested institutional rotation toward the cleaner monetary exposure.
Precious Metals scored 65.8 and earned 10% because the macro regime was mixed—monetary hedge bid (+14) was powerful, but risk appetite positive (-4) and liquidity expansion (-2) created headwinds in a Risk-On environment. GLD's 79.8 technical evidence was strong, yet category-level macro fit at 54.0 was weak by portfolio standards, and the 61.0 timing score masked the reality that both GLD and GDX were 33% and 50% extended, respectively, leaving minimal room for new trend participants. Gold is a volatility hedge and monetary insurance, not a growth driver; its allocation reflects portfolio insurance value rather than directional conviction. To earn higher allocation, GLD would need either a pullback to reset timing (currently near support at 307.43 but extended to resistance), or a macro catalyst—credit stress materialization, inflation acceleration above current priced-in levels, or a dollar weakness scare. In the current liquidity-expansion regime, it's a measured defensive position.
Utilities & Infrastructure — PAVE
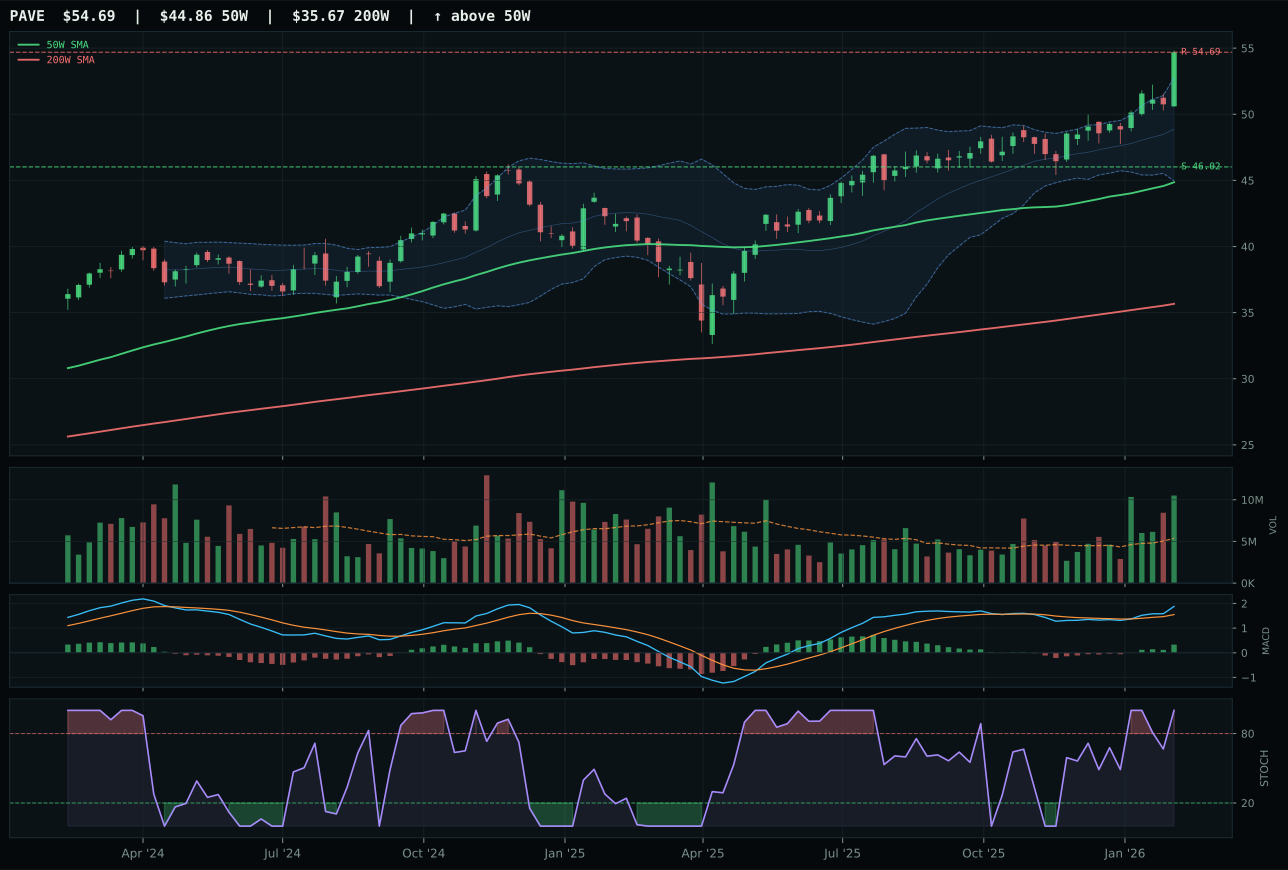
PAVE has a vertical extension profile with 11.6% 13-week relative strength versus SPY.
A failed hold above support would weaken the setup.
Actionable but governed by invalidation levels.
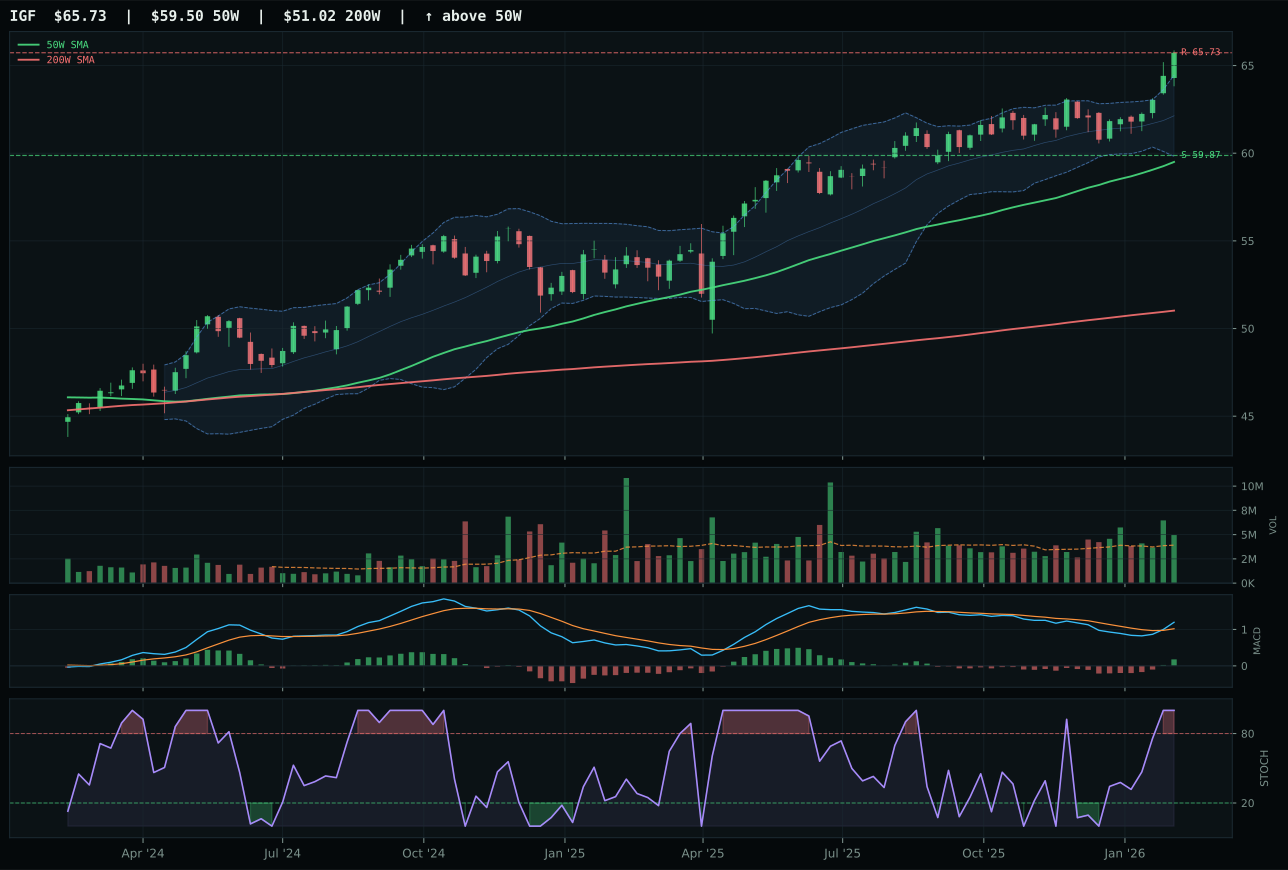
IGF has a neutral structure profile with 3.7% 13-week relative strength versus SPY.
A failed hold above support would weaken the setup.
Actionable but governed by invalidation levels.
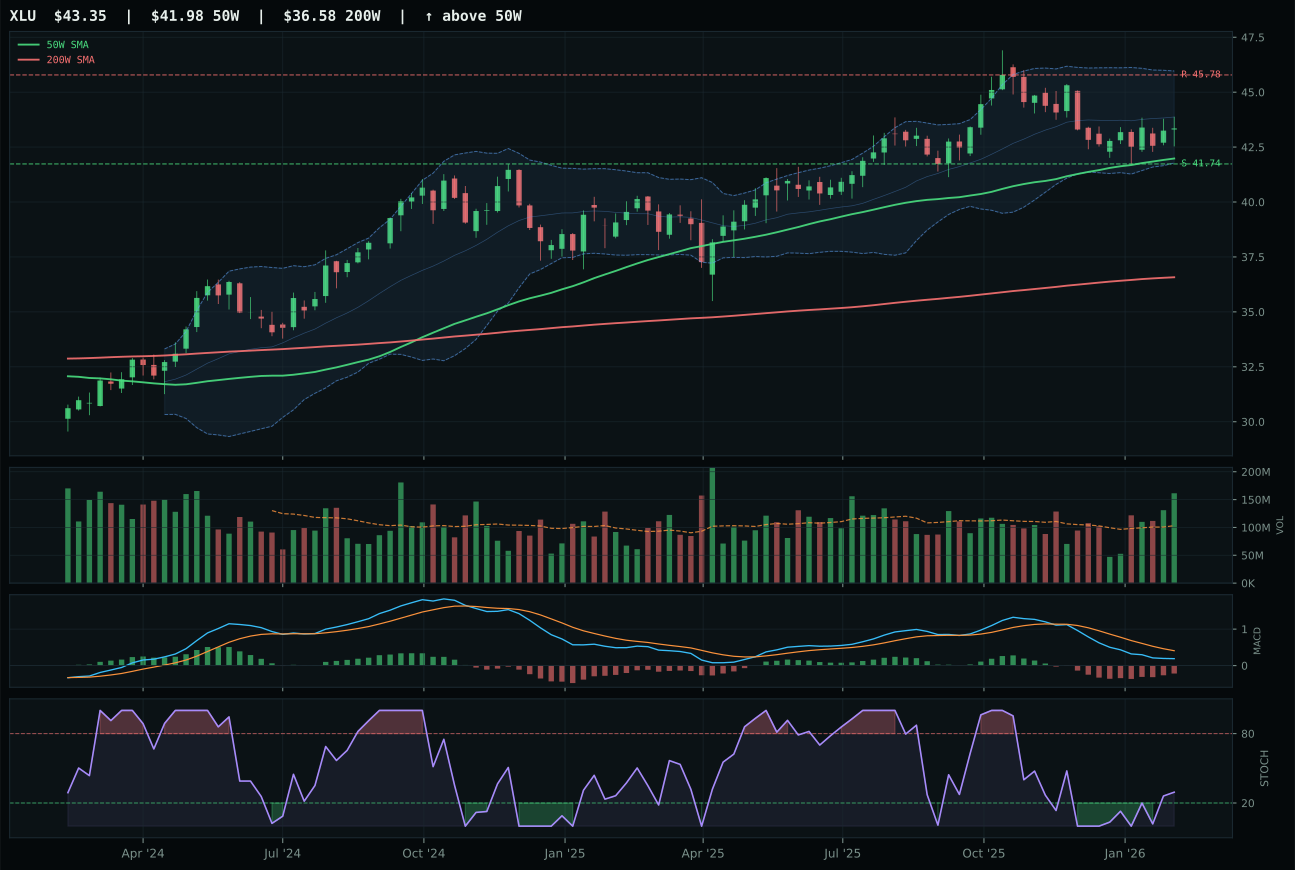
XLU has a pullback into support profile with -6.3% 13-week relative strength versus SPY.
A failed hold above support would weaken the setup.
Actionable but governed by invalidation levels.
PAVE won with 100.0 technical evidence from perfect trend and momentum combined with the highest volume-price confirmation in the domestic infrastructure space (90.2) supported by accumulation/confirmation at 1.96x the 20W average. The 14.5% 13W return and 11.6% SPY-relative strength revealed authentic institutional participation; category-relative strength at 7.9% proved that builders and infrastructure operators understood PAVE's domestic capex leverage better than IGF's global income focus or XLU's rate-sensitive utility stack. IGF held superior composite (81 vs 73) and risk/reward (52 vs 50) scores due to better timing (59 vs 37), yet fell short on volume confirmation (above-average participation only, not accumulation) and category-relative strength (0.0% vs 7.9%), indicating rotational demand into PAVE's domestic beta rather than sustained breadth across the sector. Both MACD signals were improving; both stochastic RSI were overbought; PAVE's edge lay in cleaner structure (78.8 vs IGF's ambiguous 81 composite masking 0.0% category leadership) and stronger hands (accumulation vs participation). The 21.9% extension above the 50W was material but justified by capex sponsorship.
Utilities & Infrastructure scored 63.6 and earned 10% despite PAVE's exceptional 100.0 technical evidence because the category-level macro fit at 46.0 was the lowest in the portfolio outside flat-performing sectors. Commodity breadth (+4) and risk appetite (+4) provided only modest tailwinds, while inflation pressure (-6) actively penalized interest-rate-sensitive infrastructure names. PAVE's domestic capex thesis was sound but lacked the broad macro sponsorship of energy scarcity or EM liquidity support; it was a concentrated technical trade rather than a regime-driven allocation. The 37.0 timing score reflected the 21.9% extension that left only 0.0% upside to resistance at $54.69, creating entry-point tension for new participants. The allocation reflects a high-conviction domestic-infrastructure play executed at an unfavorable entry point—justified by capex themes but limited by valuation and macro headwinds. To earn higher allocation, PAVE would need either a pullback to reset timing (support at 46.02 offers 12% downside cushion) or acceleration of inflation or supply-shortage narratives that justify capex front-loading—currently a satellite position in a regime favoring commodities and EM over domestic fixed-income beta.
AI — SMH
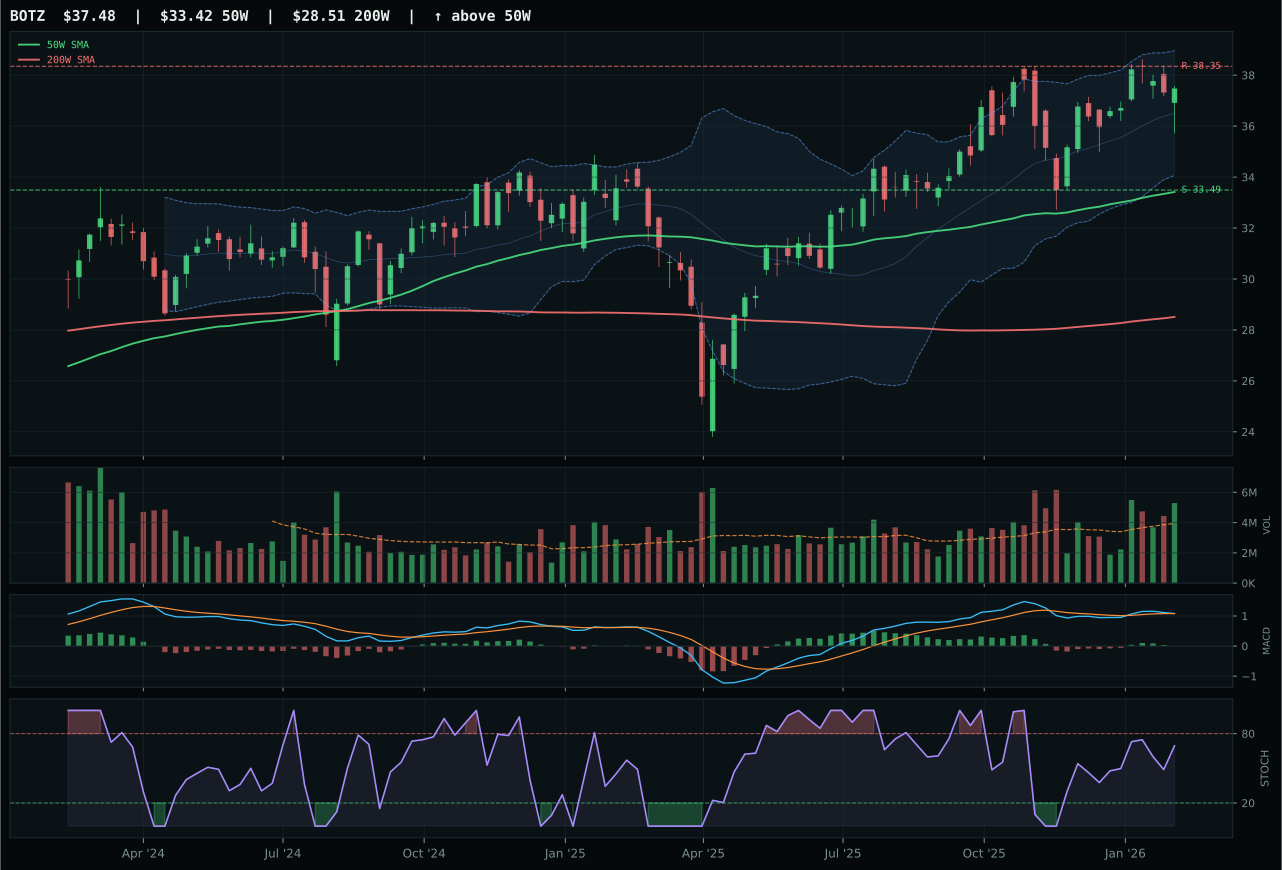
BOTZ has a neutral structure profile with 1.2% 13-week relative strength versus SPY.
A failed hold above support would weaken the setup.
Actionable but governed by invalidation levels.
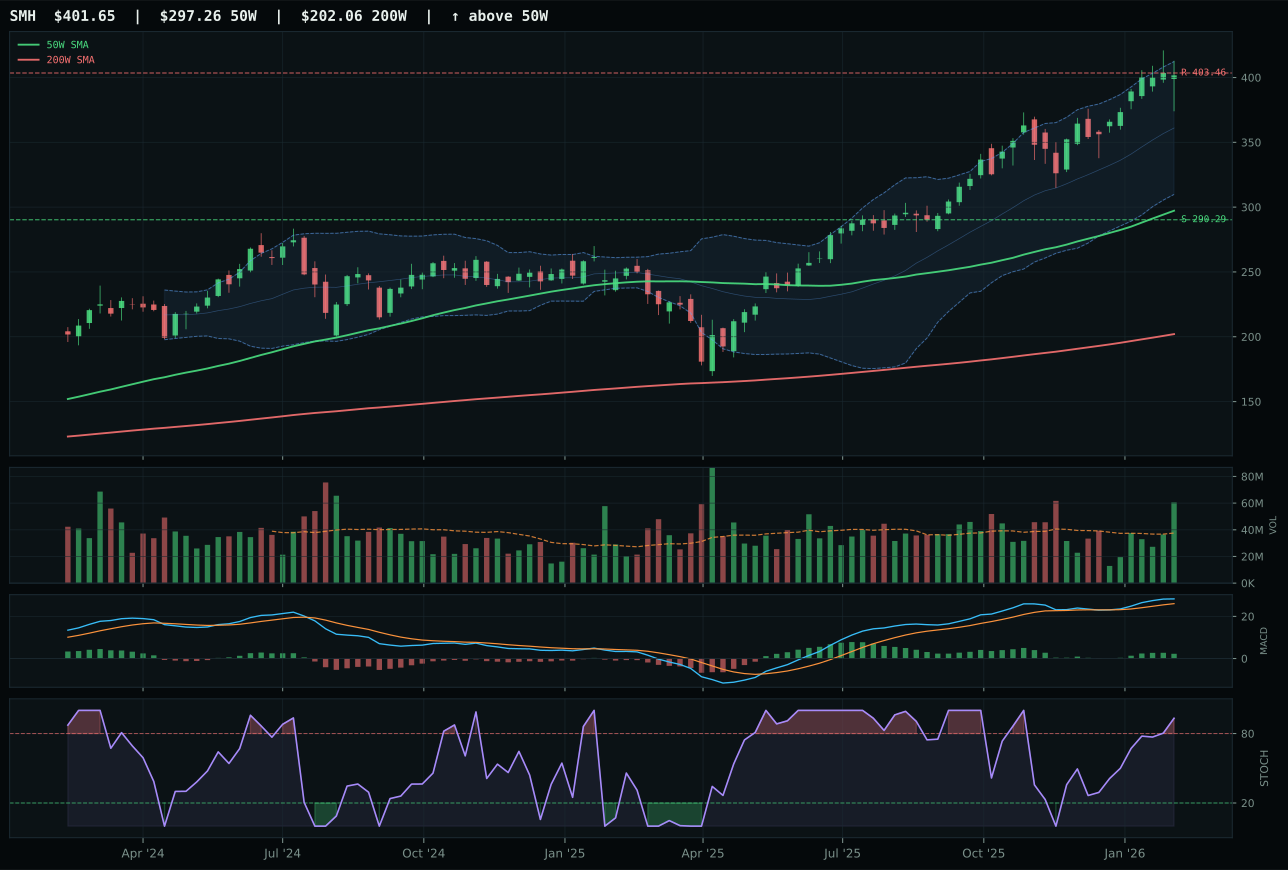
SMH has a vertical extension profile with 12.4% 13-week relative strength versus SPY.
A failed hold above support would weaken the setup.
Actionable but governed by invalidation levels.
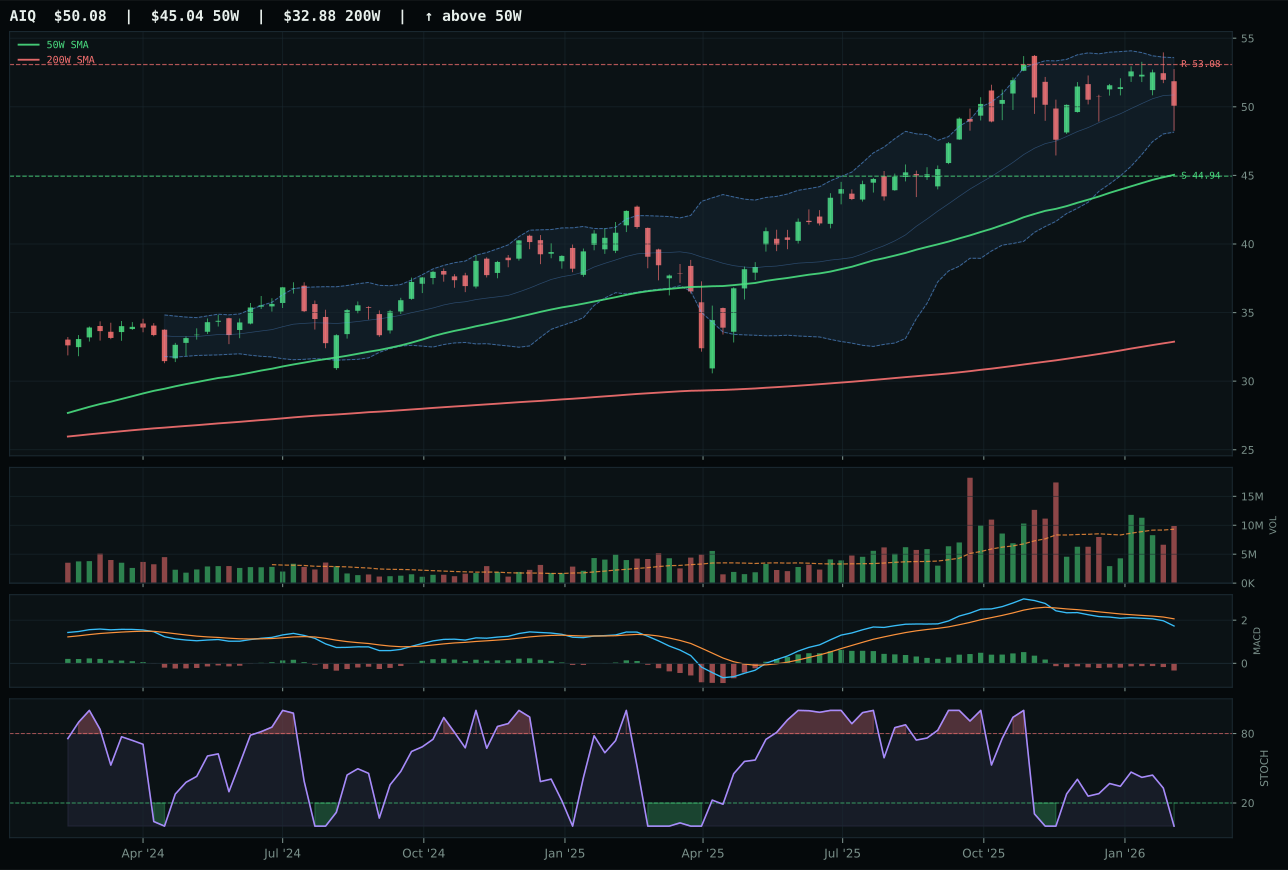
AIQ has a neutral structure profile with -4.1% 13-week relative strength versus SPY.
A failed hold above support would weaken the setup.
Actionable but governed by invalidation levels.
SMH won with 100.0 trend and momentum confirmation despite arriving at an unfavorable entry price—62.1% above the 50W, leaving only 0.4% upside to resistance. The defining difference was category-relative strength of 11.3% versus BOTZ's flat 0.0%, paired with MACD that was actively improving rather than flattening as BOTZ's was. Volume distribution pressure (1.61x 20W average) typically signals exit flows, but SMH's overbought stochastic RSI at 0.93 combined with 15.4% 13W returns proved that new money was still accumulating despite the stretched valuation. BOTZ showed higher composite score (73 vs 62) due to better timing at 62 basis points and superior risk/reward (40 vs 29), but the comparison missed the critical detail: BOTZ's bullish-but-flattening MACD signaled momentum deceleration precisely when SPY-relative strength had already disappeared. SMH's sponsor still had conviction; BOTZ's did not.
AI scored 62.9 and earned 10%, placing it third behind energy and emerging markets because the technical evidence (43.2) was weak relative to the macro narrative fit (74.0). The category faced a structural tension: AI growth sponsorship remained powerfully active (+14), yet SMH's 35.1% extension above the 50W meant every new buyer was late to the trade. Risk/reward collapsed to 29.2 due to negative upside buffer (-0.4% to resistance), amplifying the timing risk embedded in a 37.0 timing score. Liquidity expansion did help—it added +12 to category-level macro fit—but the regime also had credit stress (-8) and risk appetite already priced in (+10), leaving little oxygen for fresh momentum. SMH would require a pullback to reset timing or a significant breakout above $403 resistance to justify moving AI higher in the allocation.
Agriculture & Livestock — MOO
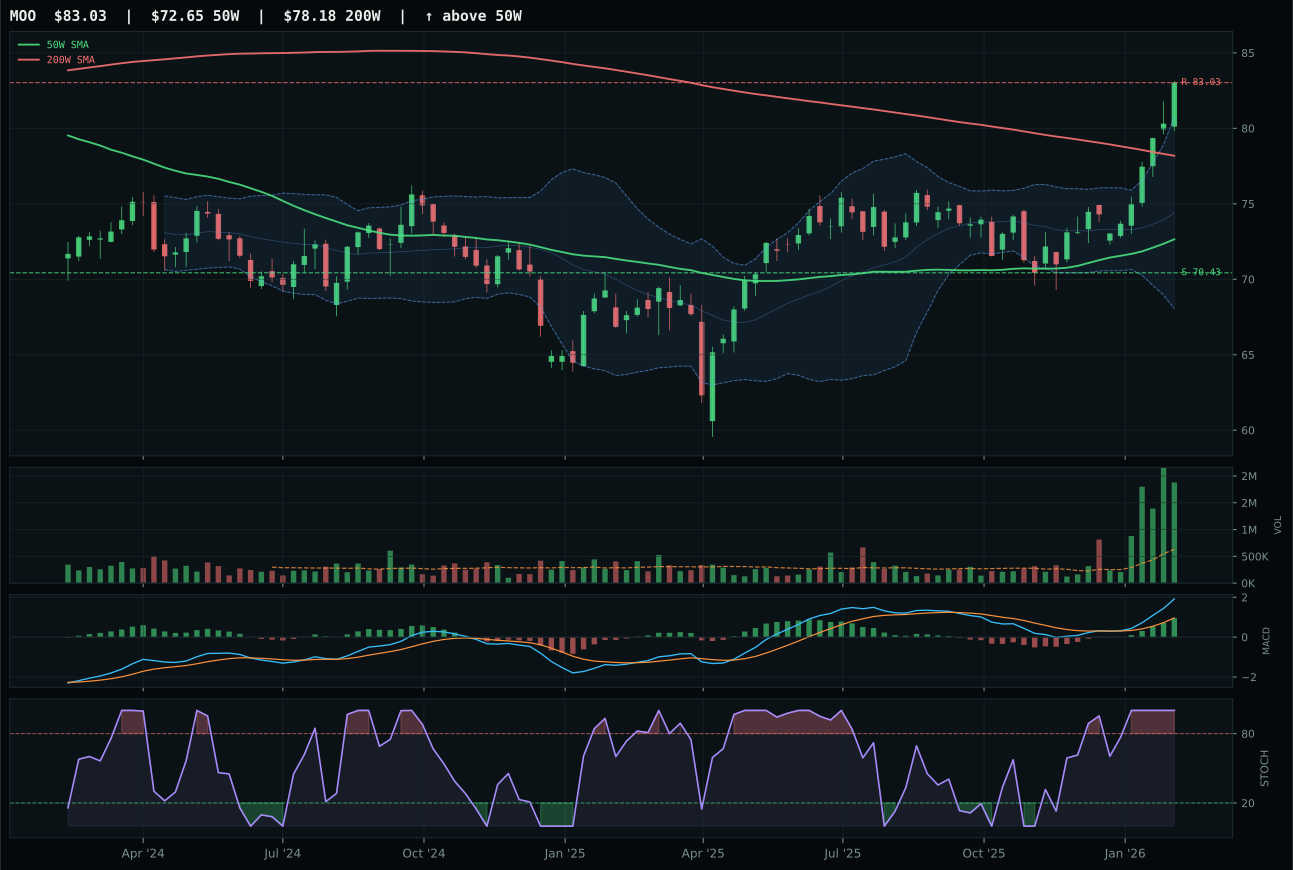
MOO has a neutral structure profile with 15.0% 13-week relative strength versus SPY.
A failed hold above support would weaken the setup.
Actionable but governed by invalidation levels.
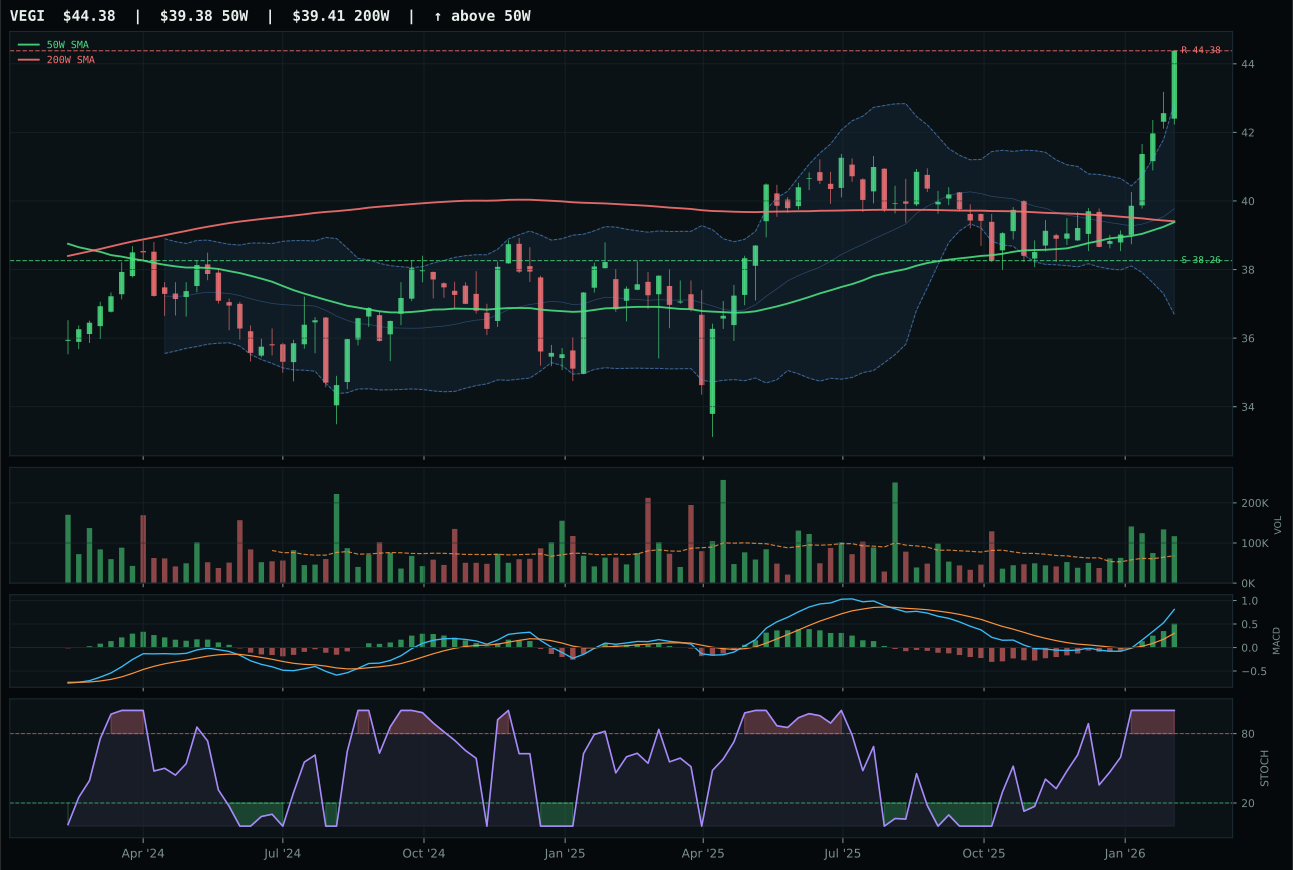
VEGI has a neutral structure profile with 12.3% 13-week relative strength versus SPY.
A failed hold above support would weaken the setup.
Tracked, but not top-2 eligible because: .
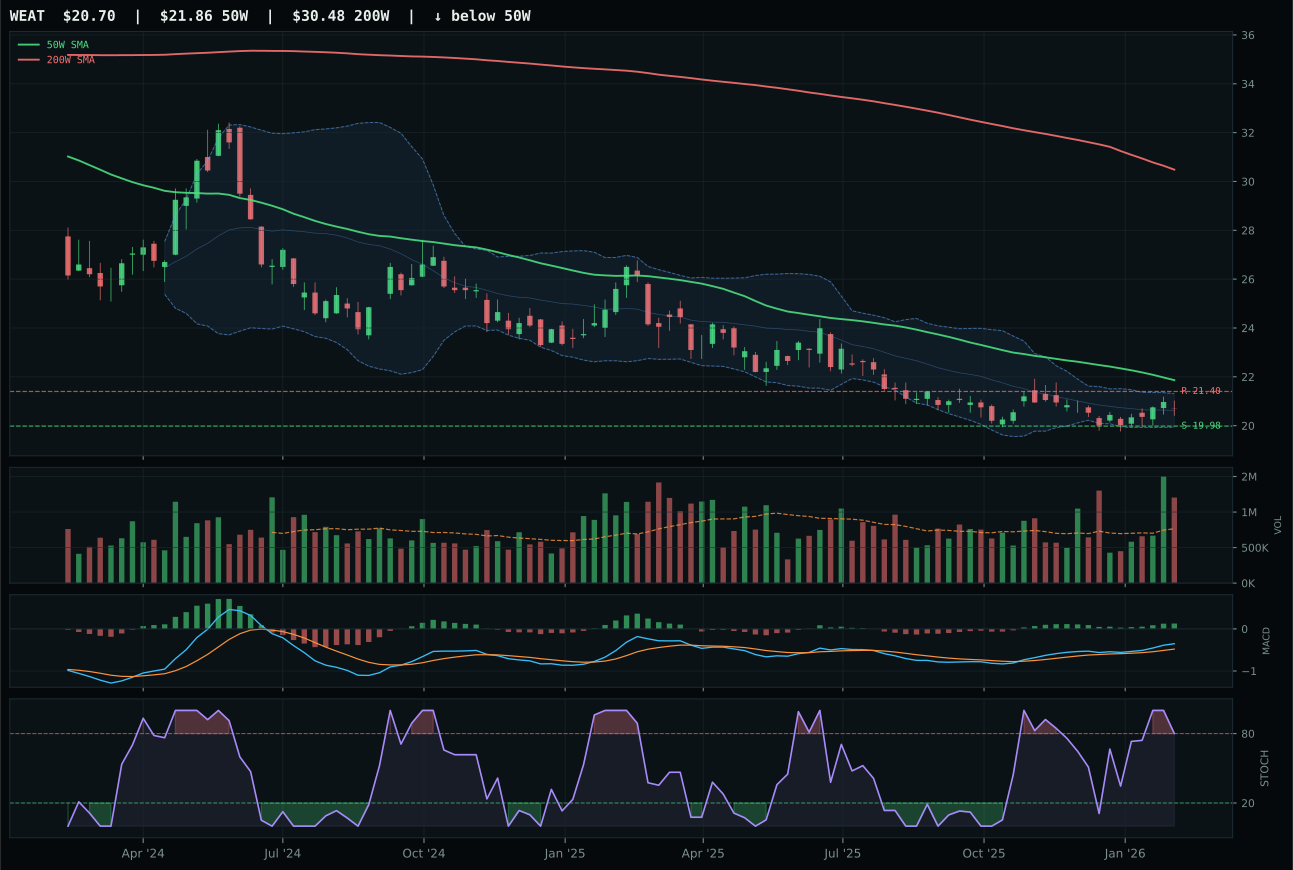
WEAT has a pullback into support profile with -4.1% 13-week relative strength versus SPY.
Extension and support failure are the main tactical risks.
Tracked, but not top-2 eligible because: structurally broken.
MOO dominated with perfect trend (100.0), perfect momentum (100.0), and exceptional volume-price confirmation (94.0) supported by 2.98x the 20W average volume—the highest in the entire portfolio this week. The 17.9% 13W return was paired with real category-relative strength at 2.6%, distinguishing MOO from the broader agribusiness rally; MACD actively improving and stochastic RSI overbought at 1.00 proved that new accumulation was still underway despite the extended 14.3% rise above the 50W. VEGI matched MOO on technical quality (both had perfect momentum and improving MACD) but failed to generate category leadership—0.0% relative strength versus MOO's 2.6%—indicating institutional money was choosing equity diversification (MOO) over global producer exposure (VEGI). Support at 70.43 and resistance at 83.03 bounded the setup tightly; zero upside to resistance signaled the entry was mature, but accumulation/confirmation volume at 1.96x average proved conviction was still present.
Agriculture & Livestock scored 46.2 and earned 10% because it delivered the highest macro fit (86.0) in the portfolio outside energy and emerging markets, driven by +13 supply shortage, +10 inflation, +8 real asset sponsorship, and +5 commodity breadth—a perfect storm of scarcity and real-asset demand. MOO's 100.0 technical evidence from trend and momentum was exceptional, yet the 59.0 timing score and 50.0 risk/reward reflected the 14.3% extension that left little room for technical followers to enter fresh. The allocation reflects a conviction trade: supply shortage and inflation support are durable, MOO's accumulation is authentic (not distribution), and the positioning offers hedging value against deflation fears in a Risk-On regime. However, timing risk is real—every new buyer from here is joining a trade that has already captured 17.9% in 13 weeks—so the 10% slot positions it as a tactical satellite holding rather than a core conviction.
Defense & Aerospace — ITA
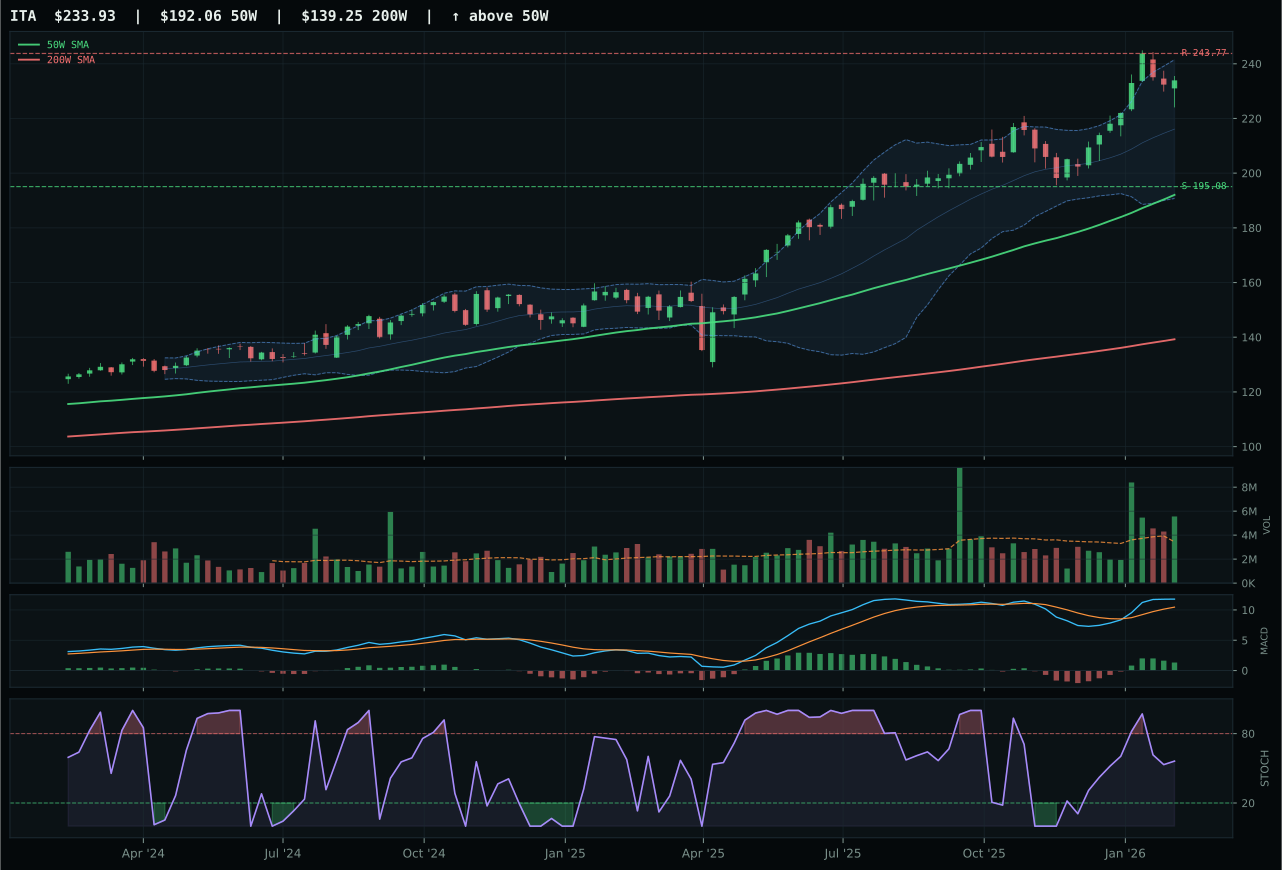
ITA has a vertical extension profile with 9.0% 13-week relative strength versus SPY.
A failed hold above support would weaken the setup.
Actionable but governed by invalidation levels.
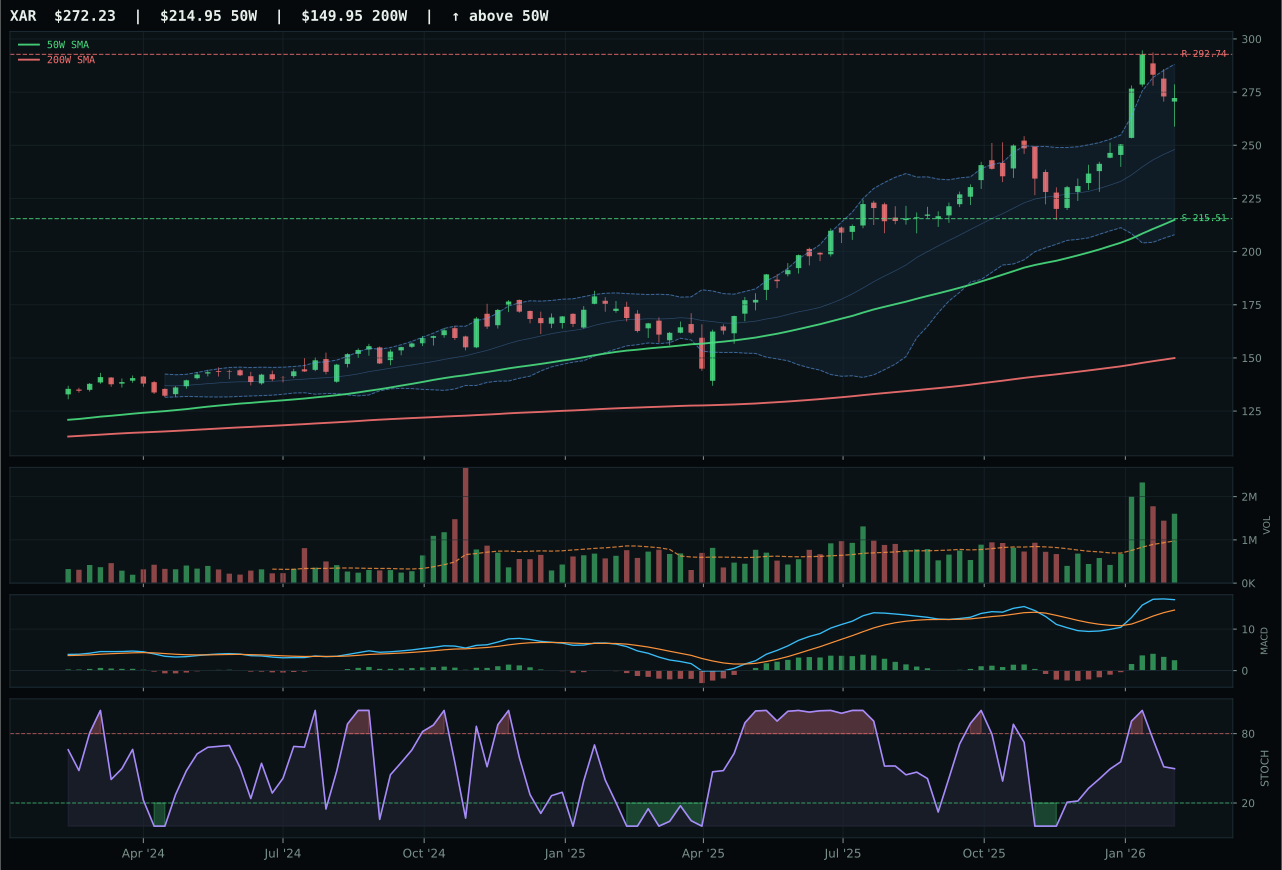
XAR has a vertical extension profile with 13.2% 13-week relative strength versus SPY.
A failed hold above support would weaken the setup.
Actionable but governed by invalidation levels.
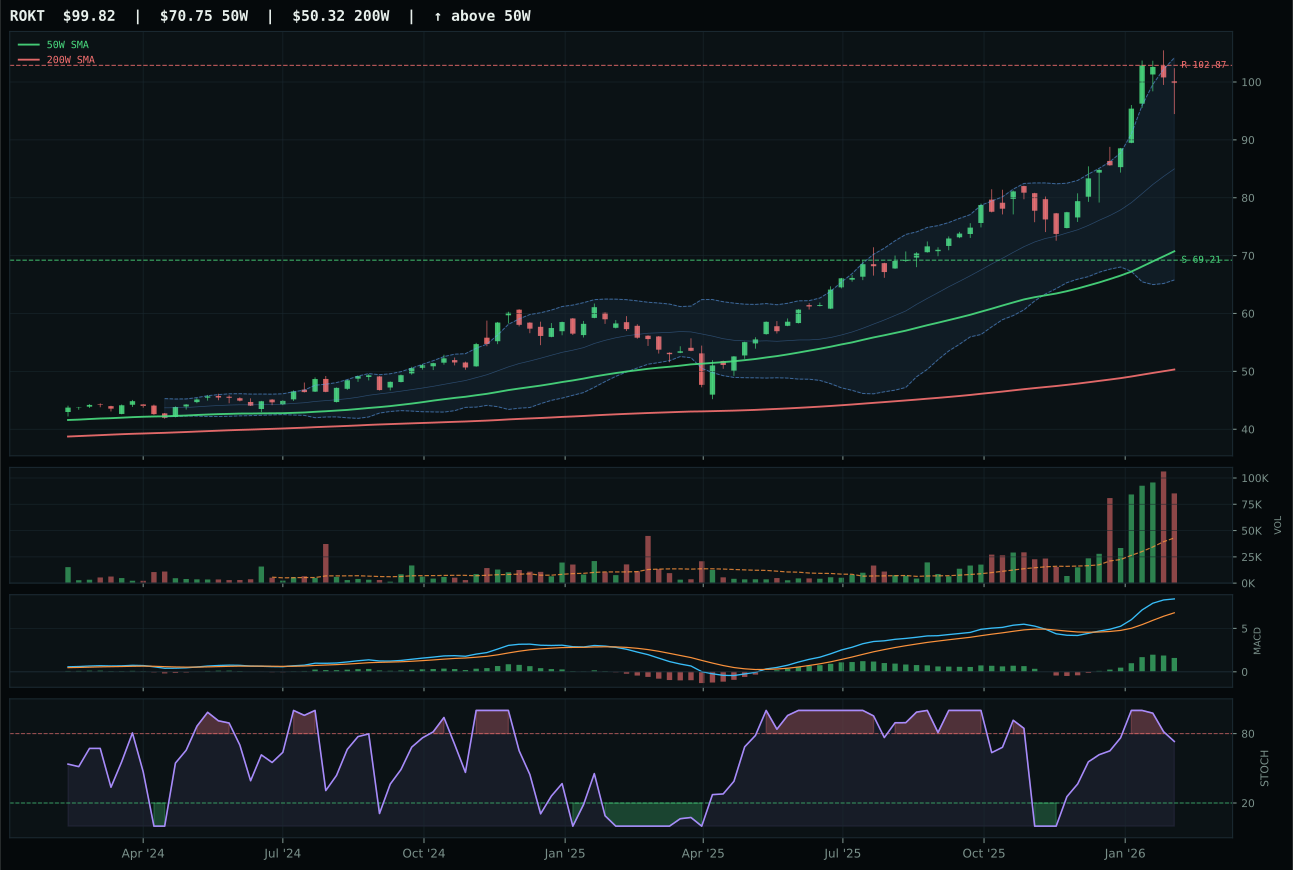
ROKT has a vertical extension profile with 25.4% 13-week relative strength versus SPY.
A failed hold above support would weaken the setup.
Tracked, but not top-2 eligible because: .
ITA won by combining clean vertical extension structure (82.7) with authentic volume confirmation at 1.62x the 20W average and MACD actively improving. The 11.9% 13W return and 9.0% SPY-relative strength were earned, not borrowed; stochastic RSI falling/neutral at 0.56 signaled momentum was maturing without rolling over. XAR displayed higher absolute returns (16.2% 13W, 13.2% SPY-relative), but those gains came with distribution pressure and lower structural integrity (72.1 vs 82.7), indicating that late-phase rally participants were exiting while ITA's early-to-mid accumulation phase persisted. Risk/reward favored ITA at 45.6 versus 41.8 because support at 195.08 provided 19.9% downside cushion without the extended multiple-expansion premium embedded in XAR's vertical run to near $292 resistance. The 50W slope of 0.9% demonstrated durability; both charts were extended, but ITA's was being built on stronger hands.
Defense & Aerospace is entirely excluded, ranking 9th among the ten categories with a 40.6 score. ITA's technical setup is clean, but the category-level macro fit is neutral (no strong tailwind or headwind), and that 9.0% relative strength to SPY does not offset the current regime bias toward commodity-linked and energy exposures. The portfolio is choosing energy outright (XLE and XOP) over defense because supply shortage, inflation, and energy scarcity descriptors are all active and driving broader risk-on flows; defense strength is more of a rotation play than a regime gift. ITA would need to break above 243.77 resistance on triple-volume participation to signal institutional re-rating, or credit stress would need to shift from -7 to +5 in the macro descriptor set; neither condition is met, so this category remains on the sideline.
Technology — XLK
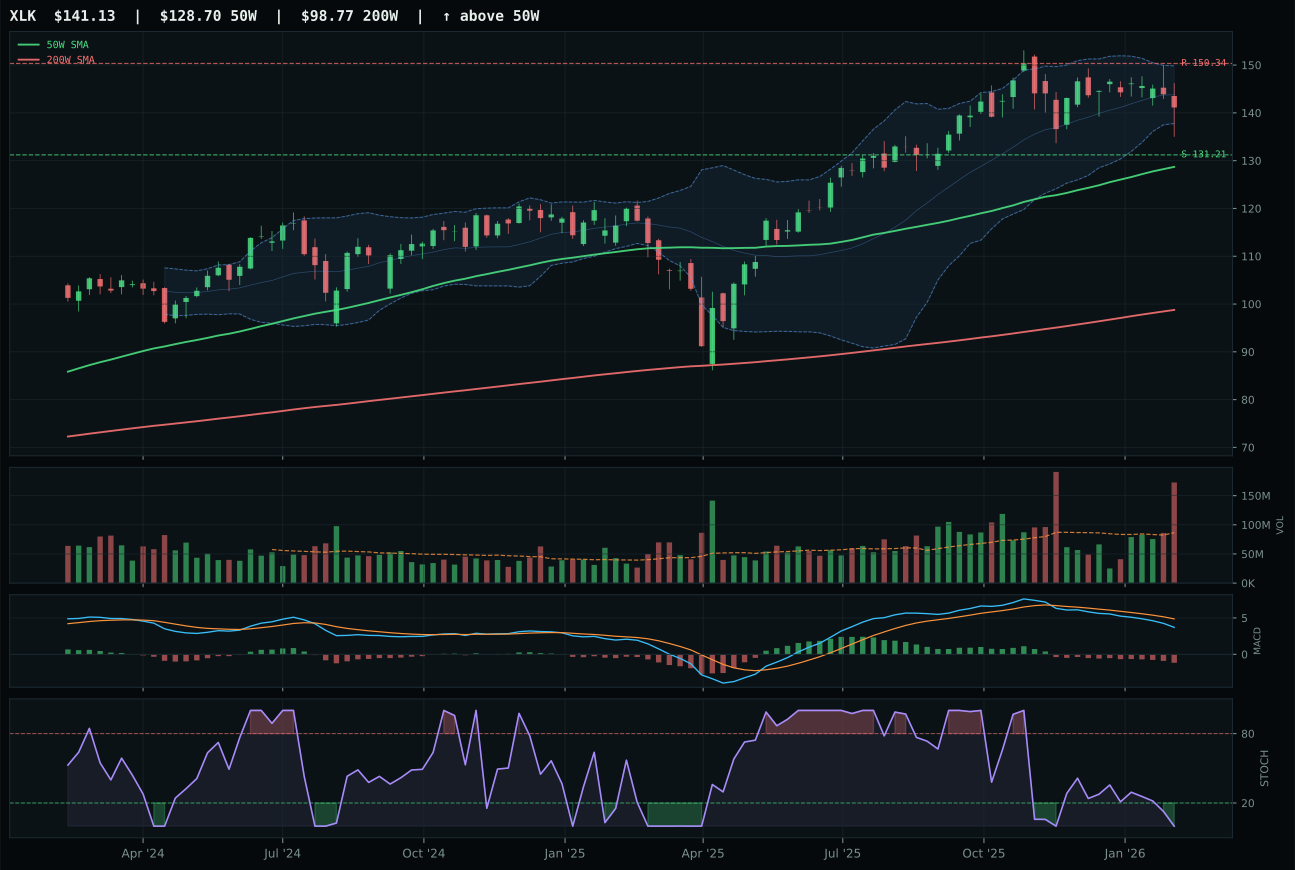
XLK has a neutral structure profile with -5.0% 13-week relative strength versus SPY.
A failed hold above support would weaken the setup.
Actionable but governed by invalidation levels.
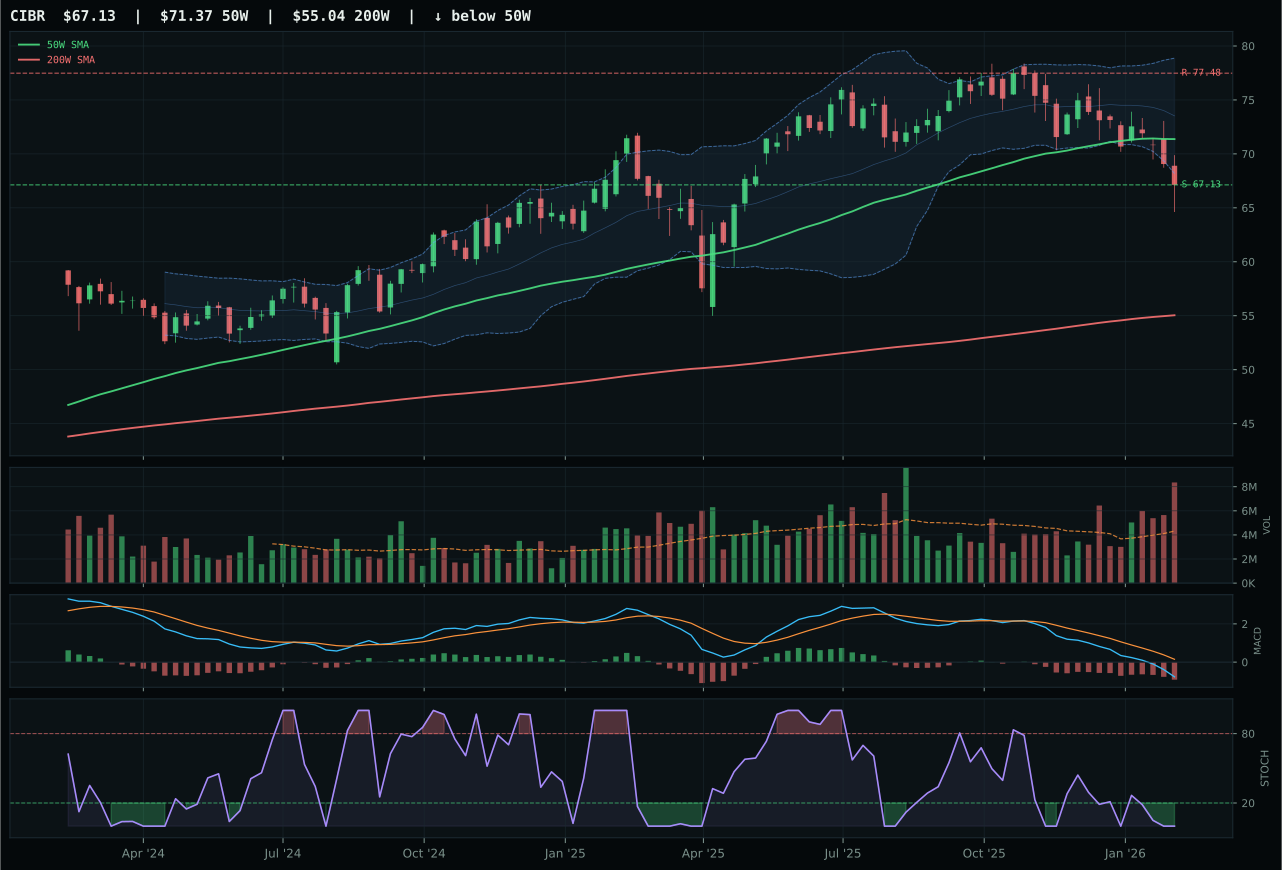
CIBR has a pullback into support profile with -13.9% 13-week relative strength versus SPY.
A failed hold above support would weaken the setup.
Actionable but governed by invalidation levels.
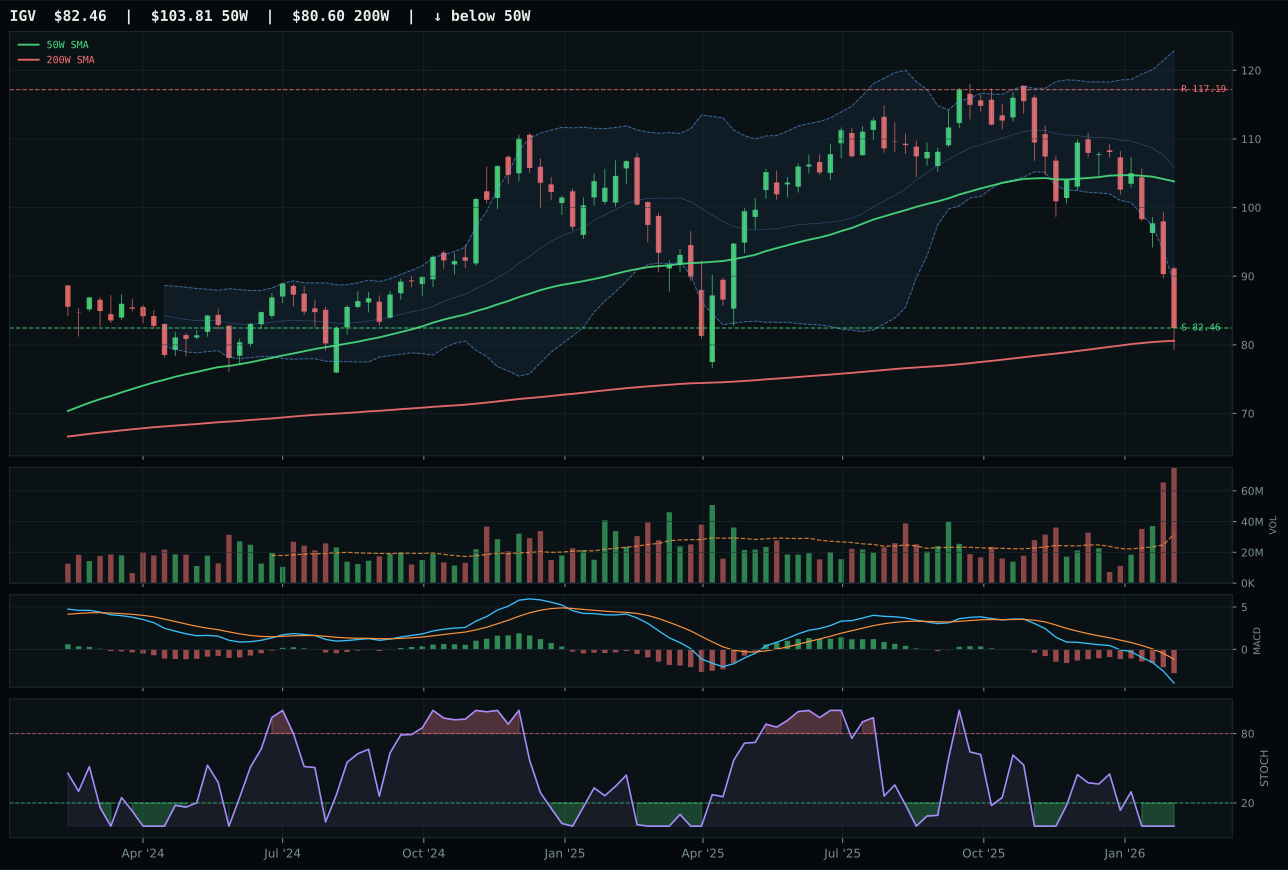
IGV has a pullback into support profile with -27.6% 13-week relative strength versus SPY.
A failed hold above support would weaken the setup.
Actionable but governed by invalidation levels.
XLK secured the category win by posting positive relative strength versus its peers (8.9% category-relative gain) while maintaining clean structure and solid trend confirmation. The 50W slope at 0.4% and price positioned just 9.7% above the 50W provided a measured entry into a neutral setup, avoiding the extreme extension penalties that plagued CIBR and IGV. CIBR's -13.9% SPY-relative weakness over 13 weeks and deteriorating breadth (0.0% category-relative strength) cost it the category decision despite a more attractive timing score; the MACD bearish/weakening signal and oversold stochastic RSI suggested mean reversion risk rather than conviction buying. XLK's momentum confirmation at 20.9 was modest and volume was distribution pressure, but these technical headwinds were offset by relative leadership within the peer basket and positive macro sponsorship from liquidity expansion and risk appetite.
Technology ranks 9th and receives zero allocation this week. The category's 36.3 score falls well below the portfolio's top-tier opportunities, and the representative's 13-week return of -2.0% against SPY's positive backdrop reveals a momentum divergence that no technical score can overcome in a risk-on liquidity expansion regime. The macro state actively penalizes this category: AI growth sponsorship is running hot across semiconductors and chip design, but the broader tech complex—hit by credit stress concerns and margin anxiety—is lagging equities by 500 basis points over 13 weeks. XLK would need to break above 150.34 resistance on clean volume confirmation and sustain +5% category-relative strength before earning a portfolio slot; as constructed, the risk/reward (6.1% upside, 7.6% downside) does not justify displacement of higher-conviction energy and emerging-market trades.