
2026-01-30
Informational purposes only. The content in this report, including allocations, analysis, and commentary, is provided solely for informational and educational purposes. It does not constitute financial advice, investment advice, trading advice, or any other type of advice. Past performance does not guarantee future results. Always conduct your own research and consult a qualified financial professional before making investment decisions.
Weekly Allocation
| Ticker | Category | Weight | Role |
|---|---|---|---|
| XLE | Traditional Energy | 20% | Top-2 (20%) |
| COPX | Industrial Metals | 20% | Top-2 (20%) |
| SMH | AI | 10% | Tier-2 (10%) |
| MOO | Agriculture & Livestock | 10% | Tier-2 (10%) |
| URNM | Nuclear Energy | 10% | Tier-2 (10%) |
| GLD | Precious Metals | 10% | Tier-2 (10%) |
| IGF | Utilities & Infrastructure | 10% | Tier-2 (10%) |
| XAR | Defense & Aerospace | 10% | Tier-2 (10%) |
Trade Instructions — Monday Open
Sell the tranche from 2026-01-02 (completing its 4-week hold). Buy the new tranche. Instructions show net portfolio changes — same-asset positions cancel, weight changes show the delta.
| Action | Ticker | Instruction |
|---|---|---|
| SELL | IEMG | Sell 50% of IEMG position (reduce 10.00% → 5.00%) |
| SELL | SLV | Sell 25% of SLV position (reduce 10.00% → 7.50%) |
| SELL | XLK | Sell 50% of XLK position (reduce 5.00% → 2.50%) |
| SELL | ITA | Sell entire ITA position (2.50% of portfolio) |
| SELL | PAVE | Sell 50% of PAVE position (reduce 5.00% → 2.50%) |
| BUY | XAR | Buy XAR — 16.67% of freed cash (adds 2.50% to portfolio) |
| BUY | XLE | Buy XLE — 33.33% of freed cash (adds 5.00% to portfolio) |
| BUY | MOO | Buy MOO — 16.67% of freed cash (adds 2.50% to portfolio) |
| BUY | GLD | Buy GLD — 16.67% of freed cash (adds 2.50% to portfolio) |
| BUY | IGF | Buy IGF — 16.67% of freed cash (adds 2.50% to portfolio) |
Current Portfolio After Trade
Combined holdings across all 4 active tranches. Each tranche is 25% of the portfolio.
| Ticker | % of Portfolio | Weight Bar |
|---|---|---|
| REMX | 15.00% | |
| SMH | 15.00% | |
| XLE | 12.50% | |
| URNM | 10.00% | |
| SLV | 7.50% | |
| XAR | 7.50% | |
| IEMG | 5.00% | |
| XLU | 5.00% | |
| MOO | 5.00% | |
| COPX | 5.00% | |
| XLK | 2.50% | |
| PAVE | 2.50% | |
| ILF | 2.50% | |
| GLD | 2.50% | |
| IGF | 2.50% |
Macro Regime — Late-Cycle Reflation
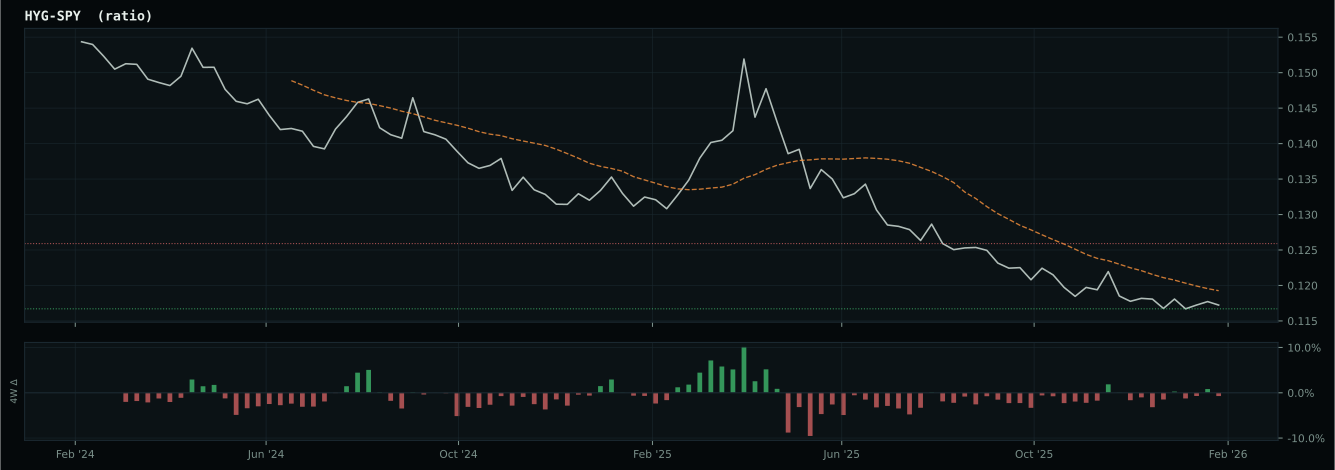
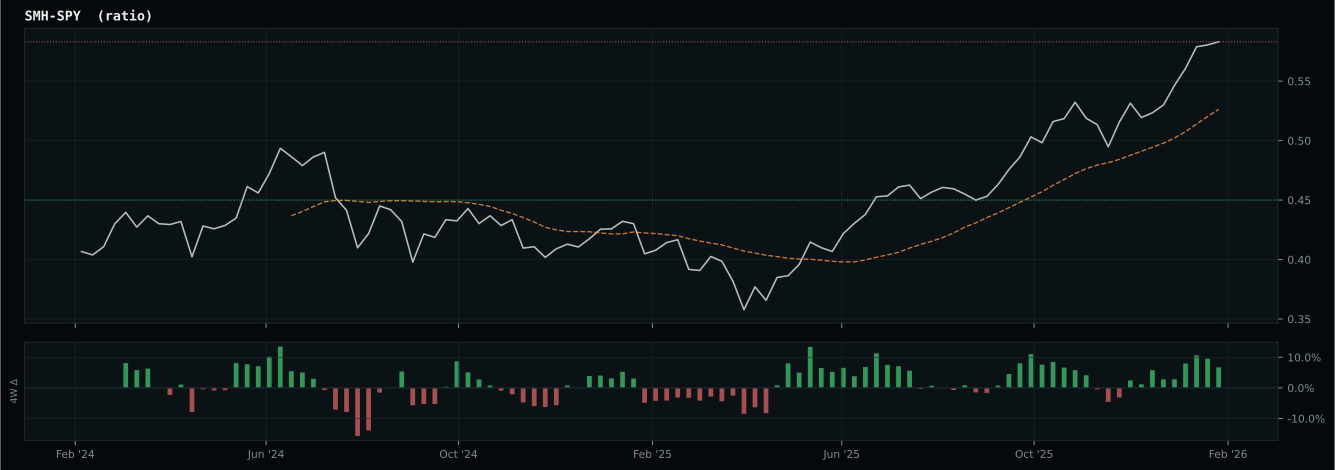
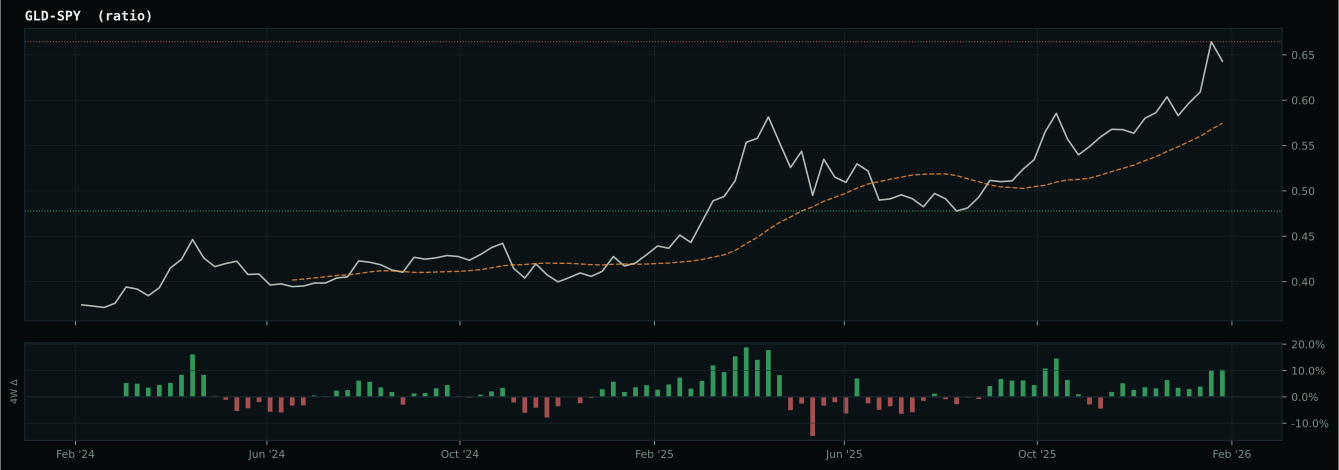
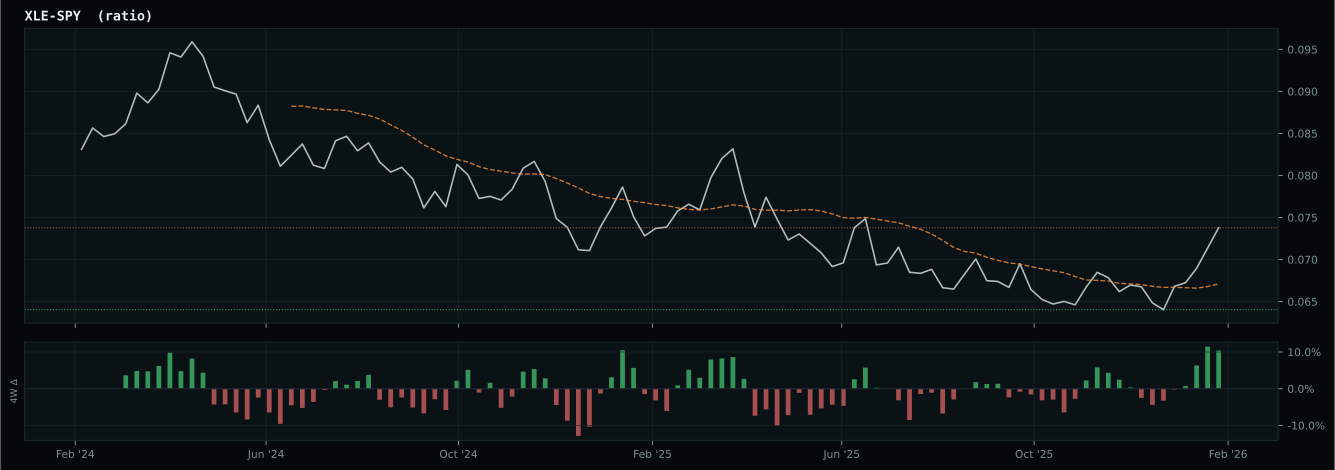
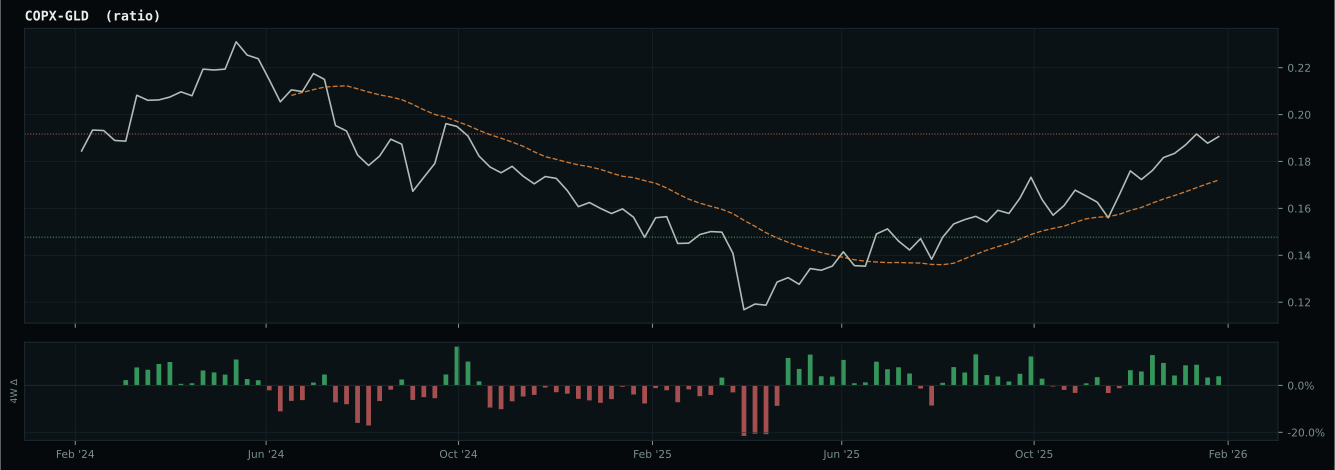
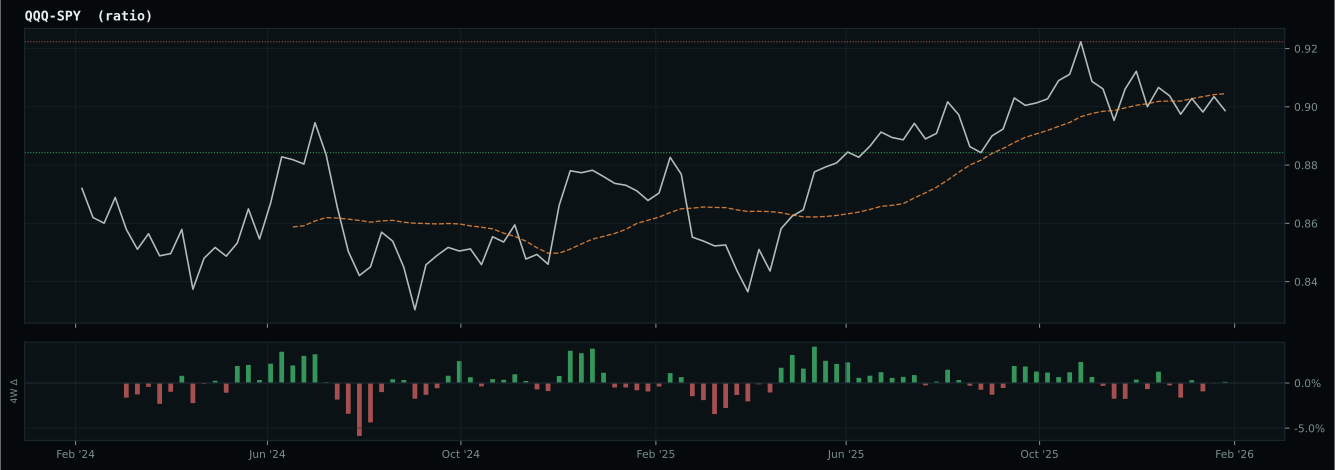
Macro Evidence Charts
Market-implied signals behind the macro regime scores. Each ratio compares two assets; the direction and slope of the ratio is what the macro engine reads.
Crypto Regime — NoCrypto
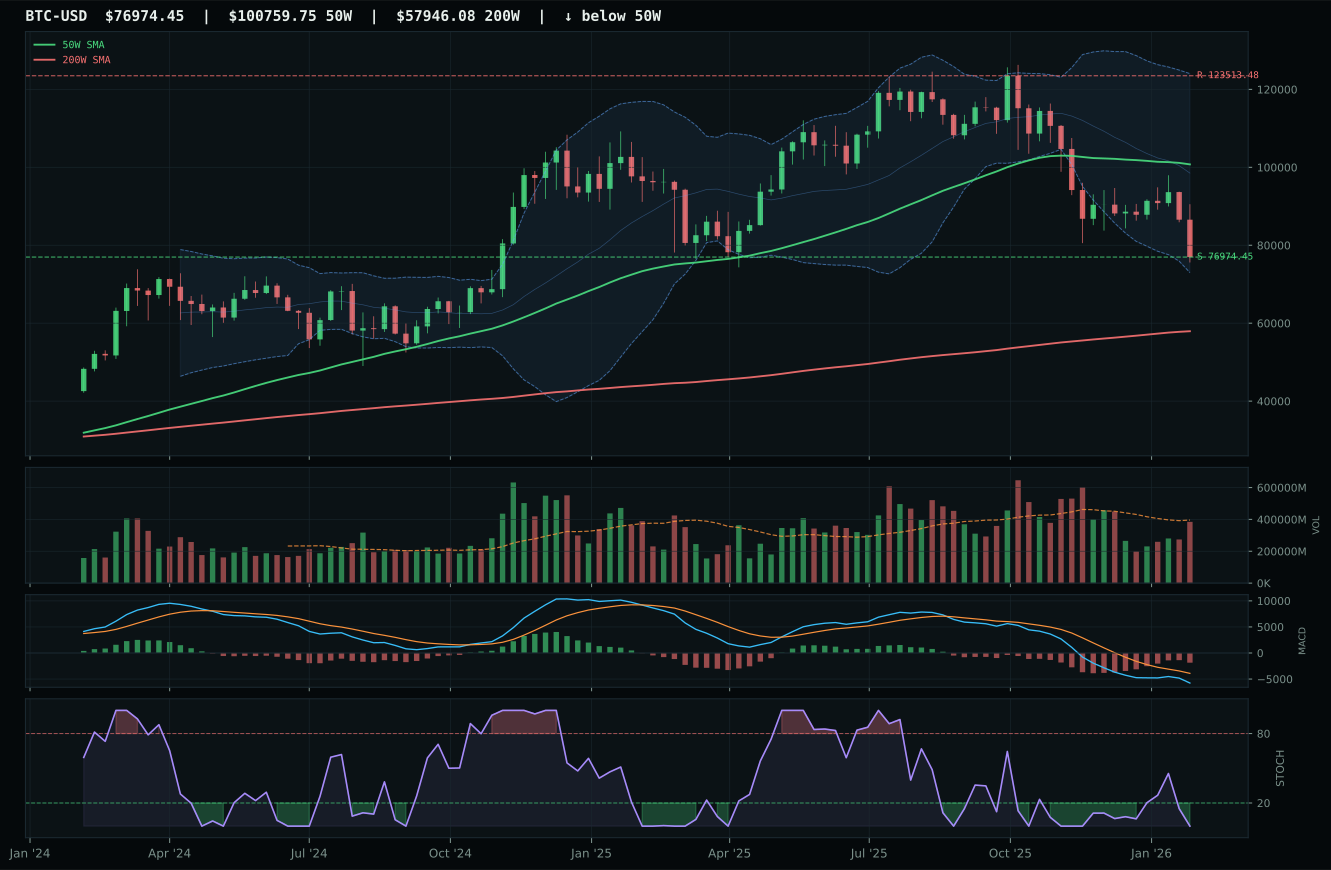
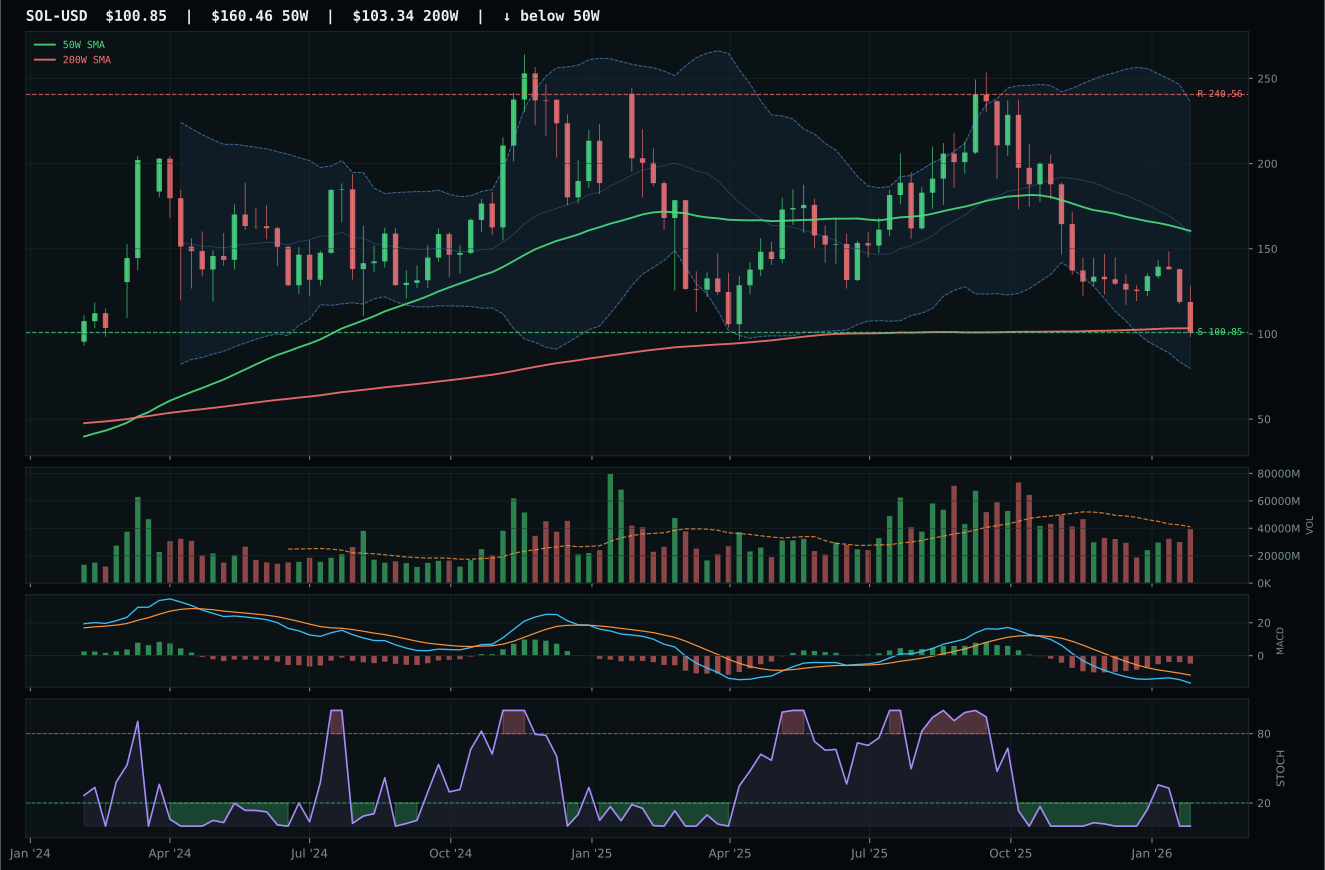
ValueBTC not armed: BTC has not made the first post-breakdown touch of the 200W buy zone after losing the 50W
TrendBTC not confirmed
one or more available conditions failed
Category Rankings
| Rank | Category | Winner | Score | Alloc | 4W Ret | Peers (4W) |
|---|---|---|---|---|---|---|
| 1 | Traditional Energy | XLE | 92.2 | 20% | +15.31% | FCG +17.3% · XOP +18.6% |
| 2 | Industrial Metals | COPX | 59.2 | 20% | +10.65% | REMX +16.3% · PICK +10.8% |
| 3 | AI | SMH | 58.8 | 10% | -0.40% | BOTZ +2.5% · AIQ -5.5% |
| 4 | Agriculture & Livestock | MOO | 51.3 | 10% | +6.64% | VEGI +9.3% · WEAT +8.3% |
| 5 | Nuclear Energy | URNM | 49.5 | 10% | -3.71% | URA -1.9% · NLR -1.6% |
| 6 | Precious Metals | GLD | 49.3 | 10% | +12.92% | SLV +10.0% · GDX +23.9% |
| 7 | Utilities & Infrastructure | IGF | 47.2 | 10% | +6.91% | PAVE +7.6% · XLU +9.5% |
| 8 | Defense & Aerospace | XAR | 43.9 | 10% | +6.55% | ITA +7.3% · ROKT +3.7% |
| 9 | Emerging Markets | ILF | 43.6 | 0% | +1.53% | IEMG +3.8% · INDA -0.5% |
| 10 | Technology | XLK | 34.7 | 0% | -4.53% | CIBR -9.4% · IGV -11.4% |
Traditional Energy — XLE
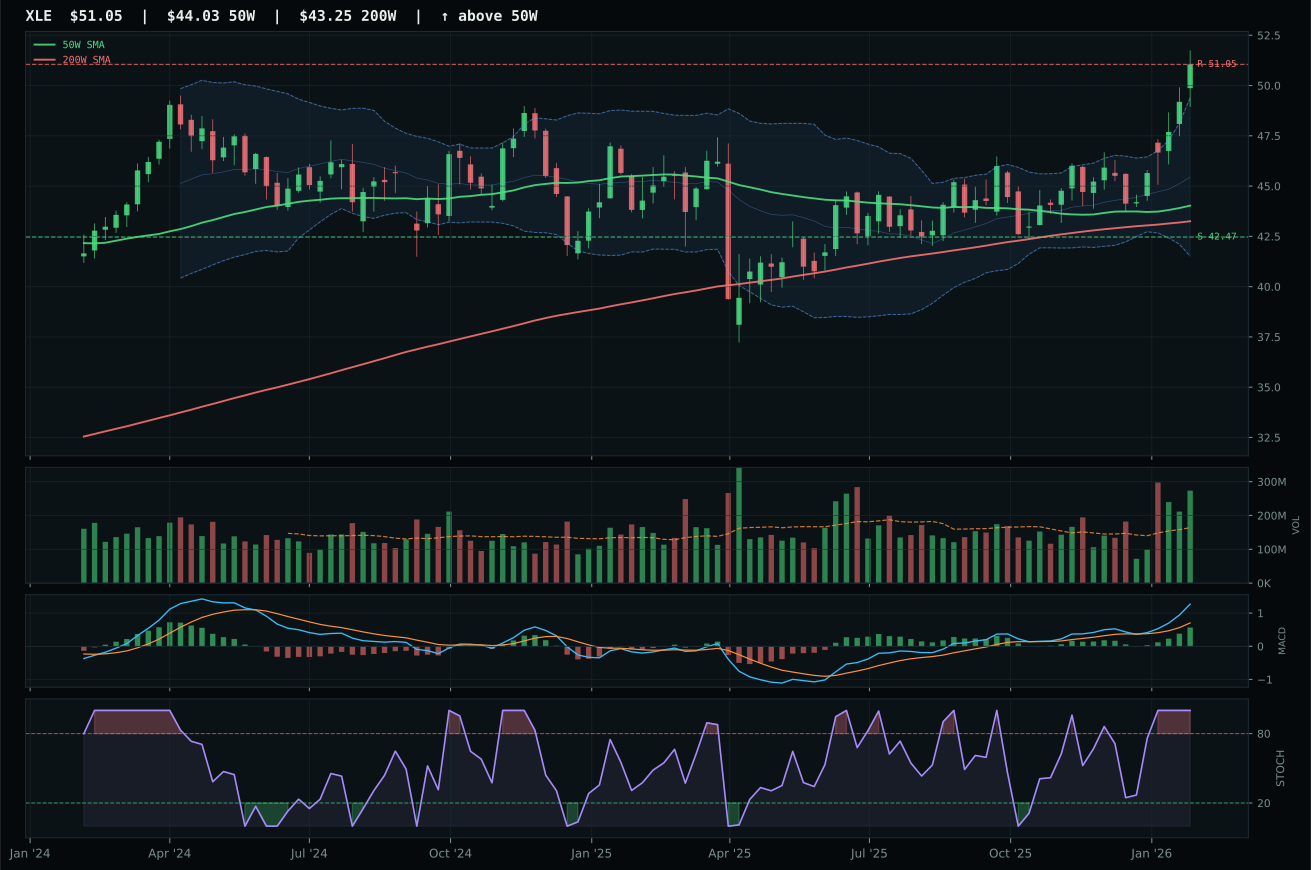
XLE has a vertical extension profile with 14.4% 13-week relative strength versus SPY.
A failed hold above support would weaken the setup.
Actionable but governed by invalidation levels.
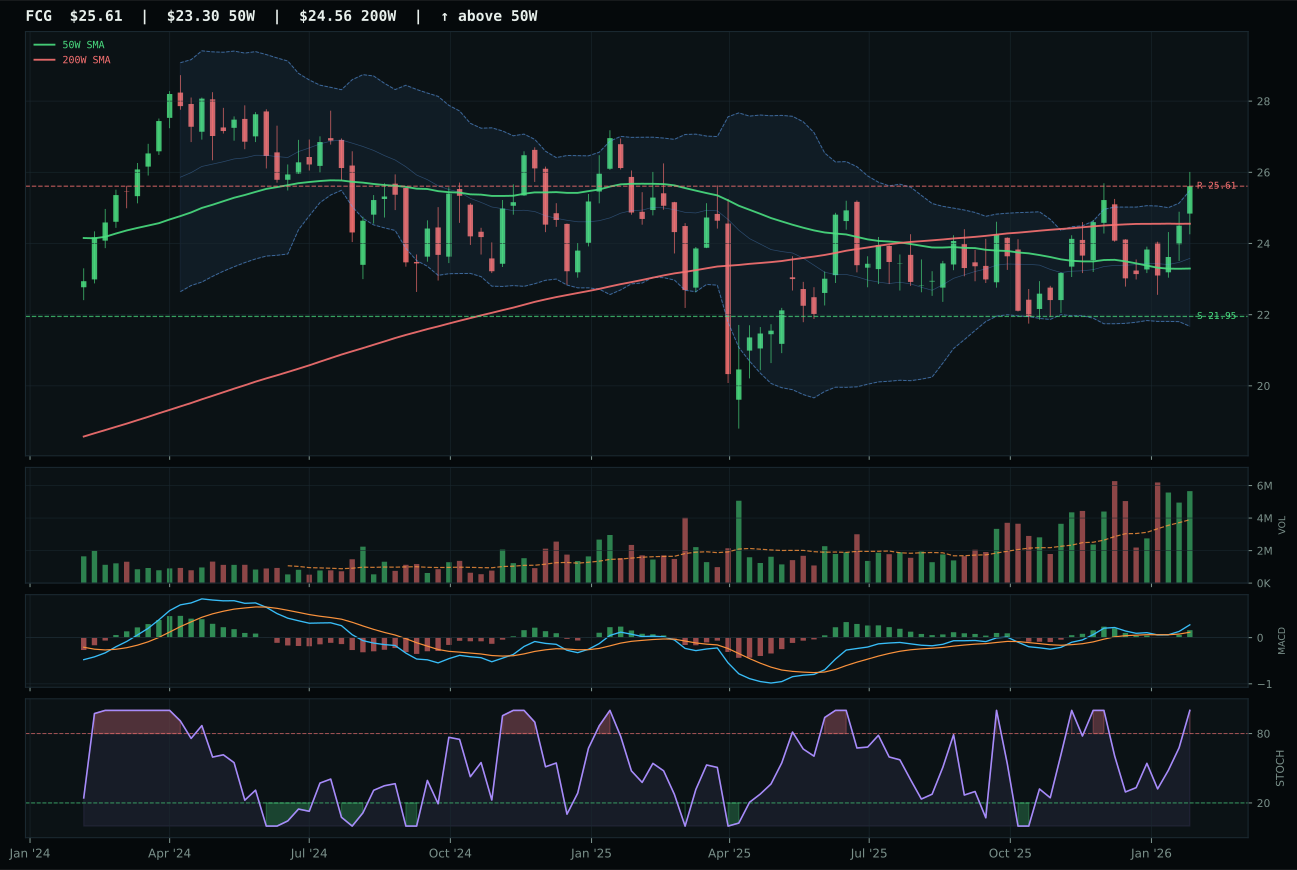
FCG has a neutral structure profile with 12.8% 13-week relative strength versus SPY.
A failed hold above support would weaken the setup.
Actionable but governed by invalidation levels.
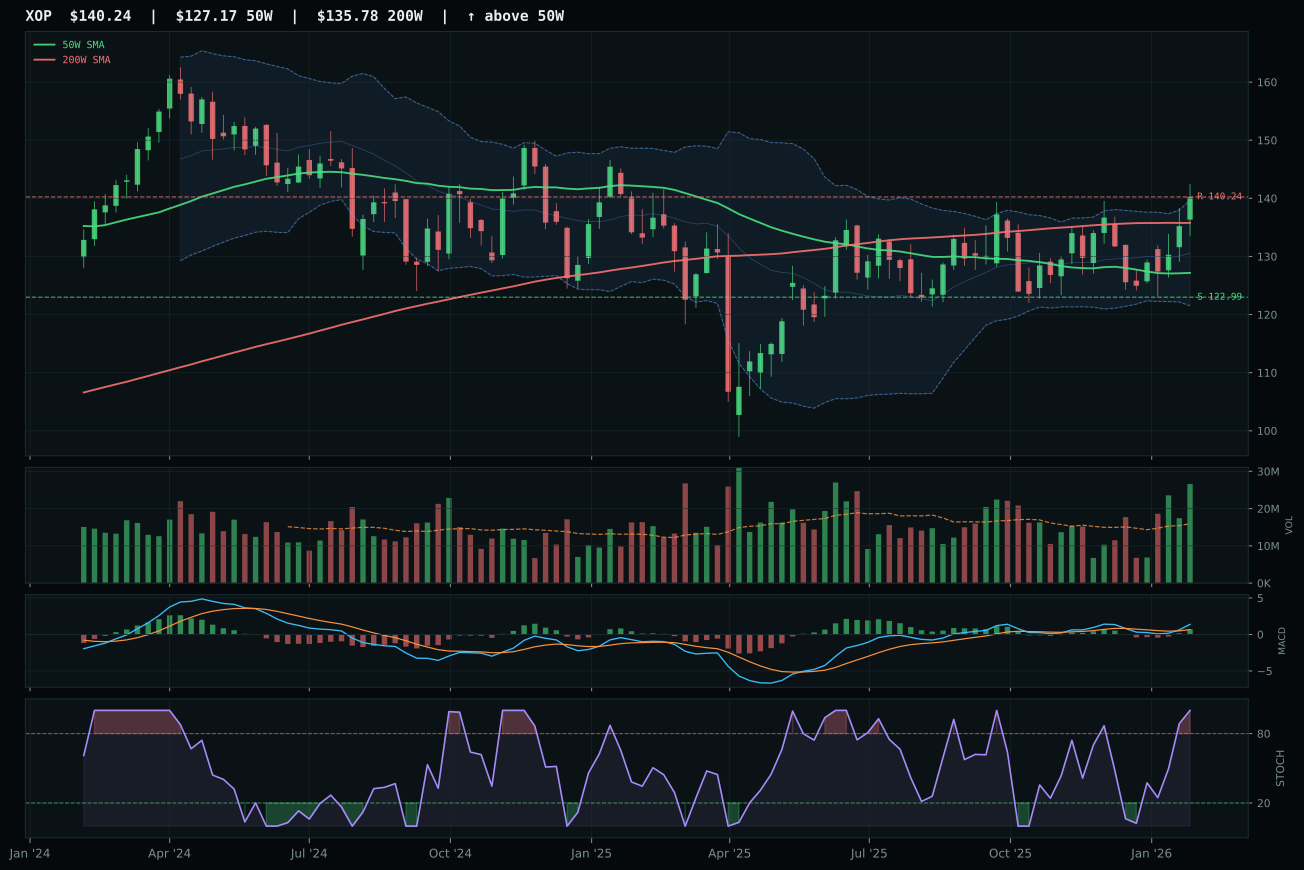
XOP has a neutral structure profile with 9.1% 13-week relative strength versus SPY.
A failed hold above support would weaken the setup.
Actionable but governed by invalidation levels.
XLE dominates the top-2 ranking by combining a perfect 100.0/100 trend score with a 86.0/100 structure score and 100.0/100 momentum confirmation, powered by 15.9% thirteen-week returns, 14.4% SPY relative strength, and a stochastic RSI stuck at 1.00 with accumulation/confirmation volume at 1.67x the 20-week average. FCG and XOP, the runners-up, show superior technical evidence scores (91.0 and 96.0 respectively), yet they surrender to XLE's leadership precisely where it matters most: category-relative strength at plus 1.6% versus zero percent for both competitors, and volume confirmation (accumulation/confirmation versus above-average participation) that proves institutional buyers are rotating into integrated energy cash-flow rather than pure-play natural gas or exploration upside. The chart sits 15.9% above the 50-week at near the 52-week high, triggering a timing score of only 37.0/100, but that is the cost of leadership in a fast-moving market—XLE has already captured the move and is being held, not chased.
Traditional Energy earns its 20% top-2 allocation because the category itself scores 92.2 on the back of a macro fit of 90.0/100 where late-cycle reflation adds twelve points, energy scarcity adds sixteen, inflation pressure adds ten, supply shortage adds nine, and real asset sponsorship adds seven. This is the single strongest macro alignment in the portfolio, and the allocation system is rightly reflecting that conviction by pairing XLE with COPX at equal weight. XLE's 100.0/100 technical evidence and persistence of 89.8/100 confirm that the move is not a short-term bounce; it is a structural reallocation into energy producers as inflation and supply constraints force real yields higher and discount rates lower on cash-generative assets. The 49.1/100 risk-reward and 15.9% extension suggest caution on new entry, yet the combination of perfect trend, perfect momentum confirmation, and optimal macro regime justifies holding every unit of the 20% allocation. This is portfolio core rather than tactical trade; do not reduce below 20% unless energy scarcity flips to inactive or supply shortage ceases.
Industrial Metals — COPX
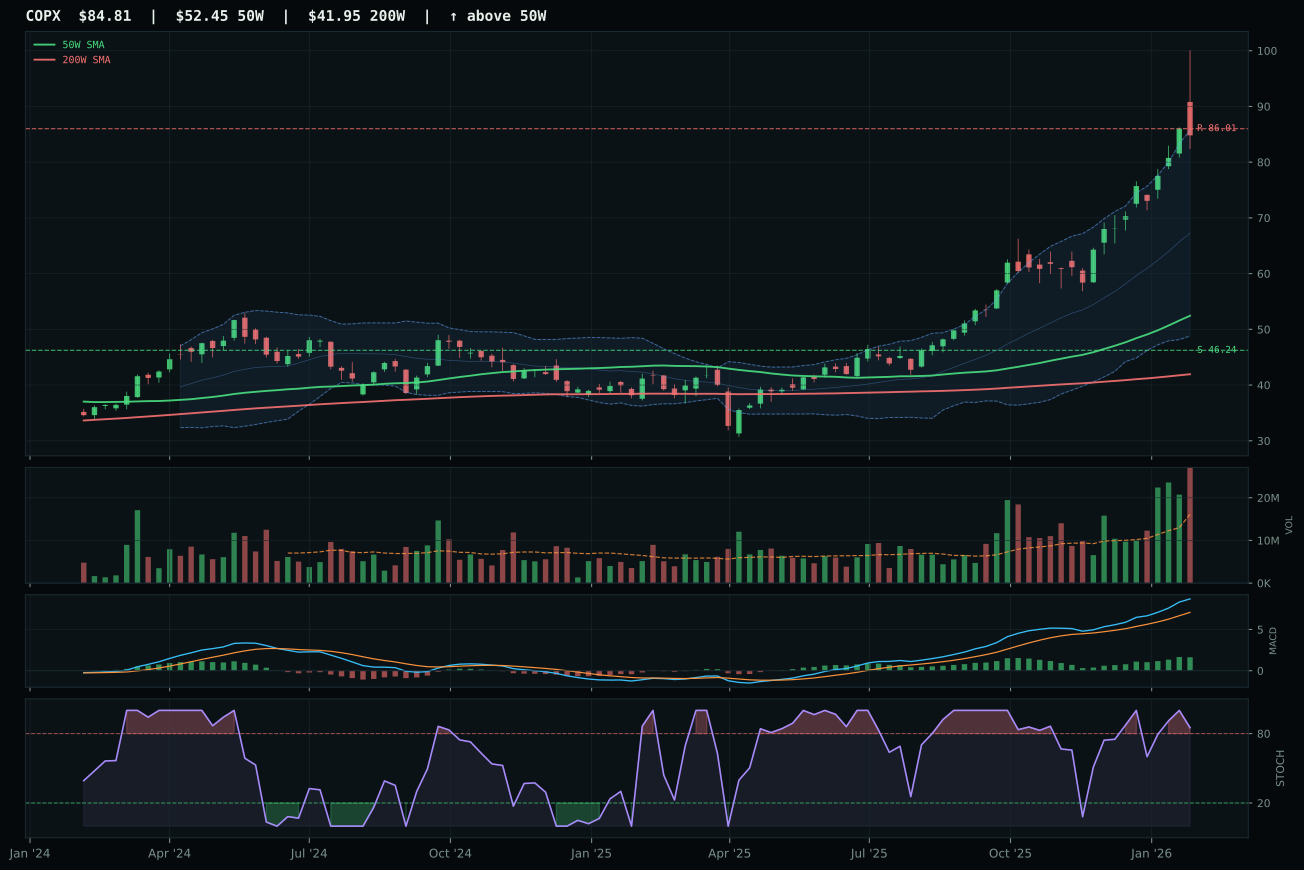
COPX has a vertical extension profile with 35.9% 13-week relative strength versus SPY.
A failed hold above support would weaken the setup.
Actionable but governed by invalidation levels.
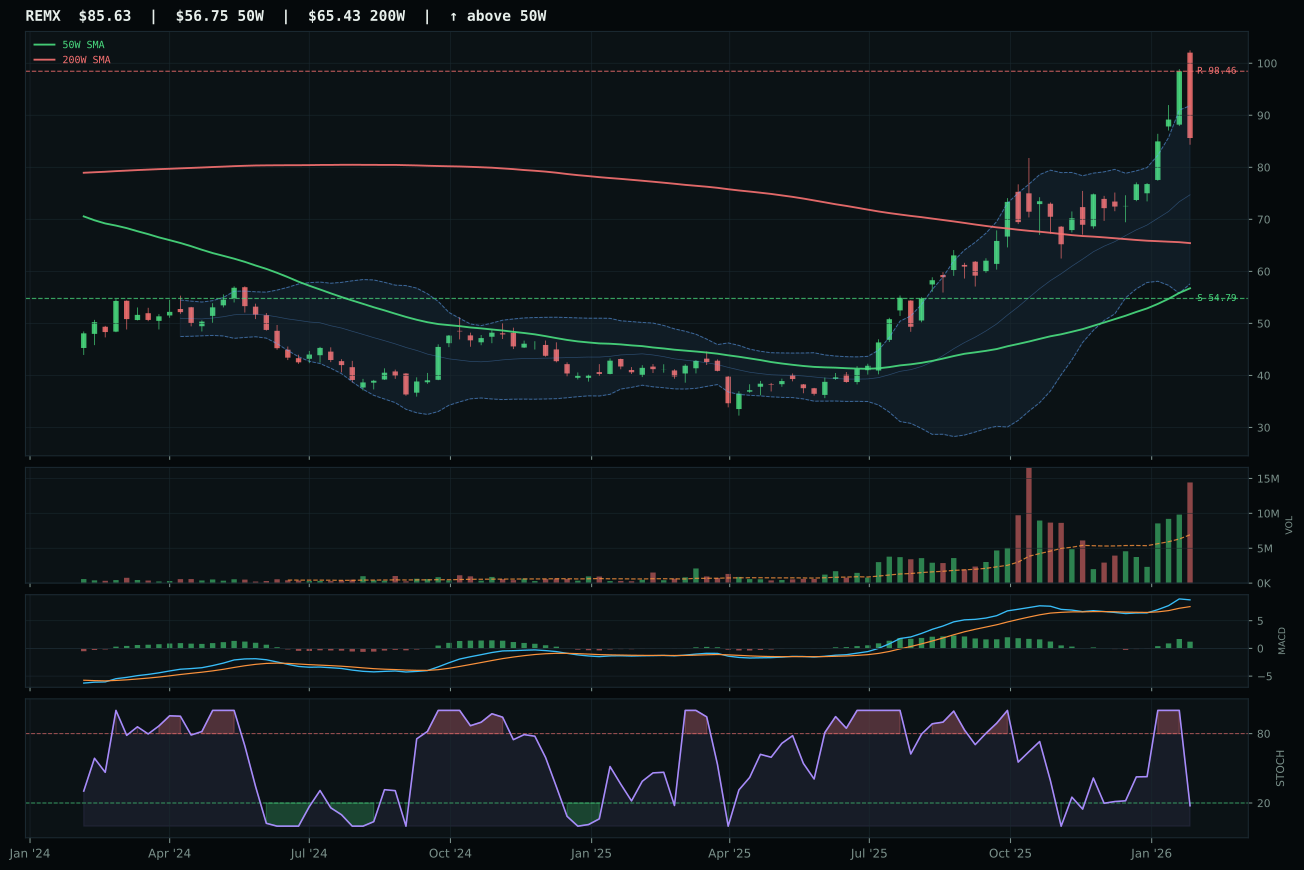
REMX has a vertical extension profile with 20.0% 13-week relative strength versus SPY.
A failed hold above support would weaken the setup.
Actionable but governed by invalidation levels.
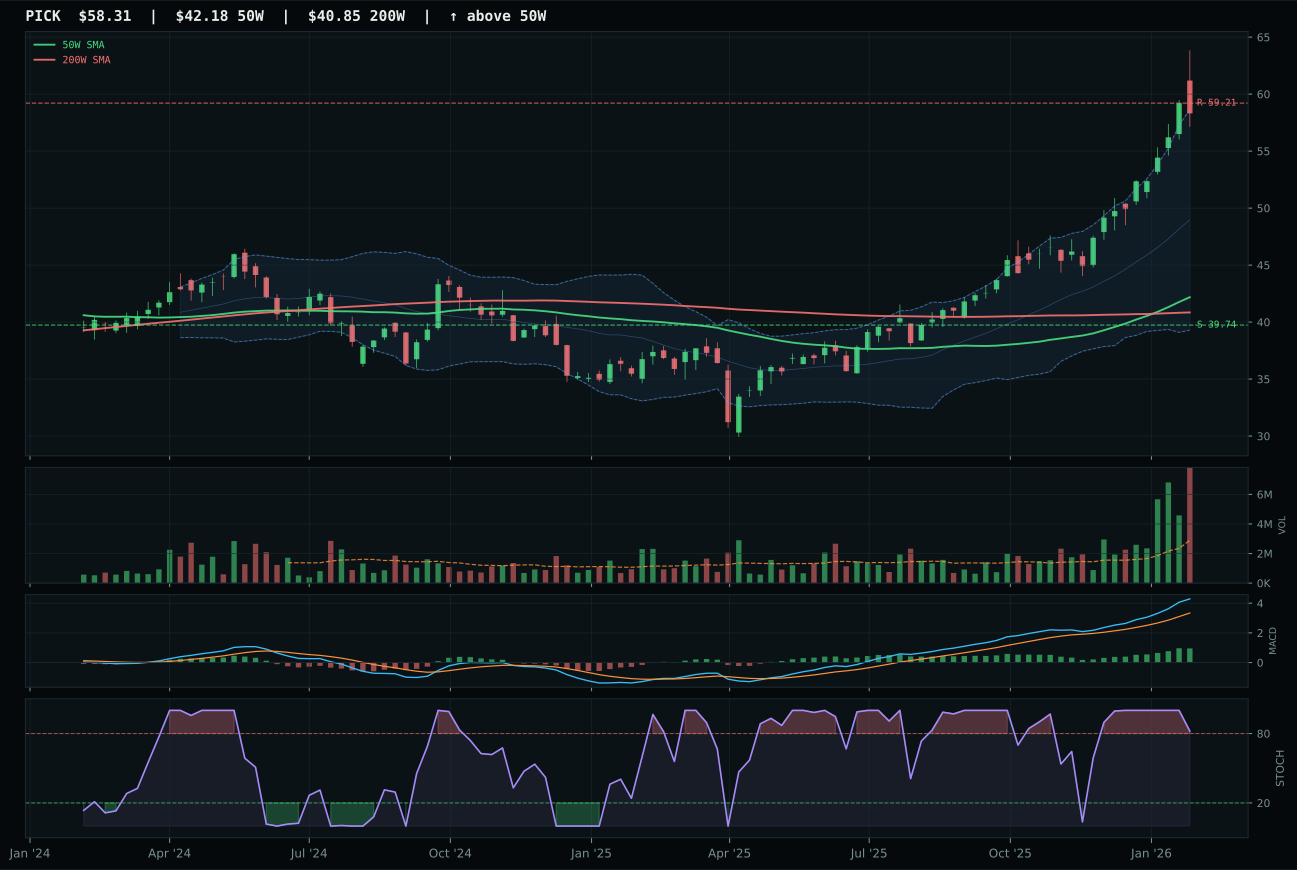
PICK has a vertical extension profile with 23.8% 13-week relative strength versus SPY.
A failed hold above support would weaken the setup.
Actionable but governed by invalidation levels.
COPX earns the top-2 slot with a commanding 59.2 category score by delivering 37.3% thirteen-week returns with 35.9% SPY relative strength and 12.1% category-relative strength, all from a copper-scarcity-driven thesis that has attracted 4.17x volume participation into its vertical extension 61.7% above the 50-week moving average. REMX trails by 4.0 points despite showing superior risk-reward at 26.2 versus COPX's 37.3, because its negative 3.7% category-relative strength reveals that allocators are choosing copper leadership over rare-earth scarcity, likely because copper's industrial demand breadth during reflation is less policy-dependent than rare-earth AI buildout. COPX's momentum confirmation score of 100.0/100 and bullish improving MACD, paired with a 4-week return of 16.1%, prove the move is accumulating fresh capital weekly rather than subsisting on prior momentum.
Industrial Metals claims top-2 status with a 59.2 final score because its macro fit of 75.0/100 is exceptional—late-cycle reflation adds ten points, metals scarcity adds fourteen, commodity breadth adds ten, and real asset sponsorship adds six—creating an environment where COPX's extended technical setup is not a warning sign but confirmation that the reflation thesis is working. COPX's technical evidence of 53.9/100 is moderate, not brilliant, but the 92.3/100 persistence score indicates this is not a two-week momentum spike; it is a structural rotation into commodity leadership that will sustain through mid-cycle. The challenge is entry: 61.7% extension and 37.3/100 risk-reward mean every new buyer is fighting negative expected value, yet the macro alignment is so strong that passing on this allocation slot now to wait for a better entry risks missing the reflation narrative entirely. This is a forced hold; do not add, but do not exit on pullbacks above 50% of the 50-week moving average.
AI — SMH
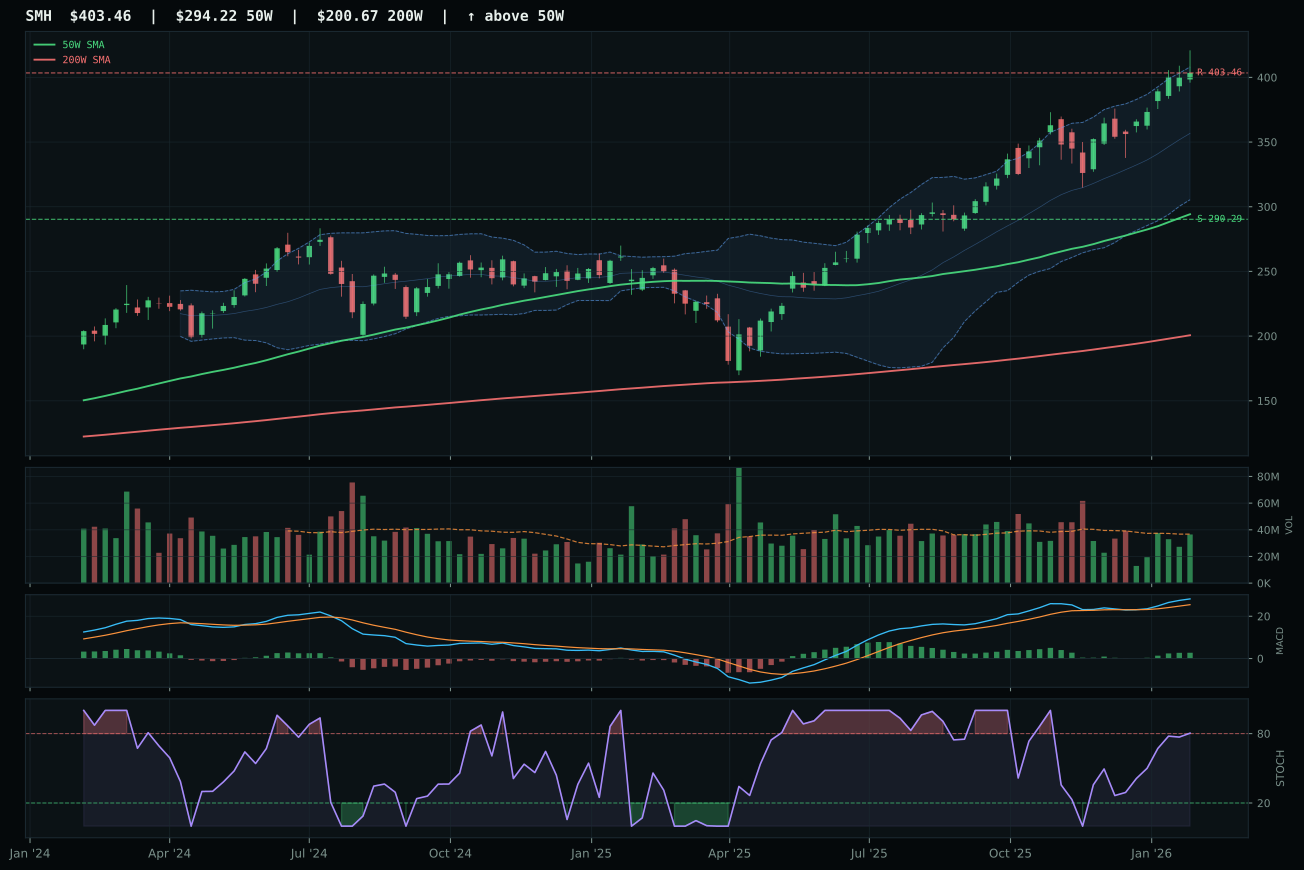
SMH has a vertical extension profile with 9.7% 13-week relative strength versus SPY.
A failed hold above support would weaken the setup.
Actionable but governed by invalidation levels.
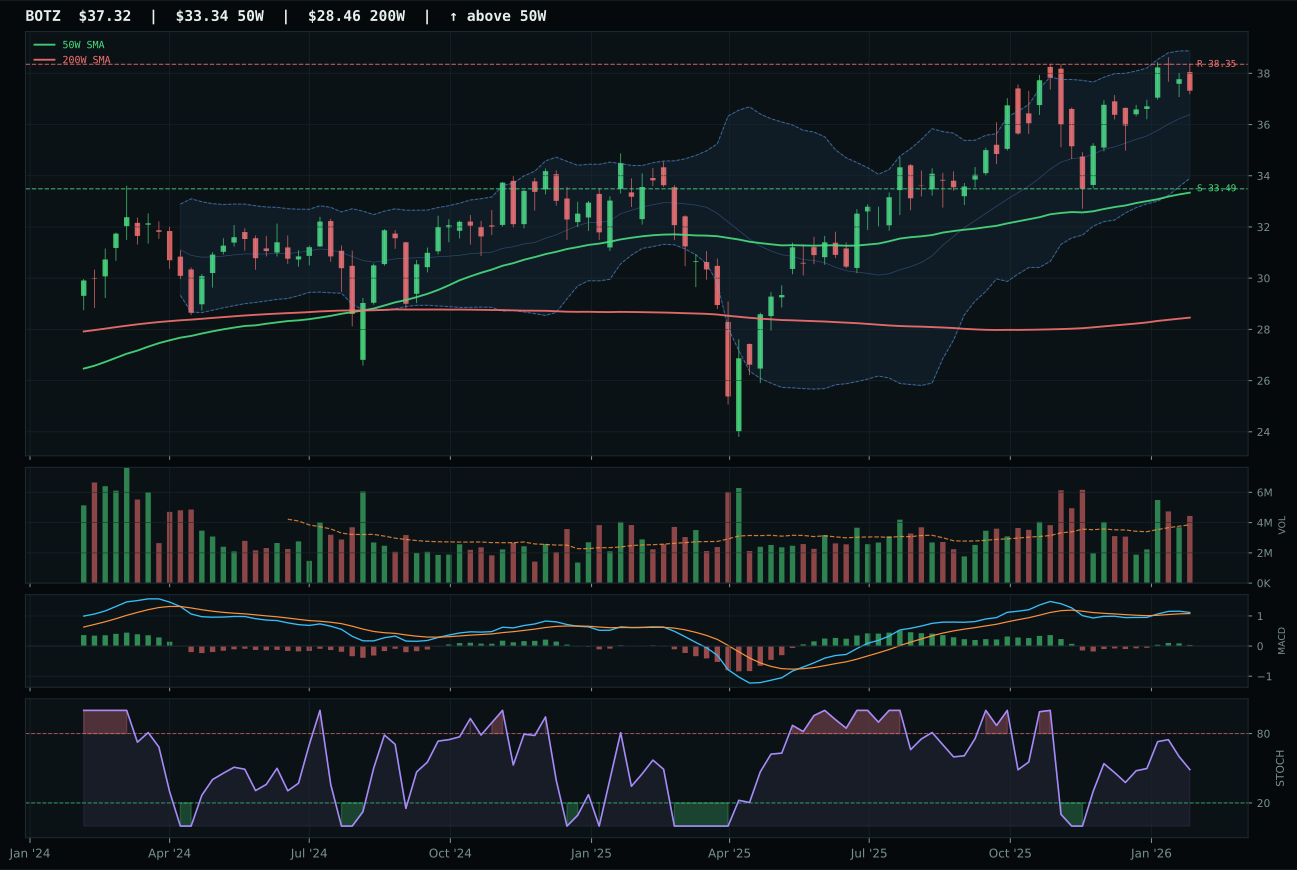
BOTZ has a neutral structure profile with -2.8% 13-week relative strength versus SPY.
A failed hold above support would weaken the setup.
Actionable but governed by invalidation levels.
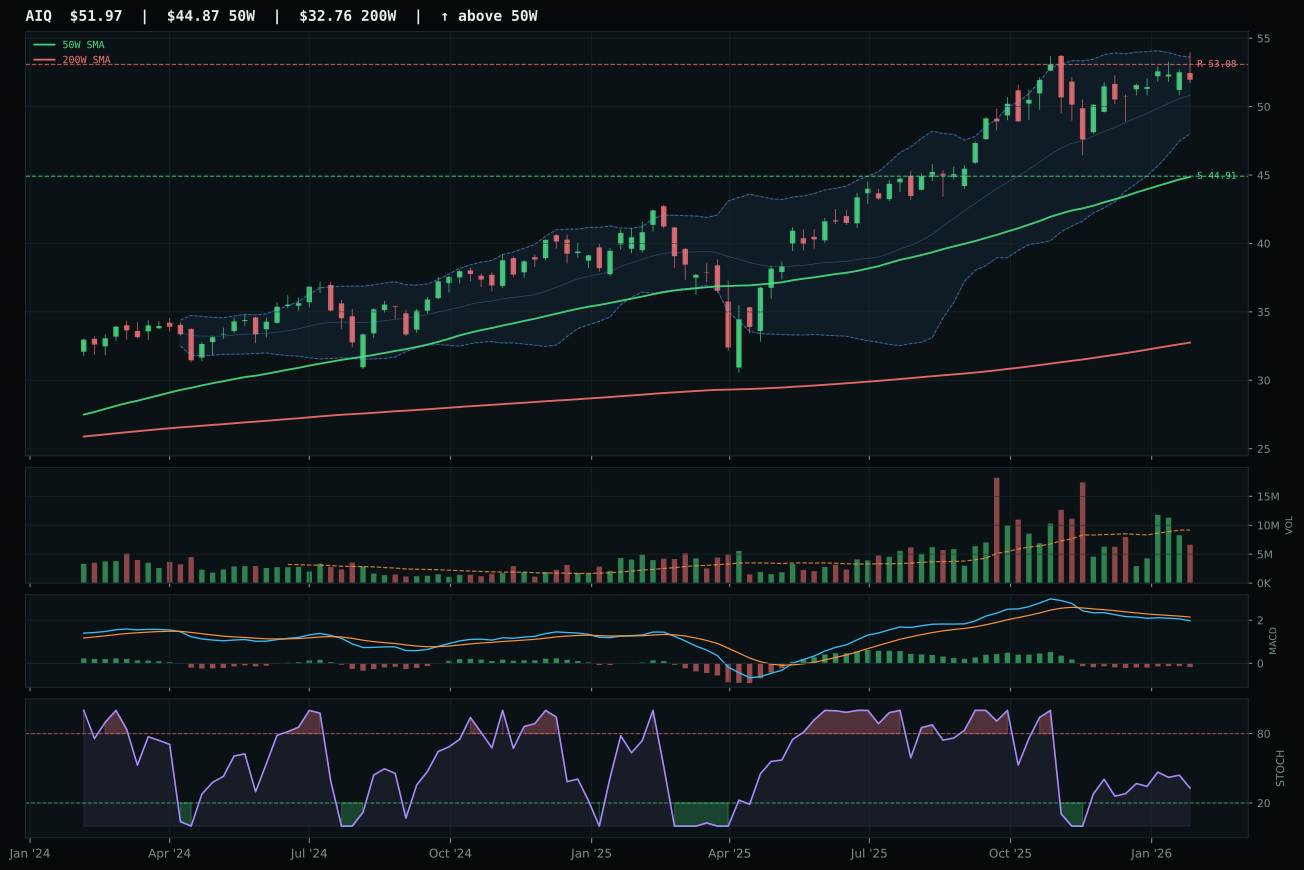
AIQ has a vertical extension profile with -3.5% 13-week relative strength versus SPY.
A failed hold above support would weaken the setup.
Actionable but governed by invalidation levels.
SMH dominates because it has delivered a 11.1% thirteen-week return with 12.5% category-relative strength and a 9.7% SPY edge, all while maintaining a perfect trend score of 100/100 from price 37.1% above its 50-week moving average. BOTZ, the runner-up, trails on category-relative strength at zero percent and shows SPY weakness at negative 2.8%, explaining the score gap of 8.4 points despite BOTZ having a superior 73.1/100 technical evidence component. SMH's challenge is pure entry risk: the stochastic RSI is overbought at 0.80, upside to resistance is nearly flat, and volume is neutral rather than confirming the extended move. The persistence score of 78.6/100 proves the move is real, but buying at Fib 0.236 extension when every buyer since December has been late to the party requires conviction that AI compute capacity scarcity is structural, not cyclical.
AI ranks 58.8 as a category and stays at 10% rather than top-2 because the macro fit of 54.0/100 is held back by negative 12 points from liquidity stress, offsetting the positive 14 points from active AI growth sponsorship. SMH's 71.5/100 technical evidence is genuine, but that carries a 62% weight while macro fit carries 38%—and in a late-cycle regime with credit and liquidity pressures active, the tailwinds are fragile. The real tell is timing: at 37.1% above the 50-week, every entry here requires the next leg of earnings growth to exceed expectations, and semiconductor inventory cycles are unpredictable once reflation cools. Maintain the 10% position as a hedge to portfolio deflation risk, but do not add until stochastic RSI falls to 0.50 or below and volume participation normalizes. If liquidity stress clears in the next three weeks, this slot becomes a candidate for 10% allocation.
Agriculture & Livestock — MOO
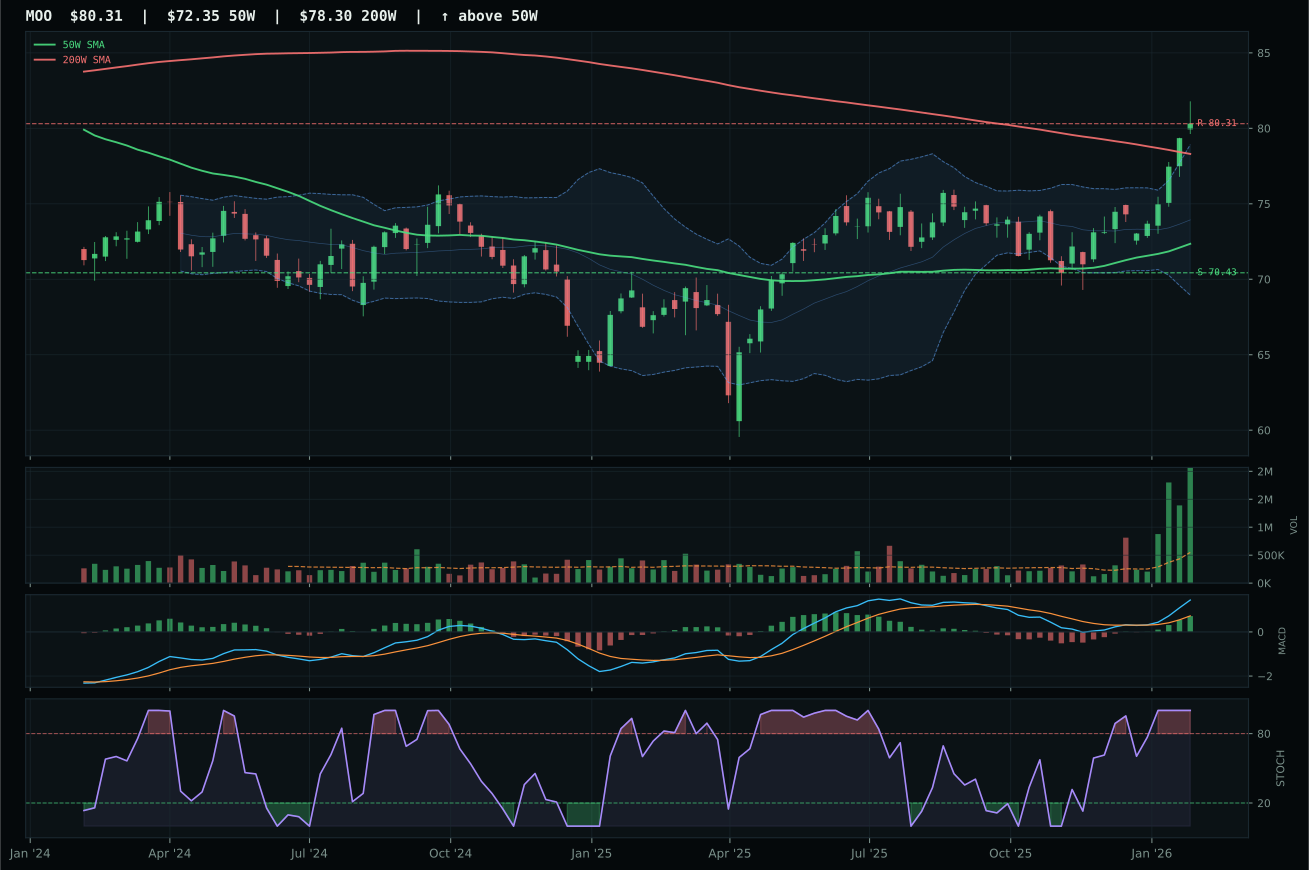
MOO has a neutral structure profile with 11.2% 13-week relative strength versus SPY.
A failed hold above support would weaken the setup.
Actionable but governed by invalidation levels.
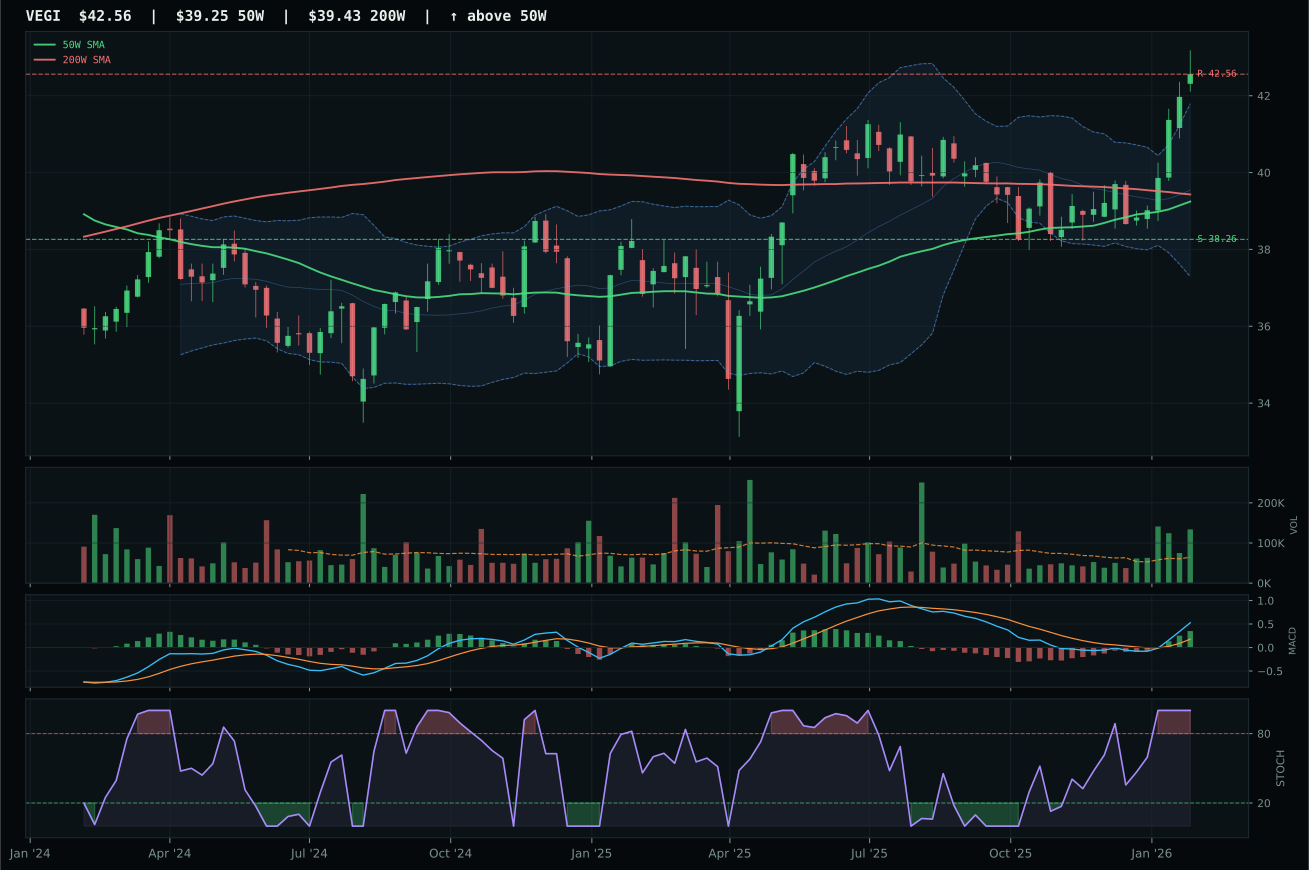
VEGI has a neutral structure profile with 9.4% 13-week relative strength versus SPY.
A failed hold above support would weaken the setup.
Tracked, but not top-2 eligible because: .
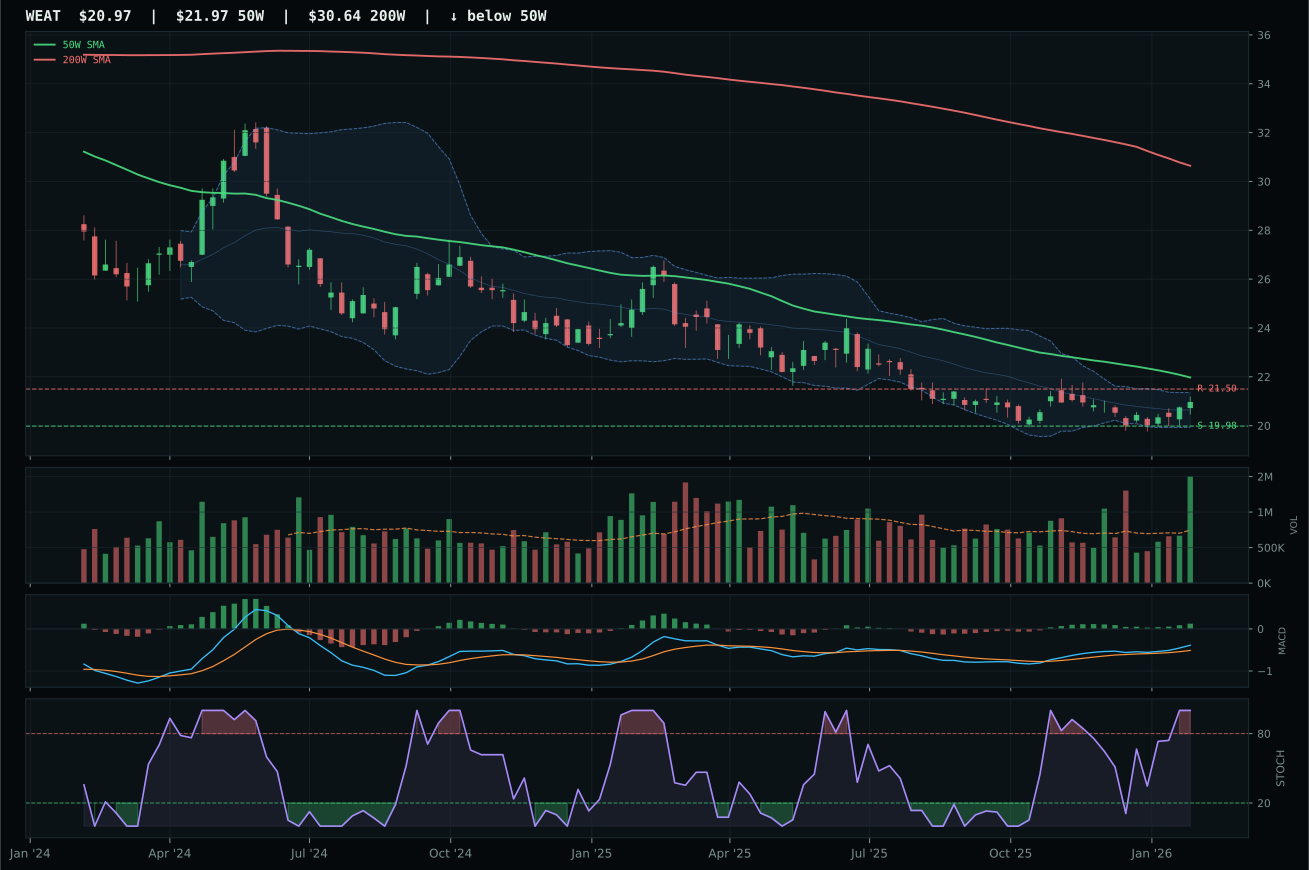
WEAT has a pullback into support profile with -2.5% 13-week relative strength versus SPY.
Extension and support failure are the main tactical risks.
Tracked, but not top-2 eligible because: structurally broken.
MOO crushes the competition with a stunning 100.0/100 technical evidence component, driven by 4.67x volume participation (accumulation/confirmation, not distribution), a 12.7% thirteen-week return with positive 11.2% SPY relative strength, and a perfect 1.00 stochastic RSI that has held above 0.90 for sustained accumulation rather than rolling over. VEGI manages 45.0/100 technical evidence and carries an identical bullish MACD setup, but MOO's one-point-nine percent category-relative strength edge proves the agribusiness basket is choosing pure equity exposure over global agriculture producers. Both charts sit in the near 52-week high, but MOO's 86.8/100 structure score—driven by exceptional 75.0 cleanliness and 86.2 compression—confirms the move is being accumulated into stability, not chased on distribution spikes.
Agriculture & Livestock claims its 10% allocation slot on the back of a 51.3 category score and a phenomenal 90.0/100 macro fit, the highest in the portfolio outside the top-2 energy and metals themes. Supply shortage adds thirteen points, inflation pressure adds ten, and real asset sponsorship adds eight—this is the category where late-cycle reflation speaks loudest, and MOO's 4.67x volume confirmation proves capital is moving into the trade actively rather than speculatively. The 52.3/100 risk-reward (zero upside to resistance, fourteen percent downside to support) looks tight, but in an inflation regime where crop scarcity is structural, the asymmetry actually favors patient holders over aggressive traders. MOO is a core holding; add on any pullback to the 50-week moving average, and do not exit unless supply-shortage descriptor flips to inactive or volume participation drops below 2.0x the twenty-week average for two consecutive weeks.
Nuclear Energy — URNM
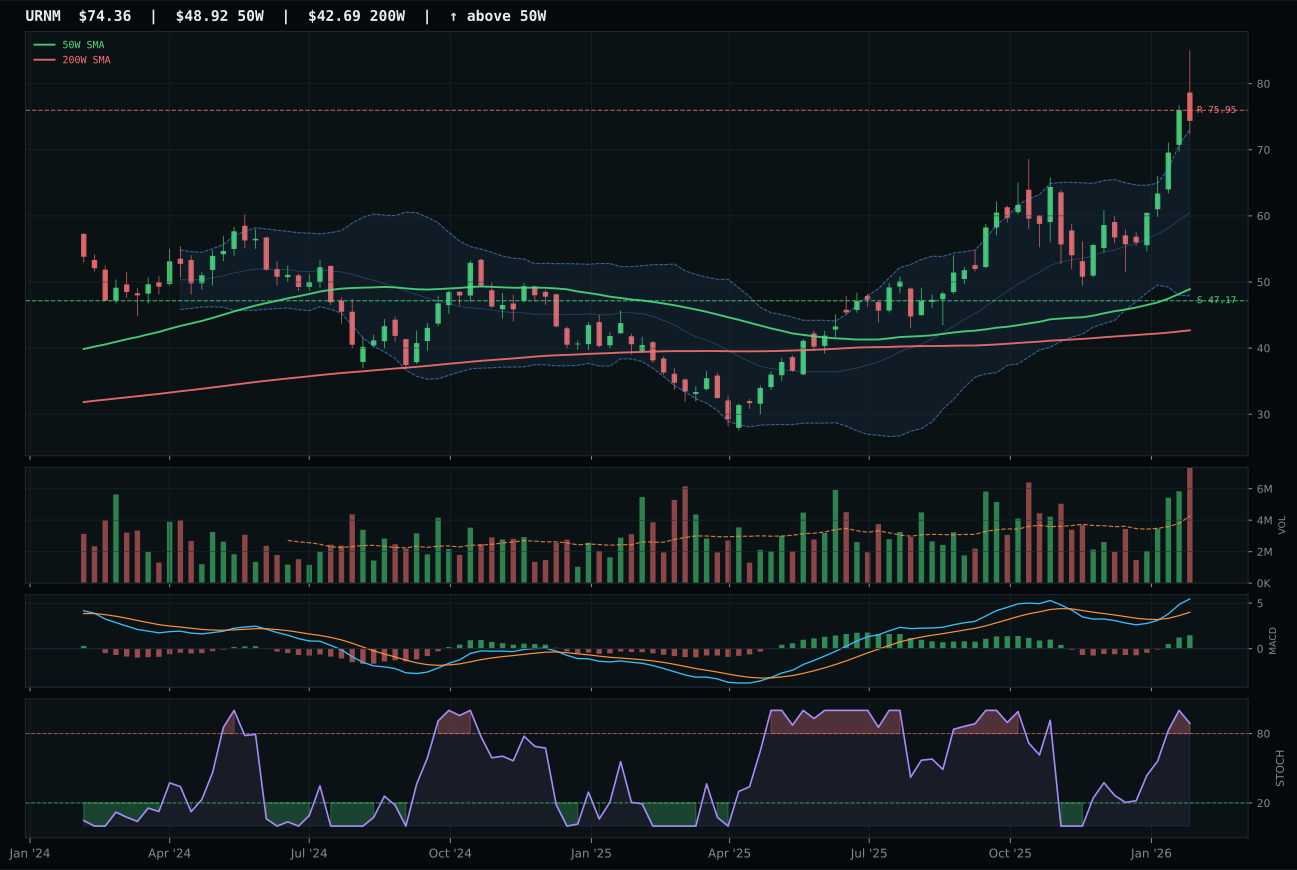
URNM has a vertical extension profile with 14.1% 13-week relative strength versus SPY.
A failed hold above support would weaken the setup.
Actionable but governed by invalidation levels.
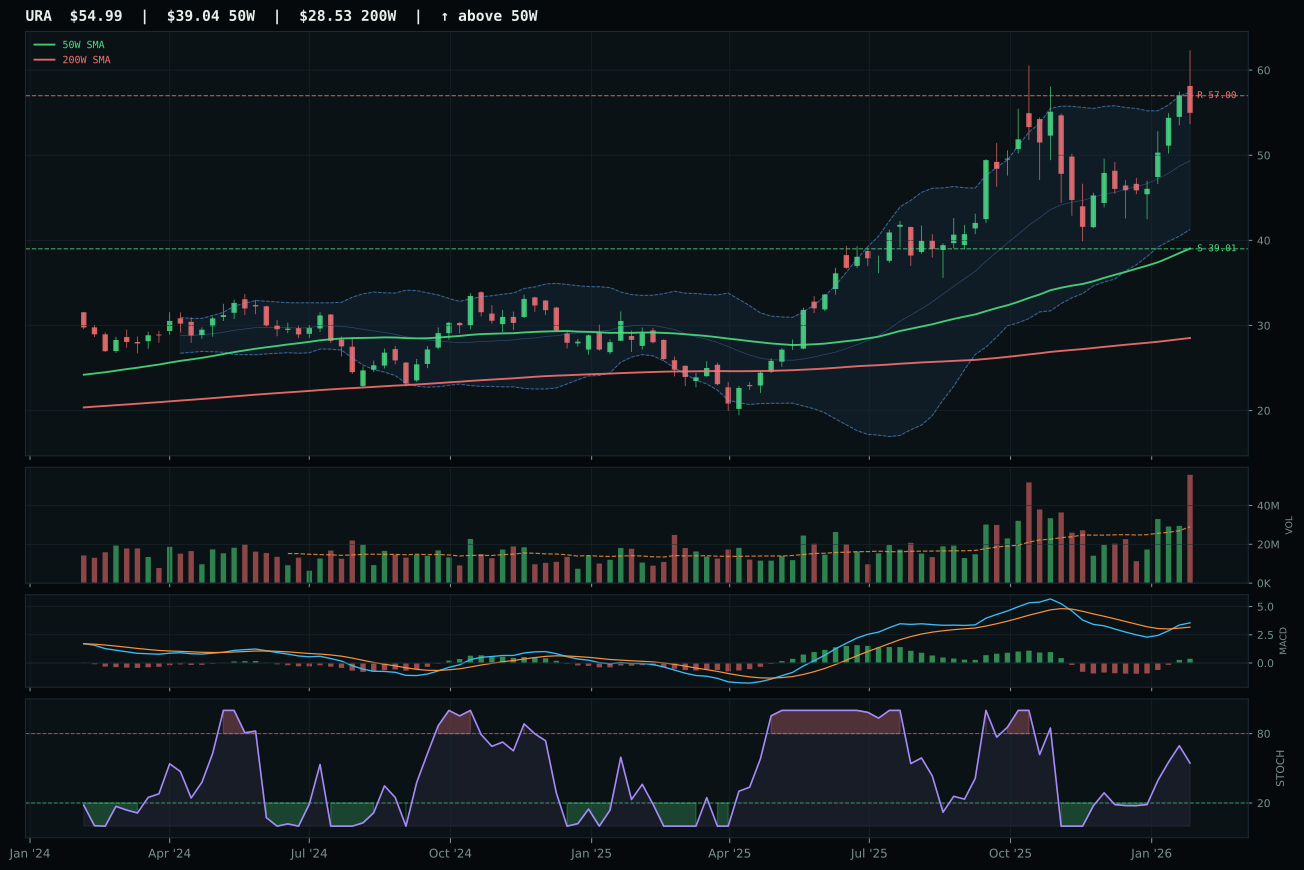
URA has a vertical extension profile with -1.7% 13-week relative strength versus SPY.
A failed hold above support would weaken the setup.
Actionable but governed by invalidation levels.
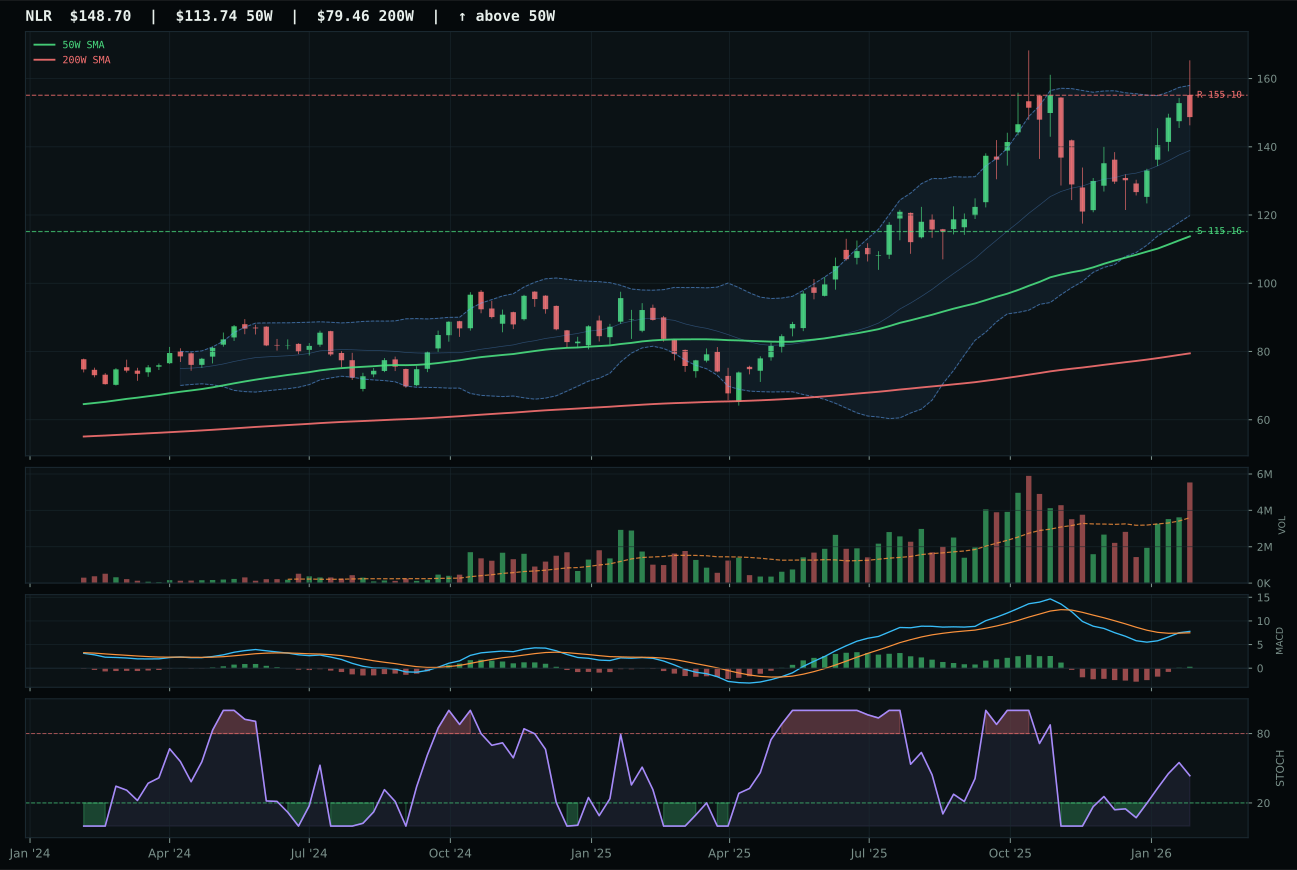
NLR has a vertical extension profile with -5.6% 13-week relative strength versus SPY.
A failed hold above support would weaken the setup.
Actionable but governed by invalidation levels.
URNM wins category leadership at 49.5 with a perfect 100.0/100 momentum confirmation and 100.0/100 trend score, posting a 15.5% thirteen-week return and 14.1% SPY relative strength despite sitting 52.0% above its 50-week moving average—a distance that would cripple most setups but here indicates the move is in early innings of uranium-supply-constrained structurality. URA, the runner-up, lags on category-relative strength at zero percent versus URNM's 15.8%, and its rising-mid-zone stochastic RSI at 0.58 signals a slower accumulation pattern than URNM's overbought momentum at 0.89. The structure cleanliness gap of 58.3 versus 61.7 is narrow, but URNM's 100.0/100 momentum confirmation proves capital is rotating into uranium miners on the belief that AI energy demand and geopolitical uranium scarcity are converging into a structural supply deficit.
Nuclear Energy lands at 10% allocation on a 49.5 category score and a 69.0/100 macro fit that benefits from energy scarcity adding nine points, real asset sponsorship adding seven, and AI growth sponsorship adding five, but liquidity stress strips eight points and prevents this from reaching top-2 status. URNM's 46.2/100 technical evidence is solid but not exceptional, yet the 15.8% category-relative strength proves the market is choosing uranium-miner beta over uranium-price exposure or nuclear utility stocks. The real challenge is entry: 52.0% above the 50-week and a 22.6/100 risk-reward (negative 2.1% upside, 57.6% downside) indicate the trade is extended and requires belief that uranium scarcity is severe enough to justify 60% drawdown risk. Hold the position as a structural play on AI energy intensity, but do not add; if stochastic RSI falls below 0.50 or volume participation drops below 1.5x the 20-week average, this slot becomes a candidate for rotation into IGF or MOO to lock in gains and rebalance into lower-risk real-asset themes.
Precious Metals — GLD
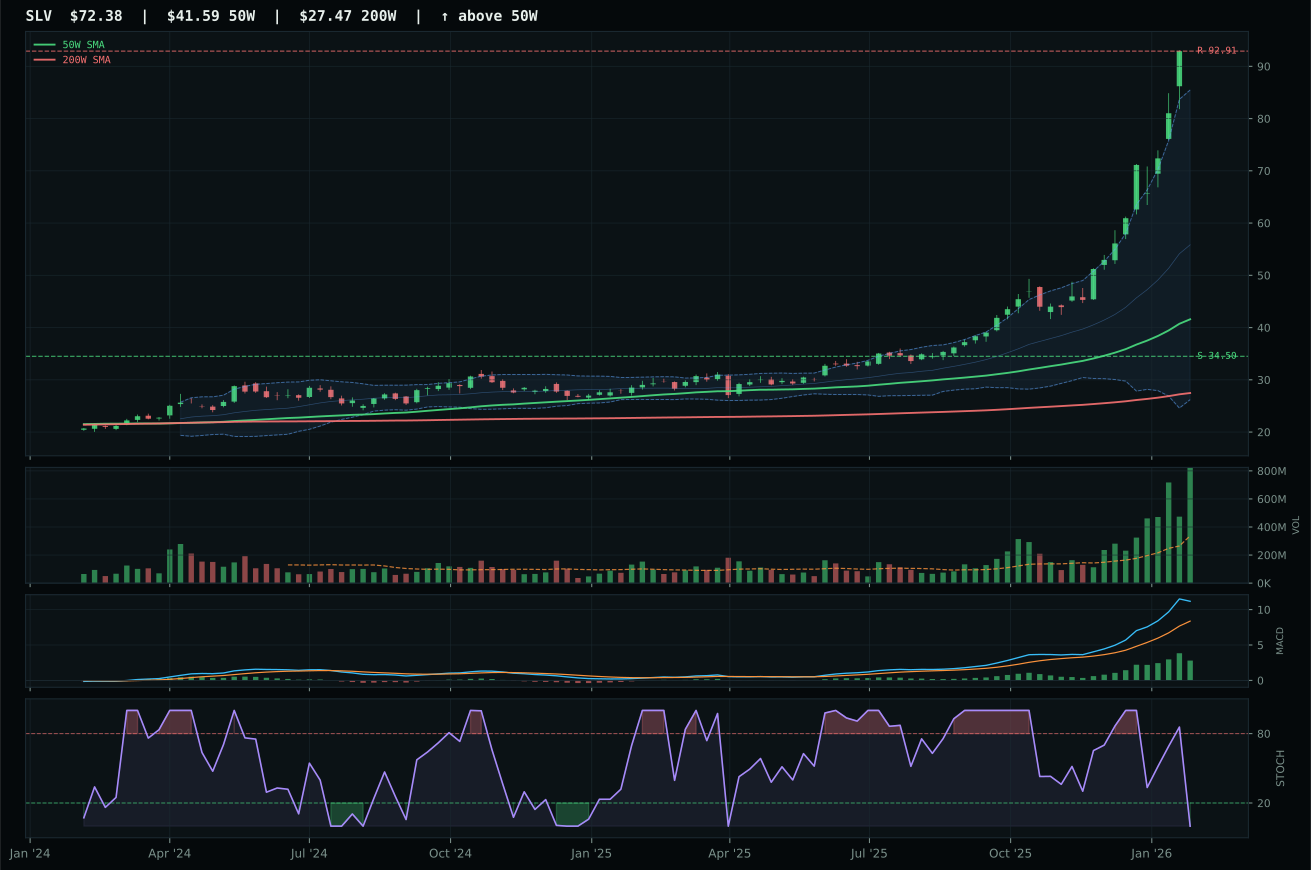
SLV has a vertical extension profile with 70.0% 13-week relative strength versus SPY.
A failed hold above support would weaken the setup.
Actionable but governed by invalidation levels.
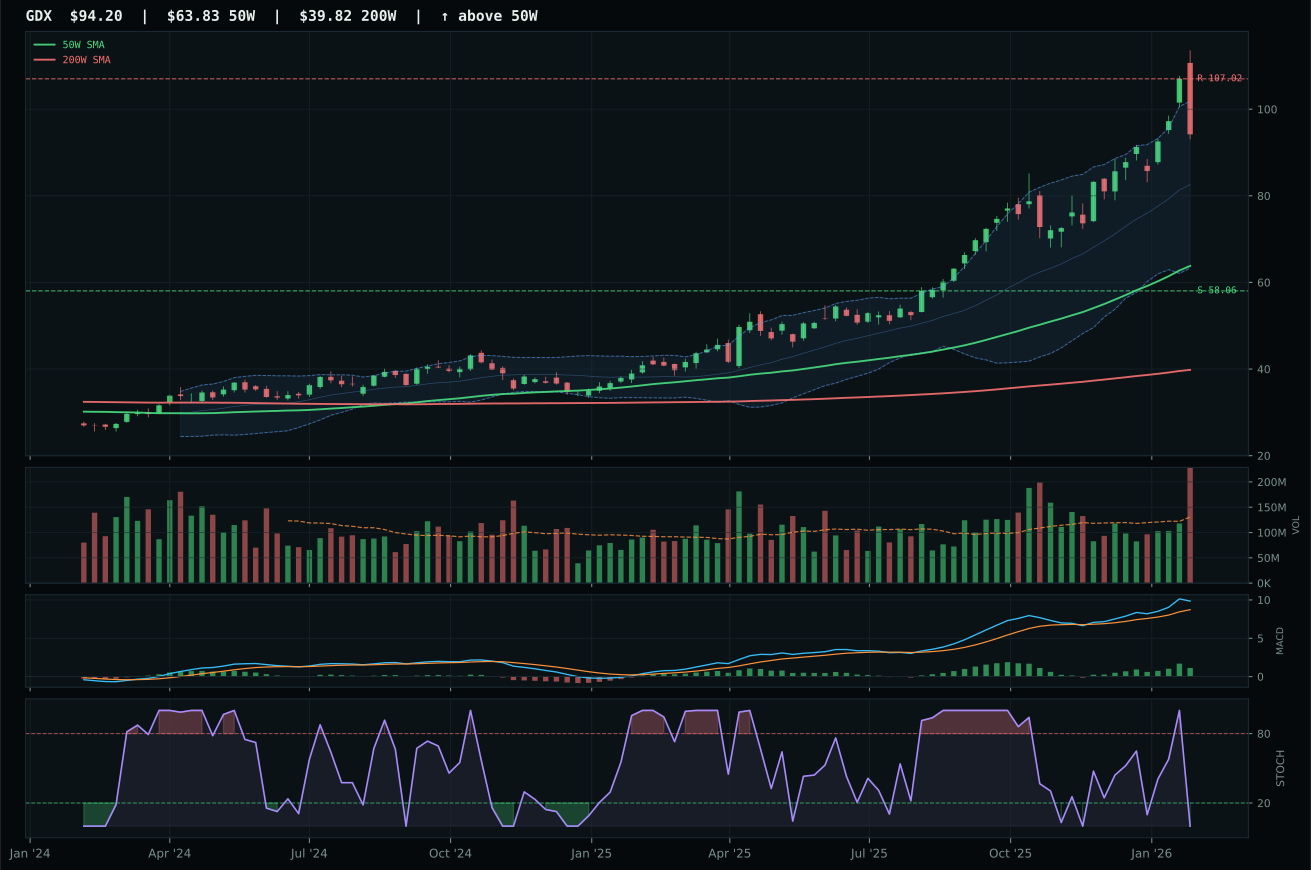
GDX has a vertical extension profile with 29.3% 13-week relative strength versus SPY.
A failed hold above support would weaken the setup.
Actionable but governed by invalidation levels.
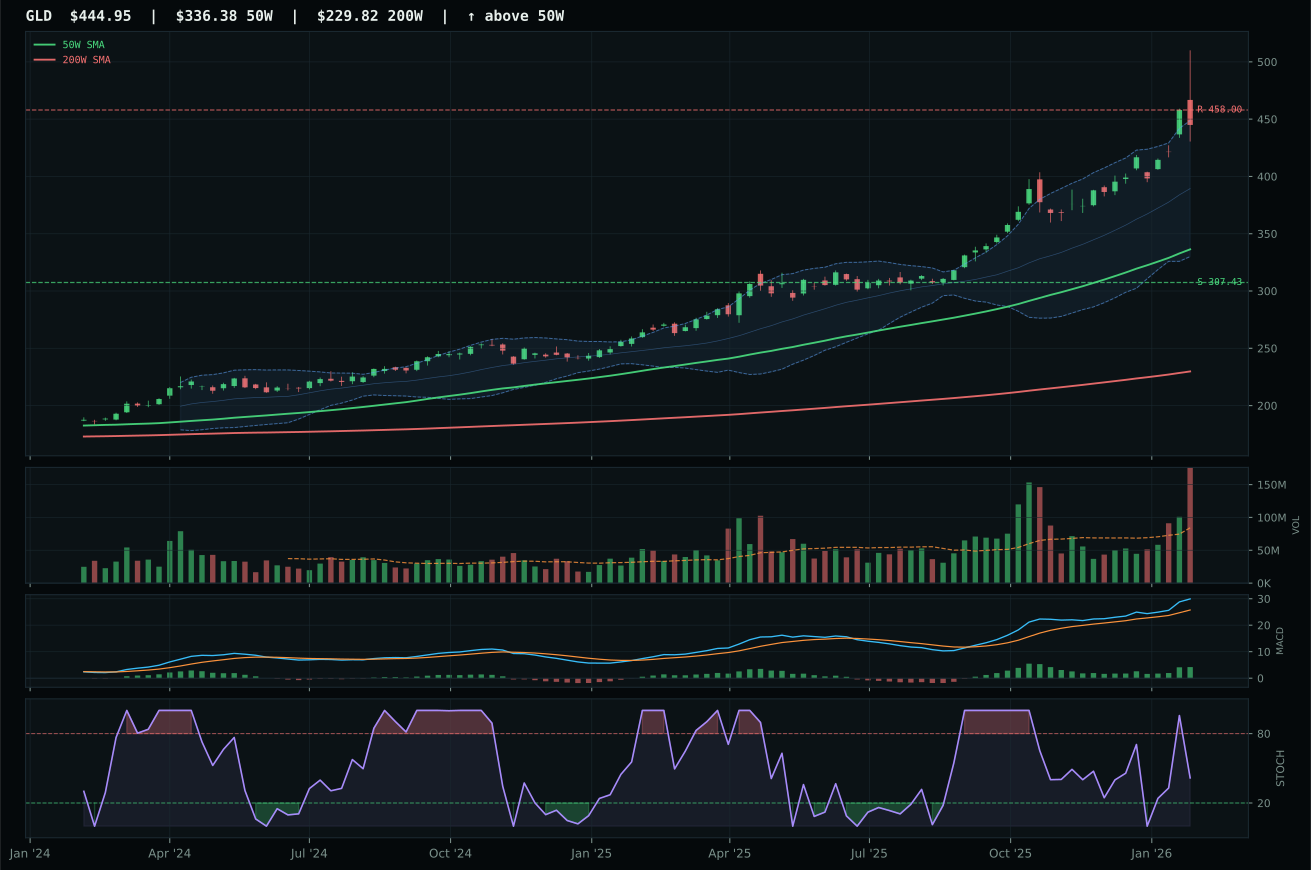
GLD has a vertical extension profile with 19.4% 13-week relative strength versus SPY.
A failed hold above support would weaken the setup.
Actionable but governed by invalidation levels.
GLD wins category leadership despite running 32.3% above its 50-week moving average—a price position that normally screams entry risk—because its momentum confirmation of 100.0/100 and rising mid-zone stochastic RSI at 0.42 signal the move is maturing into accumulation rather than fading into distribution. SLV, the runner-up, has exploded 71.4% in thirteen weeks and posts a staggering 70% relative strength versus SPY, yet that extreme oversold stochastic RSI at just below 0.0 and a 81.1% distance from the 50-week (versus GLD's 32.3%) reveal SLV is a momentum chase, not a hedge reconstitution. The timing score separates them: GLD at 61.0/100 versus SLV at 60.0/100, but more tellingly, GLD's structure cleanliness of 66.7 versus SLV's 68.0 is narrower than the directional conviction gap—GLD is being accumulated by informed buyers, SLV by retail chasers.
Precious Metals lands at 10% allocation with a 49.3 category score, held back by a macro fit of 60.0/100 that benefits from fourteen points of monetary hedge bid but surrenders four points to active positive risk appetite—a tension that defines the category in early reflation. GLD's 42.4/100 technical evidence is honest and not extraordinary, but the 19.4% SPY relative strength and improving MACD represent real allocator conviction in gold as a currency debasement hedge, not a cyclical commodity bet. The 38.1/100 risk-reward (negative 2.8% upside, 44.7% downside) and 52.8/100 volume-price confirmation warn that further extension is unlikely; GLD has likely reached its initial reflation-hedge target. Maintain the position as portfolio insurance against accelerating credit stress, but rotate to URNM or COPX if the monetary-hedge-bid descriptor flips to inactive or if GLD volume falls below 2.0x the twenty-week average, signaling that institutional accumulation has paused.
Utilities & Infrastructure — IGF
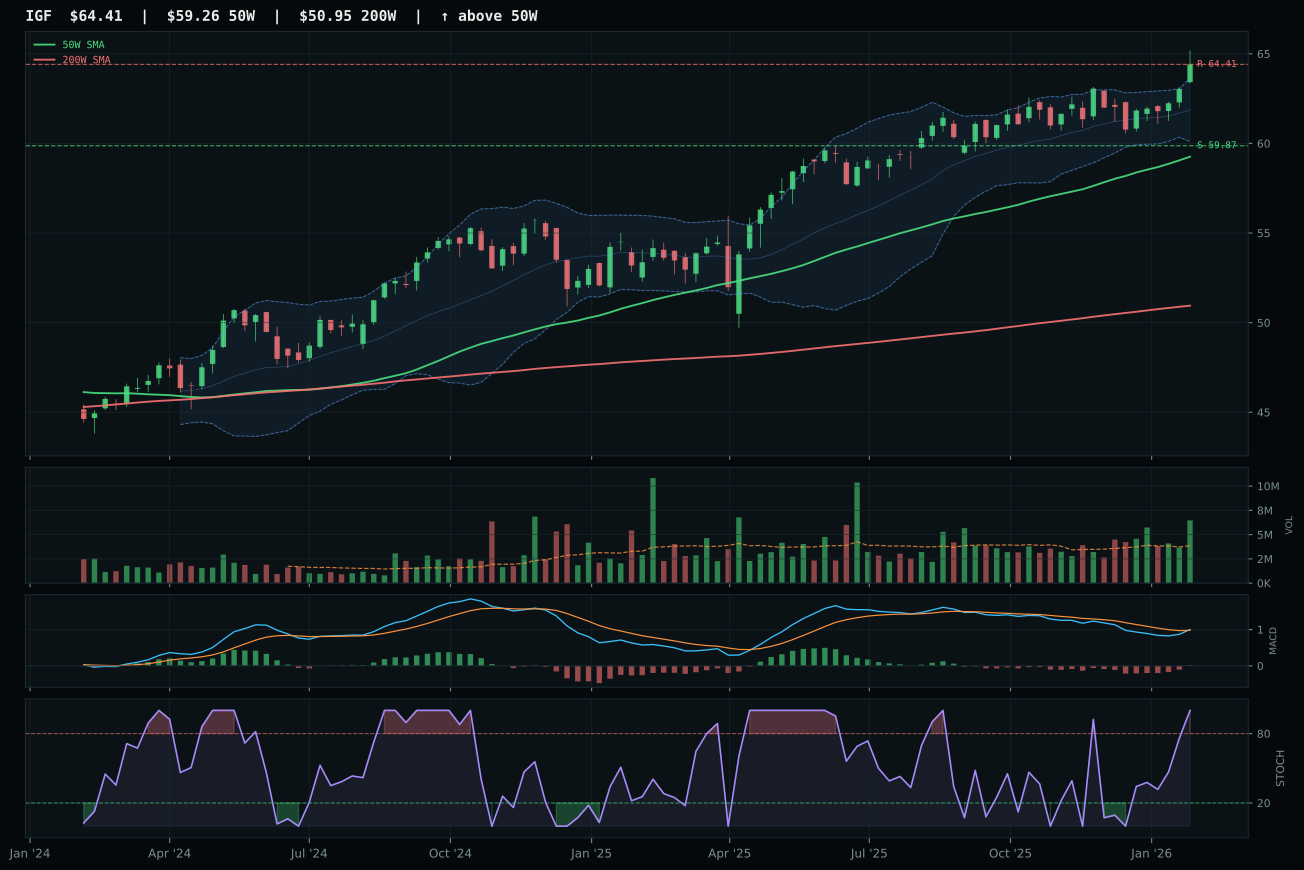
IGF has a neutral structure profile with 4.1% 13-week relative strength versus SPY.
A failed hold above support would weaken the setup.
Actionable but governed by invalidation levels.
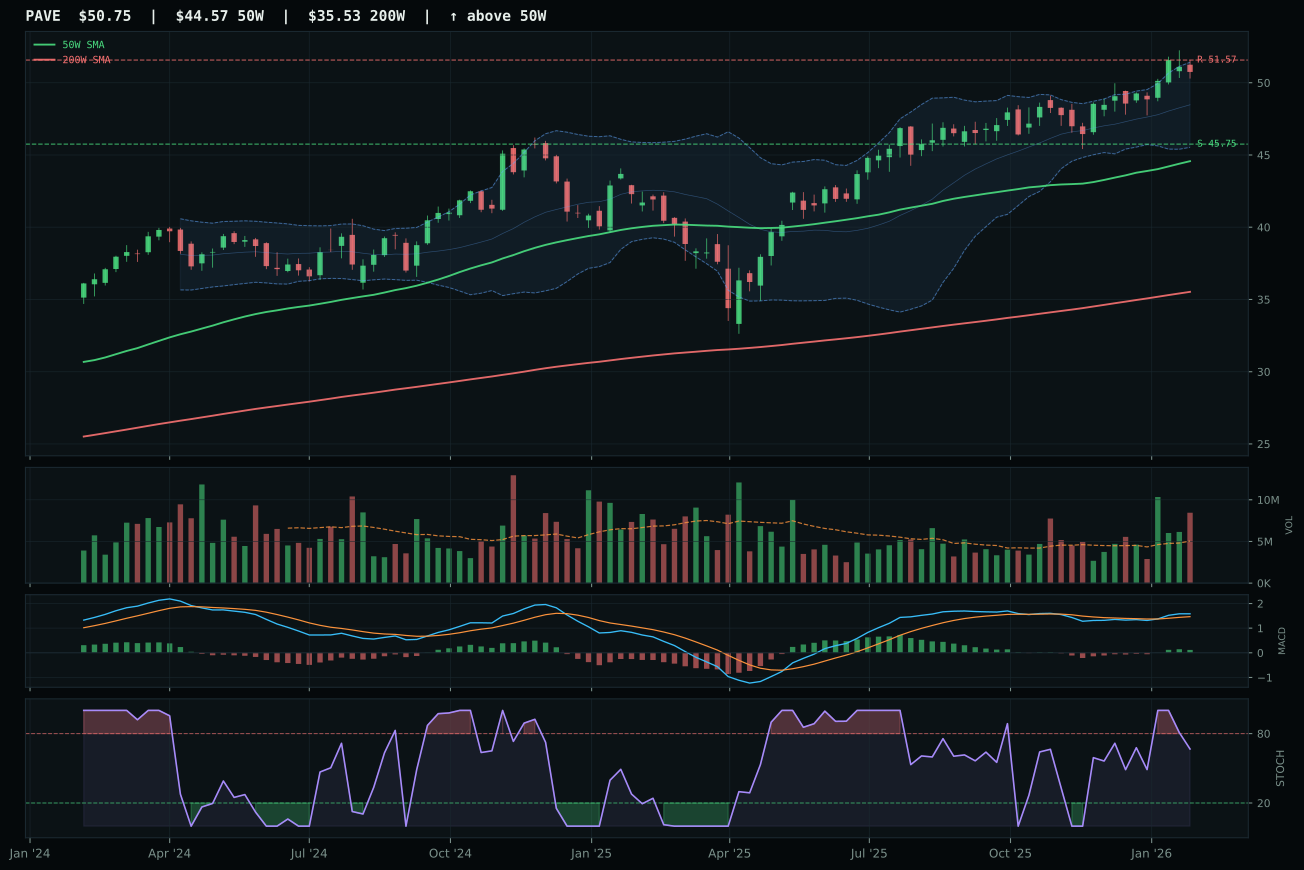
PAVE has a neutral structure profile with 3.7% 13-week relative strength versus SPY.
A failed hold above support would weaken the setup.
Actionable but governed by invalidation levels.
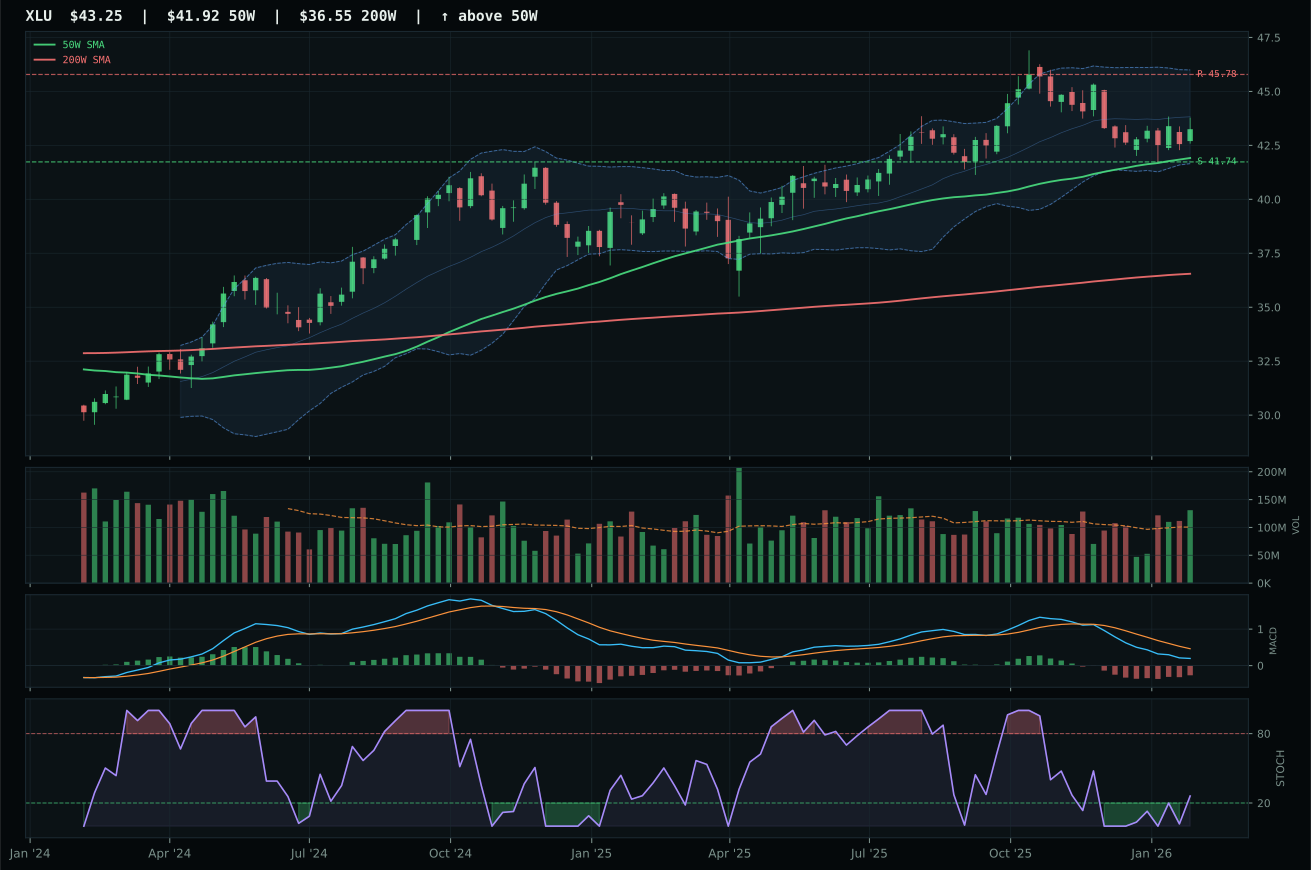
XLU has a pullback into support profile with -4.4% 13-week relative strength versus SPY.
A failed hold above support would weaken the setup.
Actionable but governed by invalidation levels.
IGF takes the category with a dominant 100.0/100 technical evidence and 83.3 reasoned ETF proof score by posting only 5.6% thirteen-week returns but delivering perfect trend, 4.1% SPY relative strength, 75.0/100 timing (8.7% above the 50-week is the sweet spot for entry, not exit), and an exceptional 89.6/100 volume-price confirmation at 1.68x the 20-week average (accumulation/confirmation). PAVE trails by 12.3 points despite showing a similar 5.2% thirteen-week return, because its distribution pressure volume pattern, falling-neutral stochastic RSI, and 13.9% distance from the 50-week reveal that infrastructure capital is rotating elsewhere—likely into real-asset cyclicals like energy and metals—while IGF's global-infrastructure-income thesis is being methodically accumulated at controlled entry prices.
Utilities & Infrastructure earns its 10% allocation slot on IGF's 100.0/100 technical evidence component and exceptional structure quality at 85.1/100, despite the category macro fit of only 43.0/100—the weakest in the portfolio outside Technology. This allocation is defensive and tactical rather than thematic: IGF's 61.0/100 risk-reward (zero upside, 7.6% downside) and low beta make it portfolio stabilizer, not growth engine, and in a late-cycle reflation regime where inflation pressure strips four points and risk appetite weakness strips an additional two, utilities and infrastructure are being held for income and downside protection rather than participation. IGF's 79.0/100 persistence and 89.9/100 momentum confirmation confirm the position is stable, not deteriorating, and the 4.1% SPY relative strength proves there is no institutional exodus yet. Maintain the 10% position as portfolio anchor; do not add unless credit stress or liquidity stress indicators improve, but do not exit because the low correlation to energy and metals makes this the ultimate late-cycle hedge against mean reversion.
Defense & Aerospace — XAR
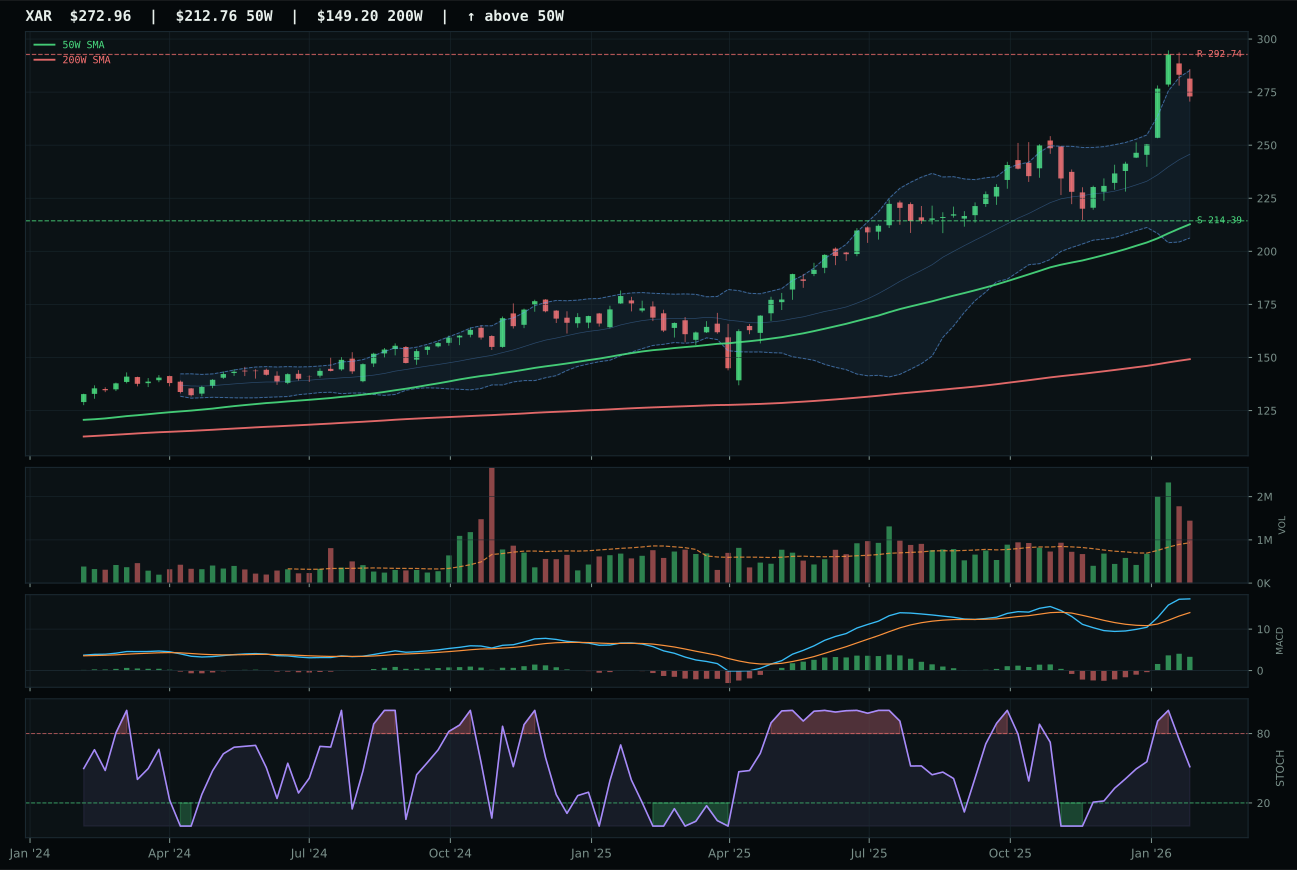
XAR has a vertical extension profile with 8.4% 13-week relative strength versus SPY.
A failed hold above support would weaken the setup.
Actionable but governed by invalidation levels.
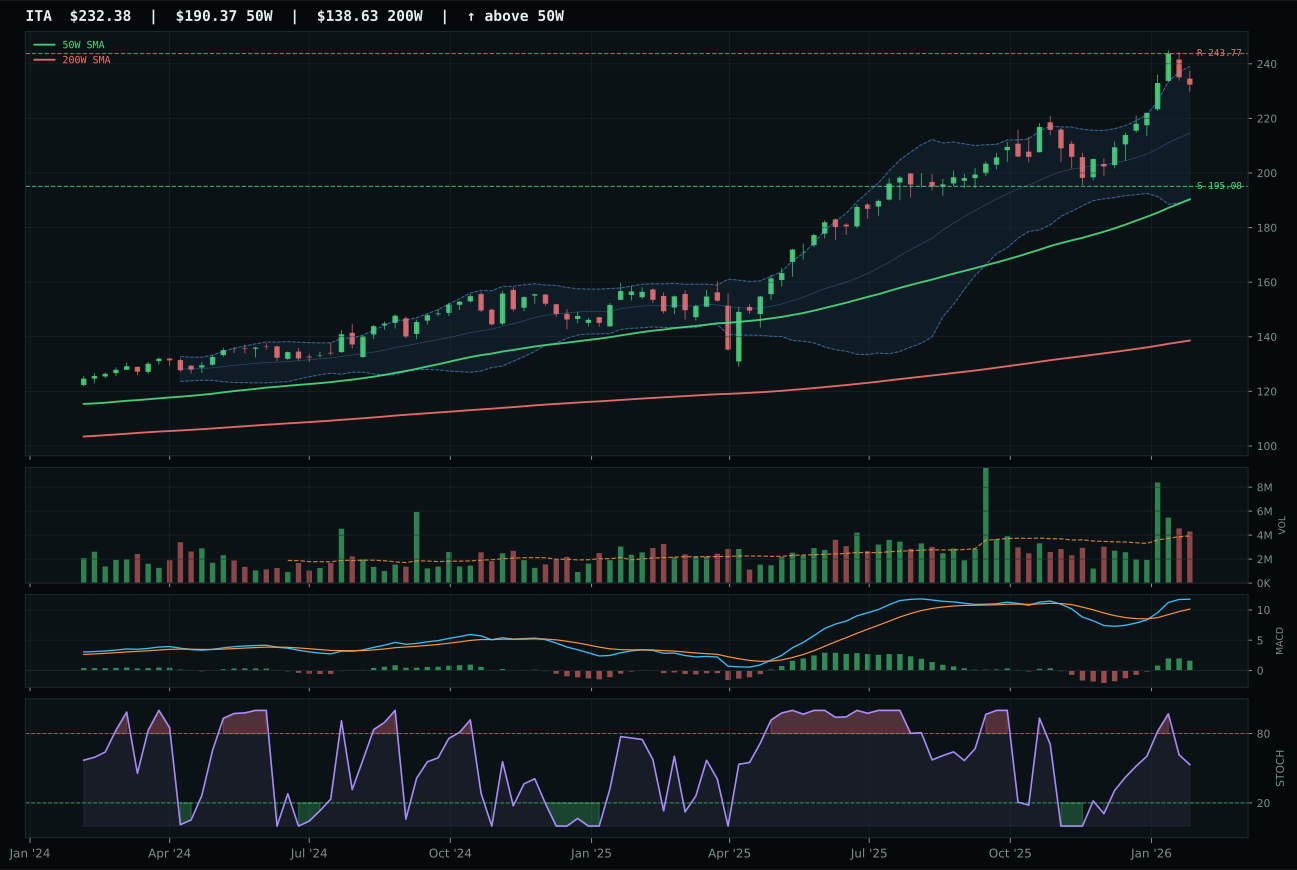
ITA has a vertical extension profile with 6.2% 13-week relative strength versus SPY.
A failed hold above support would weaken the setup.
Actionable but governed by invalidation levels.
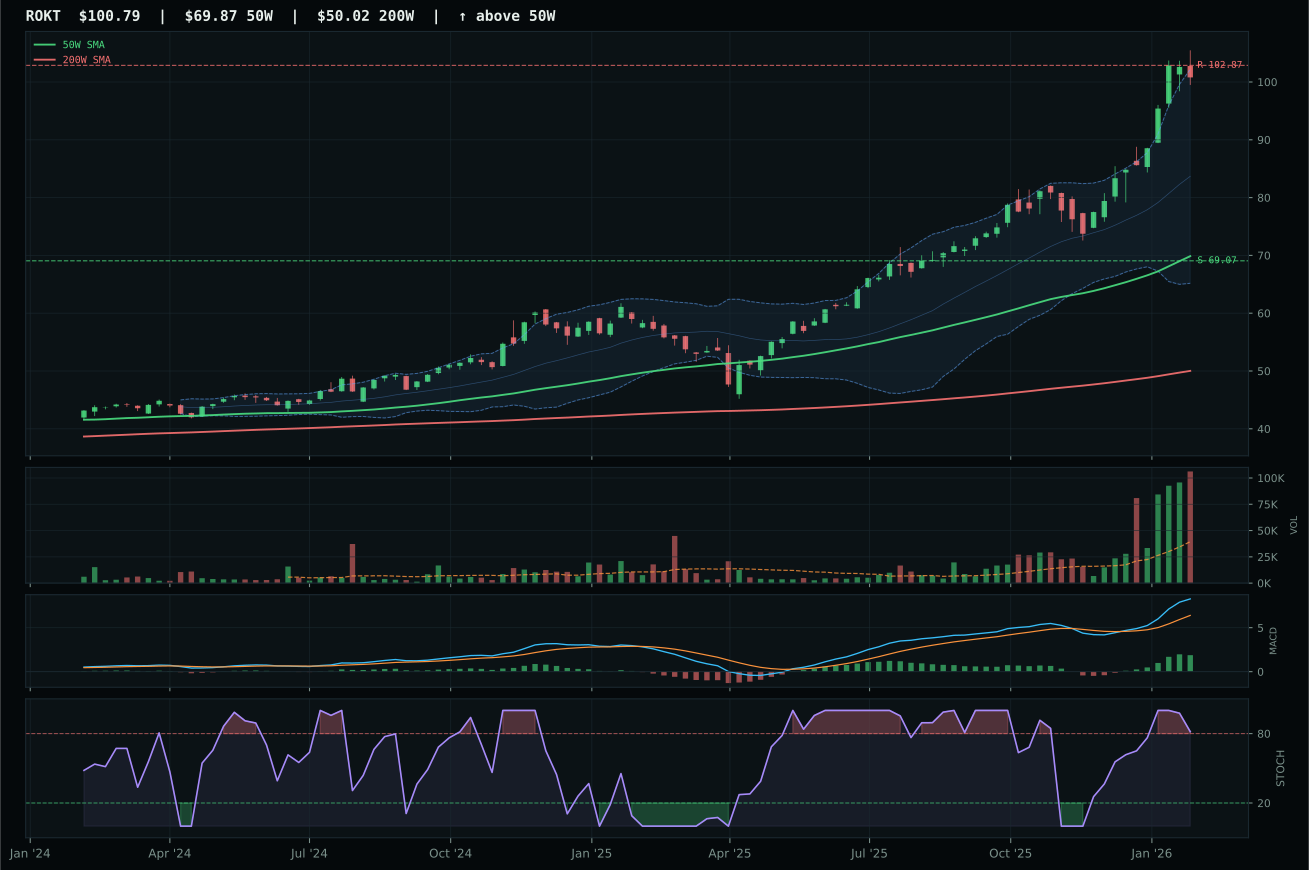
ROKT has a vertical extension profile with 23.2% 13-week relative strength versus SPY.
A failed hold above support would weaken the setup.
Tracked, but not top-2 eligible because: .
XAR claims the category at 43.9 despite trailing ITA in technical evidence (36.9 versus 68.2) because it captured 8.4% relative strength versus SPY while ITA managed only 6.2%, and that category-relative edge of plus 2.1 percentage points proves buyers are choosing hardware and systems over durability plays right now. The chart shows a vertical extension at 28.3% above the 50-week with bullish and improving MACD, but volume sits at 1.55x the 20-week average—distribution pressure that penalizes the timing score to 53.0/100. ITA's neutral structure and falling-neutral stochastic RSI look technically smoother, yet the momentum confirmation gap is stark: XAR posts 89.3/100 versus ITA's 85.0/100, driven by a nine-point four-week return that suggests tactical demand for exposure to defense budget execution, not just geopolitical hedging.
Defense & Aerospace earns 10% as a mid-tier category (score 43.9) in a late-cycle reflation where supply shortage is not yet active as a macro descriptor and credit stress contributes only two points of support. The 50.0/100 macro fit reflects that no category-specific descriptor set was available to the reasoning layer, so the allocation rests almost entirely on XAR's fresh relative strength and the fact that 27.4% twenty-six-week returns cannot be ignored in a risk-on regime. The structure quality at 72.4/100 is respectable but not pristine, and the risk-reward of negative 6.8% upside versus 27.3% downside indicates the trade is fairly valued, not cheap. This slot competes directly with Nuclear Energy and Precious Metals for marginal capital; if ITA's relative weakness persists for two more weeks or if XAR volume fails to drop below 1.2x the 20-week average, rotate to URNM or GLD to harvest superior macro alignment in supply-shortage and monetary-hedge themes.
Emerging Markets — ILF
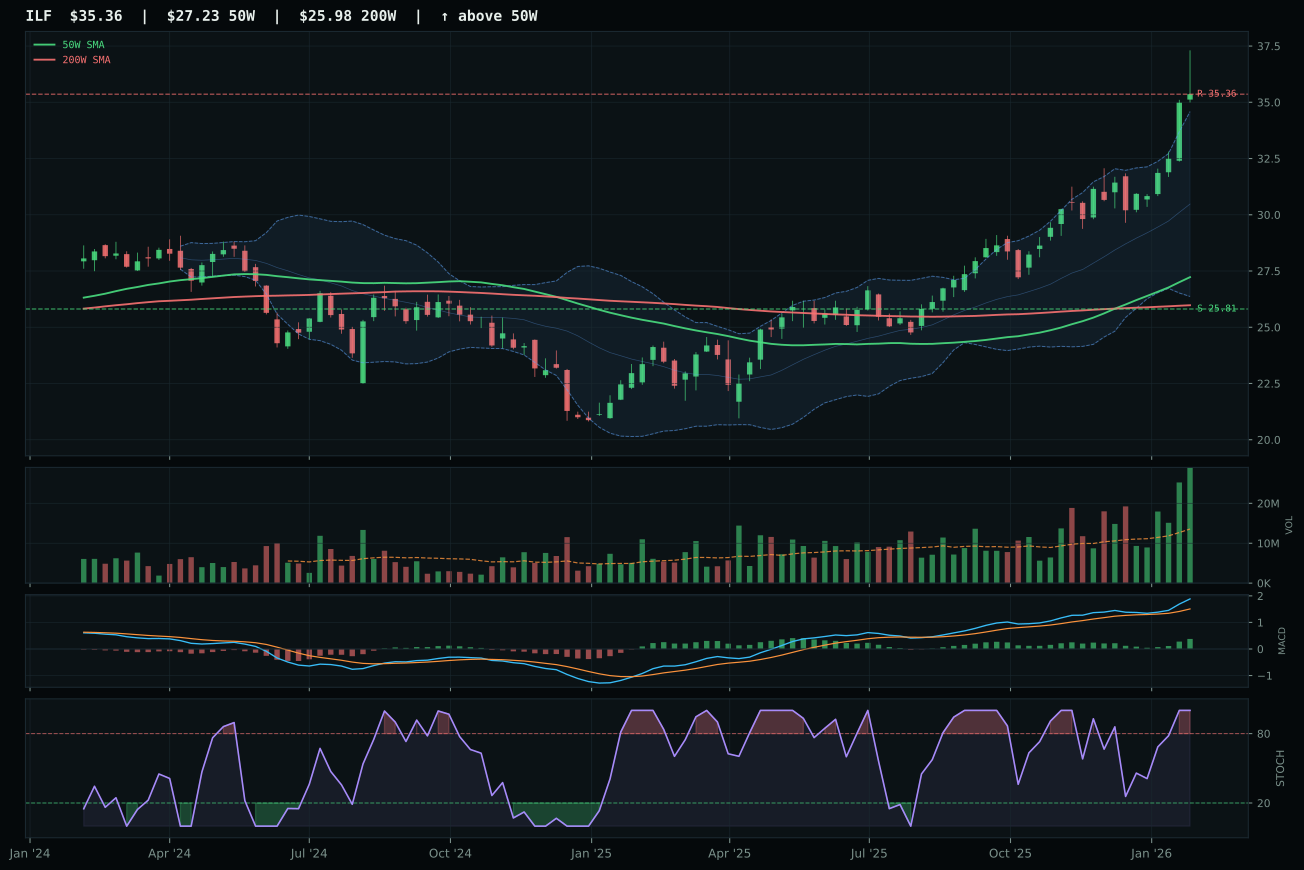
ILF has a vertical extension profile with 18.7% 13-week relative strength versus SPY.
A failed hold above support would weaken the setup.
Actionable but governed by invalidation levels.
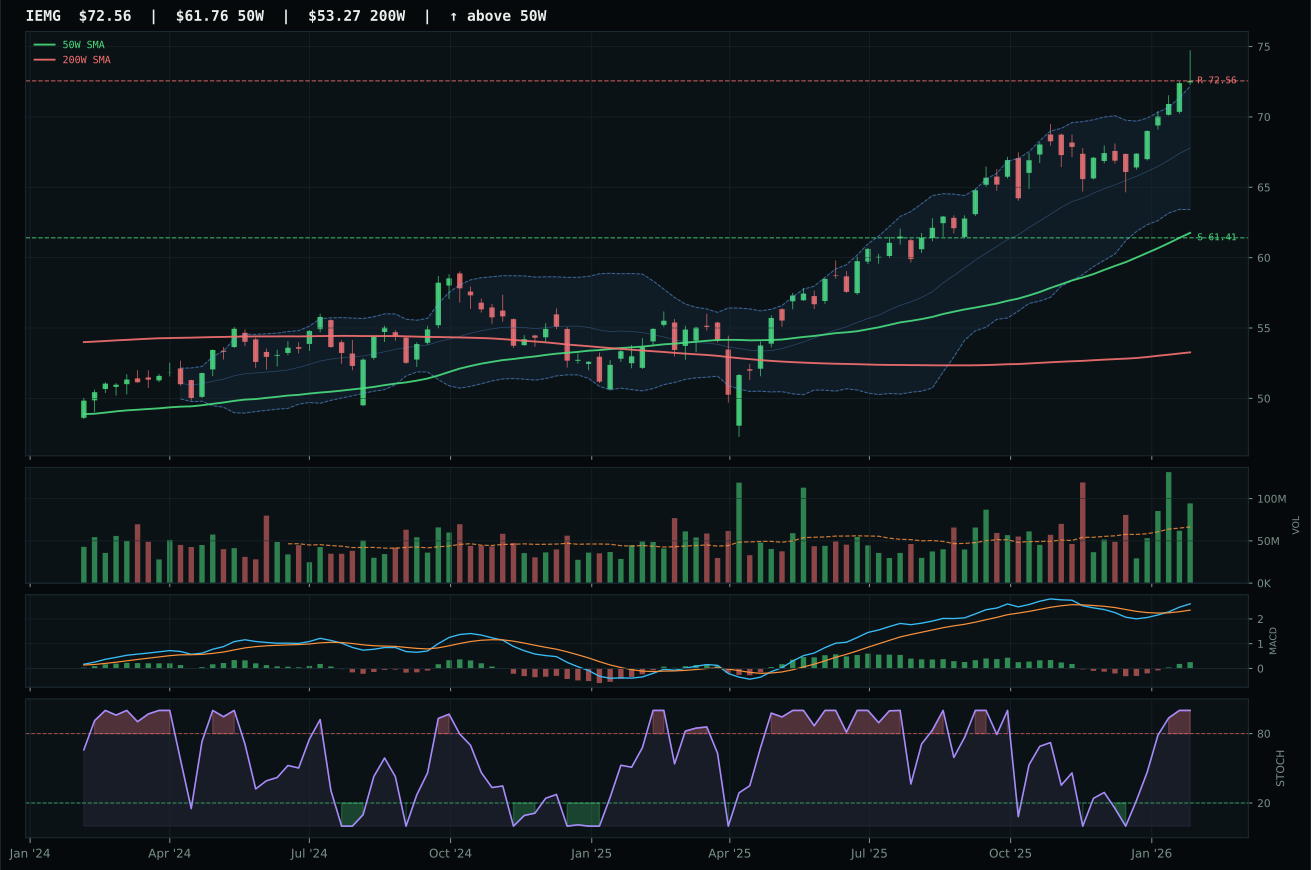
IEMG has a vertical extension profile with 4.8% 13-week relative strength versus SPY.
A failed hold above support would weaken the setup.
Actionable but governed by invalidation levels.
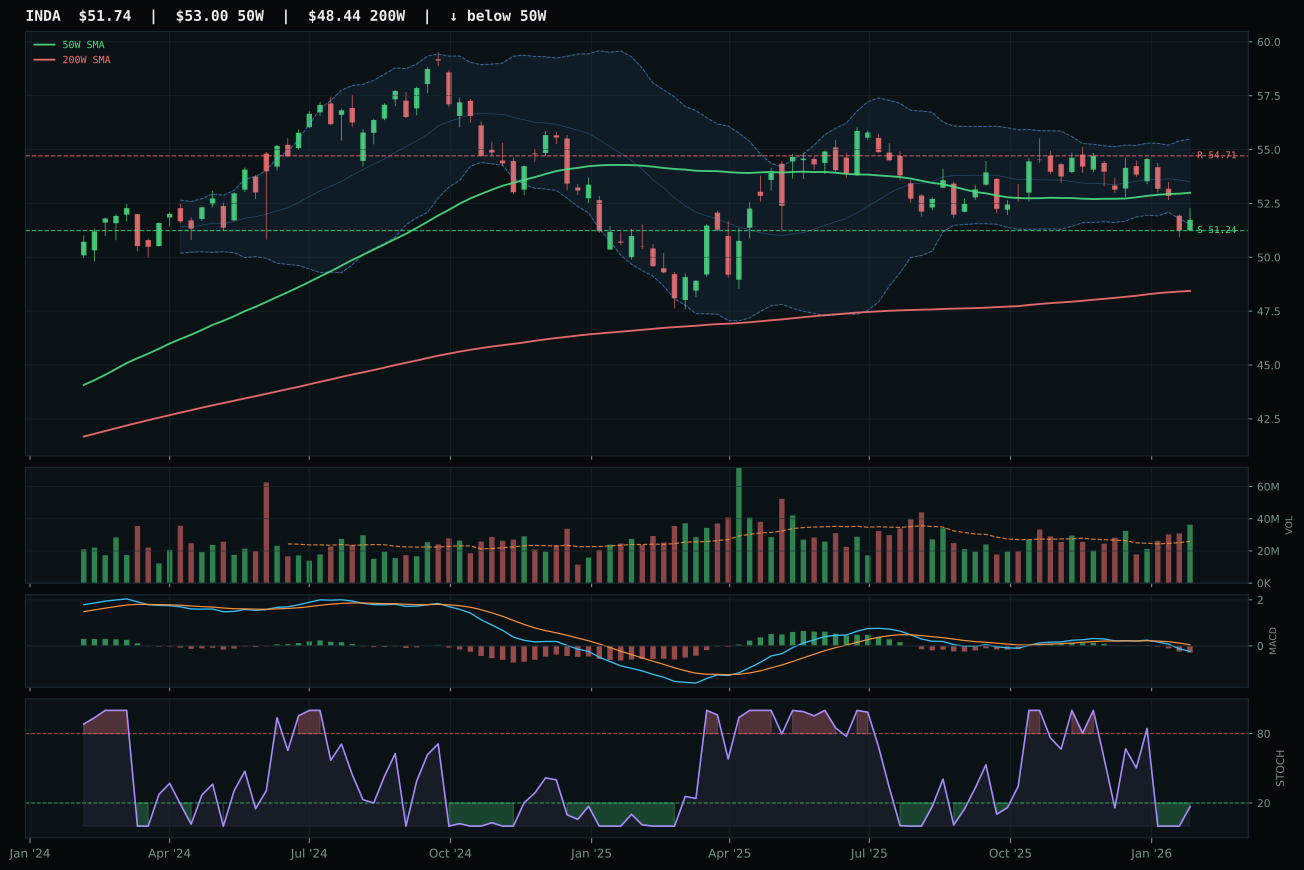
INDA has a pullback into support profile with -5.6% 13-week relative strength versus SPY.
A failed hold above support would weaken the setup.
Actionable but governed by invalidation levels.
ILF claims the category at 43.6 by capturing 20.2% thirteen-week returns with 18.7% SPY relative strength and 13.9% category-relative strength, all from a vertical extension 29.9% above the 50-week moving average backed by 2.31x volume participation (accumulation/confirmation) and a persistence score of 97.8/100—the highest in the entire portfolio. IEMG, the runner-up, shows weaker timing at 37.0/100 versus ILF's 45.0/100, weaker risk-reward at 44.9 versus 53.9, weaker volume confirmation (above-average participation versus accumulation), and zero category-relative strength versus ILF's 13.9%. The gap is stark: ILF's 97.8/100 technical evidence component reveals institutional money is flowing into Latin America commodity and value beta specifically, not broad emerging-market exposure, and the volume pattern confirms this is not retail enthusiasm but calculated reallocation.
Emerging Markets earns zero allocation, ranking ninth with a 43.6 category score that falls outside the portfolio's top eight allocation slots. Macro fit is a miserable 38.0/100, dragged by -10 points each from active credit stress and liquidity stress, while risk appetite positive contributes only +8. In late-cycle reflation, emerging markets face dual headwinds: carry-trade funding stress from rising dollar rates and credit-sensitive portfolio pressure from tightening financial conditions. ILF's brilliant technical execution—97.8 persistence and 83.0 structure—cannot overcome the macro environment's cold shoulder. The category's 3/2/1 weighted basket starts at 67.3 but drops to 43.6 after factoring in macro regime and the quality of the setup relative to other allocation options. Capital allocation is ruthless: emerging markets must compete with energy, industrial metals, agriculture, and AI for portfolio space, and the macro dice roll is unfavorable. ILF would need to accelerate 13-week relative strength beyond +25% SPY or macro fit to climb above -30 points to earn even a 10% slot.
Technology — XLK
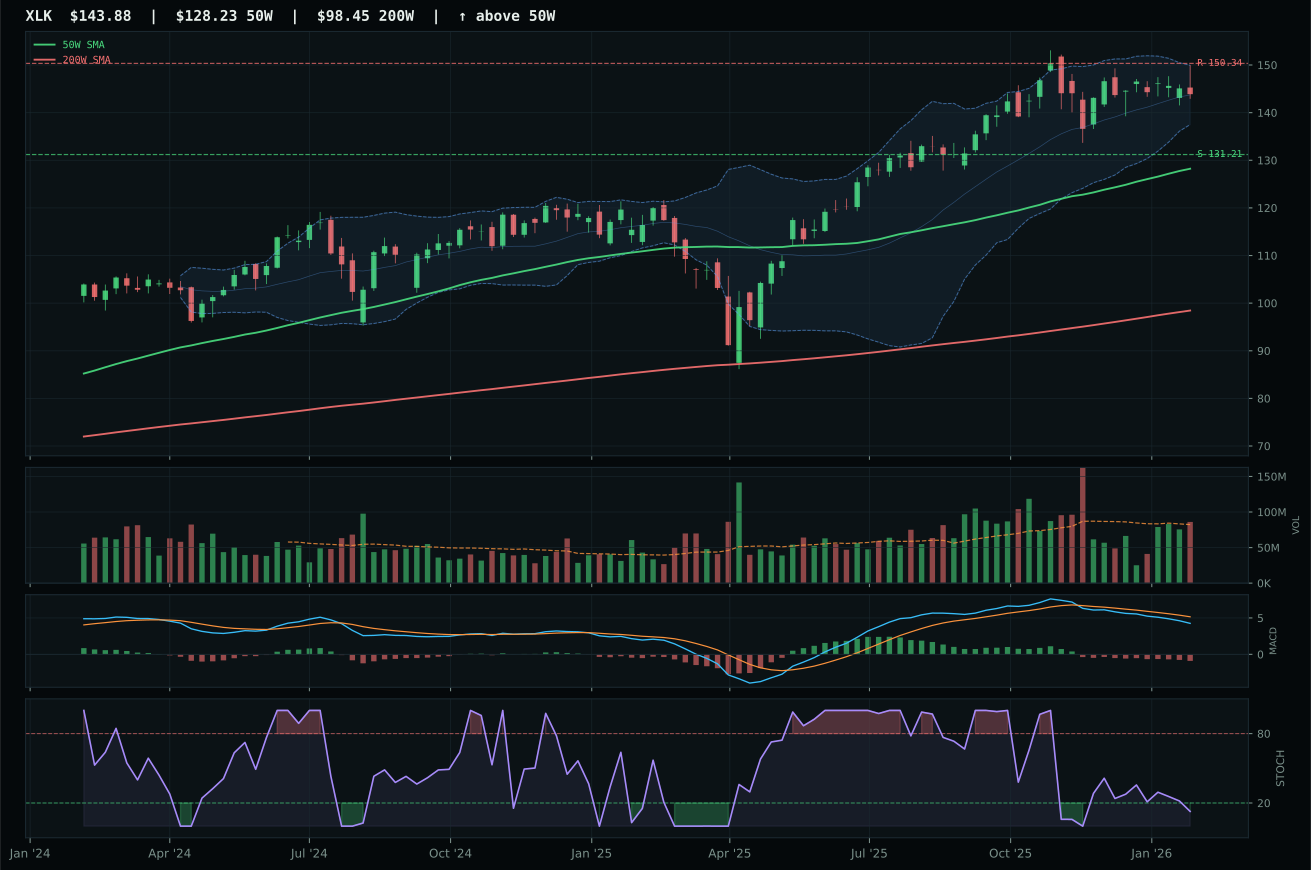
XLK has a neutral structure profile with -5.7% 13-week relative strength versus SPY.
A failed hold above support would weaken the setup.
Actionable but governed by invalidation levels.
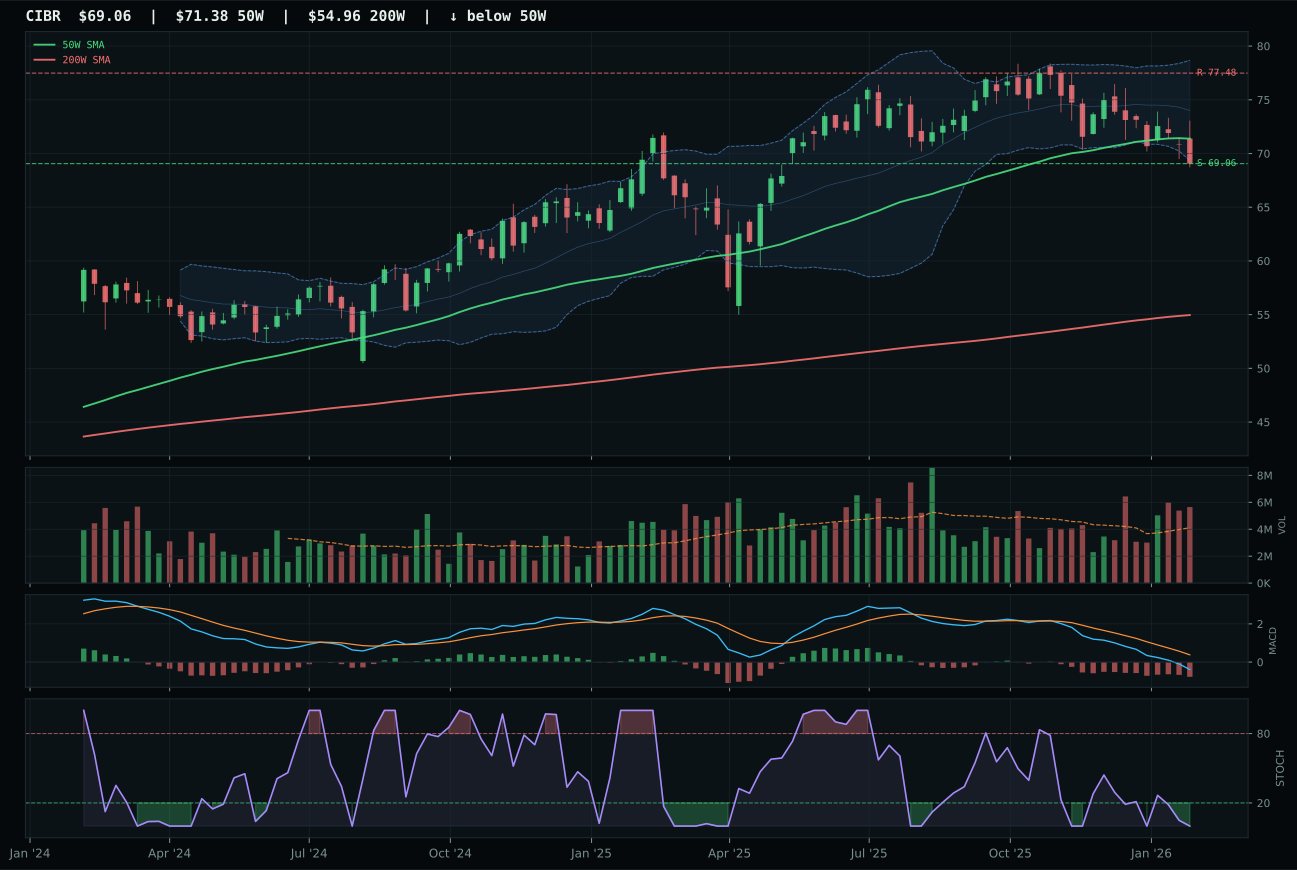
CIBR has a pullback into support profile with -12.1% 13-week relative strength versus SPY.
A failed hold above support would weaken the setup.
Actionable but governed by invalidation levels.
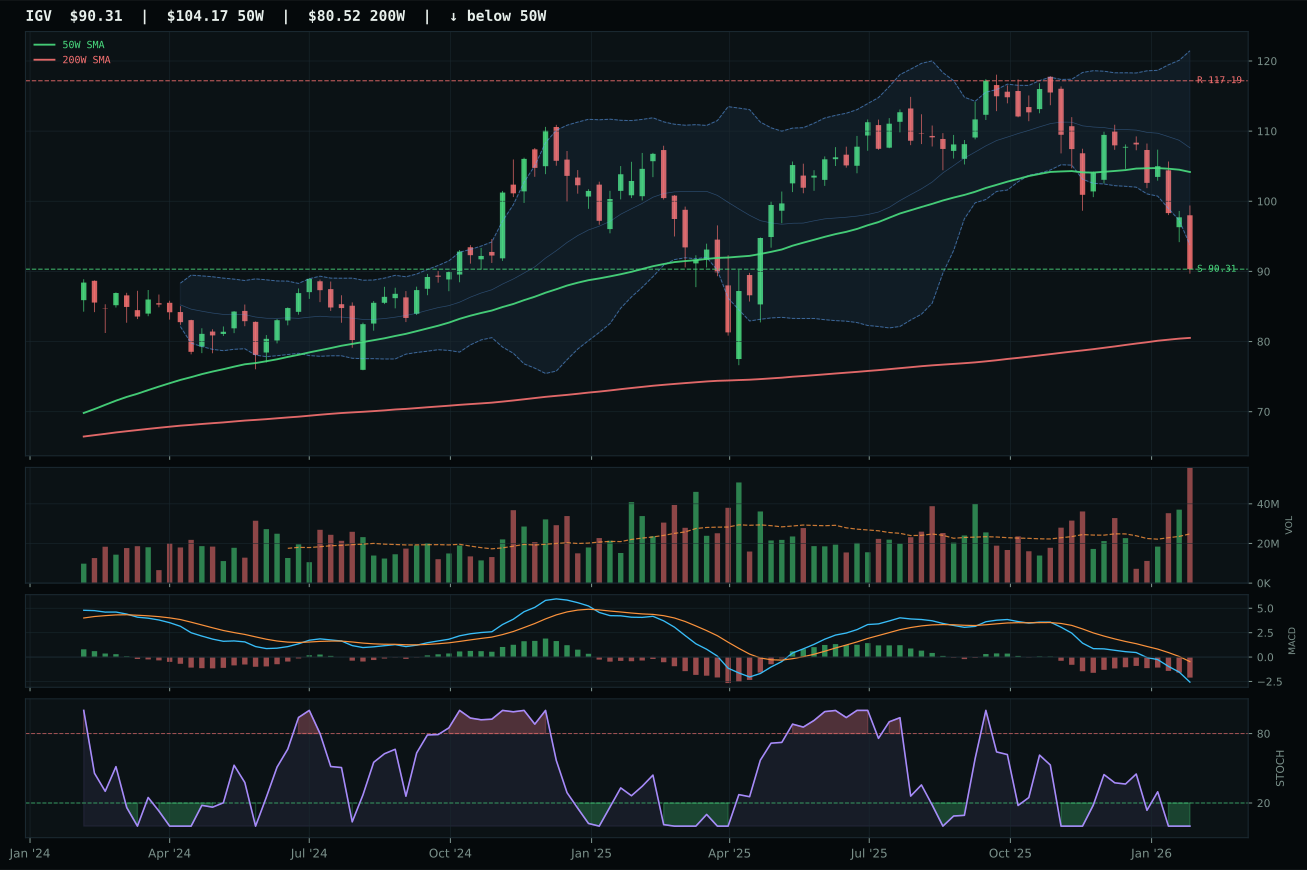
IGV has a pullback into support profile with -23.3% 13-week relative strength versus SPY.
A failed hold above support would weaken the setup.
Actionable but governed by invalidation levels.
XLK wins the category by holding ground above both its 50-week and 200-week moving averages while posting a 6.4% gain relative to category peers—the decisive edge over CIBR, which shows zero category-relative strength and a 12.1% deficit versus SPY. The setup is structurally neutral at 68.9/100 cleanliness, but XLK's 73.4% trend score and perfect positioning above key support at 131.21 give it the technical legitimacy the allocator demands in a sector where momentum confirmation sits at only 31.4/100 due to a flat 4-week return and bearish MACD. This is not a breakout; it is a controlled hold in an asset that has shaken off enough weak hands that new accumulation is beginning to matter more than trailing exhaustion.
Technology earns zero allocation this week, ranking outside the top eight categories at a final score of 34.7. The macro environment penalizes large-cap tech growth: liquidity stress remains active at -10 points, credit stress at -7, and inflation pressure at -4, while the single offsetting driver—risk appetite positive at +9—cannot overcome the structural headwinds. XLK's technical evidence of 42.0/100 is respectable but insufficient when macro fit tumbles to 44.0/100, dragging the composite to 62% weighting on weak fundamentals. In Late-Cycle Reflation, capital rotates away from duration-sensitive software and semis toward real assets and energy; even the artificial-intelligence sponsorship boost (+4 to +6 depending on the ETF) cannot anchor this category into portfolio relevance. Technology would need either a macro regime shift toward risk-on liquidity, a durable 10%+ SPY-relative strength from the basket, or MACD and stochastic confirmation of fresh accumulation to earn even a 10% slot.