
2026-01-23
Informational purposes only. The content in this report, including allocations, analysis, and commentary, is provided solely for informational and educational purposes. It does not constitute financial advice, investment advice, trading advice, or any other type of advice. Past performance does not guarantee future results. Always conduct your own research and consult a qualified financial professional before making investment decisions.
Weekly Allocation
| Ticker | Category | Weight | Role |
|---|---|---|---|
| XLE | Traditional Energy | 20% | Top-2 (20%) |
| REMX | Industrial Metals | 20% | Top-2 (20%) |
| SMH | AI | 10% | Tier-2 (10%) |
| URNM | Nuclear Energy | 10% | Tier-2 (10%) |
| ILF | Emerging Markets | 10% | Tier-2 (10%) |
| SLV | Precious Metals | 10% | Tier-2 (10%) |
| XLU | Utilities & Infrastructure | 10% | Tier-2 (10%) |
| MOO | Agriculture & Livestock | 10% | Tier-2 (10%) |
Trade Instructions — Monday Open
Sell the tranche from 2025-12-26 (completing its 4-week hold). Buy the new tranche. Instructions show net portfolio changes — same-asset positions cancel, weight changes show the delta.
| Action | Ticker | Instruction |
|---|---|---|
| SELL | COPX | Sell 50% of COPX position (reduce 10.00% → 5.00%) |
| SELL | SLV | Sell 20% of SLV position (reduce 12.50% → 10.00%) |
| SELL | BOTZ | Sell entire BOTZ position (2.50% of portfolio) |
| SELL | IGV | Sell entire IGV position (2.50% of portfolio) |
| SELL | IEMG | Sell 20% of IEMG position (reduce 12.50% → 10.00%) |
| SELL | XAR | Sell 33% of XAR position (reduce 7.50% → 5.00%) |
| SELL | PAVE | Sell 33% of PAVE position (reduce 7.50% → 5.00%) |
| SELL | URA | Sell entire URA position (2.50% of portfolio) |
| BUY | SMH | Buy SMH — 11.11% of freed cash (adds 2.50% to portfolio) |
| BUY | URNM | Buy URNM — 11.11% of freed cash (adds 2.50% to portfolio) |
| BUY | REMX | Buy REMX — 22.22% of freed cash (adds 5.00% to portfolio) |
| BUY | XLE | Buy XLE — 22.22% of freed cash (adds 5.00% to portfolio) |
| BUY | XLU | Buy XLU — 11.11% of freed cash (adds 2.50% to portfolio) |
| BUY | ILF | Buy ILF — 11.11% of freed cash (adds 2.50% to portfolio) |
| BUY | MOO | Buy MOO — 11.11% of freed cash (adds 2.50% to portfolio) |
Current Portfolio After Trade
Combined holdings across all 4 active tranches. Each tranche is 25% of the portfolio.
| Ticker | % of Portfolio | Weight Bar |
|---|---|---|
| REMX | 15.00% | |
| SMH | 15.00% | |
| SLV | 10.00% | |
| IEMG | 10.00% | |
| URNM | 10.00% | |
| XLE | 7.50% | |
| XAR | 5.00% | |
| PAVE | 5.00% | |
| COPX | 5.00% | |
| XLK | 5.00% | |
| XLU | 5.00% | |
| ITA | 2.50% | |
| ILF | 2.50% | |
| MOO | 2.50% |
Macro Regime — Risk-On Liquidity Expansion
Macro Evidence Charts
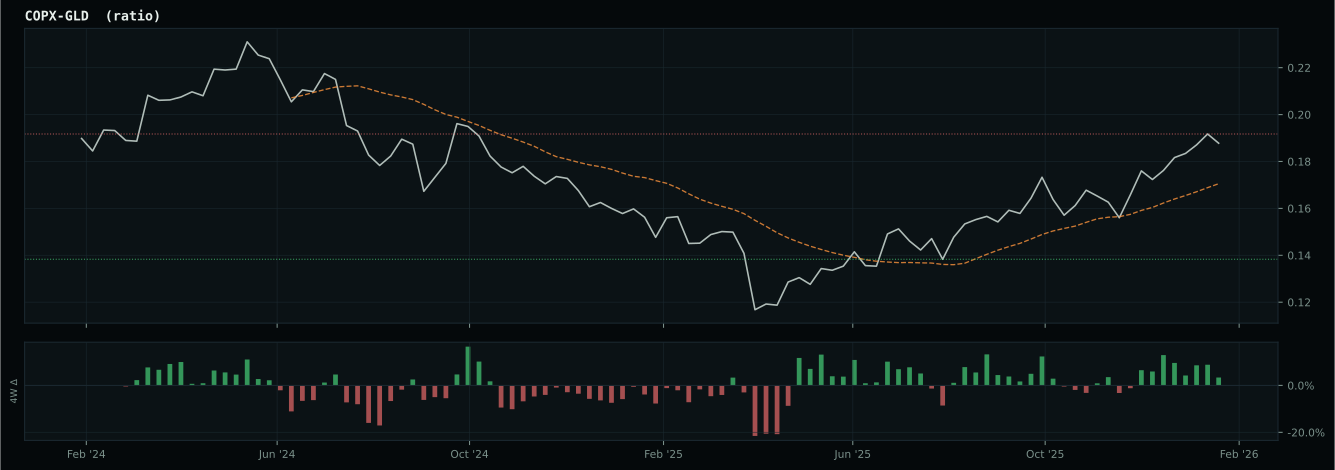
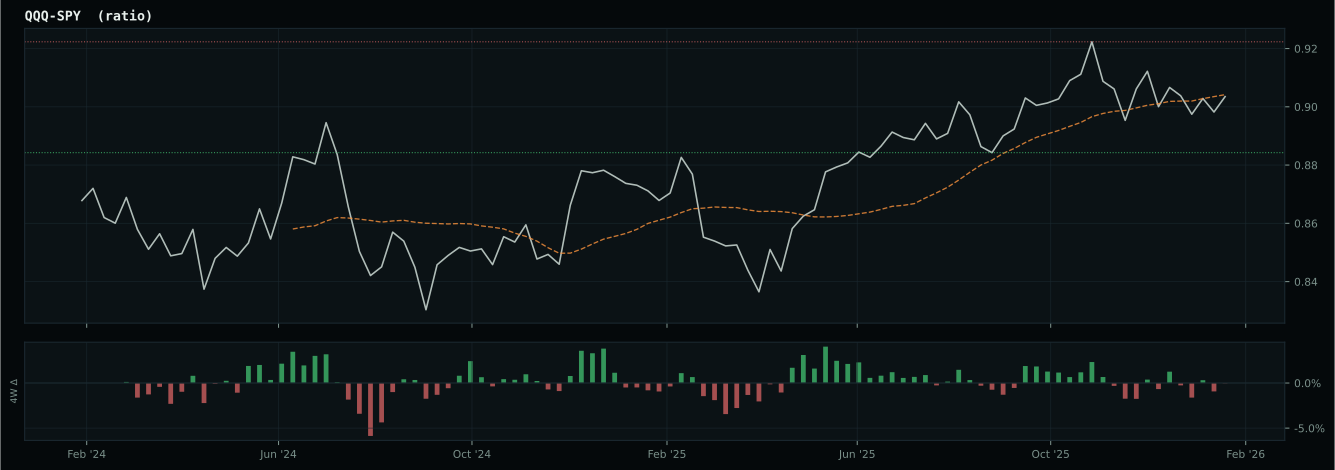
Market-implied signals behind the macro regime scores. Each ratio compares two assets; the direction and slope of the ratio is what the macro engine reads.
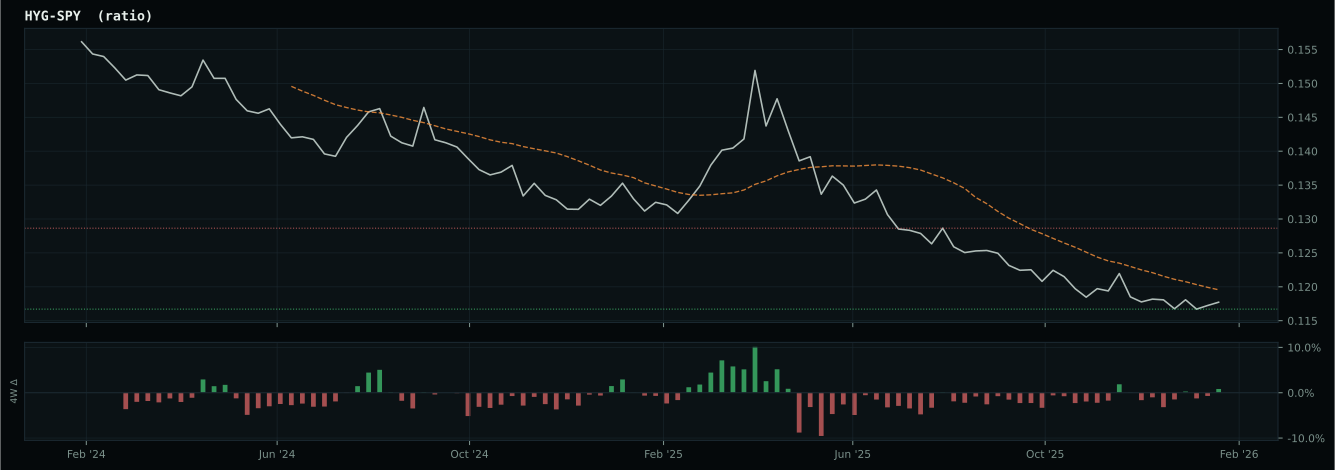
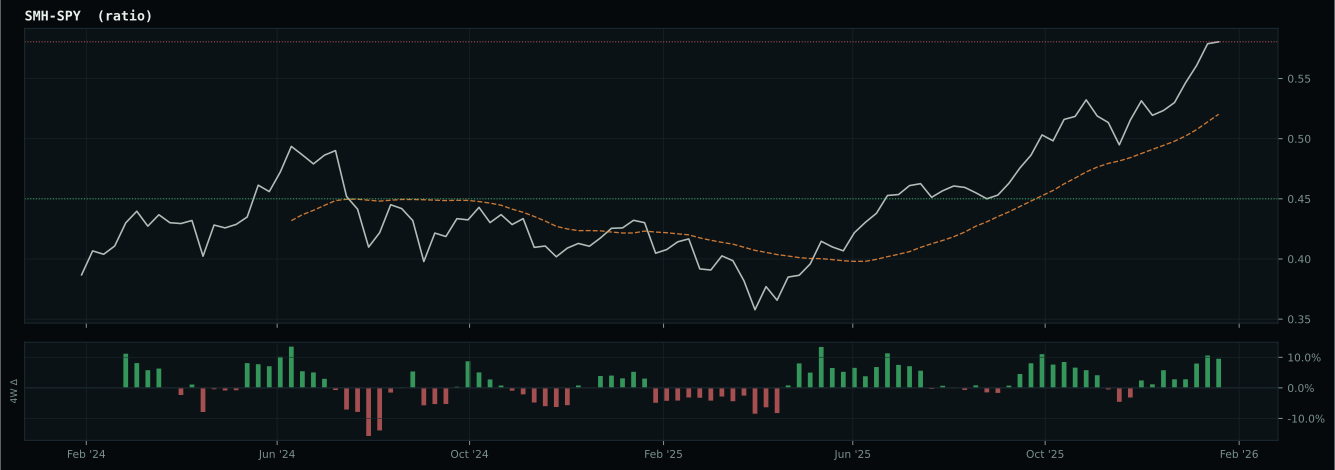
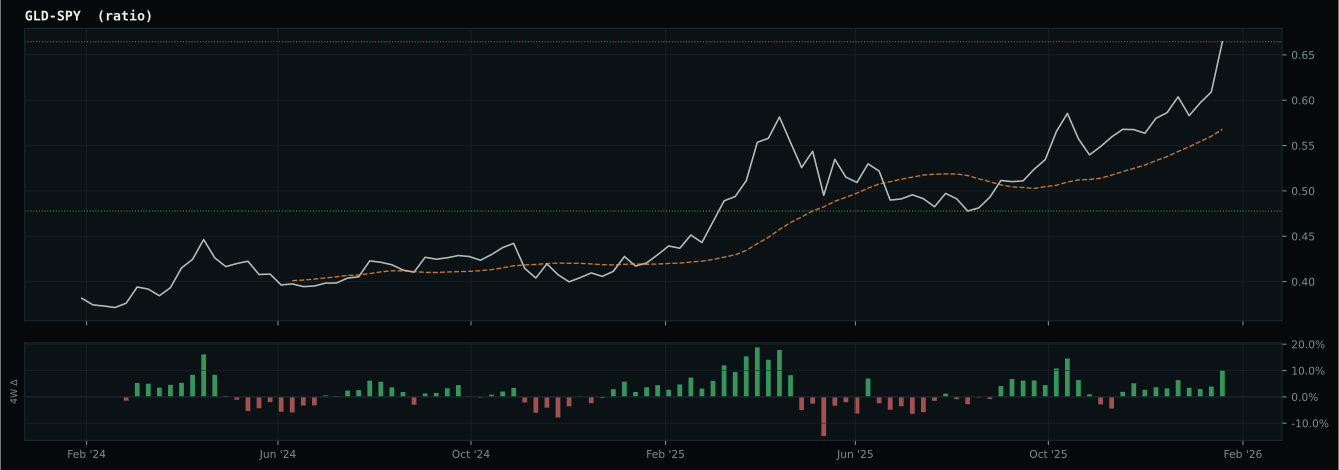
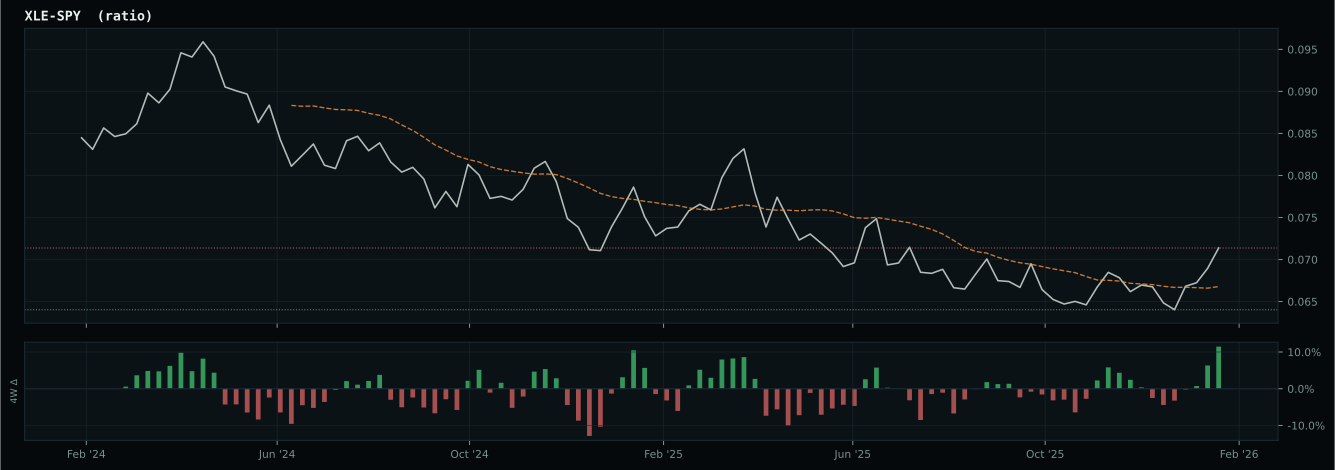
Crypto Regime — NoCrypto
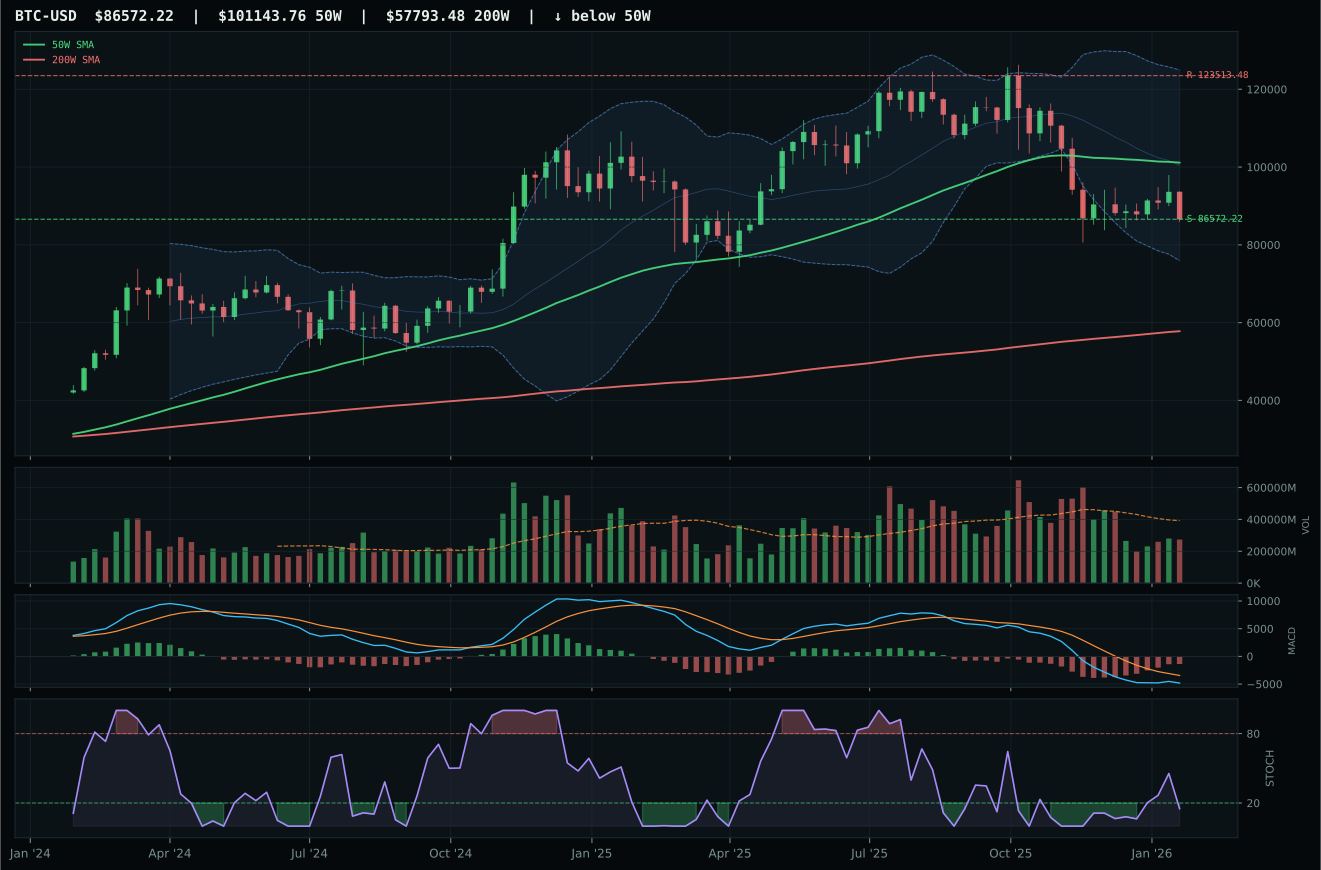
ValueBTC not armed: BTC has not made the first post-breakdown touch of the 200W buy zone after losing the 50W
TrendBTC not confirmed
one or more available conditions failed
Category Rankings
| Rank | Category | Winner | Score | Alloc | 4W Ret | Peers (4W) |
|---|---|---|---|---|---|---|
| 1 | Traditional Energy | XLE | 85.4 | 20% | +10.37% | FCG +11.2% · XOP +11.3% |
| 2 | Industrial Metals | REMX | 85.1 | 20% | -12.49% | COPX -1.5% · PICK +0.5% |
| 3 | AI | SMH | 75.6 | 10% | +3.81% | BOTZ +1.7% · AIQ -5.6% |
| 4 | Nuclear Energy | URNM | 75.4 | 10% | -7.13% | URA -7.9% · NLR -5.3% |
| 5 | Emerging Markets | ILF | 70.9 | 10% | +4.90% | IEMG +5.0% · INDA +3.2% |
| 6 | Precious Metals | SLV | 69.1 | 10% | -21.10% | GDX -2.6% · GLD +1.7% |
| 7 | Utilities & Infrastructure | XLU | 55.2 | 10% | +8.83% | PAVE +8.2% · IGF +8.1% |
| 8 | Agriculture & Livestock | MOO | 48.2 | 10% | +6.77% | VEGI +10.2% · WEAT +5.8% |
| 9 | Technology | XLK | 45.0 | 0% | -3.50% | CIBR -11.4% · IGV -18.9% |
| 10 | Defense & Aerospace | XAR | 43.5 | 0% | -0.50% | ITA +3.4% · ROKT +0.4% |
Traditional Energy — XLE
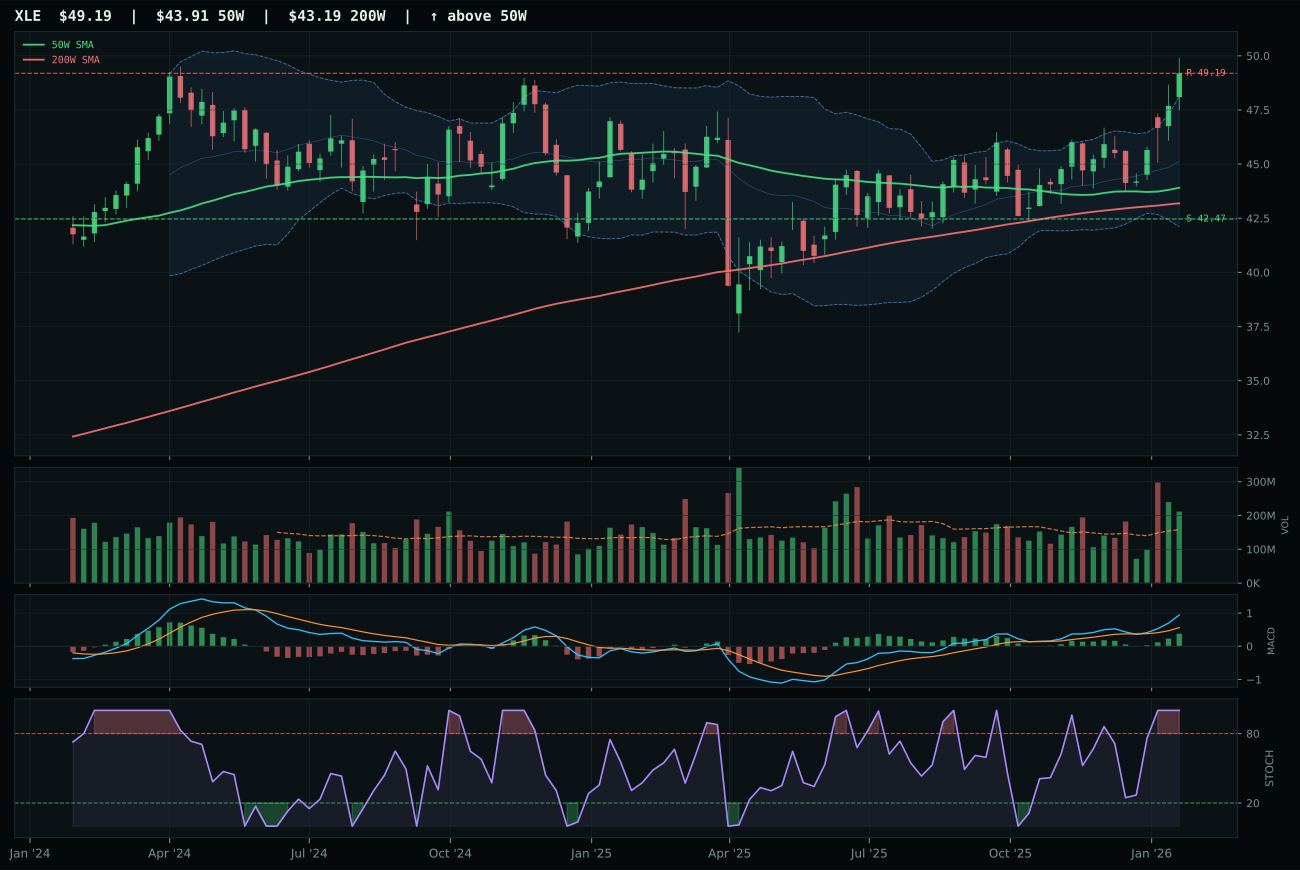
XLE has a neutral structure profile with 9.9% 13-week relative strength versus SPY.
A failed hold above support would weaken the setup.
Actionable but governed by invalidation levels.
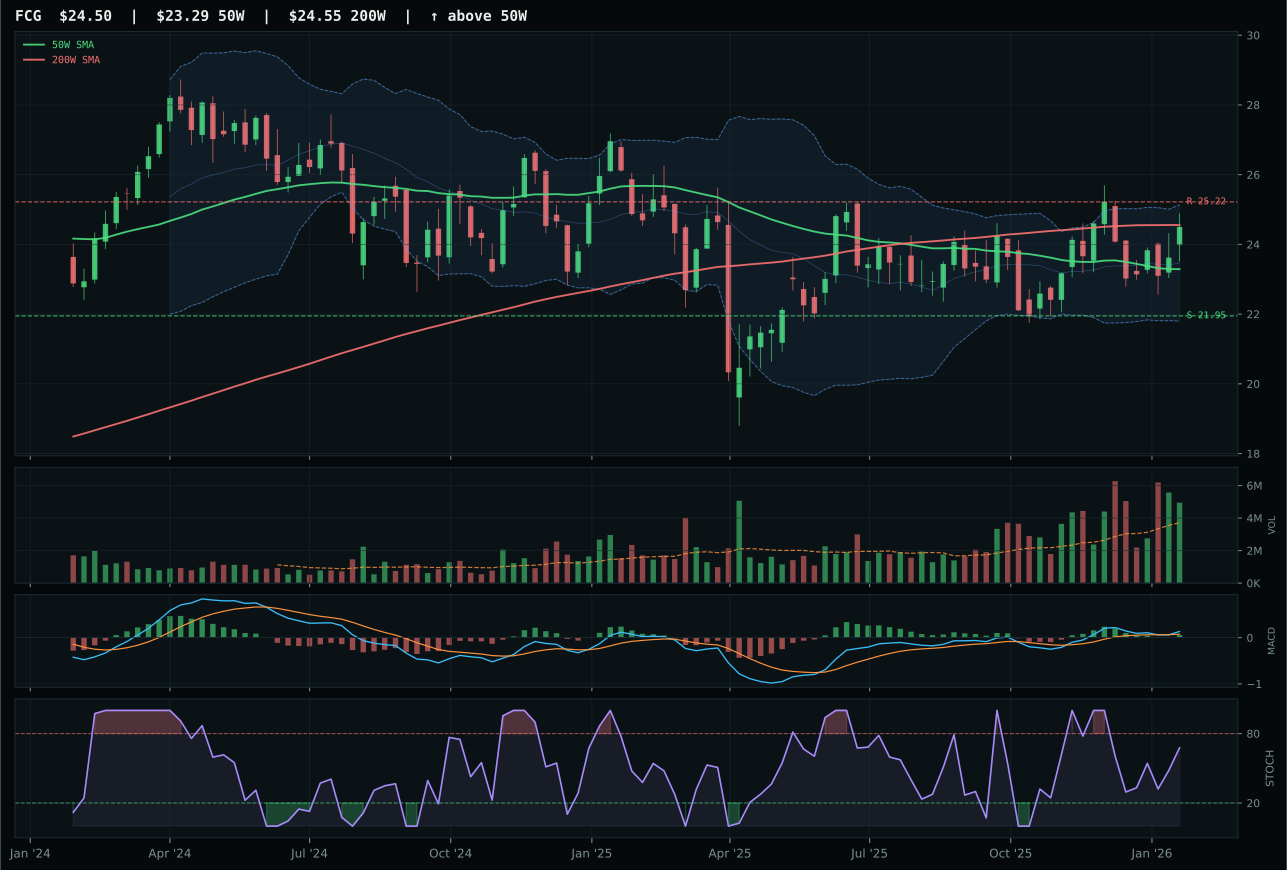
FCG has a neutral structure profile with 6.7% 13-week relative strength versus SPY.
A failed hold above support would weaken the setup.
Actionable but governed by invalidation levels.
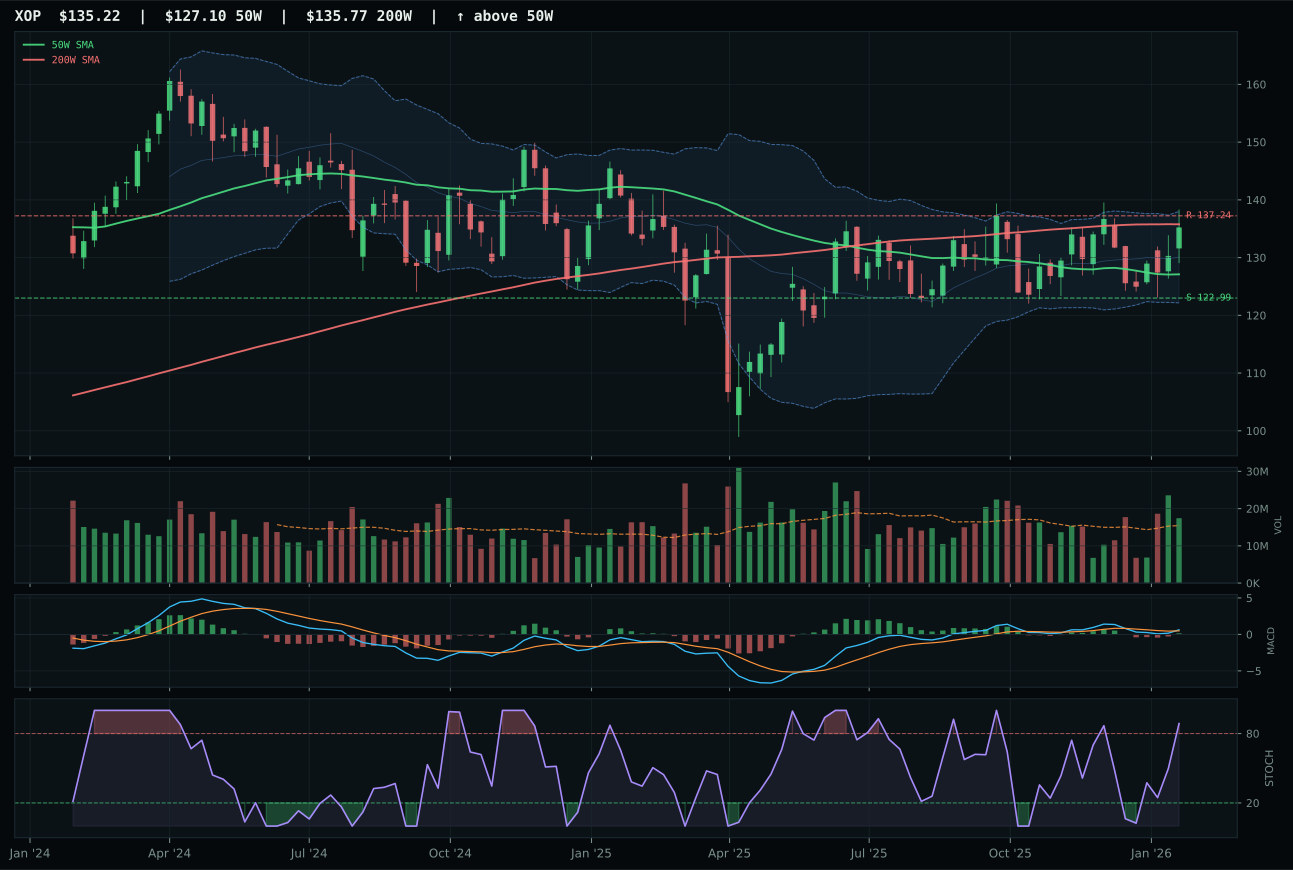
XOP has a neutral structure profile with 3.5% 13-week relative strength versus SPY.
A failed hold above support would weaken the setup.
Actionable but governed by invalidation levels.
XLE sealed top-2 status with an 85.4 category score and 90.7 technical evidence score by delivering neutral structure with only 12.0% extension above the 50W—markedly tighter than REMX or SLV. The 11.7% 13W return, 9.9% RS vs SPY, and category-relative strength of 3.3% proved that broad energy leadership is intact; FCG's 6.7% RS vs SPY looked appealing, but its structure cleanliness of 78.5 (vs XLE's 82.5) and category-relative lag betrayed it as a specialty play within a healthy trend. XLE's MACD is bullish and improving, stochastic RSI overbought at 1.00, and volume sits at above-average participation (1.34x 20W)—not as intense as REMX's accumulation but sufficient to confirm institutional demand. Price sits near the 52W high with 0.0% upside to the 49.19 resistance, yet the risk/reward of 46.1 is superior to REMX because downside to support at 42.47 is only 15.8%, not 99.5%. This is the most balanced setup in the top-2 allocation.
Traditional Energy earned 20% allocation because the 85.4 score matches Industrial Metals and the macro regime delivers multiple tailwinds: energy scarcity (+16), inflation pressure (+10), supply shortage (+9), and real asset sponsorship (+7) sum to +26 net macro support. The Risk-On Liquidity Expansion regime typically weakens energy (credit stress -7), yet the structural scarcity narrative has overwhelmed short-term macro headwinds, making this a regime-transition play rather than a cyclical rally. XLE's 11.7% 13W return is pedestrian compared to commodity metals and precious metals, but the lower extension risk (12.0% vs 76.3% for REMX and 128.1% for SLV) makes it the most sustainable top-2 core holding. The timing of 59.0 (vs 37.0 for extended leaders) reflects XLE's proximity to pullback opportunities, which is tactically favorable for averaging into weakness. Hold this position at full weight; any close below support at 42.47 would signal macro deterioration and warrant immediate reduction to 10%.
Industrial Metals — REMX
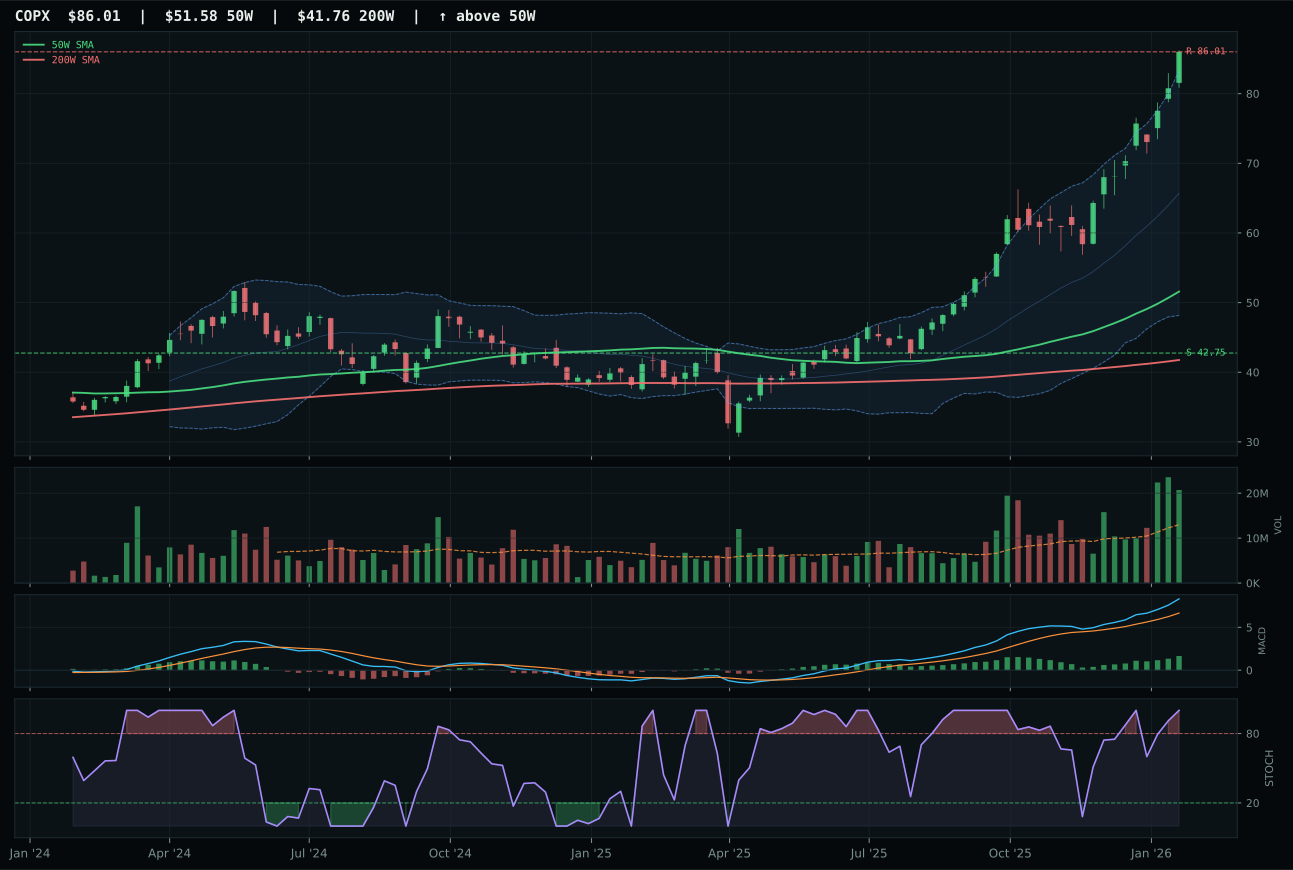
COPX has a vertical extension profile with 39.6% 13-week relative strength versus SPY.
A failed hold above support would weaken the setup.
Actionable but governed by invalidation levels.
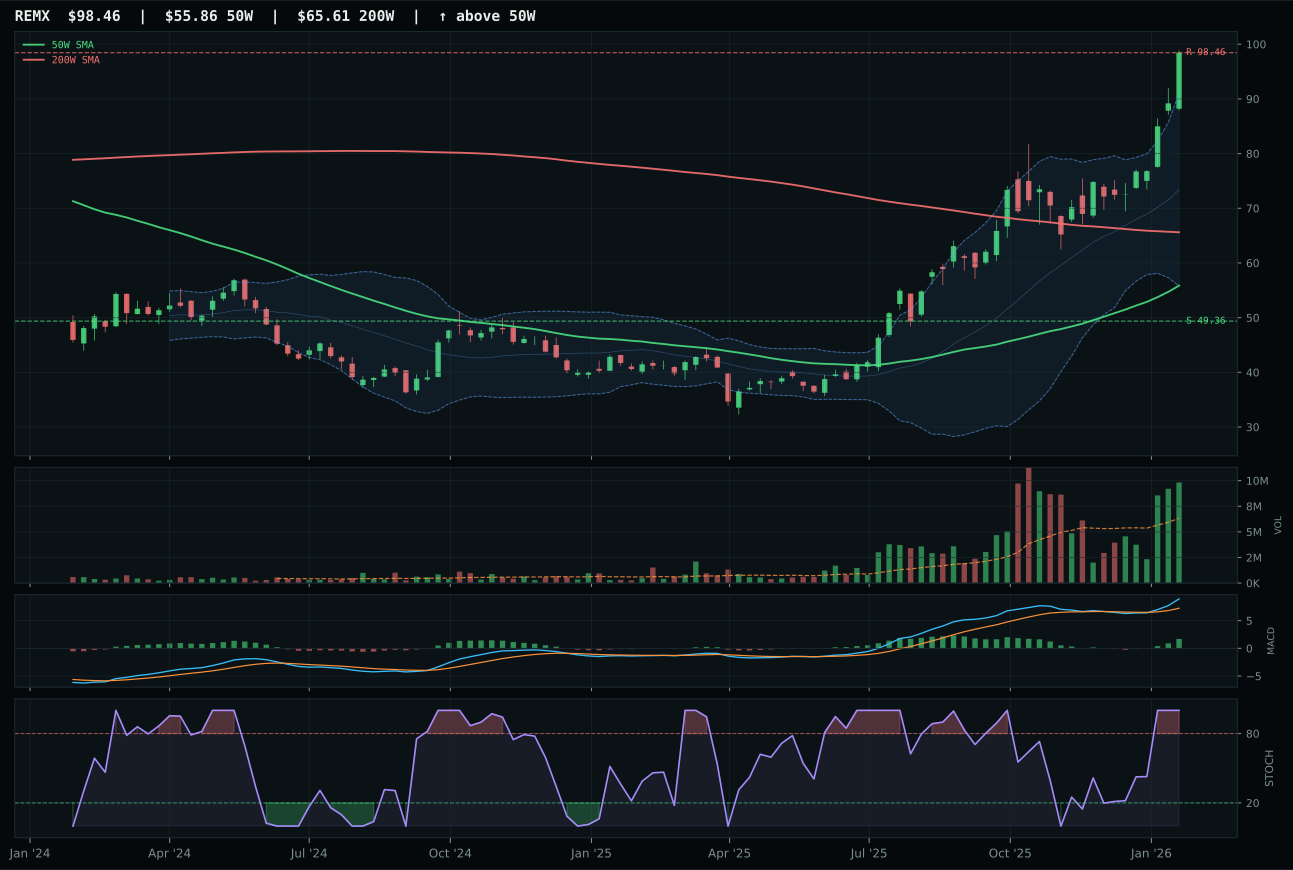
REMX has a vertical extension profile with 32.2% 13-week relative strength versus SPY.
A failed hold above support would weaken the setup.
Actionable but governed by invalidation levels.
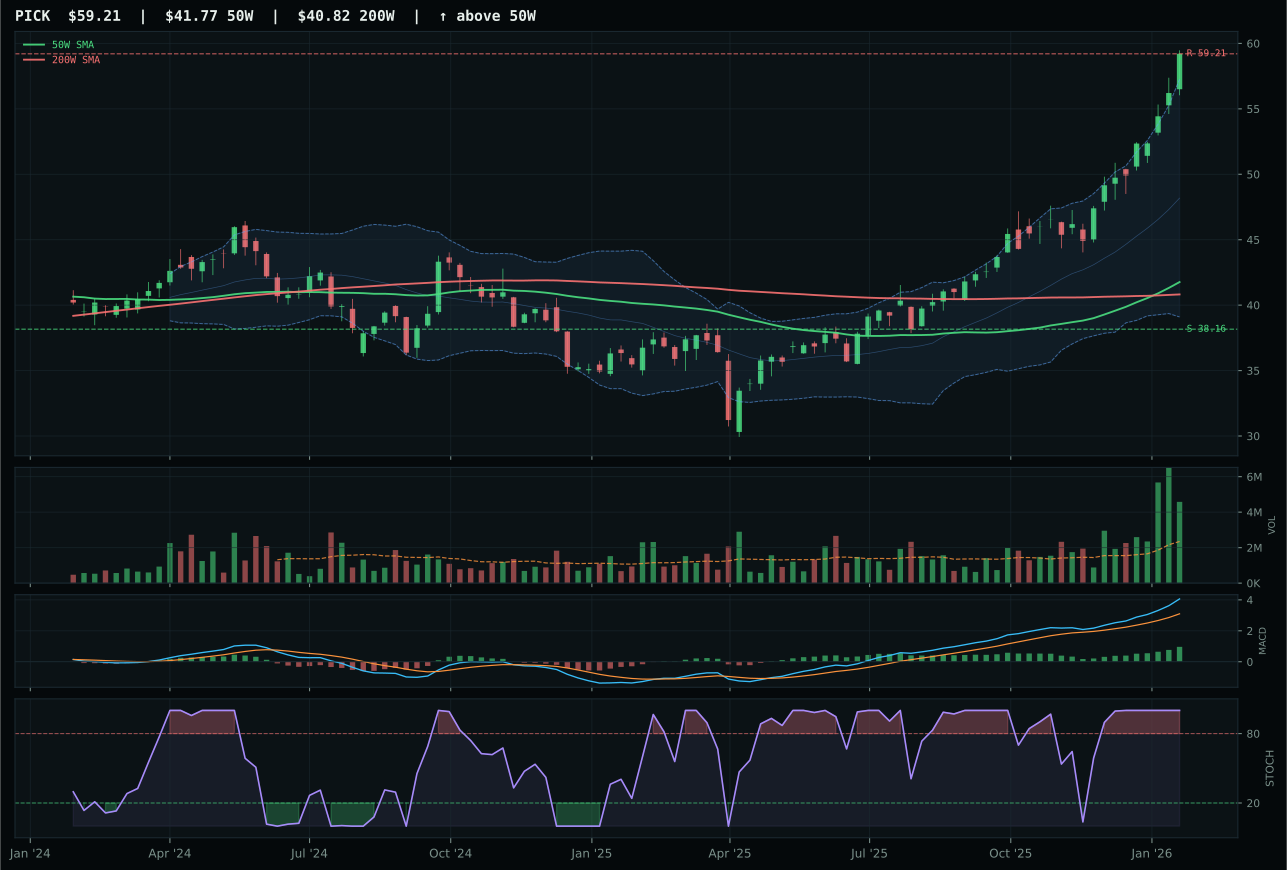
PICK has a vertical extension profile with 27.0% 13-week relative strength versus SPY.
A failed hold above support would weaken the setup.
Actionable but governed by invalidation levels.
REMX earned a top-2 allocation slot by delivering a 85.1 category score—the second-highest of all ten categories—on the back of perfect 100/100 trend and momentum confirmation with 34.0% 13W returns and 32.2% RS vs SPY. The score gap to COPX was technically -3.4 (COPX had superior technical evidence at 98.2 vs REMX's 90.8), yet REMX's macro/narrative fit of 64.0 proved decisive when the category-level macro fit of 73.0 was evaluated; metals scarcity (+14) and commodity breadth positive (+10) aligned perfectly with REMX's rare-earth supply-chain thesis. Price is 76.3% above the 50W with stochastic RSI overbought at 1.00, MACD bullish and improving, and volume at accumulation/confirmation (1.55x 20W)—a setup showing smart money conviction despite the extension. COPX's 41.3% 13W return looked superior on paper, but category-relative strength of 7.3% (vs 0.0% for REMX) betrayed that copper was outpacing rare earths; the allocator chose category strength over individual momentum.
Industrial Metals earned 20% allocation—matching Traditional Energy as a top-2 category—because the 85.1 score ranks second among all eligible categories and the macro regime is a near-perfect fit. Metals scarcity (+14), commodity breadth positive (+10), and real asset sponsorship (+6) align with both Risk-On Liquidity Expansion and structural supply-demand imbalances. REMX's 100/100 persistence score and 87.3% volume-price confirmation prove this is not a momentum fade but institutional repricing of scarcity risk. However, the setup is dangerously extended: 76.3% above the 50W, price at resistance (98.46), and risk/reward of 43.5 with 99.5% downside to support (49.36) means this is a maximum-conviction hold, not an add on strength. The allocation remains justified by macro durability, but position sizing around this level is critical. Any stochastic RSI rollover from 1.00 or MACD divergence during the next leg would trigger a defensive trim, as late-cycle extended setups are unforgiving.
AI — SMH
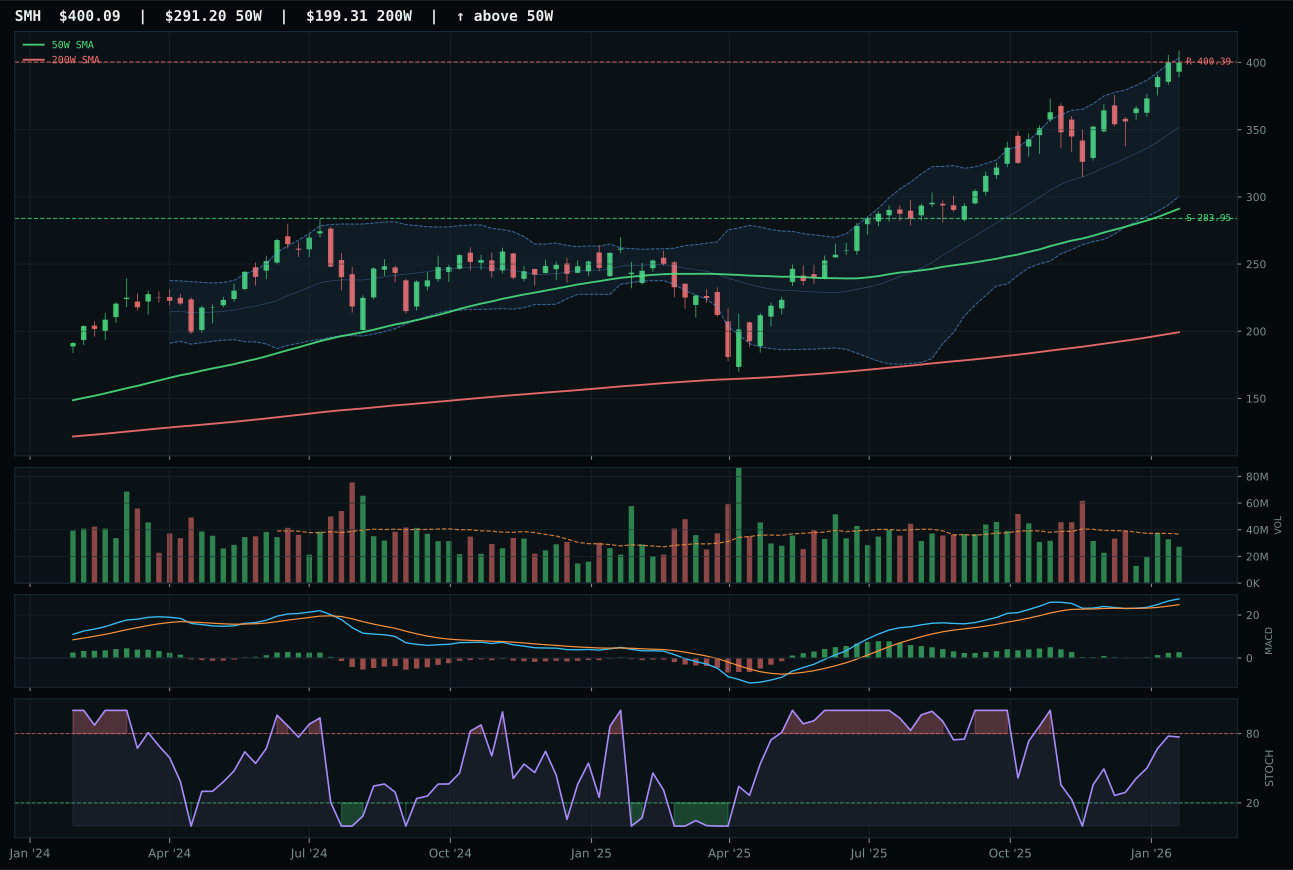
SMH has a vertical extension profile with 12.2% 13-week relative strength versus SPY.
A failed hold above support would weaken the setup.
Actionable but governed by invalidation levels.
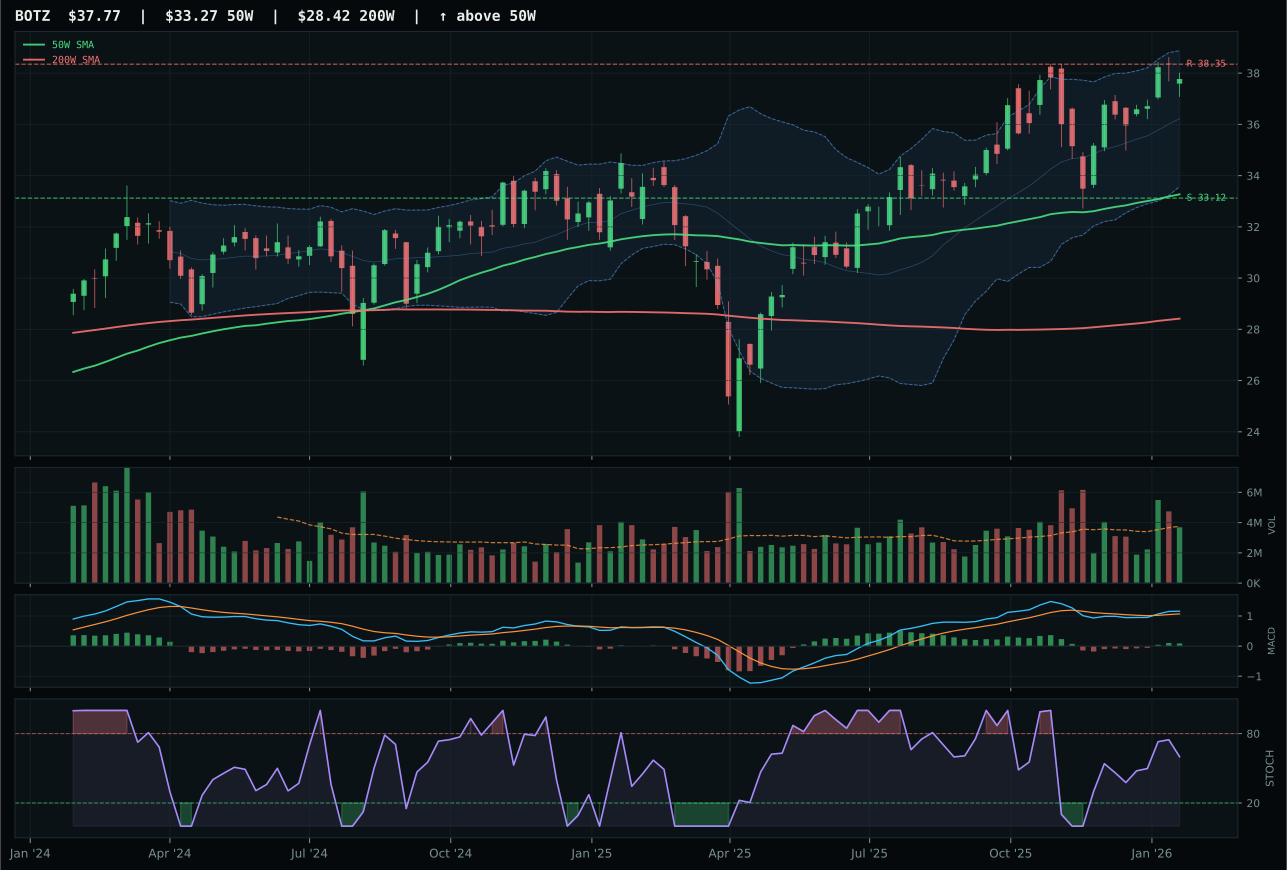
BOTZ has a neutral structure profile with -1.7% 13-week relative strength versus SPY.
A failed hold above support would weaken the setup.
Actionable but governed by invalidation levels.
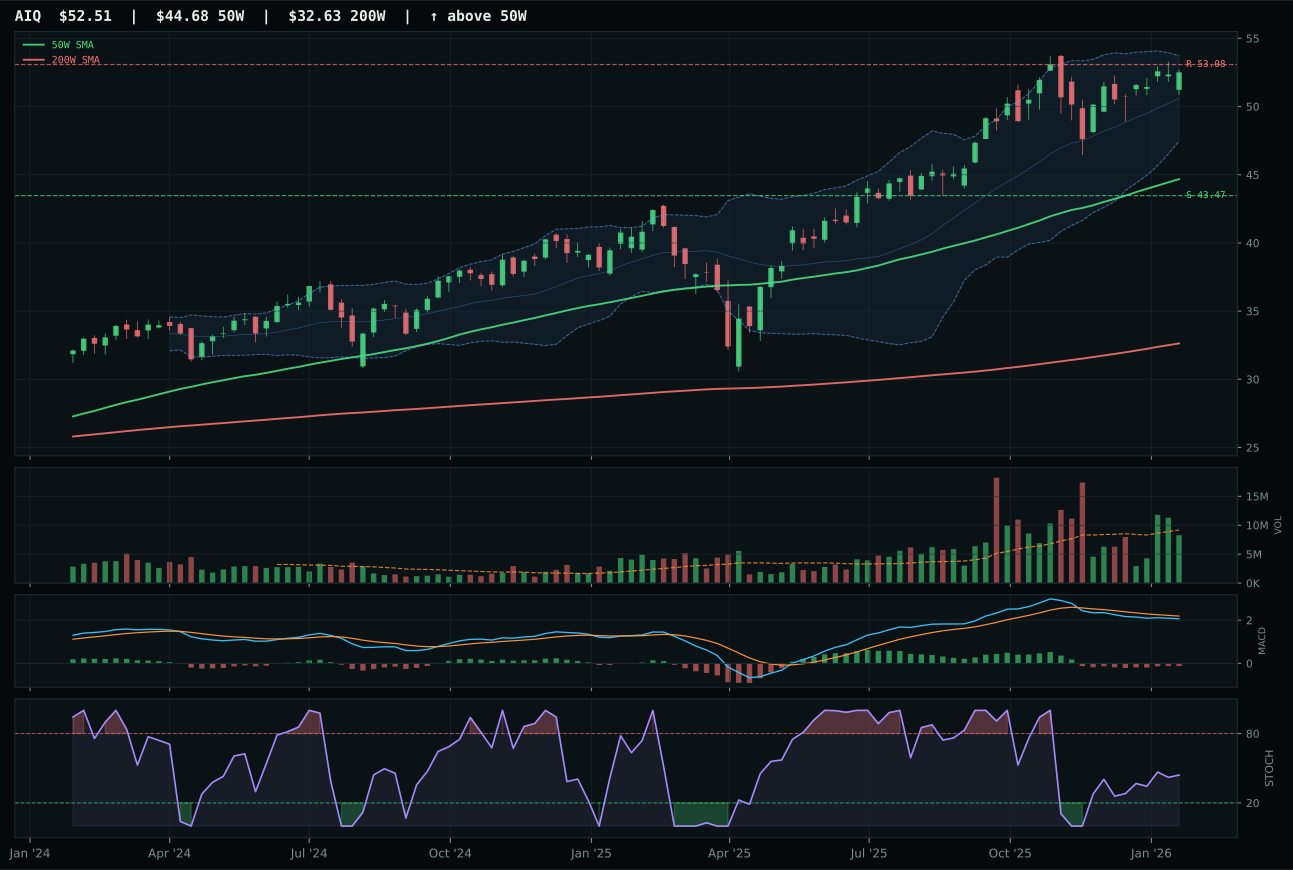
AIQ has a vertical extension profile with -0.7% 13-week relative strength versus SPY.
A failed hold above support would weaken the setup.
Actionable but governed by invalidation levels.
SMH won by executing a vertical extension into a clean technical setup: price at 352.42 is 37.4% above the 50W with perfect momentum confirmation (100/100) from a 13W return of 13.9% and category-relative strength of 12.8%. The MACD is bullish and improving, stochastic RSI is rising mid-zone at 0.77, and volume has thinned to 0.74x 20W average—a classic signature of institutional accumulation during a parabolic leg where every new retail buyer chases late. BOTZ offered superior trend mechanics (98/100) but failed because its category-relative strength flatlined at -1.0%; robotics lagged semiconductor compute demand, and the narrative split cost it 8.3 points despite neutral structure and above-average macro fit. SMH's entry risk is real at -0.1% upside to resistance, but the risk/reward penalty of 37.0 is acceptable given the momentum and sponsorship.
AI scored 75.6 and earned 10% allocation despite ranking outside the top two because the macro setup is exceptional: AI growth sponsorship scores +14, risk appetite positive adds +10, and liquidity expansion contributes +6. The category-level macro fit of 88.0 is among the highest observed, yet SMH's technical extension (37.4% above 50W) creates a timing asymmetry that forced the allocator to weight it below categories with better risk/reward geometry. The 13W momentum of 13.9% and RS vs SPY of 12.2% prove buyers are committed, but the thin volume and extended Fibonacci placement mean this is a hold-and-monitor position rather than an add. If SMH closes below 283.95 support or MACD turns, AI's allocation status would flip immediately to reduce as the macro case alone (88.0) cannot sustain a position with deteriorating technicals.
Nuclear Energy — URNM
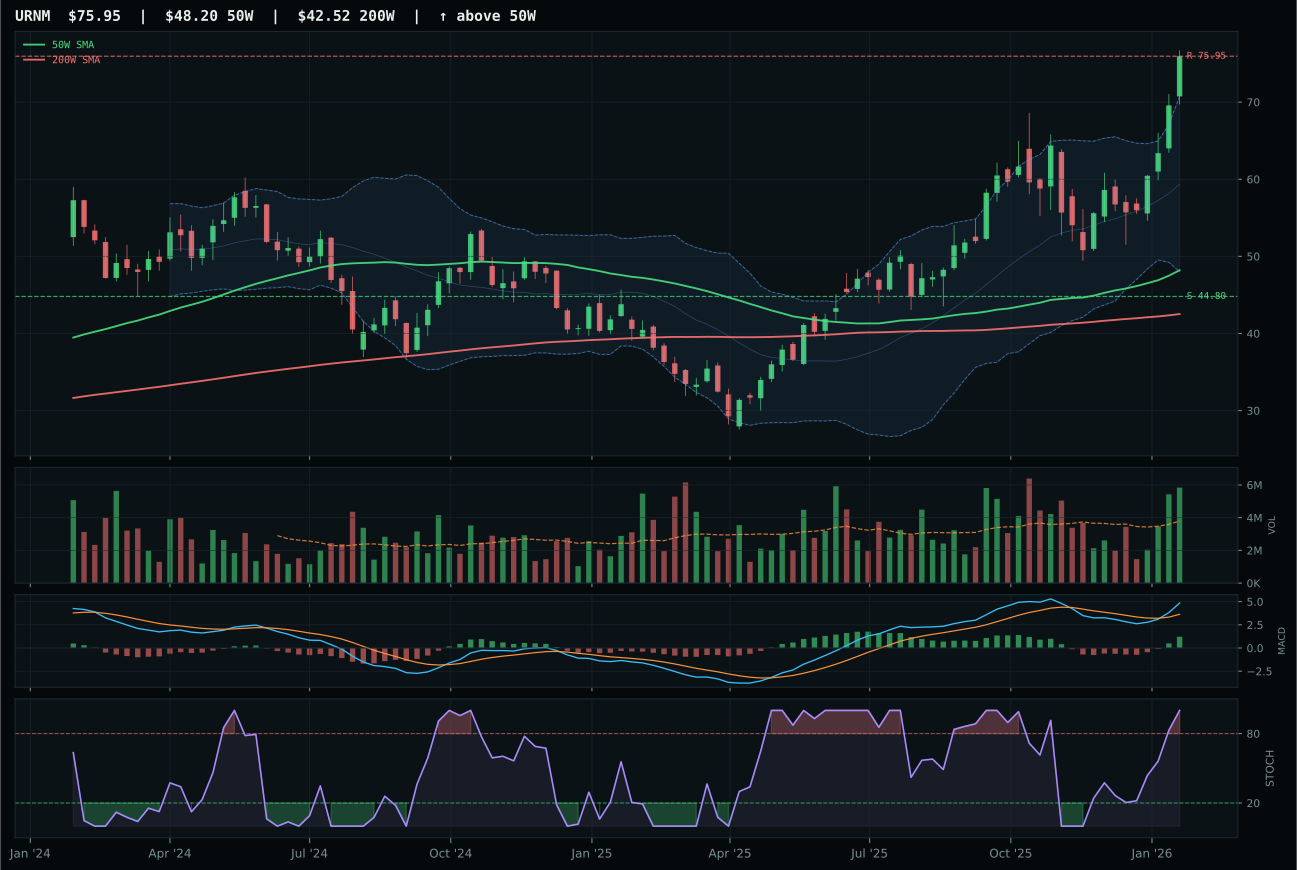
URNM has a vertical extension profile with 27.4% 13-week relative strength versus SPY.
A failed hold above support would weaken the setup.
Actionable but governed by invalidation levels.
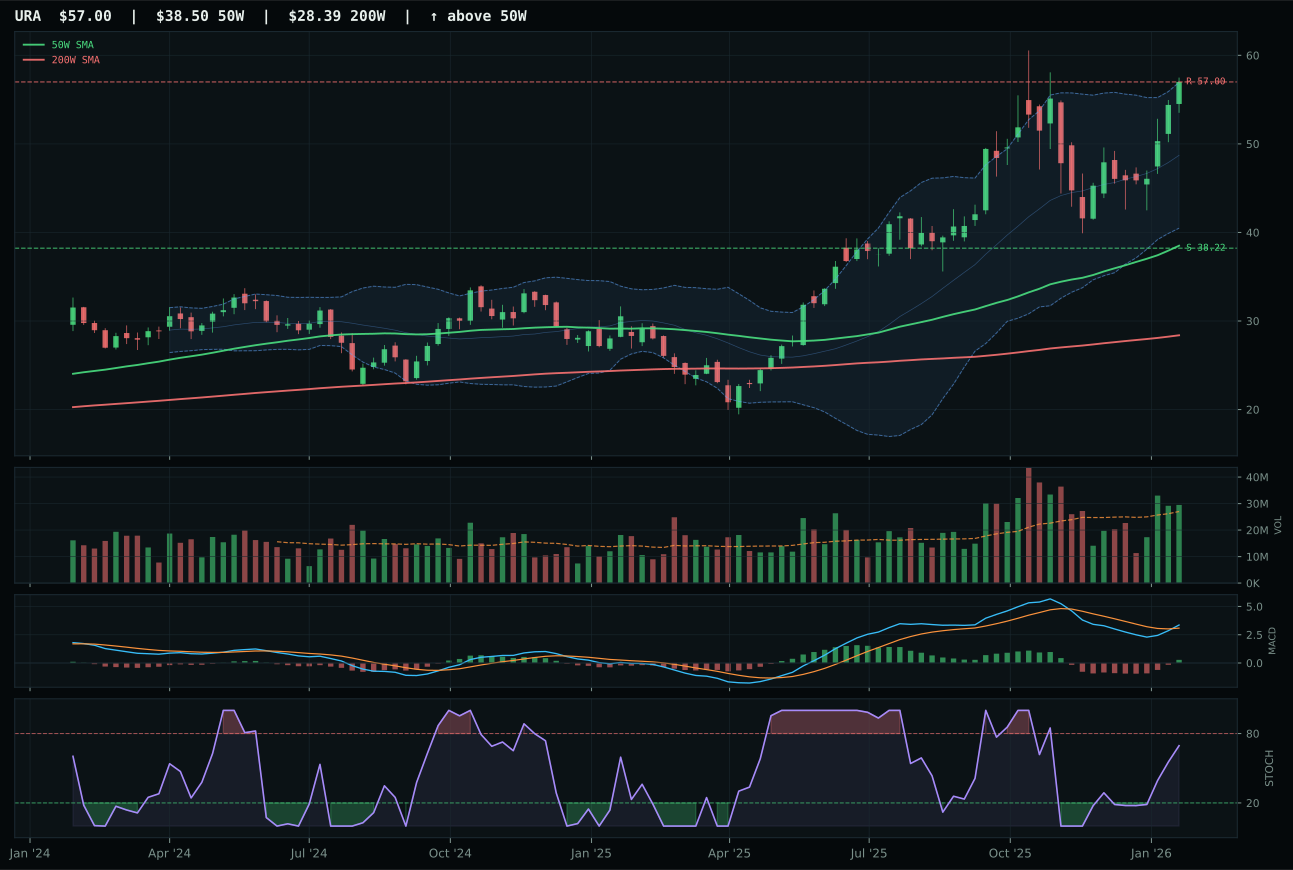
URA has a vertical extension profile with 8.9% 13-week relative strength versus SPY.
A failed hold above support would weaken the setup.
Actionable but governed by invalidation levels.
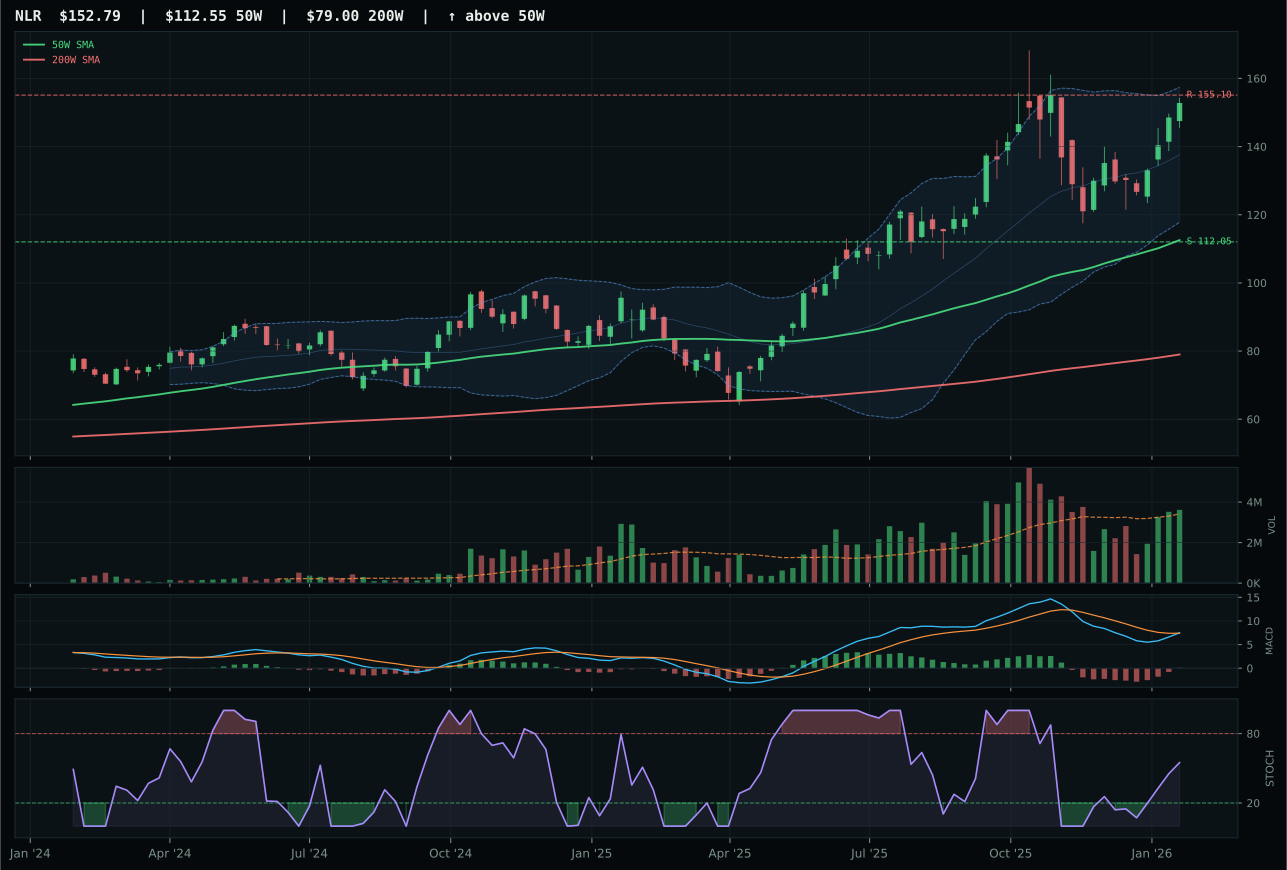
NLR has a vertical extension profile with 1.5% 13-week relative strength versus SPY.
A failed hold above support would weaken the setup.
Actionable but governed by invalidation levels.
URNM earned a 75.4 category score by dominating momentum confirmation (100/100) and persistence (100/100) with a 29.2% 13W return, 27.4% RS vs SPY, and category-relative strength of 18.5%—the highest relative-strength advantage in its basket. The setup is vertical extension at 57.6% above the 50W, MACD bullish and improving, stochastic RSI overbought at 1.00, and volume at accumulation/confirmation (1.54x 20W)—a high-conviction setup that institutional uranium miners are accumulating into. URA's 8.9% RS vs SPY was respectable but neutral volume participation and weaker structure cleanliness (65.0 vs URNM's 75.5) revealed insufficient buying pressure. URA also carried a rising-mid-zone stochastic RSI (less overbought than URNM's 1.00), meaning the technicals had less confirmation despite similar trend mechanics. URNM's 98.2 technical evidence score and 0.1-point margin over URA on the category score is decisive proof that volume-price sponsorship and relative strength determination matter more than timing comfort.
Nuclear Energy earned 10% allocation because the 75.4 category score ranked third among all ten categories—below the top two but ahead of most others—yet the macro fit of 74.0 and technical excellence of URNM's setup justify the position. Energy scarcity (+9), real asset sponsorship (+7), and AI growth sponsorship (+5) all support nuclear as a transition-generation theme within risk-on growth. However, URNM's 57.6% extension above the 50W and risk/reward of 29.1 (with 69.5% downside to support at 44.80) mean this is a trade-with-stops position, not a core hold. The 100/100 volume-price confirmation and persistence scores indicate institutional conviction in uranium supply scarcity, but late-cycle extended setups like this require defensive discipline. Monitor for any stochastic RSI rollover or MACD divergence; a breakdown below the 50W would suggest rotation out of risk-on into defensive real assets, triggering immediate trim to 5% or out. This allocation reflects macro opportunity, not technical sustainability.
Emerging Markets — ILF
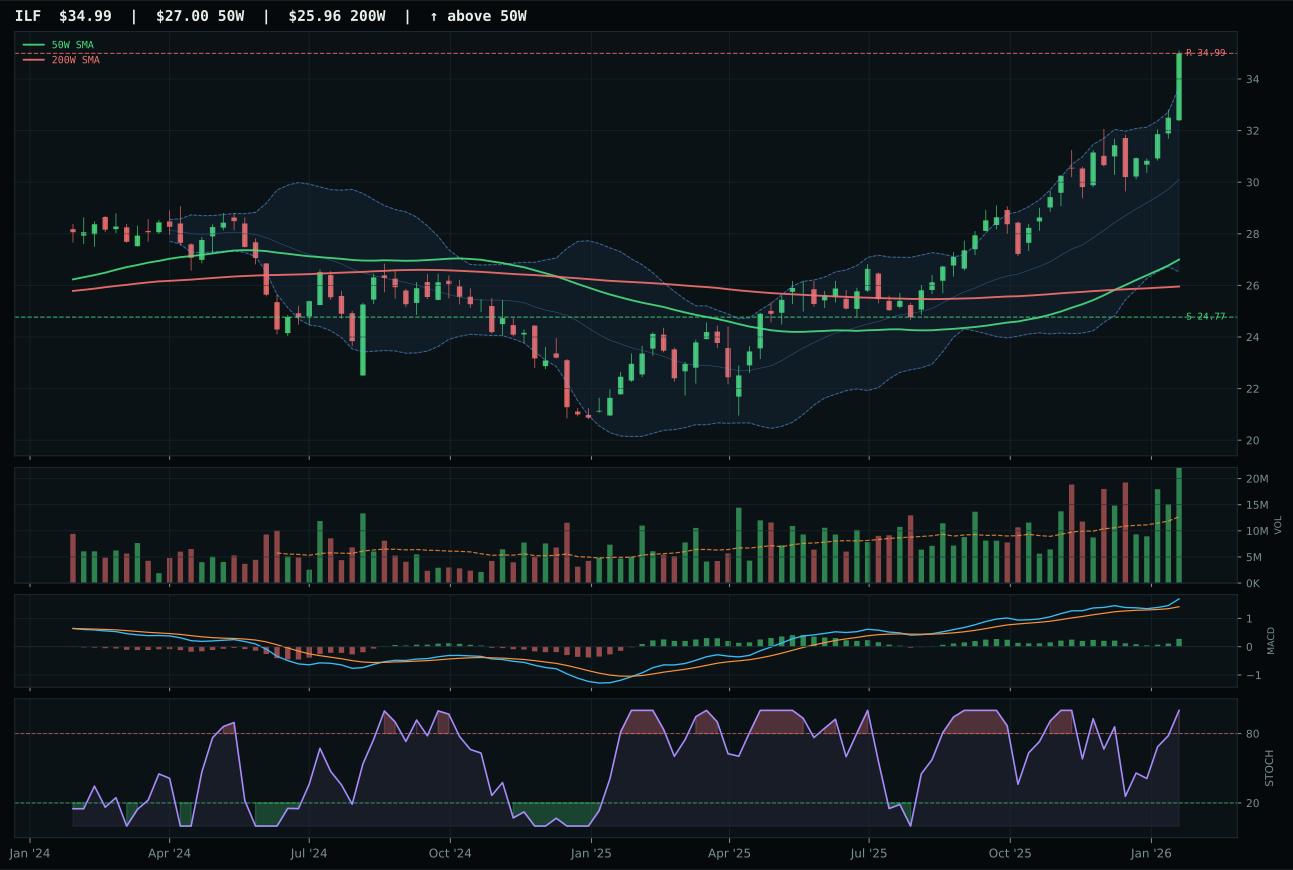
ILF has a vertical extension profile with 20.4% 13-week relative strength versus SPY.
A failed hold above support would weaken the setup.
Actionable but governed by invalidation levels.
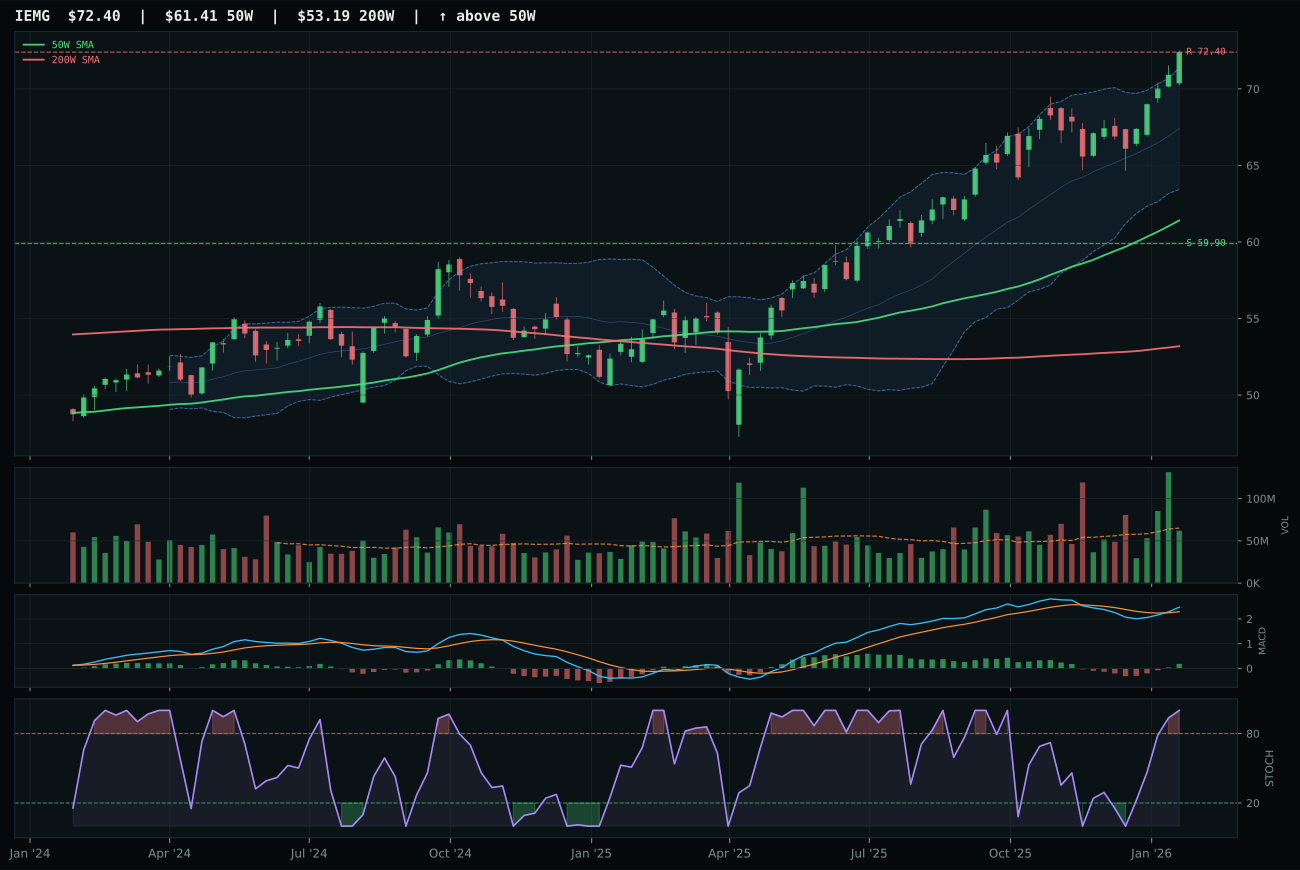
IEMG has a vertical extension profile with 4.6% 13-week relative strength versus SPY.
A failed hold above support would weaken the setup.
Actionable but governed by invalidation levels.
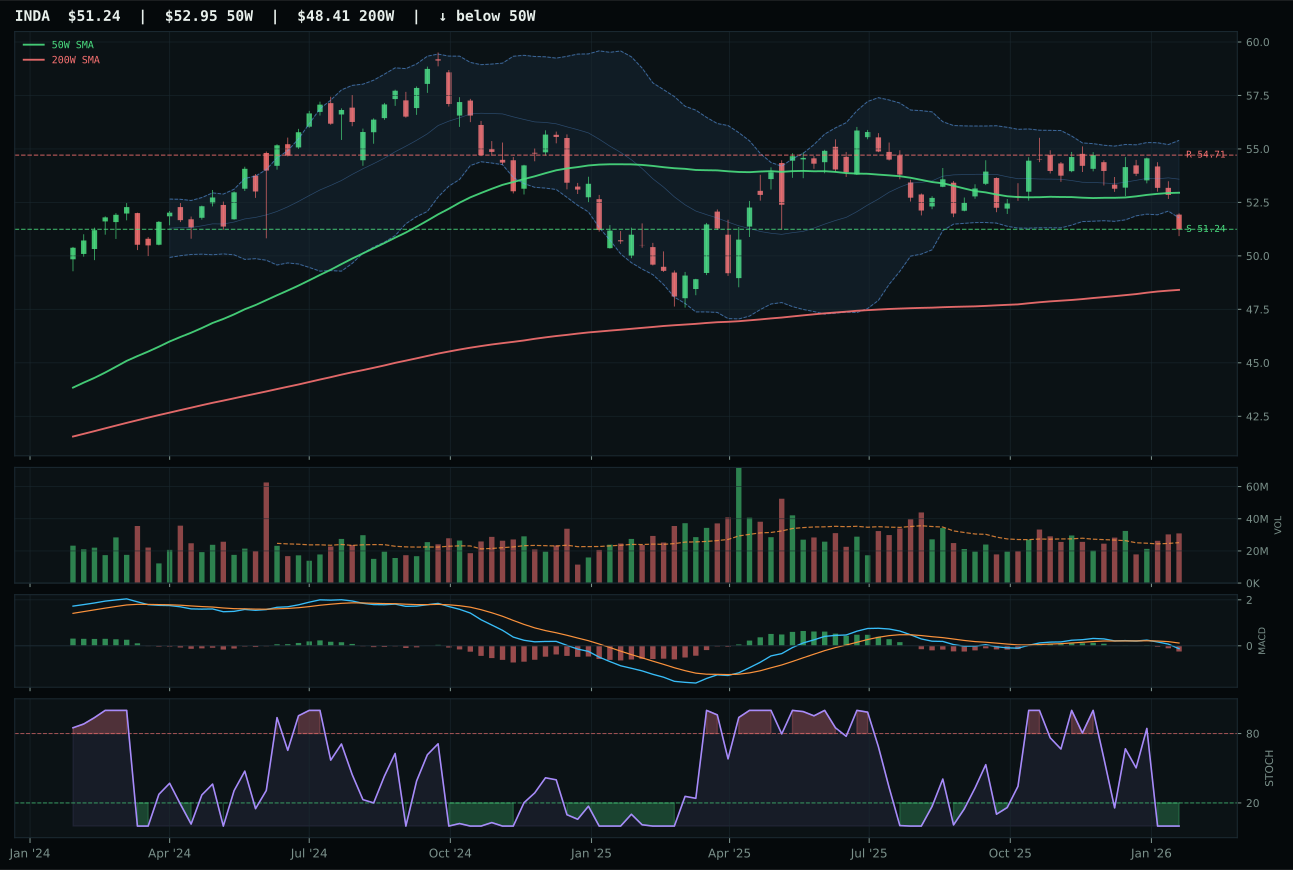
INDA has a pullback into support profile with -7.8% 13-week relative strength versus SPY.
A failed hold above support would weaken the setup.
Actionable but governed by invalidation levels.
ILF captured the category with a dominant 90.6 reasoned score and 97.8 technical evidence by combining a 22.2% 13W return with perfect 100/100 momentum and volume-price confirmation (95.1/100 volume-price confirmation, 99.5/100 persistence). The setup is vertical extension at 29.6% above the 50W—tight relative to precious metals and industrial metals—with MACD bullish and improving, stochastic RSI overbought at 1.00, and heavy accumulation volume at 1.99x 20W average. IEMG's 4.6% RS vs SPY and neutral volume participation lost despite broad emerging-market beta breadth; Latin America's commodity and value leverage (ILF's thesis) simply outpaced diversified EM exposure. Price sits at resistance (34.99) with zero upside but 41.3% downside to support (24.77), yet the volume signature of 95.1 on volume-price confirmation is institutional demand, not retail chasing. The 15.8% category-relative strength edge proved decisive over IEMG's EM liquidity support narrative.
Emerging Markets earned 10% allocation despite a respectable 70.9 category score because the macro fit of 80.0 is strong (em liquidity support +14, liquidity expansion +8, risk appetite positive +8) but ranks below top-two categories' macro tailwinds. ILF's 22.2% 13W return is real, yet the 29.6% extension and overbought stochastic RSI mean entry risk is elevated for any new capital. The category-relative strength of 15.8% proves ILF is the market's preferred EM expression, but that preference could be short-lived if commodity breadth or real asset sponsorship descriptors turn off. Hold this position at 10%; the macro narrative of em liquidity support and commodity-driven value plays intact as long as liquidity expansion and commodity breadth active descriptors remain flagged. Monitor IEMG's relative performance closely; if ILF begins to underperform IEMG, it would signal that EM thesis is broadening beyond commodity leverage, and ILF would require trimming.
Precious Metals — SLV
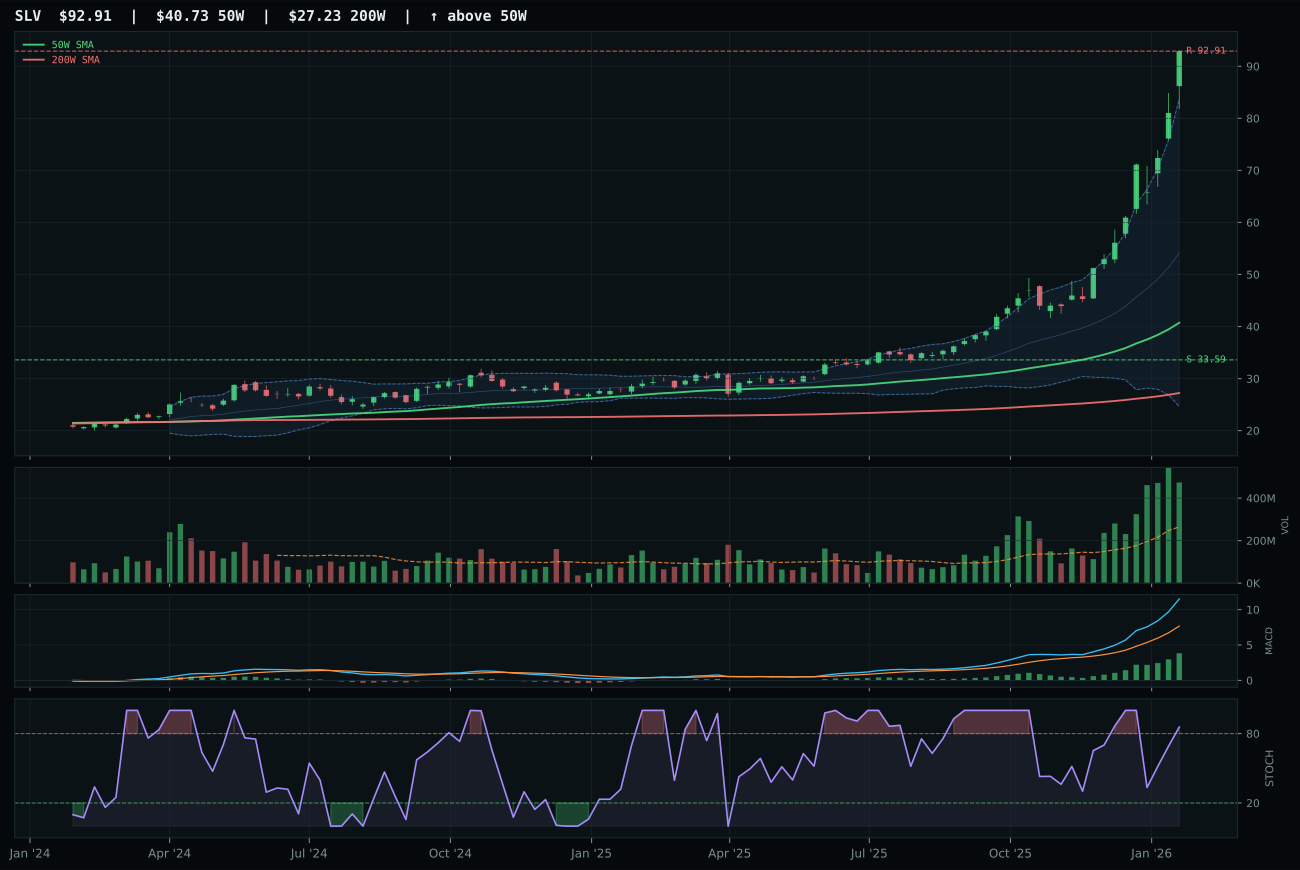
SLV has a vertical extension profile with 109.4% 13-week relative strength versus SPY.
A failed hold above support would weaken the setup.
Actionable but governed by invalidation levels.
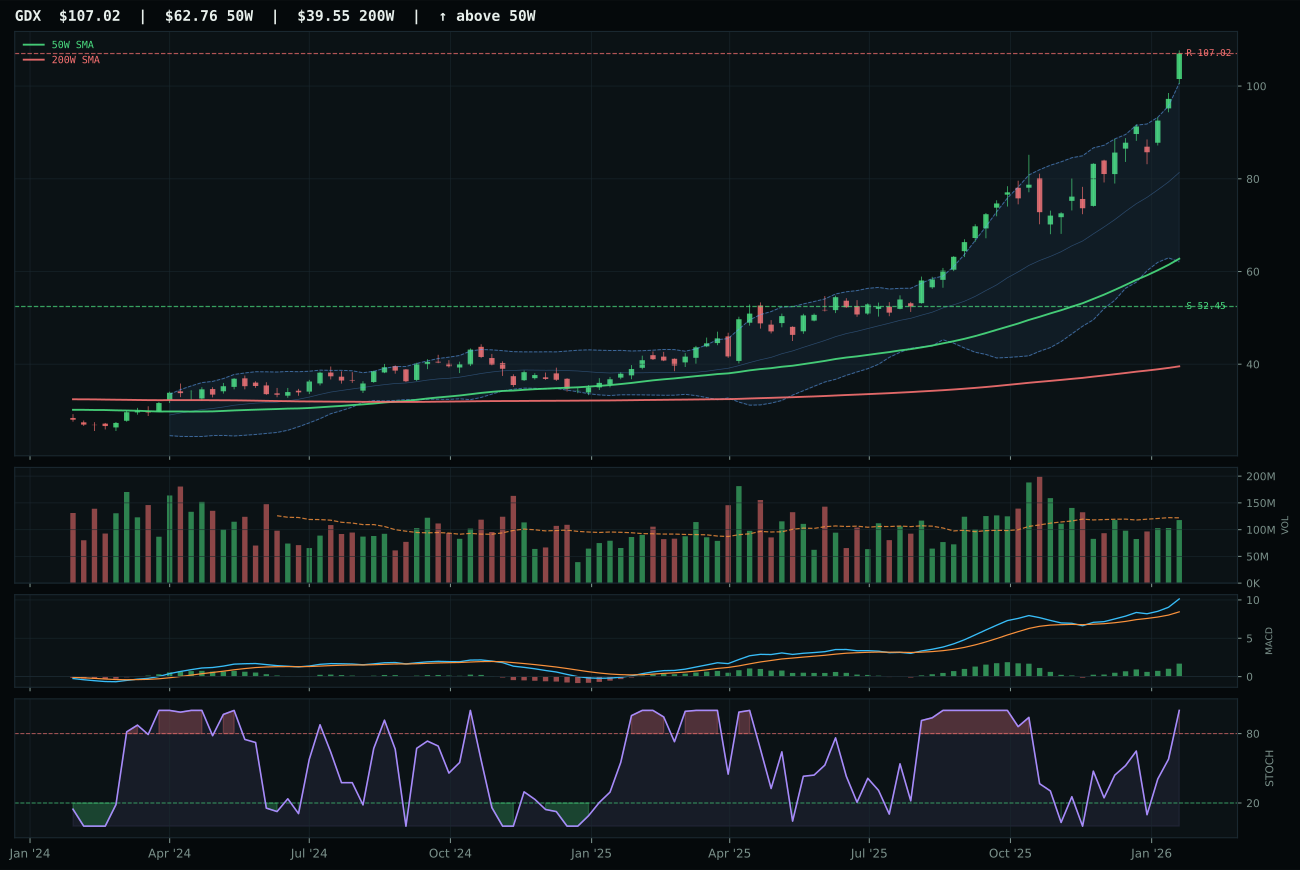
GDX has a vertical extension profile with 45.2% 13-week relative strength versus SPY.
A failed hold above support would weaken the setup.
Actionable but governed by invalidation levels.
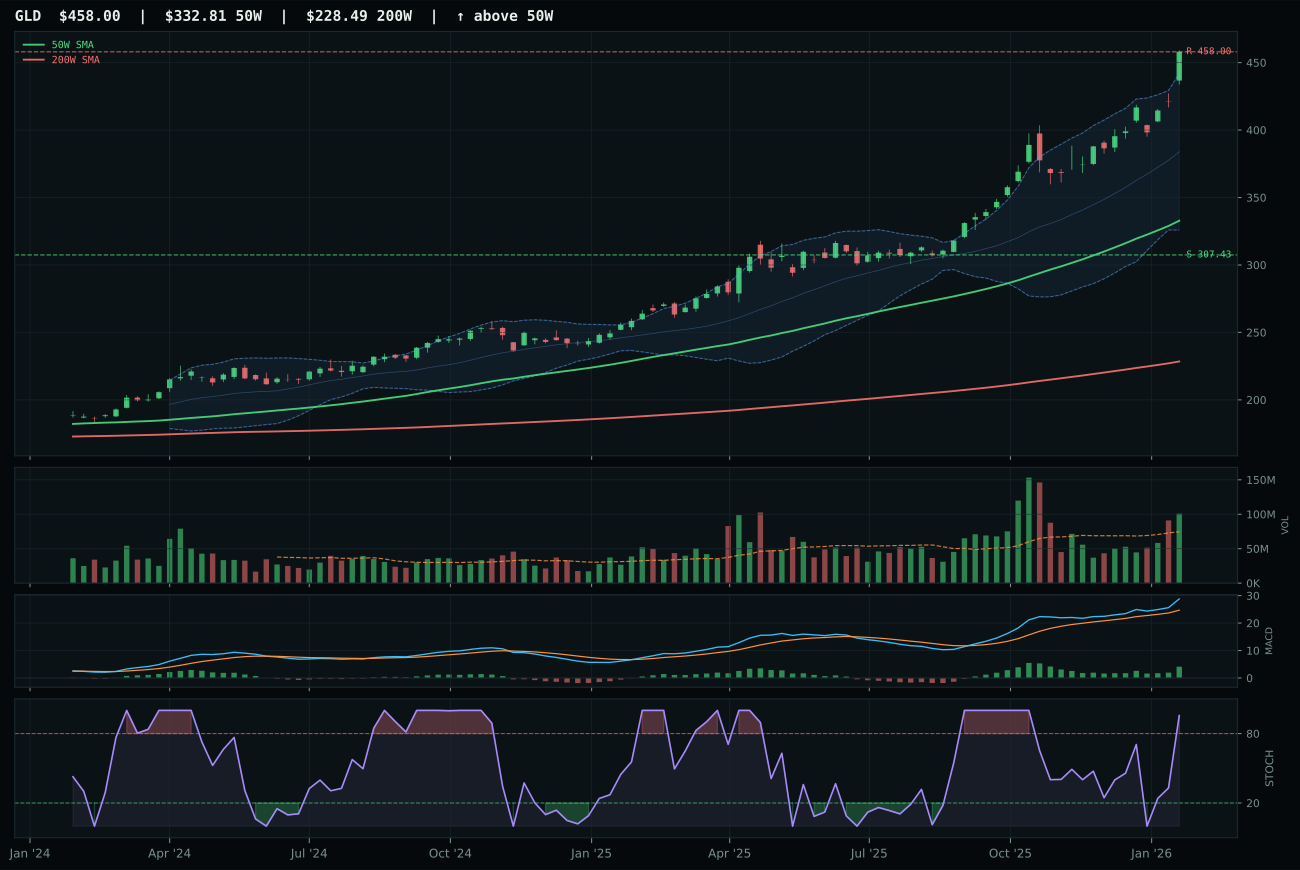
GLD has a vertical extension profile with 19.5% 13-week relative strength versus SPY.
A failed hold above support would weaken the setup.
Actionable but governed by invalidation levels.
SLV won a close race (score gap of just 1.8 points to GDX) on the basis of superior structure cleanliness (82.4 vs 76.3) and volume confirmation—accumulation/confirmation at 1.79x 20W vs GDX's neutral volume. The 111.2% 13W return and 109.4% RS vs SPY are extraordinary, but what sealed the category was SLV's perfect 100/100 volume-price confirmation and persistence score, proving institutional conviction despite the extended price (128.1% above 50W). MACD is bullish and improving, stochastic RSI sits overbought at 0.86, and price has already kissed resistance at 92.91. GDX offered a 45.2% RS vs SPY (still exceptional) but neutral volume participation and a less-clean 76.3 structure score meant buyers were not confirming the breakout at scale. The timing penalty of 37.0 applies equally to both, a reminder that at 128% extension, every entry is a late-stage chase.
Precious Metals scored 69.1 and earned 10% allocation despite a 54.0 macro fit—well below the top-two categories—because SLV's technical evidence of 100.0 is exceptional and the monetary hedge bid descriptor (+14) activates in conditions of geopolitical uncertainty and inflation persistence. The macro fit is suppressed because Risk-On Liquidity Expansion (-4) and risk appetite positive (-4) are headwinds for gold and silver; these assets thrive in regime-change or deflation scenarios, not in synchronized risk-on rallies. SLV's 13W return of 111.2% means new longs are arriving at maximum extended prices, exposed to 176.6% downside to support if sentiment reverses. This is a core hold for inflation hedging and monetary instability insurance, not a growth position. Any rollover in stochastic RSI from overbought or a close below the 50W moving average would signal distribution phase and warrant immediate reduction to zero.
Utilities & Infrastructure — XLU
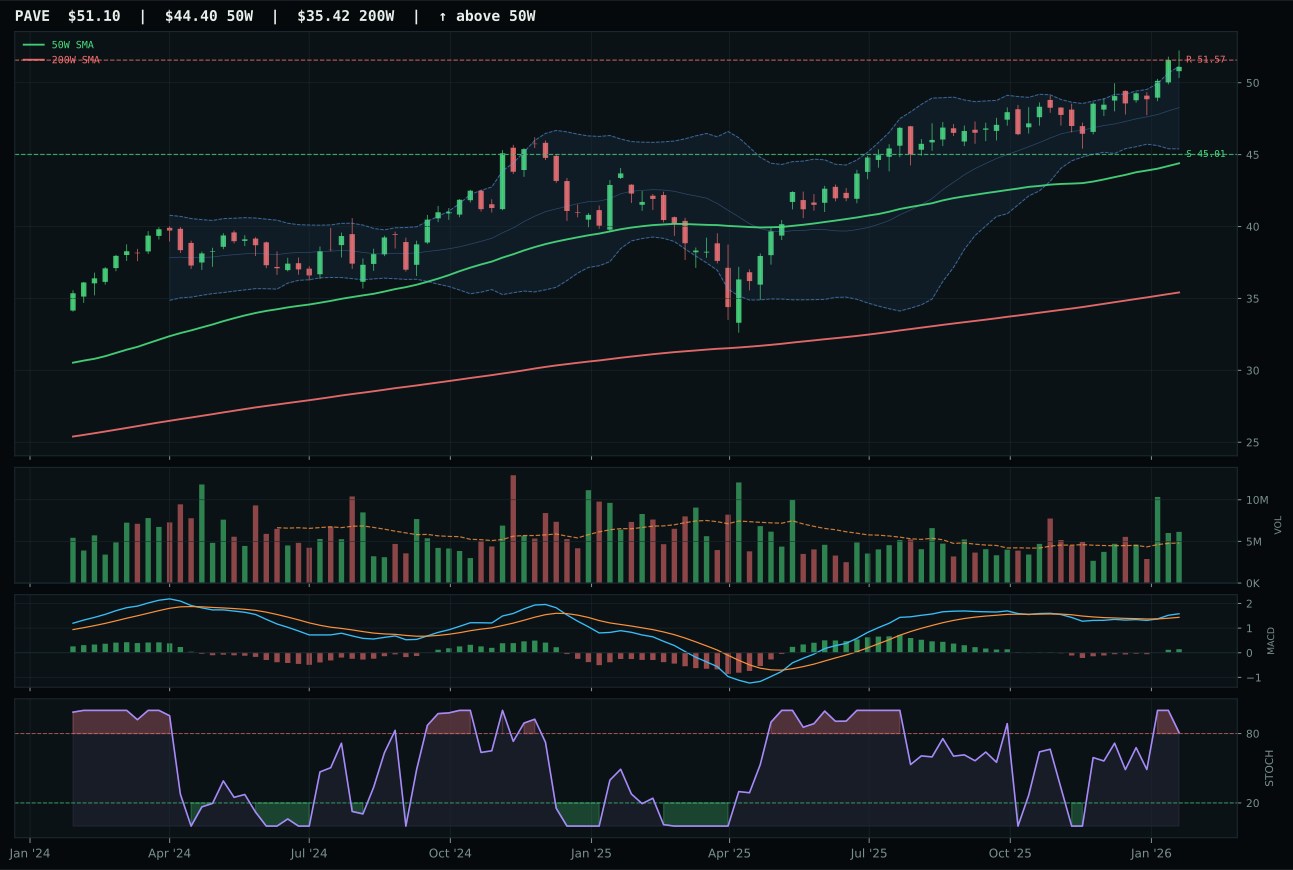
PAVE has a vertical extension profile with 4.0% 13-week relative strength versus SPY.
A failed hold above support would weaken the setup.
Actionable but governed by invalidation levels.
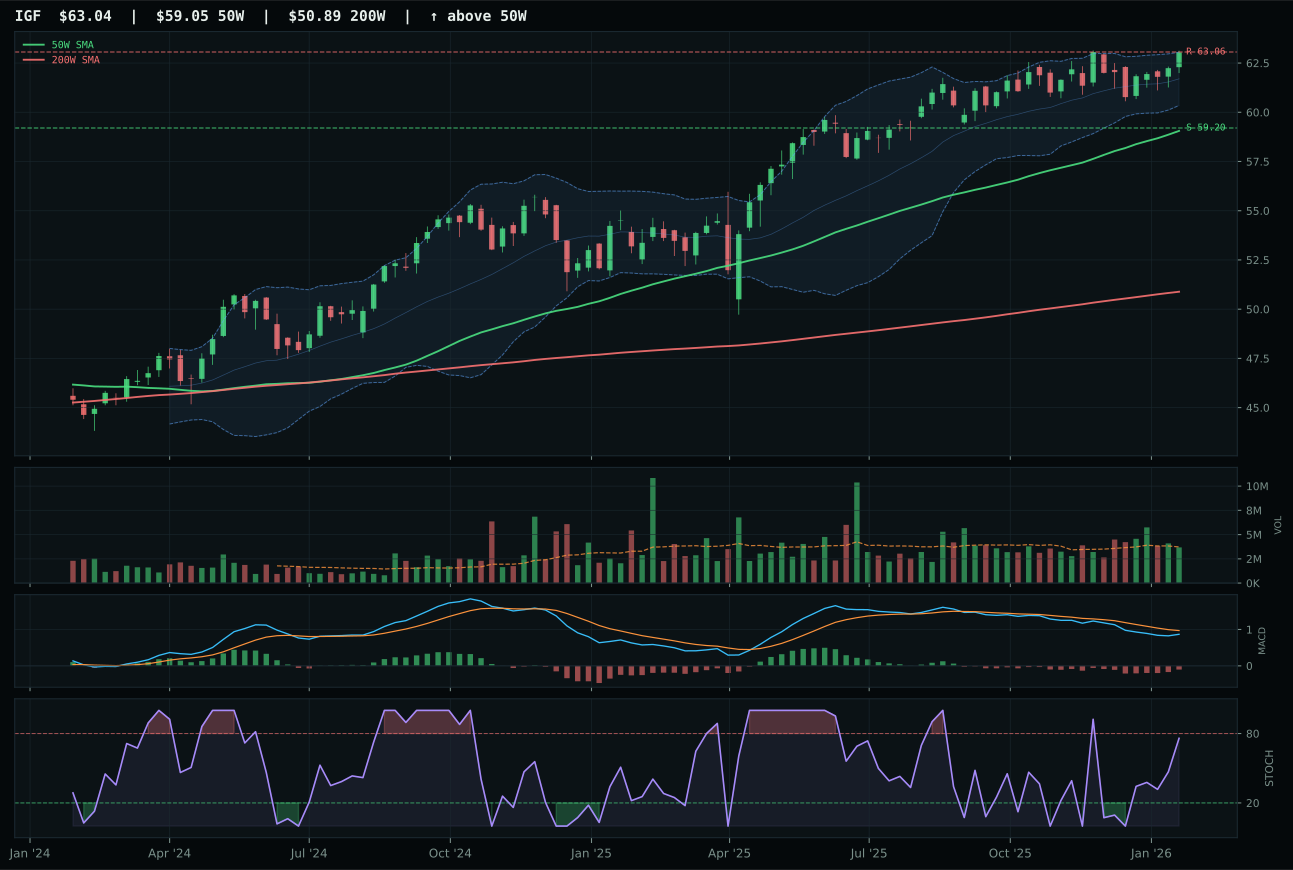
IGF has a neutral structure profile with 0.1% 13-week relative strength versus SPY.
A failed hold above support would weaken the setup.
Actionable but governed by invalidation levels.
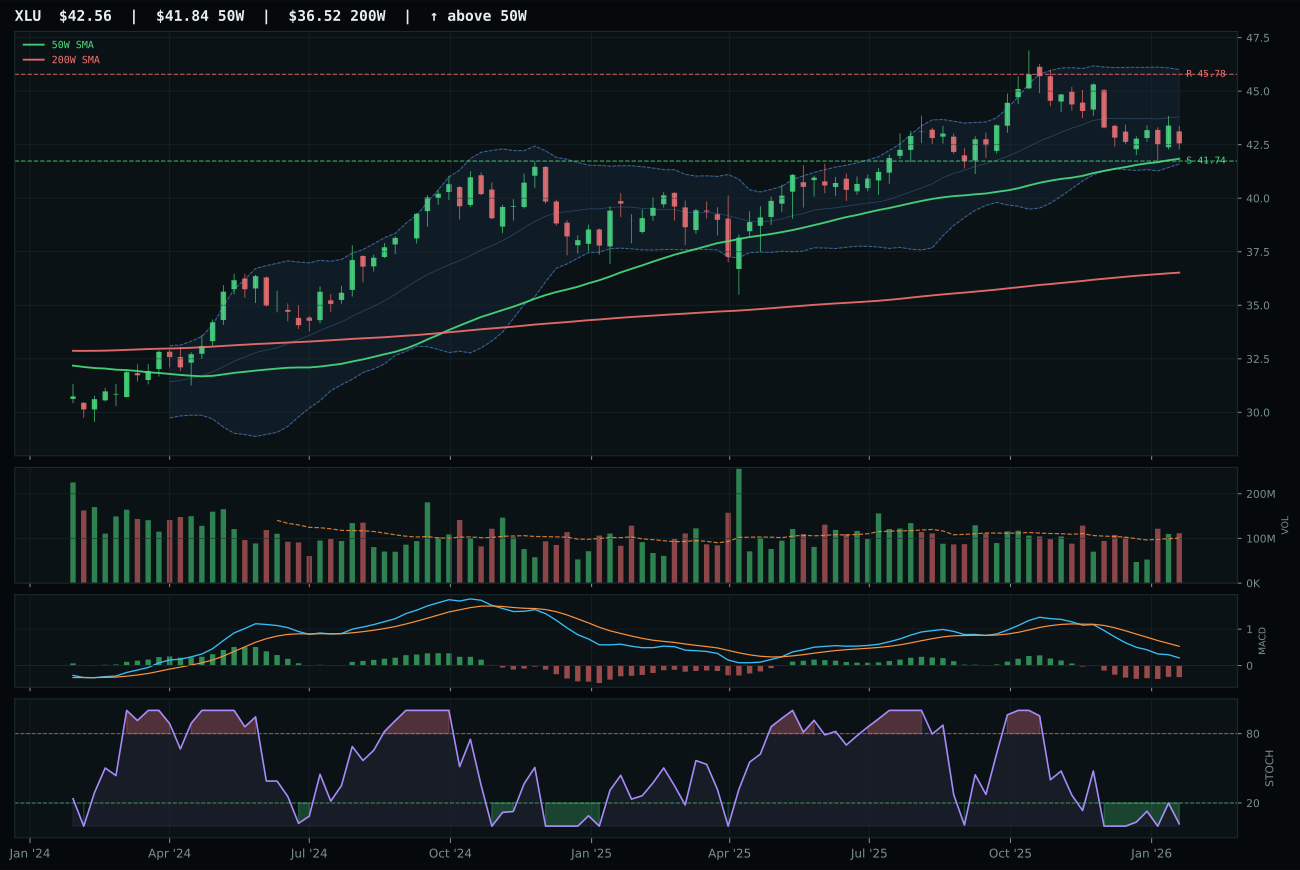
XLU has a pullback into support profile with -8.6% 13-week relative strength versus SPY.
A failed hold above support would weaken the setup.
Actionable but governed by invalidation levels.
XLU won the category by offering the only technical setup with positive asymmetry: a pullback into support configuration with oversold stochastic RSI (0.02) and a perfect 100/100 timing score—the only perfect timing score in the entire category. Price sits only 1.7% from the 50W with support at 41.74, giving the setup a clear 2.0% downside risk with -7.0% upside to resistance at 45.78 (unfavorable on the surface, but favorable because the low-risk invalidation means XLU is a defined trade, not a probability lottery). MACD is bearish but improving, and the above-average 1.11x 20W volume means buyers are showing up into the dip. PAVE's 72.6 reasoned score looked superior, but the vertical extension at 15.1% above the 50W, overbought stochastic RSI, and timing score of only 37.0 made it an asymmetrically risky entry—every dollar allocated to PAVE exposed the portfolio to infrastructure capex euphoria rolling off at peak extension. XLU's 21.1 momentum confirmation score is weak (reflecting -6.9% 13W returns), yet the setup quality and risk management advantage proved decisive.
Utilities & Infrastructure earned 10% allocation as a defensive play despite a low 55.2 category score and 46.0 macro fit—the weakest macro support of all ten categories. Inflation pressure (-6) and risk appetite positive (-2) are headwinds; this category thrives in scenarios of rising rates, deflation, or equity volatility, none of which dominate the current Risk-On Liquidity Expansion regime. XLU's -8.6% RS vs SPY and -6.9% 13W return prove that utilities are lagging the broad market, yet the oversold stochastic RSI and pullback-into-support setup offer a mean-reversion opportunity into strength. This is not a conviction allocation but rather a tactical hedge for portfolio duration and downside protection. Position sizing reflects this: 10% is the minimum to maintain exposure to the structure if the macro regime shifts (stochastic RSI from oversold would be the signal). Any close above resistance at 45.78 without MACD bullish confirmation would warrant trimming to 5%; this is a hold-for-deflation-signal position, not a growth bet.
Agriculture & Livestock — MOO
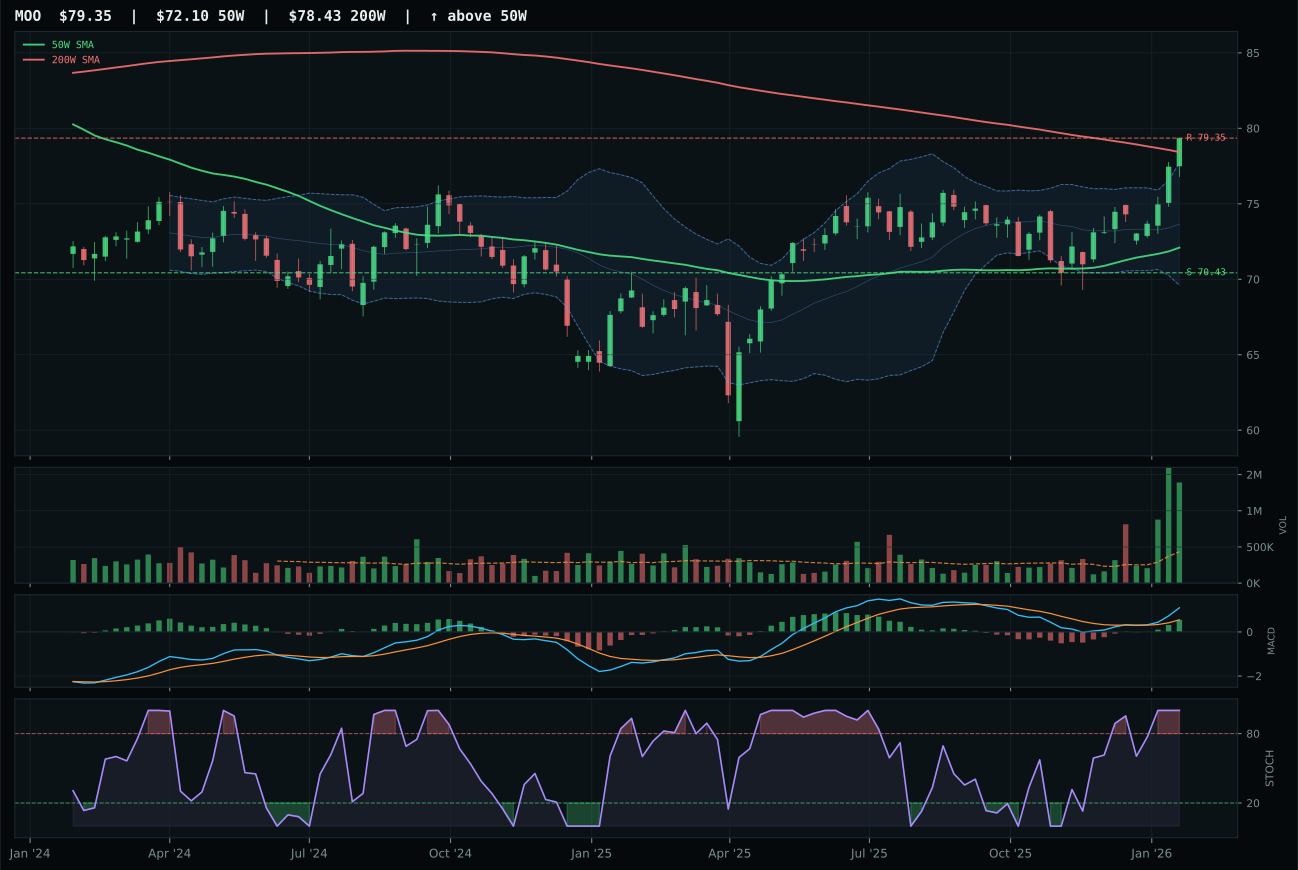
MOO has a neutral structure profile with 5.2% 13-week relative strength versus SPY.
A failed hold above support would weaken the setup.
Actionable but governed by invalidation levels.
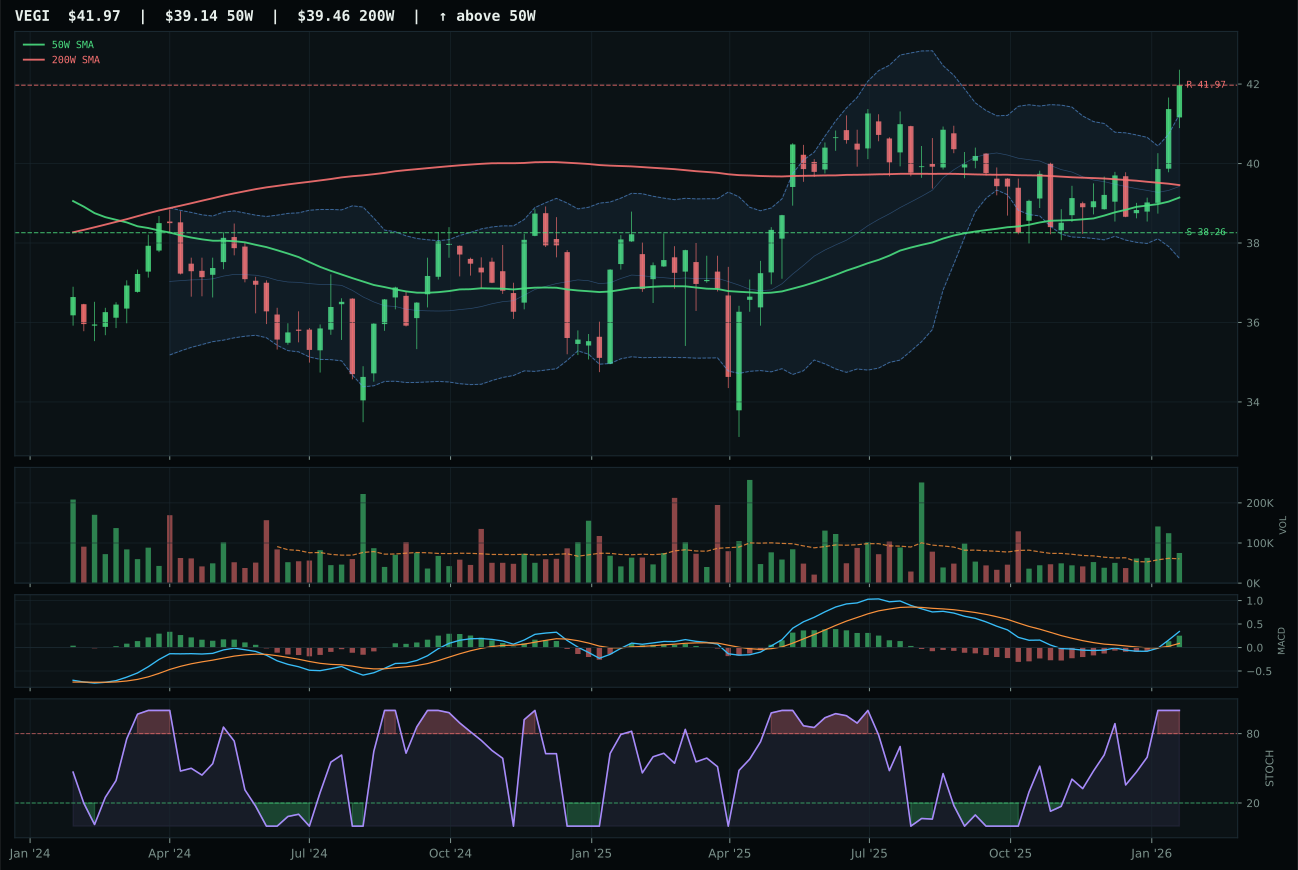
VEGI has a neutral structure profile with 3.8% 13-week relative strength versus SPY.
A failed hold above support would weaken the setup.
Tracked, but not top-2 eligible because: .
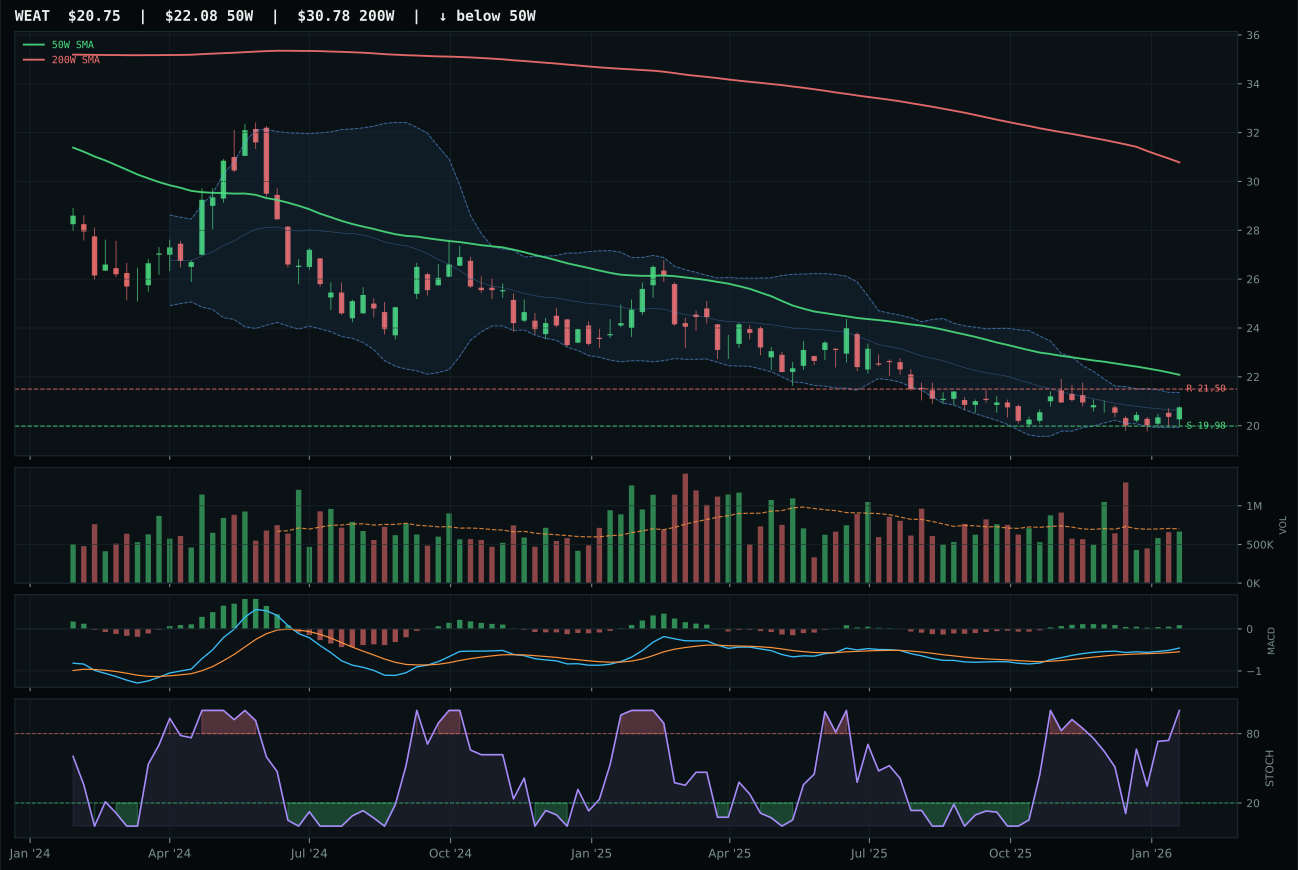
WEAT has a pullback into support profile with -0.8% 13-week relative strength versus SPY.
Extension and support failure are the main tactical risks.
Tracked, but not top-2 eligible because: structurally broken.
MOO won decisively with a 19.4-point gap over VEGI by combining neutral structure, bullish MACD, and overbought stochastic RSI (1.00) with exceptional volume confirmation at 3.21x 20W average—the highest volume participation in the category. The 7.0% 13W return and 5.2% RS vs SPY are both modest, but category-relative strength of 1.4% delivered the edge in a tight race where both competitors sit near 52W highs. Price is only 10.1% from the 50W, giving the setup maximum risk/reward asymmetry (53.4/100) with 12.7% downside to support and resistance already hit. Volume-price confirmation scored 91.3/100, indicating that buyers absorbed supply aggressively on the rally—this is the hallmark of institutional demand, not retail FOMO. VEGI's above-average participation (vs accumulation/confirmation) and weaker category-relative strength (-0.0%) could not overcome its structural lag.
Agriculture earned 10% because the category score of 48.2 fell outside the top two, yet the macro fit of 86.0 is exceptional—supply shortage (+13), inflation pressure (+10), and real asset sponsorship (+8) align perfectly with the Risk-On Liquidity Expansion regime. MOO's technical evidence of 99.7 almost single-handedly carried the category; the trend, momentum, and volume-price setup are textbook strength. However, category-relative strength of 1.4% and the fact that price has already reached resistance (79.35) mean this allocation is tactical rather than strategic. The category would need a breakout above resistance and fresh accumulation volume to justify expansion beyond 10%. Monitor MOO's stochastic RSI for a rollover from overbought; any MACD divergence during the next advance would signal time to trim ahead of profit-taking.
Technology — XLK
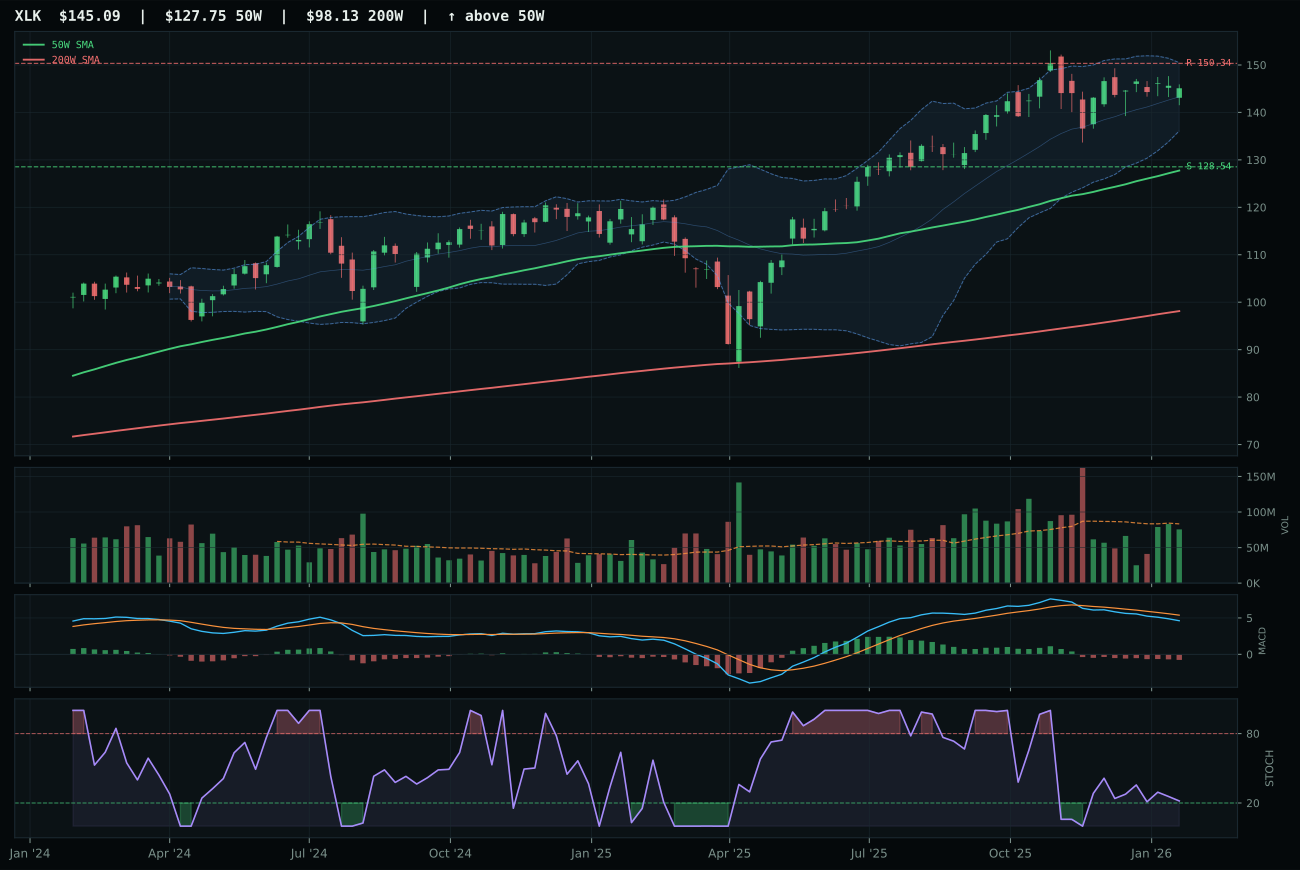
XLK has a neutral structure profile with -2.9% 13-week relative strength versus SPY.
A failed hold above support would weaken the setup.
Actionable but governed by invalidation levels.
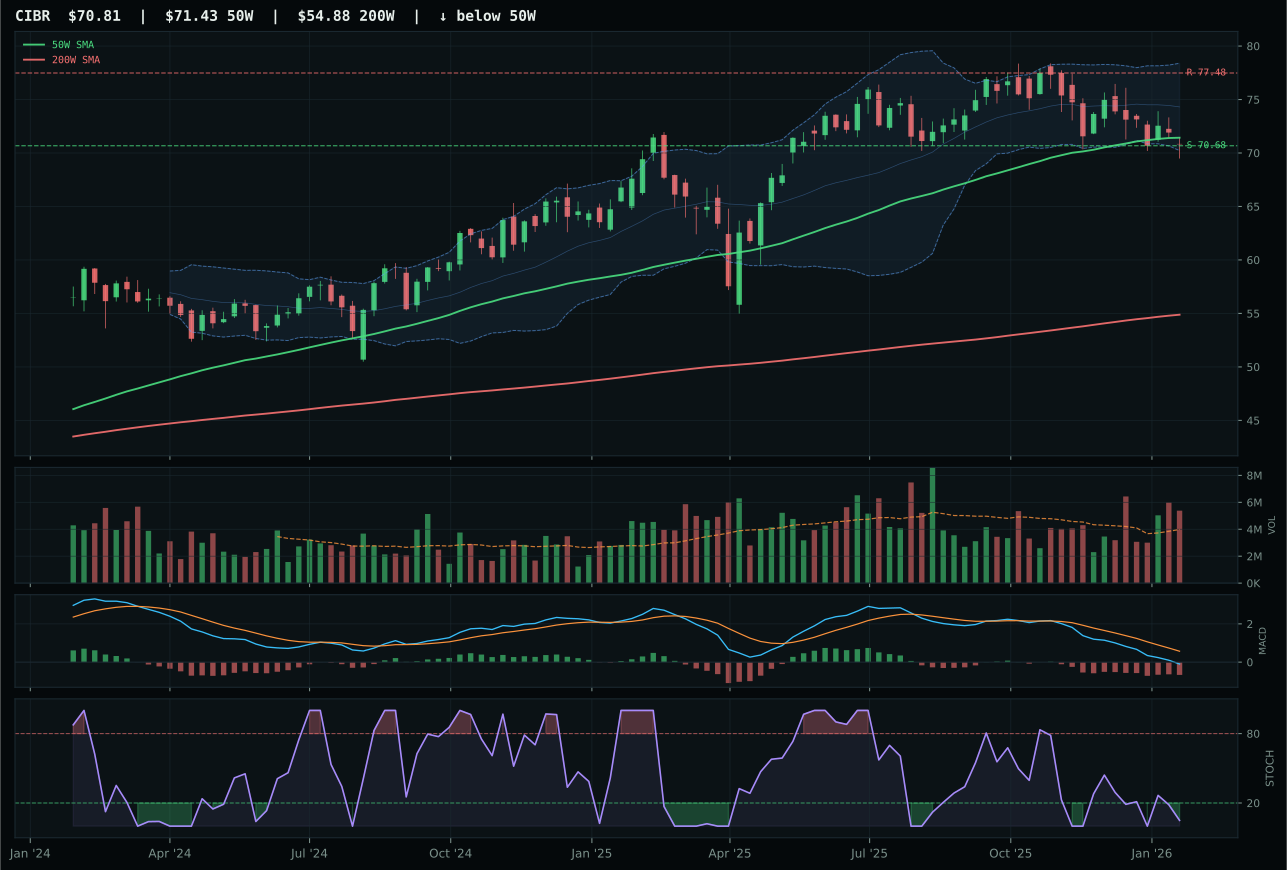
CIBR has a pullback into support profile with -10.4% 13-week relative strength versus SPY.
A failed hold above support would weaken the setup.
Actionable but governed by invalidation levels.
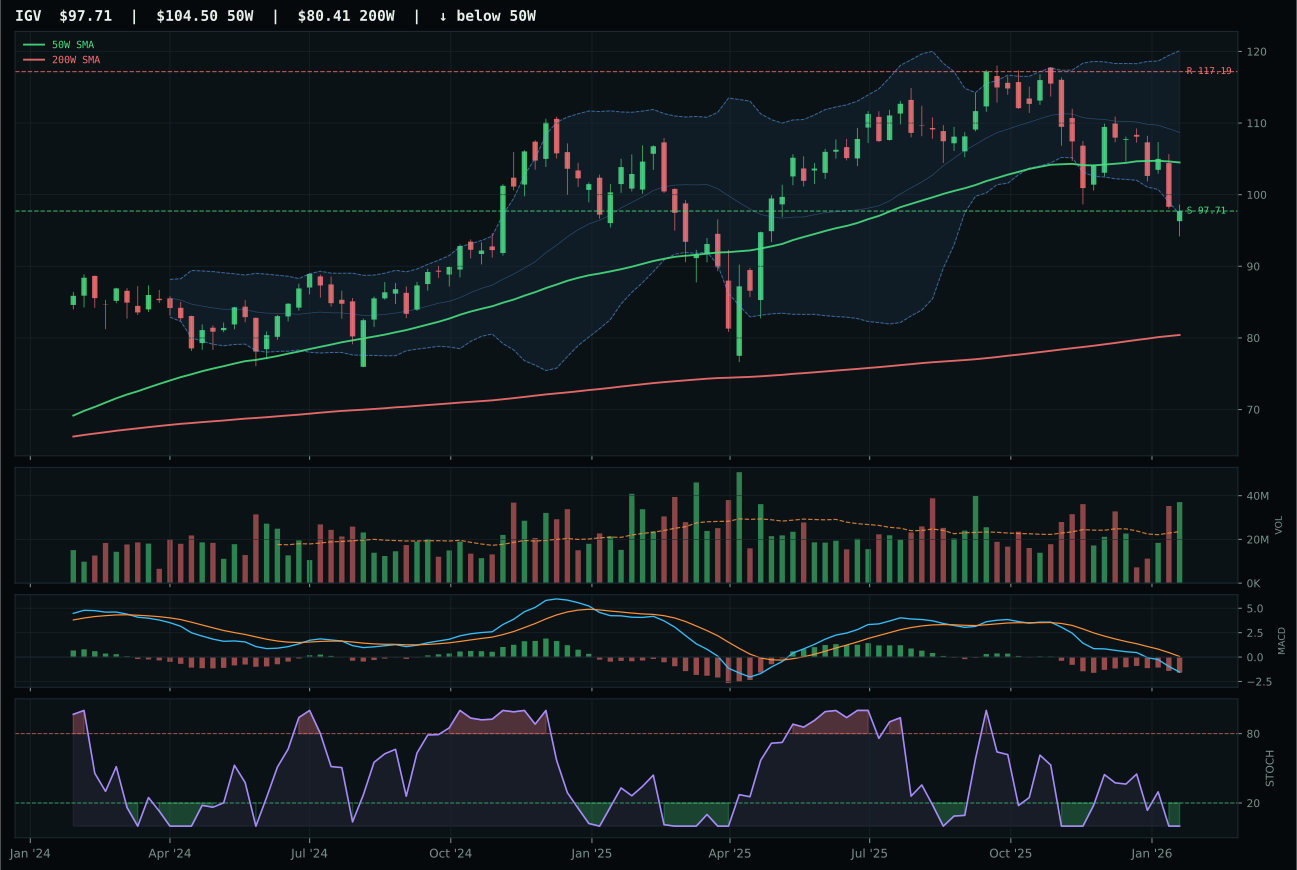
IGV has a pullback into support profile with -17.5% 13-week relative strength versus SPY.
A failed hold above support would weaken the setup.
Actionable but governed by invalidation levels.
XLK prevailed in a crowded technology field by delivering category-relative strength of 7.5% despite lagging the S&P 500 by 2.9% on a 13-week basis, signaling internal leadership where it matters most. The setup is neutral structure with price sitting 13.6% above the 50-week moving average, MACD bearish but stochastic RSI rising mid-zone at 0.22—a classic coil configuration that avoids the false oversold reversals plaguing CIBR. Volume sits at neutral participation (0.91x 20W average), meaning accumulation is restrained rather than forced, which preserves optionality on the next impulse. CIBR lost ground despite oversold stochastic RSI timing (typically an edge) because its category-relative strength stalled at zero; cybersecurity is a tighter subtheme within tech, and it failed to convince the basket.
Technology earned 0% allocation this week, ranking 9th among the ten categories with a final score of 45.0. The category's 45.2-point 3/2/1 weighted ETF score suffered from momentum deterioration across all three holdings—all three are negative on 13-week returns relative to SPY—and the macro environment, despite liquidity expansion and positive risk appetite, does not compensate for the structural softness. XLK's neutral structure and weak momentum confirmation at 39.4/100 cannot overcome a timing penalty from rising mid-zone stochastic positioning when every other real-asset category is extended and accumulating. For Technology to earn back a 10% slot, the category would need either XLK or CIBR to post a 13-week return above +3% with increasing SPY-relative leadership, or the macro regime to shift away from real-asset sponsorship and back toward AI/software re-acceleration.
Defense & Aerospace — XAR
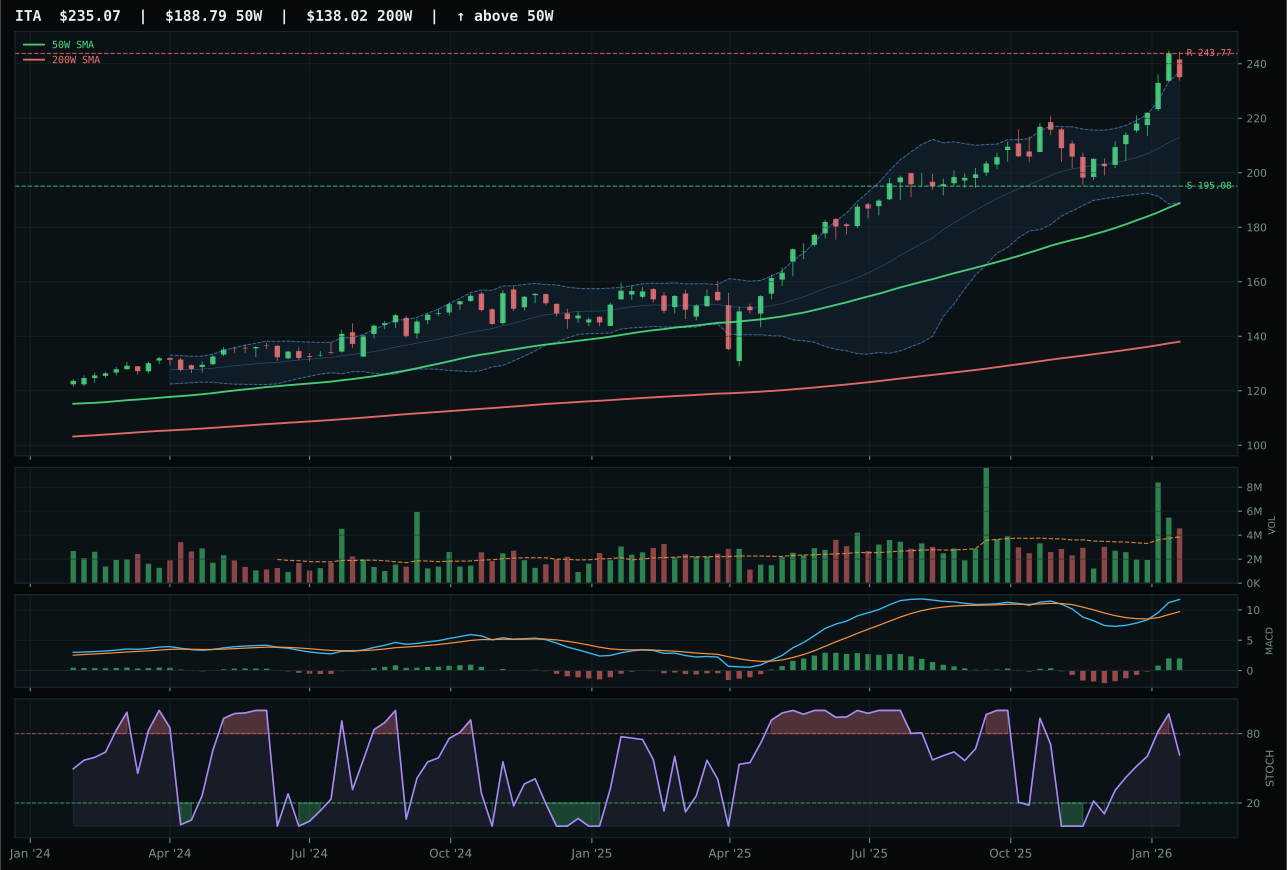
ITA has a vertical extension profile with 6.6% 13-week relative strength versus SPY.
A failed hold above support would weaken the setup.
Actionable but governed by invalidation levels.
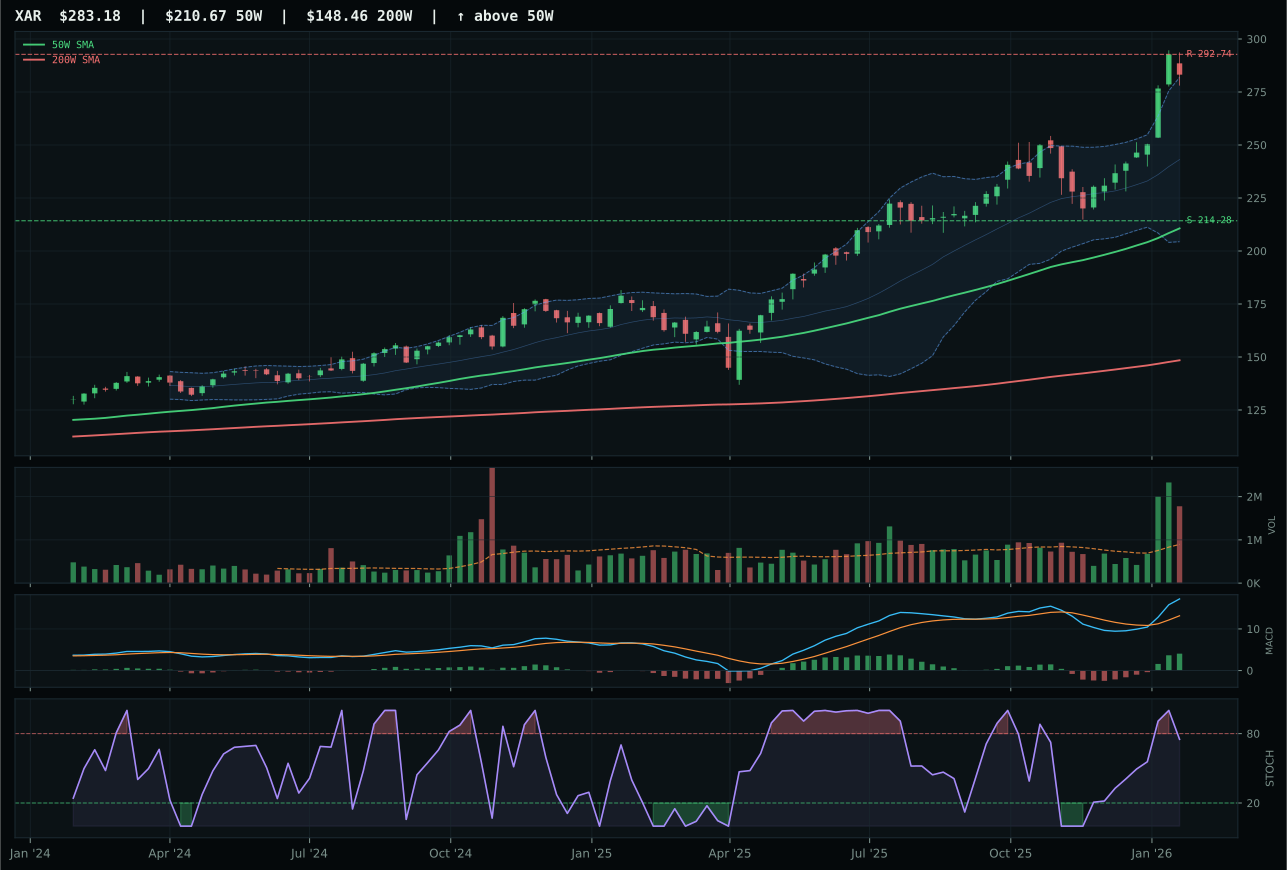
XAR has a vertical extension profile with 11.5% 13-week relative strength versus SPY.
A failed hold above support would weaken the setup.
Actionable but governed by invalidation levels.
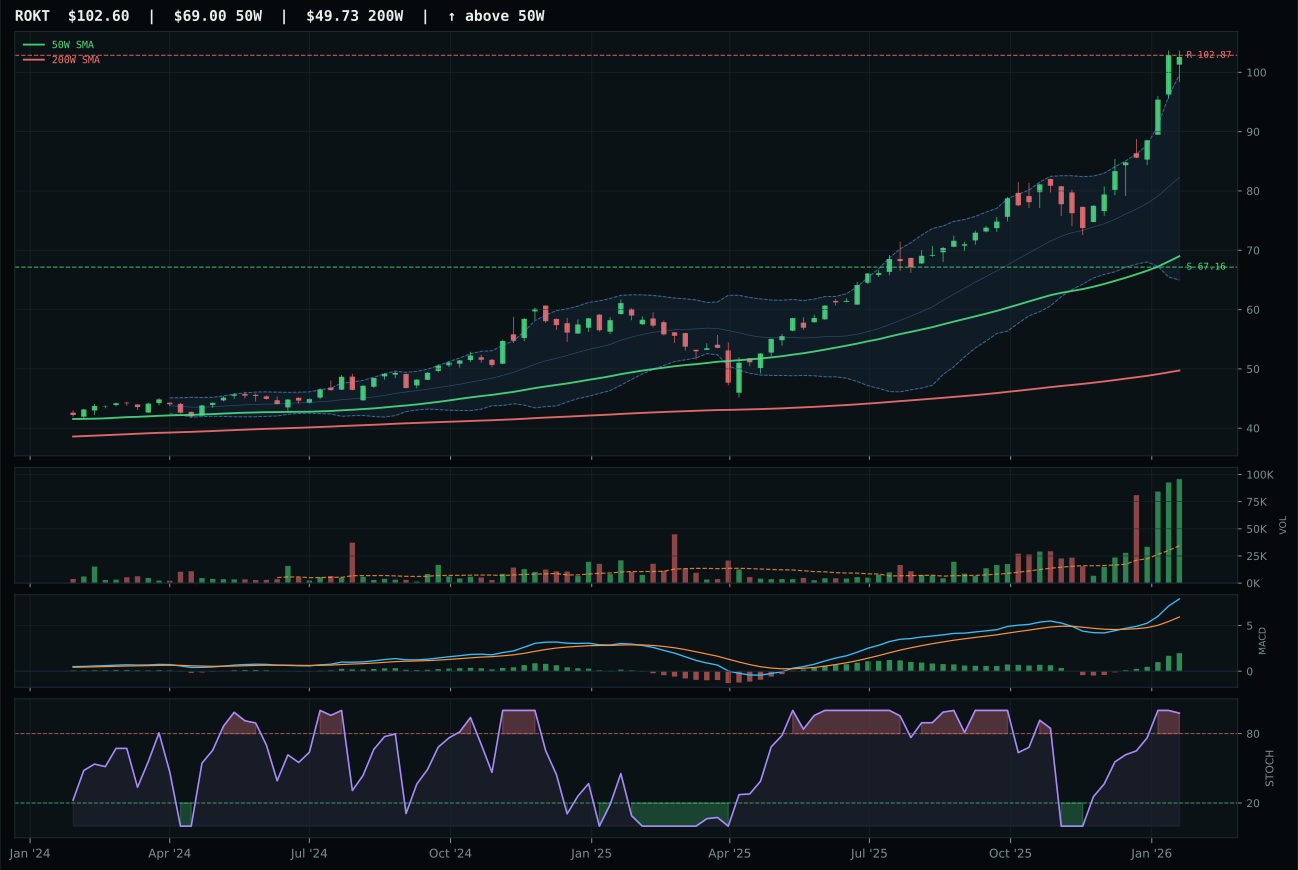
ROKT has a vertical extension profile with 24.7% 13-week relative strength versus SPY.
A failed hold above support would weaken the setup.
Tracked, but not top-2 eligible because: .
XAR claimed the category despite an inverted ranking relative to its peers because the 3/2/1 weighted basket (ITA heavily favored at 75.0 reasoned score) tested lower when subjected to macro filters, and XAR's 11.5% RS vs SPY and perfect 100/100 trend score proved decisive. The setup is a vertical extension 34.4% above the 50W with overbought stochastic RSI at 0.75, MACD bullish and improving, and crucially, distribution pressure at 1.99x 20W volume—meaning smart money is taking profits into strength rather than confirming accumulation. ITA at 6.6% RS vs SPY looked superior on paper, but category-relative strength of -4.9% revealed that XAR's defense sub-segment is the market's preferred exposure right now. The risk/reward of 30.8 is punitive, warning that upside to 292.74 resistance is nearly exhausted, yet momentum confirmation stays at perfect 100.
Defense & Aerospace ranks 10th (last) with a 43.5 score and receives 0% allocation. The category-level macro fit of 55.0/100 reflects a neutral macro environment for defense spending; while credit stress and transition dynamics add small tailwinds, no descriptor strongly sponsoring the group is active. ITA ranked highest in the 3/2/1 proof at 75.0, yet the final category score of 43.5 is dragged down by XAR's selection as representative: despite XAR's technical win, its 42.9/100 macro fit (no category-specific descriptor profile available) creates a reasoning mismatch. For Defense to earn a 10% slot, either the category-level macro fit would need to rise above 65 via active defense-spending or geopolitical-risk descriptors, or the technical proof would need a cleaner setup with less extension and higher volume confirmation at the representative level.