
2026-01-16
Informational purposes only. The content in this report, including allocations, analysis, and commentary, is provided solely for informational and educational purposes. It does not constitute financial advice, investment advice, trading advice, or any other type of advice. Past performance does not guarantee future results. Always conduct your own research and consult a qualified financial professional before making investment decisions.
Weekly Allocation
| Ticker | Category | Weight | Role |
|---|---|---|---|
| REMX | Industrial Metals | 20% | Top-2 (20%) |
| SMH | AI | 20% | Top-2 (20%) |
| XLE | Traditional Energy | 10% | Tier-2 (10%) |
| SLV | Precious Metals | 10% | Tier-2 (10%) |
| IEMG | Emerging Markets | 10% | Tier-2 (10%) |
| XAR | Defense & Aerospace | 10% | Tier-2 (10%) |
| URNM | Nuclear Energy | 10% | Tier-2 (10%) |
| XLU | Utilities & Infrastructure | 10% | Tier-2 (10%) |
Trade Instructions — Monday Open
Sell the tranche from 2025-12-19 (completing its 4-week hold). Buy the new tranche. Instructions show net portfolio changes — same-asset positions cancel, weight changes show the delta.
| Action | Ticker | Instruction |
|---|---|---|
| SELL | COPX | Sell 33% of COPX position (reduce 15.00% → 10.00%) |
| SELL | SLV | Sell 17% of SLV position (reduce 15.00% → 12.50%) |
| SELL | IGV | Sell 50% of IGV position (reduce 5.00% → 2.50%) |
| SELL | PAVE | Sell 25% of PAVE position (reduce 10.00% → 7.50%) |
| SELL | URA | Sell 50% of URA position (reduce 5.00% → 2.50%) |
| BUY | SMH | Buy SMH — 16.67% of freed cash (adds 2.50% to portfolio) |
| BUY | URNM | Buy URNM — 16.67% of freed cash (adds 2.50% to portfolio) |
| BUY | REMX | Buy REMX — 33.33% of freed cash (adds 5.00% to portfolio) |
| BUY | XLE | Buy XLE — 16.67% of freed cash (adds 2.50% to portfolio) |
| BUY | XLU | Buy XLU — 16.67% of freed cash (adds 2.50% to portfolio) |
Current Portfolio After Trade
Combined holdings across all 4 active tranches. Each tranche is 25% of the portfolio.
| Ticker | % of Portfolio | Weight Bar |
|---|---|---|
| SLV | 12.50% | |
| SMH | 12.50% | |
| IEMG | 12.50% | |
| COPX | 10.00% | |
| REMX | 10.00% | |
| XAR | 7.50% | |
| PAVE | 7.50% | |
| URNM | 7.50% | |
| XLK | 5.00% | |
| IGV | 2.50% | |
| URA | 2.50% | |
| BOTZ | 2.50% | |
| ITA | 2.50% | |
| XLE | 2.50% | |
| XLU | 2.50% |
Macro Regime — Transition / Mixed
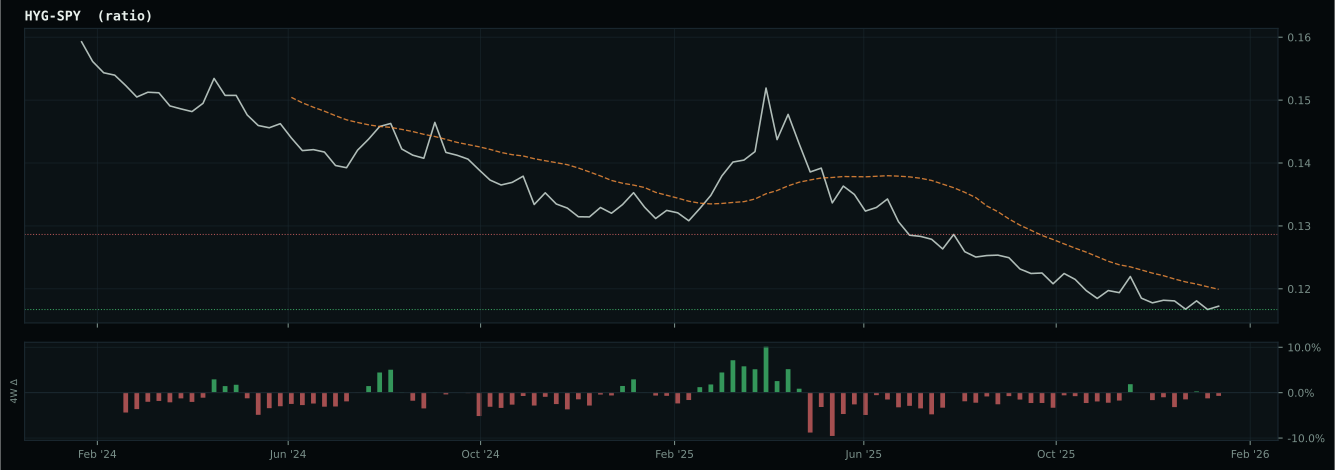
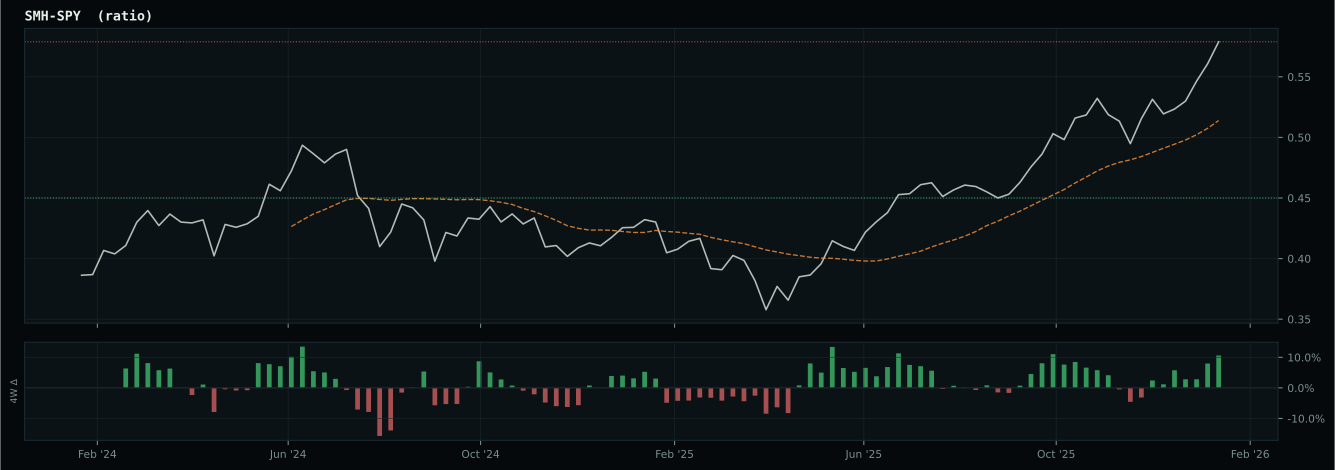
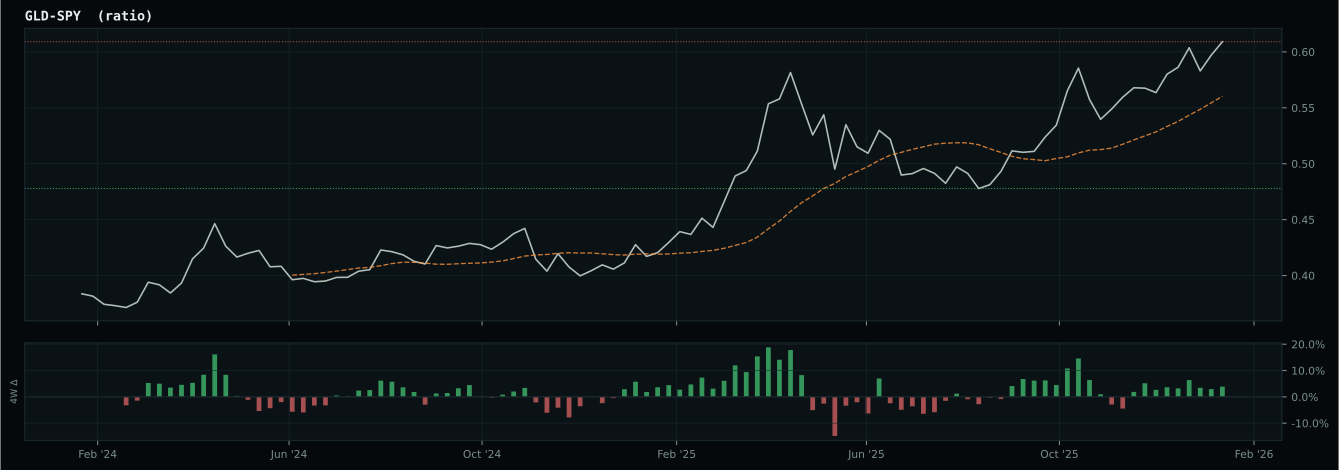
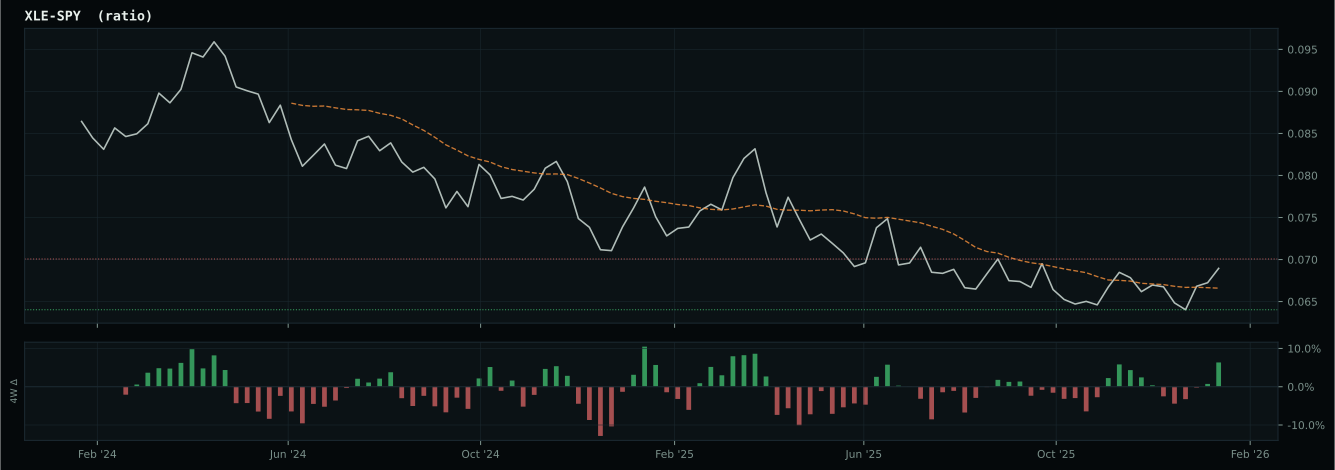
Macro Evidence Charts
Market-implied signals behind the macro regime scores. Each ratio compares two assets; the direction and slope of the ratio is what the macro engine reads.
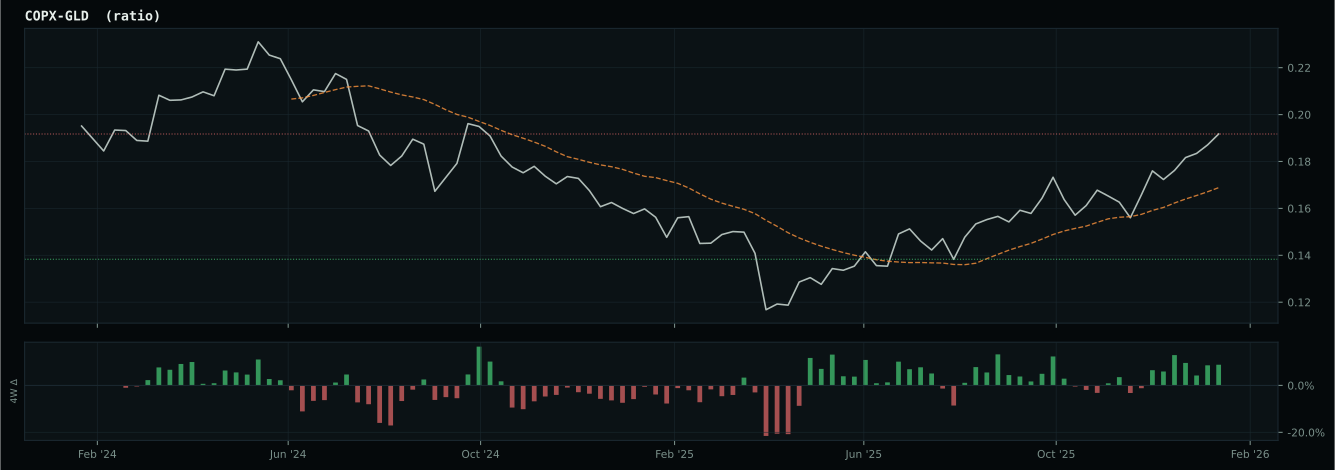
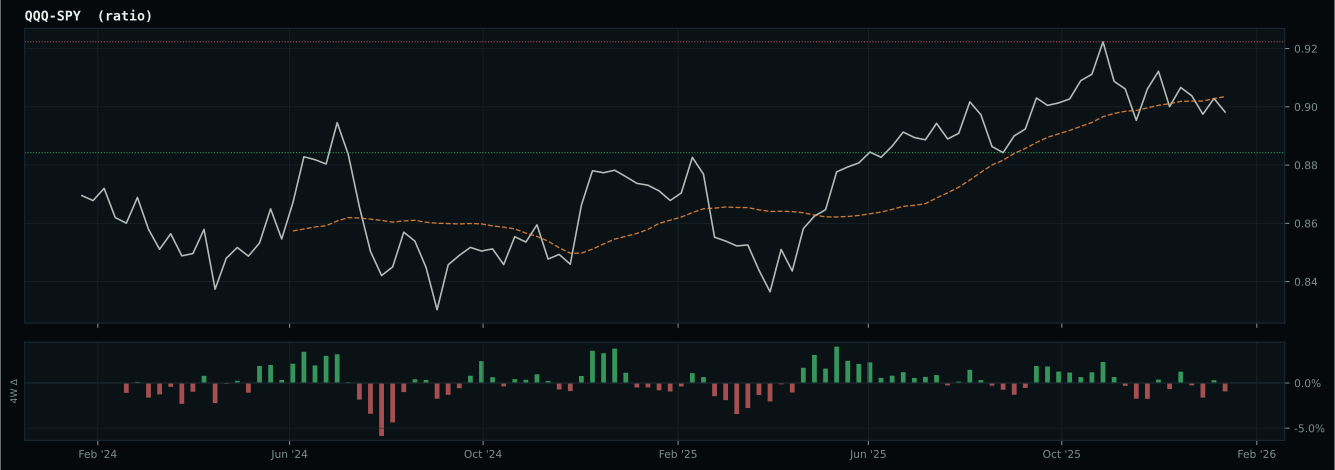
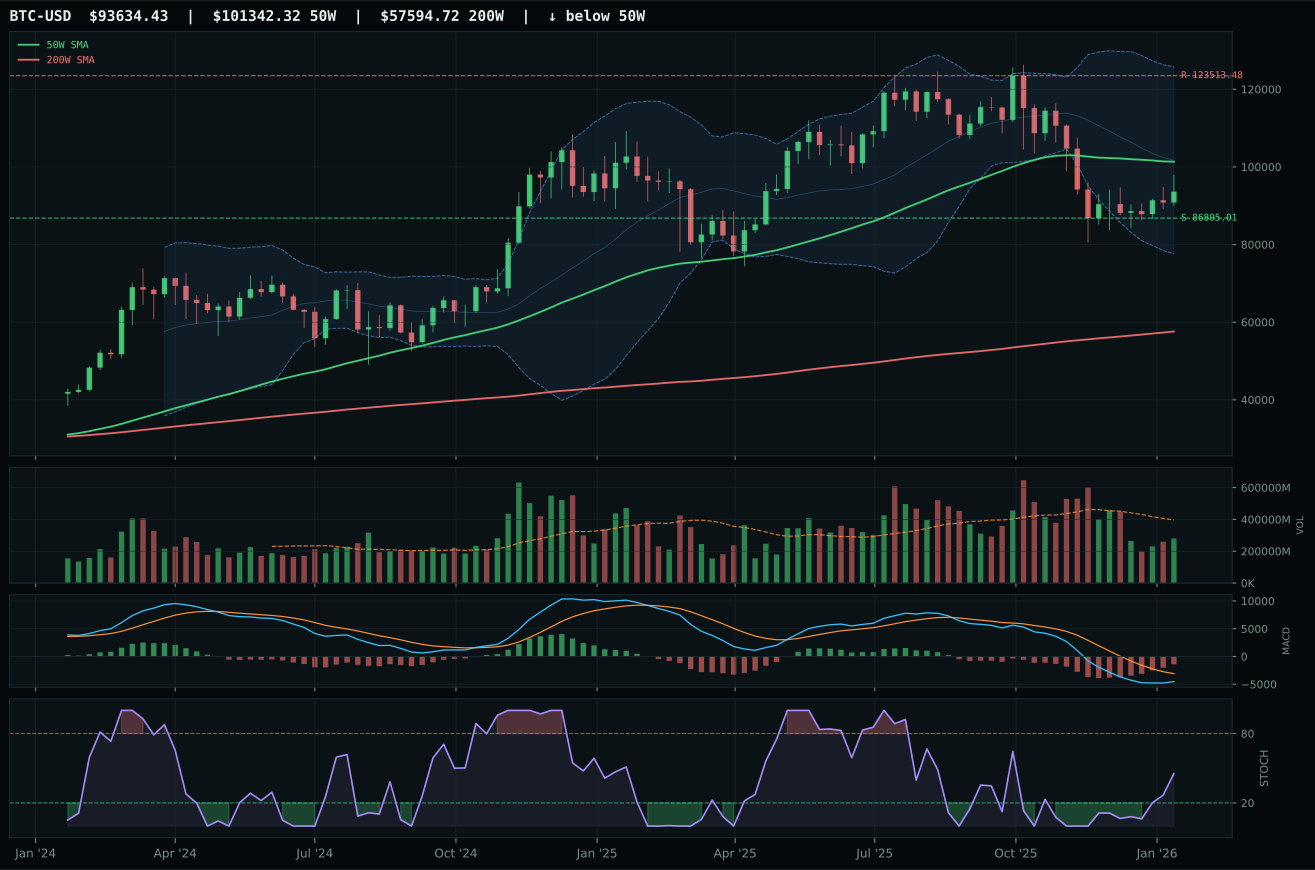
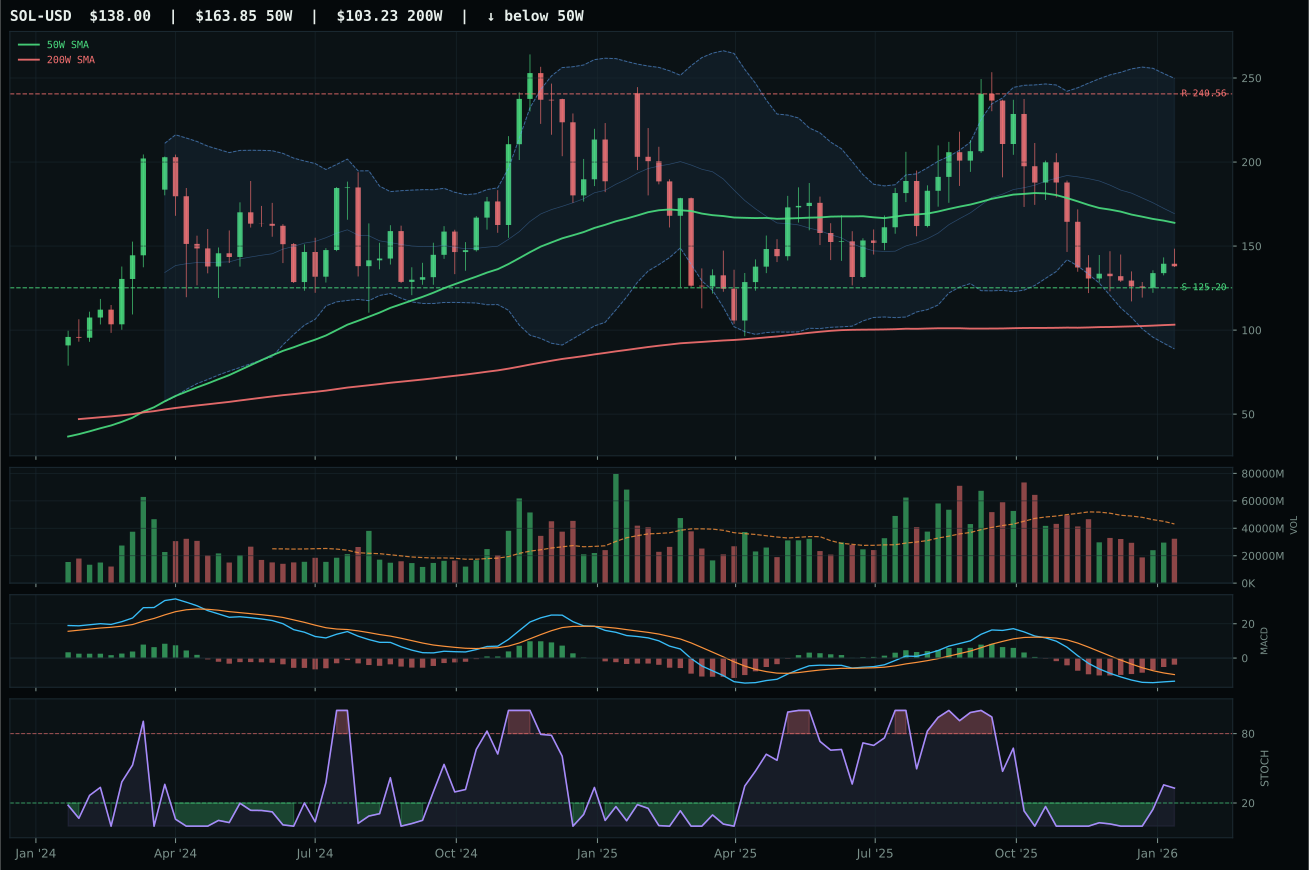
Crypto Regime — NoCrypto
ValueBTC not armed: BTC has not made the first post-breakdown touch of the 200W buy zone after losing the 50W
TrendBTC not confirmed
one or more available conditions failed
Category Rankings
| Rank | Category | Winner | Score | Alloc | 4W Ret | Peers (4W) |
|---|---|---|---|---|---|---|
| 1 | Industrial Metals | REMX | 83.4 | 20% | +0.01% | COPX +3.5% · PICK +5.8% |
| 2 | AI | SMH | 77.8 | 20% | +2.43% | BOTZ +1.8% · AIQ -4.6% |
| 3 | Traditional Energy | XLE | 76.3 | 10% | +13.45% | FCG +11.4% · XOP +12.4% |
| 4 | Precious Metals | SLV | 70.2 | 10% | -21.95% | GDX -1.6% · GLD +3.1% |
| 5 | Emerging Markets | IEMG | 69.1 | 10% | +5.83% | ILF +11.3% · INDA +2.2% |
| 6 | Defense & Aerospace | XAR | 61.4 | 10% | -6.42% | ITA -2.9% · ROKT -1.5% |
| 7 | Nuclear Energy | URNM | 56.5 | 10% | -4.18% | URA -6.4% · NLR -4.4% |
| 8 | Utilities & Infrastructure | XLU | 55.8 | 10% | +8.53% | PAVE +7.5% · IGF +10.2% |
| 9 | Agriculture & Livestock | MOO | 47.2 | 0% | +9.51% | VEGI +10.5% · WEAT +2.3% |
| 10 | Technology | XLK | 33.5 | 0% | -3.11% | CIBR -5.8% · IGV -14.7% |
Industrial Metals — REMX
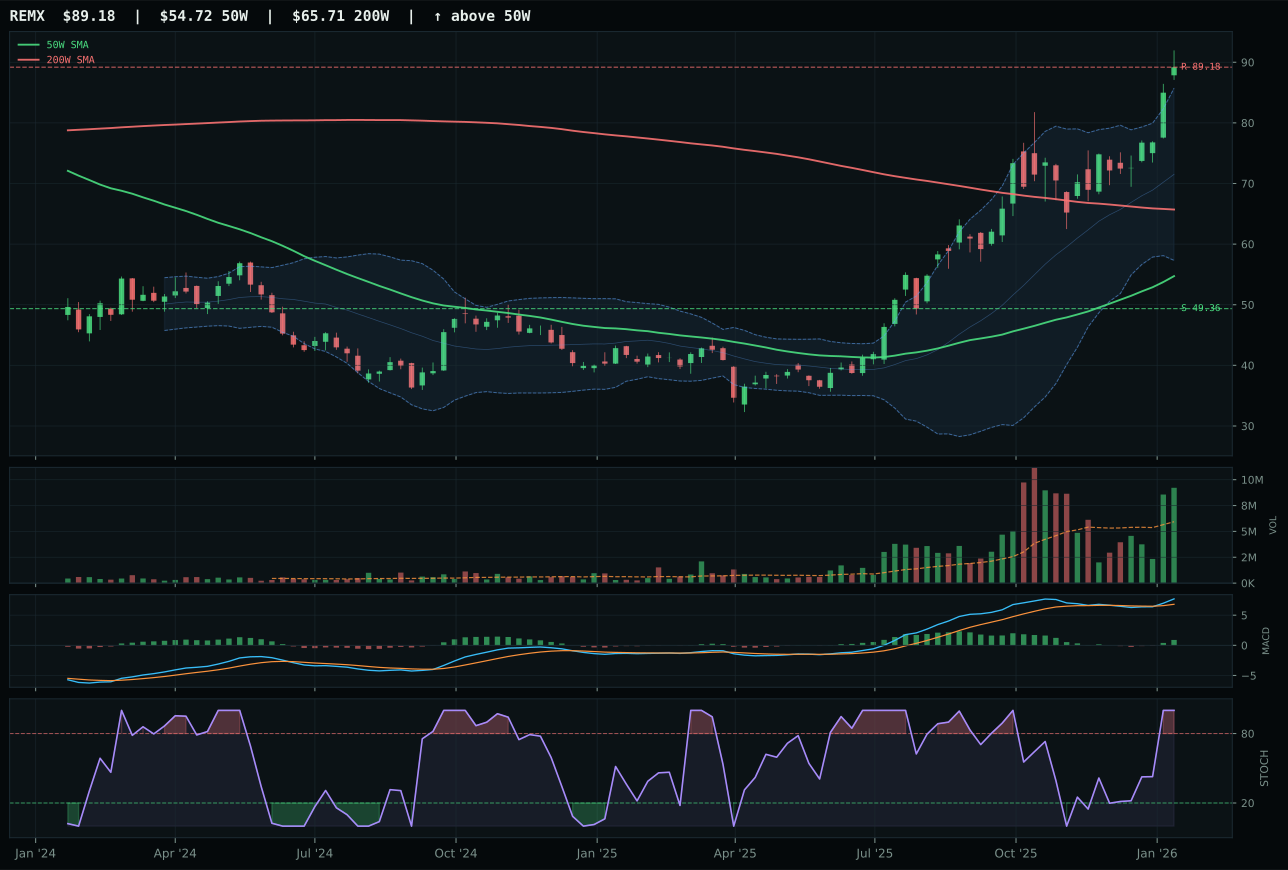
REMX has a vertical extension profile with 20.7% 13-week relative strength versus SPY.
A failed hold above support would weaken the setup.
Actionable but governed by invalidation levels.
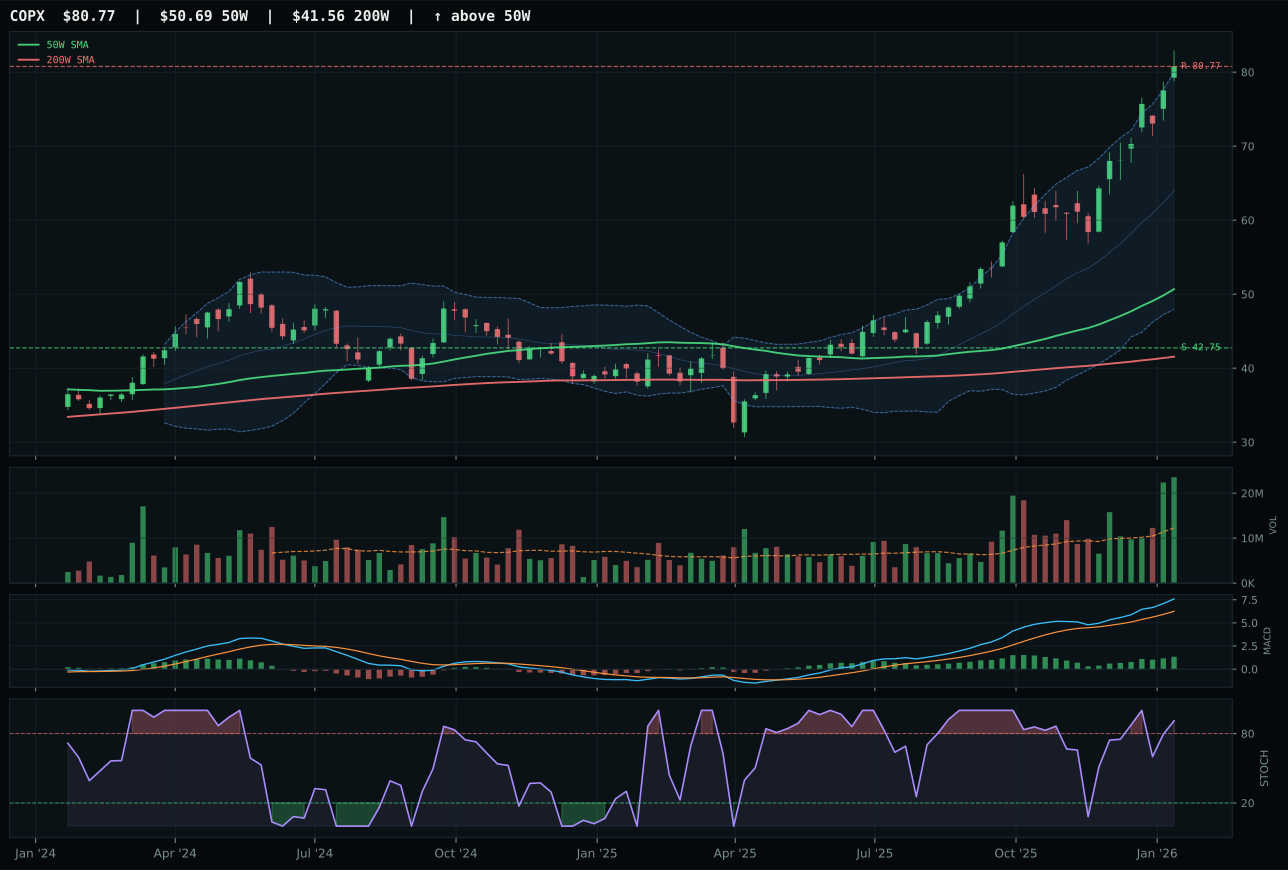
COPX has a vertical extension profile with 28.1% 13-week relative strength versus SPY.
A failed hold above support would weaken the setup.
Actionable but governed by invalidation levels.
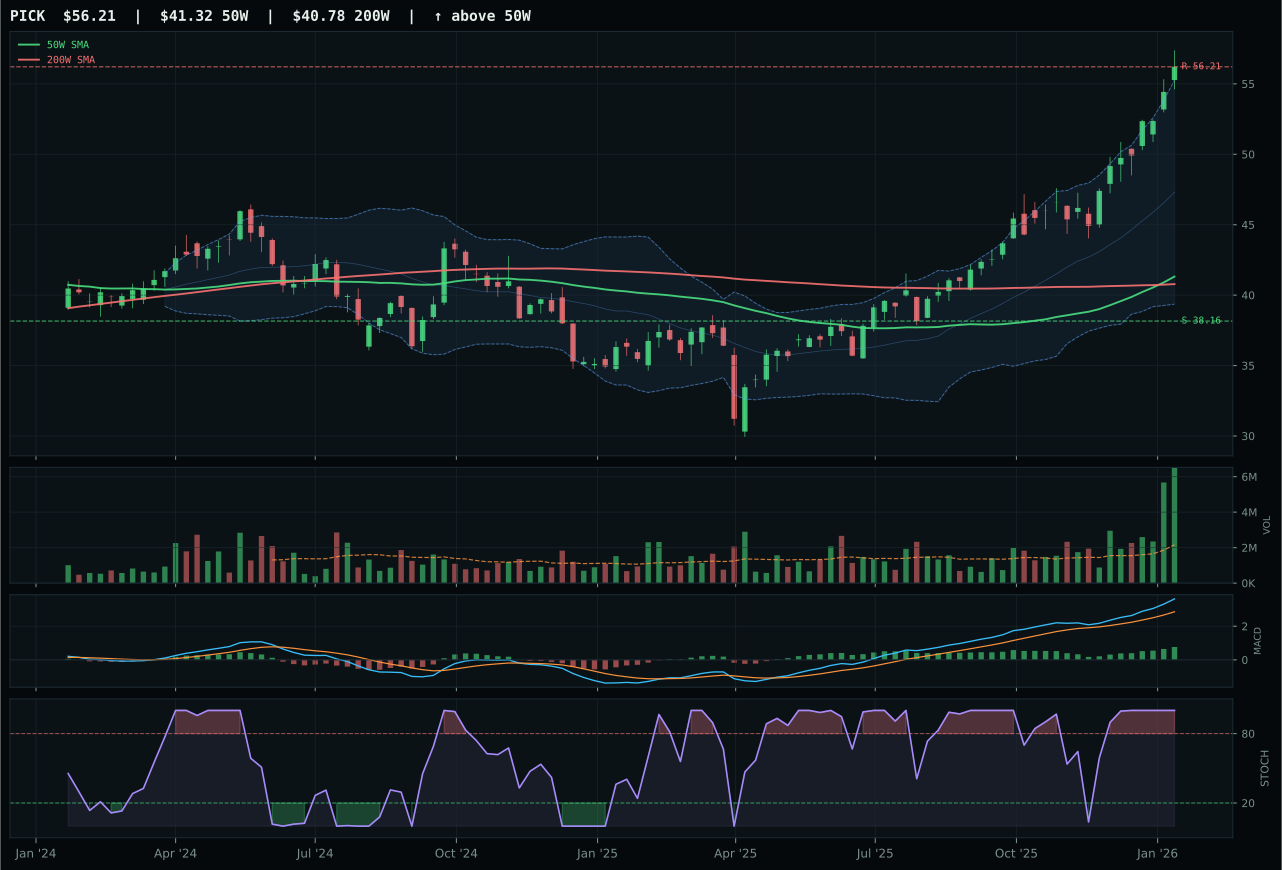
PICK has a vertical extension profile with 19.5% 13-week relative strength versus SPY.
A failed hold above support would weaken the setup.
Actionable but governed by invalidation levels.
REMX wins with a 2.4-point margin (the tightest gap in the top-2 winners) because it owns the timing advantage and slightly cleaner structure against COPX and PICK. At 20.7% relative strength versus SPY, REMX's 24.8% 13-week return and perfect 100.0 momentum score place it firmly in the rare earth supply-scarcity narrative. The structure is rated 79.2 (vertical extension, 66.7 cleanliness, 63.0 compression), and the volume is accumulation at 1.55x the 20-week average with stochastic RSI overbought (1.00) and MACD bullish and improving. The timing score of 37.0 reflects the 63.0% extension above the 50-week, but COPX's worse timing at 27.0 combined with its overbought RSI rolling over (momentum deterioration) gives REMX the nod despite very similar 13-week returns (24.8% vs 32.2% for COPX). PICK runs 96.5 persistence—higher than REMX—but REMX's category-relative strength at 0.0% versus COPX's 7.4% advantage is offset by REMX's cleaner MACD status. This is leadership by technical quality, not by absolute momentum.
Industrial Metals earns the 20% top-2 allocation at a score of 83.4—the highest in the portfolio—because it combines elite technical evidence (87.9 for REMX), outstanding macro fit (73.0 at the category level), and genuine scarcity sponsorship that is not dependent on risk appetite. Metals scarcity is active (+14), commodity breadth positive is active (+10), real asset sponsorship is active (+6), and credit stress is only modestly negative (-7). The Transition / Mixed regime typically hurts commodities, but the rare earth and industrial metals supply chains are in structural deficit independent of macro cycles; geopolitical fragmentation only reinforces the scarcity premium. REMX's 87.9 technical evidence and COPX's slight outperformance in 13-week returns (32.2% vs 24.8%) create a close decision at the category level, but REMX's cleaner MACD and superior timing control the win. This is the strongest category in the portfolio because macro and technicals are aligned: scarcity is real, supply is constrained, and institutional buying is confirmed. Industrial Metals deserves top-2 allocation.
AI — SMH
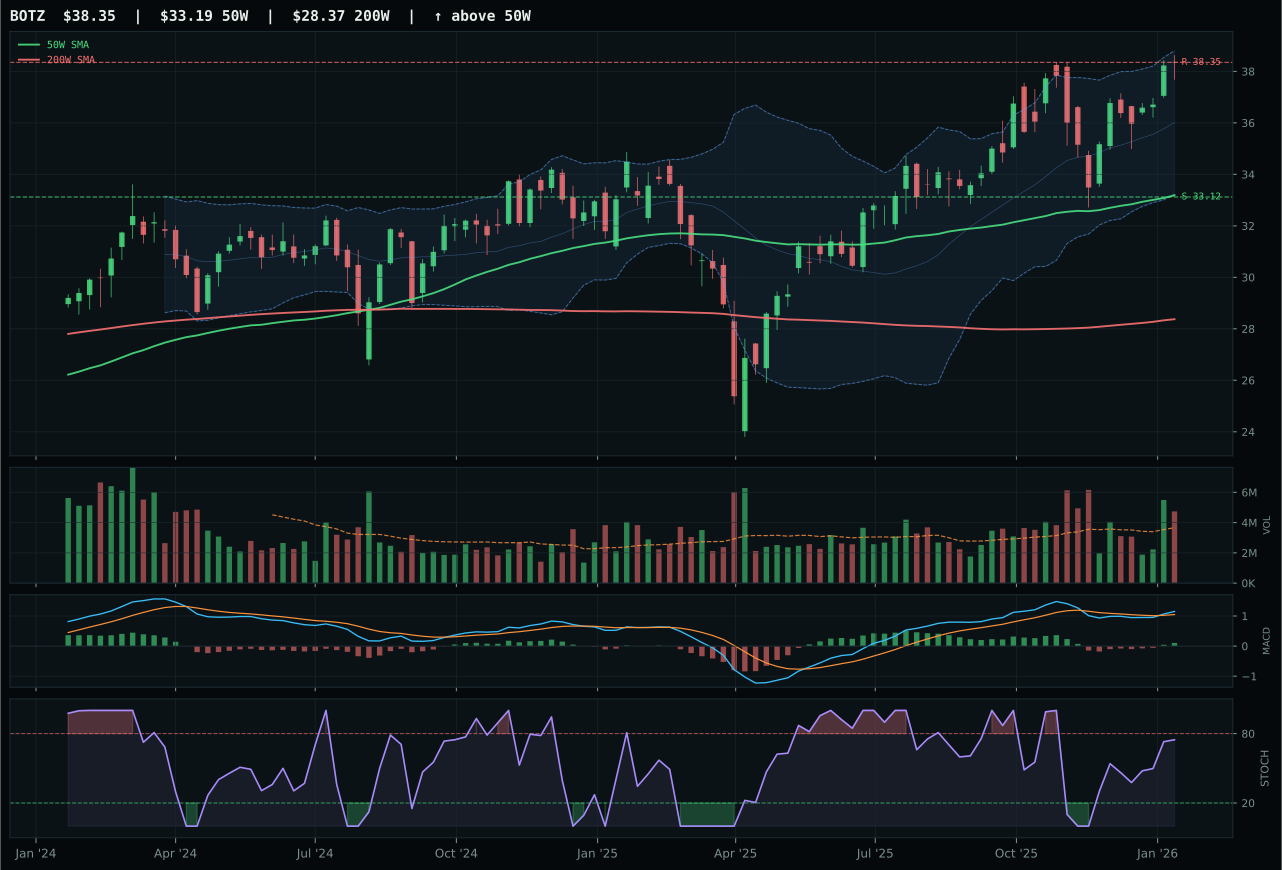
BOTZ has a vertical extension profile with 2.3% 13-week relative strength versus SPY.
A failed hold above support would weaken the setup.
Actionable but governed by invalidation levels.
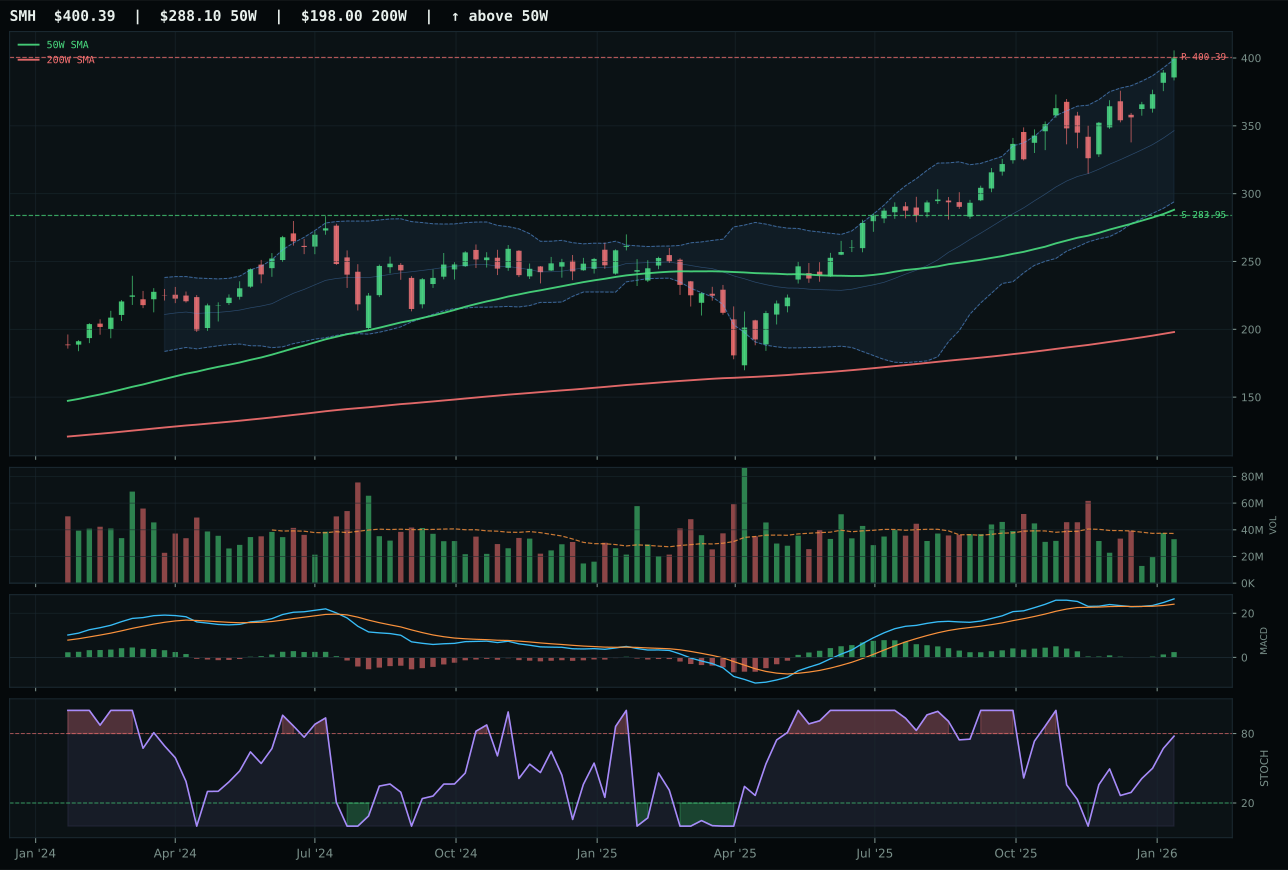
SMH has a vertical extension profile with 12.7% 13-week relative strength versus SPY.
A failed hold above support would weaken the setup.
Actionable but governed by invalidation levels.
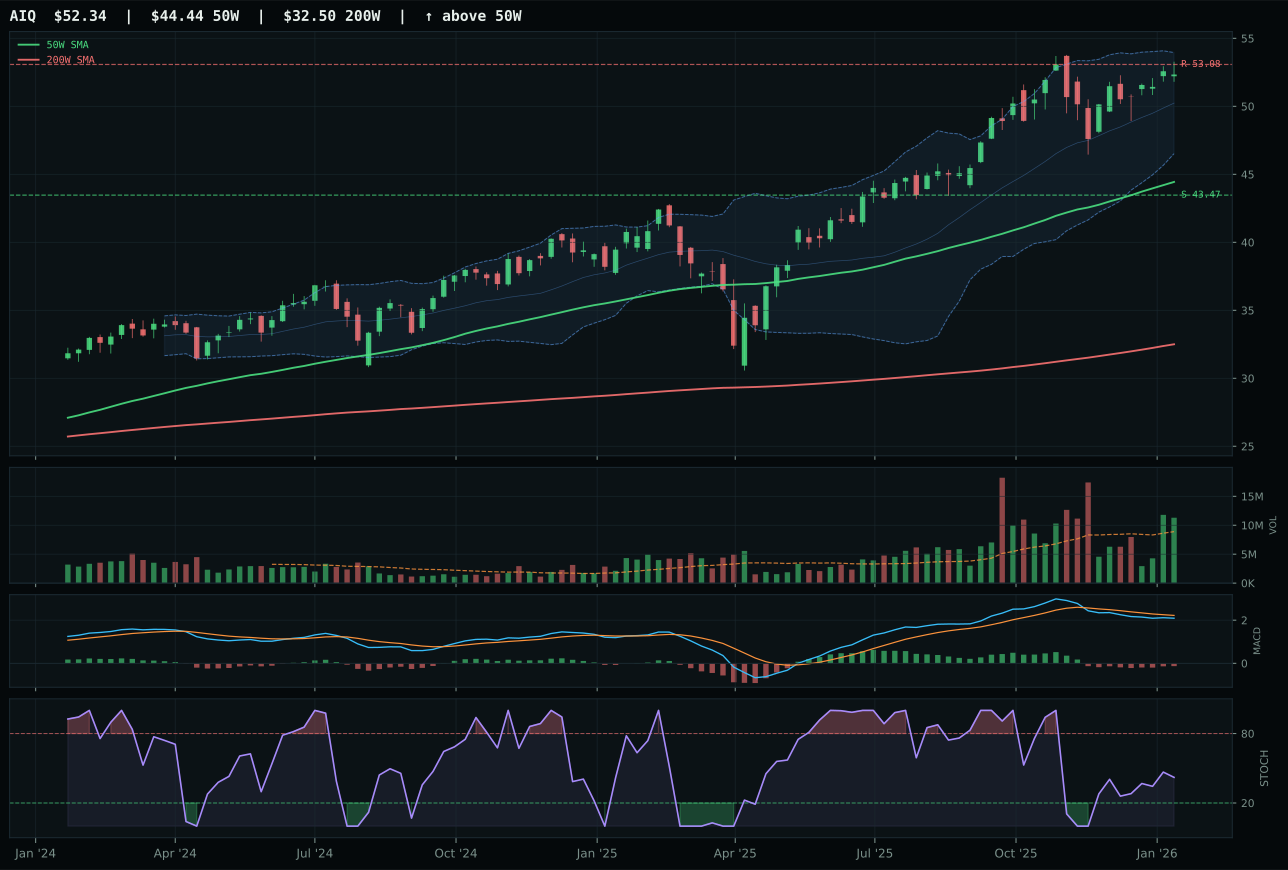
AIQ has a vertical extension profile with -0.5% 13-week relative strength versus SPY.
A failed hold above support would weaken the setup.
Actionable but governed by invalidation levels.
SMH wins because it is the only name in the basket delivering category-relative leadership combined with absolute strength across every momentum measure. At 10.4% outperformance versus the category median and 12.7% versus SPY, SMH's 16.8% 13-week return and bullish-improving MACD with rising stochastic RSI mid-zone (0.78) demonstrate that new money is actively accumulating the position at height—not rotating away. The vertical extension setup at 39.0% above the 50-week average normally triggers timing penalties, but SMH's combination of perfect trend scores (100.0), perfect momentum confirmation (100.0), and clean volume-price persistence (76.7 and 79.7) overrides entry risk. BOTZ is technically superior on structure and MACD, but it lags by 10.4 points in category-relative strength and shows only 2.3% SPY outperformance, placing it in the unicycle motion rather than the bull market. The 4.2-point winning margin confirms SMH as the clear semiconductor and AI compute leadership expression.
AI earns the 20% top-2 allocation slot at a final score of 77.8—the second-highest category this week—because it combines elite technical evidence (76.8/100) with macro fit that is genuinely supportive, not just neutral. The category-level macro fit of 76.0 is driven by active AI growth sponsorship (+14), risk appetite positive (+10), and liquidity expansion (+10), with credit stress muted at -8. This is not a mean-reversion trap or an extended speculative bubble; it is an extended move with improving sponsorship and confirmed accumulation volume. SMH's 100.0 momentum score and 100.0 volume-price confirmation leave no technical doubt about the quality of the setup. The macro regime (Transition / Mixed) is favorable to AI hardware capex cycles, and the 37.9% 26-week return on SMH coupled with 12.7% SPY outperformance demonstrates that AI leadership is not fading—it is broadening. This allocation survives both tactical and strategic scrutiny.
Traditional Energy — XLE
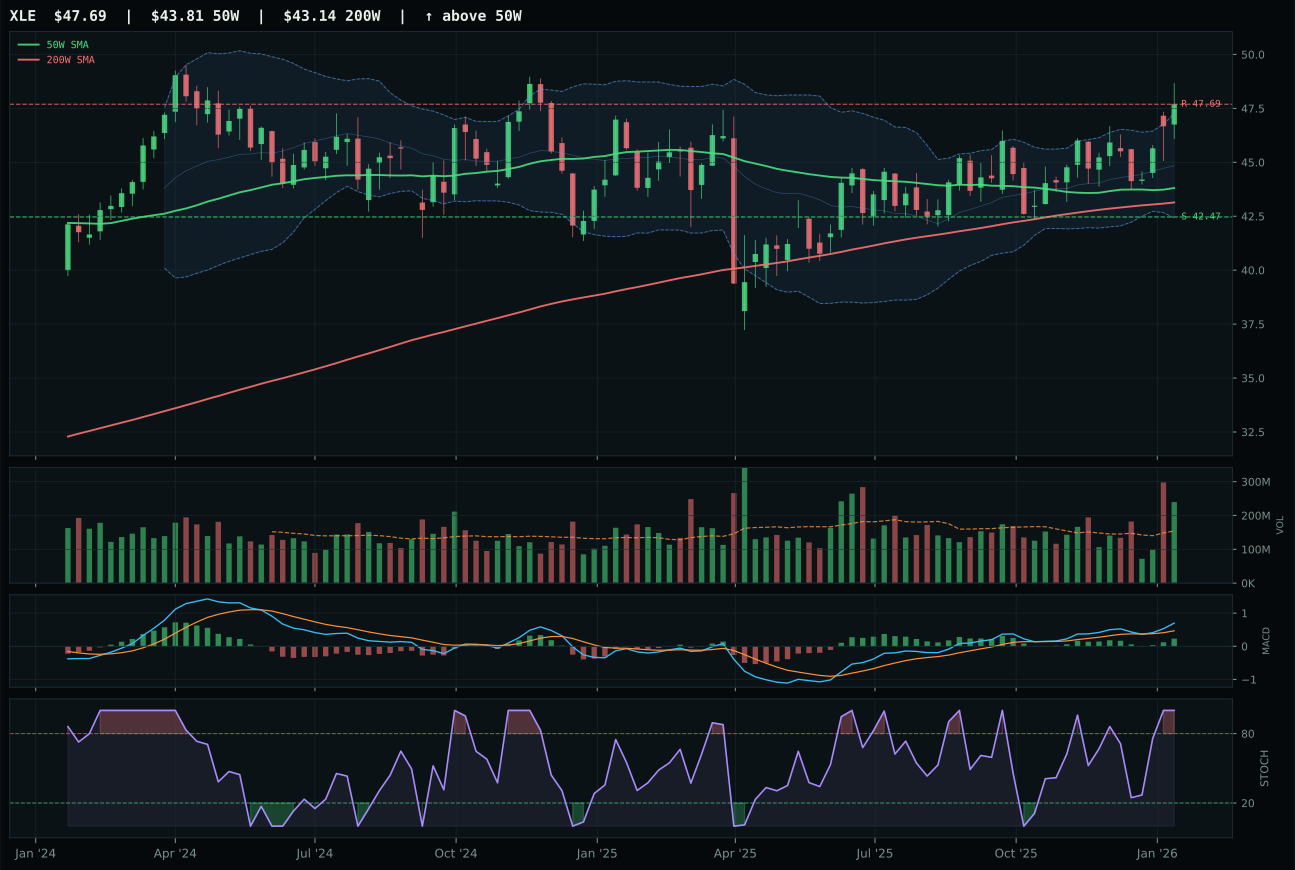
XLE has a neutral structure profile with 6.8% 13-week relative strength versus SPY.
A failed hold above support would weaken the setup.
Actionable but governed by invalidation levels.
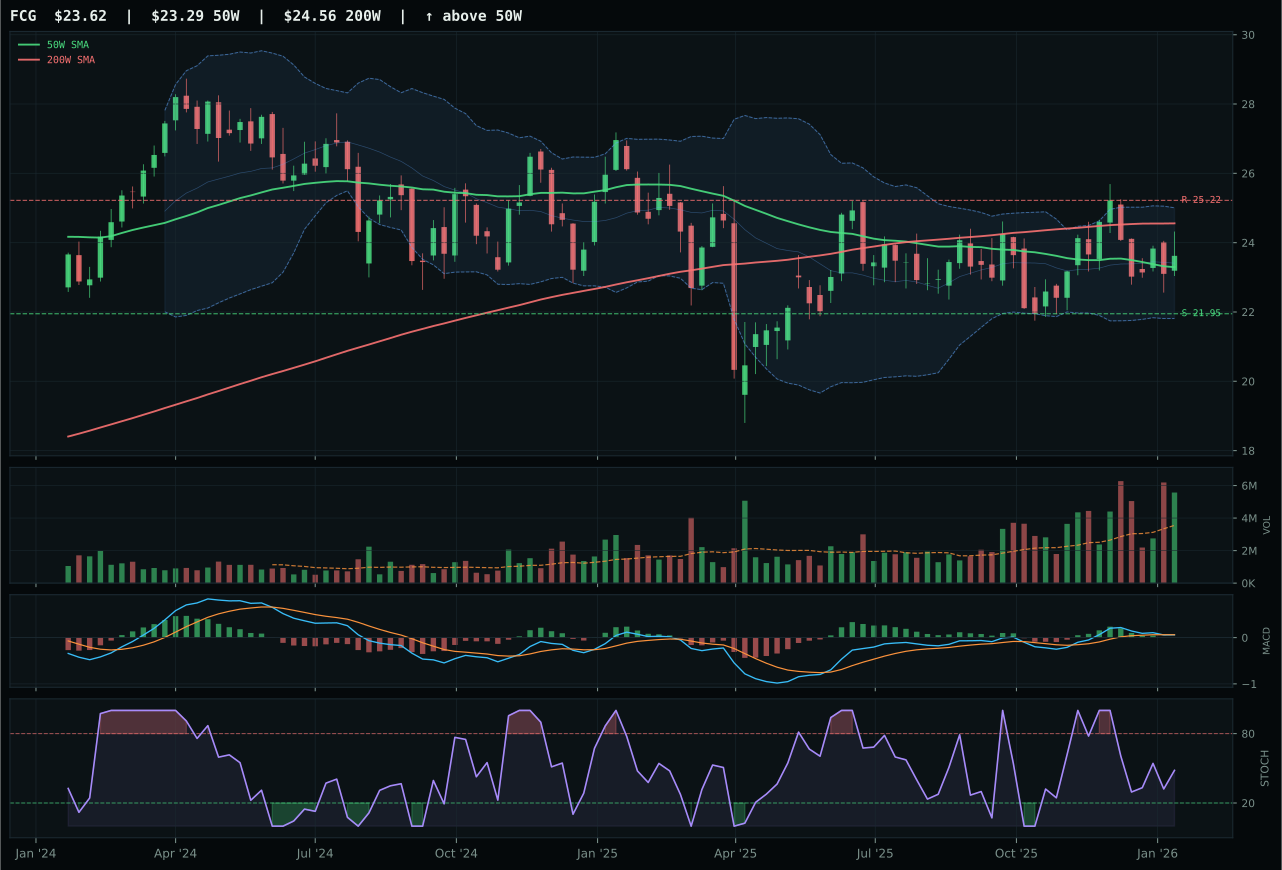
FCG has a compression near 50W profile with 3.5% 13-week relative strength versus SPY.
A failed hold above support would weaken the setup.
Actionable but governed by invalidation levels.
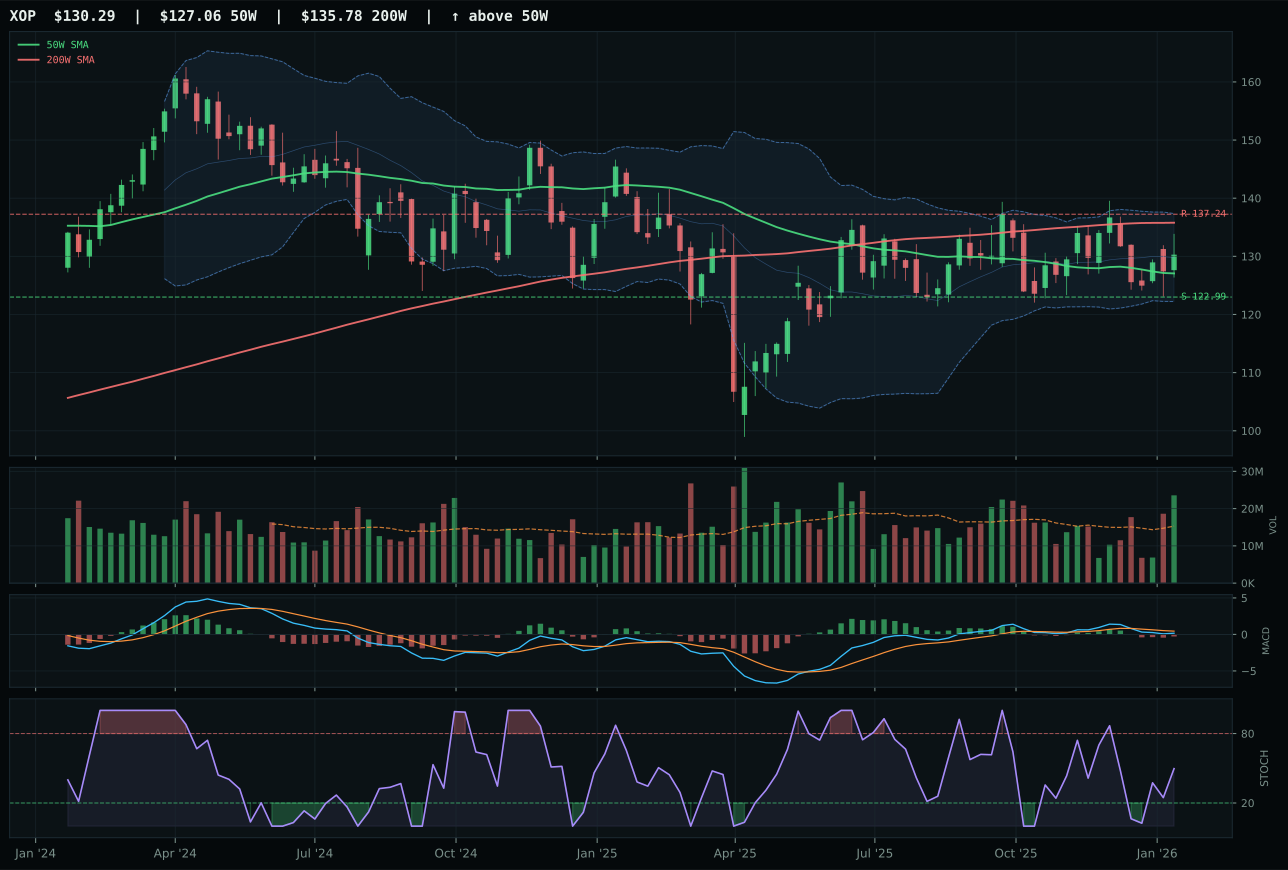
XOP has a compression near 50W profile with 1.3% 13-week relative strength versus SPY.
A failed hold above support would weaken the setup.
Actionable but governed by invalidation levels.
XLE wins with a commanding 12.7-point margin because it combines perfect trend (100.0) with the cleanest macro and technical narrative in the energy basket. At 6.8% relative strength versus SPY and 3.3% versus the category median, XLE's 10.9% 13-week return is steady and confirmed: structure at 86.1 (the highest in the category), neutral setup with 75.0 cleanliness and 83.2 compression, and near-perfect volume-price confirmation at 95.5 and 84.9 persistence. The MACD is bullish and improving, the stochastic RSI is overbought momentum (1.00), volume is accumulation at 1.55x the 20-week average, and timing is excellent at 75.0 because price sits only 8.9% from the 50-week. FCG's compression-near-50-week setup is theoretically attractive, but MACD is bearish/weakening and category-relative strength is 0.0%, making it a reactive bounce rather than accumulation. XLE is the only name delivering integrated cash-flow defense with improving momentum and macro alignment.
Traditional Energy earns a 10% allocation at a score of 76.3 because the macro fit is genuinely exceptional at 85.0, driven by energy scarcity (+16), inflation pressure (+10), supply shortage (+9), and real asset sponsorship (+7)—four major descriptors all firing in the same direction. XLE's technical evidence of 100.0 for the category winner is elite, making this a category that wins on both tactical timing and strategic regime positioning. The Transition / Mixed macro state would normally be neutral to negative for energy, but the active supply shortage and energy scarcity descriptors override that bias; this is not a risk-on energy trade, it is a fundamental scarcity trade. XLE sits only 8.9% above the 50-week with room to run, volume is accumulation, and MACD is improving—the setup is clean and early rather than extended and late. To earn 20%, Energy would need to show either higher 13-week momentum (10.9% is steady but not explosive) or evidence that the scarcity bid is translating into margin expansion; currently it is a quality real-asset allocation with solid macro support.
Precious Metals — SLV
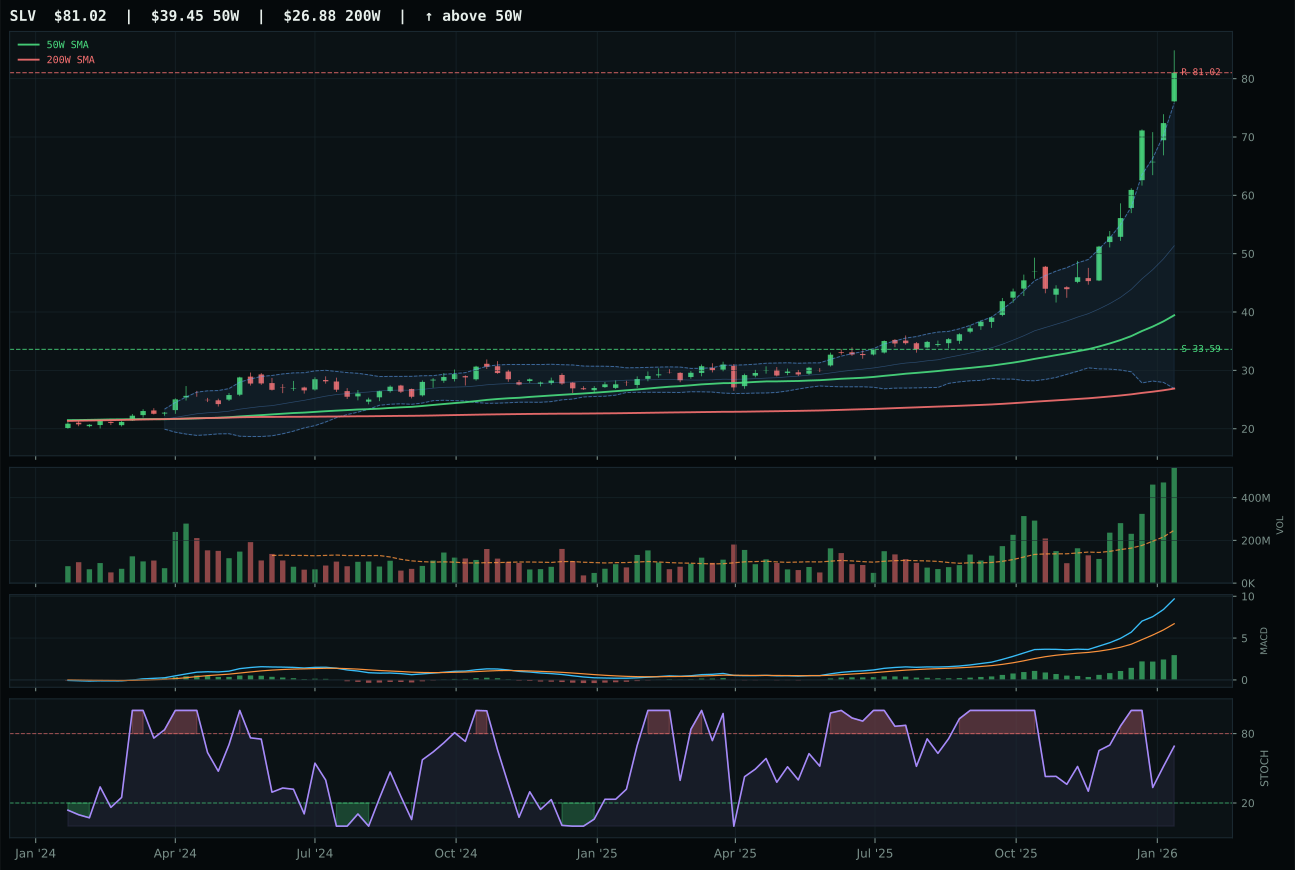
SLV has a vertical extension profile with 68.3% 13-week relative strength versus SPY.
A failed hold above support would weaken the setup.
Actionable but governed by invalidation levels.
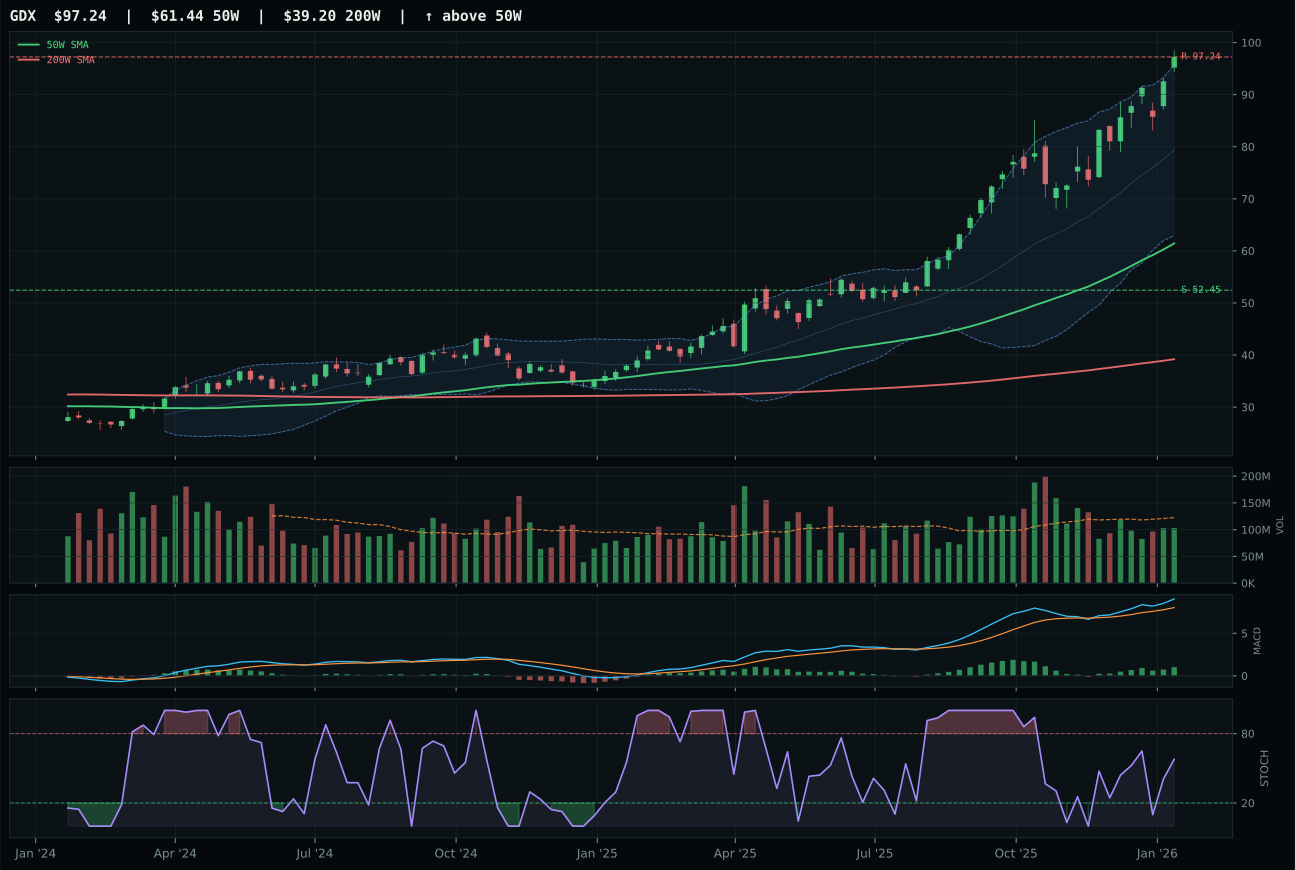
GDX has a vertical extension profile with 19.4% 13-week relative strength versus SPY.
A failed hold above support would weaken the setup.
Actionable but governed by invalidation levels.
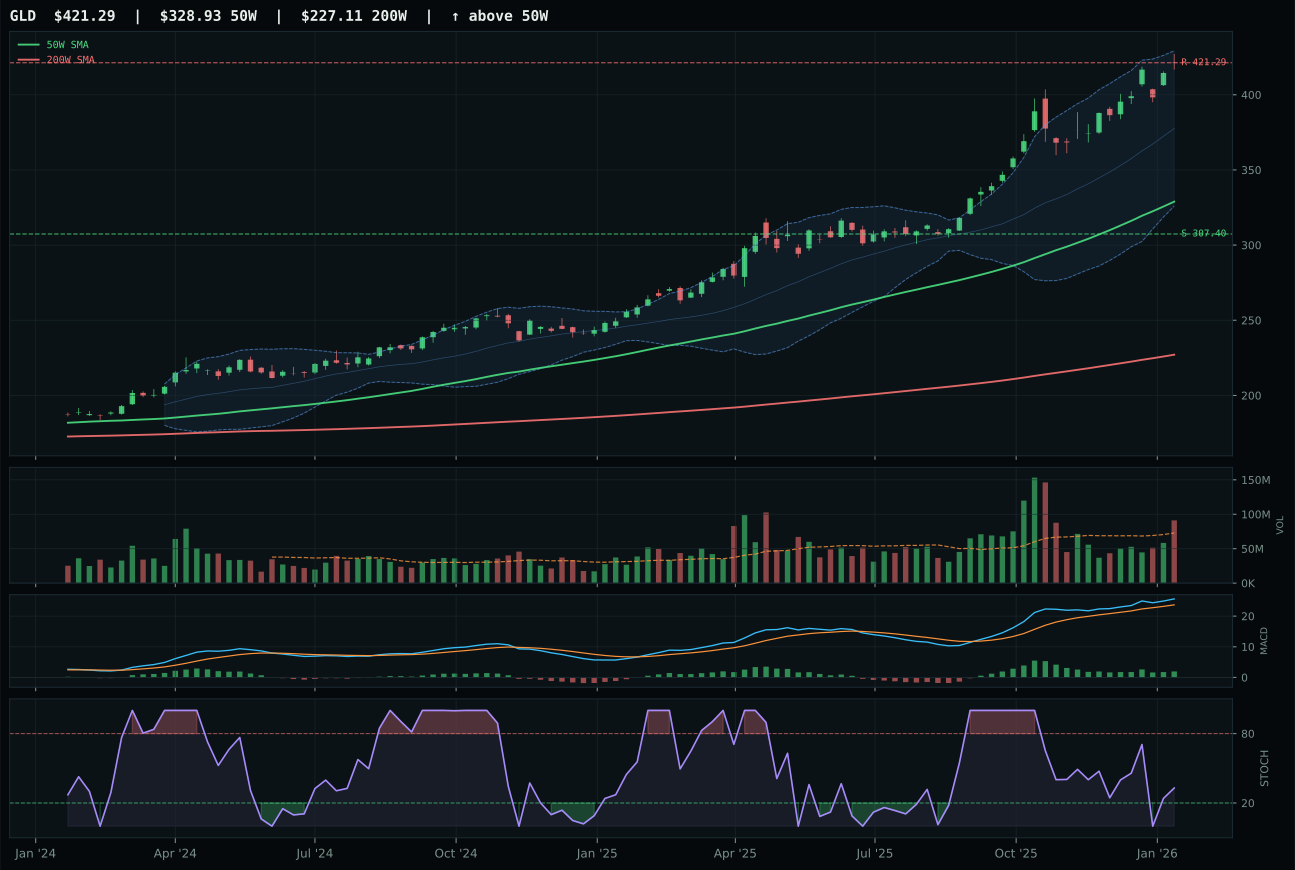
GLD has a vertical extension profile with 4.2% 13-week relative strength versus SPY.
A failed hold above support would weaken the setup.
Actionable but governed by invalidation levels.
SLV wins decisively with a 2.3-point margin because it is the only name in the basket delivering the extreme relative strength required to justify exposure at these extended levels. At 68.3% relative strength versus SPY and 48.9% versus the category median, SLV is not just leading; it is far outpacing both GDX (19.4% SPY RS) and GLD (4.2% SPY RS). The 72.4% 13-week return is genuinely extraordinary, and the volume-price confirmation is flawless: 2.89x average volume, perfect 100.0 momentum and persistence scores, and perfect 100.0 volume-price confirmation. This is not a liquidity fluke or a volatility bounce; the MACD is bullish and improving, the stochastic RSI is falling/neutral at 0.69 (giving room for the move to extend), and every technical component confirms accumulation at height. GDX's 23.5% 13-week return looks strong in isolation but is dwarfed by SLV's momentum and market-relative sponsorship. SLV owns the silver market's hybrid monetary and industrial bid.
Precious Metals earns a 10% allocation at a score of 70.2 because SLV's technical evidence (100.0) and the active monetary hedge bid descriptor (+14) create a legitimate trade, even though the category ranks fourth and is vulnerable to risk-appetite reversals. The category-level macro fit of 58.0 is positive but not exceptional; monetary hedge bid is active and metals scarcity is real, but risk appetite positive is modestly negative at -4, reflecting tension between inflation protection and equity market strength. SLV's extreme extension (105.4% above the 50-week) and poor risk/reward (0.0% upside, 141.2% downside to support) normally argue against allocation, but the 100.0 persistence score and perfect volume confirmation signal that the institutional bid is intact. This is a momentum-driven allocation that survives as long as the monetary hedge bid remains active; it would lose conviction immediately if the category-level macro fit drops or if SLV's volume participation fades. Hold this position as long as the accumulation signal holds.
Emerging Markets — IEMG
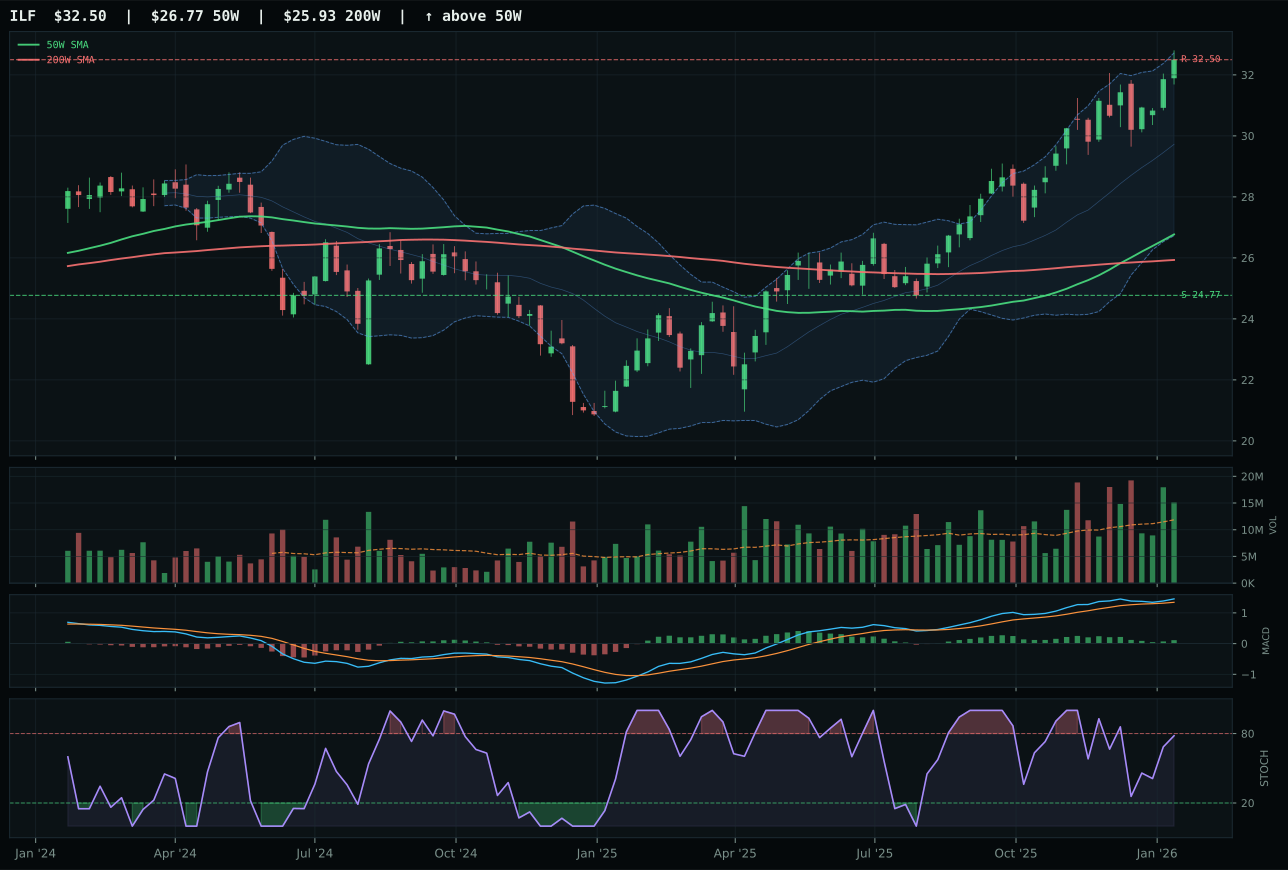
ILF has a vertical extension profile with 11.0% 13-week relative strength versus SPY.
A failed hold above support would weaken the setup.
Actionable but governed by invalidation levels.
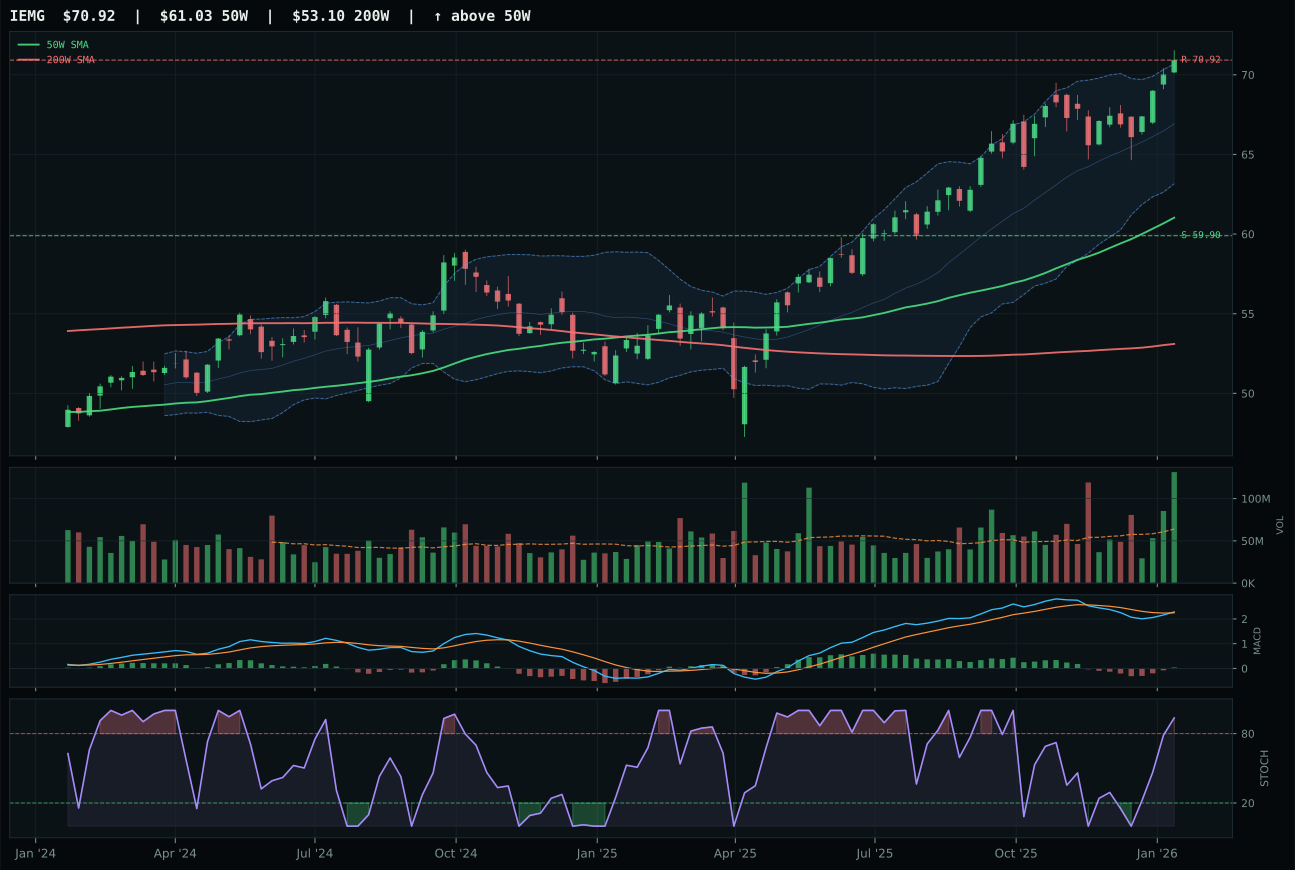
IEMG has a vertical extension profile with 1.9% 13-week relative strength versus SPY.
A failed hold above support would weaken the setup.
Actionable but governed by invalidation levels.
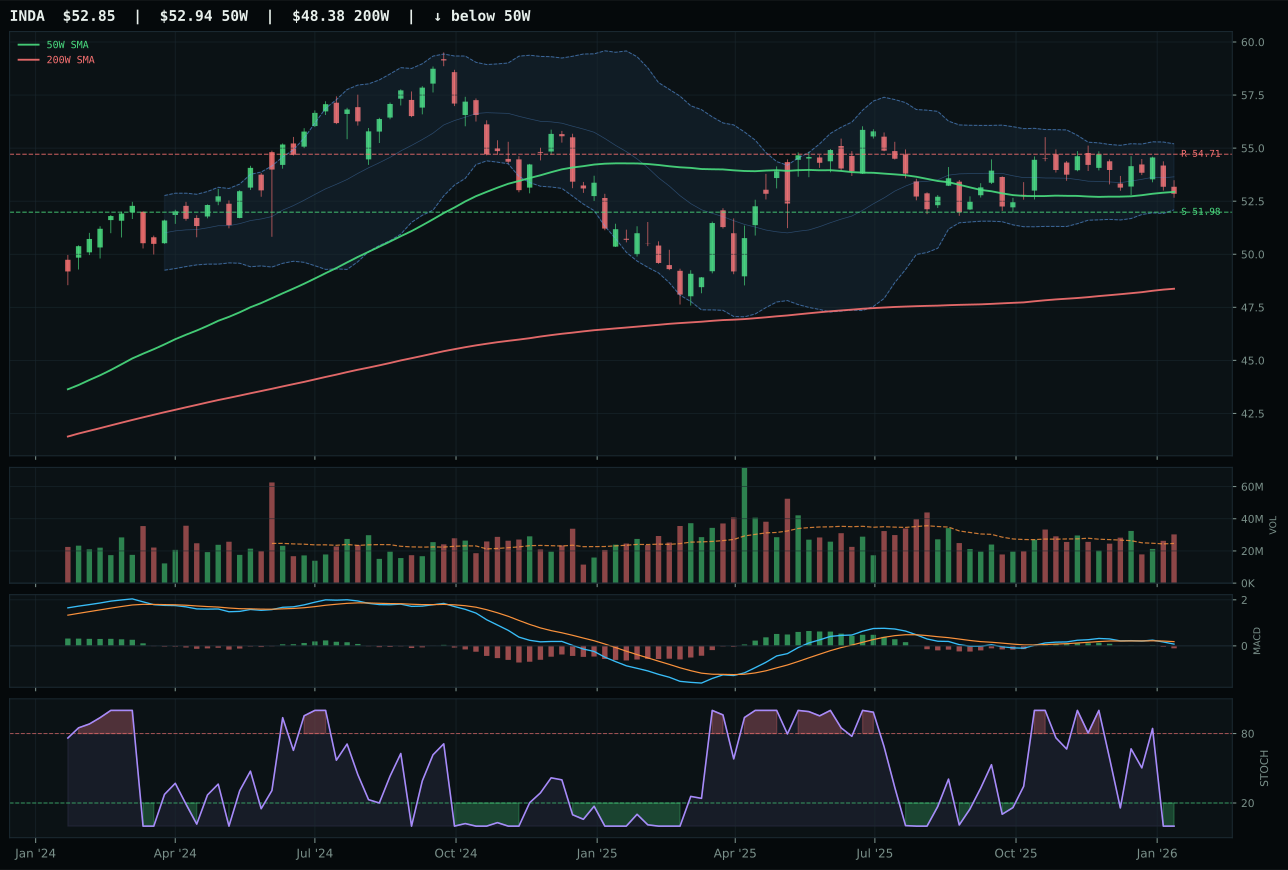
INDA has a pullback into support profile with -7.0% 13-week relative strength versus SPY.
A failed hold above support would weaken the setup.
Actionable but governed by invalidation levels.
IEMG wins with a tight 1.8-point margin because it shows the only improving MACD profile (bullish and improving vs ILF's bullish but flattening) and superior volume-price confirmation despite ILF's higher 13-week return (15.1% vs 6.0%). IEMG's category-relative strength at 0.0% matches ILF's 9.1% advantage, but IEMG's timing advantage is decisive: it sits only 16.2% above the 50-week versus ILF's 21.4% extension, giving it room to run without the entry risk. Volume is accumulation at 2.05x the 20-week average, stochastic RSI is overbought momentum (0.93), structure is cleanest at 84.4, and persistence is solid at 79.2. ILF's superior relative strength (11.0% SPY RS vs IEMG's 1.9%) is offset by declining MACD momentum and more stretched entry; it is the value and commodity leveraged play while IEMG is the broad beta accumulation. The gap is tight because both are technically sound, but IEMG's cleaner MACD and less extended timing edge it out.
Emerging Markets earns a 10% allocation at a score of 69.1 because the macro fit is solid at 70.0, driven by EM liquidity support (+14), liquidity expansion (+8), and risk appetite positive (+8), with only credit stress as a moderate headwind (-10). IEMG's 91.3 technical evidence is elite, ranking it in the conversation for higher allocation, but the category's overall score of 69.1 places it third among the ten categories. The Transition / Mixed regime typically creates uncertainty about capital flows to emerging markets, but the active EM liquidity support descriptor signals that institutions are building exposure defensively. IEMG's 6.0% 13-week return is modest, and 1.9% SPY outperformance suggests the EM story is not yet a conviction momentum trade—it is accumulation building into support. To earn 20%, Emerging Markets would need either higher absolute momentum (6.0% is steady but not exciting) or broader confirmation from the second and third ETFs (ILF is the momentum leader, but INDA is broken). Hold IEMG as a macro hedge into EM liquidity support; it becomes a top-2 trade only if risk appetite deteriorates.
Defense & Aerospace — XAR
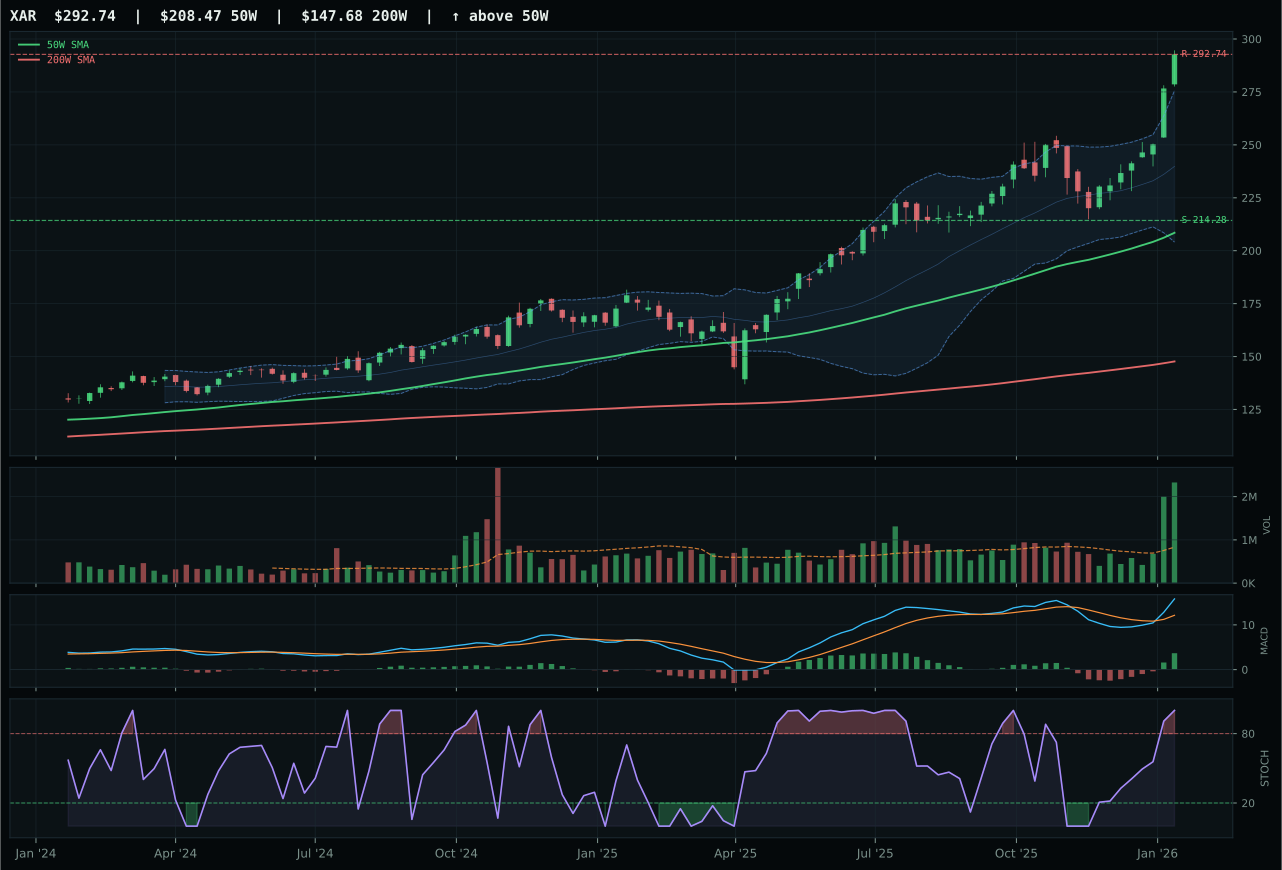
XAR has a vertical extension profile with 20.2% 13-week relative strength versus SPY.
A failed hold above support would weaken the setup.
Actionable but governed by invalidation levels.
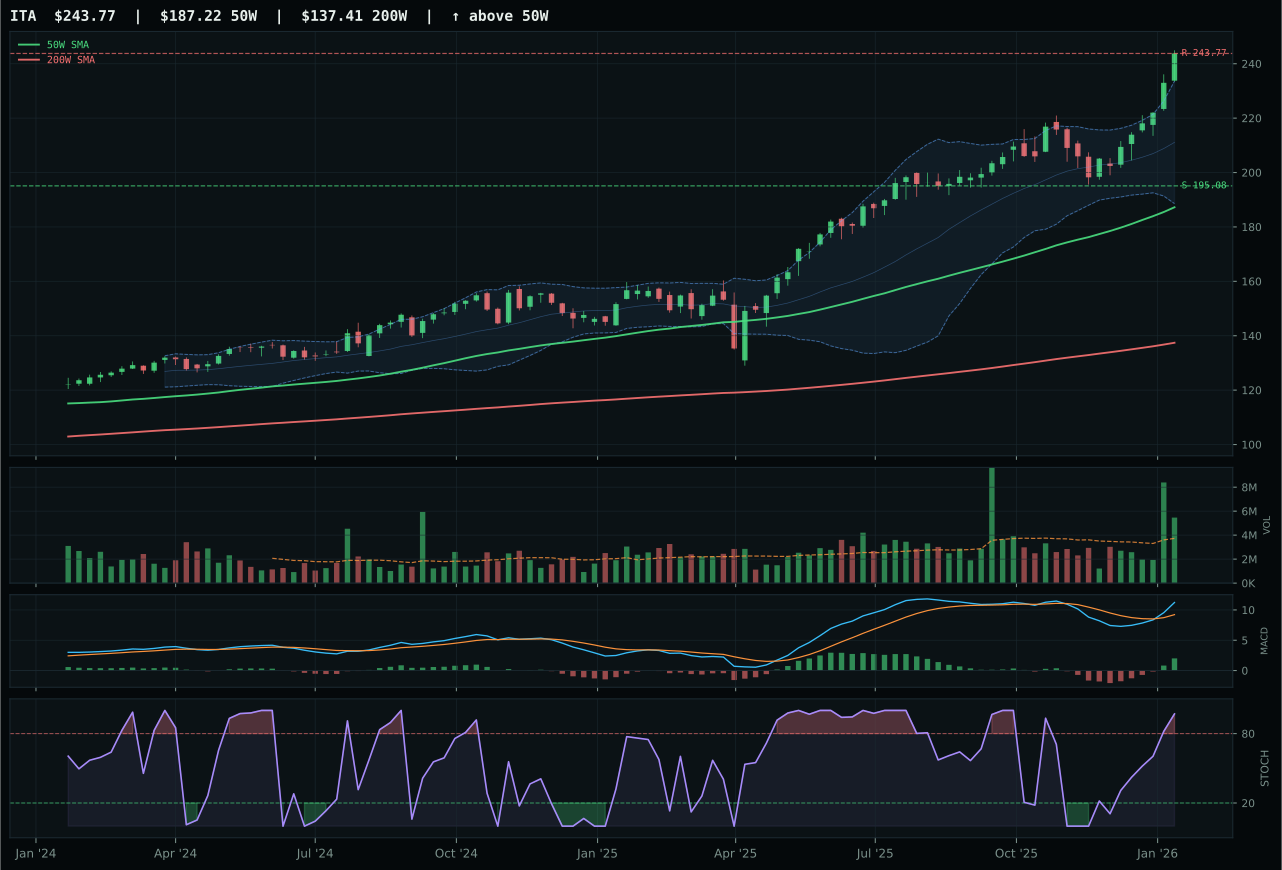
ITA has a vertical extension profile with 14.3% 13-week relative strength versus SPY.
A failed hold above support would weaken the setup.
Actionable but governed by invalidation levels.
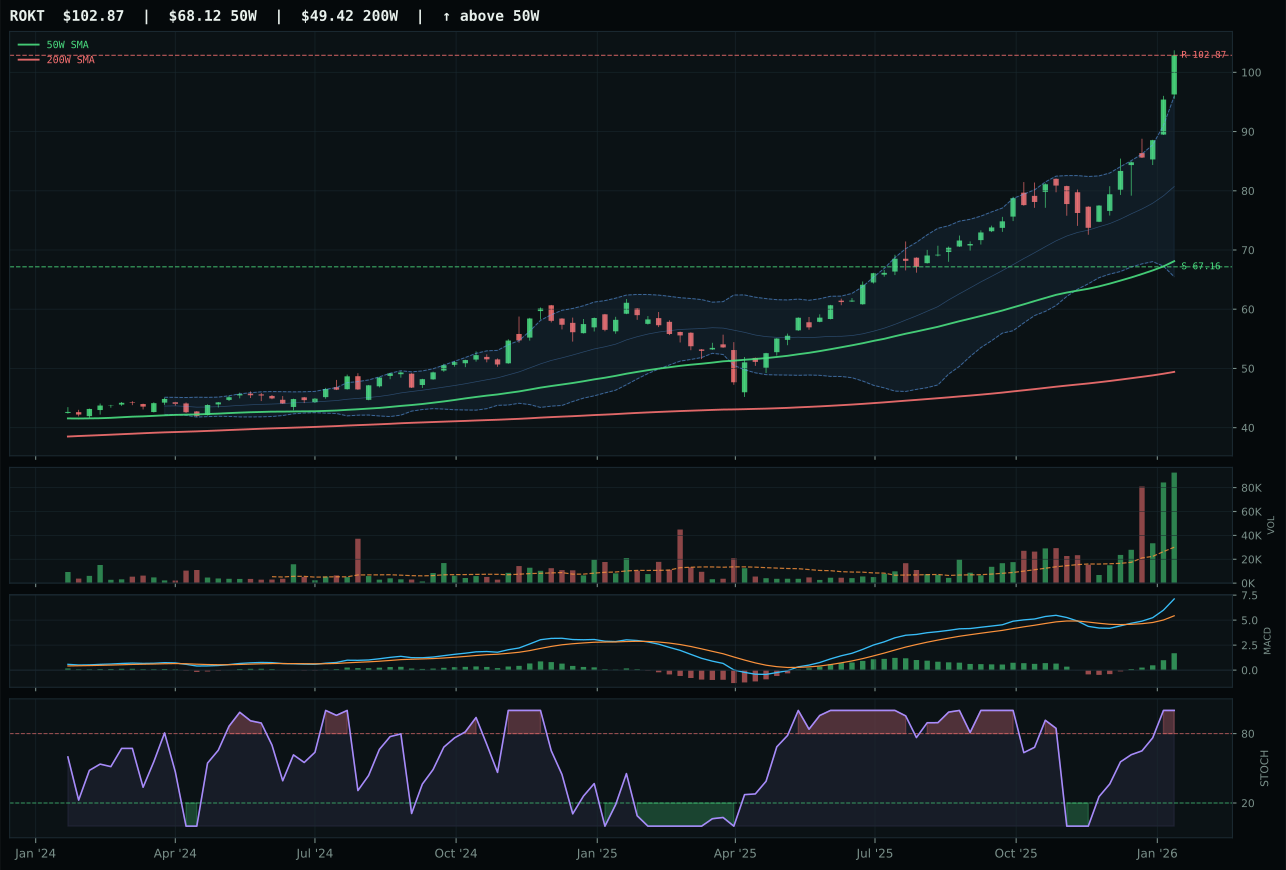
ROKT has a vertical extension profile with 27.6% 13-week relative strength versus SPY.
A failed hold above support would weaken the setup.
Tracked, but not top-2 eligible because: .
XAR wins cleanly with a 1.4-point margin because it delivers both the strongest absolute sponsor signal and the tightest technical confirmation of accumulation. At 20.2% relative strength versus SPY and volume running 2.80x the 20-week average (the highest in the category), XAR shows that institutional money is actively buying the vertical extension rather than taking profits. The 24.3% 13-week return, perfect 100.0 trend and momentum scores, and overbought stochastic RSI (1.00) with bullish-improving MACD form an ironclad accumulation narrative—extended price plus extreme volume plus improving technicals equals conviction. ITA is within 1.4 points of XAR and also shows bullish structure with 18.4% 13-week performance, but its 14.3% SPY relative strength is 6.2 points behind XAR, and its volume confirmation is only above-average participation rather than accumulation. The category has neutral macro fit at 50.0 across both finalists, making this a pure technical competition that XAR wins decisively on volume authority.
Defense & Aerospace earns a 10% allocation at a score of 61.4 because the technical evidence is overwhelming (87.4 for the winner XAR), even though macro fit is flat at 55.0 and the category ranks fifth in final score. The macro regime (Transition / Mixed) provides no directional bias, and while credit stress is modestly positive (+2), there are no active descriptors strongly favoring defense exposure. What matters here is that XAR is showing the kind of volume-price confirmation that justifies capital commitment regardless of macro backdrop: accumulation at 2.80x average volume with stochastic RSI overbought and MACD bullish and improving represents the purest technical setup in the portfolio. To earn higher allocation, Defense would need either macro clarity (geopolitical risk pricing, capex cycle confirmation) or evidence that the extended move is losing sponsorship; currently it shows neither. This is a solid category that wins on execution rather than regime positioning.
Nuclear Energy — URNM
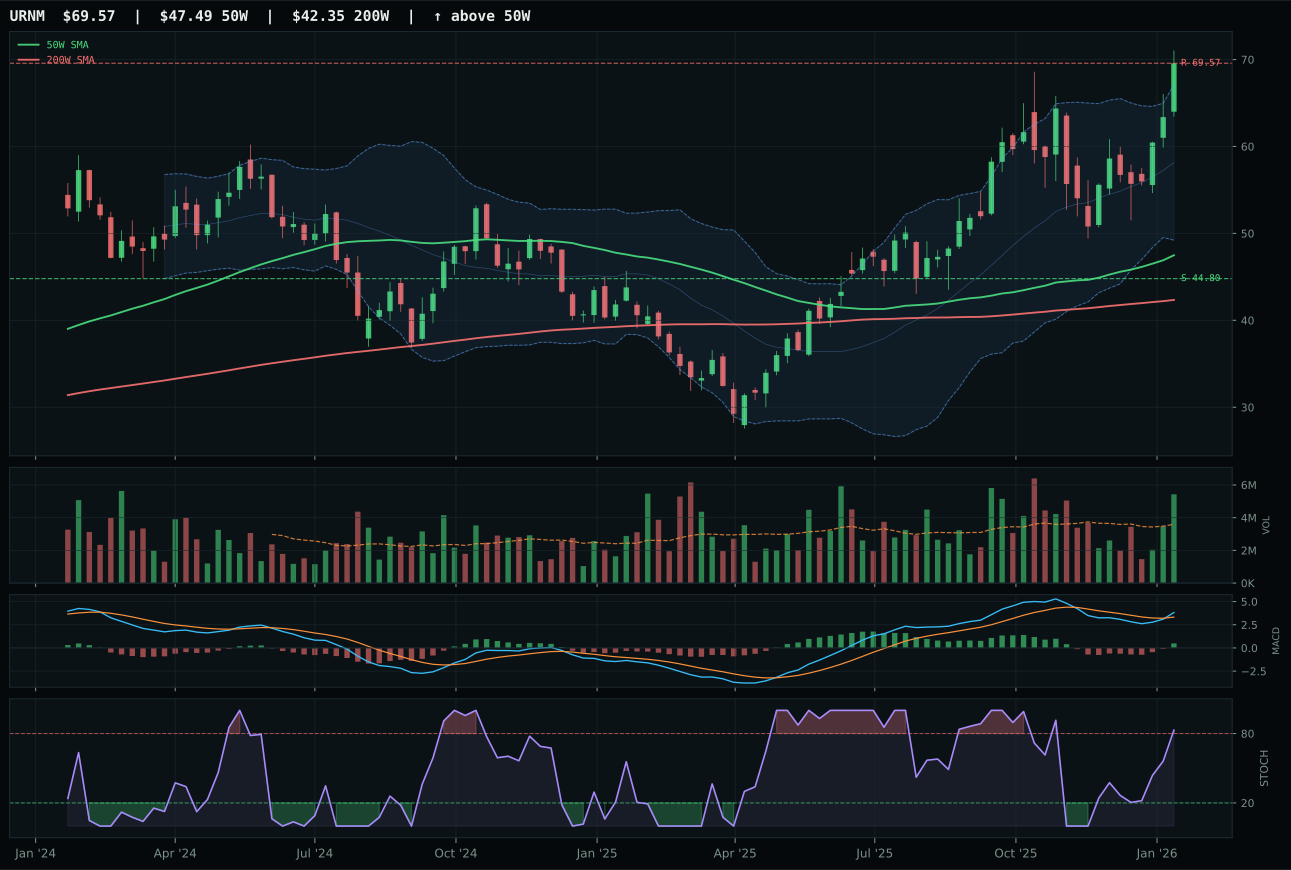
URNM has a vertical extension profile with 12.6% 13-week relative strength versus SPY.
A failed hold above support would weaken the setup.
Actionable but governed by invalidation levels.
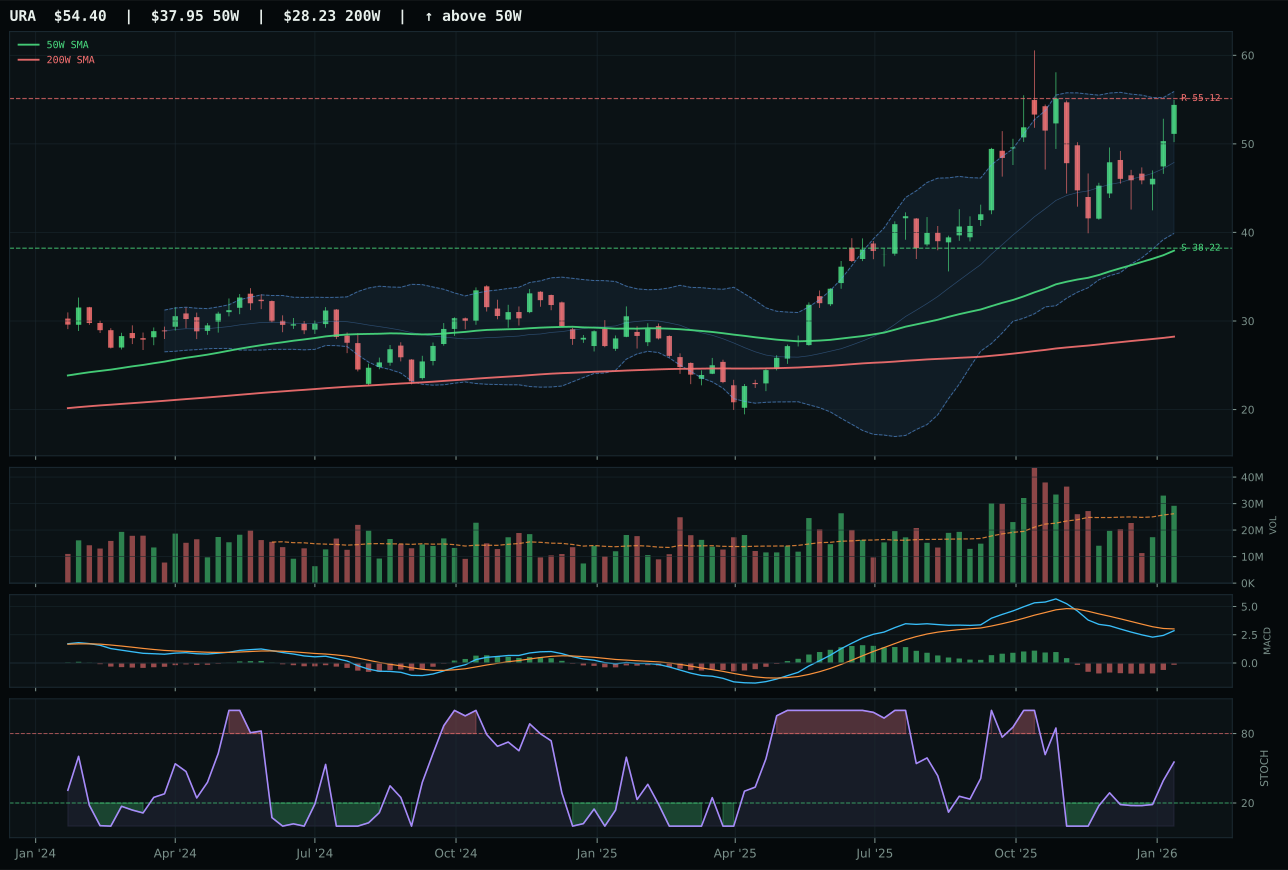
URA has a vertical extension profile with -2.1% 13-week relative strength versus SPY.
A failed hold above support would weaken the setup.
Actionable but governed by invalidation levels.
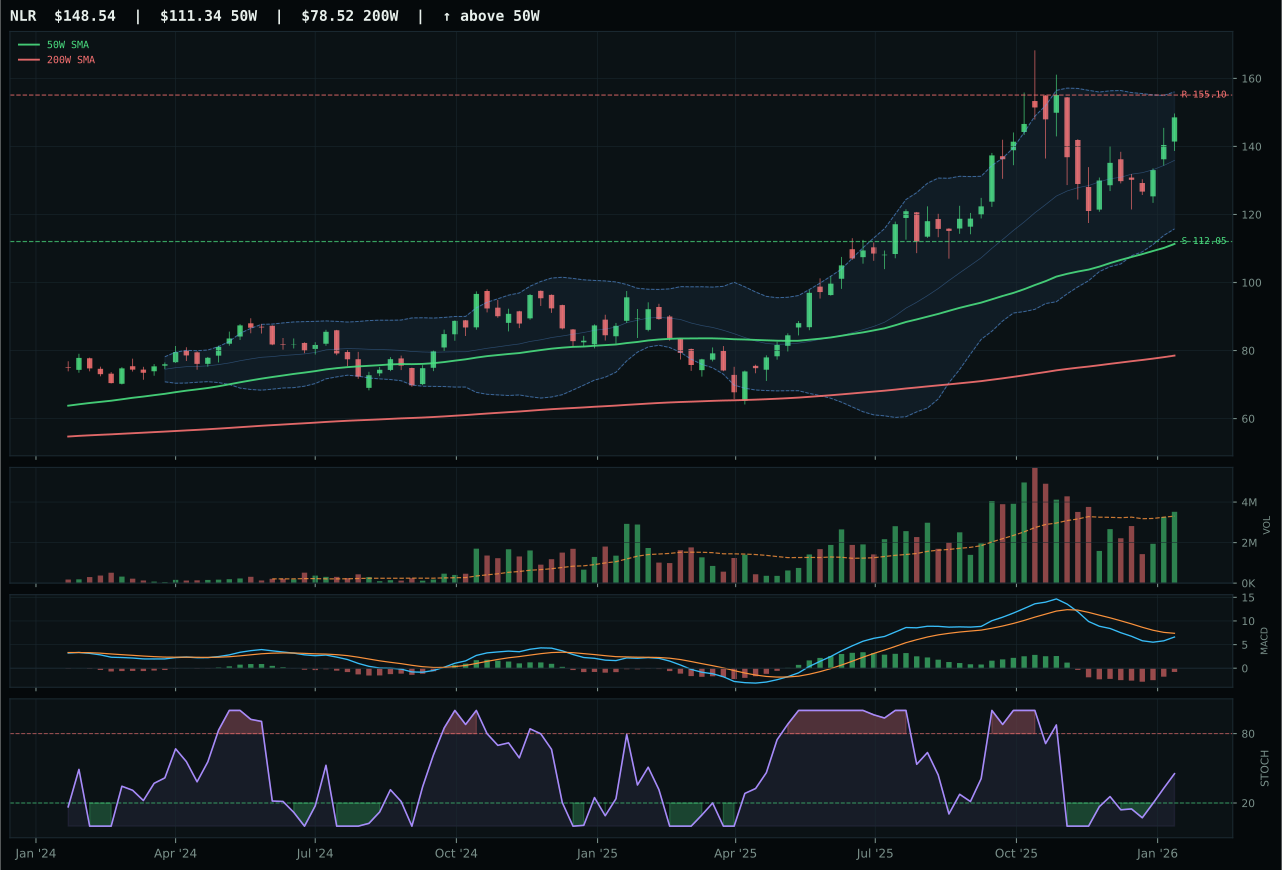
NLR has a vertical extension profile with -6.0% 13-week relative strength versus SPY.
A failed hold above support would weaken the setup.
Actionable but governed by invalidation levels.
URNM wins with a 5.9-point margin because it delivers both superior category-relative strength (14.7% vs URA's 0.0%) and dramatically better technical confirmation across the board. URNM's 16.7% 13-week return matches URNM's overbought stochastic RSI (0.83) and bullish-improving MACD with volume accumulation at 1.51x the 20-week average and perfect 100.0 momentum confirmation. Structure is rated 74.3 (vertical extension, 58.3 cleanliness), timing is 37.0 from 46.5% extension above the 50-week, and persistence is 94.7—the highest-conviction signal in the category. URA's 2.0% 13-week return is lifeless despite a similar 46.5% extension, MACD is bearish but improving (not bullish and improving), volume is only above-average participation, and stochastic RSI is rising mid-zone rather than overbought momentum. The gap reflects URNM's pure technical and momentum superiority; it is the uranium-miner scarcity play with actual sponsorship.
Nuclear Energy earns a 10% allocation at a score of 56.5 because the macro fit is moderately positive at 69.0, driven by energy scarcity (+9), real asset sponsorship (+7), and AI growth sponsorship (+5), which offset the modest credit stress penalty (-5). URNM's 93.3 technical evidence is excellent, but the category ranks sixth among the ten, placing it below the top-4 conviction trades. The fundamental case for nuclear (energy transition, grid stability, AI power demand) is strategically sound, but the 16.7% 13-week return on URNM suggests the move is already partially pricing that thesis. To earn 20%, Nuclear would need either macro clarification (explicit grid modernization policy, capex confirmation) or evidence that the volume accumulation is broadening beyond URNM to PICK or COPX-like breadth. Currently it is a solid exposure with real scarcity sponsorship but not yet a top-2 conviction trade.
Utilities & Infrastructure — XLU
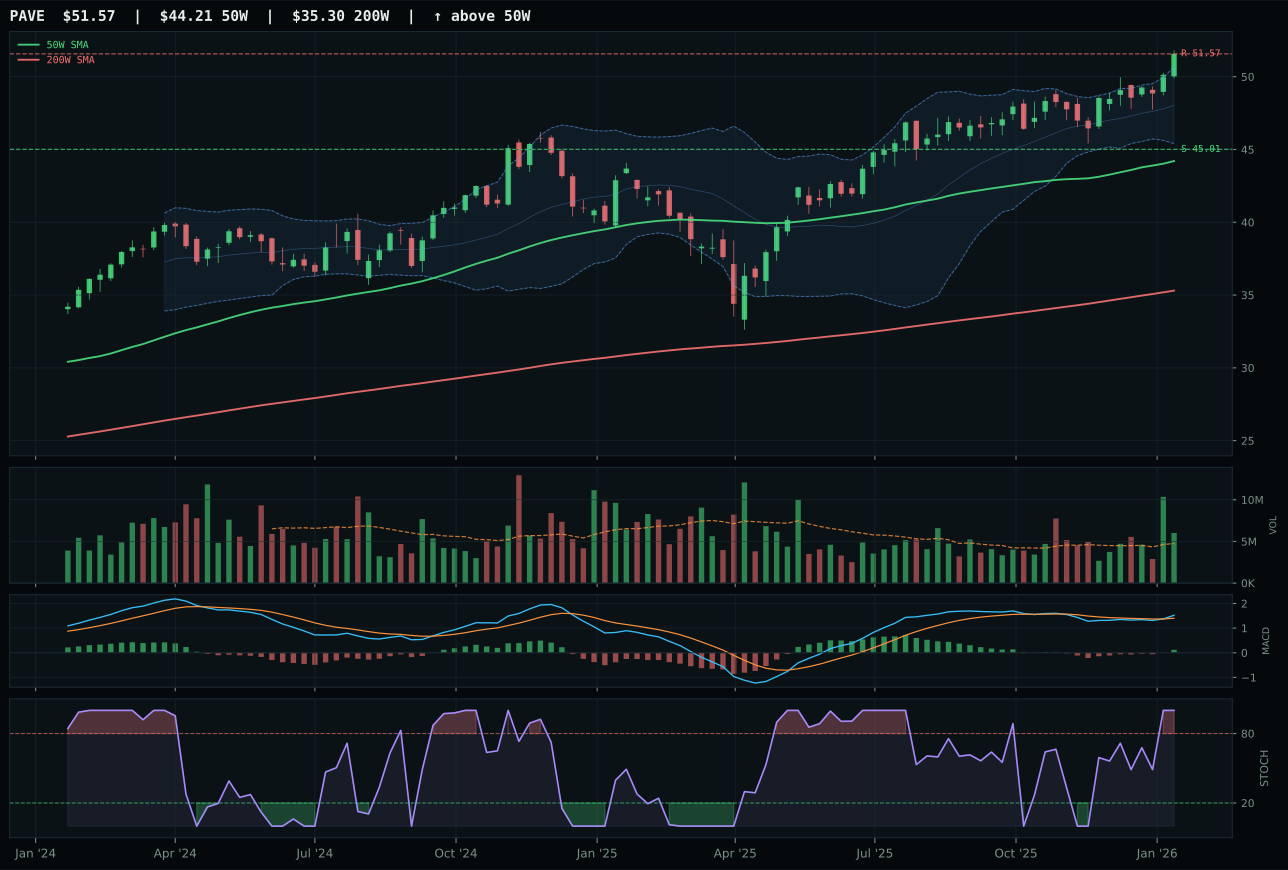
PAVE has a vertical extension profile with 5.2% 13-week relative strength versus SPY.
A failed hold above support would weaken the setup.
Actionable but governed by invalidation levels.
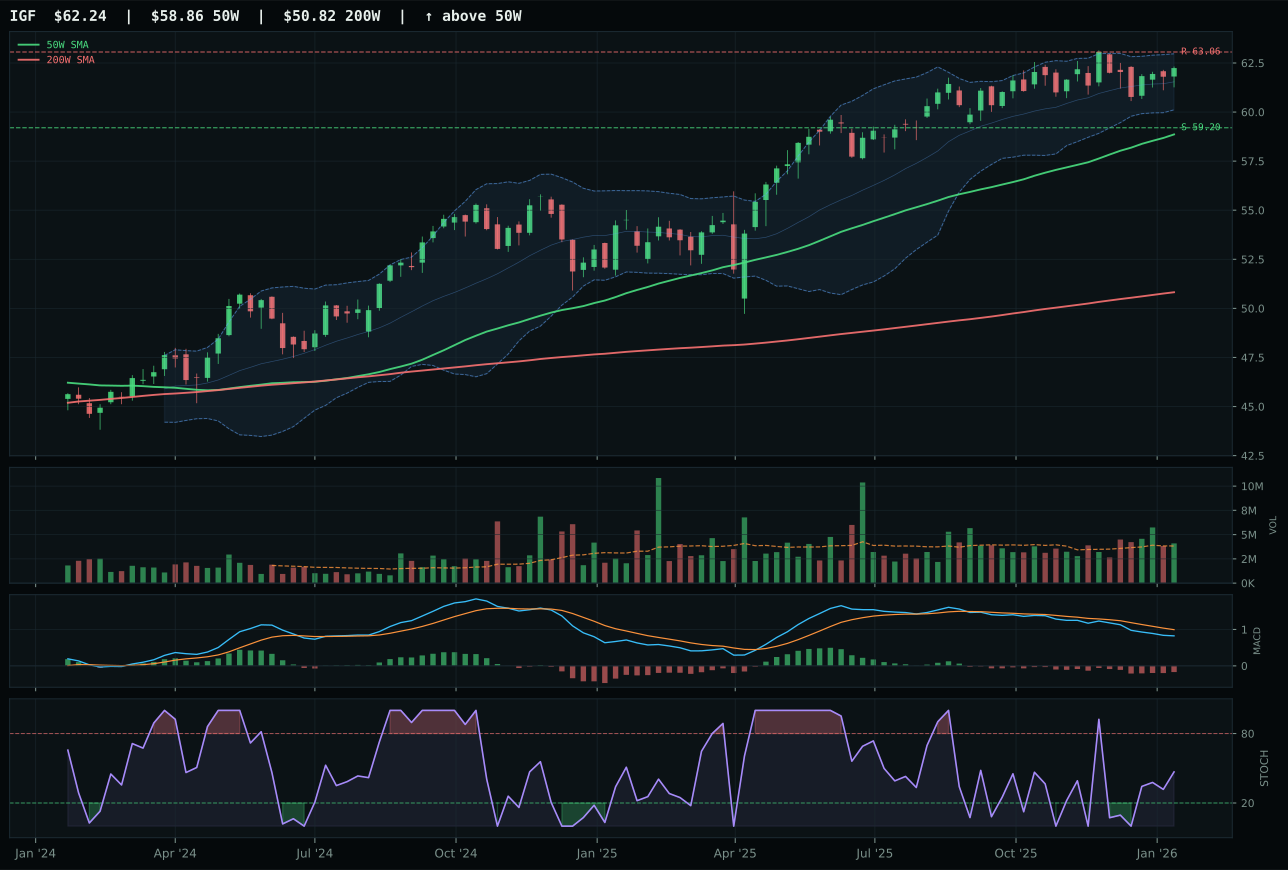
IGF has a neutral structure profile with -3.8% 13-week relative strength versus SPY.
A failed hold above support would weaken the setup.
Actionable but governed by invalidation levels.
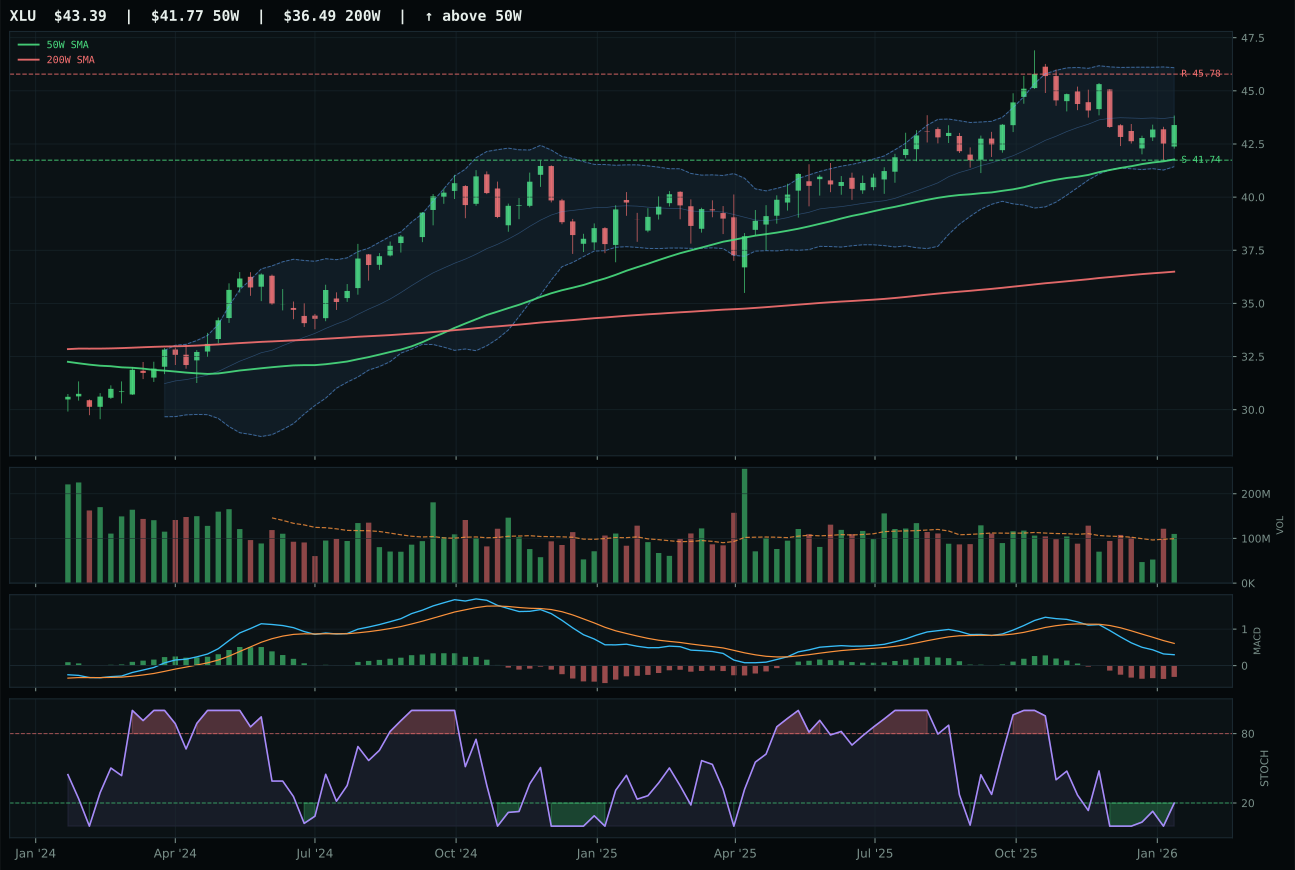
XLU has a pullback into support profile with -9.3% 13-week relative strength versus SPY.
A failed hold above support would weaken the setup.
Actionable but governed by invalidation levels.
XLU wins because it owns the only timing advantage that matters: pullback into support with oversold stochastic RSI turning up (0.20) and MACD bearish but improving. In a category where the macro regime penalizes extension, XLU's 3.9% distance from the 50-week is a feature, not a bug, and the defined support at 41.74 gives the setup an invalidation level. The timing score of 100.0 is earned because XLU is positioned in the upper retracement/momentum zone near Fib 0.236—textbook mean-reversion entry risk. The -5.2% 13-week return and -9.3% SPY relative strength are liabilities, but the risk/reward at 68.7 (best in the category) and the improving MACD signal that the selling is exhausting. PAVE shows superior technicals (88.2 evidence, 100.0 trend, overbought momentum), but it sits 16.7% extended above the 50-week with no timing advantage and weaker risk/reward at 46.9; it is a continuation trade while XLU is a reversal coil. The 6.9-point gap reflects XLU's timing and risk/reward edge.
Utilities & Infrastructure earns a 10% allocation at a score of 55.8 despite ranking eighth among the ten categories because the technical setup (63.1 evidence) offers genuine mean-reversion convexity that fits the Transition / Mixed regime. The macro fit is weak at 46.0, with inflation pressure active and negative (-6) and risk appetite positive also modestly negative (-2), creating headwinds. However, XLU's oversold stochastic RSI turn-up and pullback-into-support structure represent the only authentic reversal setup in the portfolio—meaningful drawdown with defined support and improving MACD. This is a smaller allocation that survives because it offers different risk exposure (short volatility, reversion to mean) rather than momentum or growth sponsorship. To earn higher allocation, Utilities would need either the macro regime to shift toward defensive positioning or evidence that the mean-reversion coil is filling with institutional accumulation volume; currently the volume signal is only above-average participation. Hold XLU as a tactical reversal trade and macro hedge into risk-appetite weakness.
Agriculture & Livestock — MOO
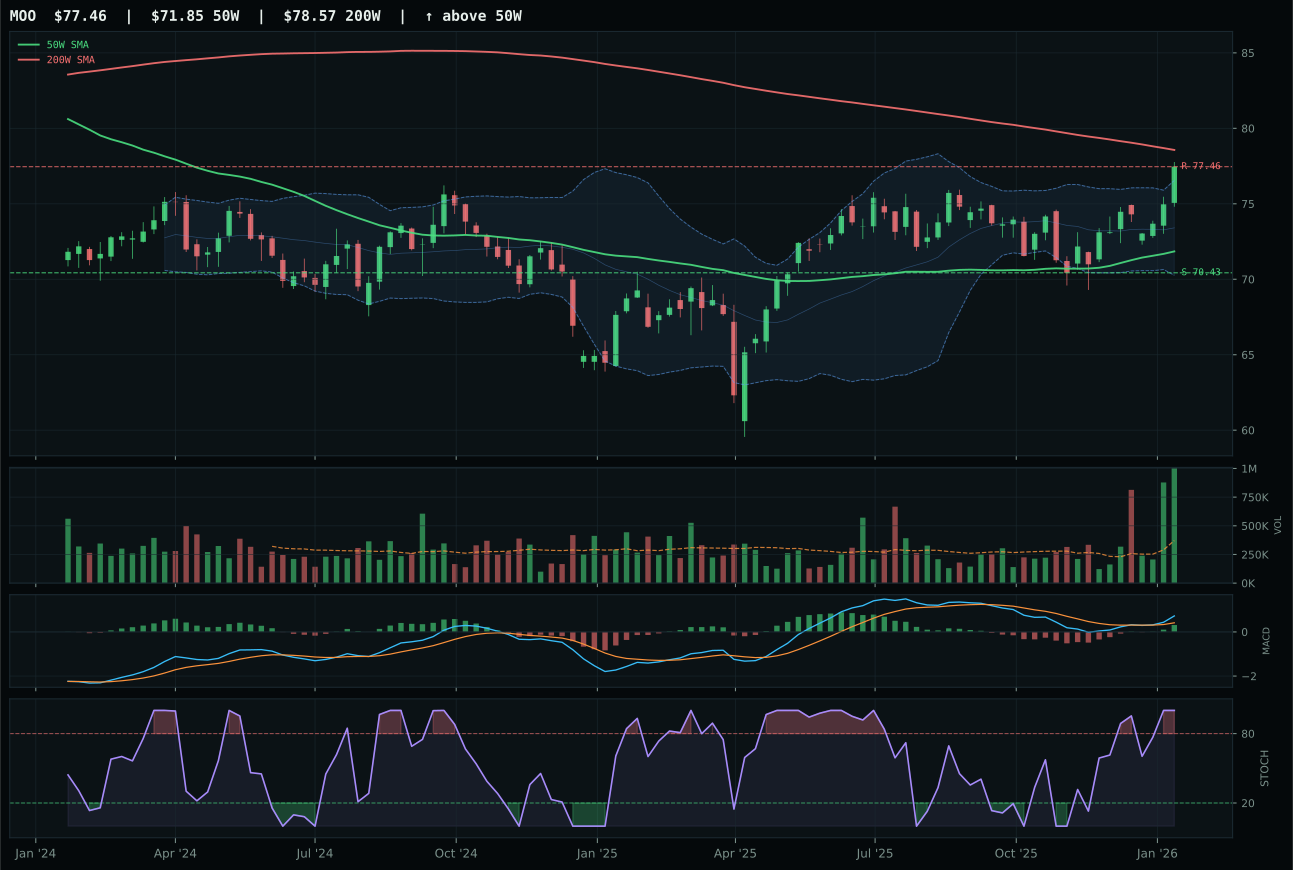
MOO has a neutral structure profile with 2.0% 13-week relative strength versus SPY.
A failed hold above support would weaken the setup.
Actionable but governed by invalidation levels.
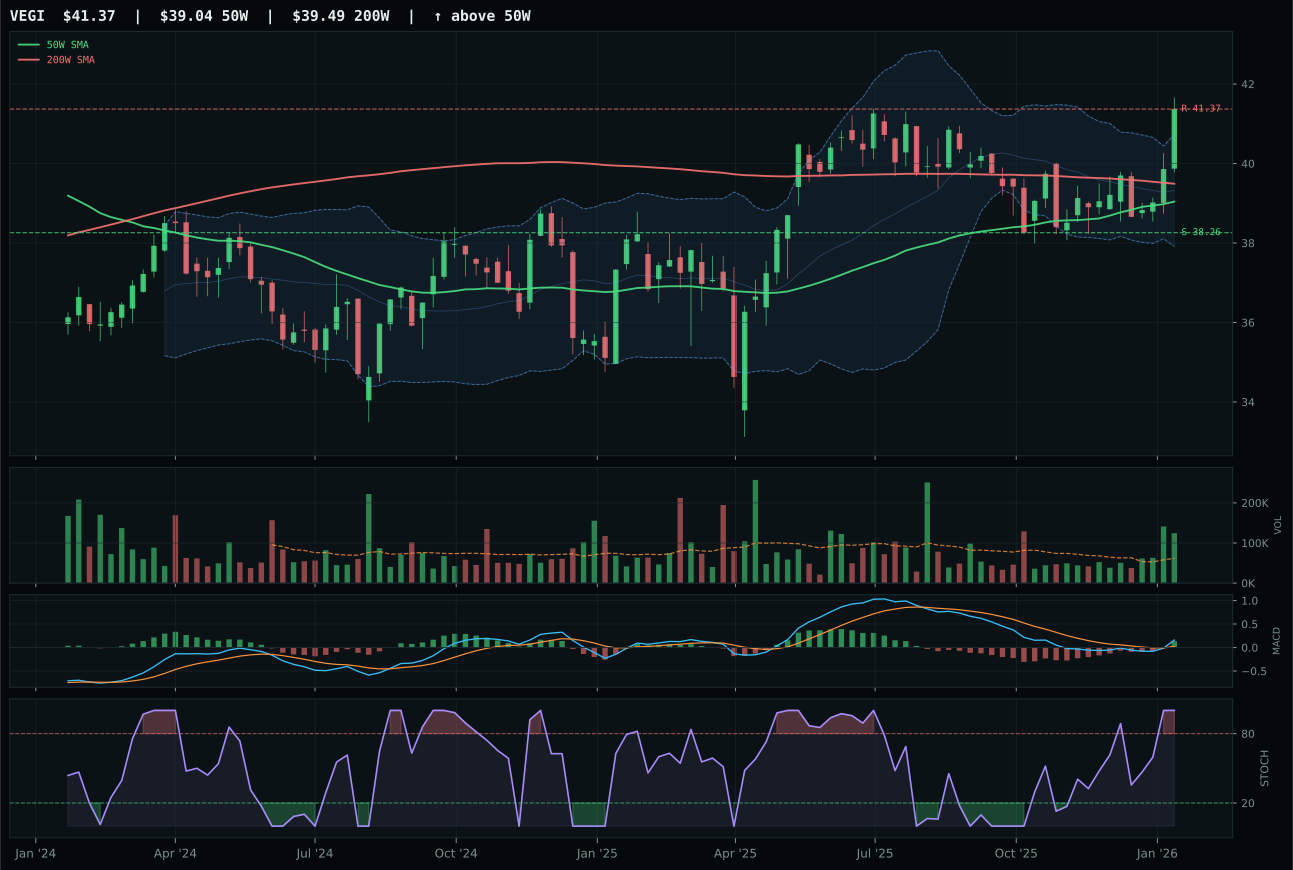
VEGI has a neutral structure profile with 1.8% 13-week relative strength versus SPY.
A failed hold above support would weaken the setup.
Tracked, but not top-2 eligible because: .
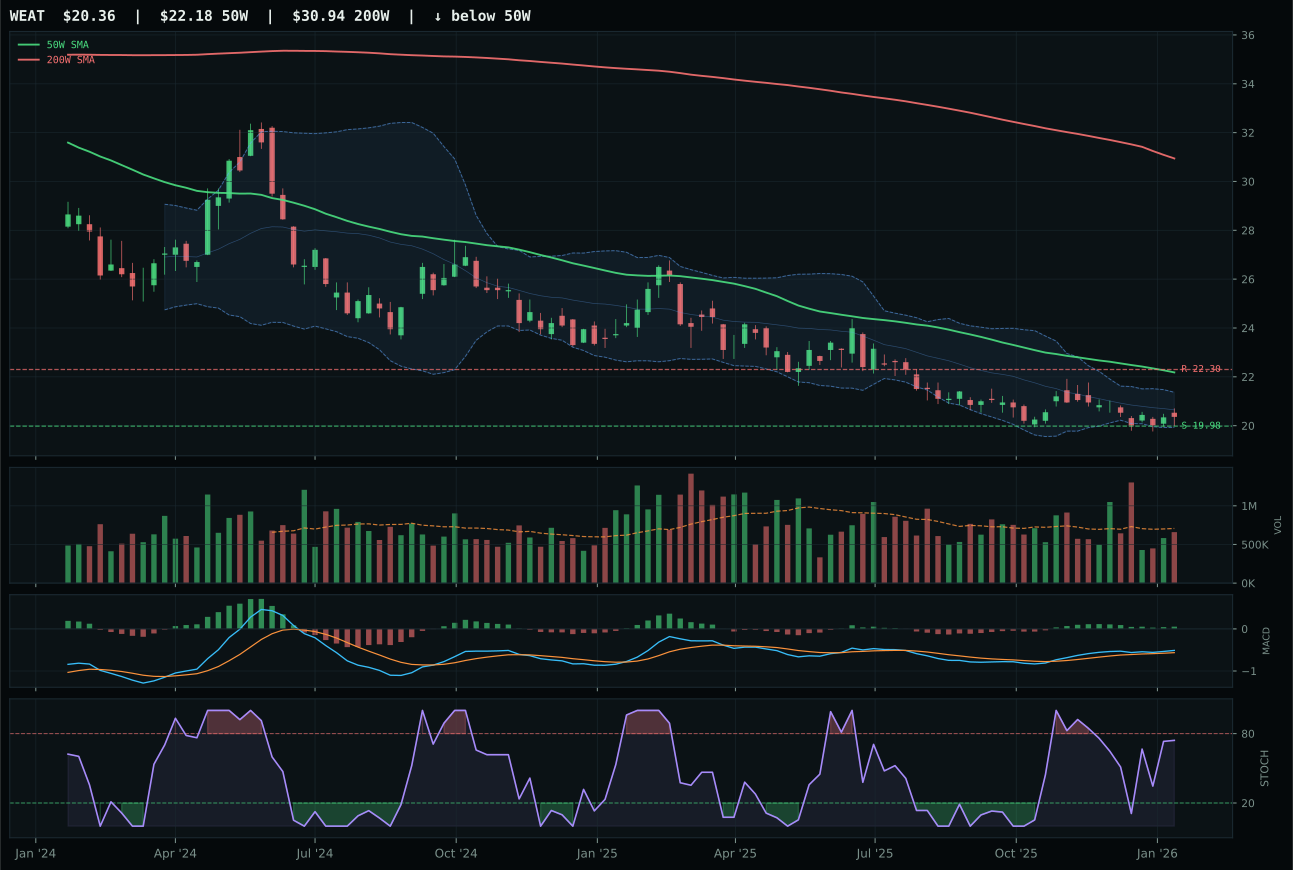
WEAT has a pullback into support profile with -3.6% 13-week relative strength versus SPY.
Extension and support failure are the main tactical risks.
Tracked, but not top-2 eligible because: structurally broken.
MOO wins with a commanding 14.8-point margin over VEGI because its technical evidence is superior across the board: trend at 83.0 (price above the 50-week despite sitting below the 200-week), structure cleanliness at 58.3, and critically, it is the only name showing 0.2% category-relative strength versus VEGI's 0.0%. More important, MOO's volume signal is unmistakable: 4.85x the 20-week average—the heaviest accumulation in the category—combined with overbought stochastic RSI (1.00) and bullish-improving MACD. This is not margin-of-error territory; MOO is being actively accumulated across supply shortage and inflation pressure themes at a pace that suggests institutional conviction about agricultural input scarcity. VEGI matches MOO on MACD and stochastic RSI but shows the same category-relative leadership (0.0%) without the volume punch; it is a macro play without the confirmation. The 14.8-point gap reflects MOO's pure technical and volume superiority.
Agriculture & Livestock scored 47.2 and earned zero allocation, ranking 9th or 10th despite exceptional macro fit of 86.0/100 driven by +13 for supply shortage, +10 for inflation pressure, and +8 for real asset sponsorship. The paradox reveals the system's design: technical evidence weighs 62% and macro only 38%, and MOO's 6.1% 13-week return and 2.0% SPY-relative strength simply cannot compete when Industrial Metals and Precious Metals are delivering 24.8% and 72.4% 13-week returns respectively. A strong macro narrative cannot overcome weak equity price action; if agriculture prices were truly scarce, the ETF would be confirming that through price momentum. The category sits in reserve: if commodity leadership broadens beyond metals and energy toward grains and livestock, MOO's setup offers a 10% upside to resistance and 10% downside to support—good asymmetry for a future rotation.
Technology — XLK
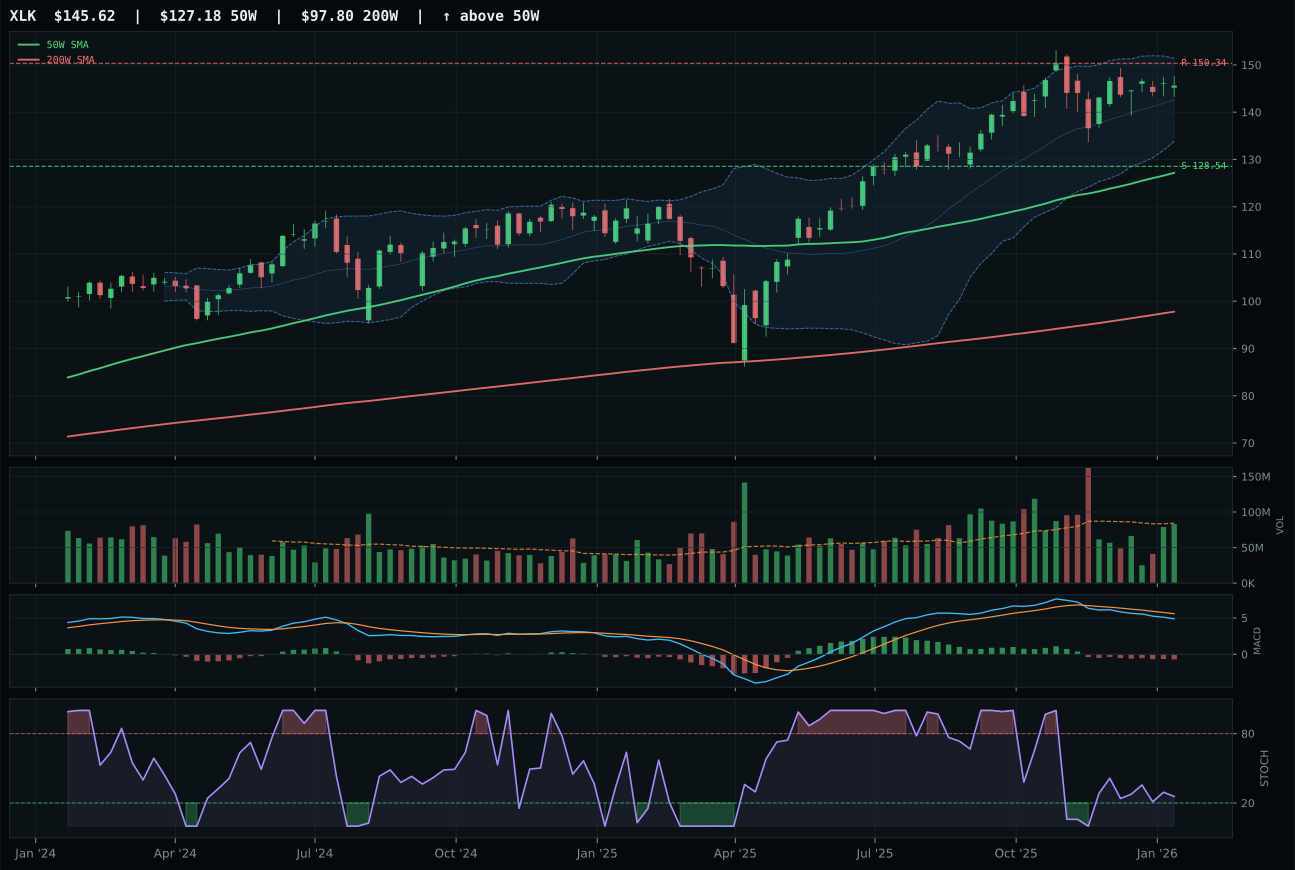
XLK has a neutral structure profile with -1.9% 13-week relative strength versus SPY.
A failed hold above support would weaken the setup.
Actionable but governed by invalidation levels.
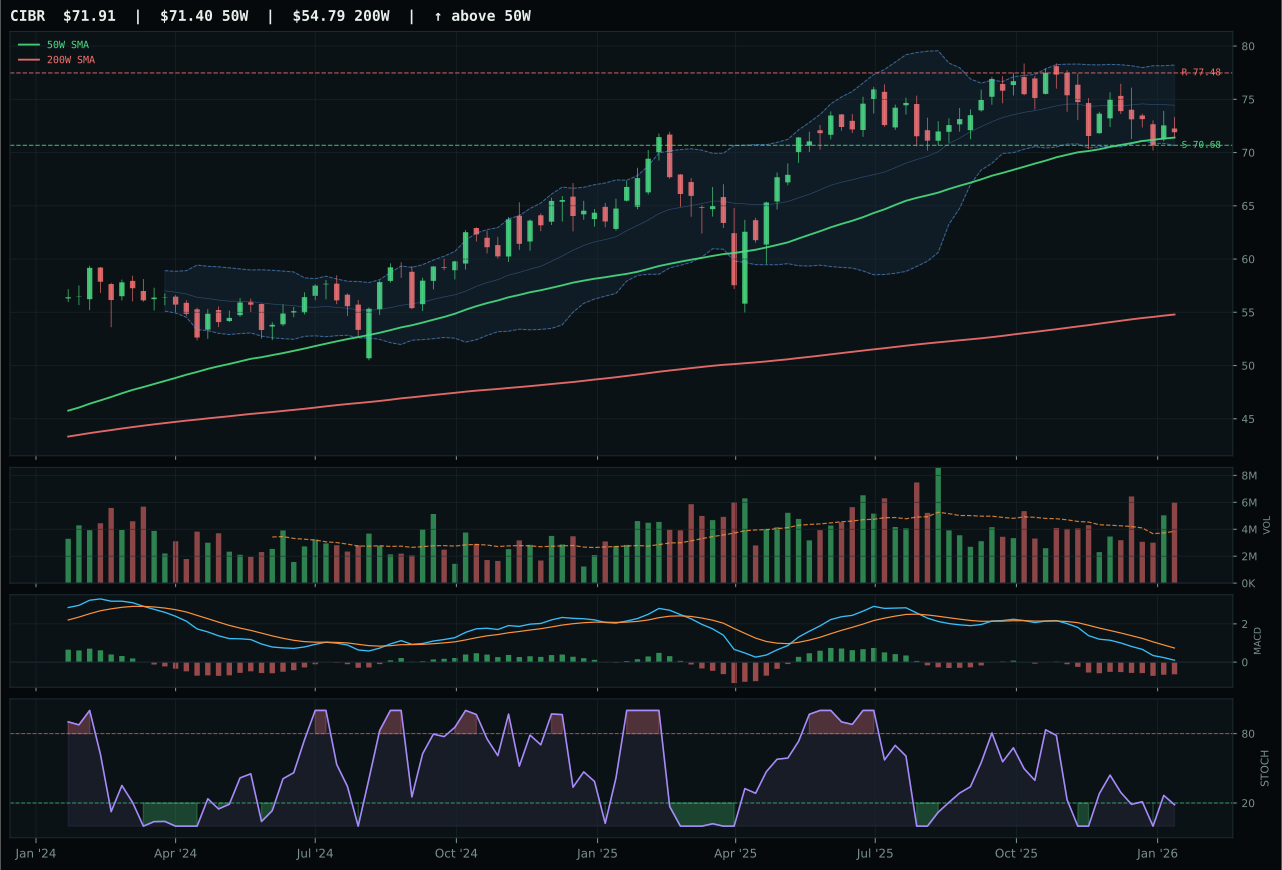
CIBR has a pullback into support profile with -8.4% 13-week relative strength versus SPY.
A failed hold above support would weaken the setup.
Actionable but governed by invalidation levels.
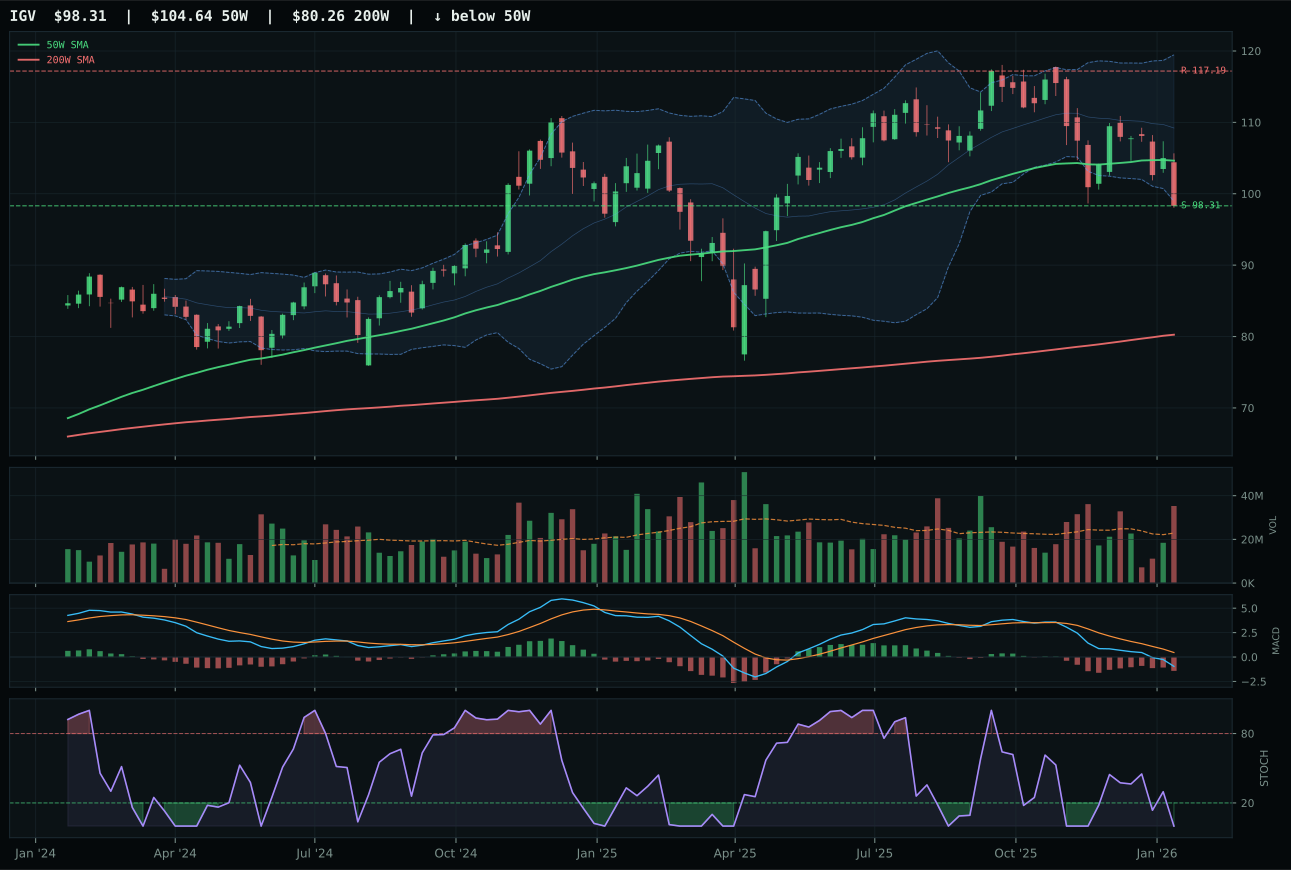
IGV has a pullback into support profile with -16.9% 13-week relative strength versus SPY.
A failed hold above support would weaken the setup.
Actionable but governed by invalidation levels.
XLK wins because it owns the only positive relative strength story inside the category basket, posting 6.5% outperformance versus the median while CIBR and IGV are underwater versus both SPY and peers. The 50-week slope is steady at 0.5%, price sits 14.5% above the 50-week moving average in a neutral structural setup, and MACD is weakening—but the category-relative strength advantage combined with neutral volume at 0.98x the 20-week average gives XLK the edge as the only broad profitable technology name not fighting distribution or momentum collapse. CIBR's setup is technically superior on paper (oversold stochastic, pullback into support), but its -8.4% relative strength disadvantage versus SPY and 0.0% category ranking mean it's a coil with uncertain sponsorship. The gap is tight at 1.7 points, reflecting a category in transition rather than conviction.
Technology earned zero allocation and ranked 9th or 10th across the portfolio this week, disqualified by weak macro fit despite technical eligibility. The 63.0/100 category-level macro score—driven by liquidity expansion and risk appetite both active—could not overcome the 62% weight on technical evidence showing -1.9% SPY-relative weakness and only 2.2% 13-week return. Credit stress (-7 points) and inflation pressure (-4 points) created structural headwinds that no pullback into support can fix in a Transition/Mixed regime where capital is rotating into commodity scarcity and real assets. For Technology to earn a 10% slot, SMH's semiconductor leadership would need to break decisively into the top-2 categories, or XLK would need to show SPY-relative strength materially above zero—a bar it has not cleared since early December.