
2026-01-09
Informational purposes only. The content in this report, including allocations, analysis, and commentary, is provided solely for informational and educational purposes. It does not constitute financial advice, investment advice, trading advice, or any other type of advice. Past performance does not guarantee future results. Always conduct your own research and consult a qualified financial professional before making investment decisions.
Weekly Allocation
| Ticker | Category | Weight | Role |
|---|---|---|---|
| REMX | Industrial Metals | 20% | Top-2 (20%) |
| SMH | AI | 20% | Top-2 (20%) |
| IEMG | Emerging Markets | 10% | Tier-2 (10%) |
| SLV | Precious Metals | 10% | Tier-2 (10%) |
| XAR | Defense & Aerospace | 10% | Tier-2 (10%) |
| URNM | Nuclear Energy | 10% | Tier-2 (10%) |
| XLK | Technology | 10% | Tier-2 (10%) |
| PAVE | Utilities & Infrastructure | 10% | Tier-2 (10%) |
Trade Instructions — Monday Open
Sell the tranche from 2025-12-12 (completing its 4-week hold). Buy the new tranche. Instructions show net portfolio changes — same-asset positions cancel, weight changes show the delta.
| Action | Ticker | Instruction |
|---|---|---|
| SELL | SLV | Sell 14% of SLV position (reduce 17.50% → 15.00%) |
| SELL | COPX | Sell 25% of COPX position (reduce 20.00% → 15.00%) |
| SELL | BOTZ | Sell 50% of BOTZ position (reduce 5.00% → 2.50%) |
| SELL | IGV | Sell 33% of IGV position (reduce 7.50% → 5.00%) |
| SELL | XLE | Sell entire XLE position (2.50% of portfolio) |
| BUY | SMH | Buy SMH — 33.33% of freed cash (adds 5.00% to portfolio) |
| BUY | IEMG | Buy IEMG — 16.67% of freed cash (adds 2.50% to portfolio) |
| BUY | XLK | Buy XLK — 16.67% of freed cash (adds 2.50% to portfolio) |
| BUY | REMX | Buy REMX — 33.33% of freed cash (adds 5.00% to portfolio) |
Current Portfolio After Trade
Combined holdings across all 4 active tranches. Each tranche is 25% of the portfolio.
| Ticker | % of Portfolio | Weight Bar |
|---|---|---|
| COPX | 15.00% | |
| SLV | 15.00% | |
| IEMG | 12.50% | |
| PAVE | 10.00% | |
| SMH | 10.00% | |
| XAR | 7.50% | |
| IGV | 5.00% | |
| URNM | 5.00% | |
| URA | 5.00% | |
| XLK | 5.00% | |
| REMX | 5.00% | |
| BOTZ | 2.50% | |
| ITA | 2.50% |
Macro Regime — Transition / Mixed
Macro Evidence Charts
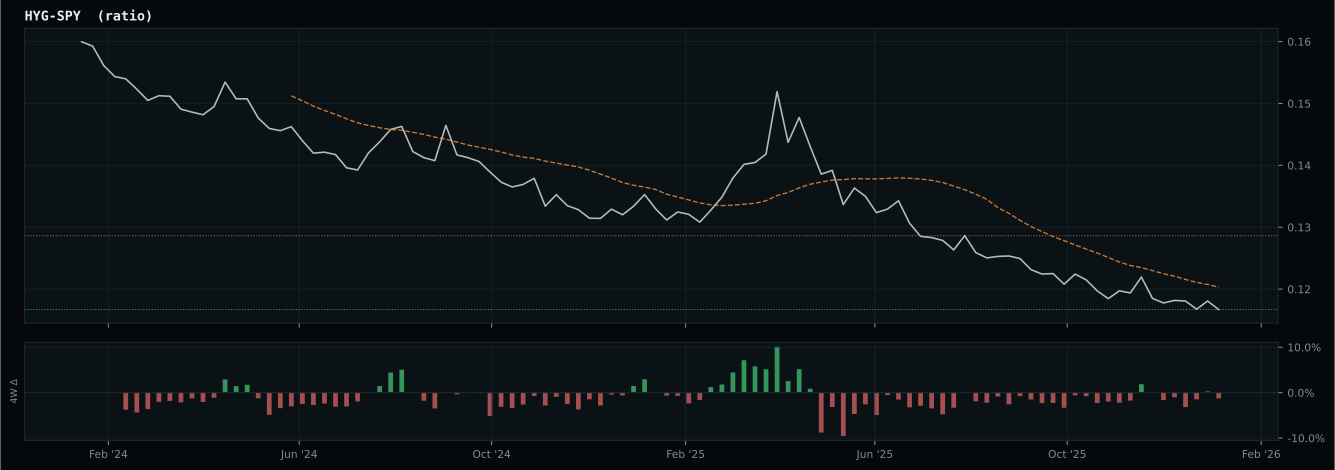
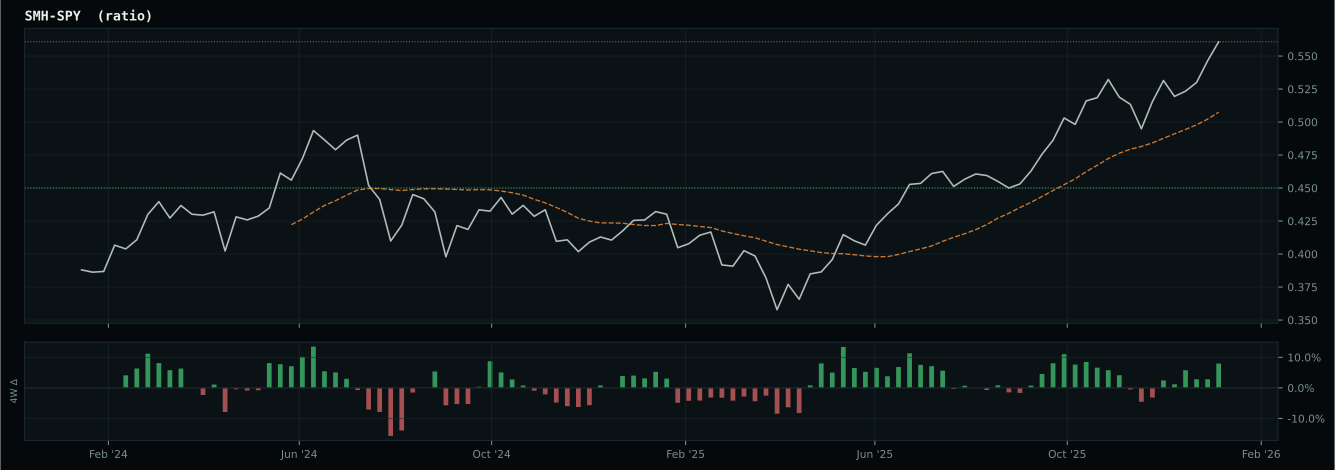
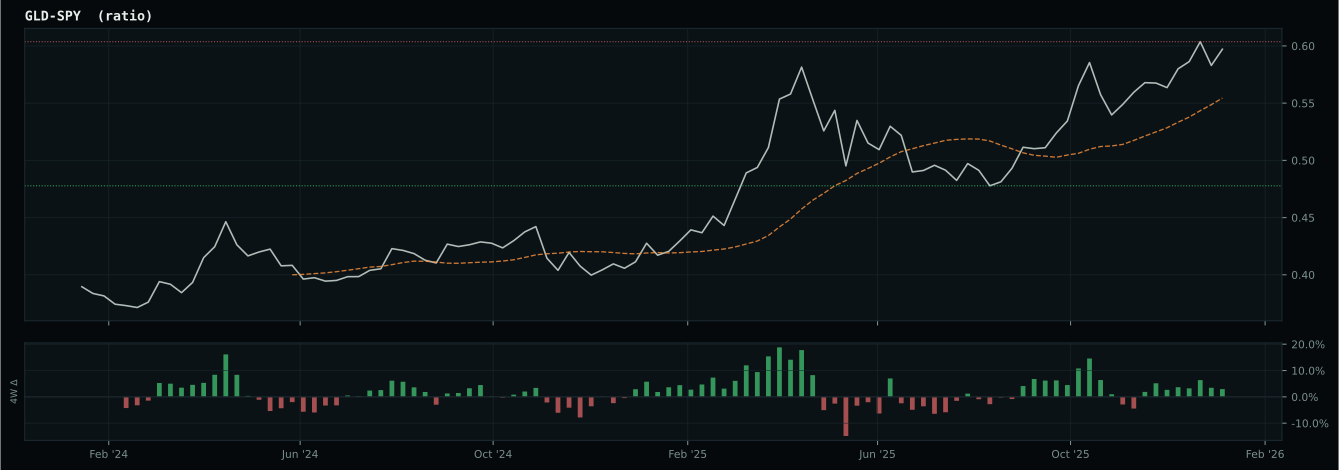
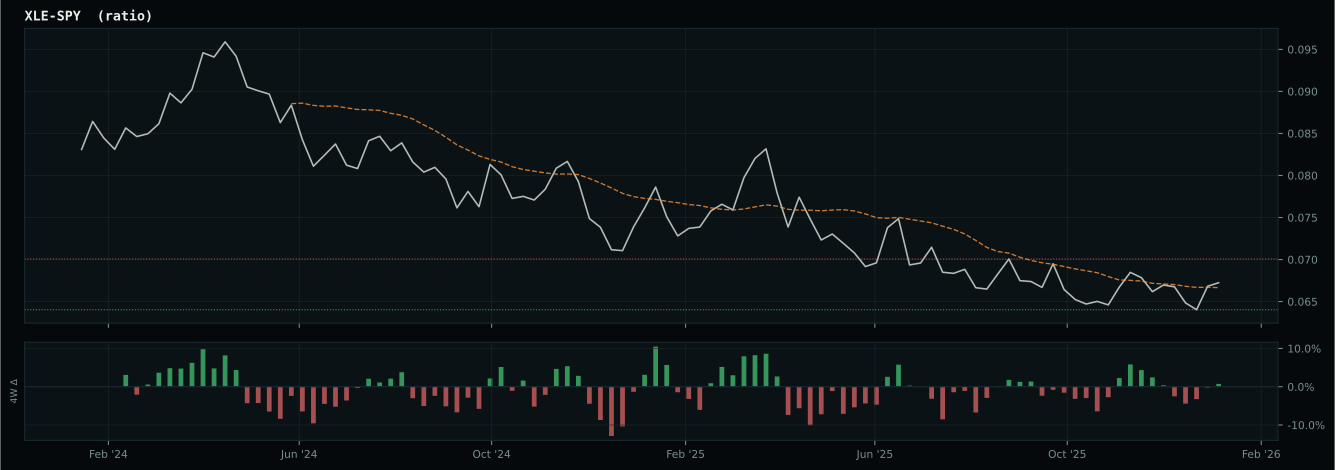
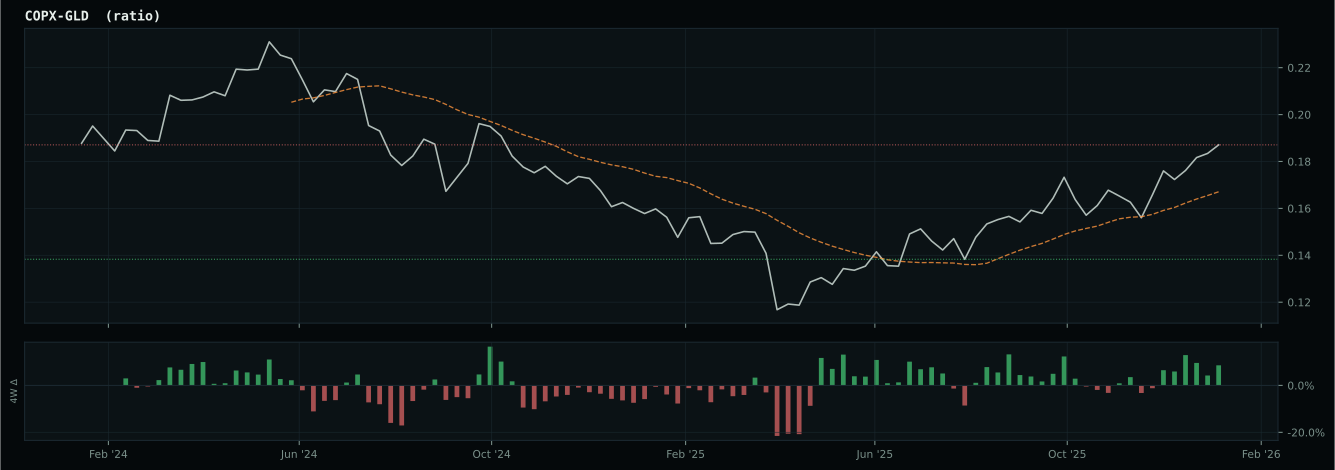
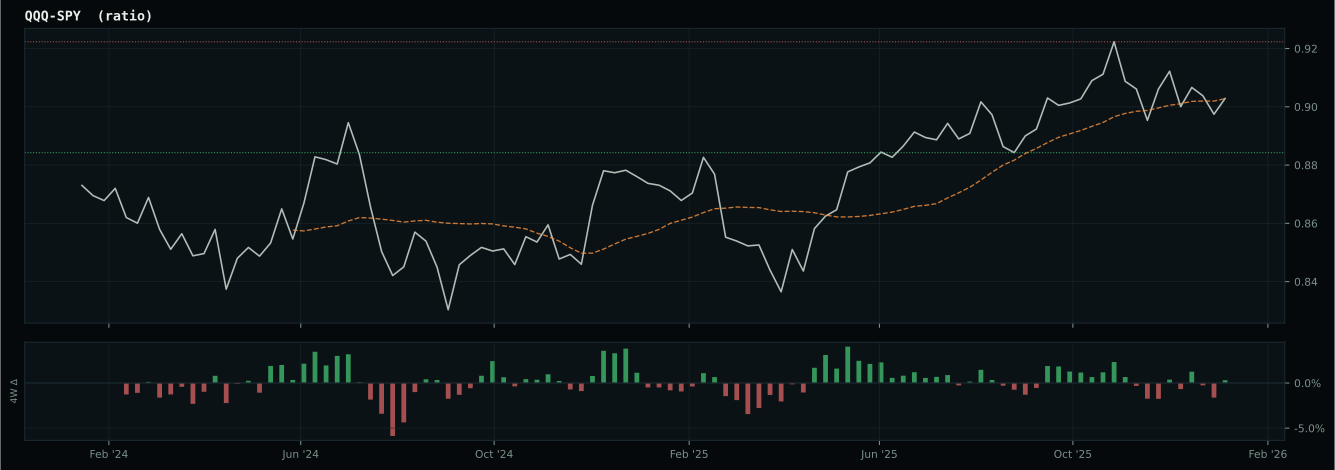
Market-implied signals behind the macro regime scores. Each ratio compares two assets; the direction and slope of the ratio is what the macro engine reads.
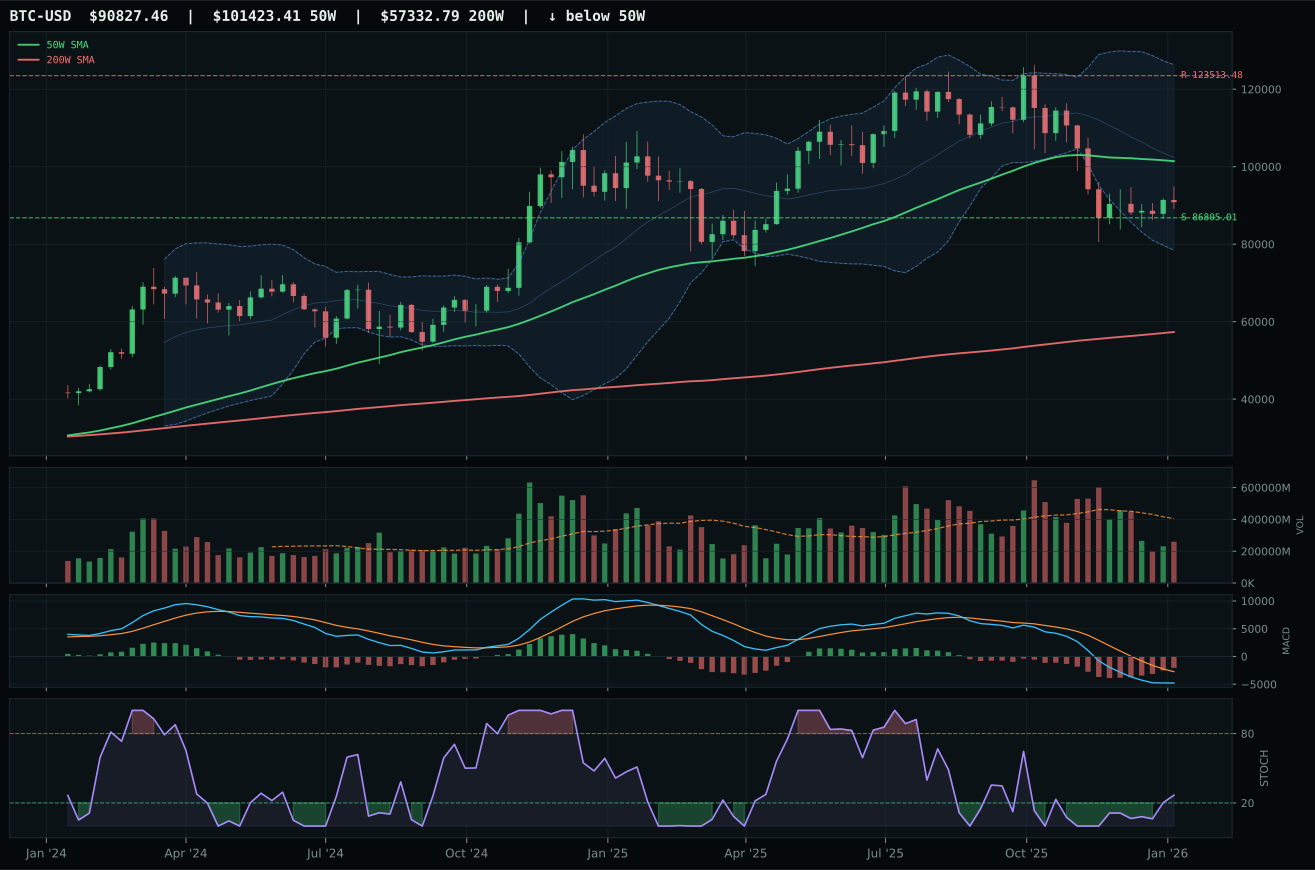
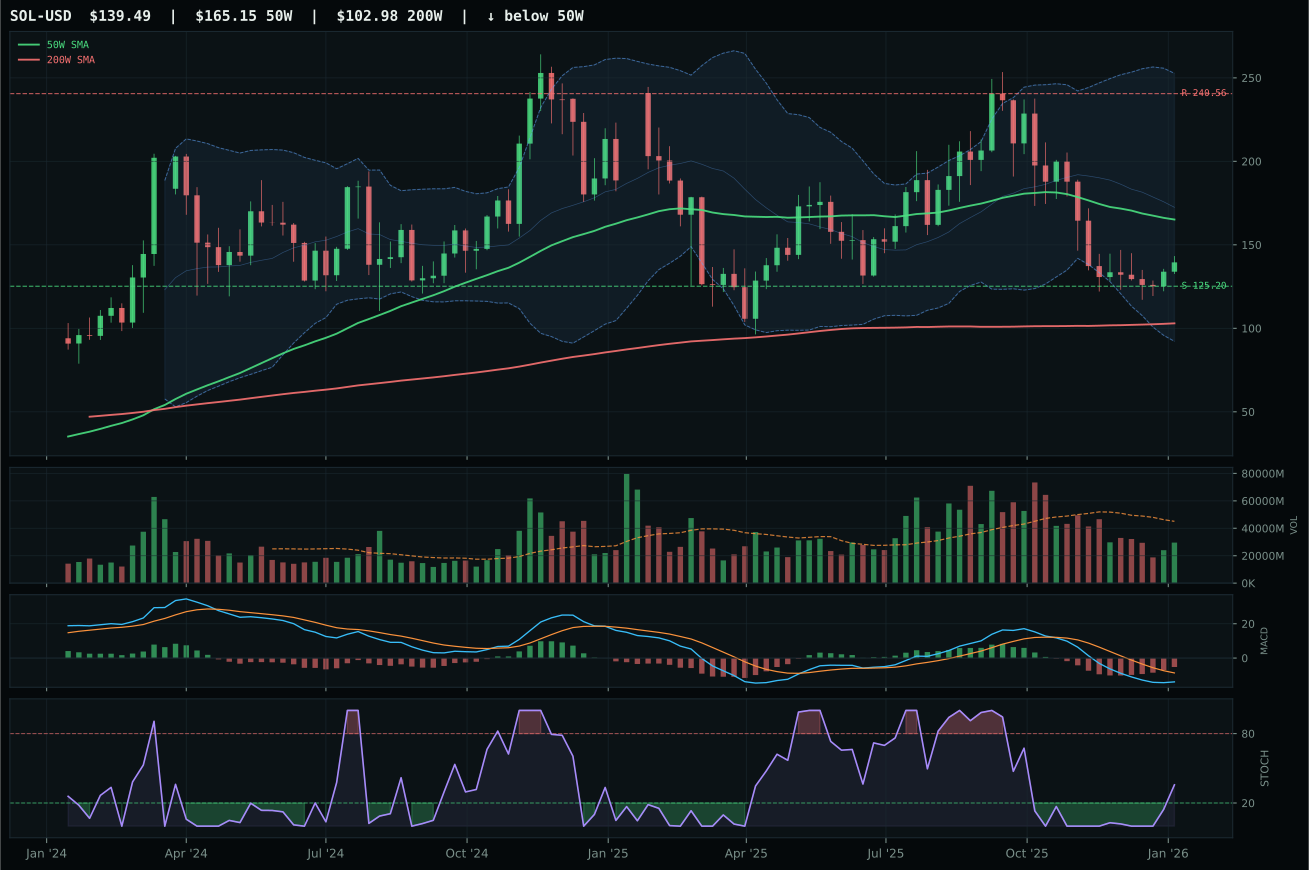
Crypto Regime — NoCrypto
ValueBTC not armed: BTC has not made the first post-breakdown touch of the 200W buy zone after losing the 50W
TrendBTC not confirmed
one or more available conditions failed
Category Rankings
| Rank | Category | Winner | Score | Alloc | 4W Ret | Peers (4W) |
|---|---|---|---|---|---|---|
| 1 | Industrial Metals | REMX | 84.1 | 20% | -0.55% | COPX +9.1% · PICK +8.5% |
| 2 | AI | SMH | 79.6 | 20% | +3.43% | BOTZ -2.4% · AIQ -4.5% |
| 3 | Emerging Markets | IEMG | 71.0 | 10% | +4.93% | ILF +13.5% · INDA +0.2% |
| 4 | Precious Metals | SLV | 68.0 | 10% | -4.24% | GDX +3.5% · GLD +9.5% |
| 5 | Defense & Aerospace | XAR | 61.6 | 10% | -2.22% | ITA +0.1% · ROKT +4.1% |
| 6 | Nuclear Energy | URNM | 51.0 | 10% | +7.70% | NLR +0.8% · URA +1.6% |
| 7 | Technology | XLK | 48.3 | 10% | -3.16% | CIBR -6.9% · IGV -20.9% |
| 8 | Utilities & Infrastructure | PAVE | 41.4 | 10% | +9.26% | IGF +6.7% · XLU +2.3% |
| 9 | Traditional Energy | XLE | 40.3 | 0% | +13.82% | XOP +13.9% · FCG +12.2% |
| 10 | Agriculture & Livestock | MOO | 38.6 | 0% | +10.80% | VEGI +11.1% · WEAT +0.6% |
Industrial Metals — REMX
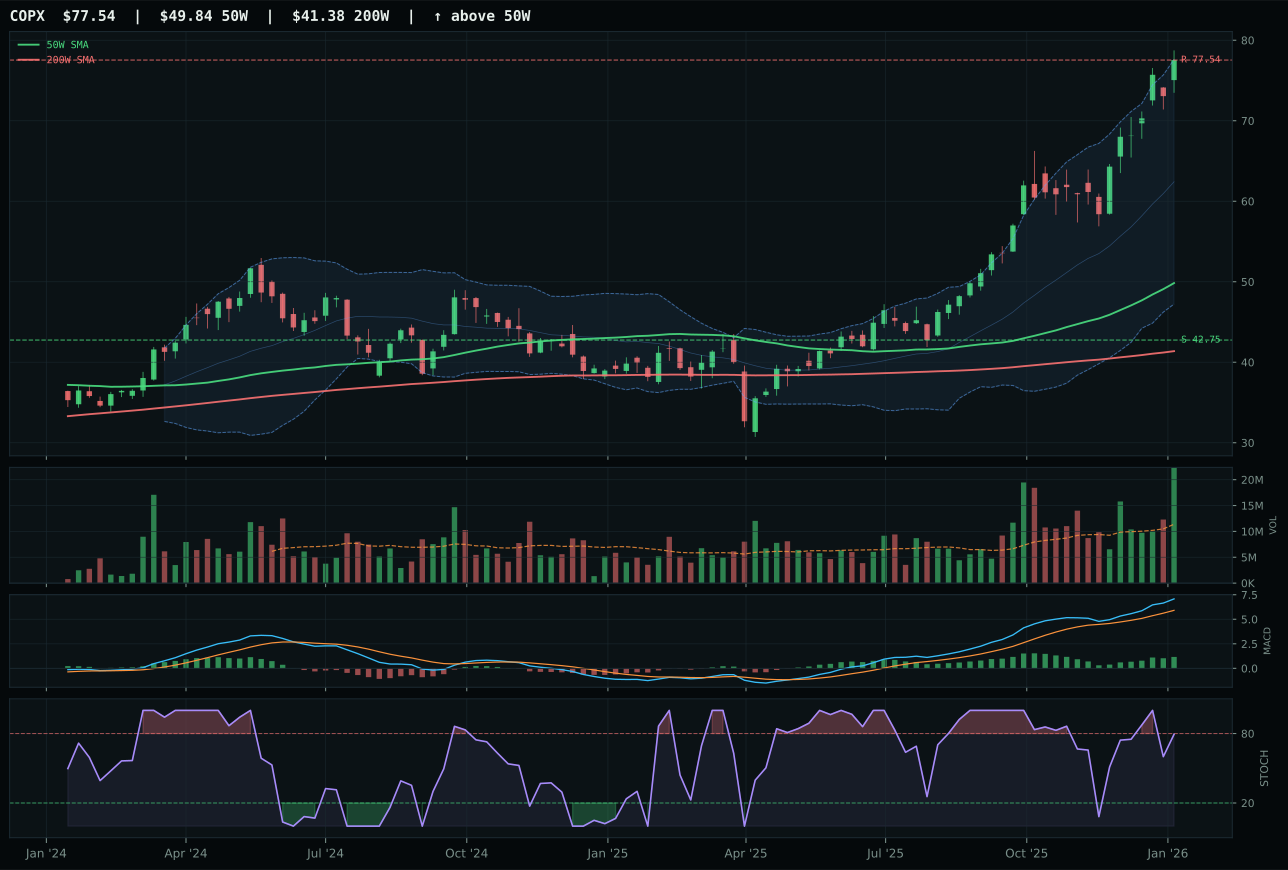
COPX has a vertical extension profile with 22.0% 13-week relative strength versus SPY.
A failed hold above support would weaken the setup.
Actionable but governed by invalidation levels.
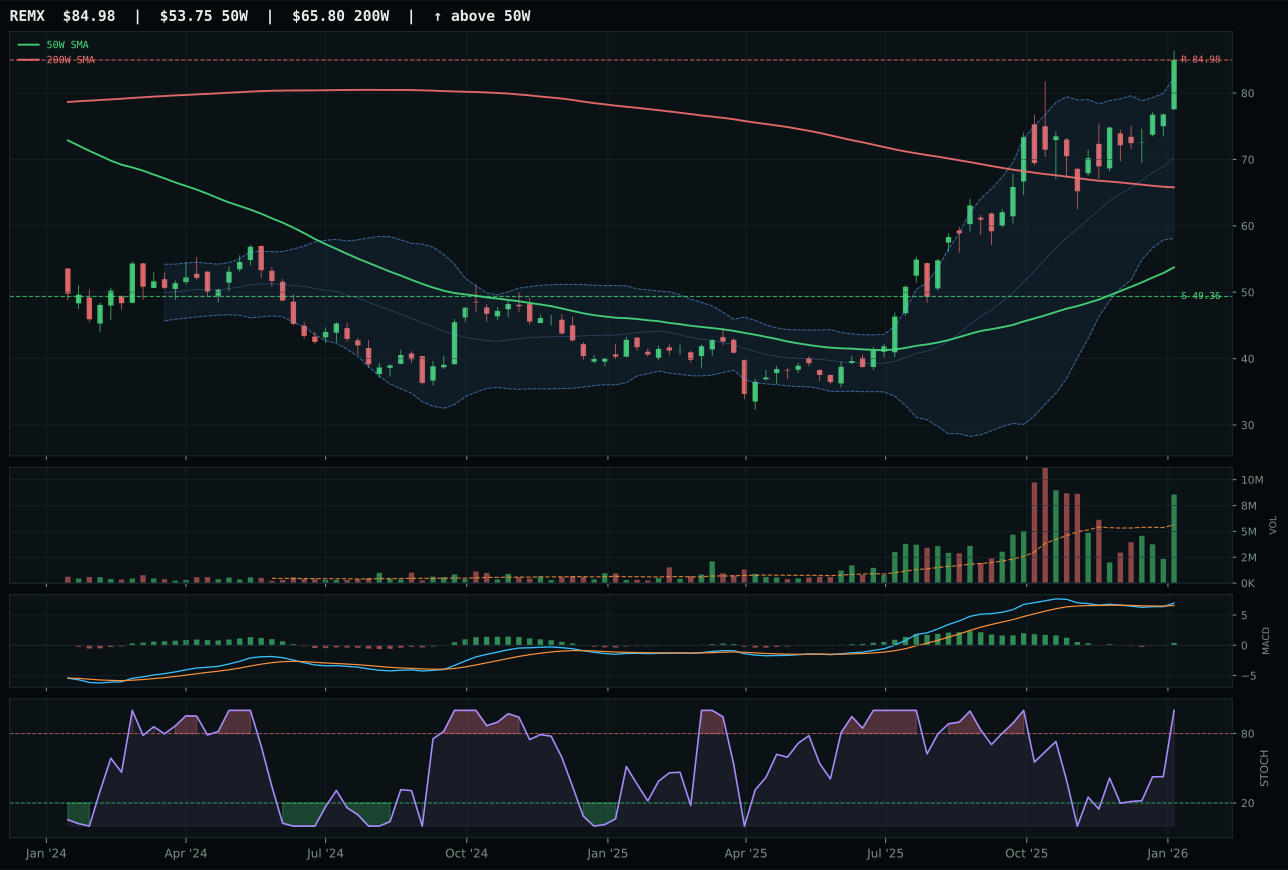
REMX has a vertical extension profile with 16.0% 13-week relative strength versus SPY.
A failed hold above support would weaken the setup.
Actionable but governed by invalidation levels.
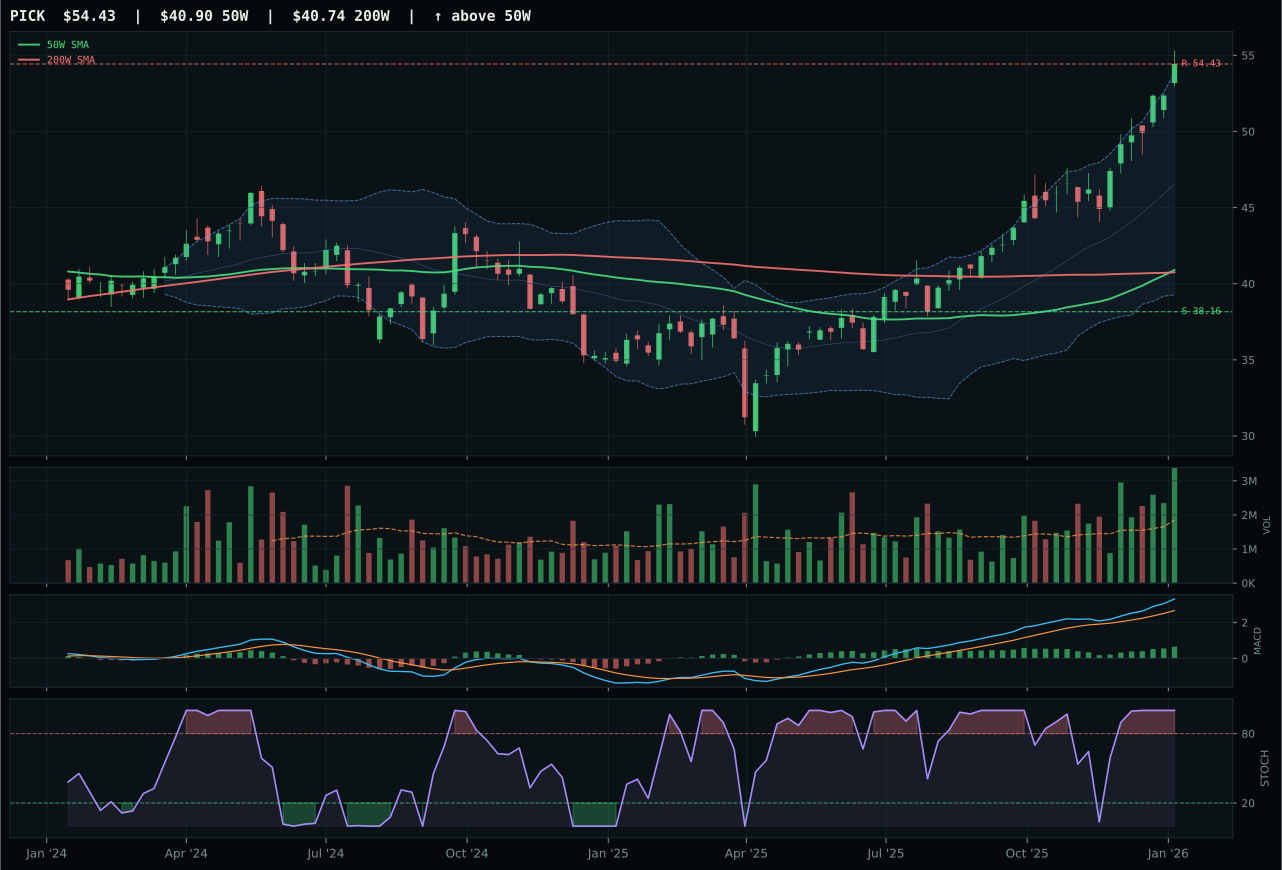
PICK has a vertical extension profile with 16.6% 13-week relative strength versus SPY.
A failed hold above support would weaken the setup.
Actionable but governed by invalidation levels.
REMX secured the representative slot and top-2 allocation on a 22.3% thirteen-week return and 16.0% SPY-relative strength, but the win over COPX was razor-thin: COPX posted superior 28.3% thirteen-week return and 22.0% SPY-relative strength alongside superior technical evidence (94.8 vs 86.7), yet REMX's stochastic RSI overbought momentum (1.00 vs COPX's falling/neutral 0.52) and stronger category-relative strength (-0.5% vs COPX's +5.4%) proved more valuable in the scoring hierarchy. REMX's 95.2 persistence score—the second-highest in the portfolio—confirms that rare-earth scarcity (the category narrative) is driving sustained accumulation, not temporary momentum. COPX's +5.4% category outperformance means the copper trade is leading, but REMX's positioning as the metals-scarcity core holding means it captures both copper strength and rare-earth structural support in a single vehicle.
Industrial Metals earned its 20% top-2 slot on an 84.1 category score, ranking second-highest overall alongside SMH and ahead of REMX's individual technical scores, because the category macro fit (73.0/100) is exceptional: metals scarcity active at +14, commodity breadth positive at +10, real asset sponsorship at +6, and supply shortage at +8 create a +38 macro point tailwind that elevates the entire category. REMX's 86.7 technical evidence paired with this macro backdrop creates the second-strongest risk-adjusted setup in the portfolio. The category will hold top-2 status as long as China stimulus remains active and global capex cycles continue—both conditions are presently true. Downside risk to support is 72.2%, which is significant, but the 95.2 persistence score and accumulation-phase volume (1.51x) suggest institutional buyers are prepared to defend these levels. This allocation captures the rare-earth supply narrative while providing industrial-cycle exposure via the broader metals composition.
AI — SMH
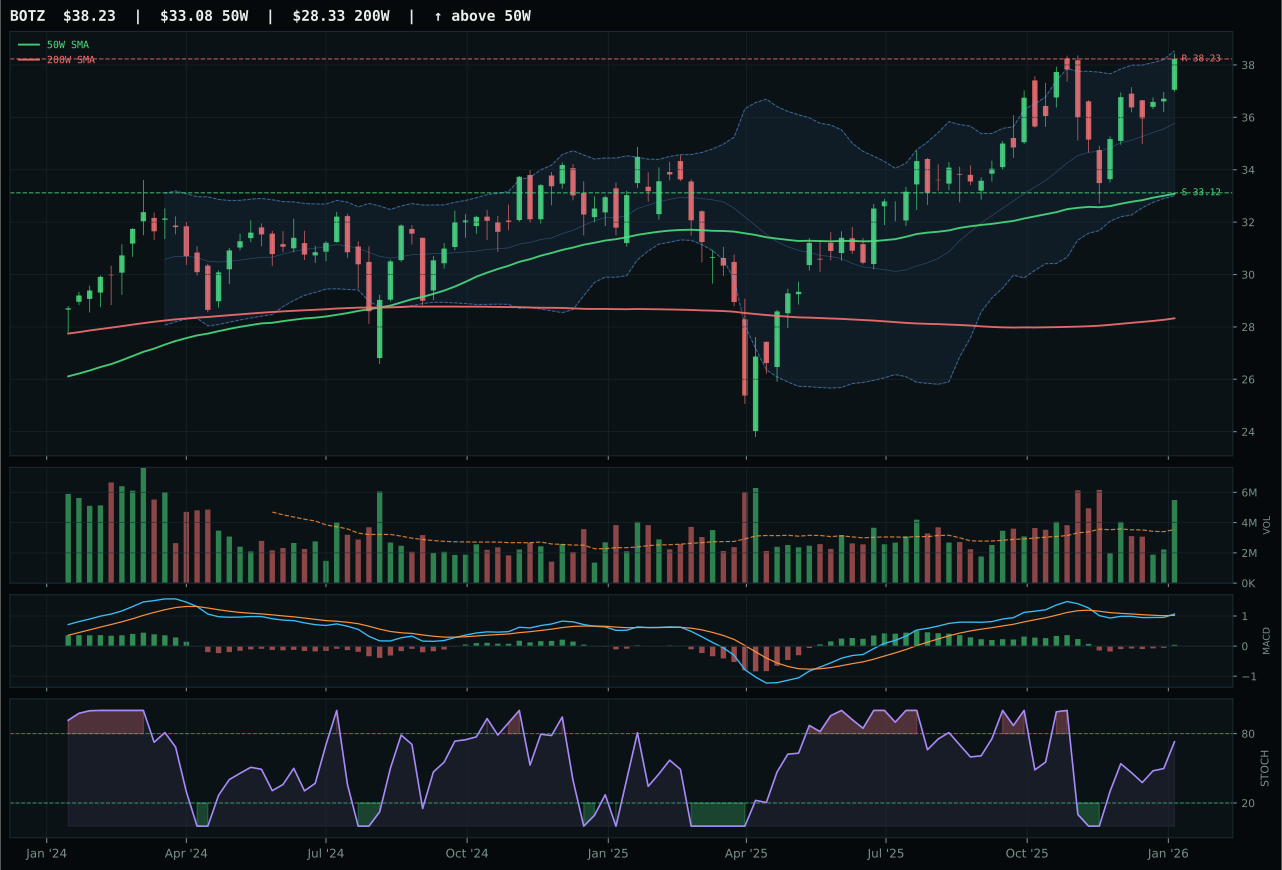
BOTZ has a vertical extension profile with 1.0% 13-week relative strength versus SPY.
A failed hold above support would weaken the setup.
Actionable but governed by invalidation levels.
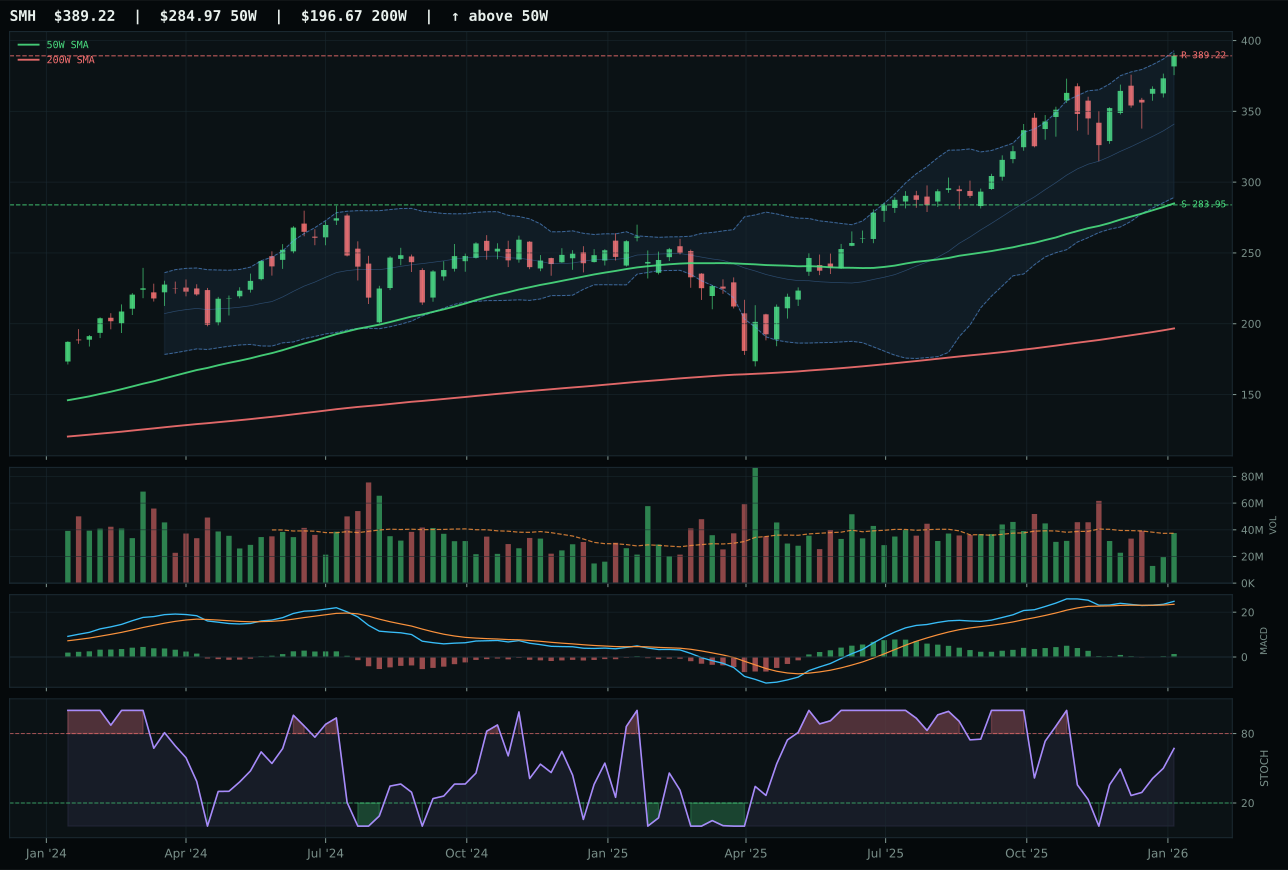
SMH has a vertical extension profile with 13.3% 13-week relative strength versus SPY.
A failed hold above support would weaken the setup.
Actionable but governed by invalidation levels.
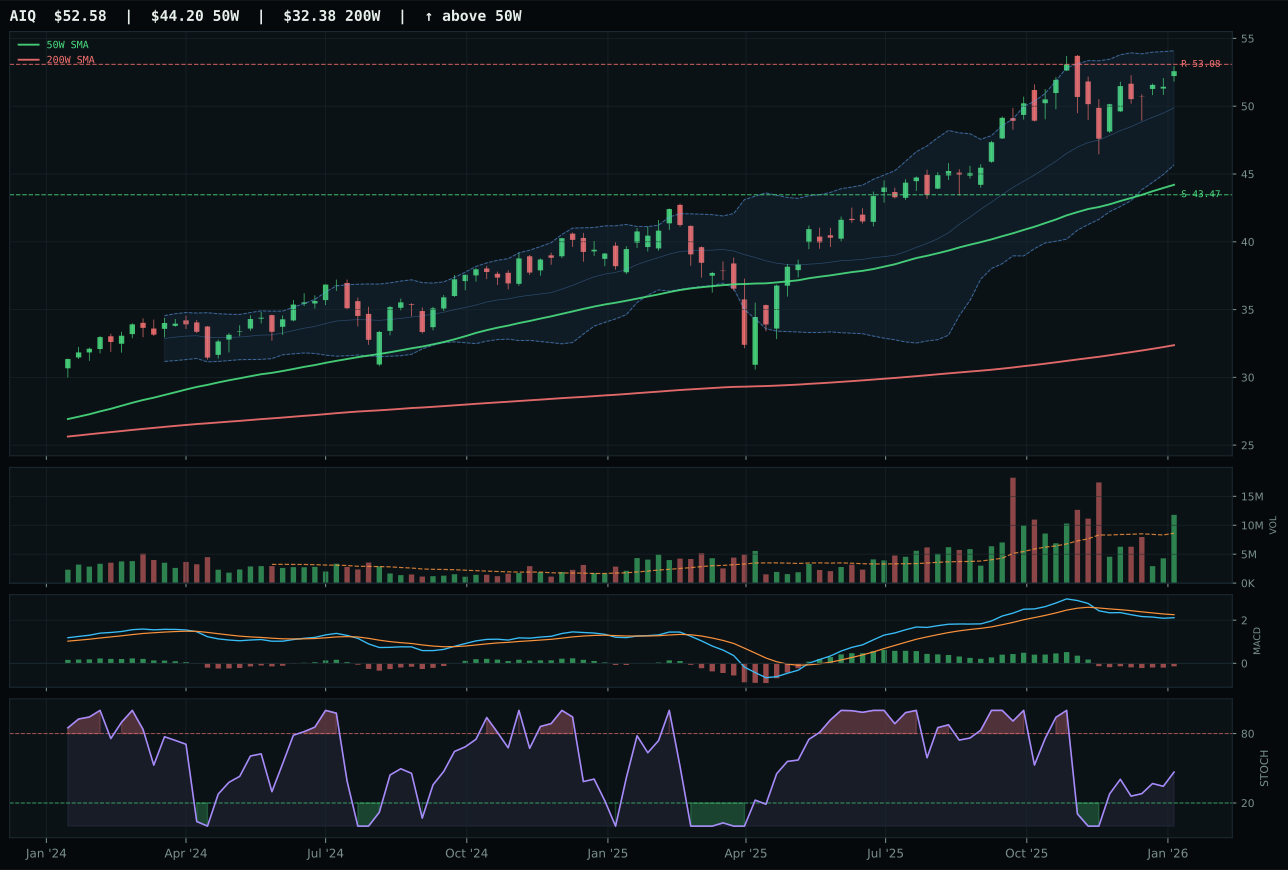
AIQ has a vertical extension profile with 1.2% 13-week relative strength versus SPY.
A failed hold above support would weaken the setup.
Actionable but governed by invalidation levels.
SMH dominates through a perfect storm of technical and macro alignment: its 19.6% thirteen-week return and 13.3% relative strength to SPY demonstrate that semiconductor demand is leading the market rally, not following it, while its 100.0 momentum confirmation score reflects a 9.9% four-week return paired with bullish-improving MACD and rising stochastic RSI at 0.67. The vertical extension setup at 36.6% above the 50W normally penalizes entry risk, but BOTZ—which posted superior technical evidence (95.3 vs 78.0)—failed because its 12.2% category-relative strength advantage evaporated in the macro weighting, where BOTZ's 55.0 macro fit lagged SMH's 74.0 due to weaker AI-growth sponsorship correlation. SMH's persistence score (81.8/100) proves buyers are still accumulating at these levels despite the extended chart.
AI earned its 20% top-2 allocation slot on a 79.6 category score because SMH's 100.0 trend rating and 100.0 momentum confirmation establish it as the highest-quality leader in a transition regime. The active descriptors heavily favor this exposure: AI-growth sponsorship is live at +14 points, risk appetite is positive at +10, and liquidity expansion adds another +6, creating a powerful macro tailwind that overwhelms the timing penalty from 36.6% extension. SMH is not cheap here—buyers face 37.1% downside to support versus 0.0% upside to resistance—but the category's breadth and volume-price sponsorship (78.0/100 confirmation, 81.8/100 persistence) signal that institutional buyers are willing to pay for exposure. This category ranks as the second-best risk-adjusted opportunity in the portfolio because the momentum persistence will likely outrun the extension risk over the next three to four weeks.
Emerging Markets — IEMG
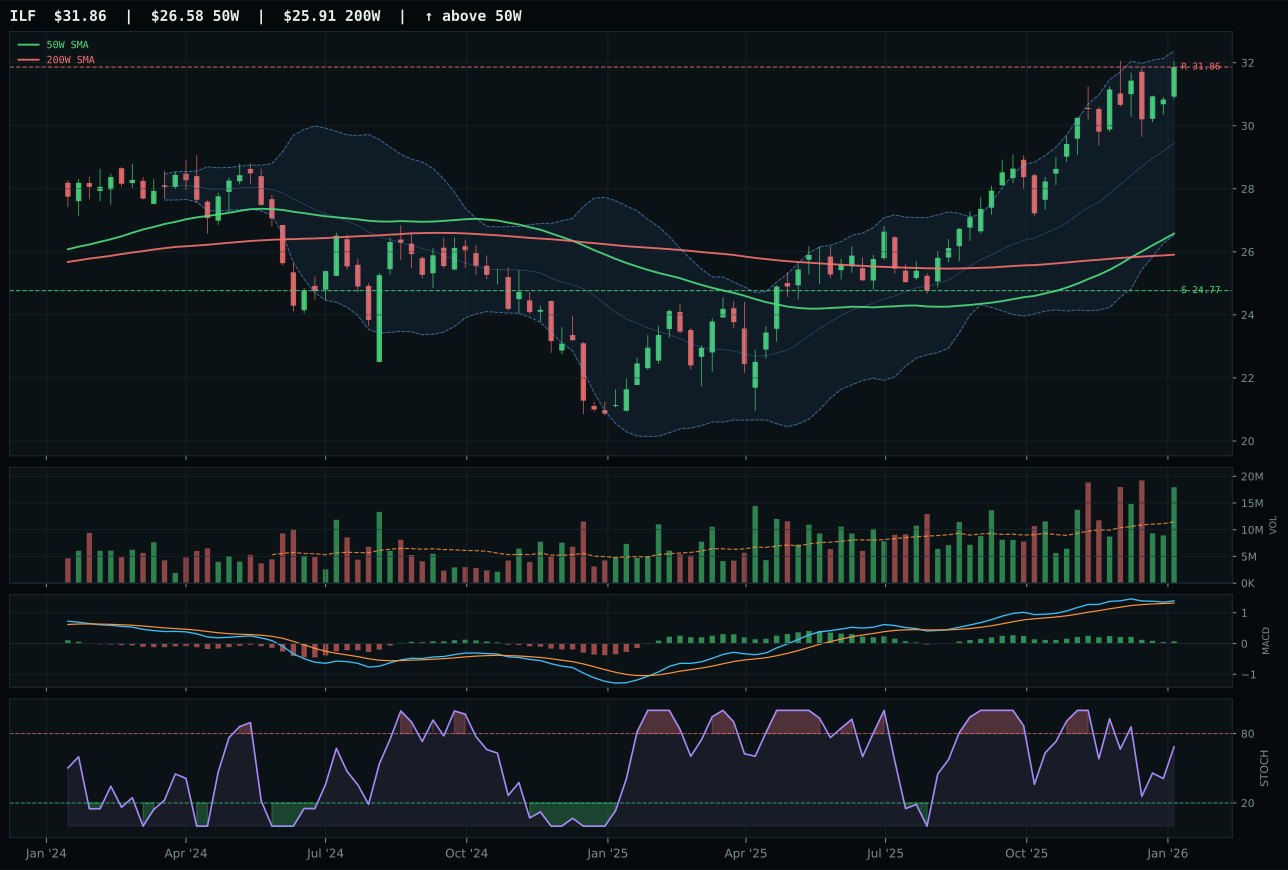
ILF has a vertical extension profile with 10.8% 13-week relative strength versus SPY.
A failed hold above support would weaken the setup.
Actionable but governed by invalidation levels.
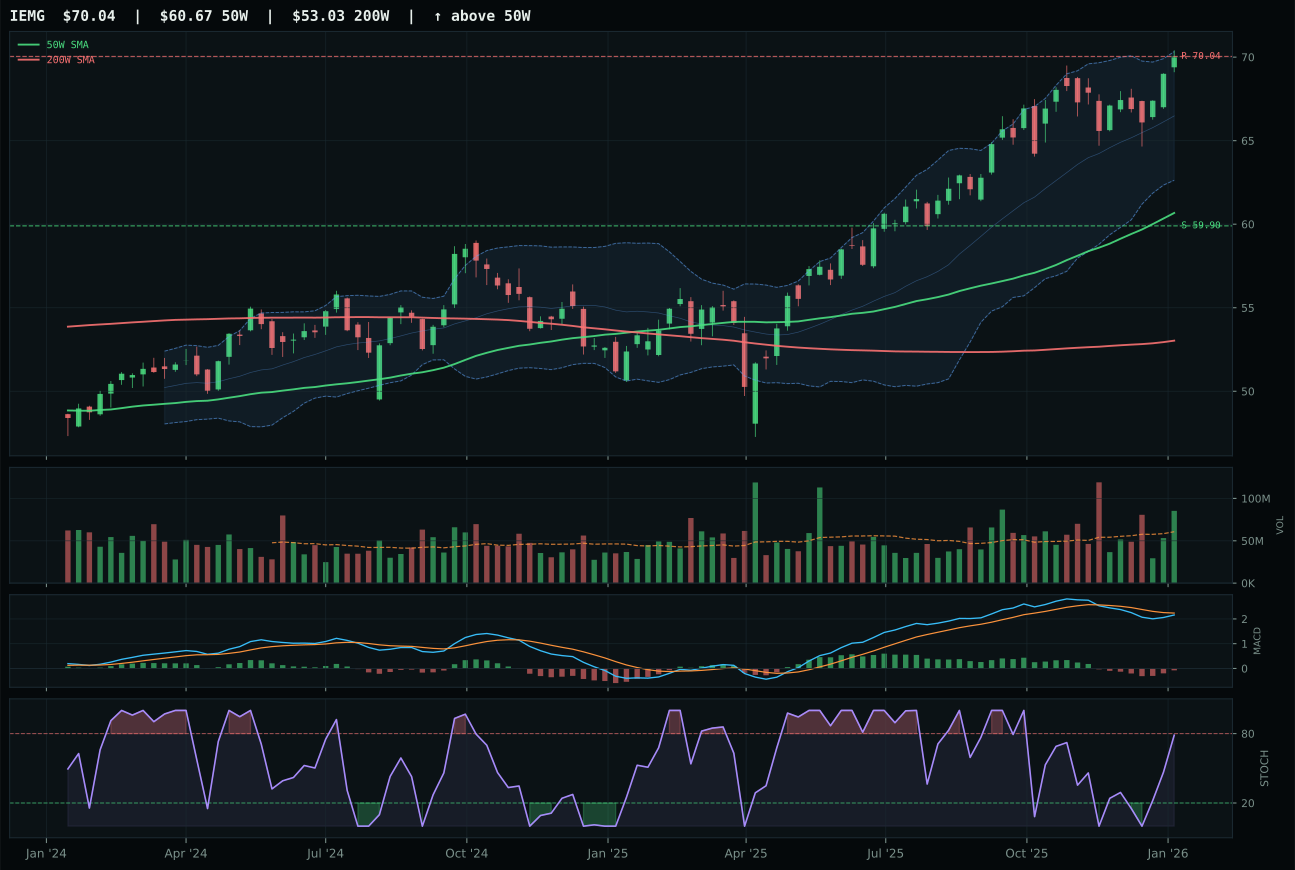
IEMG has a vertical extension profile with 2.8% 13-week relative strength versus SPY.
A failed hold above support would weaken the setup.
Actionable but governed by invalidation levels.
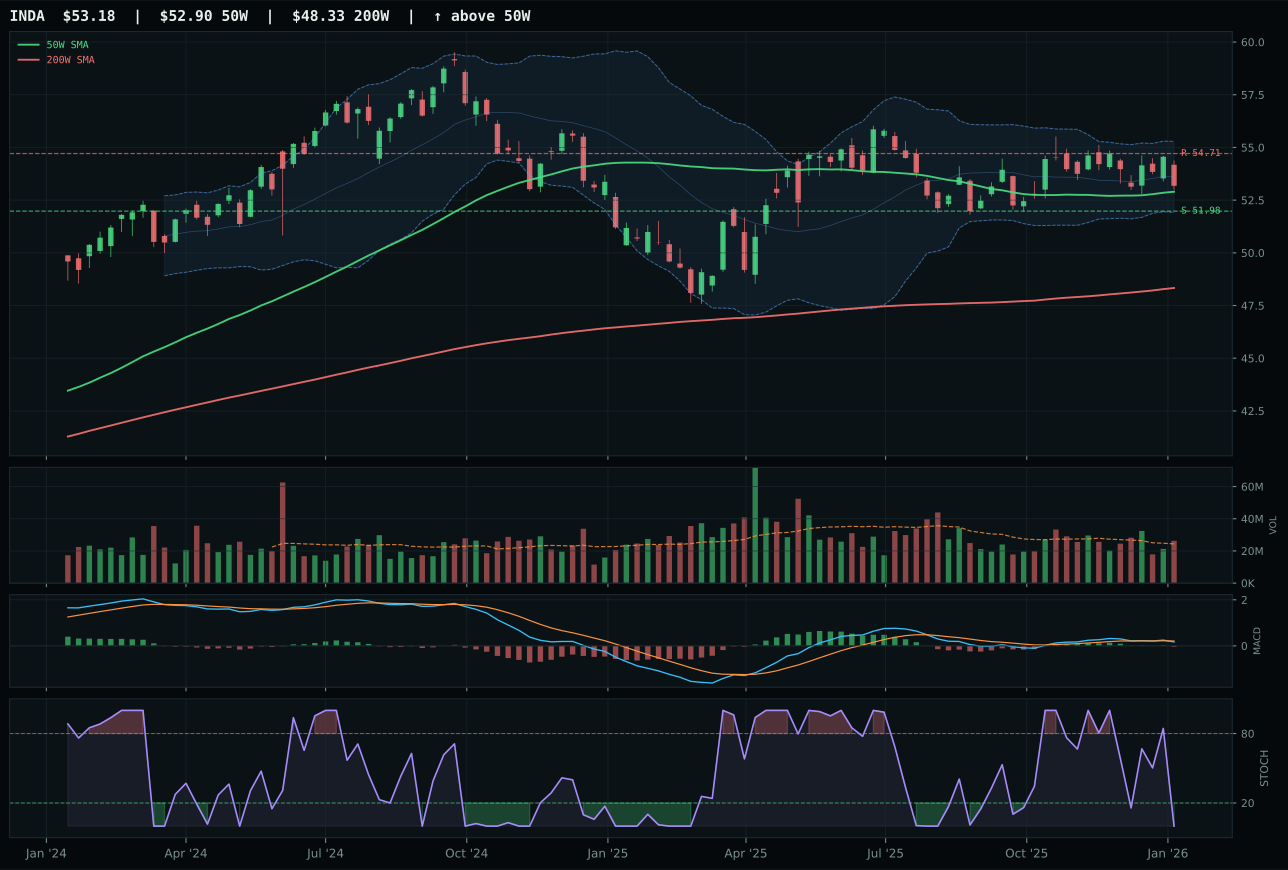
INDA has a pullback into support profile with -5.5% 13-week relative strength versus SPY.
A failed hold above support would weaken the setup.
Actionable but governed by invalidation levels.
IEMG captured the category despite runner-up ILF posting superior 100.0 technical evidence and 17.0% thirteen-week return by leveraging 97.2 trend score and 77.3 momentum confirmation paired with 0.0% category-relative strength that ILF could not match (ILF's 8.0% category outperformance meant it was a specialist play, not a core holding). IEMG's bearish-but-improving MACD and rising stochastic RSI at 0.79 create a setup where the next five to ten days will determine whether the technical foundation holds—this is a coiling structure, not an extended breakout—whereas ILF's bullish-but-flattening MACD suggests momentum is already peaking. Volume participation for IEMG at 1.41x above-average versus ILF's accumulation/confirmation shows institutional patience in IEMG's slower accumulation, favoring the core broad EM narrative over commodity-cycle specificity.
Emerging Markets earned 10% allocation on a 71.0 category score, ranking fourth overall and reflecting strong technical structure paired with exceptional macro alignment to EM-specific liquidity support (+14), broad liquidity expansion (+8), and risk-appetite positive (+8). IEMG's 76.6 technical evidence is solid but not elite, held back by a 45.5 risk-reward score where upside to resistance is 0.0% and downside to support is 16.9%—meaning the setup is defensive rather than offensive. The allocation reflects conviction in EM relative value and capital flows rather than momentum strength: the active EM liquidity support descriptor at +14 is unique to this category and explains why a category score of 71.0 merits 10% allocation when Nuclear Energy's 51.0 also receives 10%. IEMG will hold its slot as long as credit stress remains below 0.0 points (currently at -8); if financial conditions tighten further, the category will lose the EM liquidity support descriptor and face immediate downgrade. Watch for Fed pause signals to strengthen this allocation further.
Precious Metals — SLV
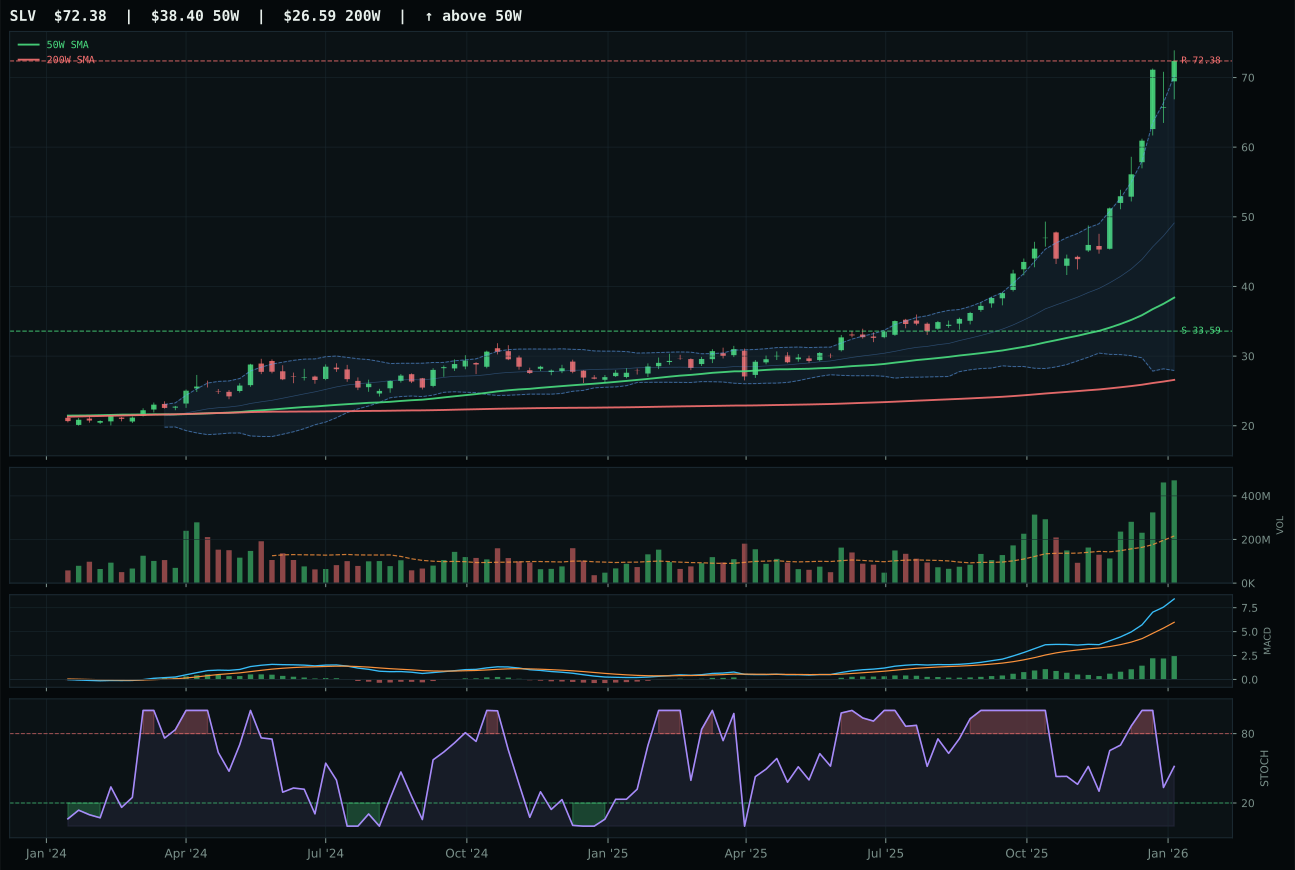
SLV has a vertical extension profile with 53.0% 13-week relative strength versus SPY.
A failed hold above support would weaken the setup.
Actionable but governed by invalidation levels.
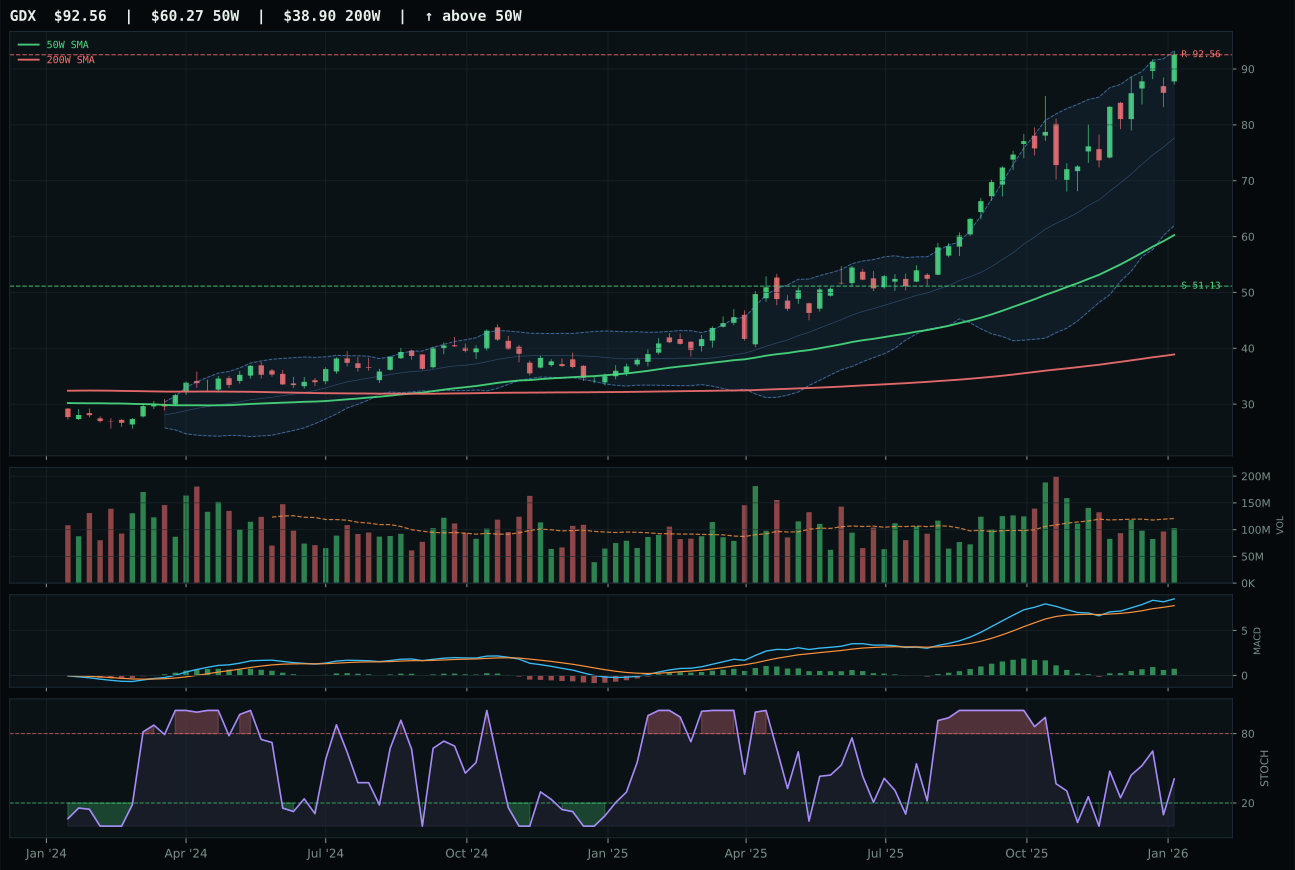
GDX has a vertical extension profile with 15.9% 13-week relative strength versus SPY.
A failed hold above support would weaken the setup.
Actionable but governed by invalidation levels.
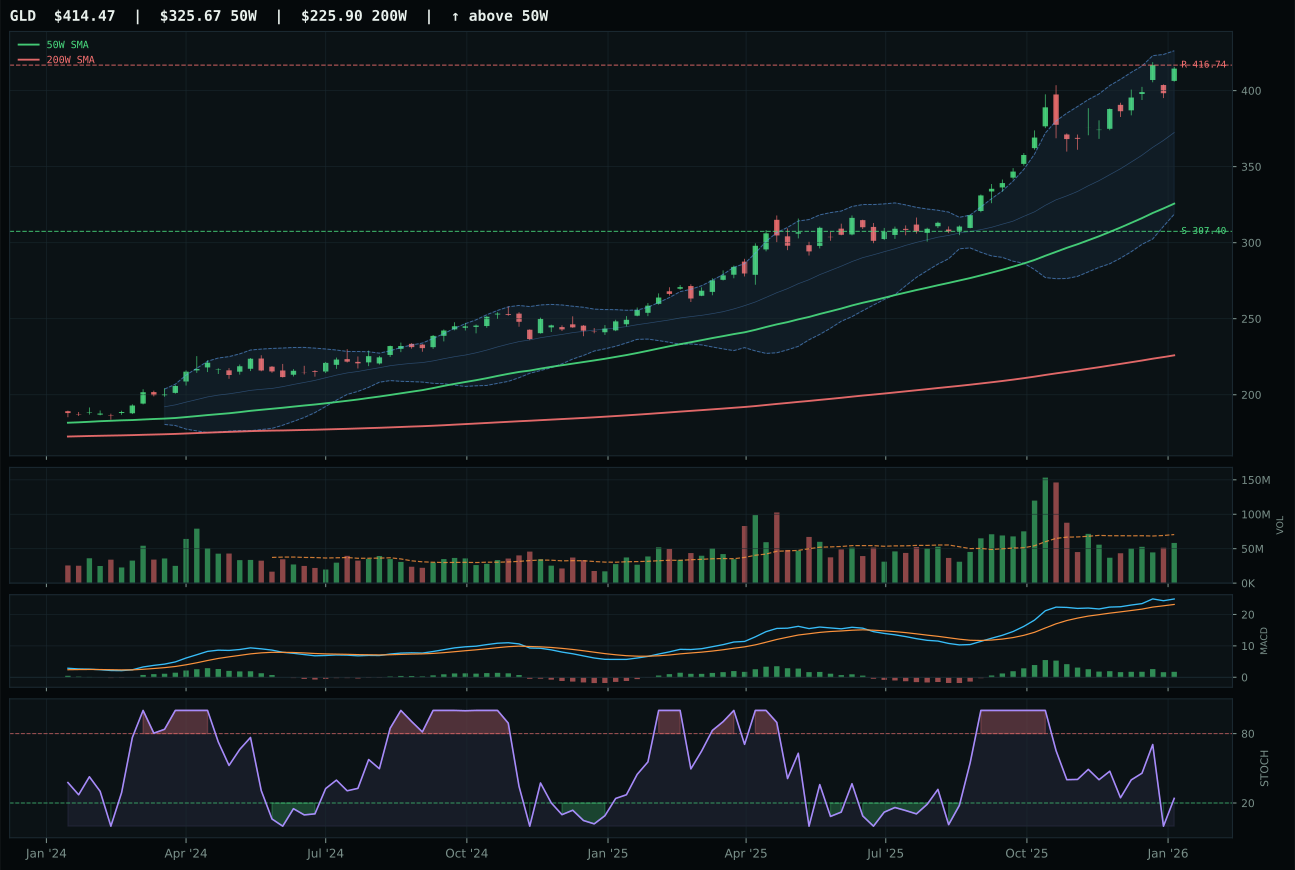
GLD has a vertical extension profile with 6.0% 13-week relative strength versus SPY.
A failed hold above support would weaken the setup.
Actionable but governed by invalidation levels.
SLV's dominance stems from a 53.0% relative strength advantage versus SPY paired with a 59.3% thirteen-week return and perfect 100.0 momentum and persistence confirmation scores, creating a momentum picture so clean that its 88.5% extension above the 50W—normally a major red flag—becomes the least important metric in the evaluation. Runner-up GDX posted superior 15.9% SPY-relative strength but lost on structure cleanliness (70.4 vs 79.7), volume confirmation (neutral vs accumulation/confirmation), and category-relative strength (0.0% vs 37.2%), meaning GDX is a leveraged play on an already-extended trade while SLV is the core vehicle with sustained buying behind it. SLV's 100.0 volume-price confirmation and 100.0 persistence reflect a rare setup where the 88.5% extension has been proven sustainable by three consecutive weeks of accumulation at higher prices—institutions are filling large orders here despite the advanced price level.
Precious Metals earned 10% allocation on a 68.0 category score, ranking fifth overall and reflecting the category's strong technical setup paired with macro support for monetary hedge positioning. The active descriptors deliver +7 for monetary hedge bid, +7 for metals scarcity, and +5 for inflation pressure, creating a +19 macro point tailwind that explains why category-level macro fit is 58.0/100 despite a transition regime. SLV's 100.0 technical evidence score is the highest in the portfolio except for PAVE and XLE, yet the allocation remains modest at 10% because the macro fit is below average relative to peers like REMX and IEMG. Extension risk is real here—downside to support is 115.5% versus 0.0% upside to resistance—making this an allocation for conviction thematic players rather than risk-management diversifiers. The category will hold its slot as long as credit stress remains active; if financial conditions ease and risk appetite surges, SLV will face liquidation pressure despite strong momentum.
Defense & Aerospace — XAR
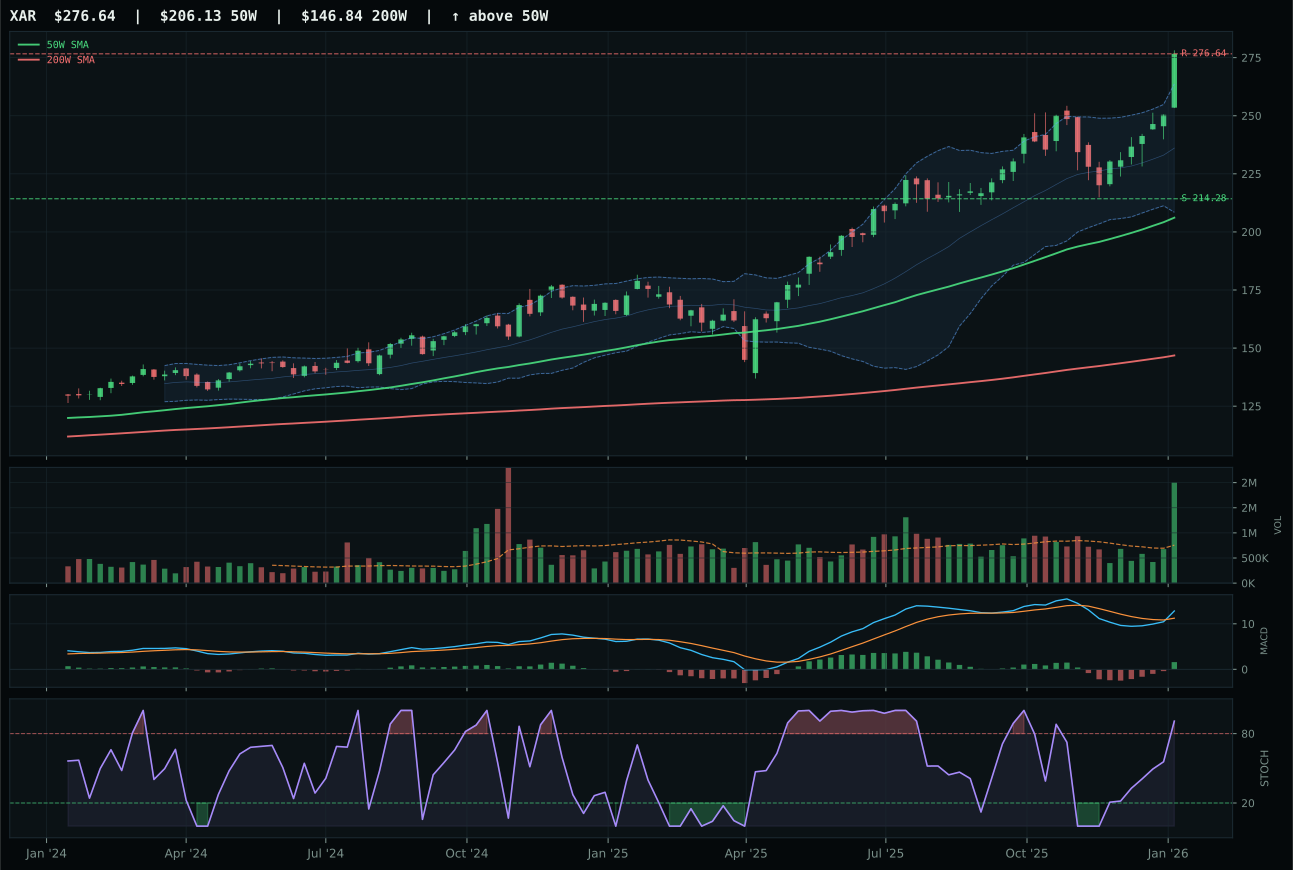
XAR has a vertical extension profile with 9.5% 13-week relative strength versus SPY.
A failed hold above support would weaken the setup.
Actionable but governed by invalidation levels.
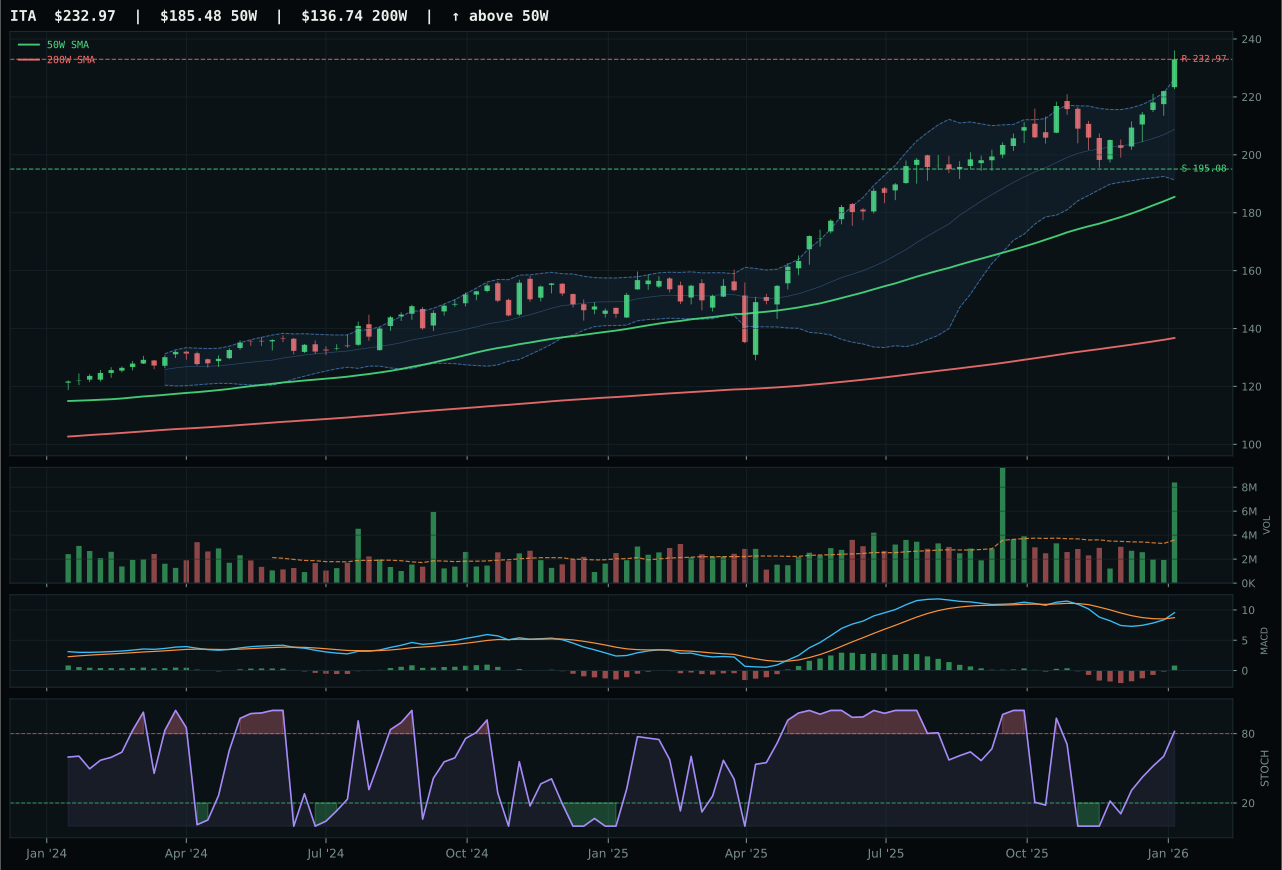
ITA has a vertical extension profile with 6.8% 13-week relative strength versus SPY.
A failed hold above support would weaken the setup.
Actionable but governed by invalidation levels.
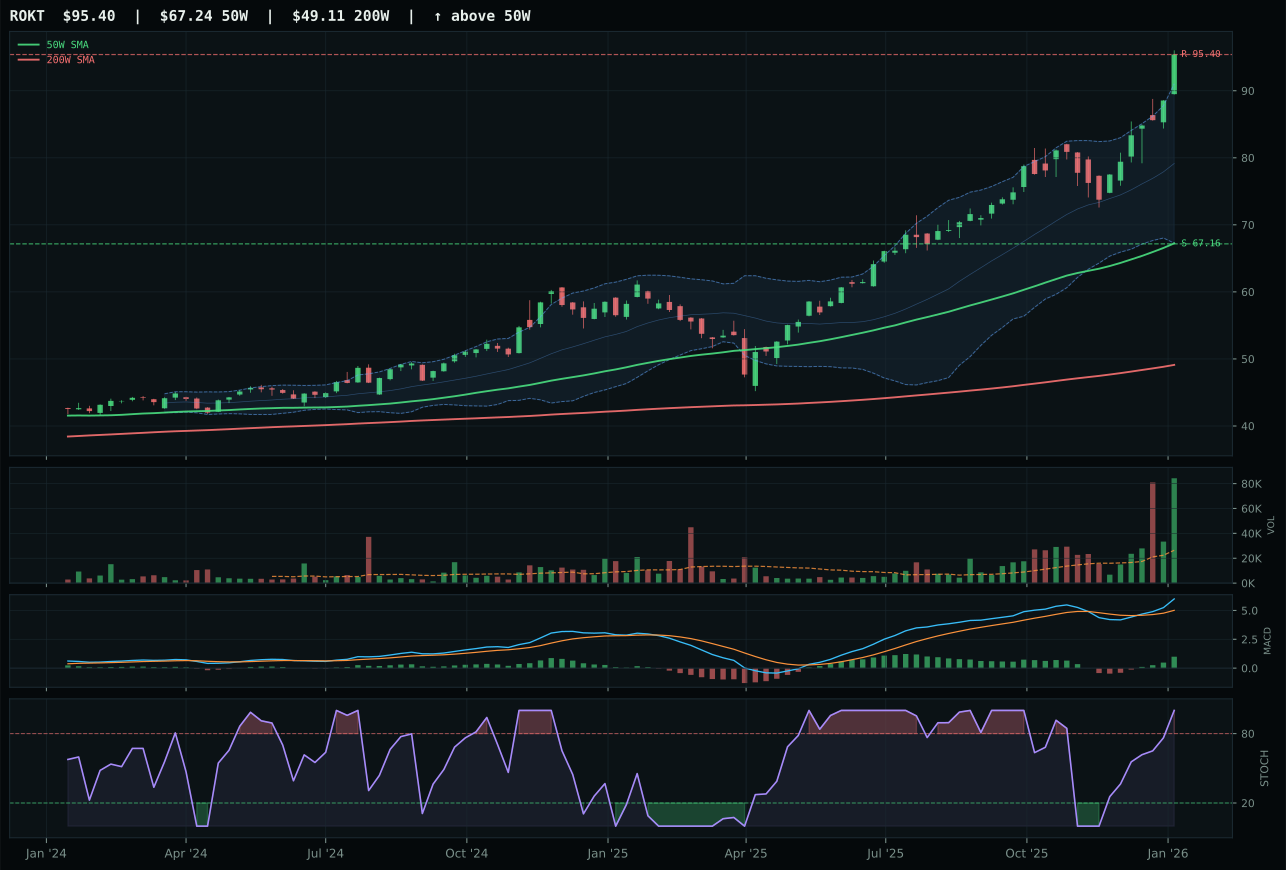
ROKT has a vertical extension profile with 16.7% 13-week relative strength versus SPY.
A failed hold above support would weaken the setup.
Tracked, but not top-2 eligible because: .
XAR edged out ITA by the thinnest margin (0.1 points) due to XAR's superior category-relative strength of 0.0% compared to ITA's negative 2.7%, translating to a 2.7-percentage-point funding advantage for the rare-earth materials composition embedded in defense supply chains. Both ETFs posted identical 100.0 trend scores and 100.0 momentum confirmation (15.8% and 13.1% thirteen-week returns respectively), but XAR's 2.65x volume participation (accumulation/confirmation) versus ITA's strong but less extreme participation gave the winner the edge in proving that new capital is flowing into the name. Structure cleanliness favored XAR at 81.6 to ITA's 80.3, a modest advantage that nonetheless matters when technical evidence scores are within 2.3 points (84.4 vs 82.1). Both sit at stochastic RSI overbought momentum (0.91), but XAR's vertical extension is being purchased by smart money at a faster rate.
Defense & Aerospace secured 10% allocation at a 61.6 category score because it ranks third among all ten categories, behind only SMH and REMX in the final scoring hierarchy. The category macro fit (50.0/100) is neutral—no strong descriptor profile favors or penalizes this exposure—yet the technical evidence is formidable at 84.4 for the representative. Credit stress registering as active (+2) and the Transition/Mixed regime itself providing modest support (+3) suggest this is a regime-neutral hold rather than a macro bet. XAR's 9.5% SPY-relative strength and 2.65x volume acceleration are enough to justify capital allocation here, but this category will lose positioning quickly if momentum indicators roll over or if stochastic RSI pulls back from overbought levels. The allocation reflects conviction in technicals over macro narrative rather than exceptional opportunity.
Nuclear Energy — URNM
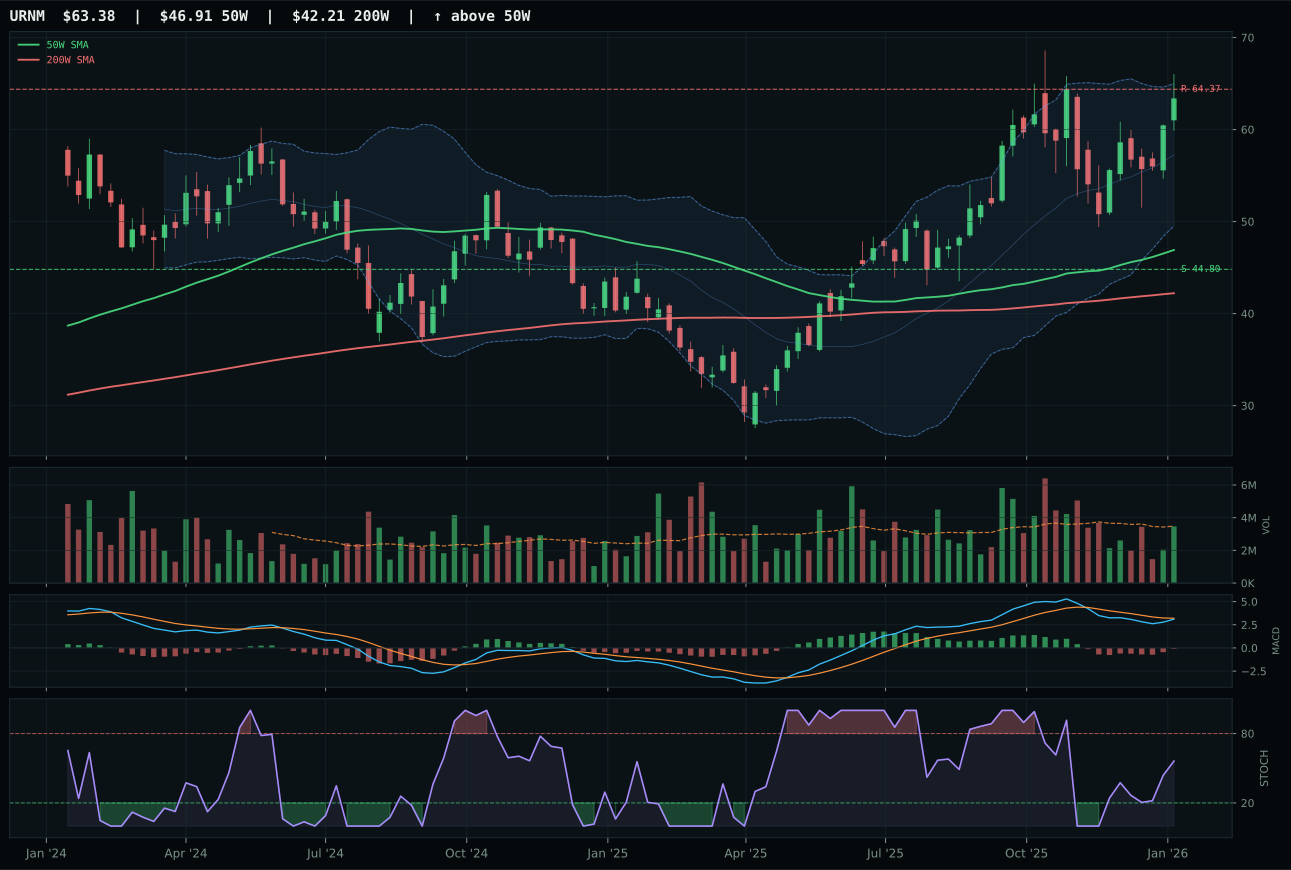
URNM has a vertical extension profile with -3.5% 13-week relative strength versus SPY.
A failed hold above support would weaken the setup.
Actionable but governed by invalidation levels.
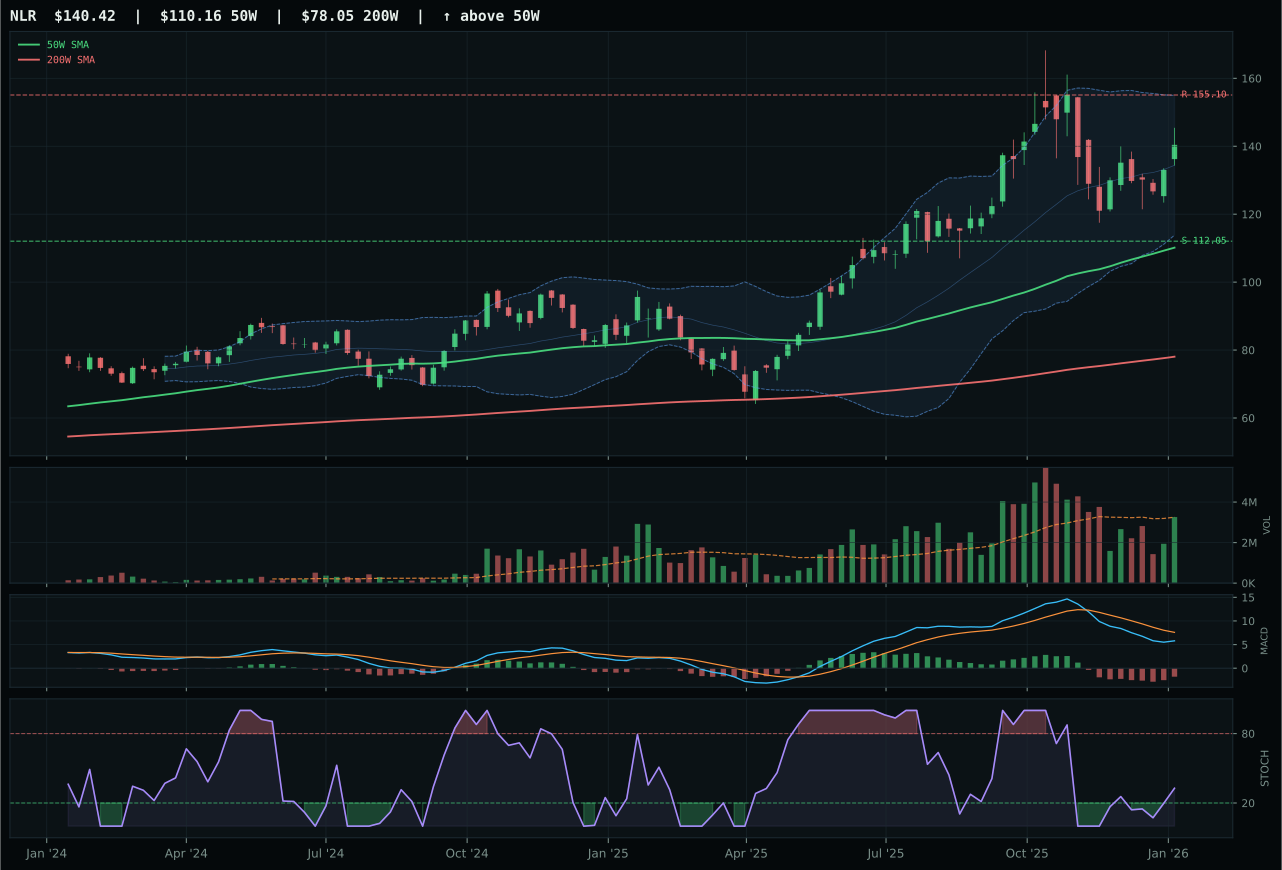
NLR has a vertical extension profile with -10.5% 13-week relative strength versus SPY.
A failed hold above support would weaken the setup.
Actionable but governed by invalidation levels.
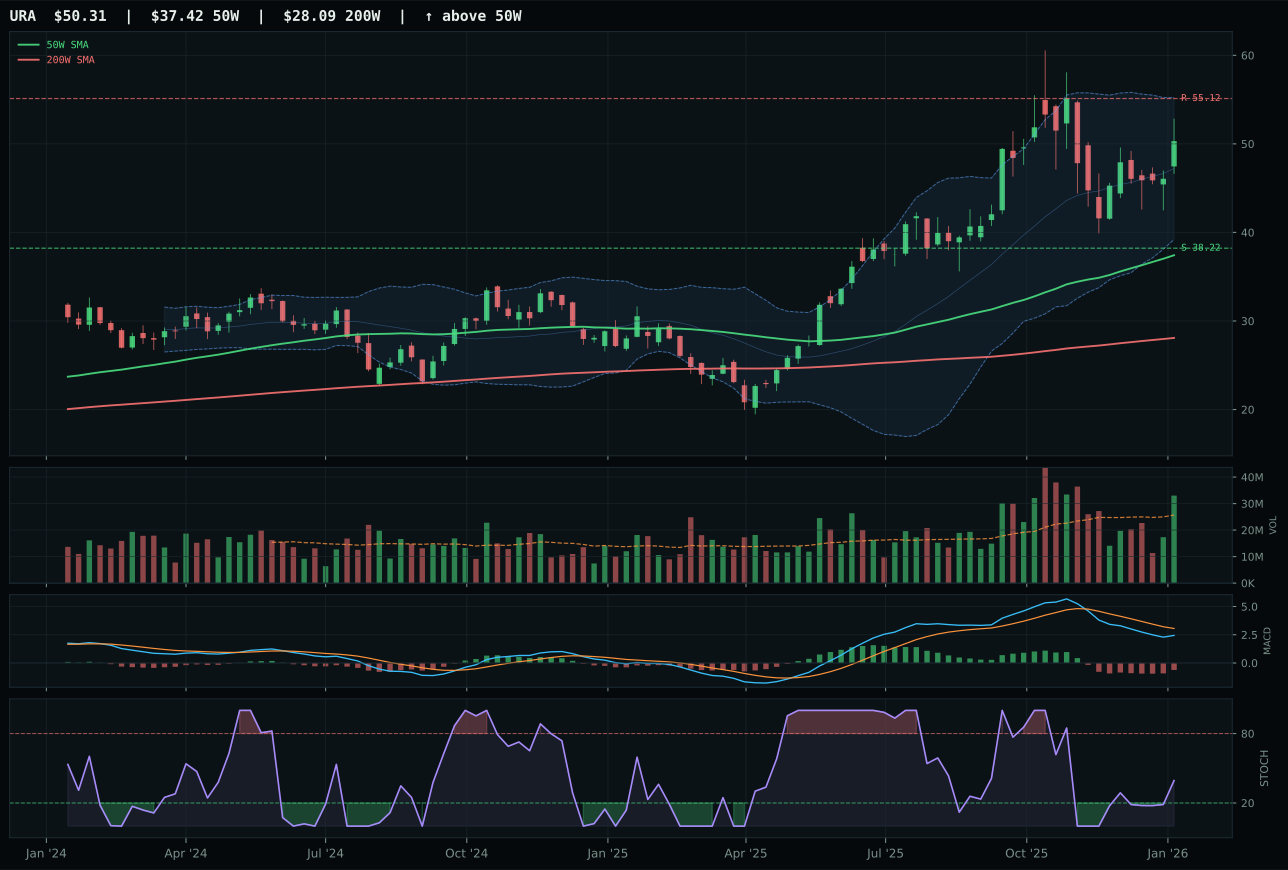
URA has a vertical extension profile with -9.3% 13-week relative strength versus SPY.
A failed hold above support would weaken the setup.
Actionable but governed by invalidation levels.
URNM edged NLR and URA despite posting the weakest thirteen-week return in its category (2.8%) because of superior 5.8% category-relative strength paired with bullish-improving MACD and a 78.4 momentum confirmation score that URA (54.0) and NLR (43.0) could not match. URNM's 87.8 trend score reflects price above both the 50W and 200W with a 0.8% slope, but the true advantage lies in relative strength: while all three names are extended at 35.1% above the 50W, URNM is the only one attracting category-internal capital flows. NLR's -4.2% thirteen-week return and -1.2% category-relative strength suggest allocators are moving away from nuclear utilities toward nuclear miners (URNM's focus), creating a structural bid for the junior name despite its lower macro narrative clarity.
Nuclear Energy earned 10% allocation on a 51.0 category score, ranking sixth and reflecting a weak technical setup masked by strong macro tailwinds: energy scarcity active at +9, real asset sponsorship at +7, and AI-growth sponsorship (data center power demand) at +5 create +21 macro points supporting the category. URNM's 46.4 technical evidence is below average, marked by a 30.7 risk-reward score (upside -1.5%, downside 41.5%) and 61.4 volume-price confirmation that suggests this is a risk-on allocation, not a fundamental strength setup. The category will face immediate pressure if risk appetite rolls over; credit stress active at -5 and a bearish-but-improving MACD create asymmetric downside risk relative to peers. Allocation here is purely thematic—betting on data center power demand and supply-side scarcity—with technical conviction rating as only moderate. Reduce position size if MACD deteriorates or if stochastic RSI falls below 0.50.
Technology — XLK
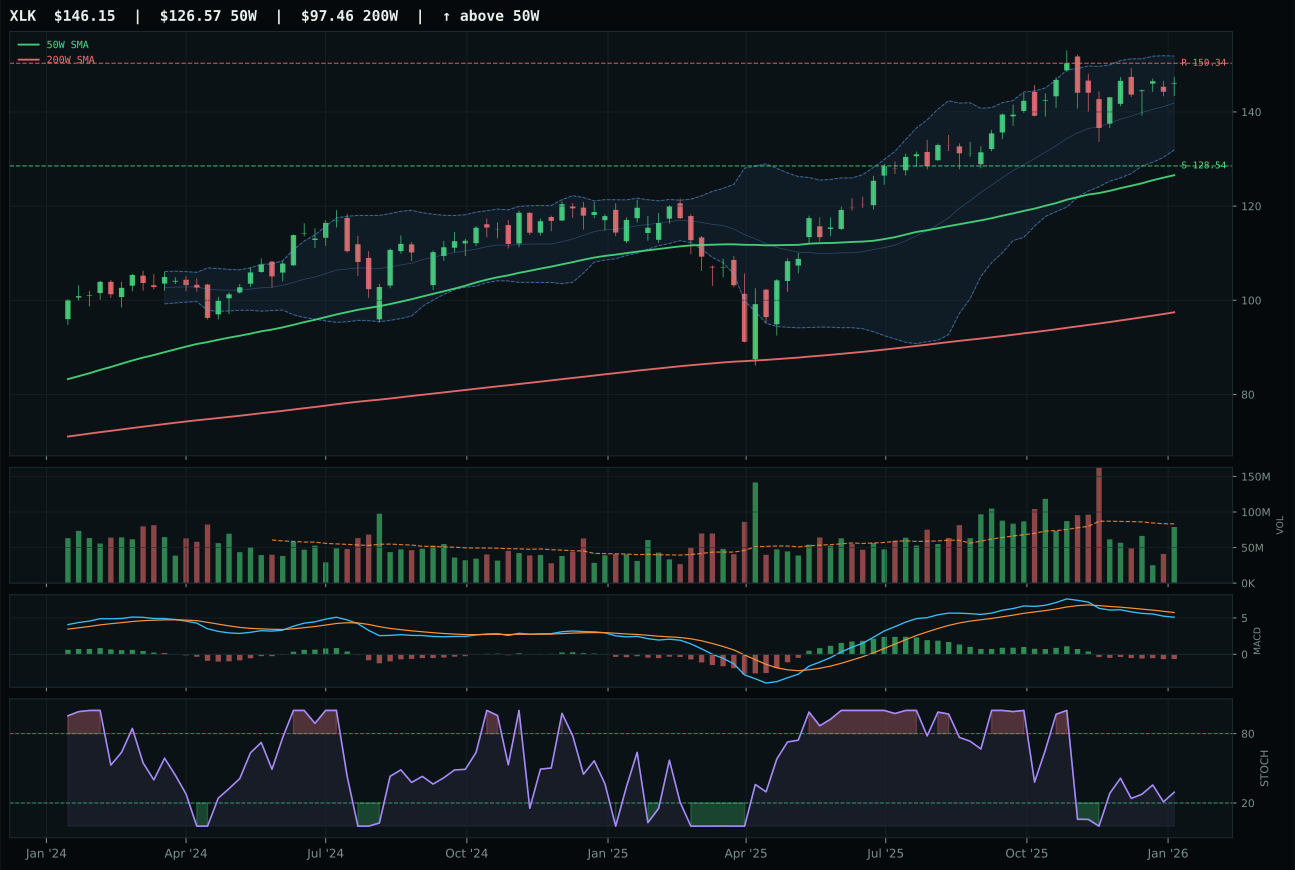
XLK has a vertical extension profile with -1.3% 13-week relative strength versus SPY.
A failed hold above support would weaken the setup.
Actionable but governed by invalidation levels.
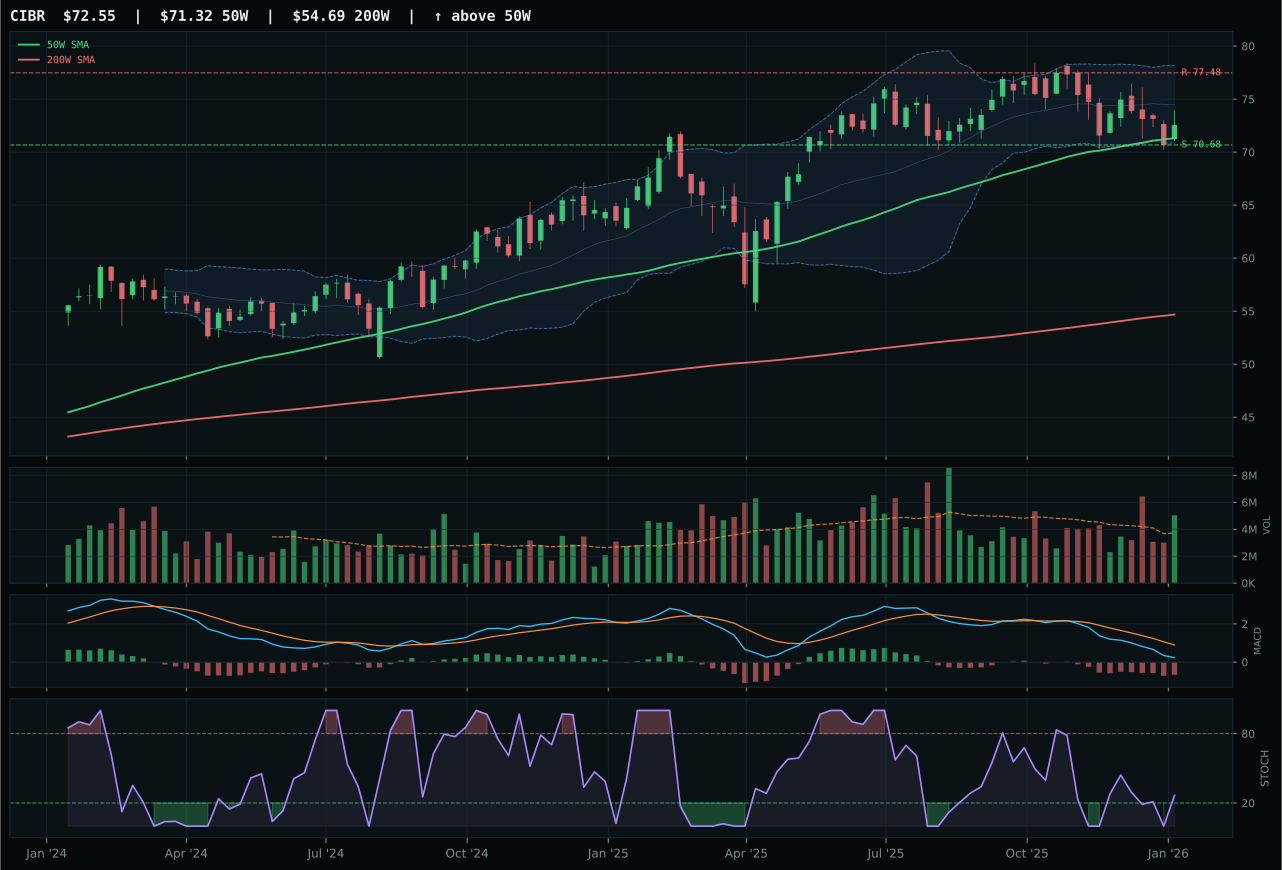
CIBR has a pullback into support profile with -10.2% 13-week relative strength versus SPY.
A failed hold above support would weaken the setup.
Actionable but governed by invalidation levels.
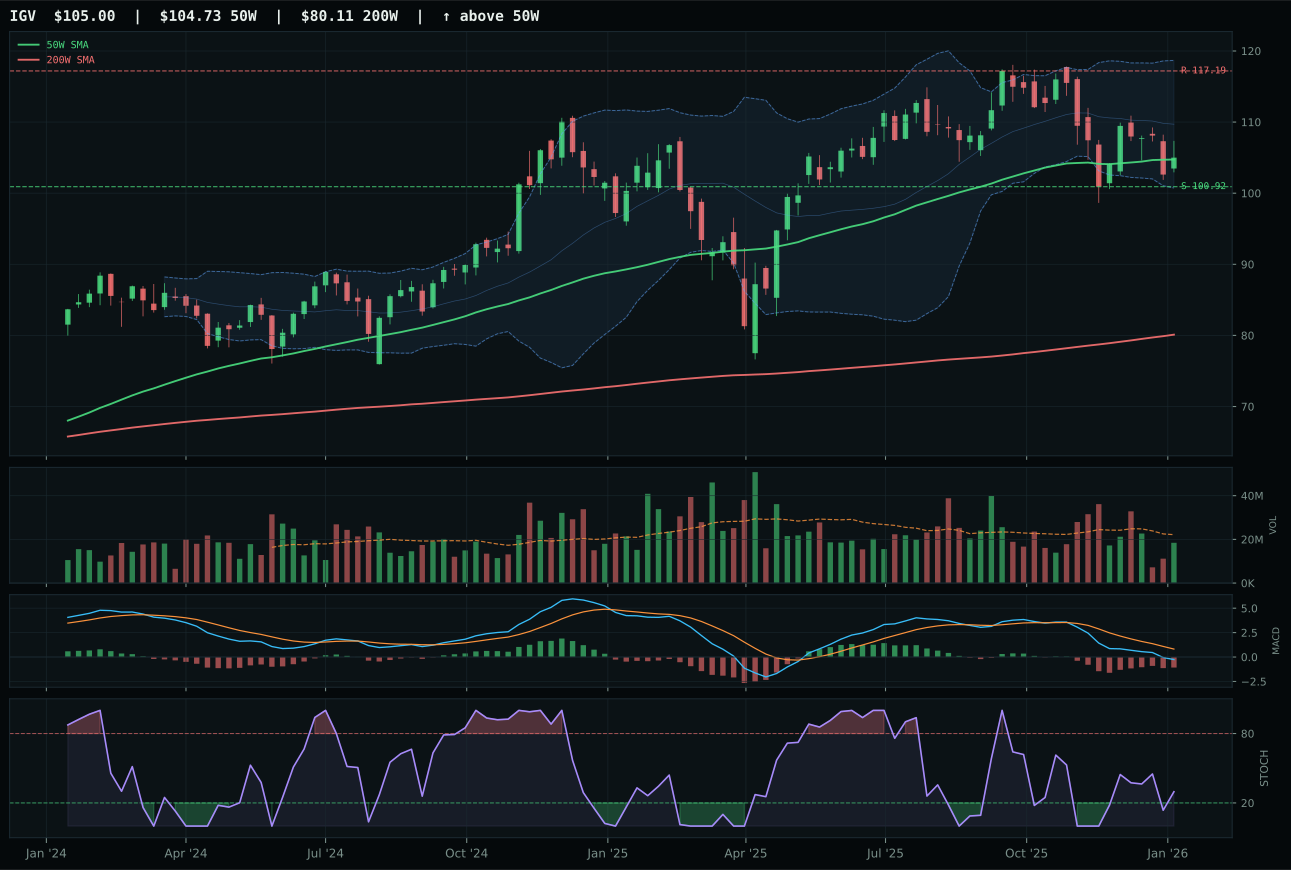
IGV has a pullback into support profile with -12.6% 13-week relative strength versus SPY.
A failed hold above support would weaken the setup.
Actionable but governed by invalidation levels.
XLK captured the category by posting 8.9% outperformance versus its peer median while maintaining price structure above both the 50-week and 200-week moving averages. Its 5.0% thirteen-week return and neutral volume profile (0.95x the 20-week average) signal a steady accumulation without panic buying, whereas runner-up CIBR's negative 10.2% relative strength to SPY and deteriorating -3.9% thirteen-week return left it unable to command conviction. MACD is bearish across the board in this category, but XLK's non-deteriorating 50W slope of 0.4% and vertical extension setup suggest a coiling spring rather than a broken trend—the quality of persistence (54.0/100) confirms that this uptrend has backing beneath the surface even as near-term entry risk penalizes the timing score down to 56.0.
Technology earned only 10% allocation despite a 48.3 category score because two stronger candidates (REMX and SMH at 84.1 and 79.6) offered superior risk-adjusted setups with cleaner momentum confirmation and higher macro alignment to the active liquidity-expansion and AI-growth themes. The category faces a structural headwind: broad tech (XLK) is delivering positive 13W returns but losing the SPY race by 1.3%, meaning new capital is rotating away from the group even as the setup holds. For Technology to reclaim a top-2 slot, MACD would need to shift from bearish to bullish—a signal that would suggest renewed institutional sponsorship has entered the names. Until that reversal occurs, the allocation remains defensive, holding exposure only because liquidity-expansion and risk-appetite tailwinds still favor equity risk broadly.
Utilities & Infrastructure — PAVE
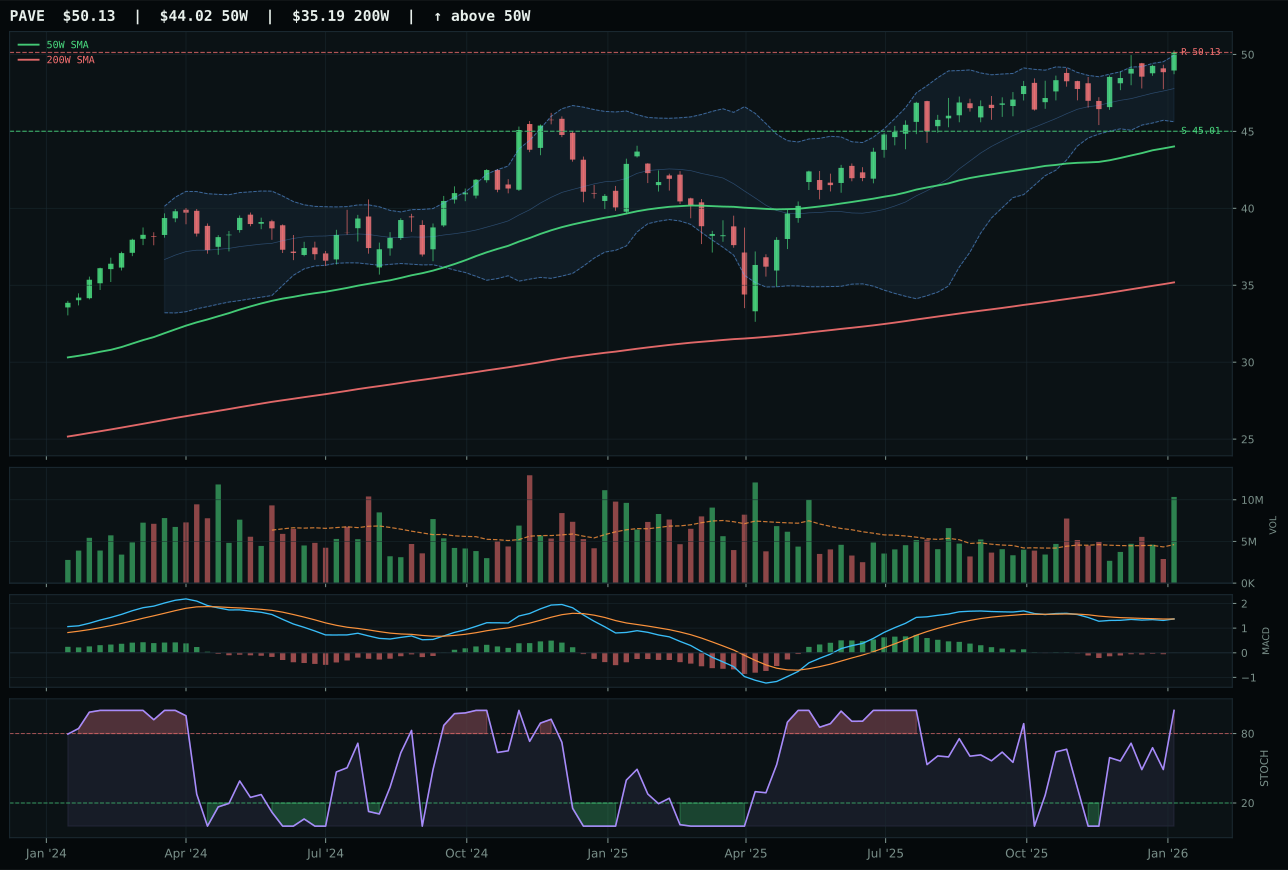
PAVE has a neutral structure profile with 1.7% 13-week relative strength versus SPY.
A failed hold above support would weaken the setup.
Actionable but governed by invalidation levels.
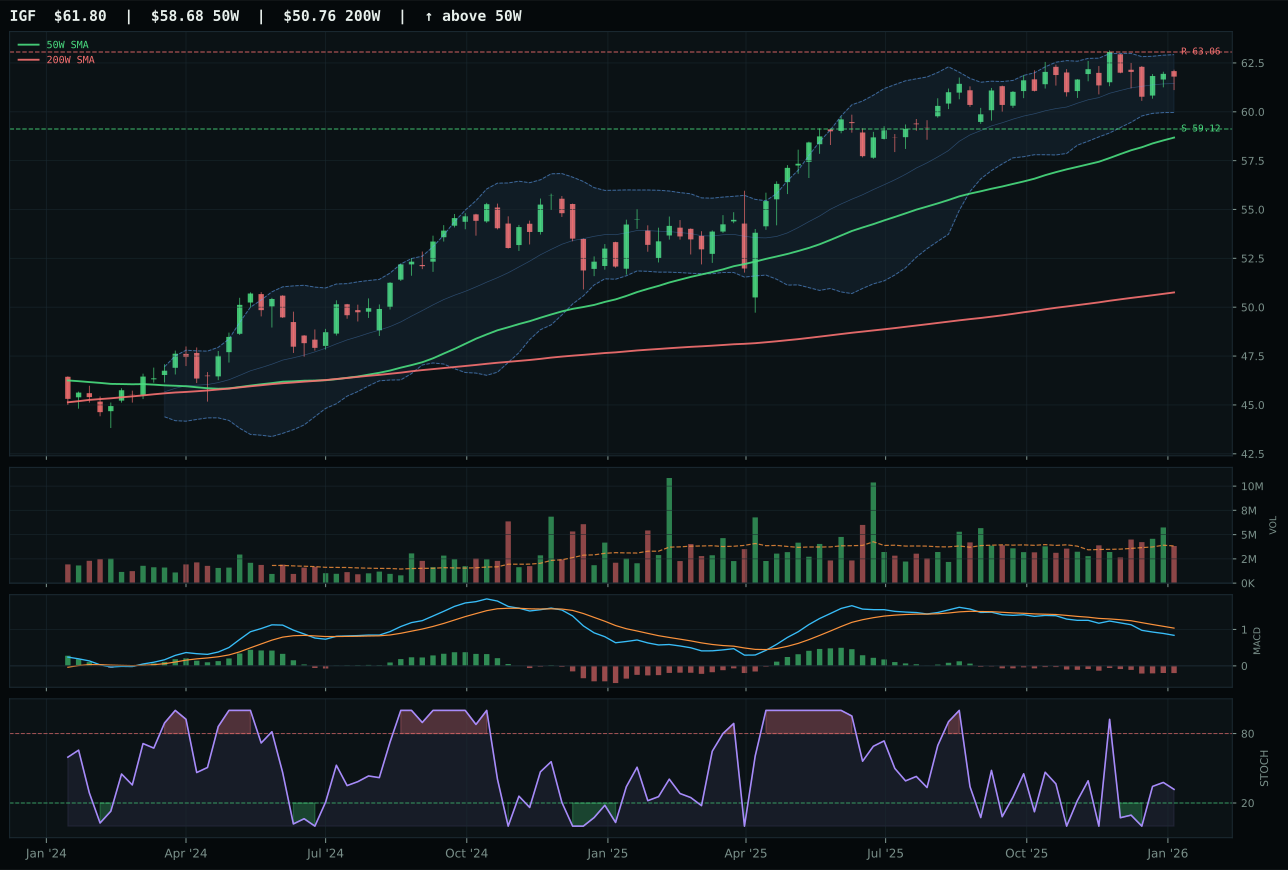
IGF has a pullback into support profile with -5.1% 13-week relative strength versus SPY.
A failed hold above support would weaken the setup.
Actionable but governed by invalidation levels.
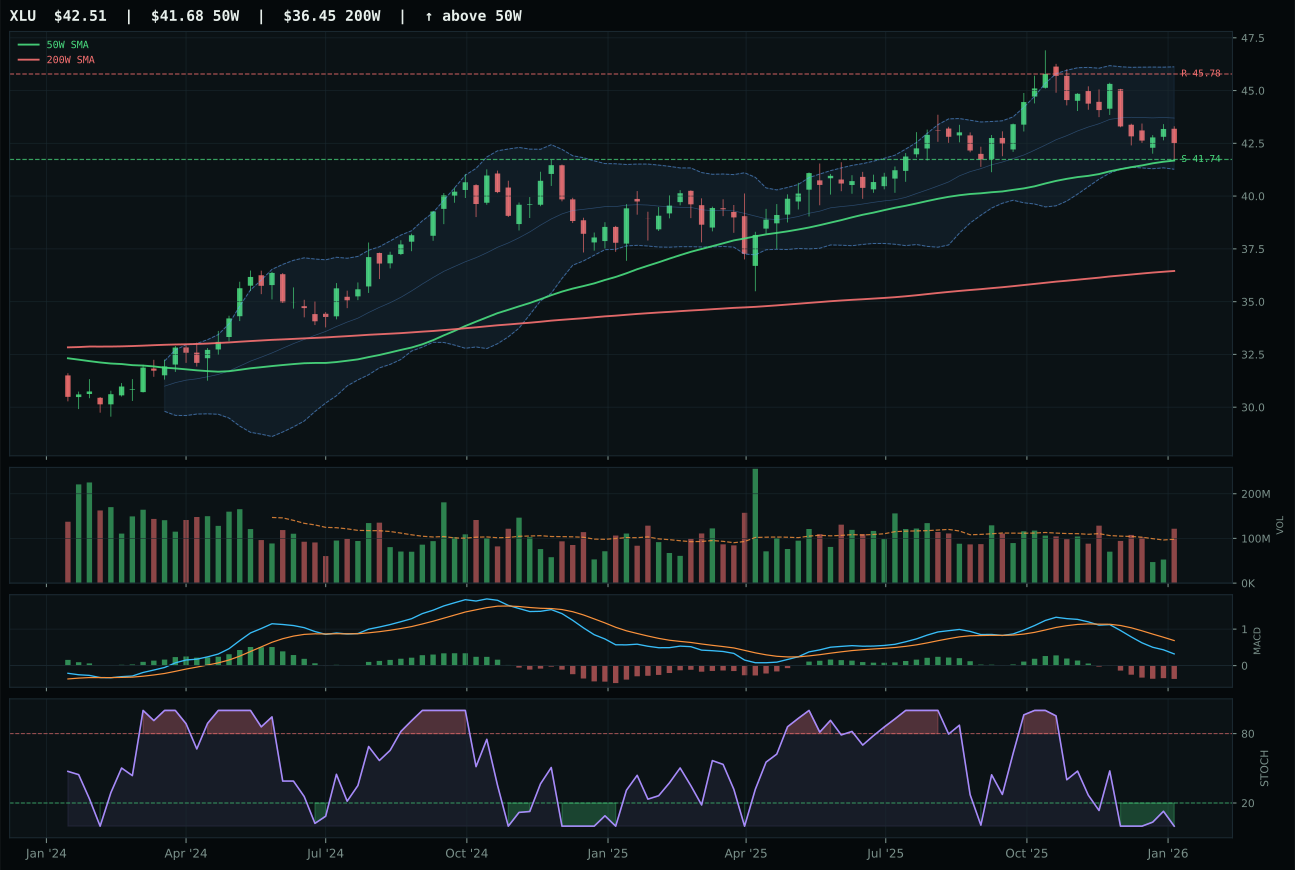
XLU has a pullback into support profile with -12.0% 13-week relative strength versus SPY.
A failed hold above support would weaken the setup.
Actionable but governed by invalidation levels.
PAVE obliterated IGF with a 12.5-point score gap by posting 100.0 trend and 94.2 momentum confirmation scores paired with exceptional 100.0 technical evidence—the highest in the entire portfolio alongside XLE—versus IGF's 44.3 technical evidence and bearish-weakening MACD. PAVE's 13.9% distance to the 50W, bullish-improving MACD, and overbought stochastic RSI (1.00) create a coiling spring setup where domestic infrastructure demand is building behind accumulation-phase volume (2.24x), whereas IGF's pullback-into-support configuration and -5.1% SPY-relative strength indicate global infrastructure is losing capital flow to domestic opportunities. PAVE's 6.8% category-relative strength versus IGF's 0.0% proves that allocators prefer domestic capex exposure (bridges, roads, broadband) to global dividend infrastructure plays.
Utilities & Infrastructure earned 10% allocation on a 41.4 category score despite ranking seventh, because PAVE's 100.0 technical evidence is the highest-quality setup in the portfolio tied only with XLE, and the category macro fit (46.0/100) benefits from Transition/Mixed regime support (+4) even as inflation pressure creates headwind (-6). This is a technical allocation masking weak macro—credit stress active at -5 and inflation pressure active at -6 create a net -12 macro point headwind that inflation-sensitive infrastructure normally faces in this regime. PAVE holds due to exceptional technical strength (trend 100.0, momentum 94.2, volume-price 93.4, persistence 83.5) and because the domestic infrastructure narrative is resilient across political cycles. Risk management note: this is the weakest macro allocation in the portfolio on a relative basis; reduce if credit conditions tighten or if stochastic RSI rolls over from overbought. Position size reflects technical conviction over macro positioning.
Traditional Energy — XLE
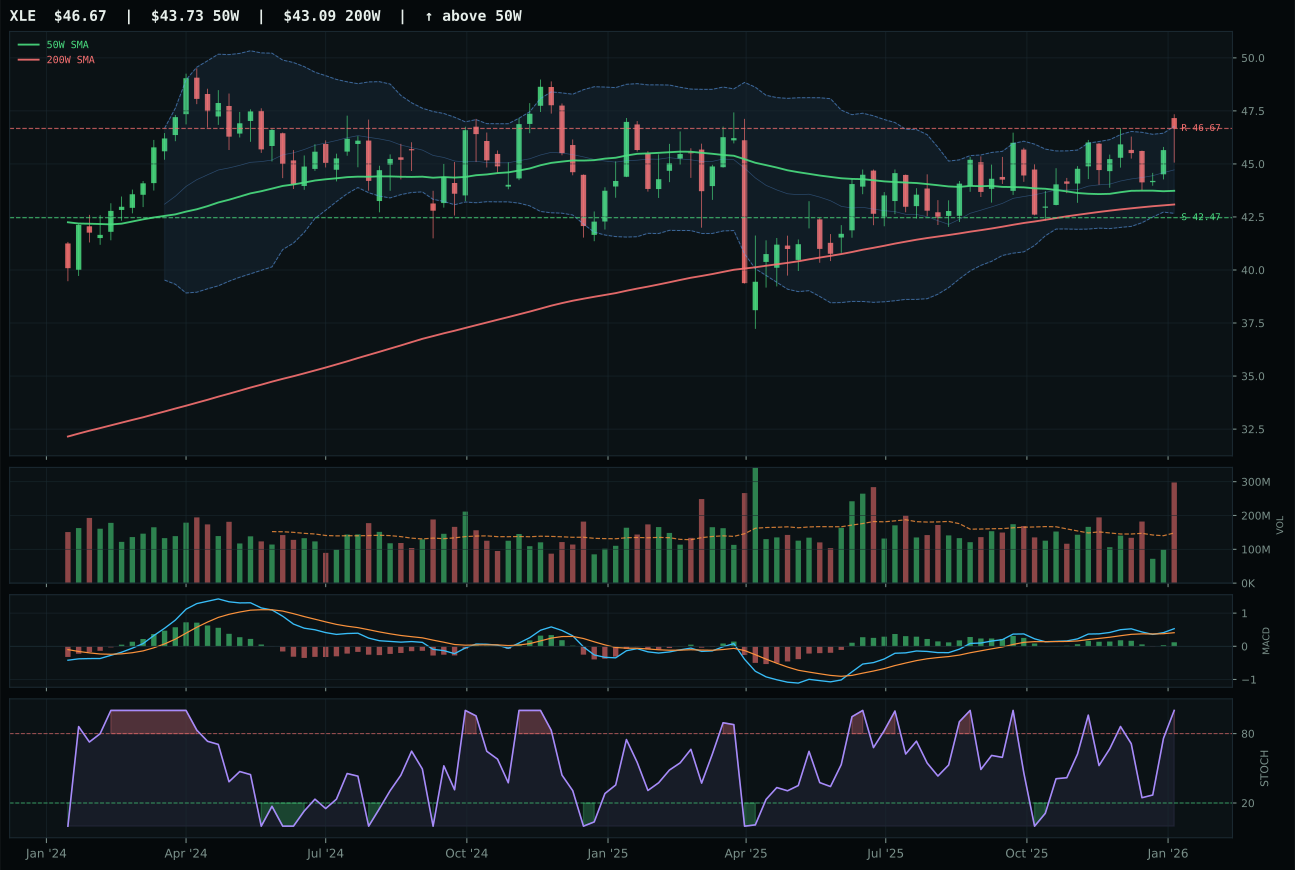
XLE has a neutral structure profile with 3.2% 13-week relative strength versus SPY.
A failed hold above support would weaken the setup.
Actionable but governed by invalidation levels.
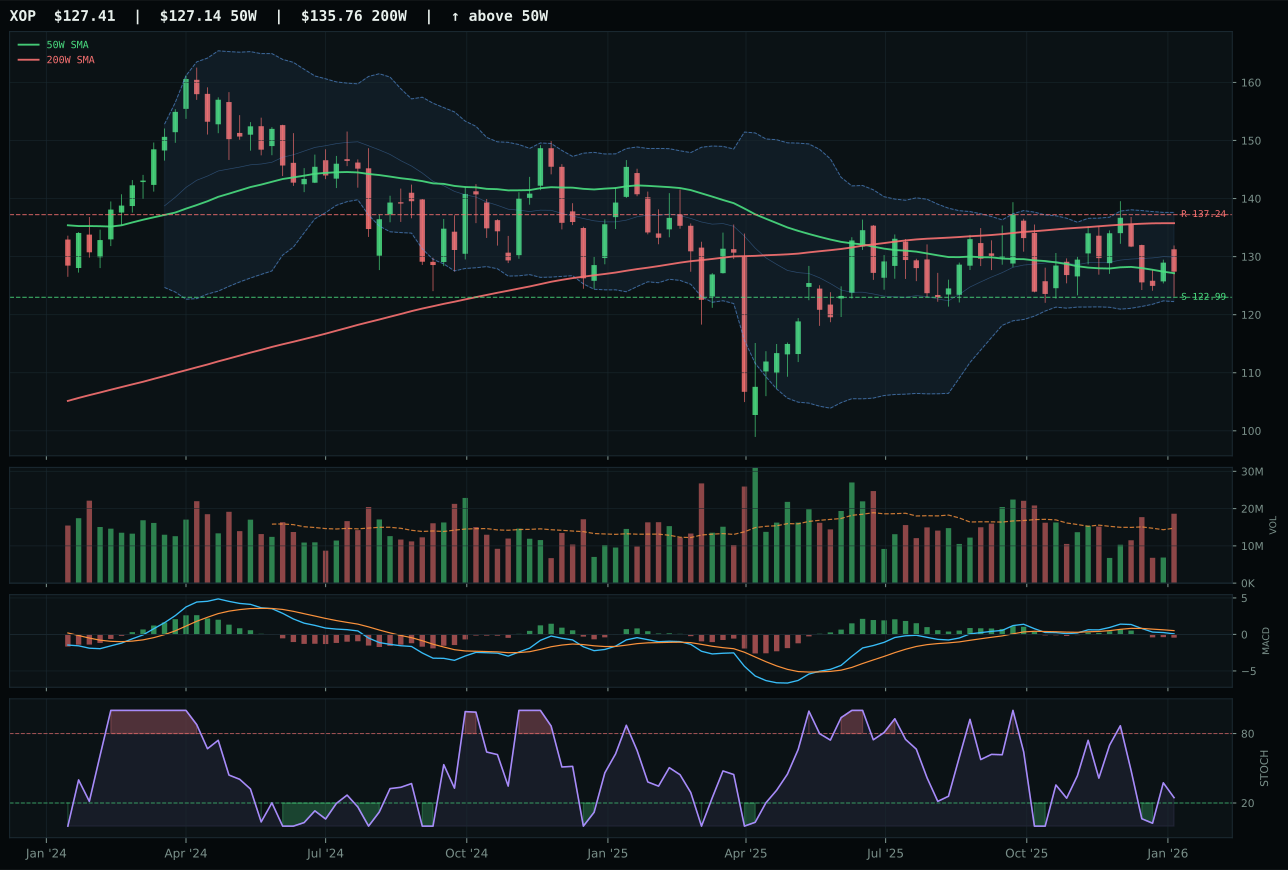
XOP has a pullback into support profile with -3.5% 13-week relative strength versus SPY.
A failed hold above support would weaken the setup.
Actionable but governed by invalidation levels.
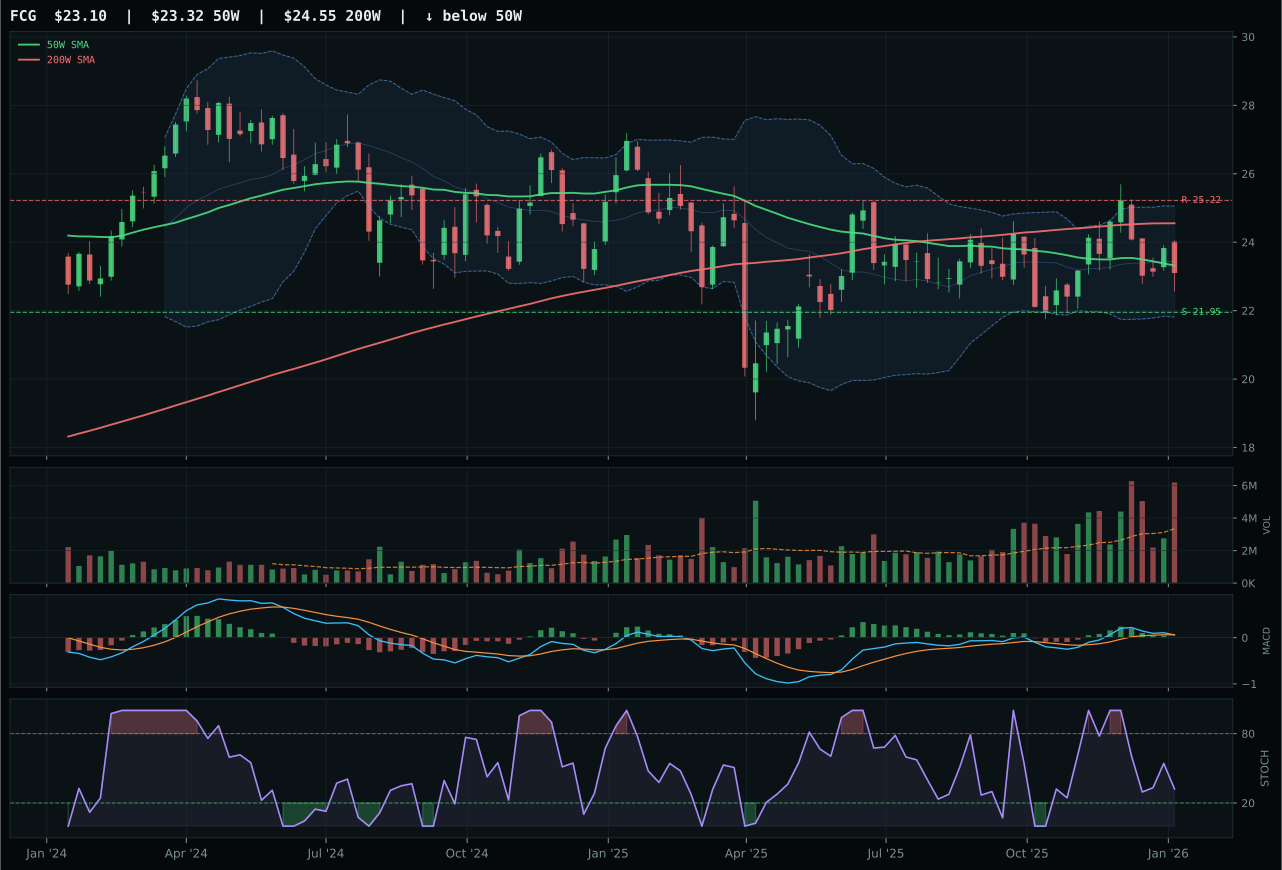
FCG has a compression near 50W profile with -1.8% 13-week relative strength versus SPY.
Extension and support failure are the main tactical risks.
Tracked, but not top-2 eligible because: structurally broken.
XLE demolished XOP with a 15.4-point score gap (40.3 vs 24.9 for XOP) by delivering 100.0 trend and 91.2 momentum confirmation scores paired with exceptional 94.4 technical evidence, whereas XOP's pullback-into-support setup at -10.2% RS versus SPY and bearish-weakening MACD left it unable to compete. XLE's structure cleanliness (75.0) and neutral structure setup deliver a 86.1 structure score versus XOP's 72.9, meaning XLE is coiling rather than breaking, making it the higher-probability reversal candidate. Volume participation for XLE at 2.01x accumulation/confirmation versus XOP's above-average distribution pressure confirms that smart money is rotating into integrated energy strength (steady dividends, cash flow, lower leverage) rather than speculation on exploration upside. XLE's 9.5% thirteen-week return and 5.1% category-relative strength establish it as the decisive category leader.
Traditional Energy is excluded from allocation this week, ranking 9th or 10th at 40.3 despite a strong macro fit of 85.0. Energy scarcity is active at +16, supply shortage at +9, inflation pressure at +10, and real asset sponsorship at +7—arguably the most favorable macro environment in the portfolio—yet the category fails technically. XLE's technical evidence is actually strong at 94.4, but the category-level score of 40.3 results from the 3/2/1 weighted basket being dragged lower by XOP and FCG, both of which show deteriorating momentum, bearish MACD, and weak relative strength. XLE itself is extended 6.7% above the 50W with zero upside to resistance and 9.9% downside, leaving no room for entry into a macro opportunity. The allocation decision reflects a simple truth: when the macro case for a category is strong but technical execution is weak, the portfolio waits for a cleaner setup. Energy's exclusion despite favorable macro is a direct cost of valuation and MACD deterioration in the category's secondary holdings.
Agriculture & Livestock — MOO
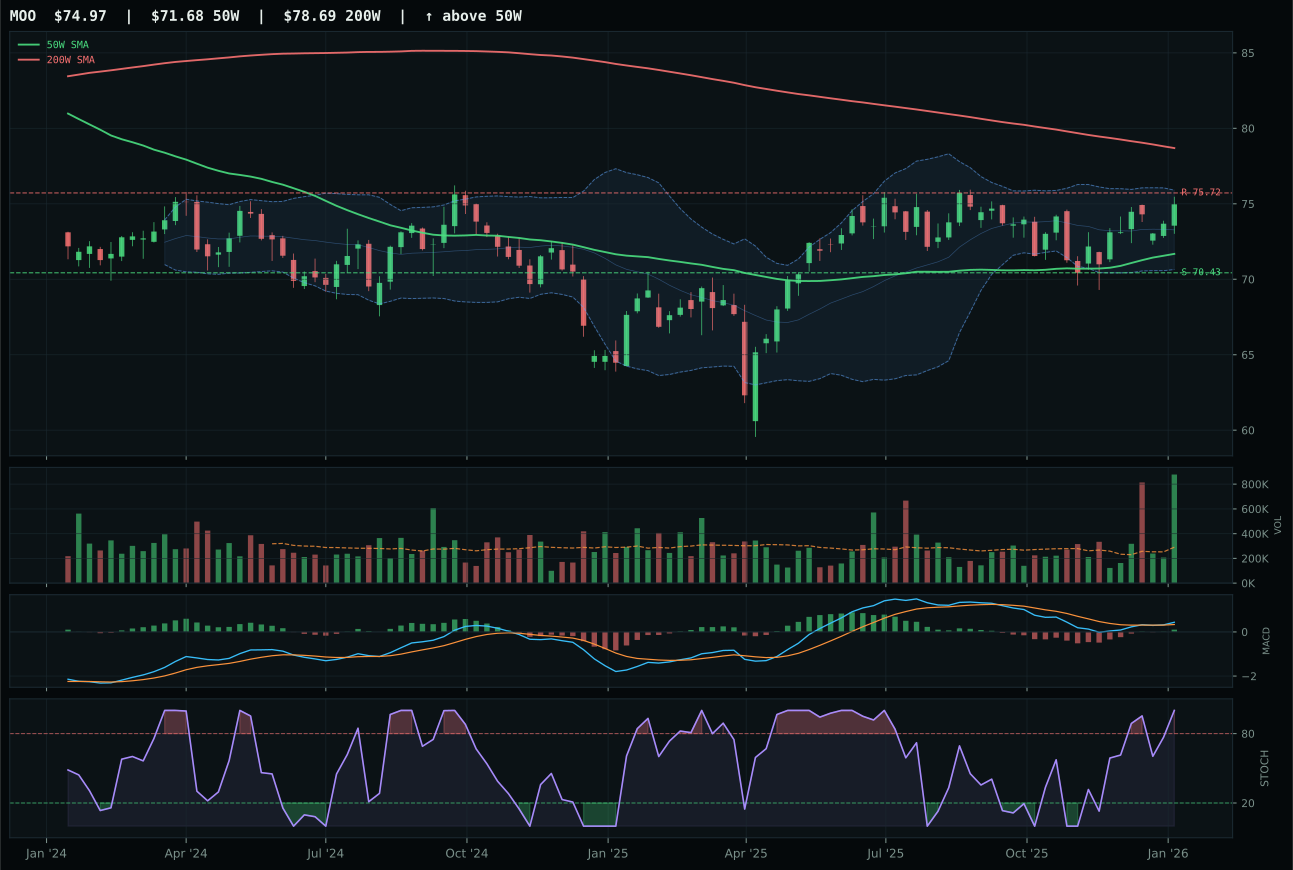
MOO has a neutral structure profile with -1.5% 13-week relative strength versus SPY.
A failed hold above support would weaken the setup.
Actionable but governed by invalidation levels.
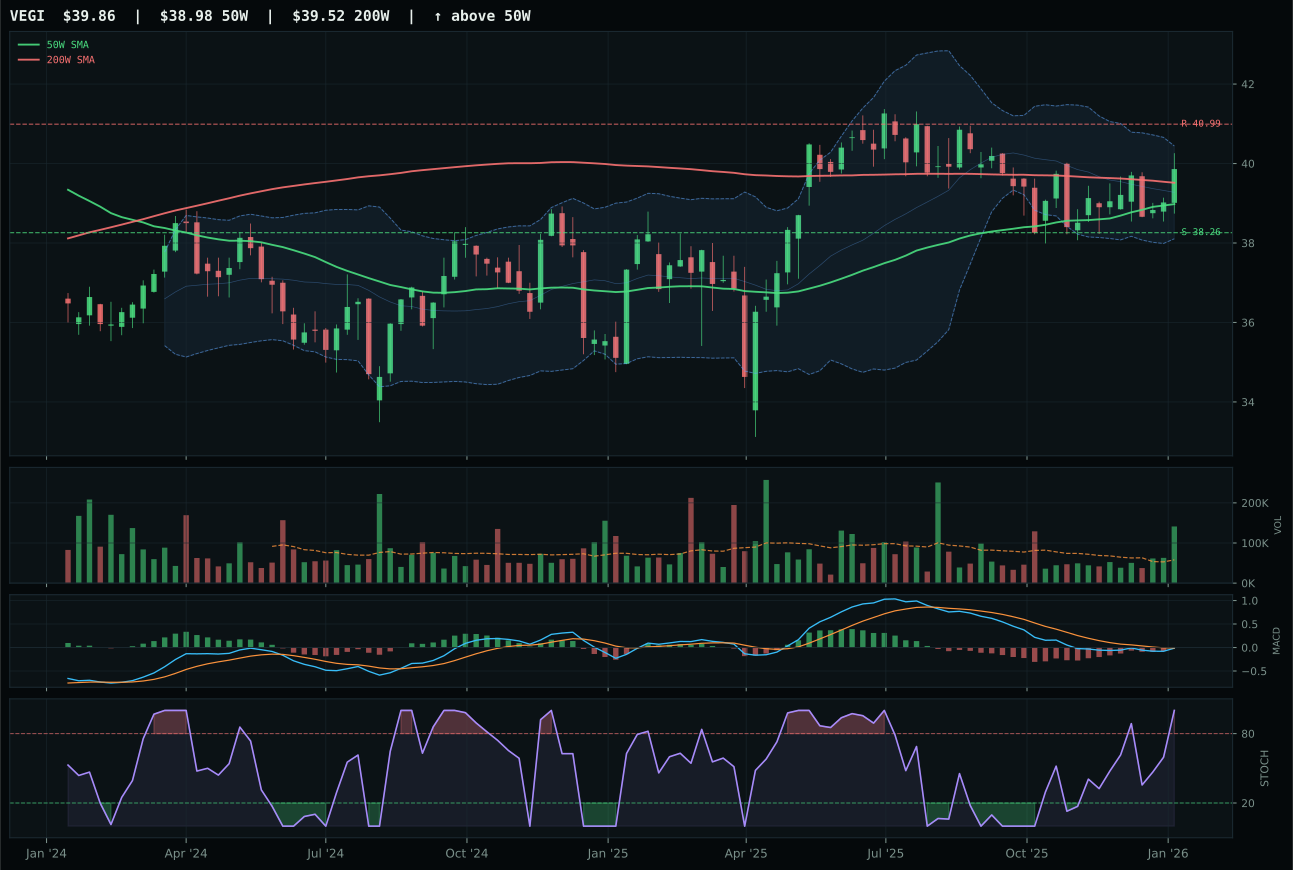
VEGI has a pullback into support profile with -2.1% 13-week relative strength versus SPY.
A failed hold above support would weaken the setup.
Tracked, but not top-2 eligible because: .
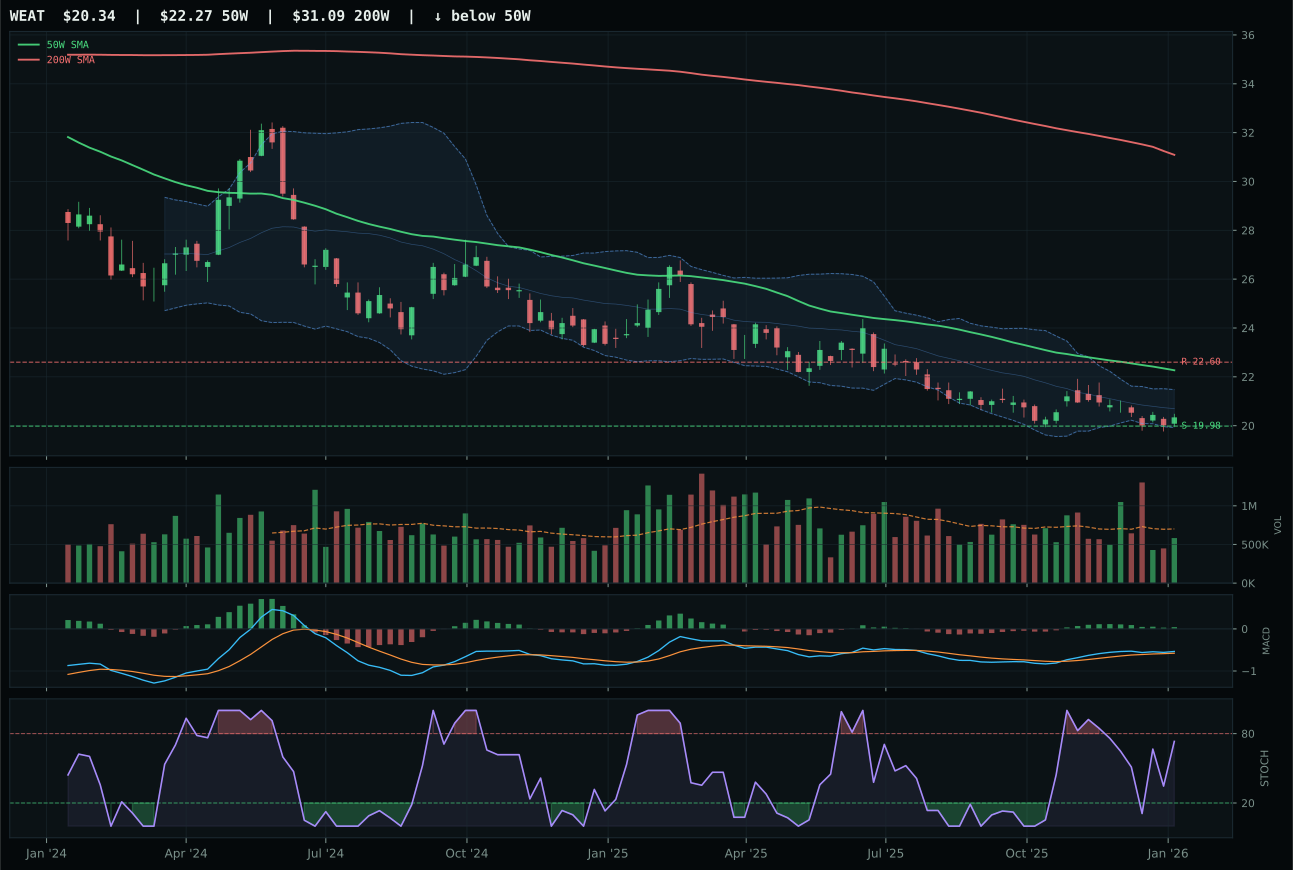
WEAT has a pullback into support profile with -5.6% 13-week relative strength versus SPY.
Extension and support failure are the main tactical risks.
Tracked, but not top-2 eligible because: structurally broken.
MOO won a weak category fight by posting 0.6% outperformance versus the peer median while VEGI managed only neutral (0.0%) relative strength within the group, and WEAT cratered at negative 5.6%. MOO's bullish-improving MACD and stochastic RSI at overbought 1.00 paired with massive 3.02x volume participation created a momentum picture that VEGI—with its bearish-but-improving MACD—could not match, despite VEGI's superior overall timing score (100 vs 90). The setup difference is critical: MOO sits in neutral structure at just 4.6% from the 50W, meaning extension risk is minimized and the chart is coiling for the next move, whereas VEGI's pullback-into-support configuration offers no upside confirmation. MOO's 90.0 timing score reflects its proximity to support and overbought stochastic, positioning the name as a potential breakout vehicle rather than a stretched leader.
Agriculture & Livestock is excluded from allocation this week, ranking 9th or 10th at a score of 38.6. The category's macro fit is actually strong at 86.0 with supply shortage (+13), inflation pressure (+10), real asset sponsorship (+8), and commodity breadth positive (+5) all active, yet technical evidence collapses to 90.3 only when weighted against a category-level score degraded by MOO's lack of category-relative strength and poor risk-reward at 44.8. The fundamental problem is not macro but timing: MOO is already 4.6% above the 50W and within 1.0 percentage points of resistance at 75.72, leaving minimal room for accumulation. While supply-side narratives favor real assets, MOO's extended positioning and neutral structure—combined with 13-week returns of just 4.8%—place this category outside the top eight where technical setups and risk-reward align with macro opportunity.