
2026-01-02
Informational purposes only. The content in this report, including allocations, analysis, and commentary, is provided solely for informational and educational purposes. It does not constitute financial advice, investment advice, trading advice, or any other type of advice. Past performance does not guarantee future results. Always conduct your own research and consult a qualified financial professional before making investment decisions.
Weekly Allocation
| Ticker | Category | Weight | Role |
|---|---|---|---|
| IEMG | Emerging Markets | 20% | Top-2 (20%) |
| COPX | Industrial Metals | 20% | Top-2 (20%) |
| SMH | AI | 10% | Tier-2 (10%) |
| SLV | Precious Metals | 10% | Tier-2 (10%) |
| XLK | Technology | 10% | Tier-2 (10%) |
| ITA | Defense & Aerospace | 10% | Tier-2 (10%) |
| PAVE | Utilities & Infrastructure | 10% | Tier-2 (10%) |
| URNM | Nuclear Energy | 10% | Tier-2 (10%) |
Trade Instructions — Monday Open
Sell the tranche from 2025-12-05 (completing its 4-week hold). Buy the new tranche. Instructions show net portfolio changes — same-asset positions cancel, weight changes show the delta.
| Action | Ticker | Instruction |
|---|---|---|
| SELL | SLV | Sell 12% of SLV position (reduce 20.00% → 17.50%) |
| SELL | FCG | Sell entire FCG position (2.50% of portfolio) |
| BUY | IEMG | Buy IEMG — 100.00% of freed cash (adds 5.00% to portfolio) |
Current Portfolio After Trade
Combined holdings across all 4 active tranches. Each tranche is 25% of the portfolio.
| Ticker | % of Portfolio | Weight Bar |
|---|---|---|
| COPX | 20.00% | |
| SLV | 17.50% | |
| PAVE | 10.00% | |
| IEMG | 10.00% | |
| IGV | 7.50% | |
| XAR | 7.50% | |
| SMH | 5.00% | |
| URNM | 5.00% | |
| BOTZ | 5.00% | |
| URA | 5.00% | |
| XLE | 2.50% | |
| XLK | 2.50% | |
| ITA | 2.50% |
Macro Regime — Risk-On Liquidity Expansion
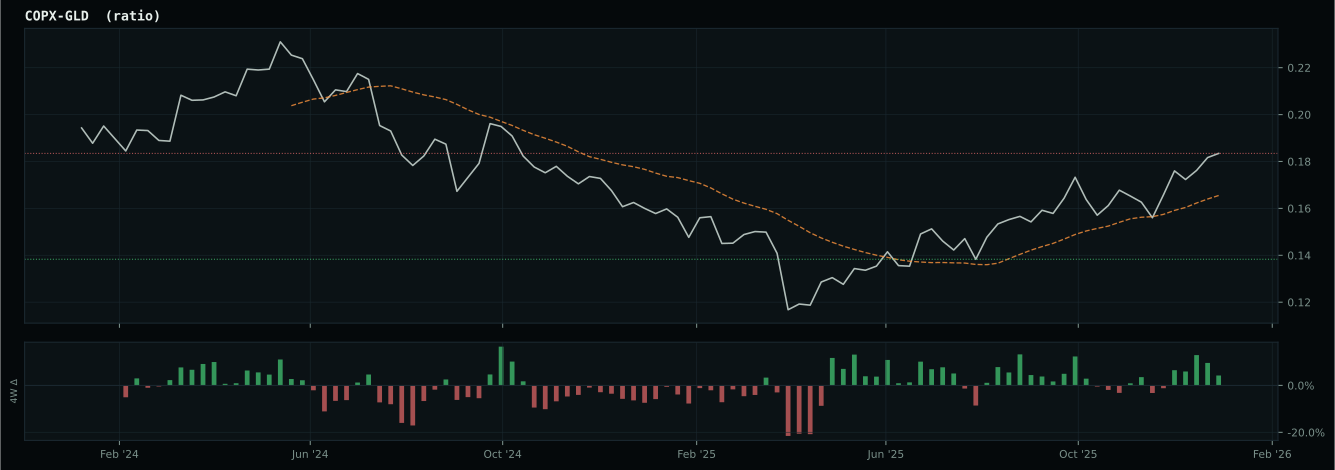
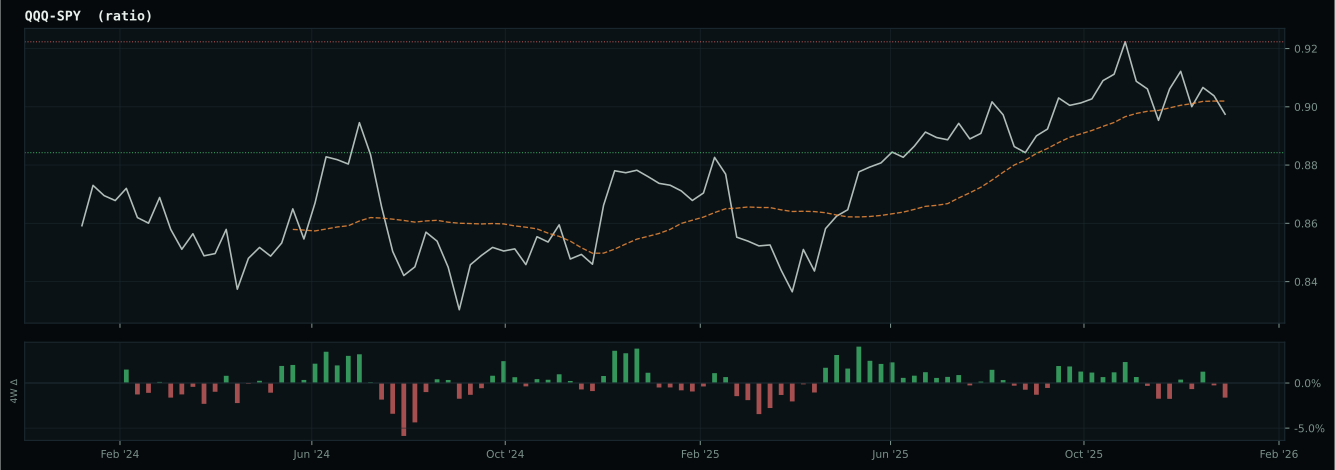
Macro Evidence Charts
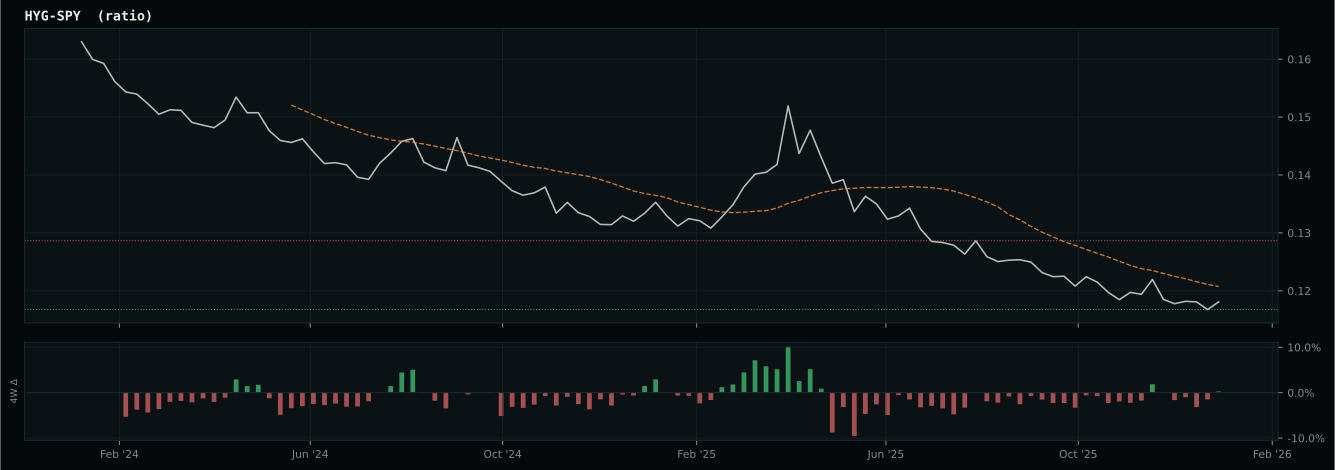
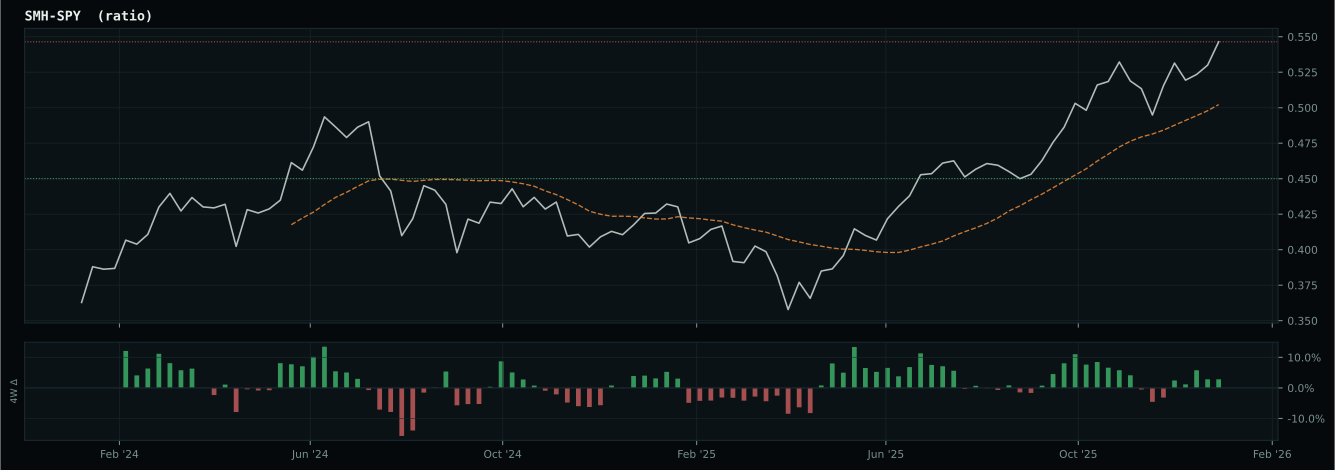
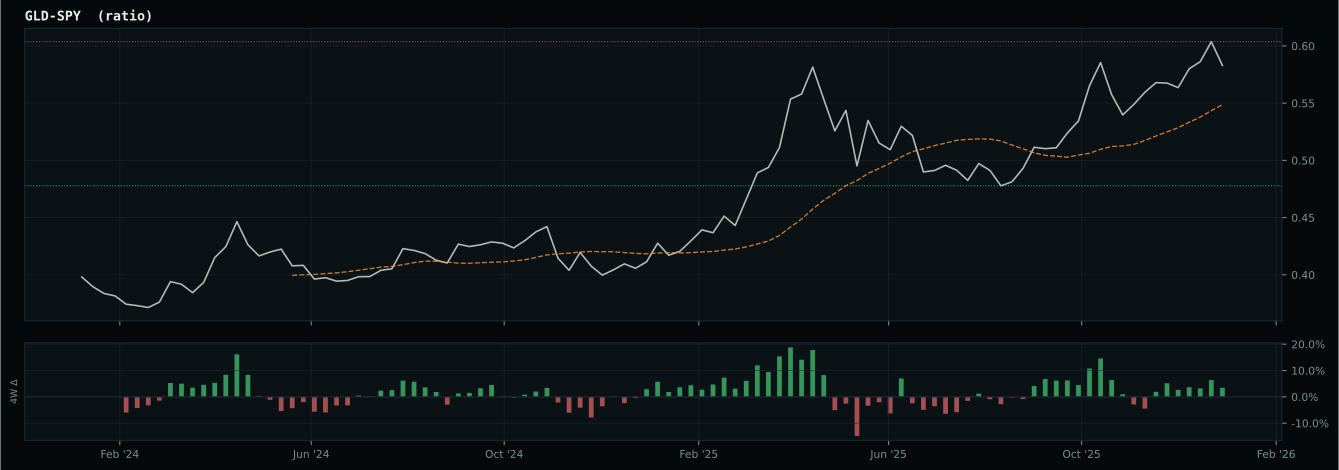
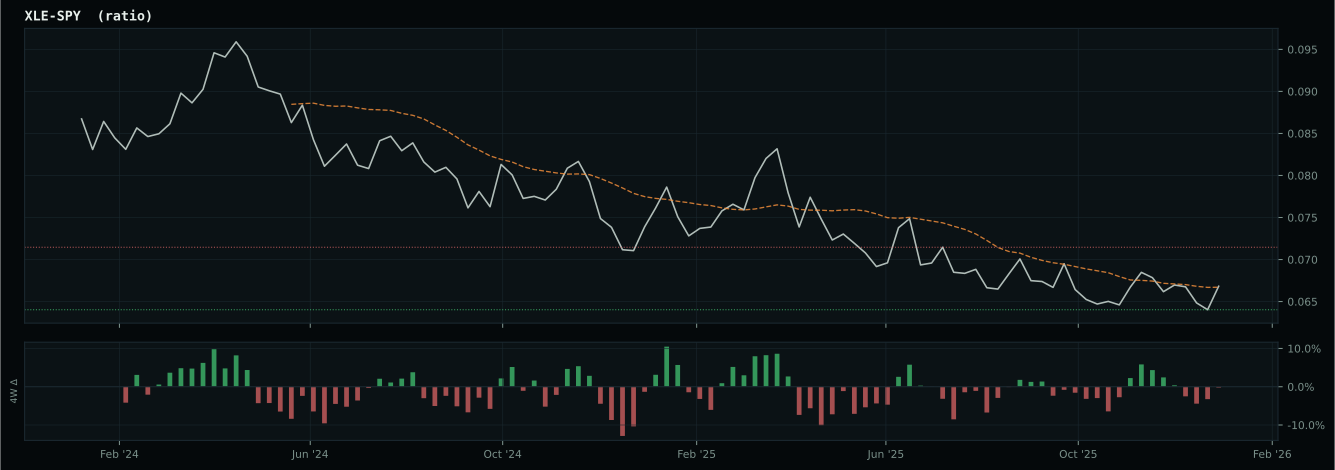
Market-implied signals behind the macro regime scores. Each ratio compares two assets; the direction and slope of the ratio is what the macro engine reads.
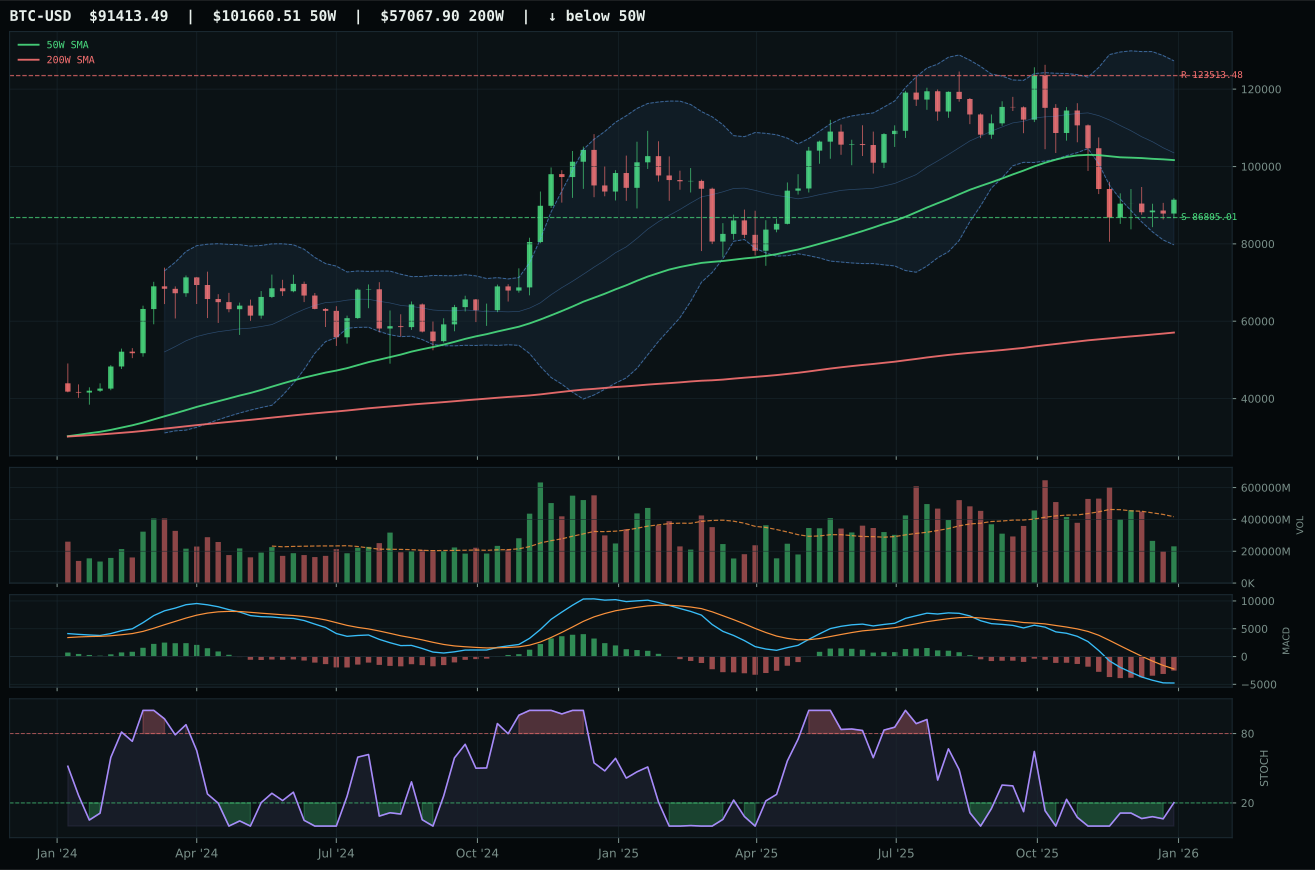
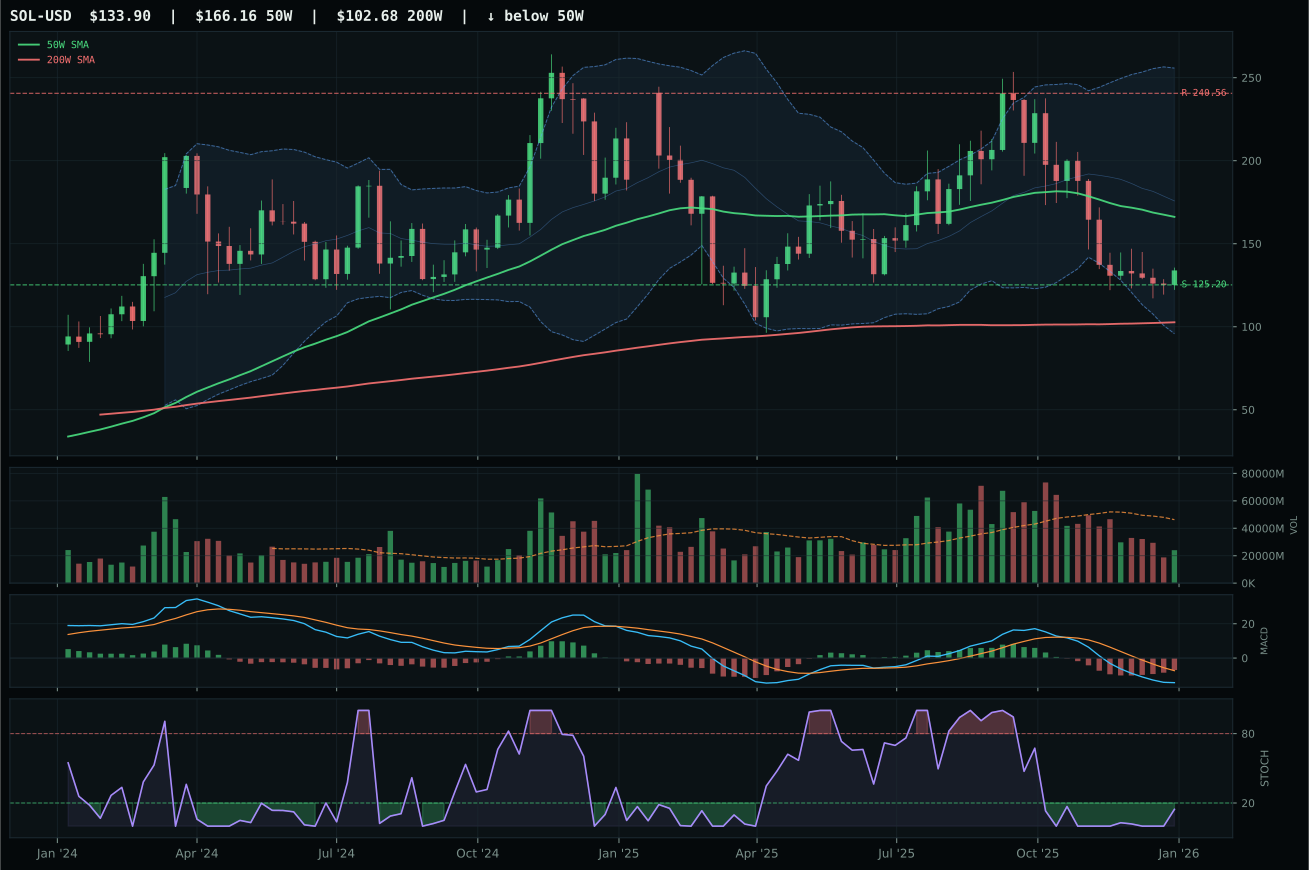
Crypto Regime — NoCrypto
ValueBTC not armed: BTC has not made the first post-breakdown touch of the 200W buy zone after losing the 50W
TrendBTC not confirmed
one or more available conditions failed
Category Rankings
| Rank | Category | Winner | Score | Alloc | 4W Ret | Peers (4W) |
|---|---|---|---|---|---|---|
| 1 | Emerging Markets | IEMG | 73.4 | 20% | +3.67% | ILF +14.0% · INDA -5.4% |
| 2 | Industrial Metals | COPX | 73.1 | 20% | +12.94% | PICK +8.6% · REMX +10.6% |
| 3 | AI | SMH | 64.0 | 10% | +4.49% | BOTZ -0.4% · AIQ -0.7% |
| 4 | Precious Metals | SLV | 63.0 | 10% | +6.26% | GLD +6.8% · GDX +7.1% |
| 5 | Technology | XLK | 53.5 | 10% | -1.70% | IGV -11.9% · CIBR -3.3% |
| 6 | Defense & Aerospace | ITA | 44.2 | 10% | +3.42% | XAR +6.7% · ROKT +11.9% |
| 7 | Utilities & Infrastructure | PAVE | 41.9 | 10% | +3.35% | IGF +3.6% · XLU +0.3% |
| 8 | Nuclear Energy | URNM | 37.5 | 10% | +21.62% | NLR +9.1% · URA +15.1% |
| 9 | Traditional Energy | XLE | 34.9 | 0% | +6.23% | FCG +3.0% · XOP +3.1% |
| 10 | Agriculture & Livestock | MOO | 30.3 | 0% | +8.92% | VEGI +8.7% · WEAT +3.1% |
Emerging Markets — IEMG
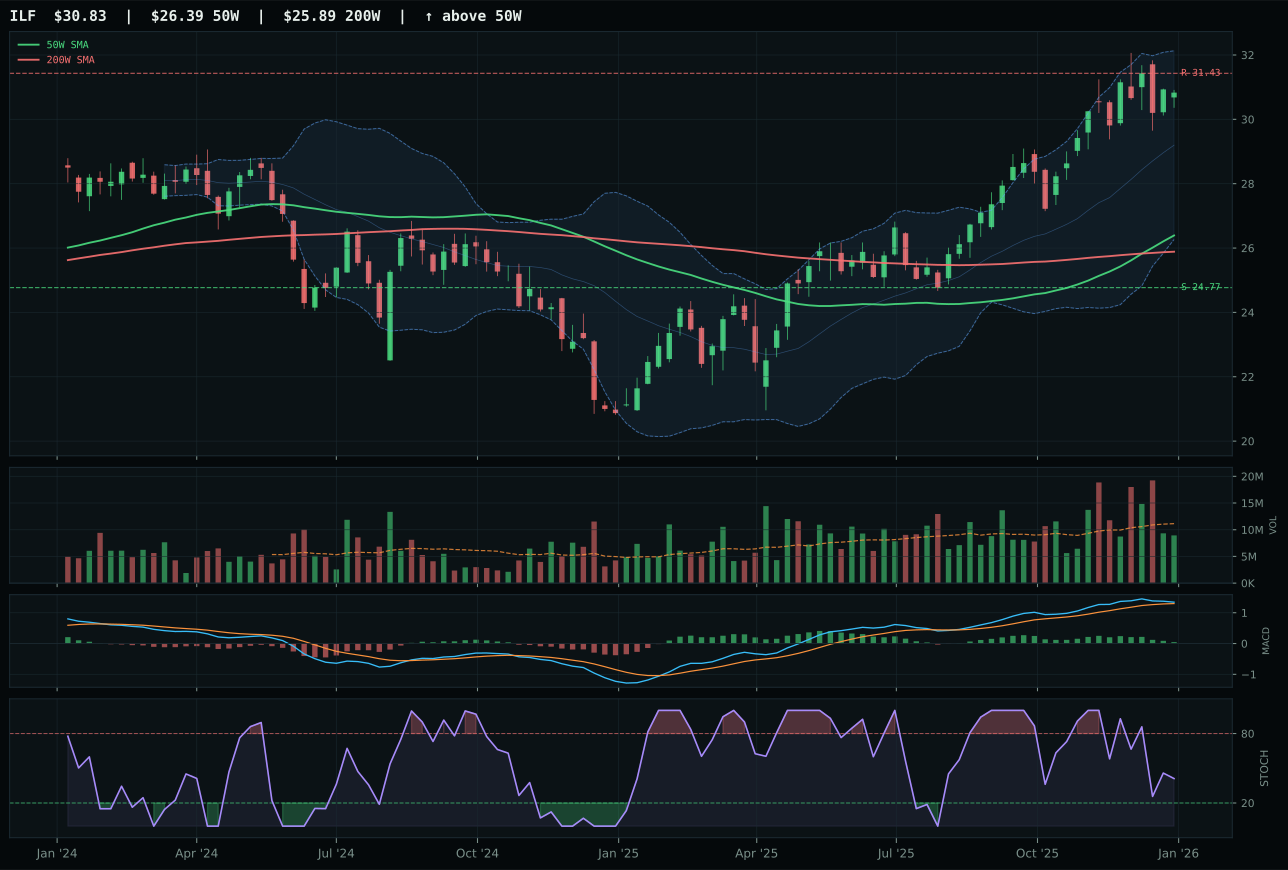
ILF has a vertical extension profile with 6.6% 13-week relative strength versus SPY.
A failed hold above support would weaken the setup.
Actionable but governed by invalidation levels.
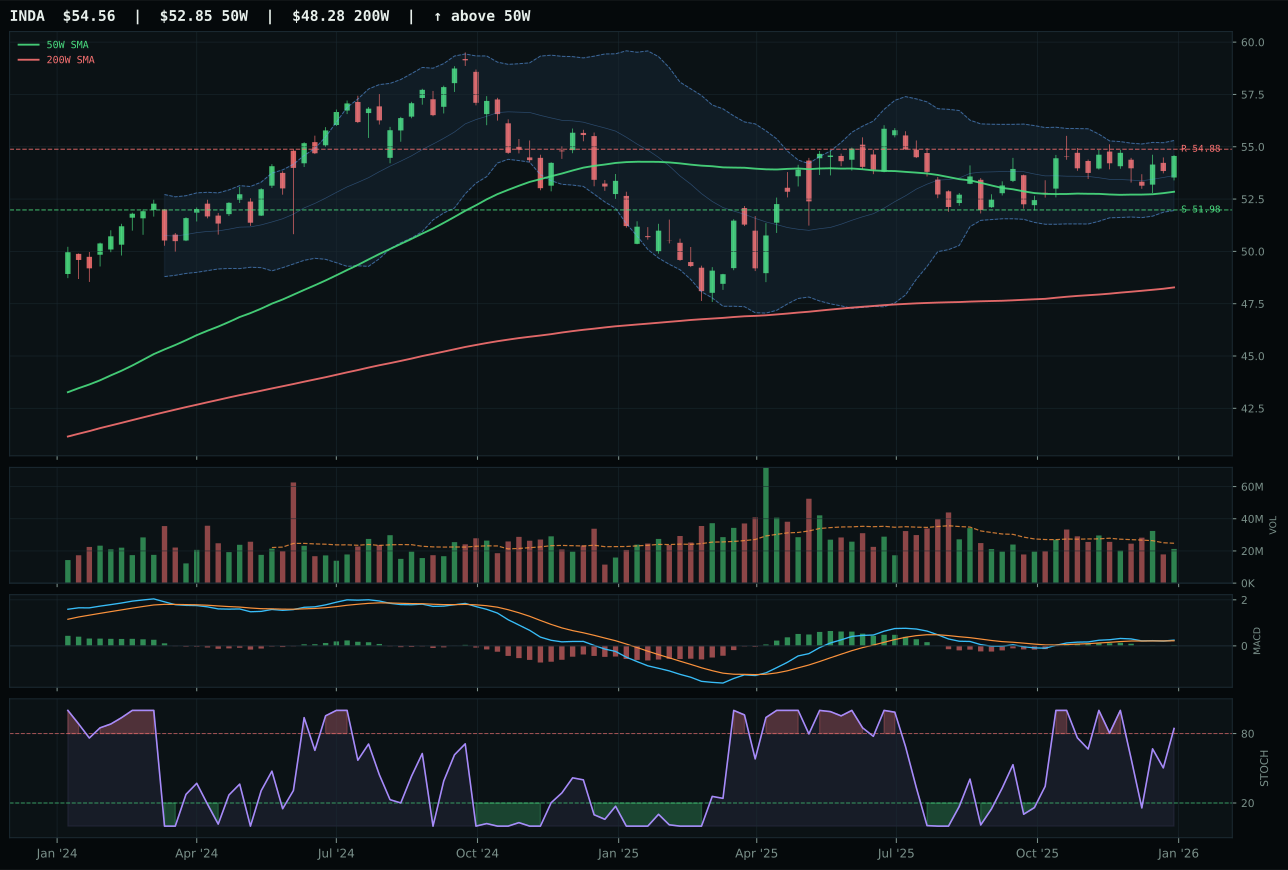
INDA has a pullback into support profile with 1.9% 13-week relative strength versus SPY.
A failed hold above support would weaken the setup.
Actionable but governed by invalidation levels.
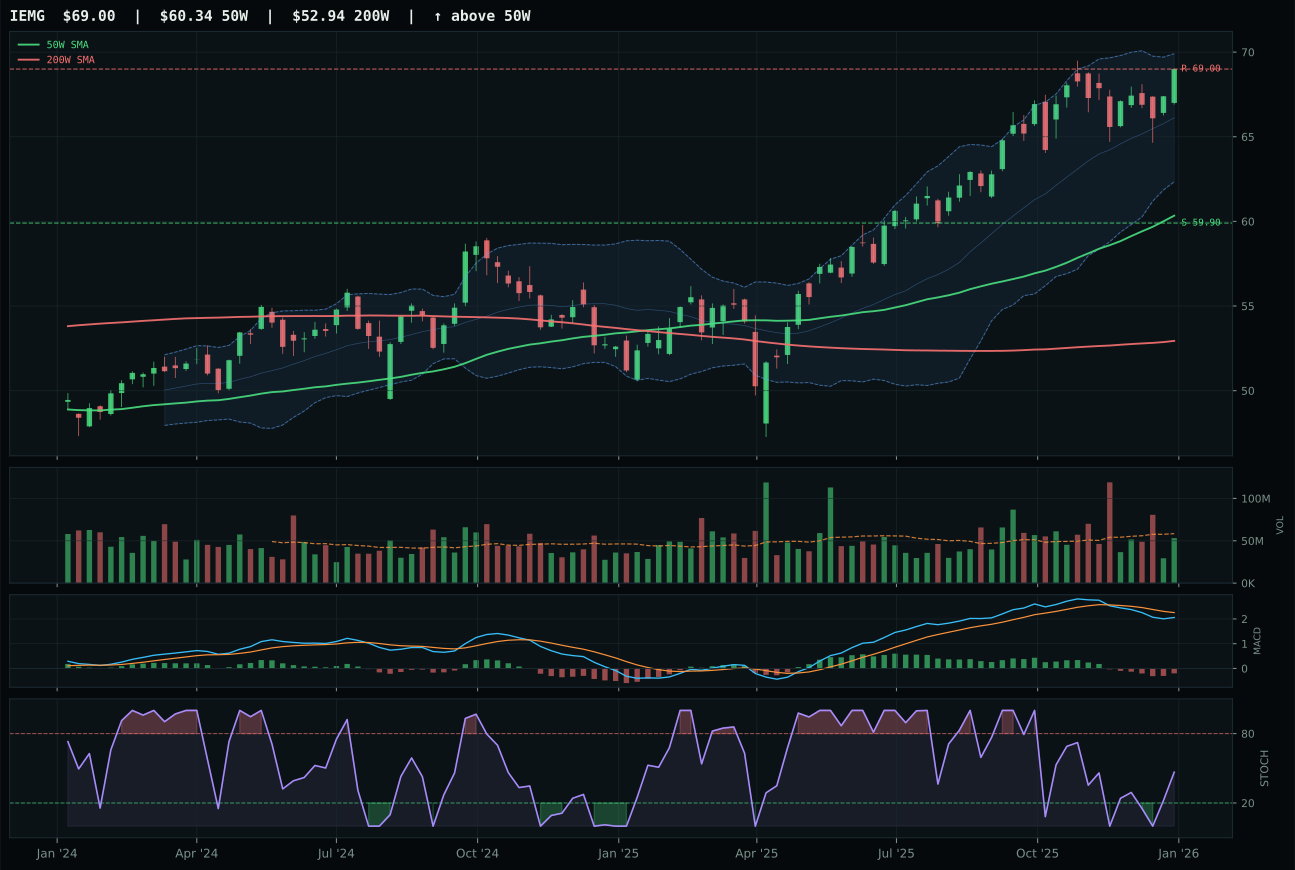
IEMG has a neutral structure profile with 1.0% 13-week relative strength versus SPY.
A failed hold above support would weaken the setup.
Actionable but governed by invalidation levels.
IEMG captured the category despite ranking third in reasoned technical evidence (55.2 versus INDA's 75.7) because it won the representative selection on better category-relative strength (-0.9% vs INDA/ILF) and a setup structure that is cleaner on macro fit. The ETF holds price above the 50W and 200W with a respectable 0.6% slope, but the bearish-and-weakening MACD is a material caution: 70.0 timing score reflects distance to 50W (14.4%) and rising-mid-zone stochastic RSI, not confirmation strength. The runner-up ILF delivered superior momentum (8.7% 13W, 6.6% SPY-relative) and bullish-but-flattening MACD, but its timing score of 48.0 lost decisively to IEMG's 70.0, meaning ILF is further extended and its stochastic RSI is falling/neutral (deteriorating). INDA posted the strongest technical evidence but fell victim to overbought stochastic RSI momentum and a pullback-into-support setup that raised entry risk.
Emerging Markets earned its 20% top-2 allocation because it is the portfolio's cleanest macro bet on liquidity expansion: category-level macro-fit reaches 88.0/100, driven by EM liquidity support at +14, liquidity expansion at +8, and risk appetite positive at +8. This is the regime's strongest single expression—easy money flowing into undervalued emerging-market equities during a period of Fed accommodation and rising risk appetite. The 73.4 category score ties with Industrial Metals as conviction bets, and IEMG's neutral structure at 77.7 cleanliness provides entry geometry superior to ILF's extension. However, IEMG's bearish-and-weakening MACD is a critical warning: the momentum signal is rolling over even as the trend remains intact, which suggests the early-stage of a pullback. The 43.3 momentum confirmation is weak and volume-price confirmation sits at only 47.5, meaning the accumulation pattern is subtle rather than aggressive. Build the position gradually on weakness toward the 50W support at 59.90; if IEMG closes below that level, conviction on emerging markets shifts and allocation should rotate to a higher-conviction entry.
Industrial Metals — COPX
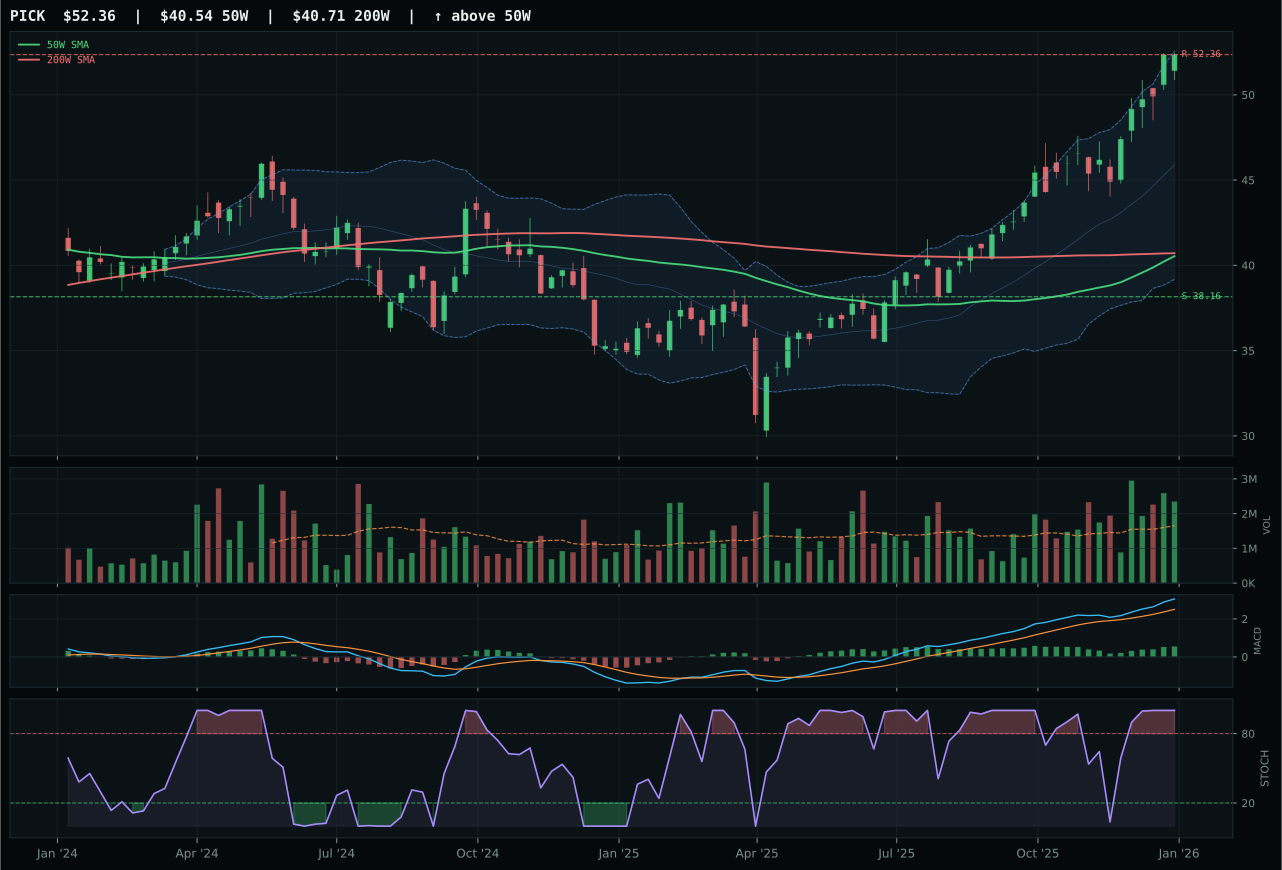
PICK has a vertical extension profile with 13.1% 13-week relative strength versus SPY.
A failed hold above support would weaken the setup.
Actionable but governed by invalidation levels.
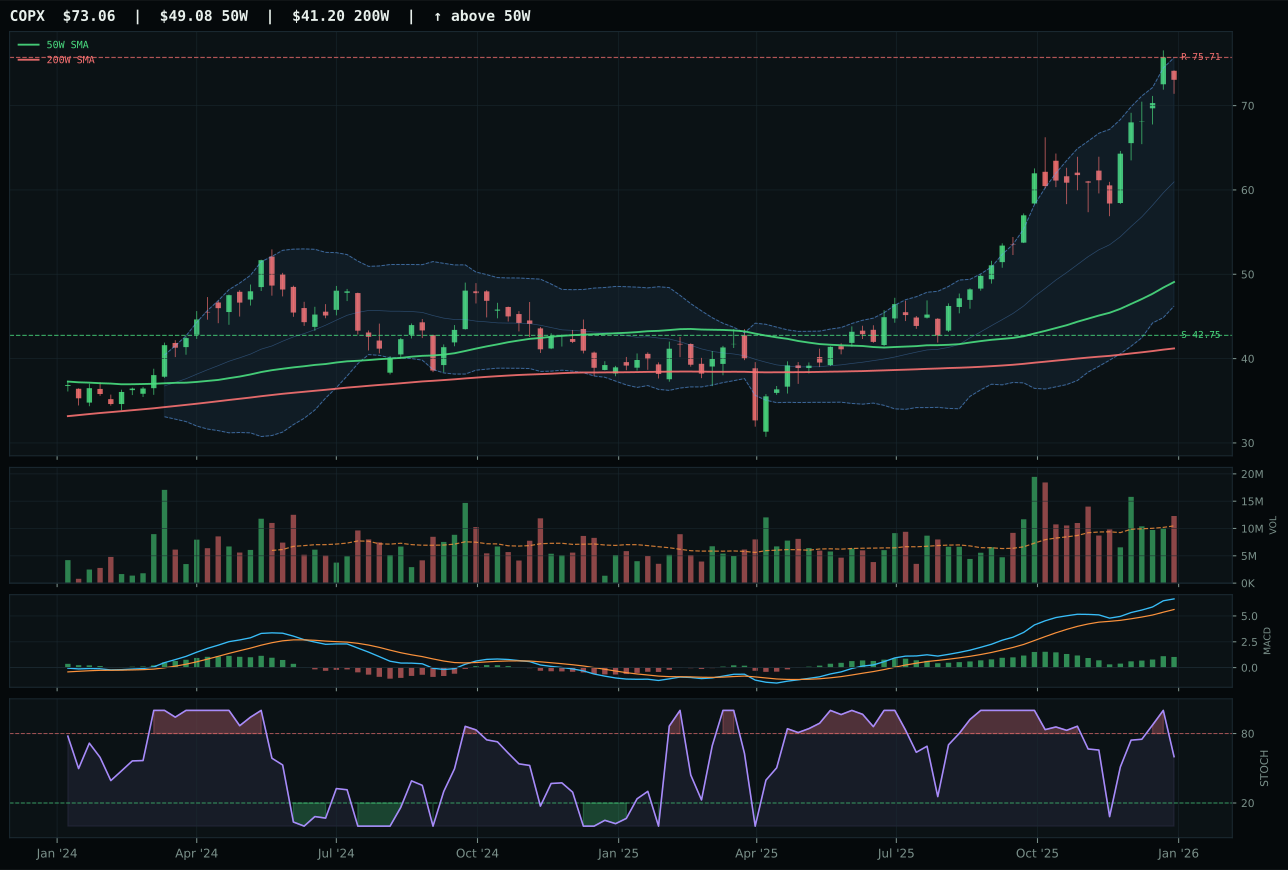
COPX has a vertical extension profile with 15.8% 13-week relative strength versus SPY.
A failed hold above support would weaken the setup.
Actionable but governed by invalidation levels.
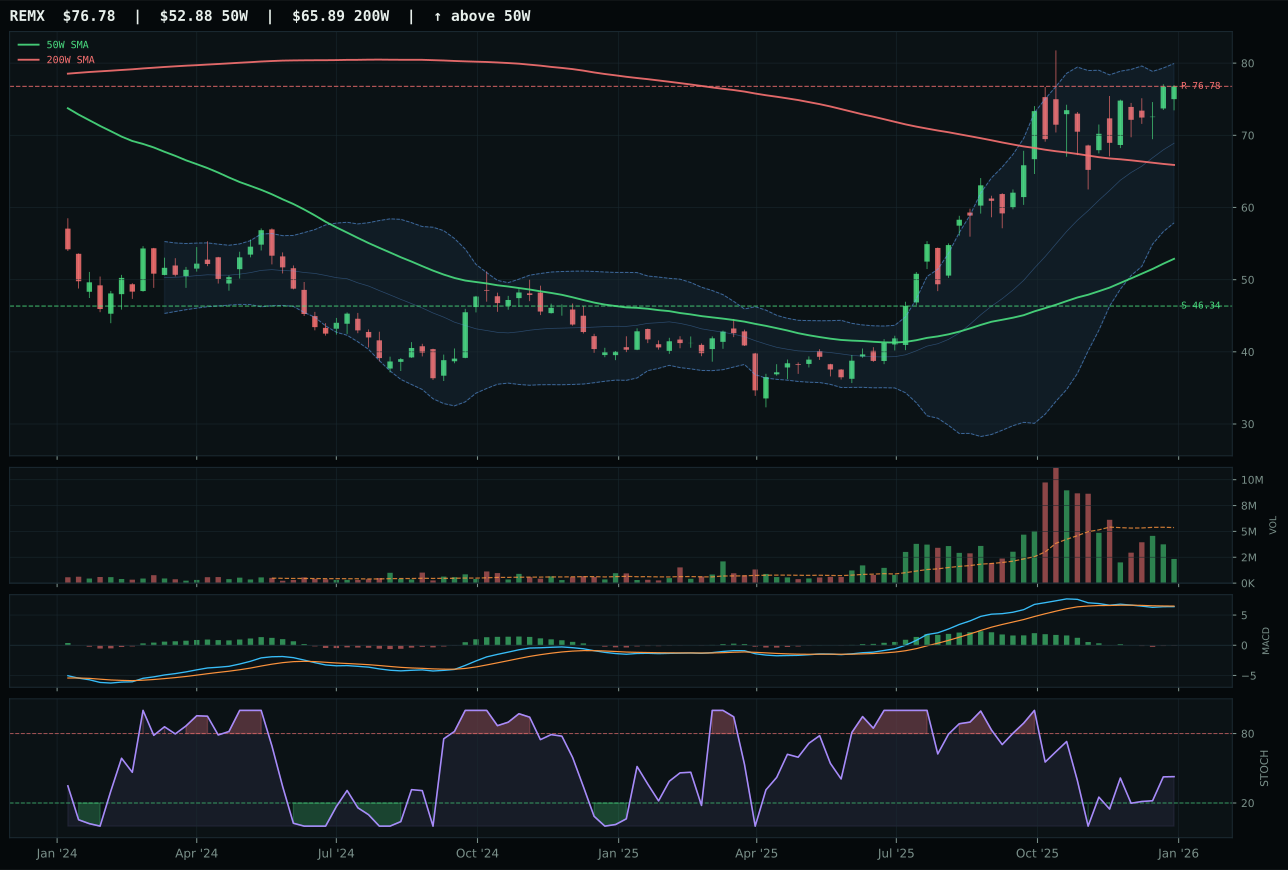
REMX has a vertical extension profile with 2.6% 13-week relative strength versus SPY.
A failed hold above support would weaken the setup.
Actionable but governed by invalidation levels.
COPX won narrowly over PICK (a 0.6-point margin on a 73.1 category score) by capturing superior timing (45.0 versus 37.0) and category-relative strength (2.7% versus 0.0%) in a setup that both delivered equally: 17.9% 13W return, bullish-and-improving MACD, and vertical extension above the 50W at 48.8%. The spread is razor-thin because both ETFs are pricing in copper scarcity and cyclical manufacturing demand, and both are extended beyond comfortable entry zones. COPX's 1.17x above-average volume participation says institutional accumulation is ongoing, whereas PICK's overbought stochastic RSI (a momentum extreme) and rising-mid-zone reading suggest the move is hitting distribution at supply. The 50W slope at 1.4% and 15.8% SPY-relative strength confirm the primary trend is intact, but at 48.8% extension the category is pricing in perfection—mean-revert setups will be found lower.
Industrial Metals earned its 20% top-2 allocation because it is the portfolio's second-strongest macro setup: category-level macro-fit reaches 79.0/100, driven by metals scarcity at +14 and commodity breadth positive at +10, with credit stress providing only a mild -7 headwind. This is a direct bet on infrastructure spending, EV demand, and supply-side tightness in copper, and the Risk-On Liquidity Expansion regime feeds all three. The category's 73.1 score ties it with Emerging Markets as the portfolio's twin conviction bets. COPX's 78.7 technical evidence and 69.0 macro-fit are strong, and its 1.17x volume participation says accumulation is real. However, the entry is extended and risk-reward sits at only 37.9/100 with 70.9% downside exposure to support—this is a position to build into weakness, not chase aggressively. If COPX breaks below 42.75 on above-average volume, conviction on the category diminishes and the allocation should shift to defensive waiting.
AI — SMH
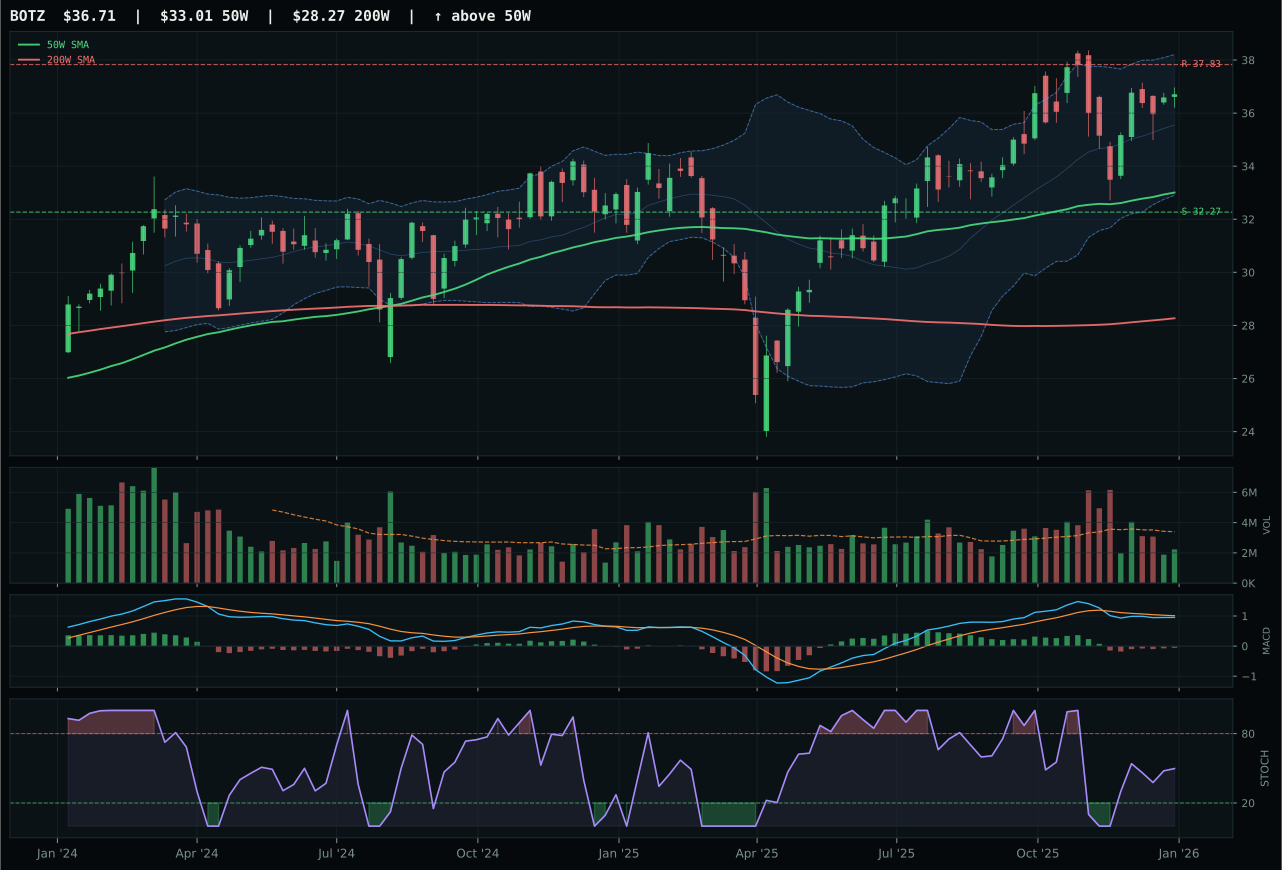
BOTZ has a neutral structure profile with -2.2% 13-week relative strength versus SPY.
A failed hold above support would weaken the setup.
Actionable but governed by invalidation levels.
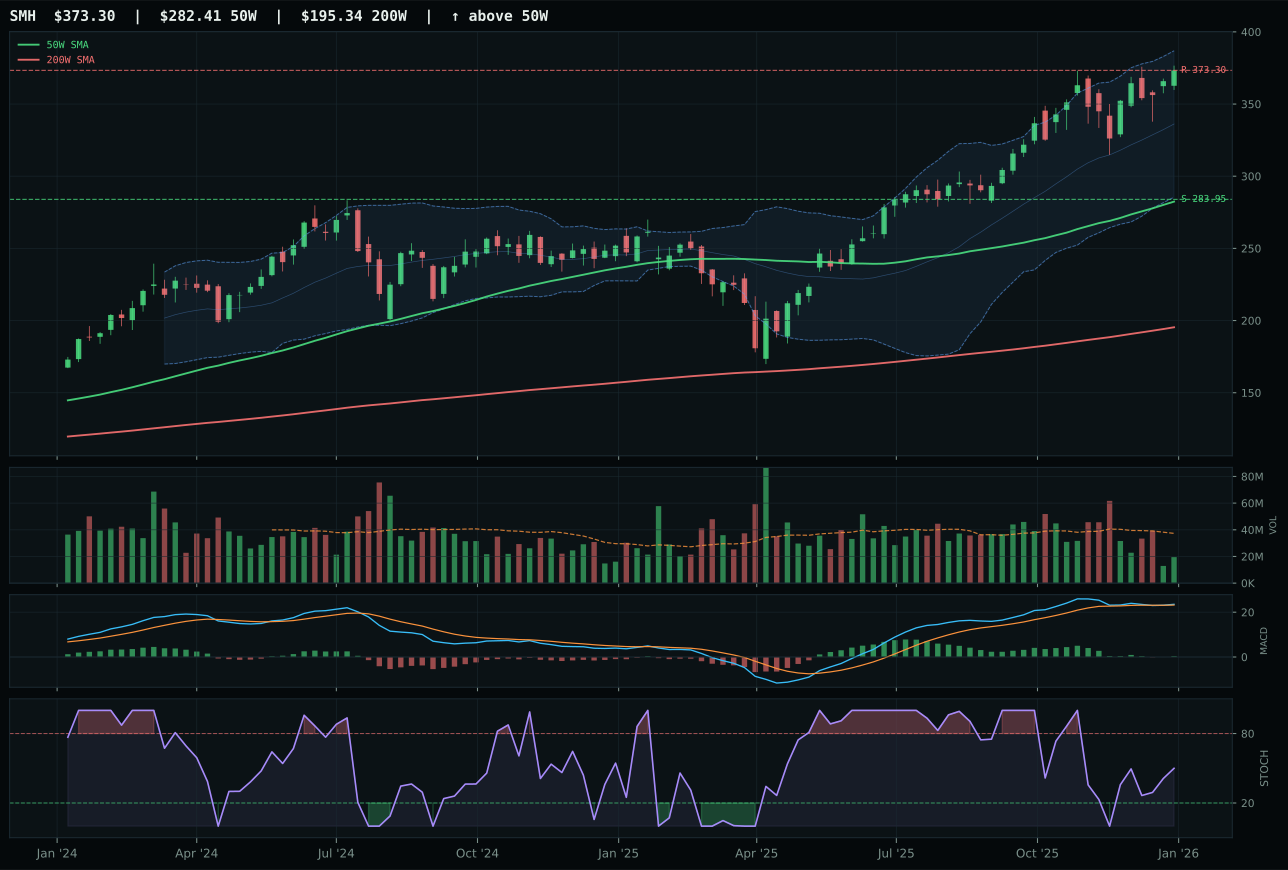
SMH has a vertical extension profile with 8.8% 13-week relative strength versus SPY.
A failed hold above support would weaken the setup.
Actionable but governed by invalidation levels.
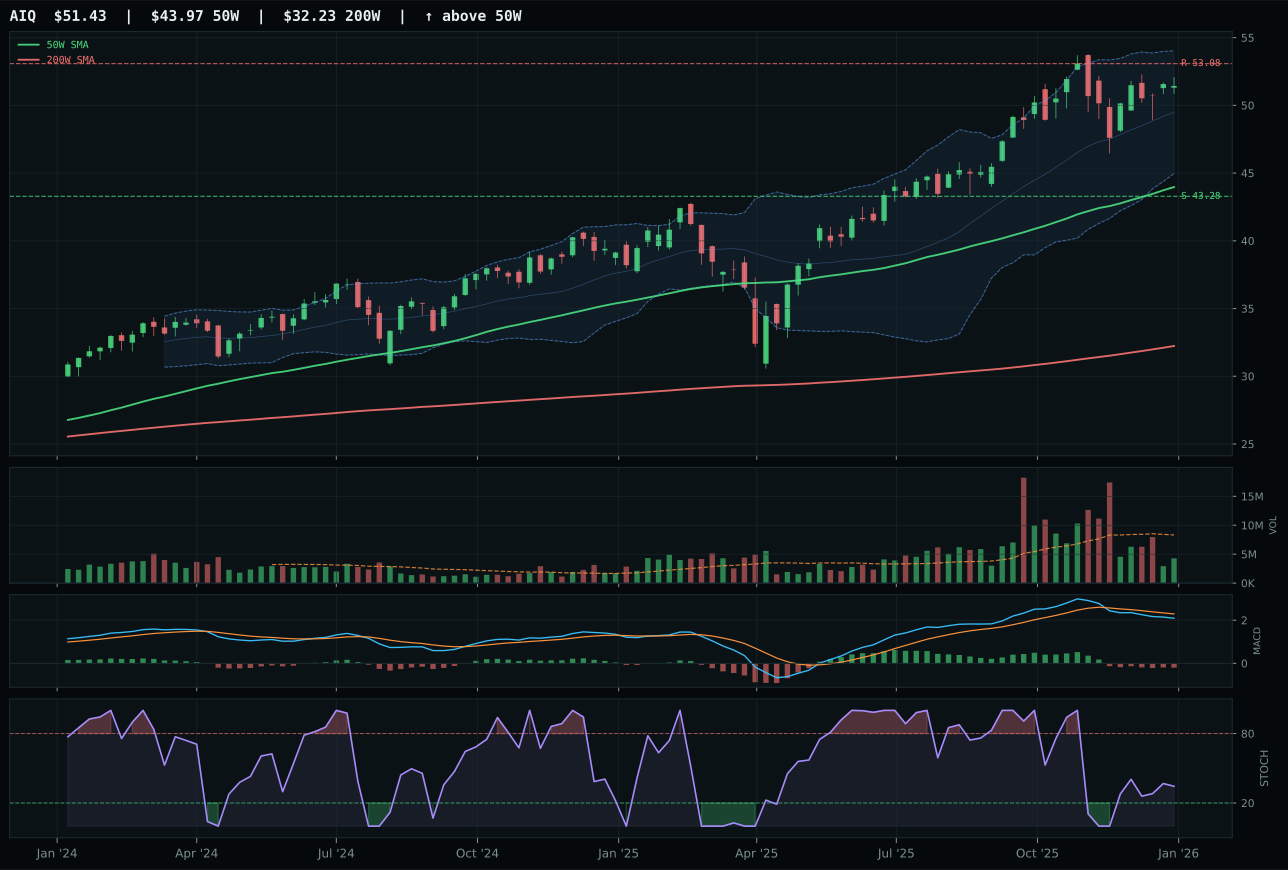
AIQ has a vertical extension profile with 0.3% 13-week relative strength versus SPY.
A failed hold above support would weaken the setup.
Actionable but governed by invalidation levels.
SMH won by combining perfect trend confirmation (100/100) with exceptional 13W momentum (10.9%) and category-relative outperformance (8.4%), even though the price sits 32.2% above the 50W and entry risk is acute. The bull case is unambiguous: a +0.8% 50W slope, 8.8% SPY-relative strength, and bullish-but-flattening MACD all say the move has structural support, not just technical momentum. The runner-up BOTZ delivered superior near-term timing (83 vs 48) and kept its structure tighter (71.6 vs 72.5), but it delivered zero category-relative strength, carried a bearish-but-improving MACD that lags SMH's bullish signal, and failed to ignite the 13W return (only -0.1% versus SMH's 10.9%). At extreme extension, SMH is a trade for buyers who already own it; new entries face the reality that 100.0% upside at resistance is priced in and downside to support is 31.5%.
AI's 64.0 score and 10% allocation reflect a category with elite macro fit (98.0/100) but middling entry quality. Risk-on liquidity expansion is a direct positive for semiconductor and compute spending, and AI growth sponsorship is live at +14 basis points of macro weight. The category's problem is not conviction—it is that both SMH and BOTZ are too extended to anchor a 20% position right now, and AIQ is uninspiring. The allocation holds because the macro regime genuinely supports this sector and because SMH's momentum is real enough to reward patience if you can accept the entry risk. What would push AI to top-2: either a 10-15% pullback into the 50W that re-syncs entry quality with conviction, or a break above resistance on sustained volume that validates the extension as a new floor rather than a liquidation trap.
Precious Metals — SLV
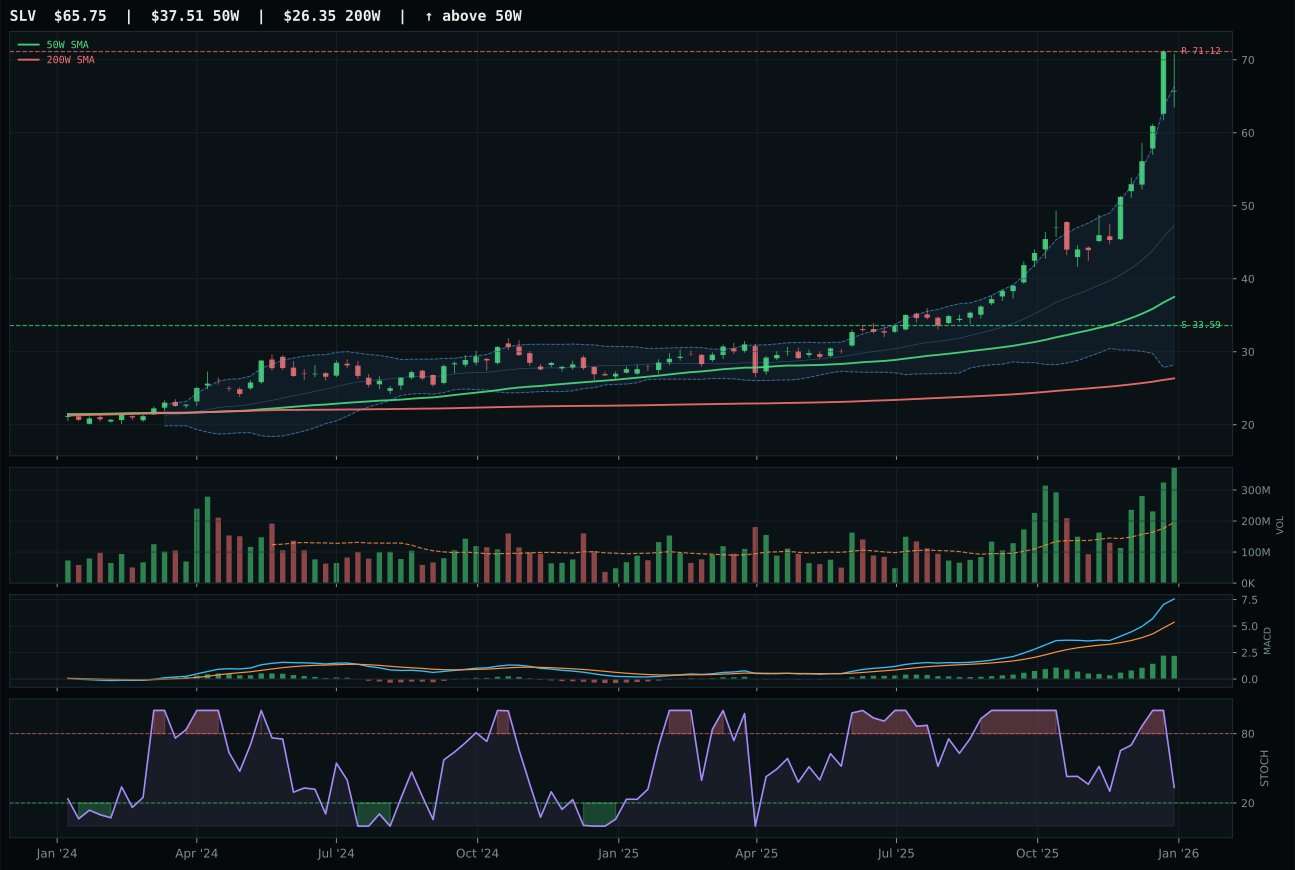
SLV has a vertical extension profile with 49.0% 13-week relative strength versus SPY.
A failed hold above support would weaken the setup.
Actionable but governed by invalidation levels.
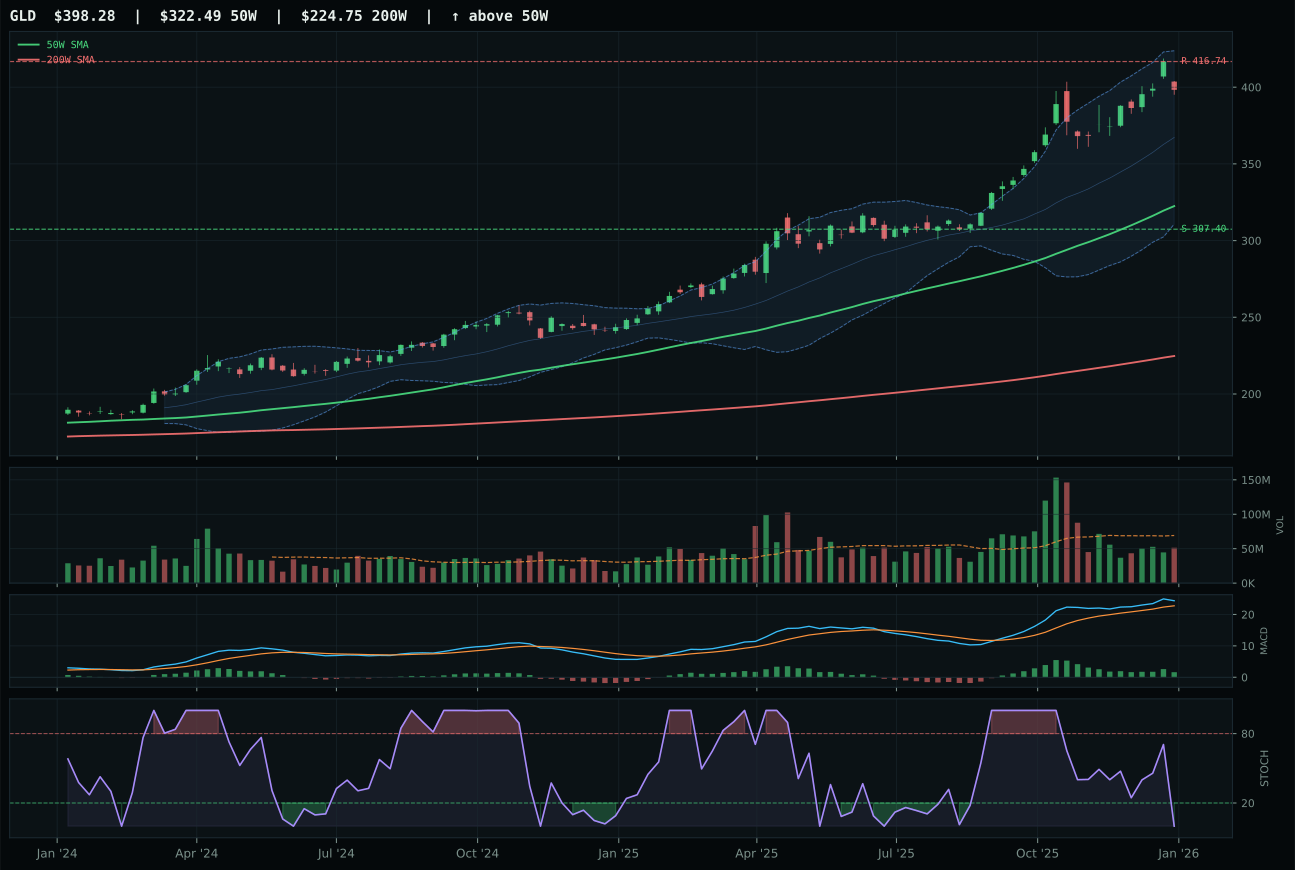
GLD has a vertical extension profile with 9.3% 13-week relative strength versus SPY.
A failed hold above support would weaken the setup.
Actionable but governed by invalidation levels.
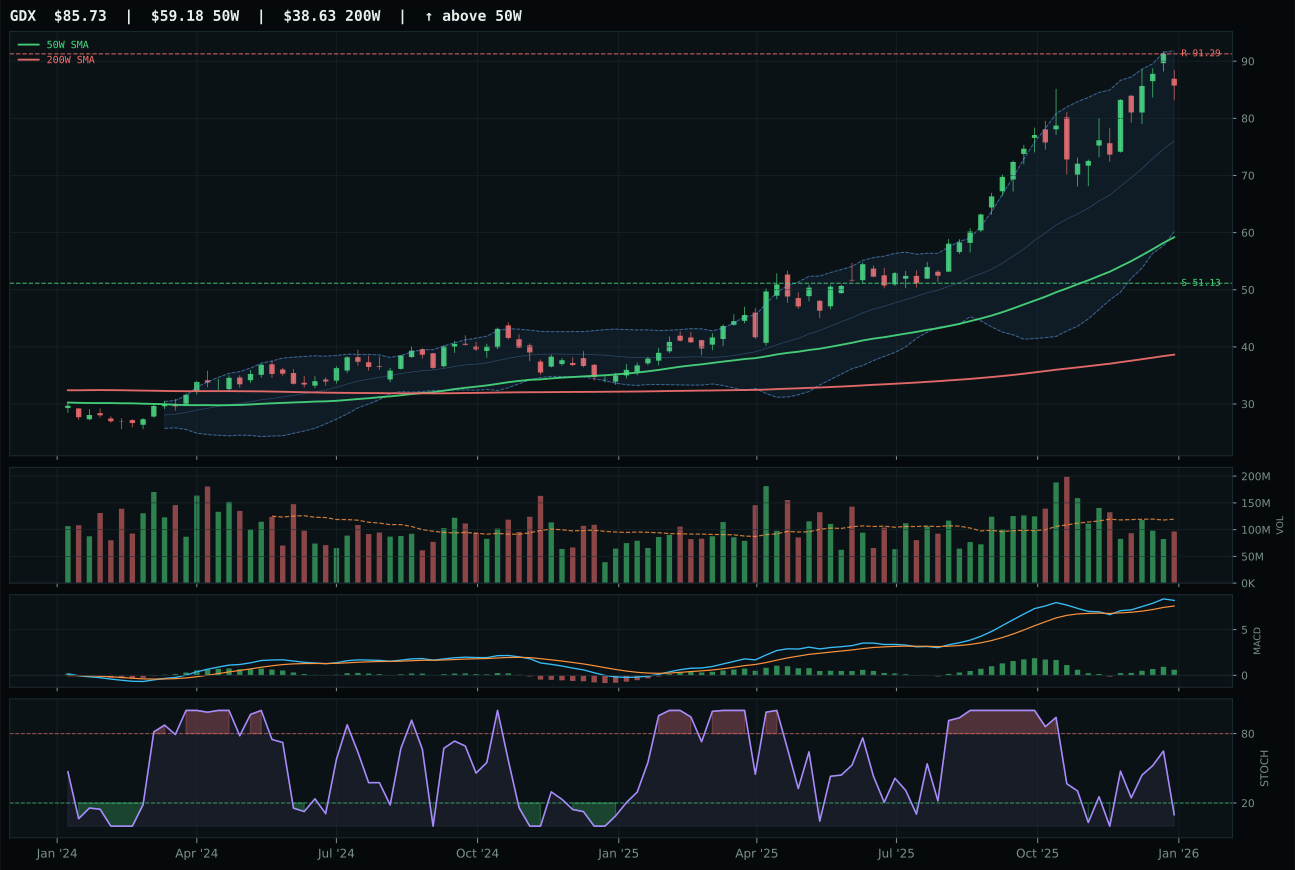
GDX has a vertical extension profile with 9.1% 13-week relative strength versus SPY.
A failed hold above support would weaken the setup.
Actionable but governed by invalidation levels.
SLV demolished the category with perfect trend scoring (100/100), perfect momentum confirmation (100/100), and 39.7% category-relative outperformance that dwarfed both GLD (0.0%) and GDX. A 51.1% 13W return and 49.0% SPY-relative gain mean silver has become the portfolio's most explosive relative performer, and the bullish-and-improving MACD says institutional money is still adding. The price is 75.3% extended above the 50W and downside to support is a brutal 95.7%, which explains why risk-reward scores only 38.4/100—this is a run-away freight train, not a fresh entry. GLD lost despite identical 100/100 trend scores because its MACD is bullish-but-flattening (a weakening confirmation), stochastic RSI rolled into oversold (a late-stage signal), and it generated zero category-relative strength, making it a monetary hedge without silver's hybrid industrial beta.
Precious Metals earned 10% allocation purely on macro conviction and category dominance; SLV itself is a terrible entry at these levels. The 63.0 category score and 54.0 macro-fit reflect genuine tailwinds: monetary hedge bid is the portfolio's strongest single descriptor at +14 basis points, and metals scarcity is confirmed at +7. However, the macro regime is risk-on liquidity expansion, which actively penalizes duration plays and inflation hedges—monetary hedge bid is fighting against SPY risk-appetite strength and liquidity stimulus that typically crushes precious metals. SLV's 2.35x distribution-pressure volume, extended price action, and falling stochastic RSI all warn that the move is maturing. The 10% allocation is macro-weighted insurance, not technical conviction; buyers at these levels are catching what could be the final wave of dip-buying before a reversion toward the 50W. GLD offers better entry geometry with its pullback-into-support framing, even if SLV has the momentum flag.
Technology — XLK
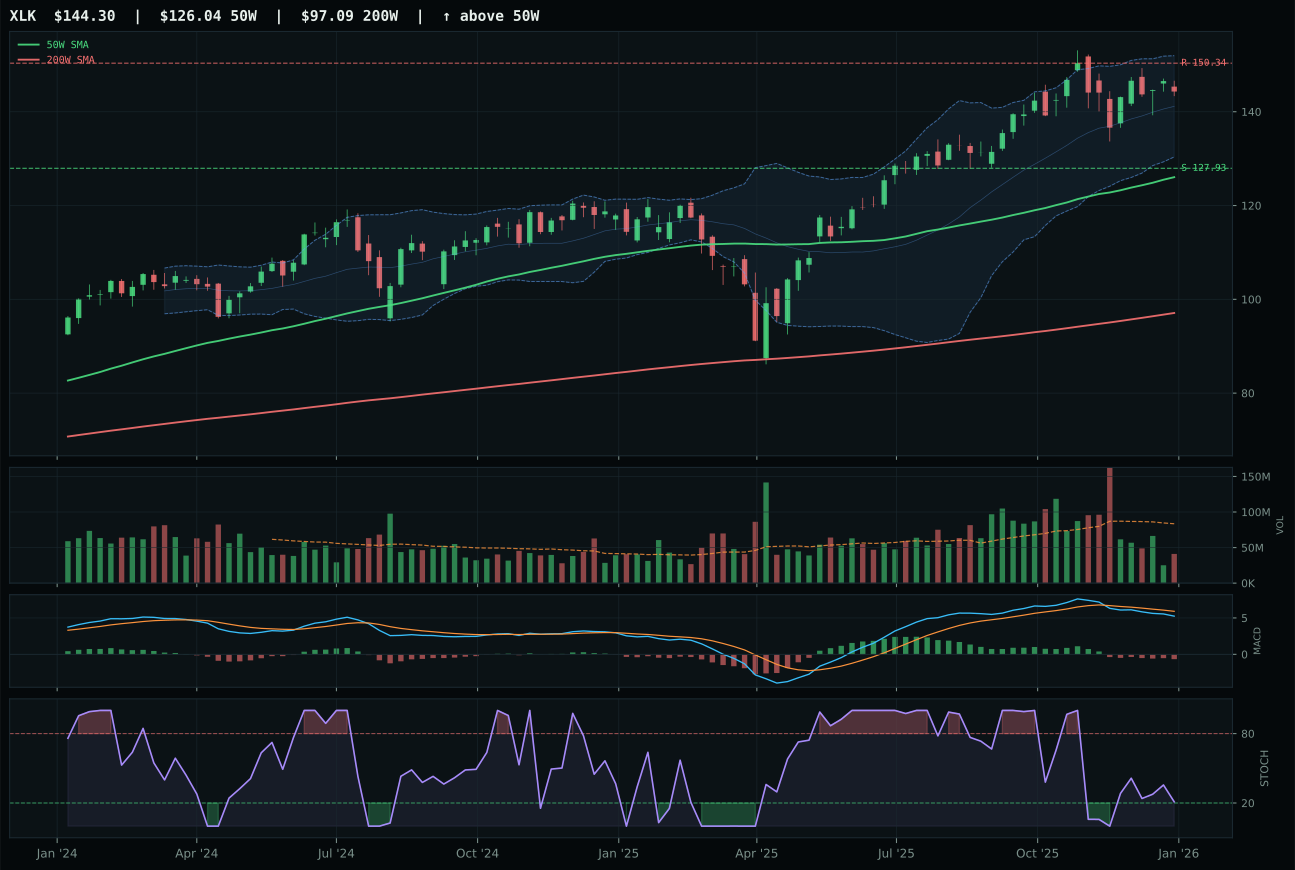
XLK has a neutral structure profile with -0.7% 13-week relative strength versus SPY.
A failed hold above support would weaken the setup.
Actionable but governed by invalidation levels.
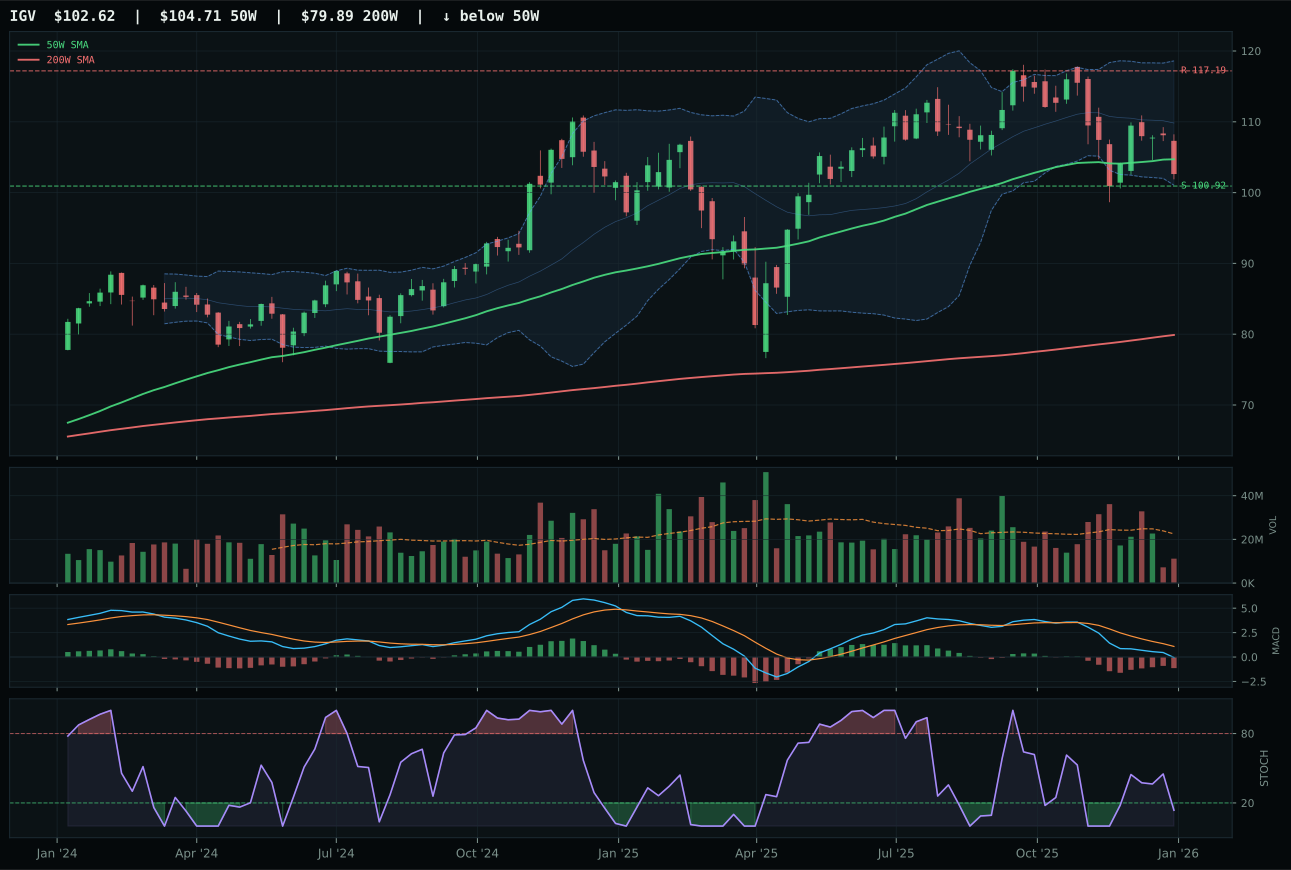
IGV has a pullback into support profile with -12.7% 13-week relative strength versus SPY.
A failed hold above support would weaken the setup.
Actionable but governed by invalidation levels.
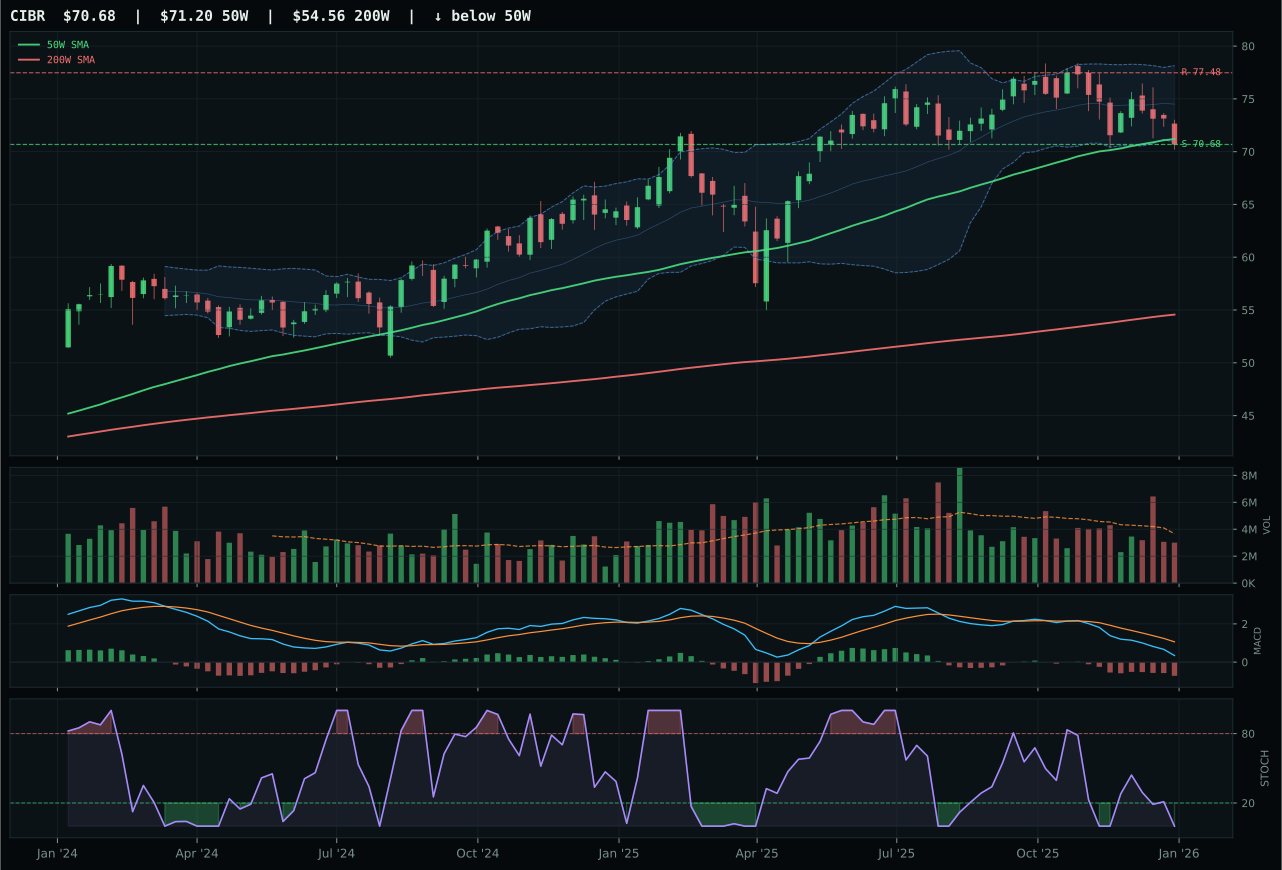
CIBR has a pullback into support profile with -9.9% 13-week relative strength versus SPY.
A failed hold above support would weaken the setup.
Actionable but governed by invalidation levels.
XLK captured the category by establishing relative strength dominance inside its own basket, where a 9.2% category-relative advantage over the median separated it decisively from IGV's -2.8% showing. The 50W slope remains constructive at 0.4%, price holds above both major moving averages, and the structure is neutral rather than extended—this matters because it means the 14.5% distance to the 50W reflects genuine accumulation rather than speculative chase. However, the setup is deteriorating on the signals: MACD is bearish and weakening, stochastic RSI has rolled over to 0.21, and volume at 0.49x the 20W average suggests thin institutional participation. IGV lost despite a cleaner pullback-into-support setup because its -10.6% 13W return and -12.7% SPY-relative weakness created a structural disconfirmation that oversold stochastics alone could not repair.
Technology earned its 10% slot because the macro regime actively punishes duration-sensitive growth while favoring profitable leadership, and XLK's broad-based methodology captures that transition better than pure software exposure. The category's 86.0 macro-fit score reflects genuine tailwinds: liquidity expansion and risk appetite are both live, AI sponsorship is real, but credit stress remains a headwind that keeps the entire sector defensive. At 53.5 composite, the category scores below the portfolio midline and loses the top-2 fight to commodities and emerging markets, which means capital is rationed toward setups with better risk-adjusted entry points. XLK's lack of extension and neutral structure give it optionality—the setup can either break higher or consolidate—but thin volume and weakening technicals suggest waiting for either a MACD repair or a pullback to the 50W before adding meaningful exposure.
Defense & Aerospace — ITA
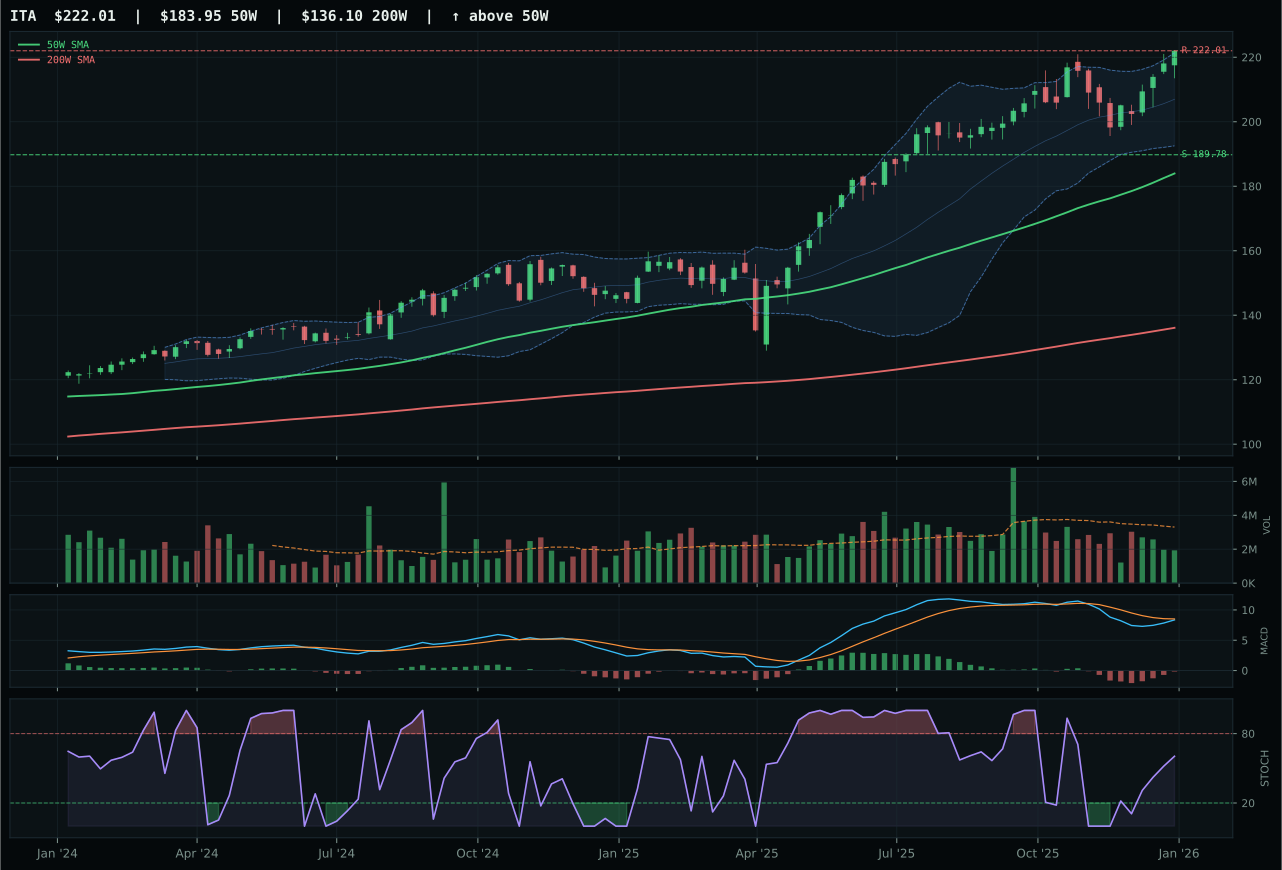
ITA has a vertical extension profile with 3.9% 13-week relative strength versus SPY.
A failed hold above support would weaken the setup.
Actionable but governed by invalidation levels.
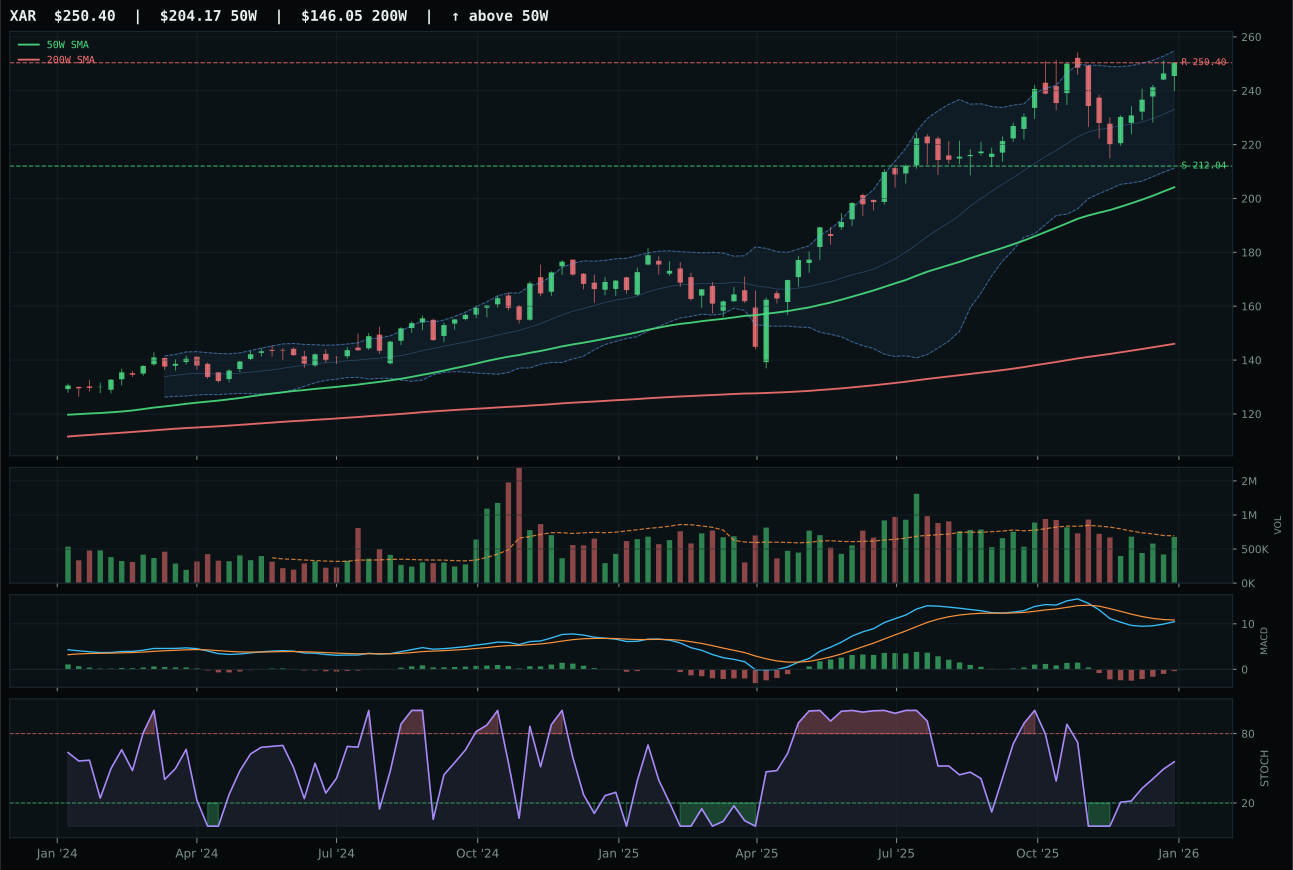
XAR has a vertical extension profile with 2.0% 13-week relative strength versus SPY.
A failed hold above support would weaken the setup.
Actionable but governed by invalidation levels.
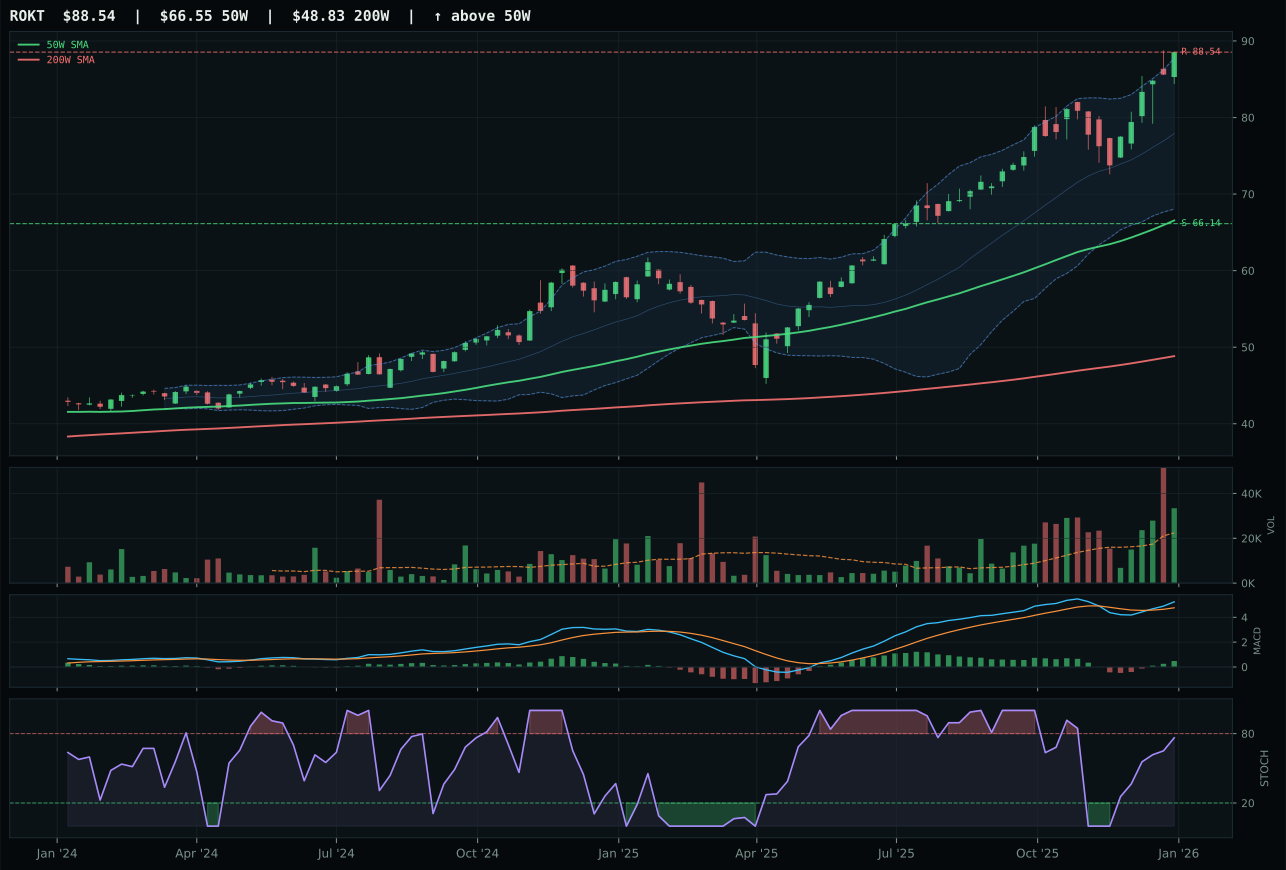
ROKT has a vertical extension profile with 10.3% 13-week relative strength versus SPY.
A failed hold above support would weaken the setup.
Tracked, but not top-2 eligible because: .
ITA edged XAR in an exceptionally tight race—a 1.2-point spread on a 44.2 category score—by capturing marginally better category-relative strength (0.0% versus -1.9%) and risk-reward (45.5 versus 45.0) in a setup where both are extended at roughly 20.7% above the 50W. The trend is nearly flawless at 98.8/100, the 50W slope at 0.8% is firm, and both ETFs show bearish-but-improving MACD that suggests the uptrend is maturing but not breaking. XAR's neutral volume (0.59x) versus ITA's thin participation (0.59x) is a wash; the real difference is category leadership within a three-fund basket where no macro descriptor strongly supports or penalizes the entire sector. ITA wins by default here—it is the lesser loser in a category with modest macro tailwinds and stretched entry points.
Defense & Aerospace sits at 10% not because it deserves conviction but because the alternative is nothing—the category scores only 44.2 and the macro-fit lands at just 52.0, implying neutral positioning rather than bullish structural support. Credit stress ticking up by 2 basis points is the only real macro driver, and that is protective coloring rather than genuine sponsorship. The setup is sound: price above both moving averages, a defined pullback structure that could hold, and stochastic RSI rising into mid-zone signals that confirm the uptrend is alive. However, the risk-reward is capped (0% to resistance, 17% to support), volume is thin, and there is no macro reason to believe this sector will outrun the broader market. Keep the 10% as an overcrowded-exit hedge if equities roll over, but this is not a conviction hold—it is a placeholder waiting for better setup quality or a shift in credit-stress momentum.
Utilities & Infrastructure — PAVE
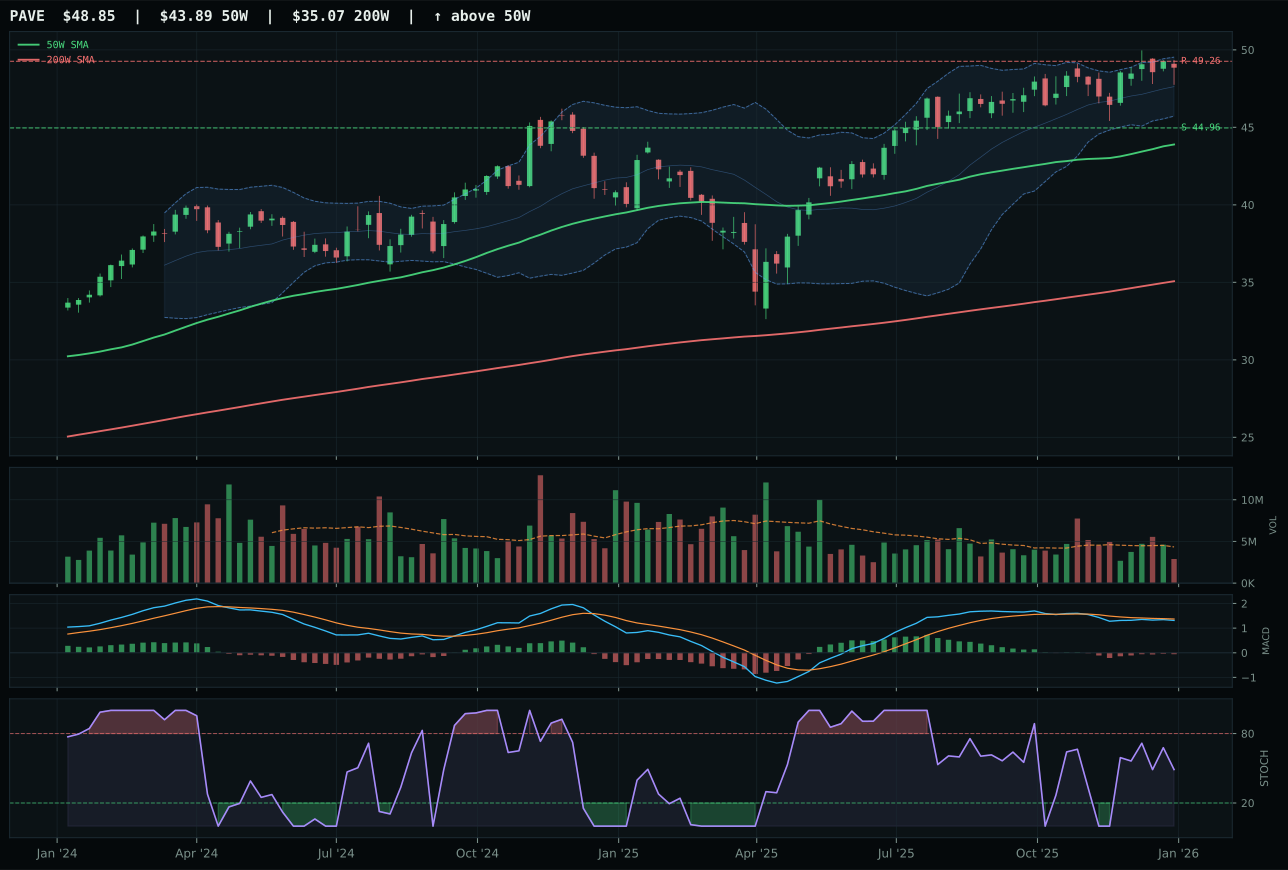
PAVE has a neutral structure profile with -0.2% 13-week relative strength versus SPY.
A failed hold above support would weaken the setup.
Actionable but governed by invalidation levels.
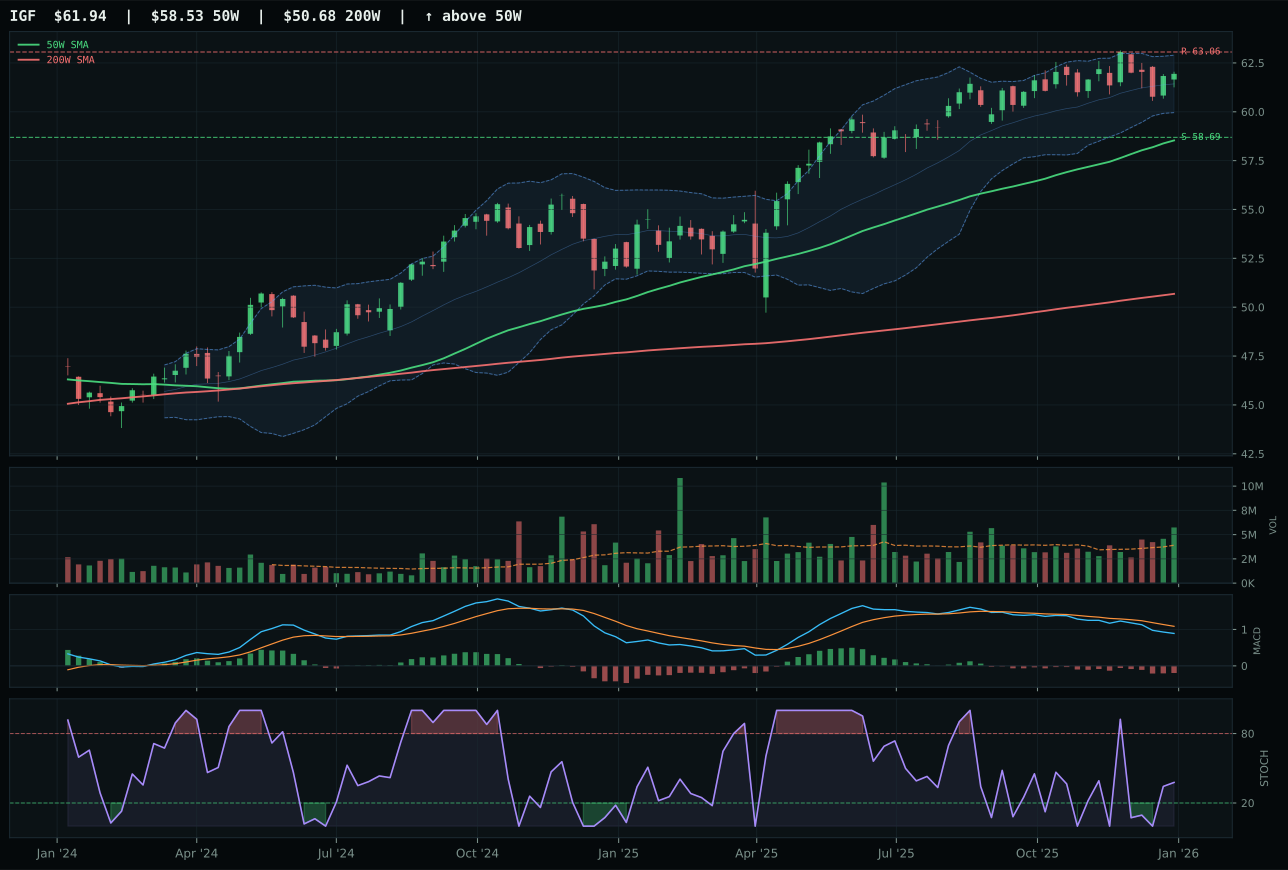
IGF has a neutral structure profile with -1.6% 13-week relative strength versus SPY.
A failed hold above support would weaken the setup.
Actionable but governed by invalidation levels.
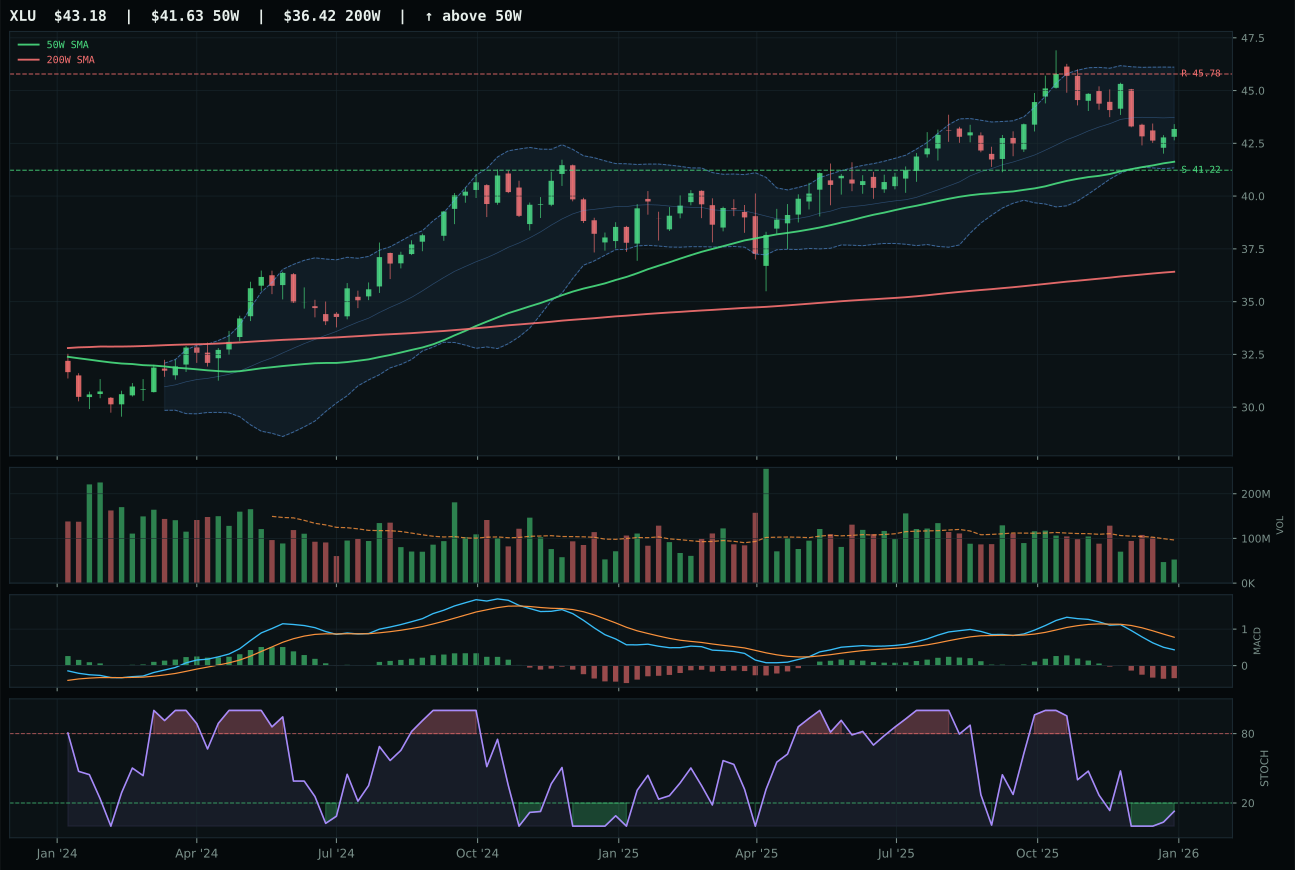
XLU has a pullback into support profile with -5.0% 13-week relative strength versus SPY.
A failed hold above support would weaken the setup.
Actionable but governed by invalidation levels.
PAVE narrowly defeated IGF (a 2.1-point spread on a 41.9 category score) by capturing superior category-relative strength (1.3% versus 0.0%) in a setup where both ETFs are near-term overextended but PAVE's technical picture is marginally cleaner. Both are 11-14% above their 50W, both sit at resistance with near-zero upside to caps, and both face 8-9% downside to support, creating defined and similar risk-reward. PAVE's advantage lies in its bearish-but-improving MACD (versus IGF's bearish-and-weakening deterioration) and a falling-neutral stochastic RSI that suggests room for stabilization rather than continued downside. The structure is neutral in both cases, meaning the setups are balanced between continuation and reversion. IGF's above-average volume (versus PAVE's thin participation) suggests institutional interest, but that institutional money bought into PAVE's strength rather than IGF's weakness.
Utilities & Infrastructure holds 10% because the macro regime is hostile to this sector and the technical setup offers no margin for error. The category score of 41.9 and macro-fit of only 48.0 confirm this is a placeholder allocation, not a conviction bet—risk appetite positive is the regime's dominant signal, and that hurts defensive dividend plays. PAVE's 92.7 trend score is strong and the near-50W proximity (11.3% distance) creates defined entry geometry, but thin volume (0.67x) and thin participation say institutional accumulation is absent. The 38.7 risk-reward reflects capped upside (0.8% to resistance) and exposed downside (8.7% to support), which is the trade-off of owning defensive exposure in a risk-on regime. Keep this 10% as a portfolio ballast; if equities crack on growth concerns or credit stress spikes, PAVE will re-rate upward and become a beneficial hedge. If PAVE breaks above 49.26 on above-average volume, the setup inverts and conviction rises—until then, treat this as a low-conviction tactical hold designed to protect against tail risk rather than to profit from fundamental infrastructure spending.
Nuclear Energy — URNM
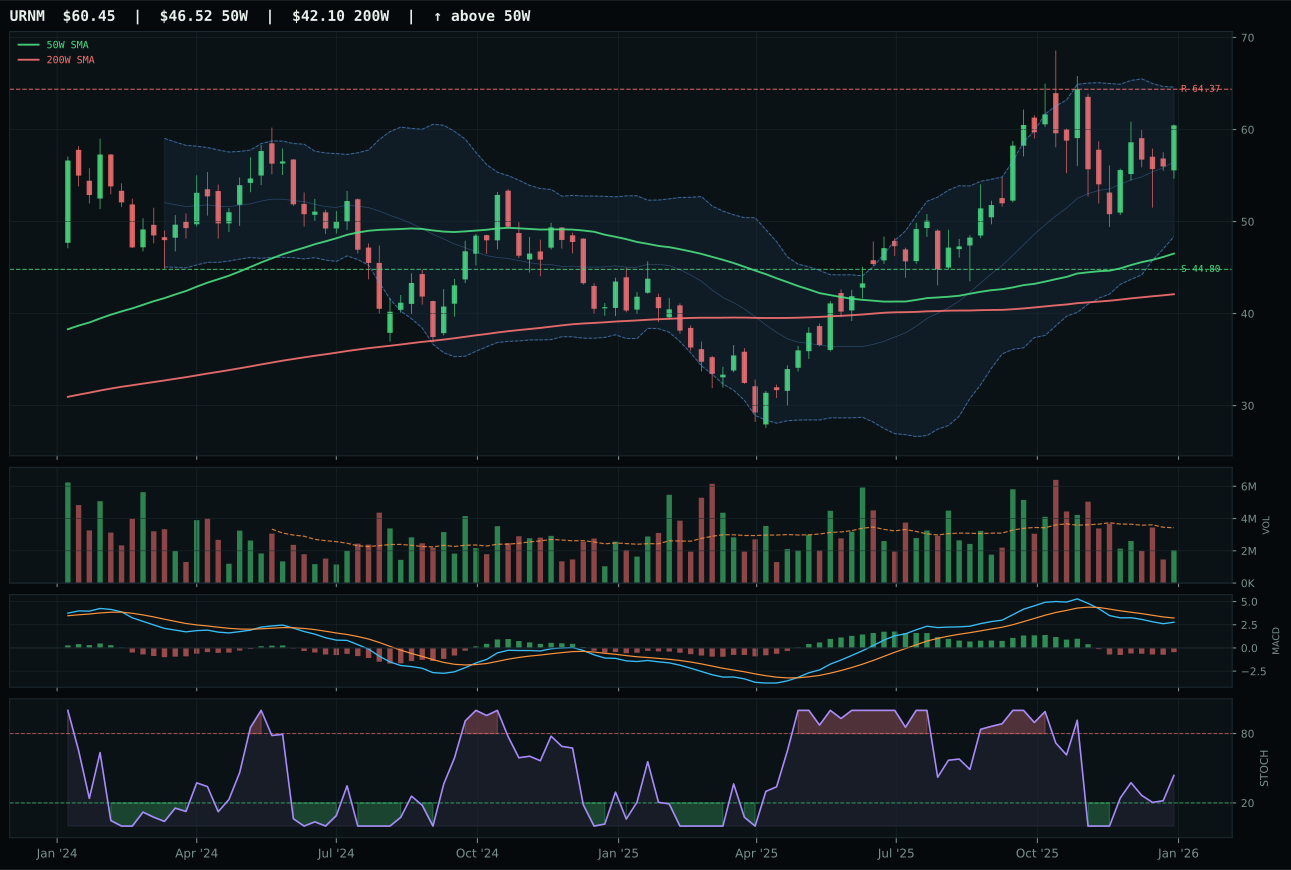
URNM has a vertical extension profile with -0.8% 13-week relative strength versus SPY.
A failed hold above support would weaken the setup.
Actionable but governed by invalidation levels.
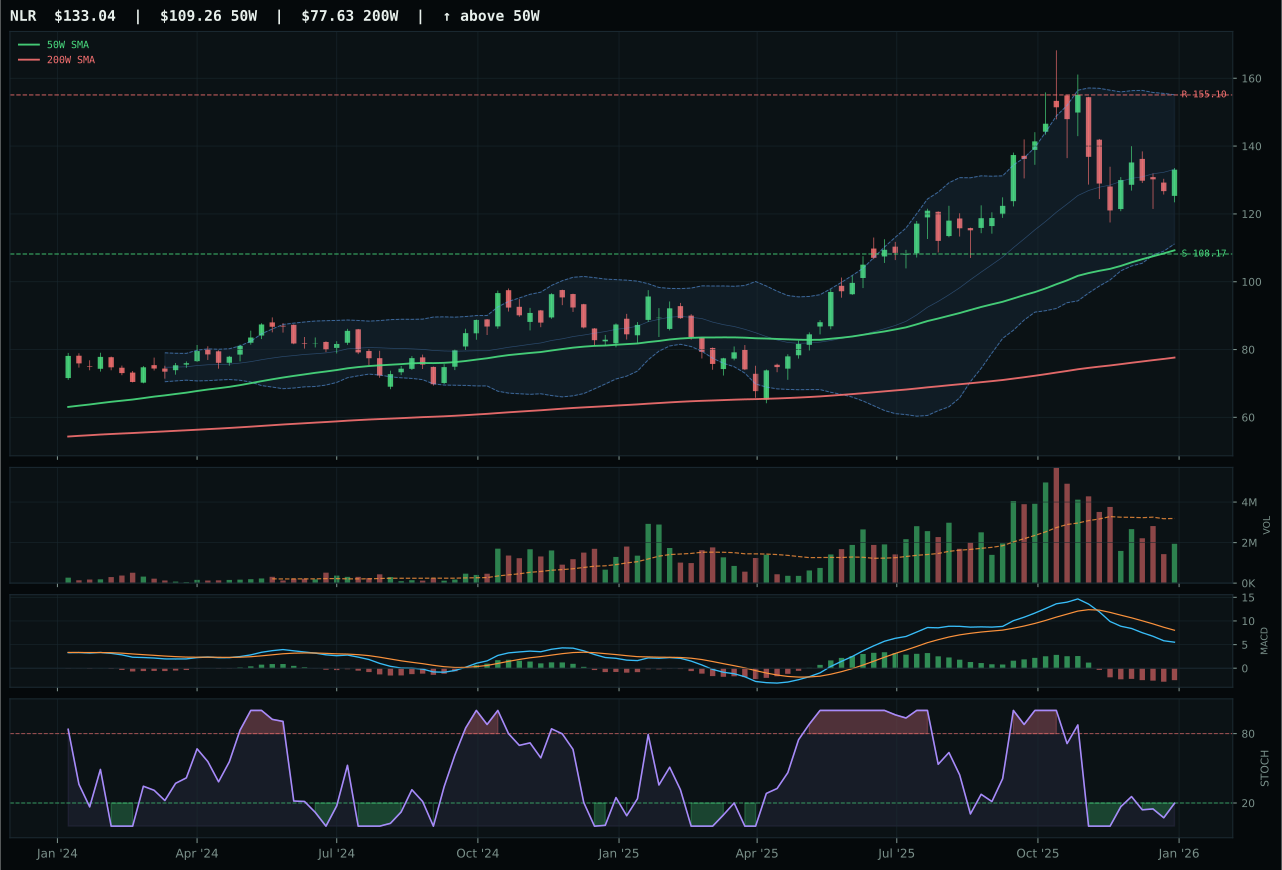
NLR has a vertical extension profile with -8.0% 13-week relative strength versus SPY.
A failed hold above support would weaken the setup.
Actionable but governed by invalidation levels.
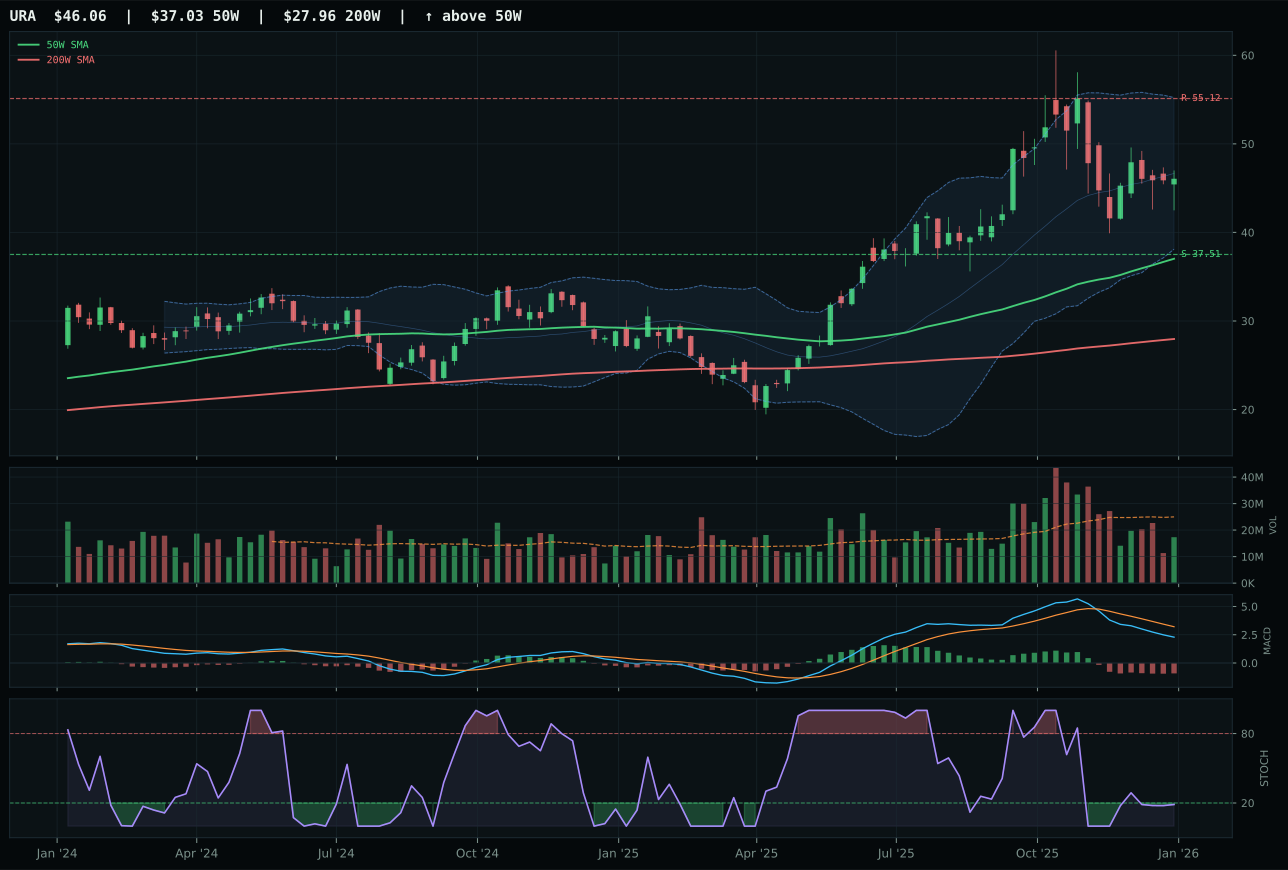
URA has a vertical extension profile with -9.2% 13-week relative strength versus SPY.
A failed hold above support would weaken the setup.
Actionable but governed by invalidation levels.
URNM defeated NLR decisively because it captured category-relative strength (7.2% versus 0.0%), a rising-mid-zone stochastic RSI (versus NLR's oversold-turn-up, a much earlier signal), and bearish-but-improving MACD confirmation (versus NLR's bearish-and-weakening deterioration). The trend is flawless at 91.8/100, price holds above both 50W and 200W, and the 50W slope at 0.8% is constructive. However, the structure is extended at 29.9% above the 50W with cleanliness scoring only 41.7—this is a vertical extension with rougher edges, meaning consolidation risk is elevated. The 13W return of just 1.3% against that extension is a red flag; URNM has extended price with weak intermediate momentum, suggesting late-stage accumulation or early distribution. NLR's weakness in both MACD (-9 confirmation points) and stochastic RSI (oversold turn-up is a 5-week-old signal) made it the clear loser, but neither ETF inspires conviction at these levels.
Nuclear Energy earned 10% because real asset sponsorship at +7 and AI growth sponsorship at +5 provide genuine macro support, even though the category score is only 37.5 and macro-fit is 62.0. This is a sector bet on power consumption growth from data centers and AI computing, not on nuclear safety ideology or geopolitical cost-of-capital dynamics. URNM's 91.8 trend score and category-relative strength advantage make it the only viable expression, but the 29.9% extension, rough structure (41.7 cleanliness), and anemic 13W return create a technical mismatch. Risk-reward sits at 33.1/100 with 34.9% downside exposure, so entry is risky. The allocation exists as a tail-end position in a regime favoring real assets and computational demand—use it as a small, tactical holding that you would gladly exit on a 10% pullback to the 50W. If URNM closes below 44.80 on above-average volume, cut exposure to 5% and wait for the structure to reset.
Traditional Energy — XLE
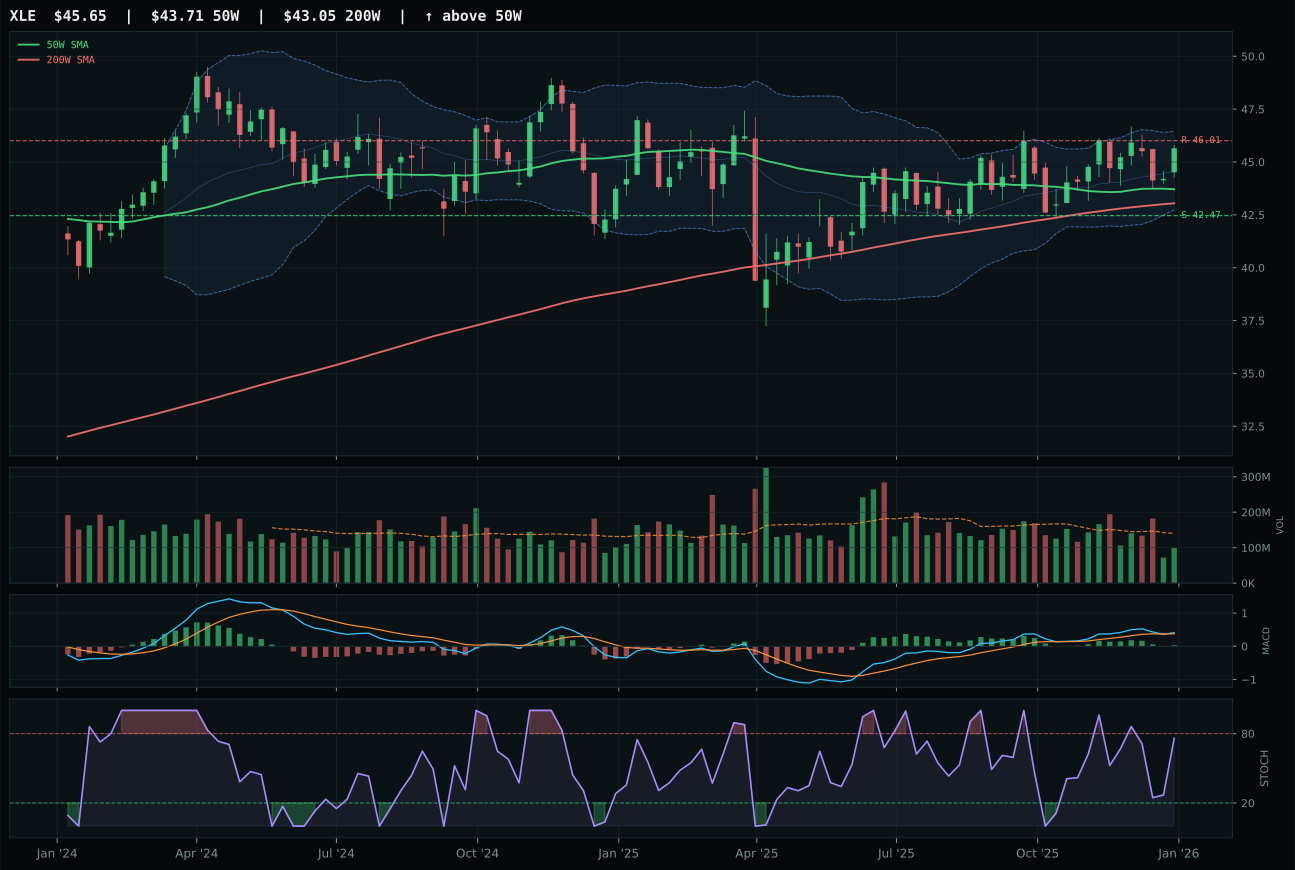
XLE has a neutral structure profile with 0.6% 13-week relative strength versus SPY.
A failed hold above support would weaken the setup.
Actionable but governed by invalidation levels.
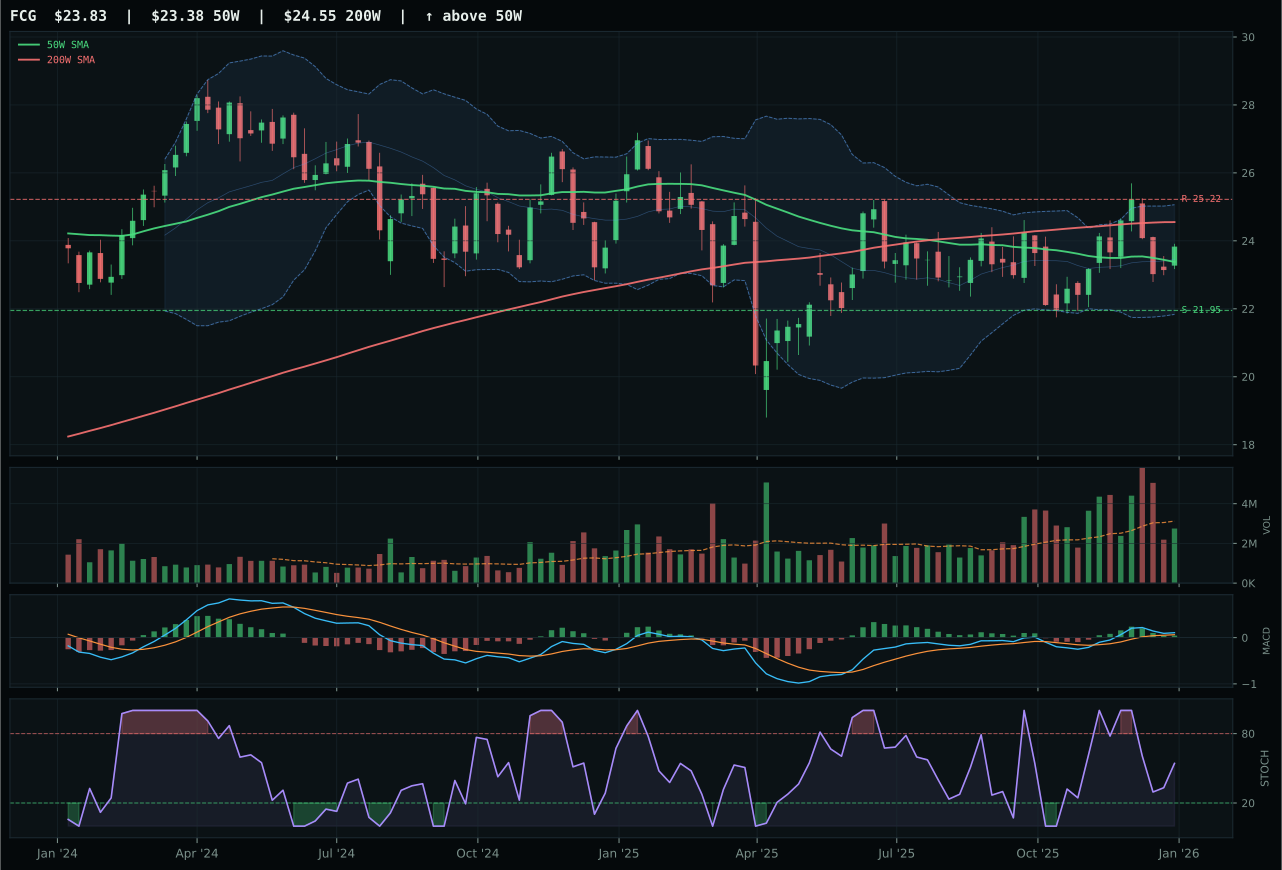
FCG has a compression near 50W profile with -1.3% 13-week relative strength versus SPY.
A failed hold above support would weaken the setup.
Actionable but governed by invalidation levels.
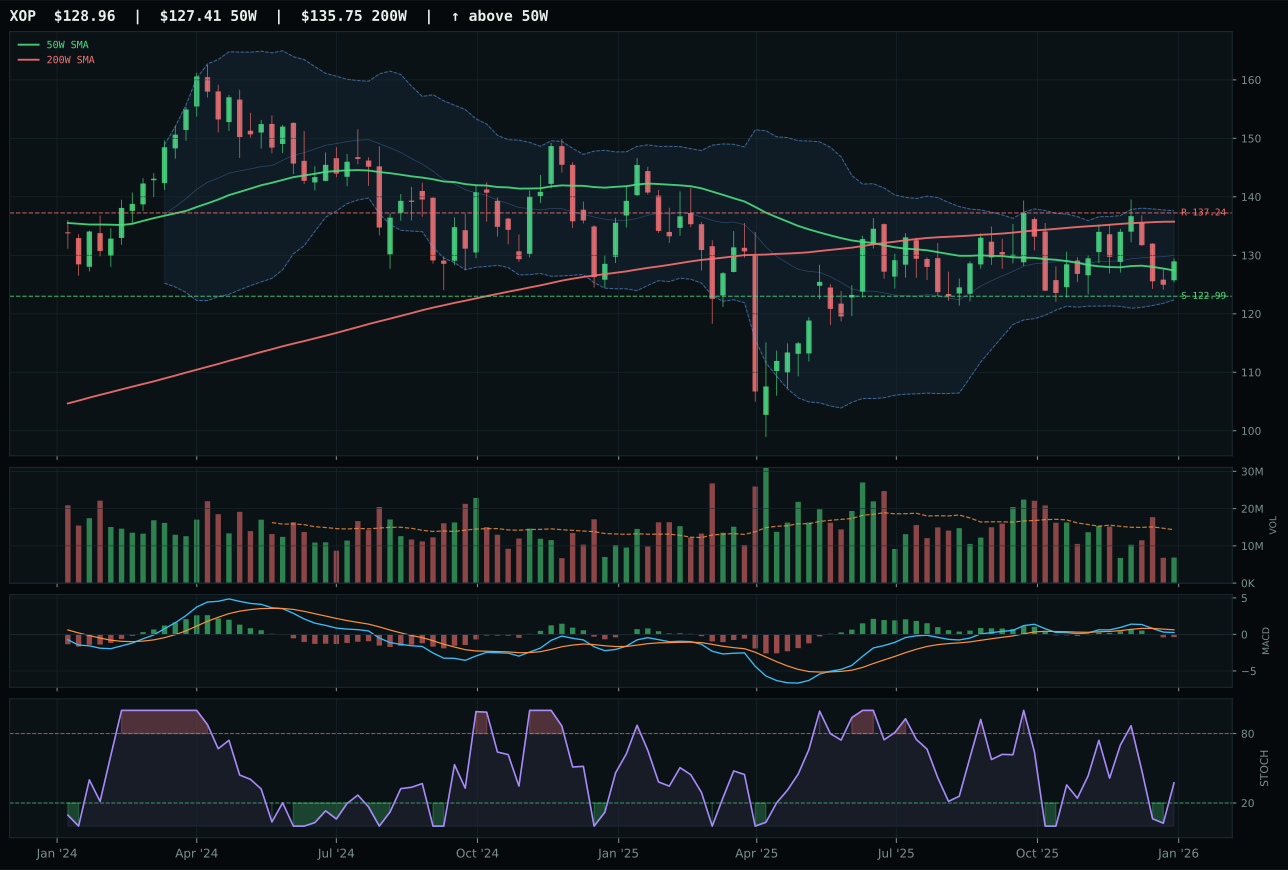
XOP has a pullback into support profile with -5.3% 13-week relative strength versus SPY.
A failed hold above support would weaken the setup.
Actionable but governed by invalidation levels.
XLE won by delivering the category's best timing score (93.0/100) and structure quality (78.0/100), even though it trails the category in headline returns and momentum signals. The price sits just 4.4% above the 50W with a near-flat 50W slope at -0.1%, which means this is an early-stage uptrend breakout—not extended, not late, just beginning. MACD is bullish but flattening (a caution flag), stochastic RSI is rising into mid-zone (confirming, not exhausted), and the neutral structure with tight compression (82.9) says the base is firm. FCG lost because its MACD confirmation is identical (bullish but flattening), its timing is superior (95 vs 93), but its 13W return lags (0.8% vs 2.7%), category-relative strength is zero, and stochastic RSI has fallen/neutral (already deteriorating). XLE's 13W return of 2.7% and 0.6% SPY-relative strength are modest, but they are positive in a sector fighting macro headwinds.
Traditional Energy ranks 10th at 34.9/100 and is excluded from allocation this week because the macro regime offers no tailwind: credit stress is active at -7, and despite real-asset sponsorship at +5, the net macro fit is 50.0/100, the weakest in the portfolio. XLE's 2.7% thirteen-week return and 0.6% SPY-relative return fail to justify capital when COPX (73.1) offers 17.9% returns and 15.8% SPY-relative strength, and IEMG (73.4) offers 3.1% returns with broader macro support. The setup is technically reasonable—neutral structure, bullish-but-flattening MACD, rising stochastic—but thin volume (0.71x 20W) and minimal momentum divergence suggest the move lacks conviction. Energy would earn even a 10% position only if credit stress reversed (signaling safety demand) or if commodity breadth extended into barrel strength that outpaced copper and metals. Current conditions favor growth and commodity exposure through cleaner proxies; XLE remains on watch as a risk-off hedge but offers no tactical entry until either XLE breaks above resistance at 46.01 with volume sponsorship or macro conditions deteriorate in ways that lift energy relative to equities.
Agriculture & Livestock — MOO
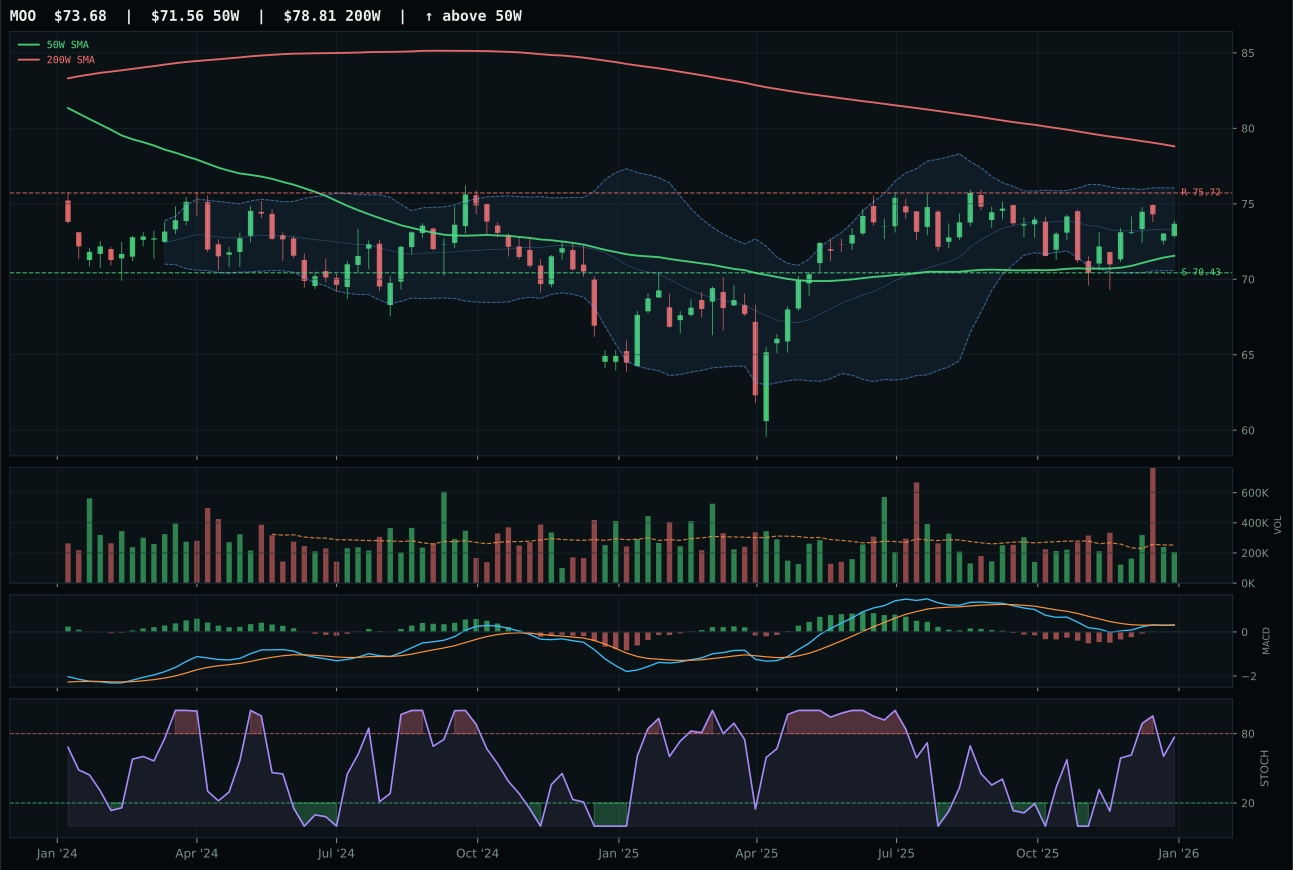
MOO has a pullback into support profile with -2.5% 13-week relative strength versus SPY.
A failed hold above support would weaken the setup.
Actionable but governed by invalidation levels.
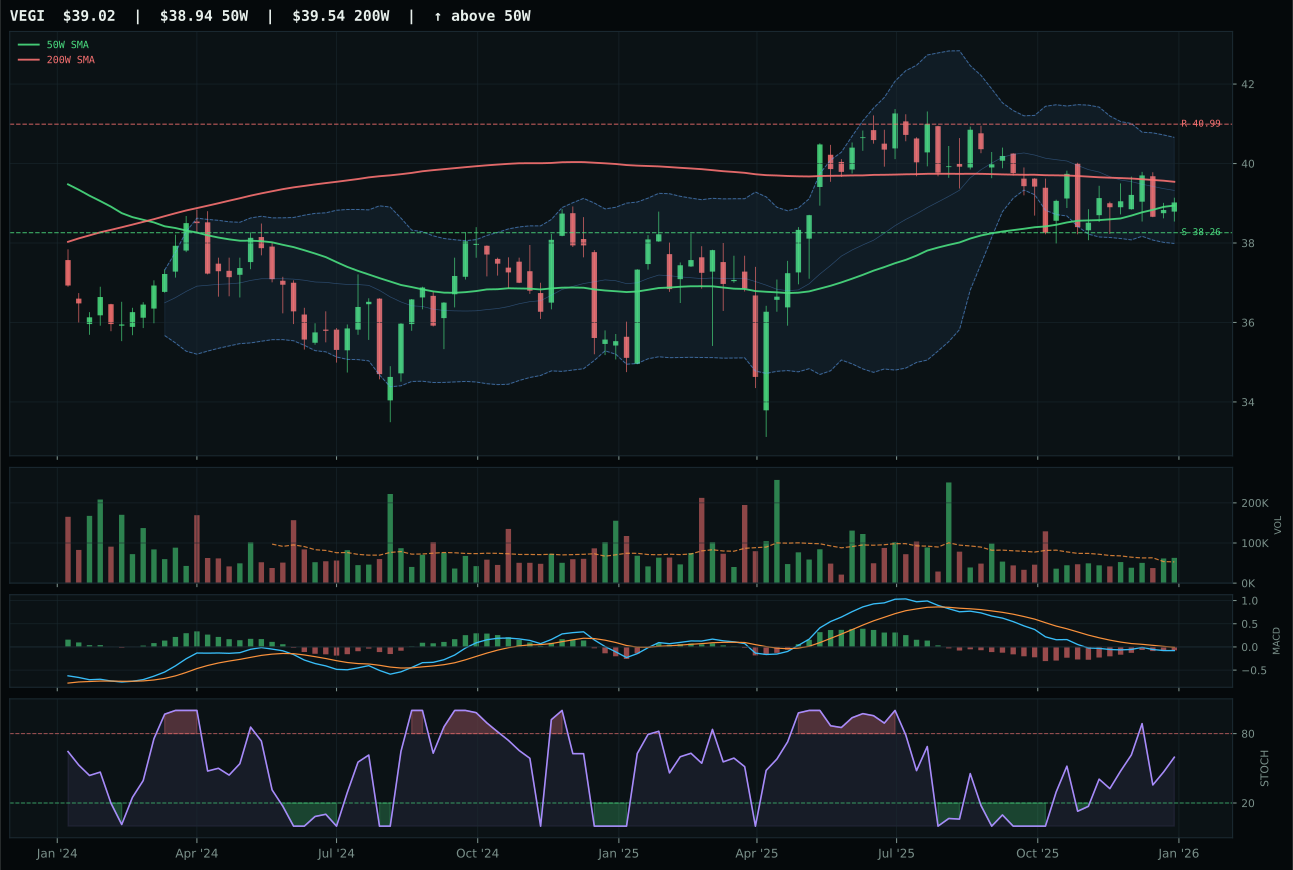
VEGI has a pullback into support profile with -3.1% 13-week relative strength versus SPY.
A failed hold above support would weaken the setup.
Tracked, but not top-2 eligible because: .
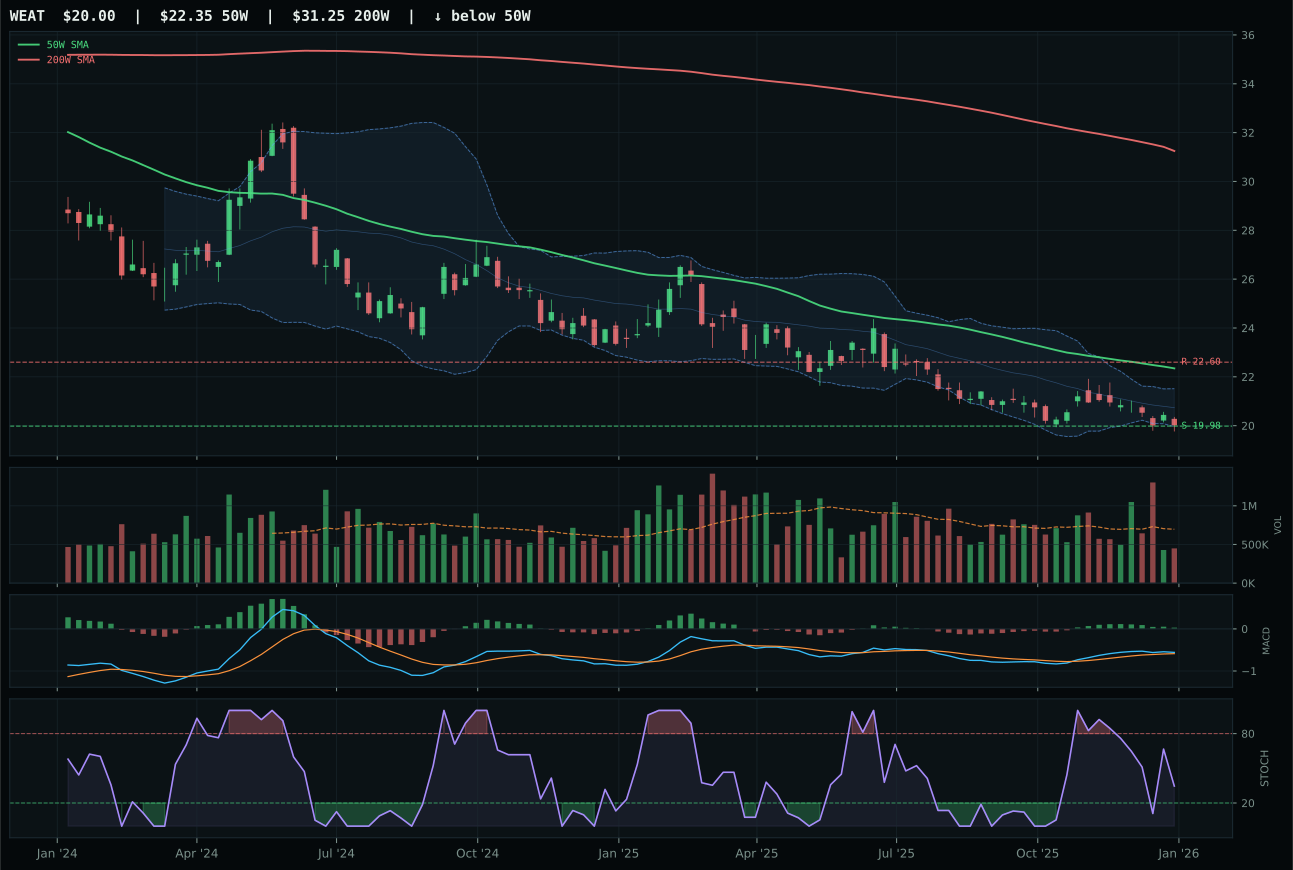
WEAT has a pullback into support profile with -5.7% 13-week relative strength versus SPY.
Extension and support failure are the main tactical risks.
Tracked, but not top-2 eligible because: structurally broken.
MOO won decisively with a 17.8-point margin over VEGI because it delivered the category's strongest timing signal (100/100) and the only bullish MACD confirmation—bullish and improving versus VEGI's bearish-but-improving reading. The setup is nearly perfect for a mean-reversion trade: price sits just 3.0% from the 50W, MACD is rising, and the chart is pulling into support at 70.43 with defined downside risk of only 4.6%. The 13W return is near-flat at -0.4%, but category-relative strength at 0.6% says MOO is holding its own in a weak sector; VEGI's 0.0% category-relative strength and bearish MACD confirmation created a double negative that outweighed its superior 13W return of -1.0%. Compression at 86.3 is tight, suggesting a coil rather than a rolling-over trend, and the structure—pullback into support on bullish MACD—is textbook mean-reversion entry geometry.
Agriculture & Livestock is ranked 9th on the final scorecard and earns 0% allocation because macro conditions do not support commodity-dependent agriculture, and technicals offer no compensatory catalyst. The category's macro fit of 63.0/100 is supported only by real-asset sponsorship and commodity breadth—neither active enough to offset the portfolio's allocation to COPX (metals scarcity +14) and SLV (monetary hedge +7). MOO's perfect timing score is a false positive: the fund is at support, not in breakout, and with near-zero thirteen-week momentum and negative SPY-relative returns, the risk of invalidation (drop to 66.35) outweighs the reward of mean reversion to resistance (75.72). The portfolio's two top categories (IEMG and COPX) already capture the real-asset and emerging-market themes at higher confidence levels. Agriculture would require either a sustained pickup in commodity demand (visible in PICK or COPX momentum) or a technical bounce off support with volume sponsorship to earn even a 10% tactical position.