
2025-12-26
Informational purposes only. The content in this report, including allocations, analysis, and commentary, is provided solely for informational and educational purposes. It does not constitute financial advice, investment advice, trading advice, or any other type of advice. Past performance does not guarantee future results. Always conduct your own research and consult a qualified financial professional before making investment decisions.
Weekly Allocation
| Ticker | Category | Weight | Role |
|---|---|---|---|
| COPX | Industrial Metals | 20% | Top-2 (20%) |
| SLV | Precious Metals | 20% | Top-2 (20%) |
| BOTZ | AI | 10% | Tier-2 (10%) |
| IGV | Technology | 10% | Tier-2 (10%) |
| IEMG | Emerging Markets | 10% | Tier-2 (10%) |
| XAR | Defense & Aerospace | 10% | Tier-2 (10%) |
| PAVE | Utilities & Infrastructure | 10% | Tier-2 (10%) |
| URA | Nuclear Energy | 10% | Tier-2 (10%) |
Trade Instructions — Monday Open
Sell the tranche from 2025-11-28 (completing its 4-week hold). Buy the new tranche. Instructions show net portfolio changes — same-asset positions cancel, weight changes show the delta.
| Action | Ticker | Instruction |
|---|---|---|
| SELL | REMX | Sell entire REMX position (5.00% of portfolio) |
| SELL | IGF | Sell entire IGF position (2.50% of portfolio) |
| SELL | SMH | Sell 33% of SMH position (reduce 7.50% → 5.00%) |
| SELL | CIBR | Sell entire CIBR position (2.50% of portfolio) |
| SELL | URNM | Sell 33% of URNM position (reduce 7.50% → 5.00%) |
| SELL | FCG | Sell 50% of FCG position (reduce 5.00% → 2.50%) |
| SELL | ITA | Sell 50% of ITA position (reduce 5.00% → 2.50%) |
| BUY | COPX | Buy COPX — 25.00% of freed cash (adds 5.00% to portfolio) |
| BUY | PAVE | Buy PAVE — 12.50% of freed cash (adds 2.50% to portfolio) |
| BUY | BOTZ | Buy BOTZ — 12.50% of freed cash (adds 2.50% to portfolio) |
| BUY | IGV | Buy IGV — 12.50% of freed cash (adds 2.50% to portfolio) |
| BUY | XAR | Buy XAR — 12.50% of freed cash (adds 2.50% to portfolio) |
| BUY | IEMG | Buy IEMG — 12.50% of freed cash (adds 2.50% to portfolio) |
| BUY | URA | Buy URA — 12.50% of freed cash (adds 2.50% to portfolio) |
Current Portfolio After Trade
Combined holdings across all 4 active tranches. Each tranche is 25% of the portfolio.
| Ticker | % of Portfolio | Weight Bar |
|---|---|---|
| SLV | 20.00% | |
| COPX | 20.00% | |
| PAVE | 10.00% | |
| IGV | 7.50% | |
| XAR | 7.50% | |
| SMH | 5.00% | |
| URNM | 5.00% | |
| BOTZ | 5.00% | |
| IEMG | 5.00% | |
| URA | 5.00% | |
| FCG | 2.50% | |
| ITA | 2.50% | |
| XLK | 2.50% | |
| XLE | 2.50% |
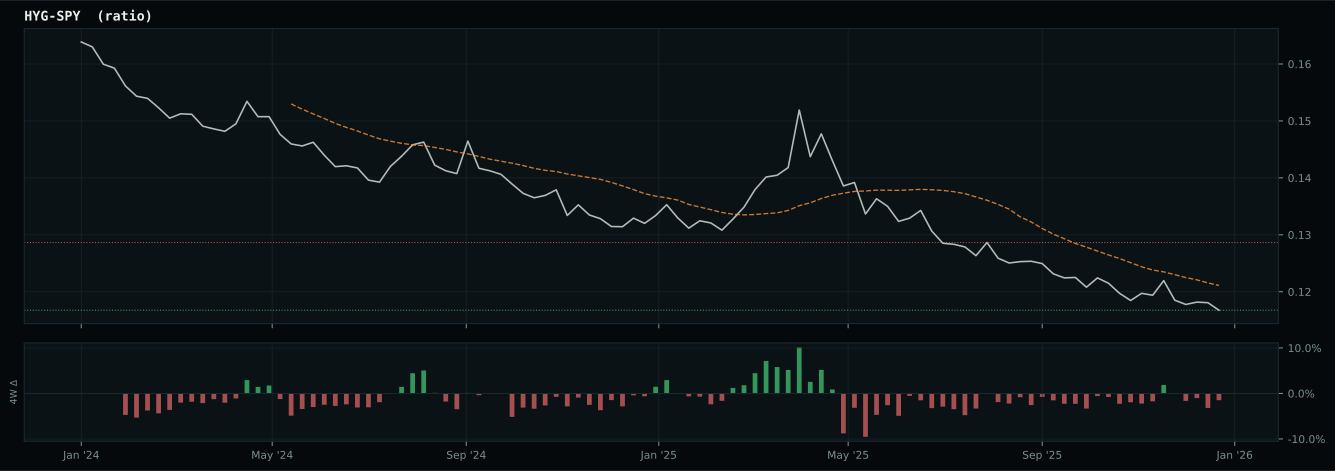
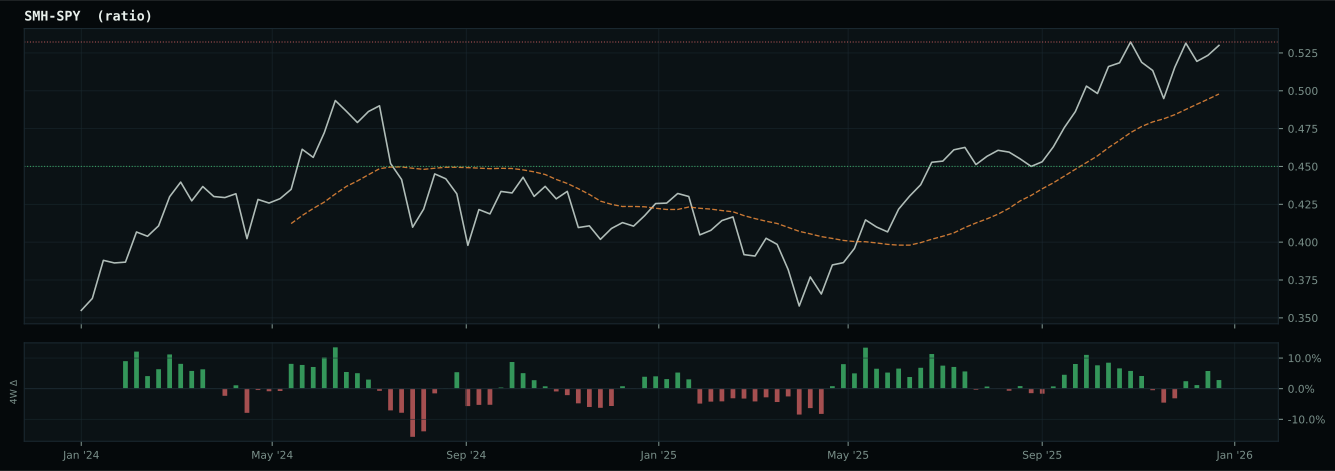
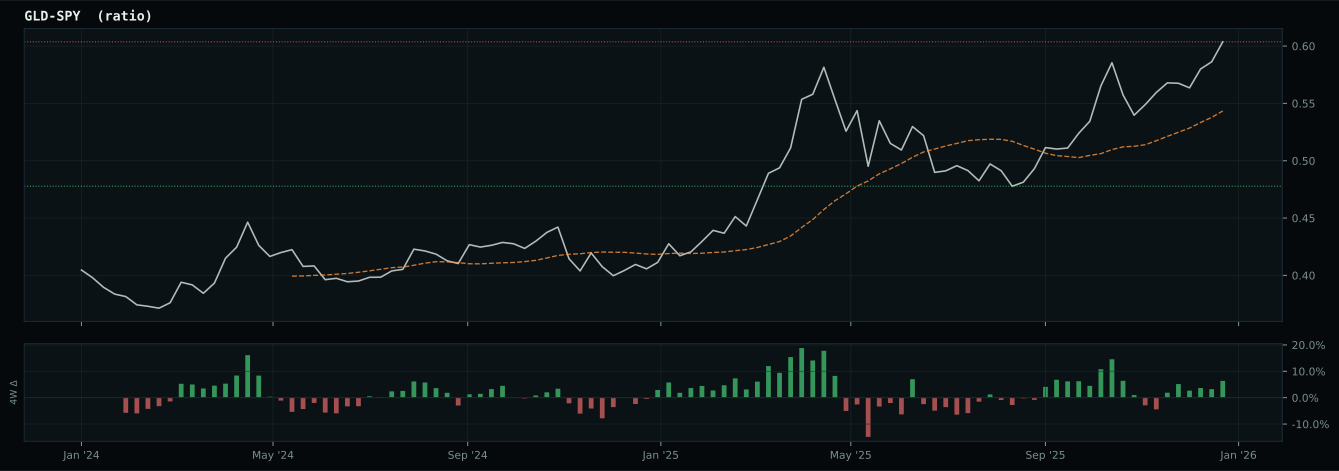
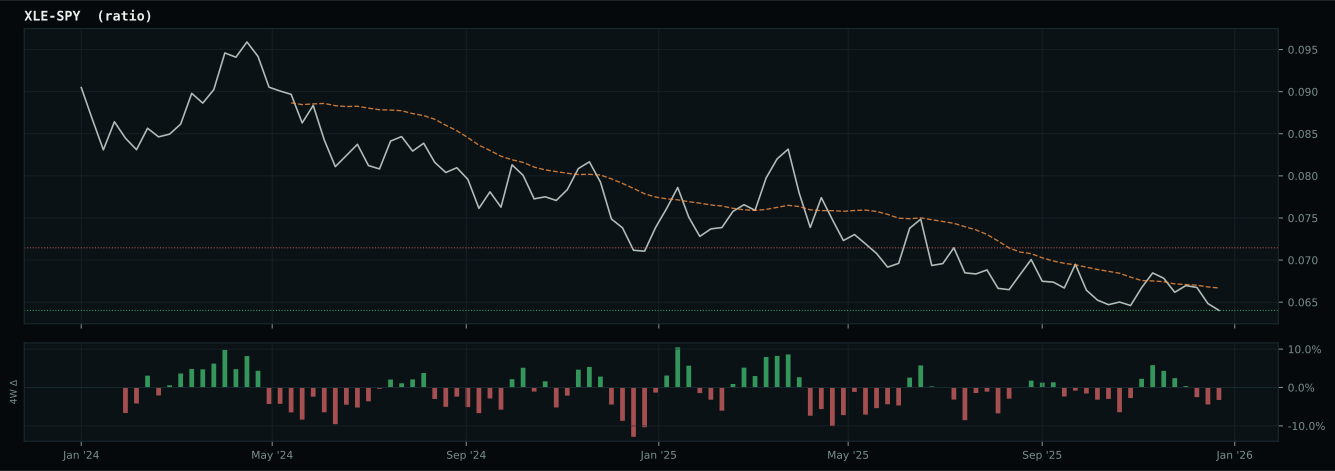
Macro Regime — Goldilocks
Macro Evidence Charts
Market-implied signals behind the macro regime scores. Each ratio compares two assets; the direction and slope of the ratio is what the macro engine reads.
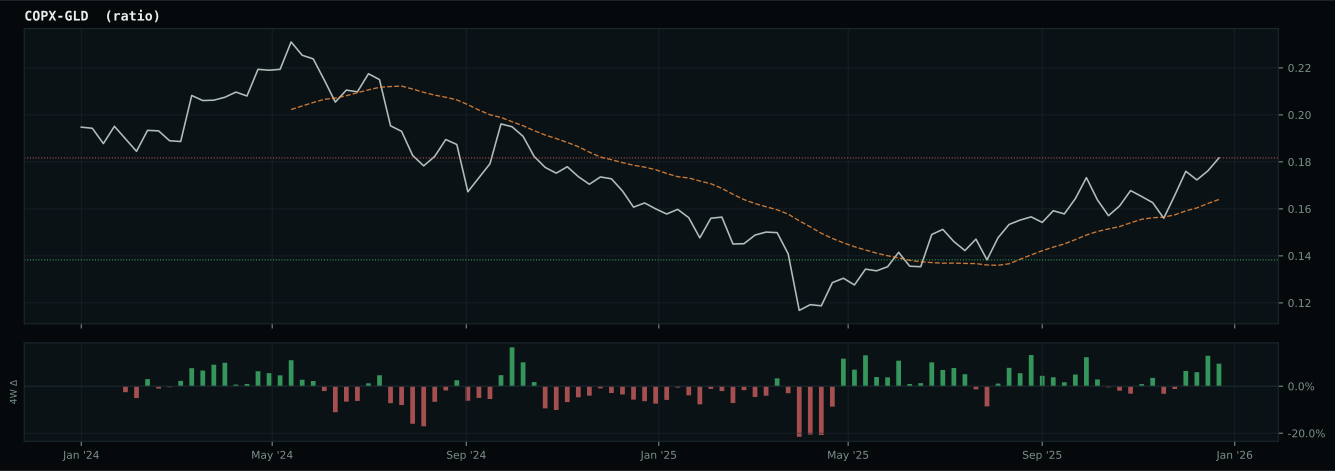
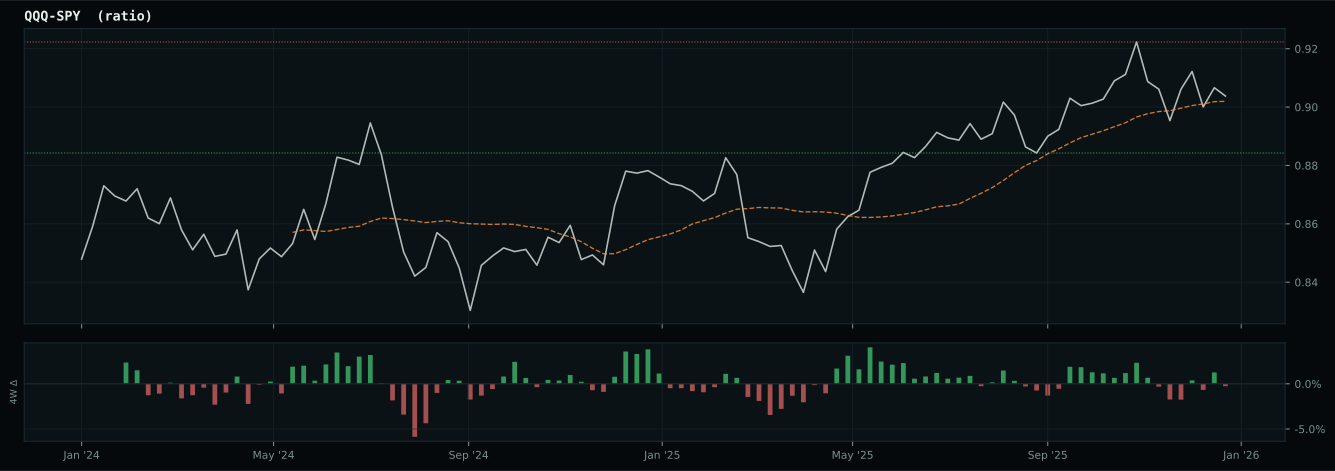
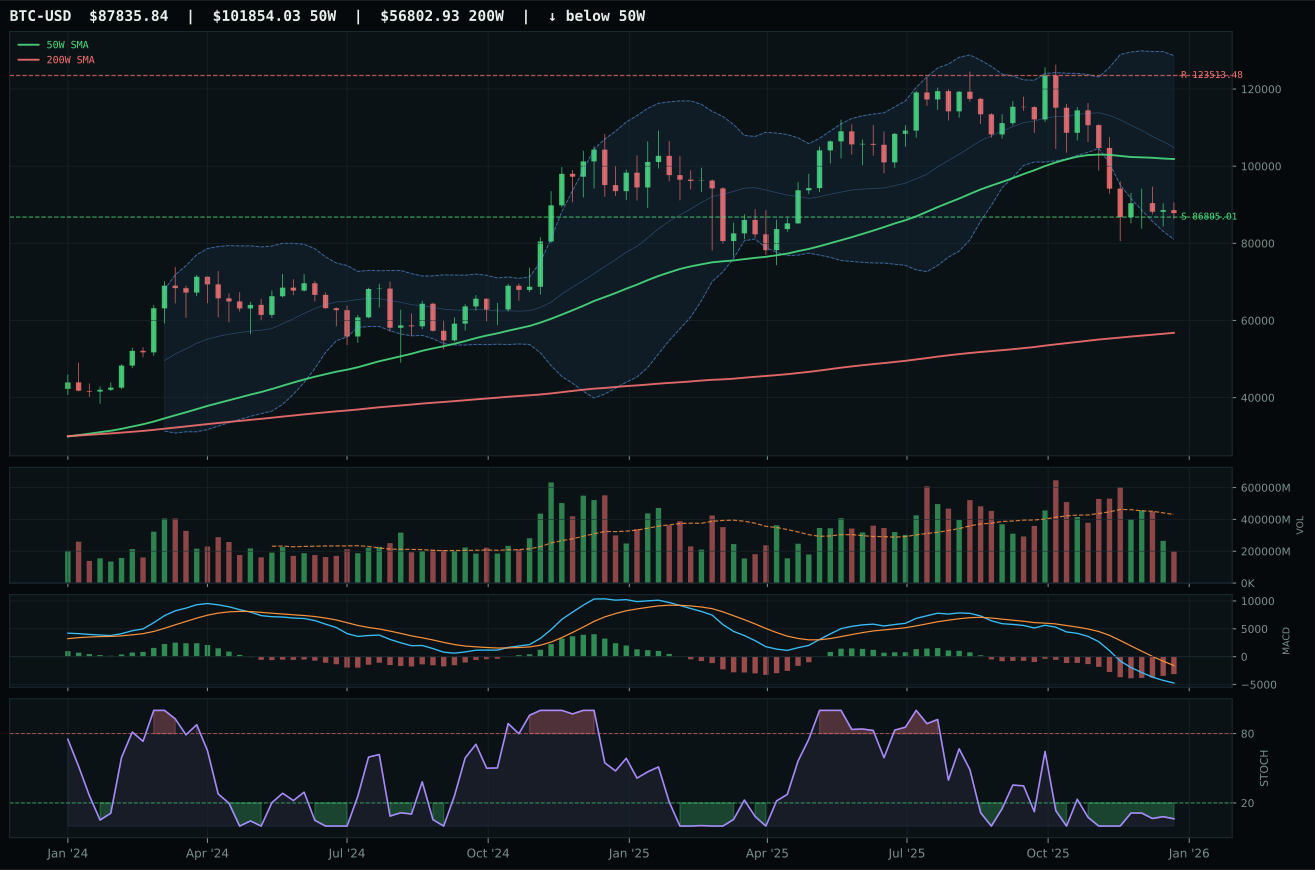
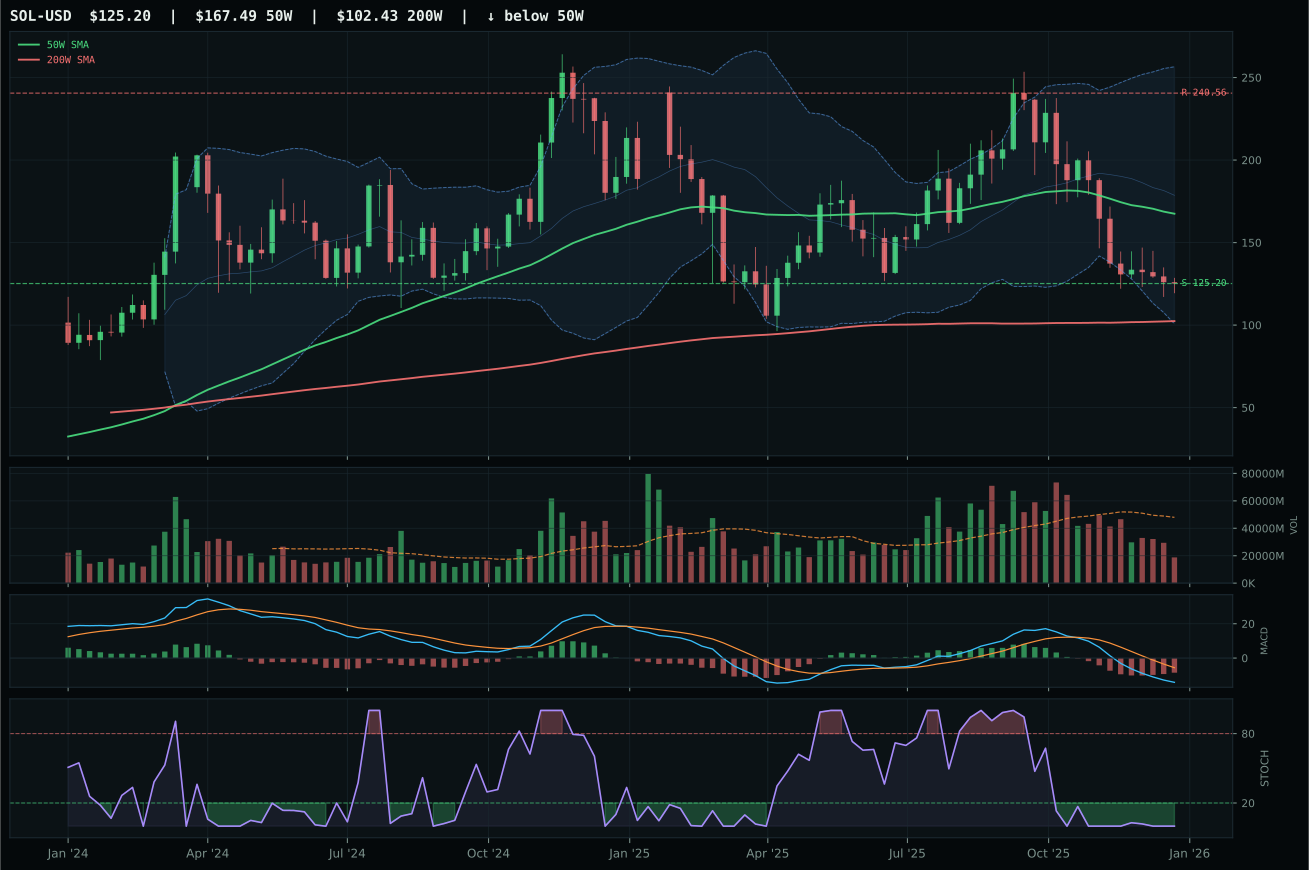
Crypto Regime — NoCrypto
ValueBTC not armed: BTC has not made the first post-breakdown touch of the 200W buy zone after losing the 50W
TrendBTC not confirmed
one or more available conditions failed
Category Rankings
| Rank | Category | Winner | Score | Alloc | 4W Ret | Peers (4W) |
|---|---|---|---|---|---|---|
| 1 | Industrial Metals | COPX | 78.0 | 20% | +22.49% | PICK +19.0% · REMX +36.0% |
| 2 | Precious Metals | SLV | 71.8 | 20% | +51.34% | GDX +27.3% · GLD +15.6% |
| 3 | AI | BOTZ | 69.6 | 10% | +3.93% | SMH +9.9% · AIQ +2.2% |
| 4 | Technology | IGV | 59.4 | 10% | -8.68% | XLK -0.1% · CIBR -1.7% |
| 5 | Emerging Markets | IEMG | 57.4 | 10% | +8.13% | ILF +14.5% · INDA -4.3% |
| 6 | Defense & Aerospace | XAR | 44.4 | 10% | +14.63% | ITA +7.9% · ROKT +20.5% |
| 7 | Utilities & Infrastructure | PAVE | 41.3 | 10% | +4.38% | IGF +2.9% · XLU -0.3% |
| 8 | Nuclear Energy | URA | 39.1 | 10% | +28.01% | URNM +41.5% · NLR +23.8% |
| 9 | Agriculture & Livestock | MOO | 25.0 | 0% | +9.69% | VEGI +9.1% · WEAT +2.2% |
| 10 | Traditional Energy | XLE | — | 0% | +12.04% | FCG +6.7% · XOP +8.4% |
Industrial Metals — COPX
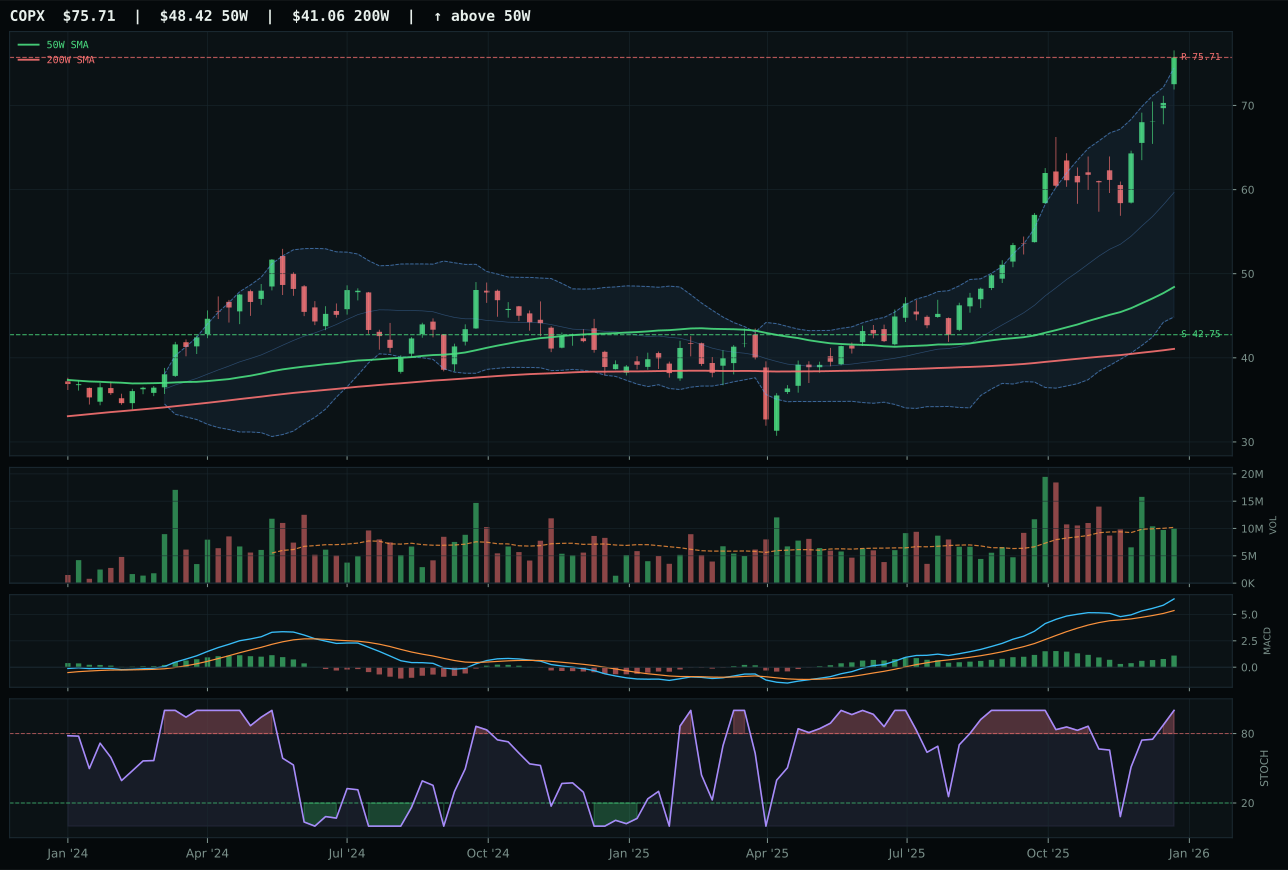
COPX has a vertical extension profile with 28.5% 13-week relative strength versus SPY.
A failed hold above support would weaken the setup.
Actionable but governed by invalidation levels.
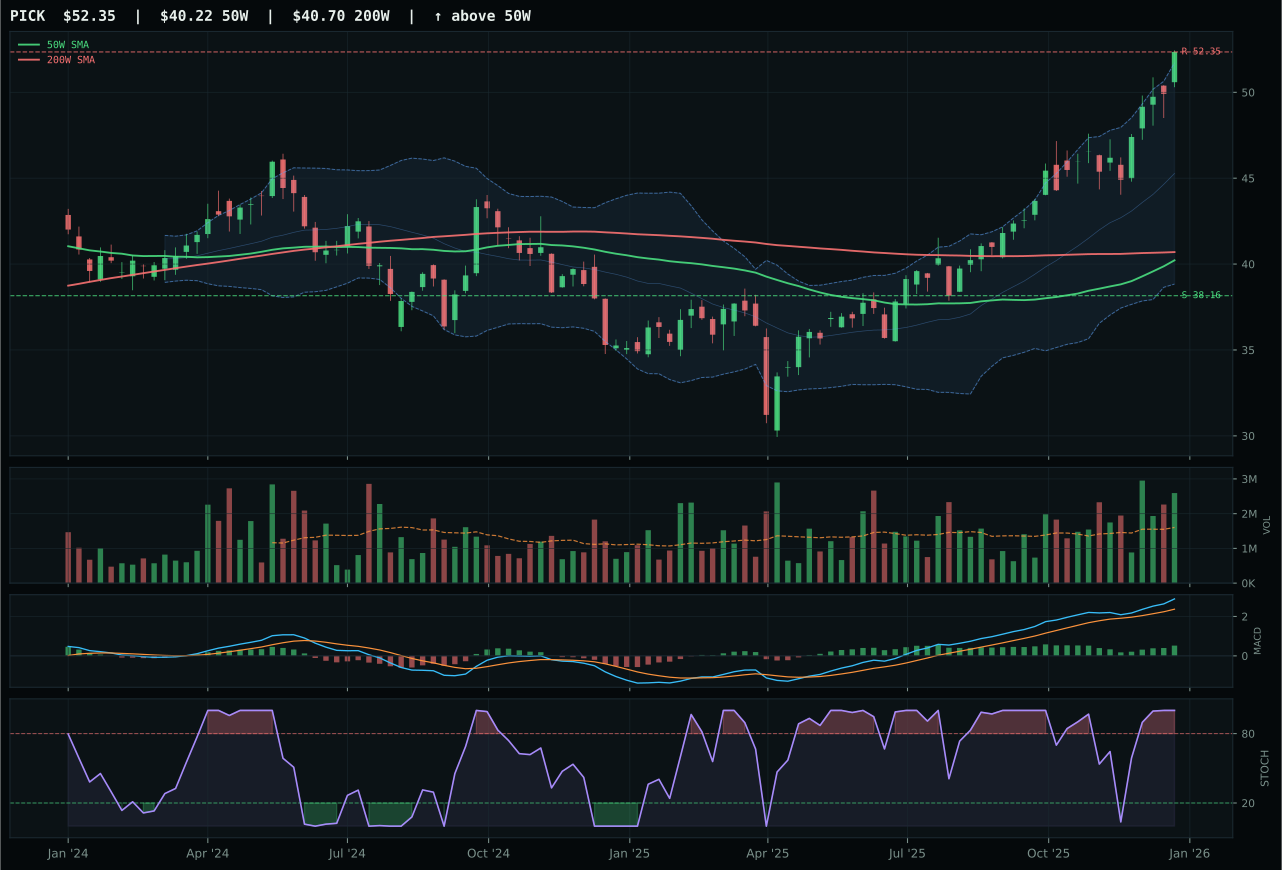
PICK has a vertical extension profile with 15.5% 13-week relative strength versus SPY.
A failed hold above support would weaken the setup.
Actionable but governed by invalidation levels.
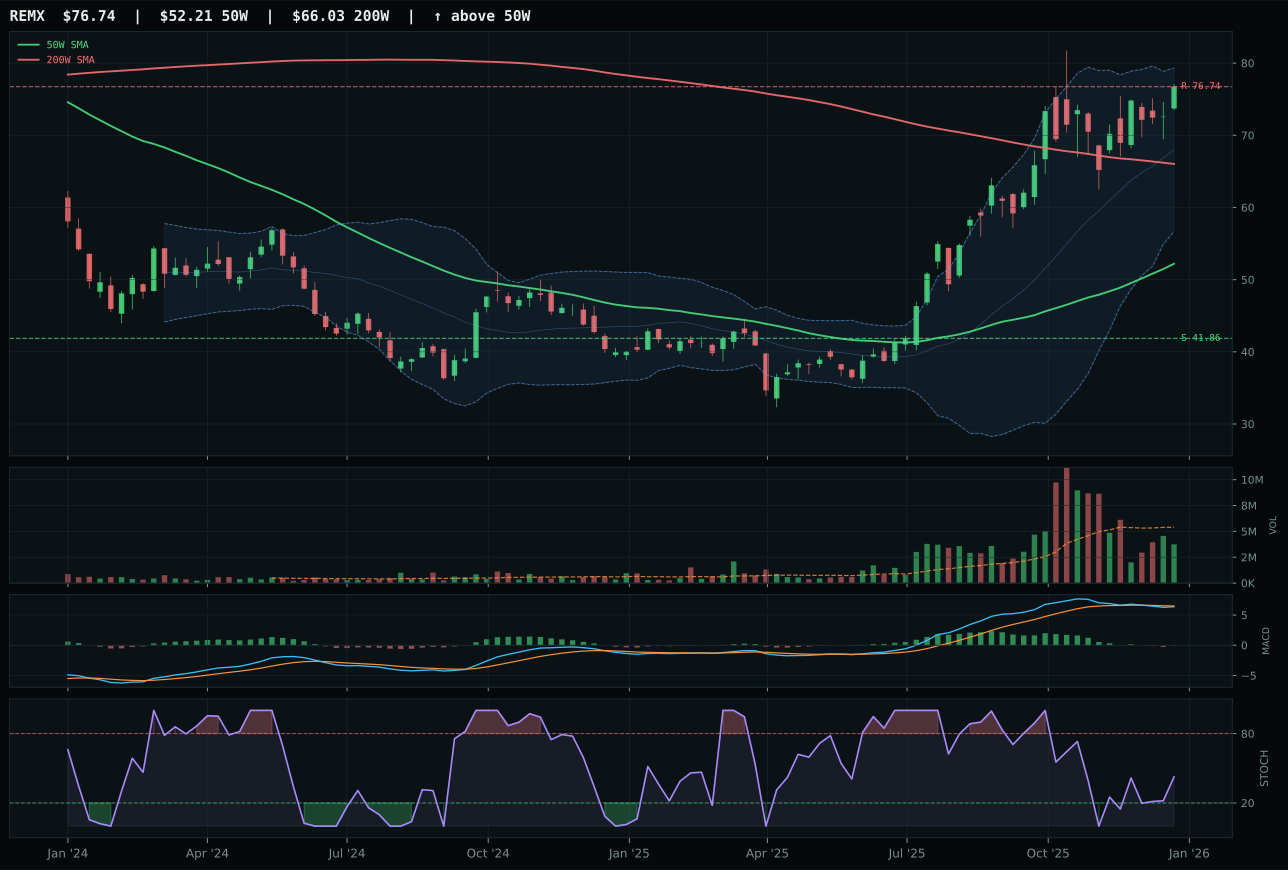
REMX has a vertical extension profile with 12.2% 13-week relative strength versus SPY.
A failed hold above support would weaken the setup.
Actionable but governed by invalidation levels.
COPX wins a closely contested battle against PICK on the single technical edge of category-relative strength: 13.0% versus 0.0%, translating a 10-point gap between trend/structure/timing scores into a 78.0 final category score that earns top-2 status. Both charts are extended 56–57% above their 50Ws, both show stochastic RSI overbought at 1.00, both have MACD bullish and improving, and both show 13-week returns north of 19%. PICK's technical evidence of 86.5 is superior to COPX's 78.4, and PICK's volume confirmation is actual accumulation (87 score) versus COPX's neutral 80—yet PICK ranks below COPX in the reasoner's proof order because COPX's RS versus SPY (28.5%) exceeds PICK's (15.5%), signaling that copper's scarcity narrative is outpacing the broader mining complex. The category-relative strength metric is the tiebreaker that elevates COPX from third place to the winner's circle; it reflects market structure where copper-specific demand is driving the outperformance, not general risk appetite.
Industrial Metals earned top-2 status with a 78.0 score, just shy of Precious Metals' 71.8, because the macro case for metals scarcity is even more robust at the category level (79.0 fit) than for silver alone. Two active descriptors drive the reasoning: 'metals scarcity' contributes +14 and 'commodity breadth positive' adds +10, combining with Goldilocks regime tailwind (+6) to create powerful structural support. COPX's macro fit of 69.0 is slightly lower than its technical evidence of 78.4, revealing that the technicals are outpacing the narrative—a healthy sign that the move is not purely macro-driven hype. The 20% allocation reflects the portfolio's thesis that industrial metal demand will remain structurally bid throughout the Goldilocks period, underpinned by energy transition capex, semiconductor supply chains, and the absence of major supply additions. The risk to this allocation is asymmetric: risk/reward is only 38.9, meaning upside to resistance is 0.0% while downside to support is 77.1%. COPX's persistence score of 99.3 and momentum confirmation of 100.0 provide comfort that the structure is real, but the extended distance from the 50W (56.4%) combined with neutral volume (0.98x) suggests that the next phase of accumulation will require a pullback. A close below the 50W at 41.79 would trigger a reduction to 10%.
Precious Metals — SLV
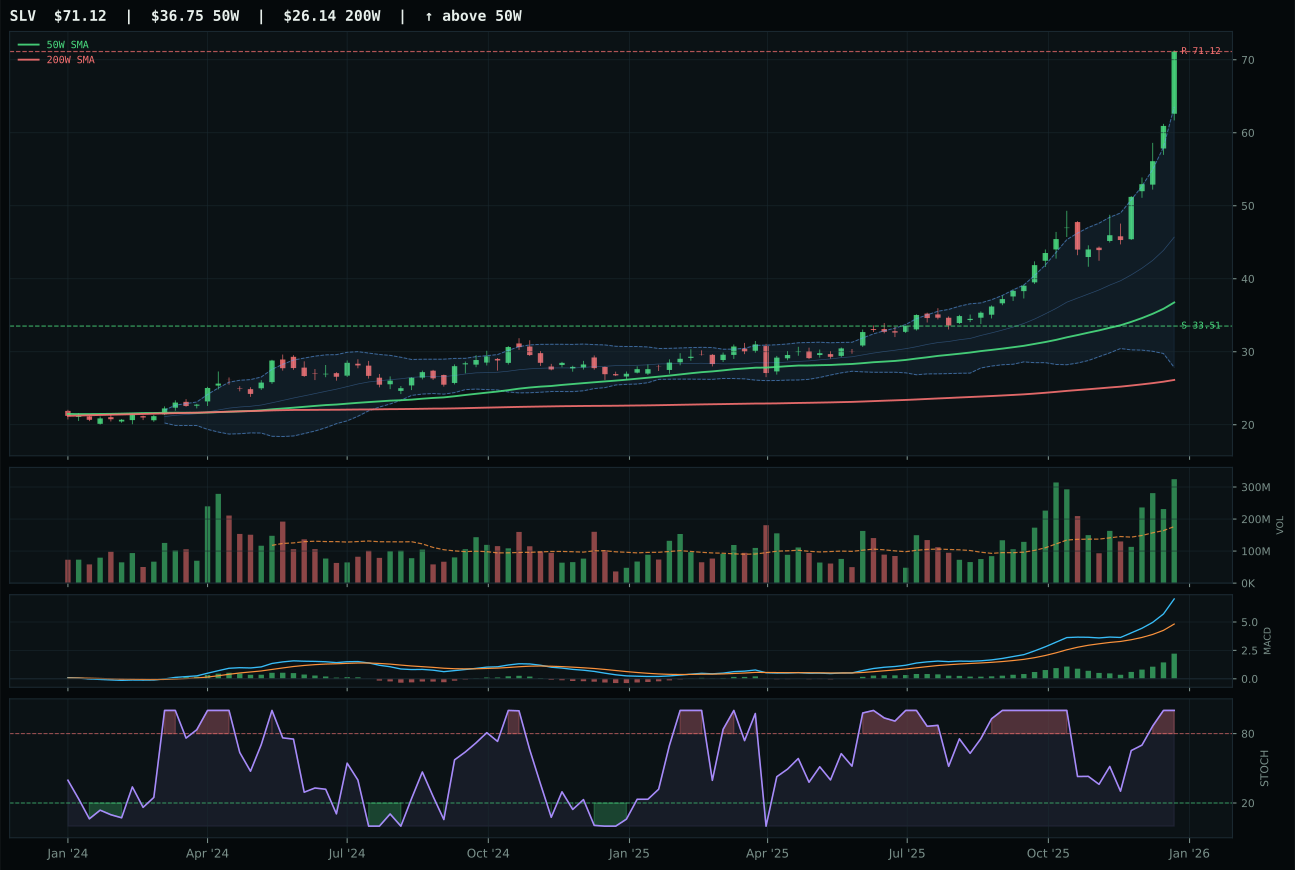
SLV has a vertical extension profile with 65.6% 13-week relative strength versus SPY.
A failed hold above support would weaken the setup.
Actionable but governed by invalidation levels.
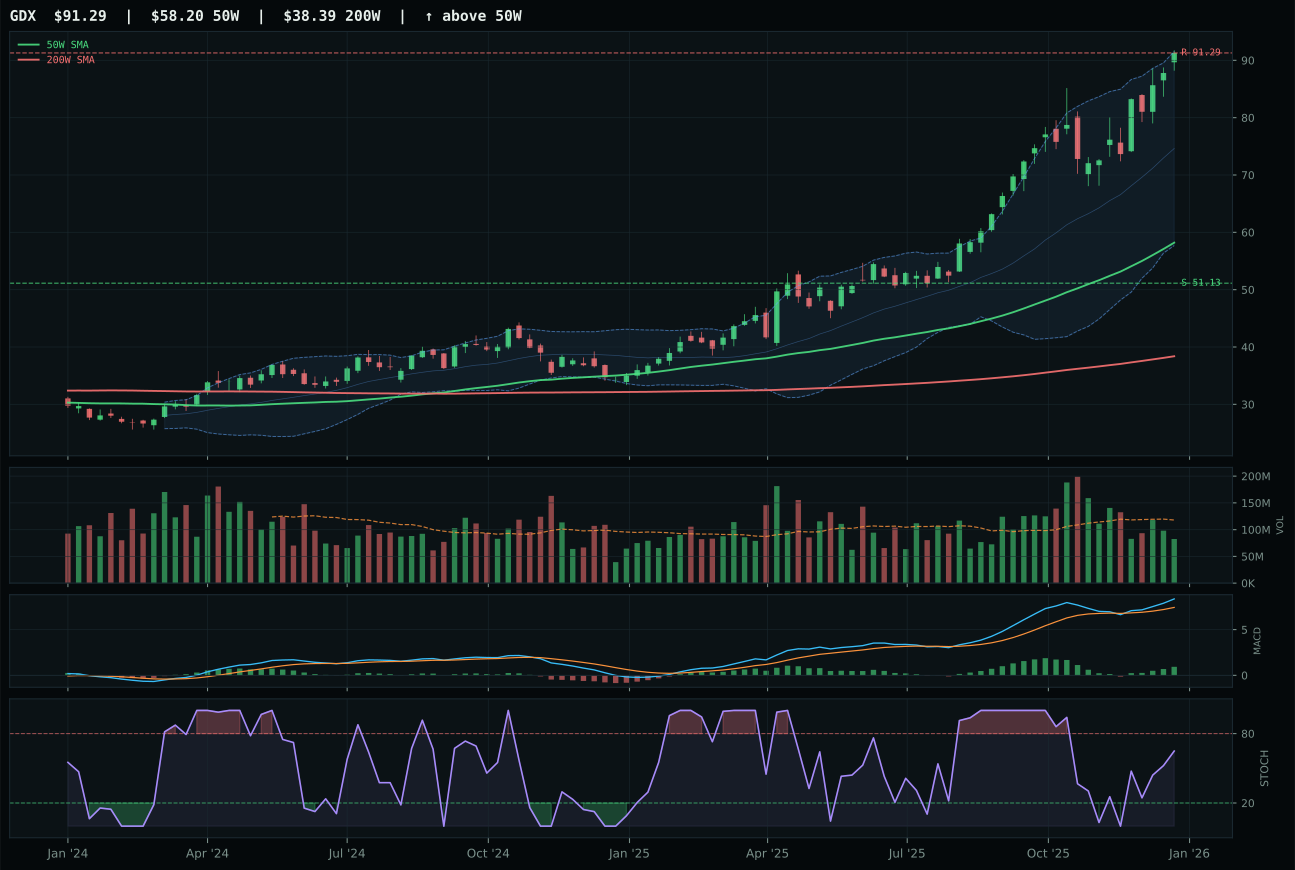
GDX has a vertical extension profile with 17.9% 13-week relative strength versus SPY.
A failed hold above support would weaken the setup.
Actionable but governed by invalidation levels.
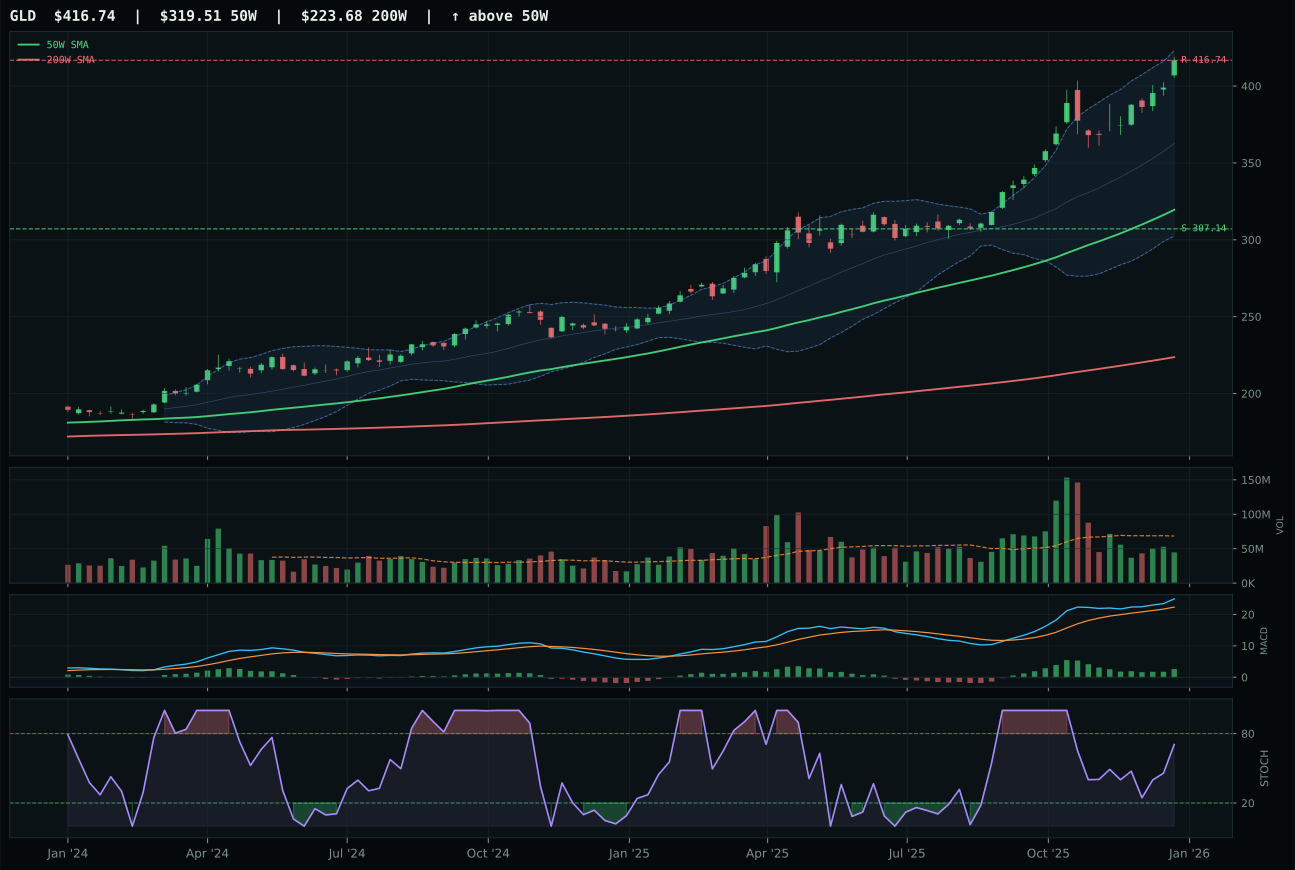
GLD has a vertical extension profile with 15.9% 13-week relative strength versus SPY.
A failed hold above support would weaken the setup.
Actionable but governed by invalidation levels.
SLV dominates not just its category but the entire portfolio with a 71.8 score that reflects the full technical and macro alignment rare in capital markets. The chart is extended 93.5% above the 50W—an entry risk that would normally penalize any asset—but SLV's 69.9% 13-week return, 65.6% relative strength to SPY, and overbought stochastic RSI at 1.00 indicate momentum is not exhausted but rather confirming a structural regime shift in monetary hedge demand. Volume explodes to 1.84x normal, MACD is bullish and improving, and the persistence score of 100 means every technical signal is aligned to the same direction. GDX, the runner-up, shows similar absolute strength (22.2% 13-week return, 17.9% relative to SPY) but fails on structure (69.2 versus 83.2), volume confirmation (thin versus accumulation), and category-relative strength (0.0% versus 47.7%)—a difference that matters when timing the transition from catch-up to carry. SLV's 47.7% outperformance of the category median reflects the silver market's re-rating as monetary premium plus industrial beta, not speculation.
Precious Metals earned its rank as a top-2 category at 71.8 because the macro regime and technical evidence aligned completely around a monetary hedge thesis that is only beginning. The active descriptor 'monetary hedge bid' contributes +14 to category reasoning and 'metals scarcity' adds +7, combining to a macro fit of 64.0 that is rare outside the two top categories. SLV's technical evidence of 100.0 derives from perfect alignment of trend, relative strength, volume sponsorship, and momentum confirmation—each pillar reinforcing the others. The category's 20% allocation reflects conviction that the Goldilocks regime will persist long enough for silver's industrial demand to follow monetary premium higher, and that liquidity expansion will continue funding real-asset flows. However, the timing score of only 37.0 is a warning light: SLV is already extended, stochastic is overbought, and there is no downside cushion. The allocation persists at 20% because mean-reversion trades in precious metals are typically violent and destructive; holding during extension is preferable to chasing back in after a 10% drawdown. The pre-condition for downgrade is a MACD cross below signal line or a fall below the 50W—not a close call but a definitive break of the uptrend.
AI — BOTZ
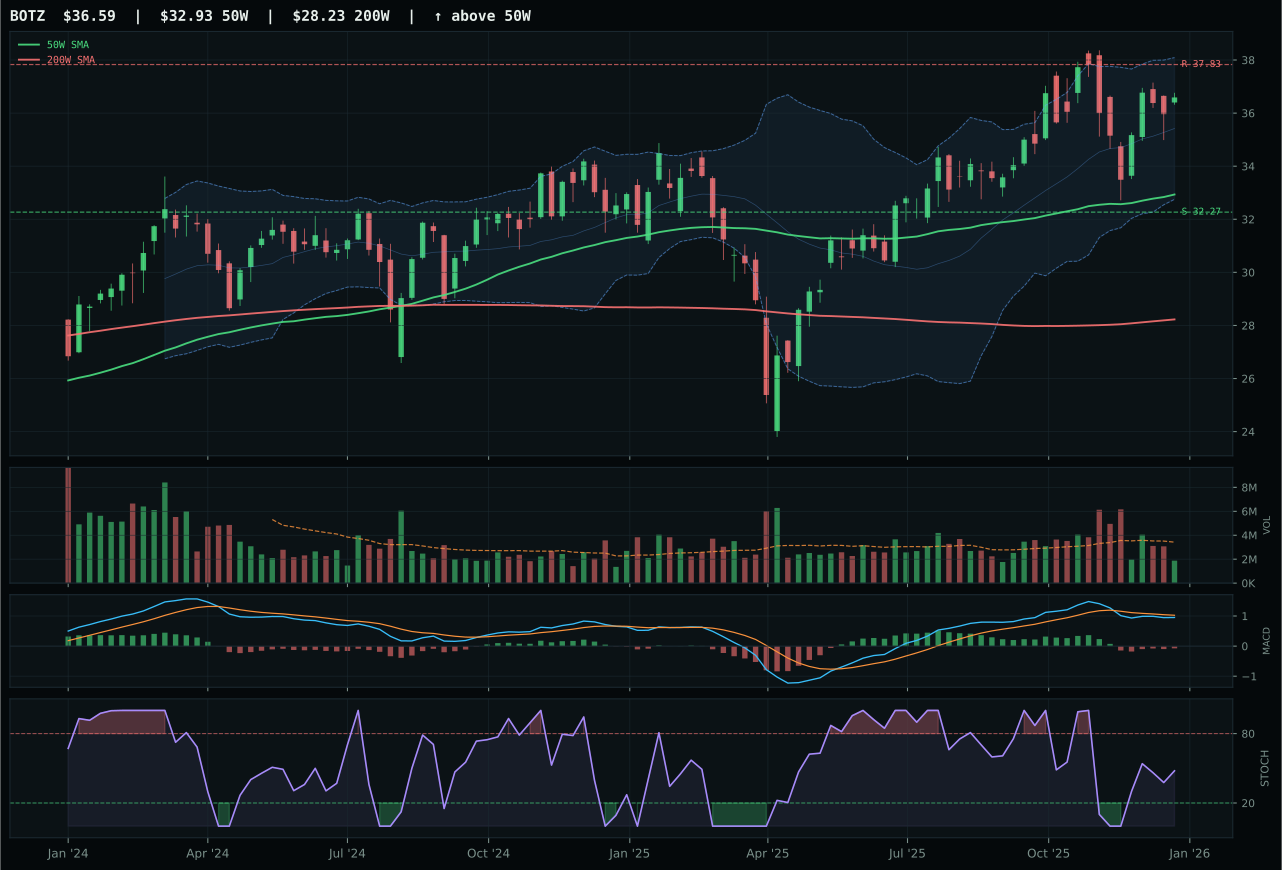
BOTZ has a neutral structure profile with 0.7% 13-week relative strength versus SPY.
A failed hold above support would weaken the setup.
Actionable but governed by invalidation levels.
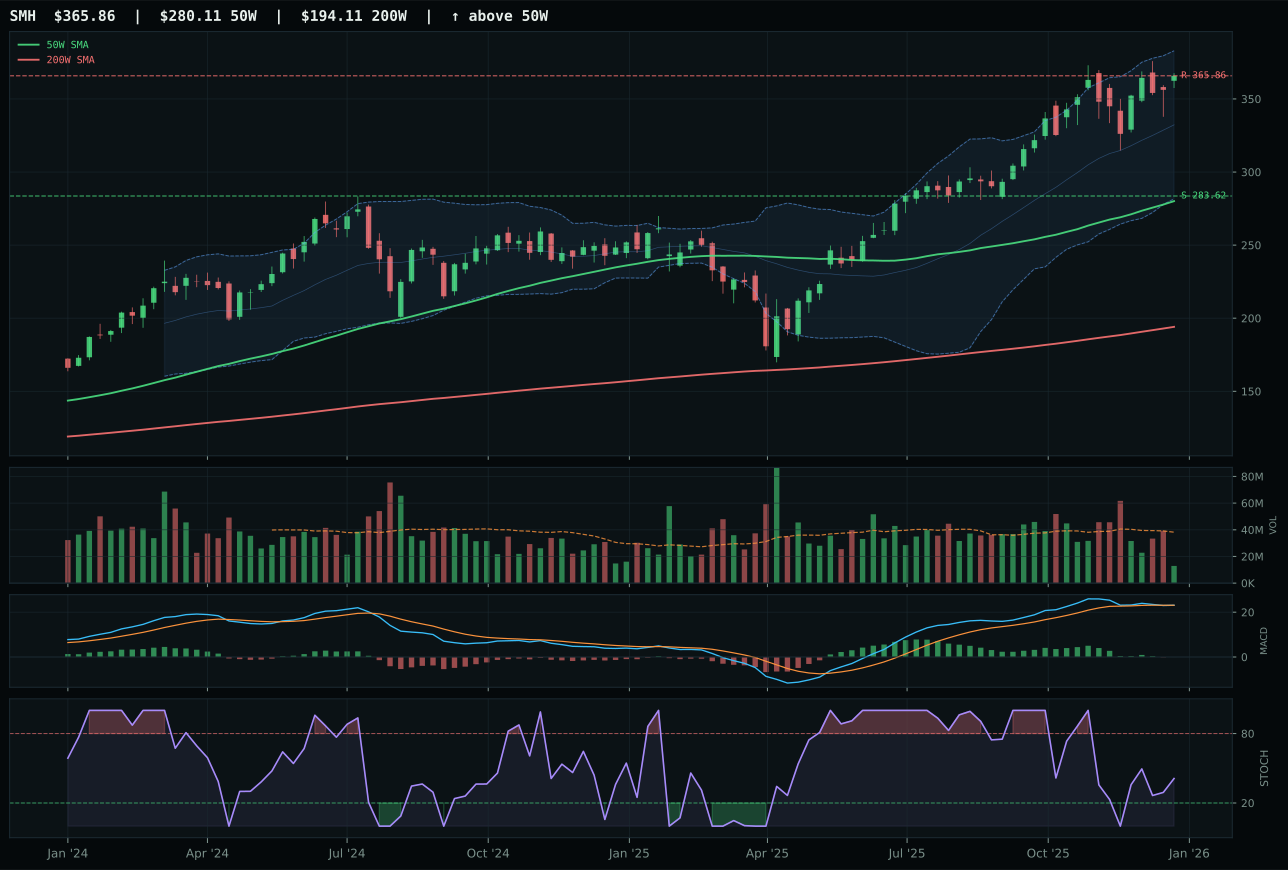
SMH has a vertical extension profile with 9.4% 13-week relative strength versus SPY.
A failed hold above support would weaken the setup.
Actionable but governed by invalidation levels.
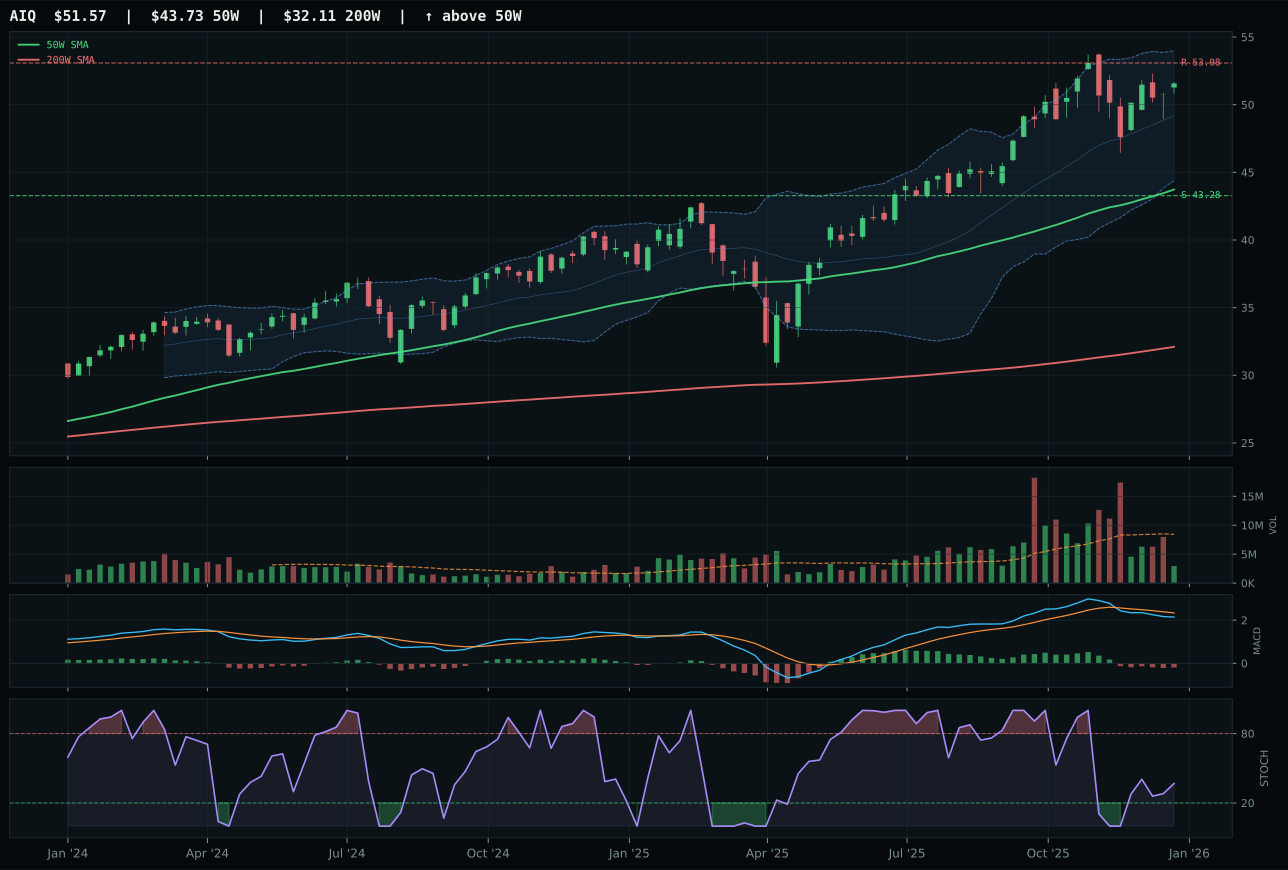
AIQ has a vertical extension profile with 1.1% 13-week relative strength versus SPY.
A failed hold above support would weaken the setup.
Actionable but governed by invalidation levels.
BOTZ edges SMH because it refuses the vertical extension trap that has claimed the semiconductor leader at a 30.6% distance from the 50W. BOTZ sits 11.1% above its moving average with trend strength of 94 and risk/reward of 49.4 versus SMH's inferior 42.0, meaning the robotics play offers better downside cushion relative to its upside target. SMH's 13-week return of 13.7% and relative strength of 9.4 versus SPY look compelling, but they mask a timing problem: stochastic RSI is falling in neutral territory and MACD is bullish but flattening, indicating momentum is decelerating into the extended setup. BOTZ's stochastic RSI is also falling but from a lower starting point, and its 5.0% 13-week return with 0.7% relative strength to SPY suggests boring stability rather than stretched leadership—exactly what wins during rebalancing phases when the easy money has already been made.
AI scores 69.6, fourth among the ten categories, and earns a 10% allocation despite strong macro tailwinds because its technical backbone is soft where it matters most. The category-level macro fit of 86.0 reflects robust AI growth sponsorship and risk appetite, yet the representative BOTZ posts only 57.0 technical evidence and 60.9 volume-price confirmation—suggesting the upside is priced in and participation is waning. BOTZ's timing score of 75 is respectable but not dominant, and risk/reward at 49.4 leaves limited cushion if the Goldilocks narrative fractures. The allocation holds because AI remains structurally supported by liquidity expansion and positive risk appetite, and BOTZ offers pure-play robotics exposure without semiconductor leverage; however, the weakness in persistence (58.9) and momentum confirmation (59.3) signals that conviction should remain modest. Only a fresh breakout above resistance at 37.83 with volume confirmation would justify moving this to 20%.
Technology — IGV
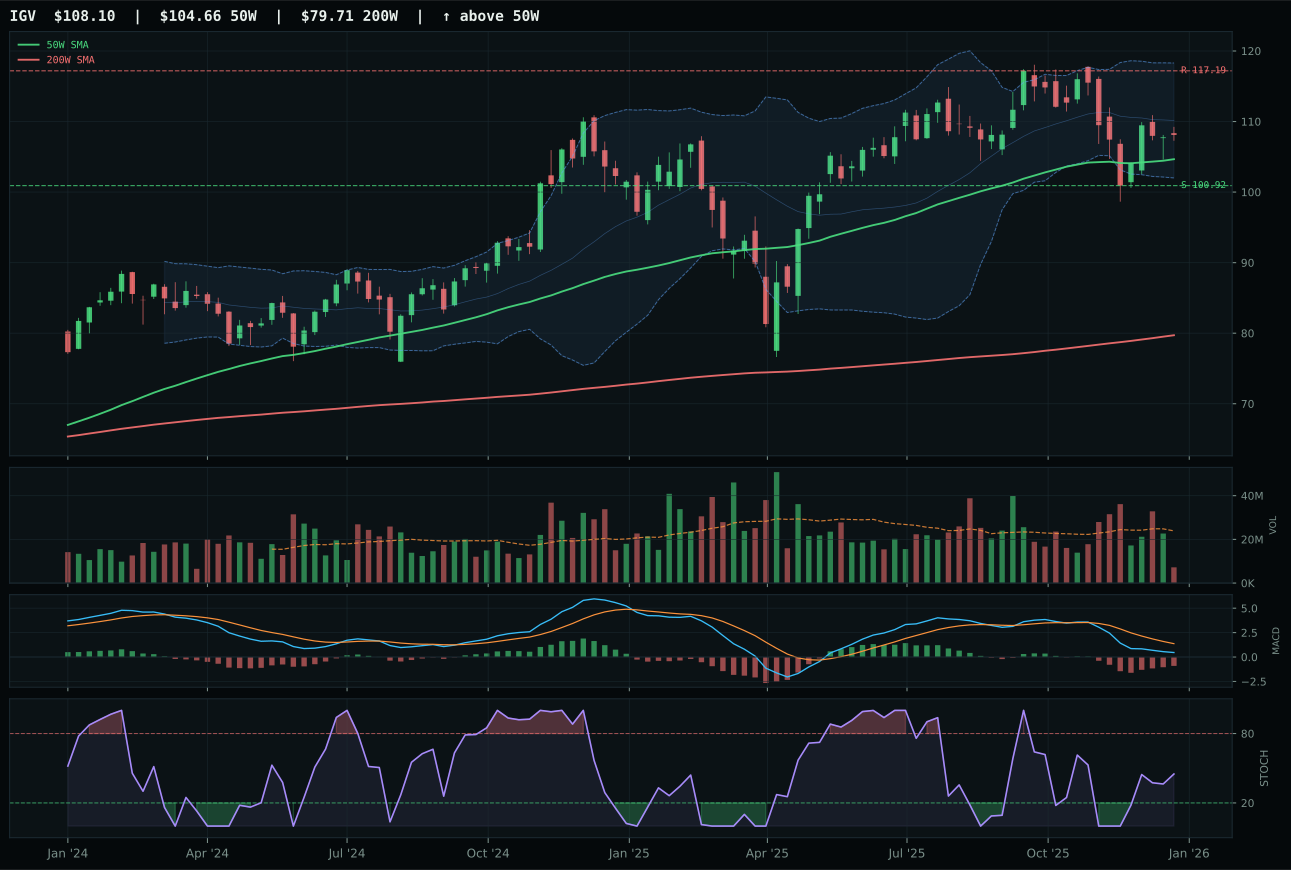
IGV has a neutral structure profile with -10.3% 13-week relative strength versus SPY.
A failed hold above support would weaken the setup.
Actionable but governed by invalidation levels.
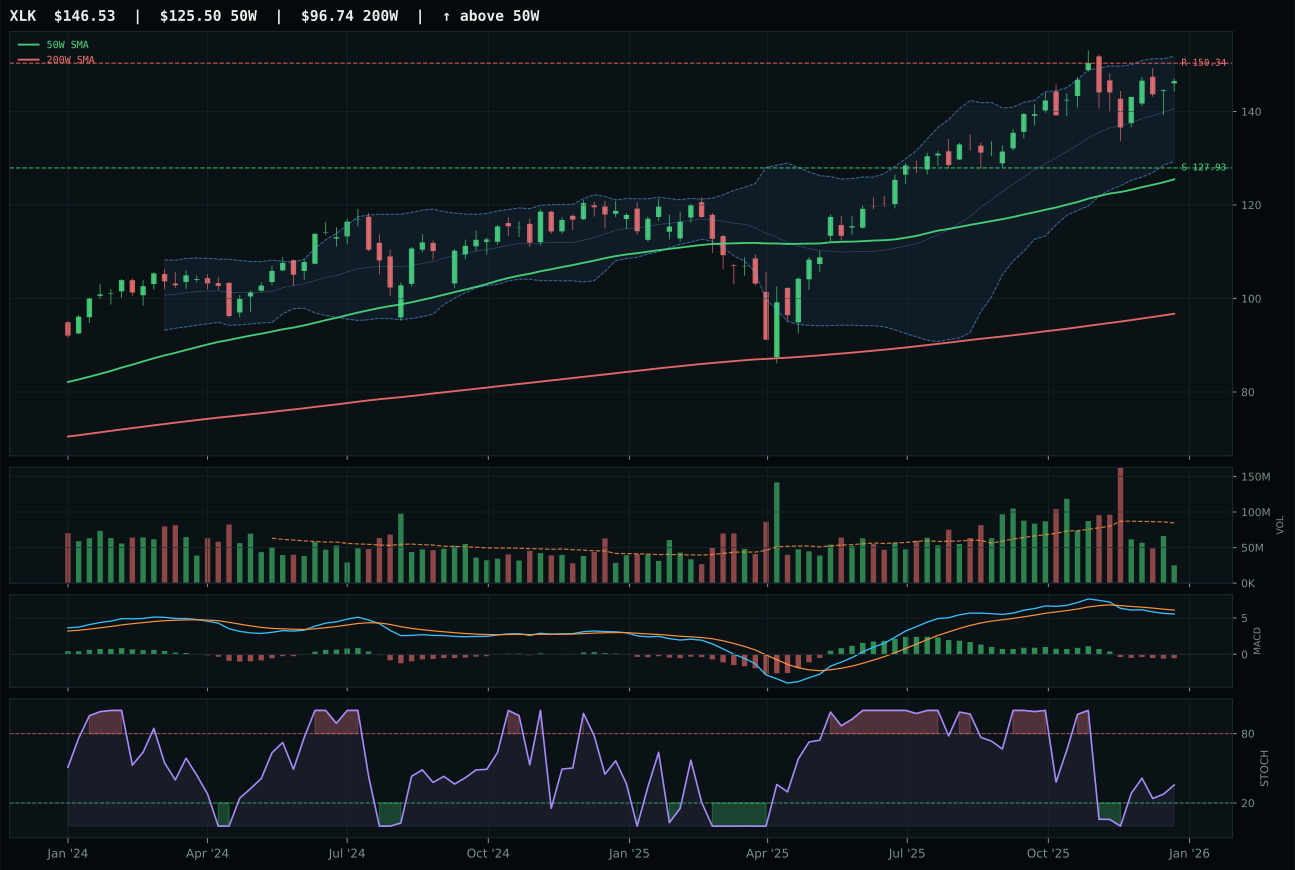
XLK has a vertical extension profile with 0.8% 13-week relative strength versus SPY.
A failed hold above support would weaken the setup.
Actionable but governed by invalidation levels.
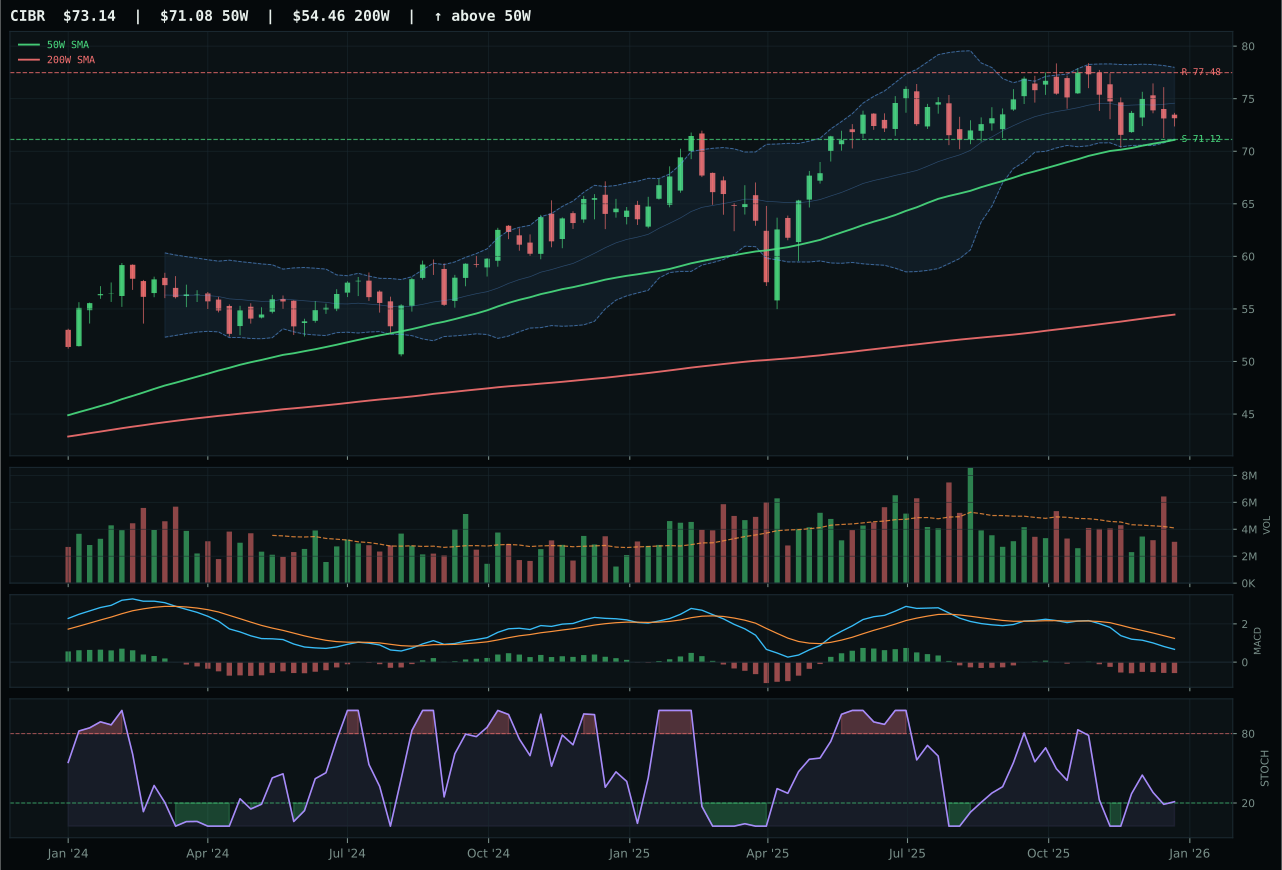
CIBR has a pullback into support profile with -7.8% 13-week relative strength versus SPY.
A failed hold above support would weaken the setup.
Actionable but governed by invalidation levels.
IGV claims the category because its timing score of 98 reflects a setup that rewards patience rather than chasing extended moves. The chart sits just 3.3% above the 50W, with MACD bearish but inflecting higher and stochastic RSI climbing into mid-zone territory—a clean reversion-to-mean environment where new capital can enter without fighting gravity. XLK, by contrast, extended 16.8% above its 50W with stochastic RSI already falling and MACD deteriorating, leaving late buyers exposed. IGV's -6.0% 13-week return and -10.3% relative strength versus SPY tell a story of temporary weakness within a intact trend; the risk/reward of 64.6 versus XLK's 40.1 reflects genuine pullback opportunity rather than breakdown. The setup is neutral structure with defined support at 100.92 and resistance at 117.19, making the trade binary and manageable.
Technology ranks tenth among the ten categories this week at 59.4, earning a 10% allocation as a cyclical hedge rather than a growth engine. Goldilocks regime combined with active liquidity expansion and positive risk appetite should theoretically support this exposure, yet the category-level macro fit of 81.0 cannot override technical evidence that remains suspect across the board—volume is thin participation across all three ETFs, momentum confirmation is weak at 27.4 for the winner, and persistence sits at just 45.0. IGV's strength relative to XLK and CIBR is real but relative; winning a weak category does not justify top-tier allocation. The allocation persists because the portfolio needs exposure to enterprise software and duration-sensitive growth in a liquidity-expansion regime, and IGV offers the cleanest entry point despite compressed risk-reward. A move back above the 50W with volume confirmation would be the pre-condition to upgrade this to 20%.
Emerging Markets — IEMG
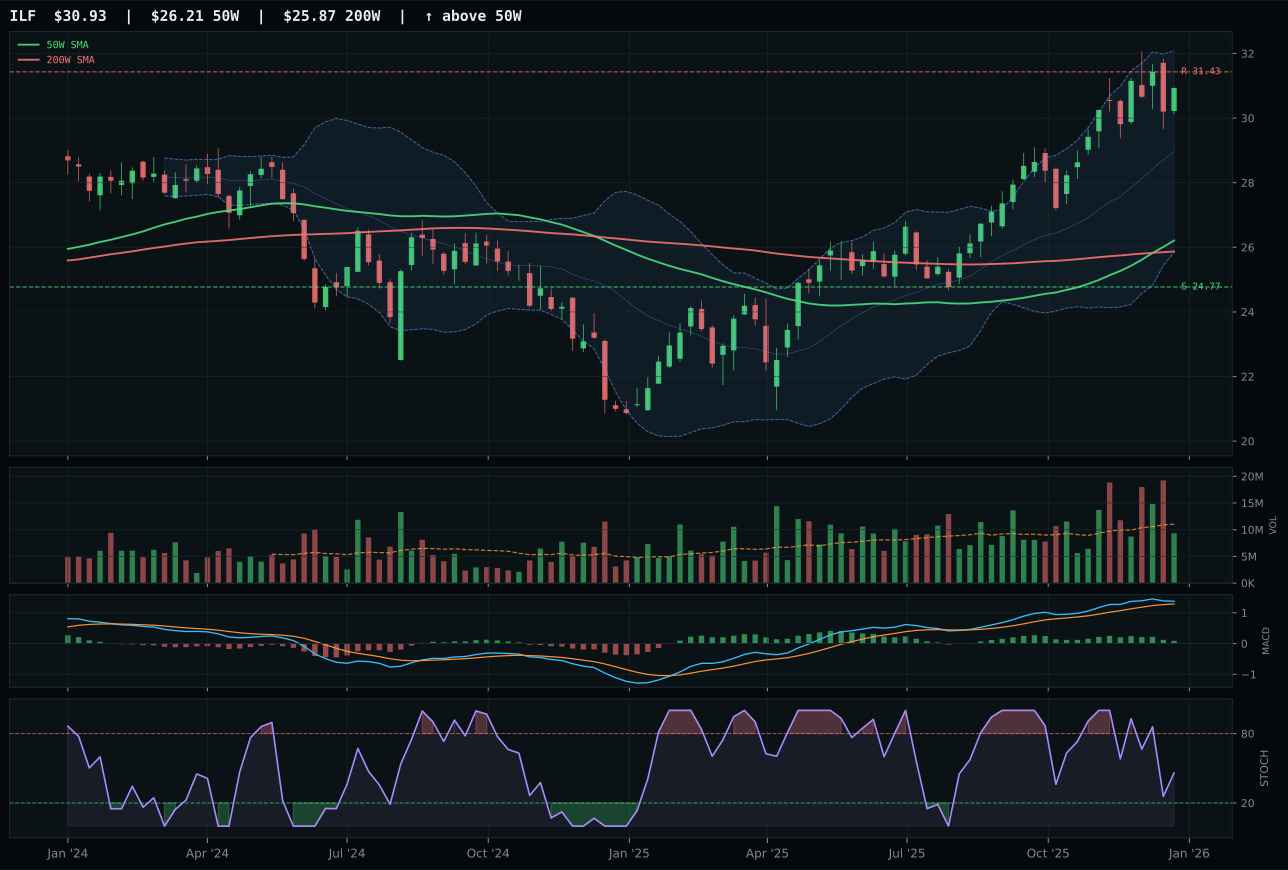
ILF has a vertical extension profile with 3.7% 13-week relative strength versus SPY.
A failed hold above support would weaken the setup.
Actionable but governed by invalidation levels.
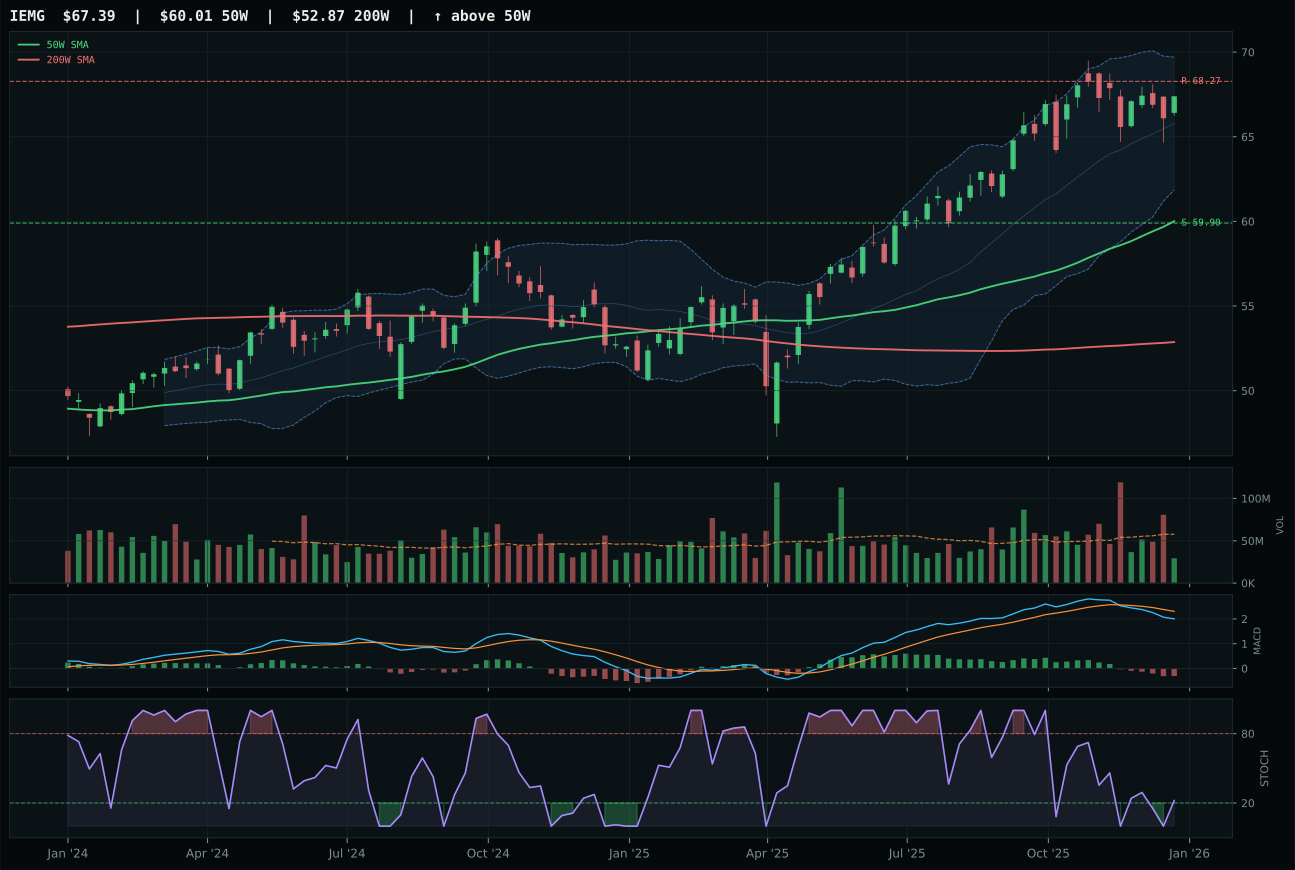
IEMG has a neutral structure profile with -0.9% 13-week relative strength versus SPY.
A failed hold above support would weaken the setup.
Actionable but governed by invalidation levels.
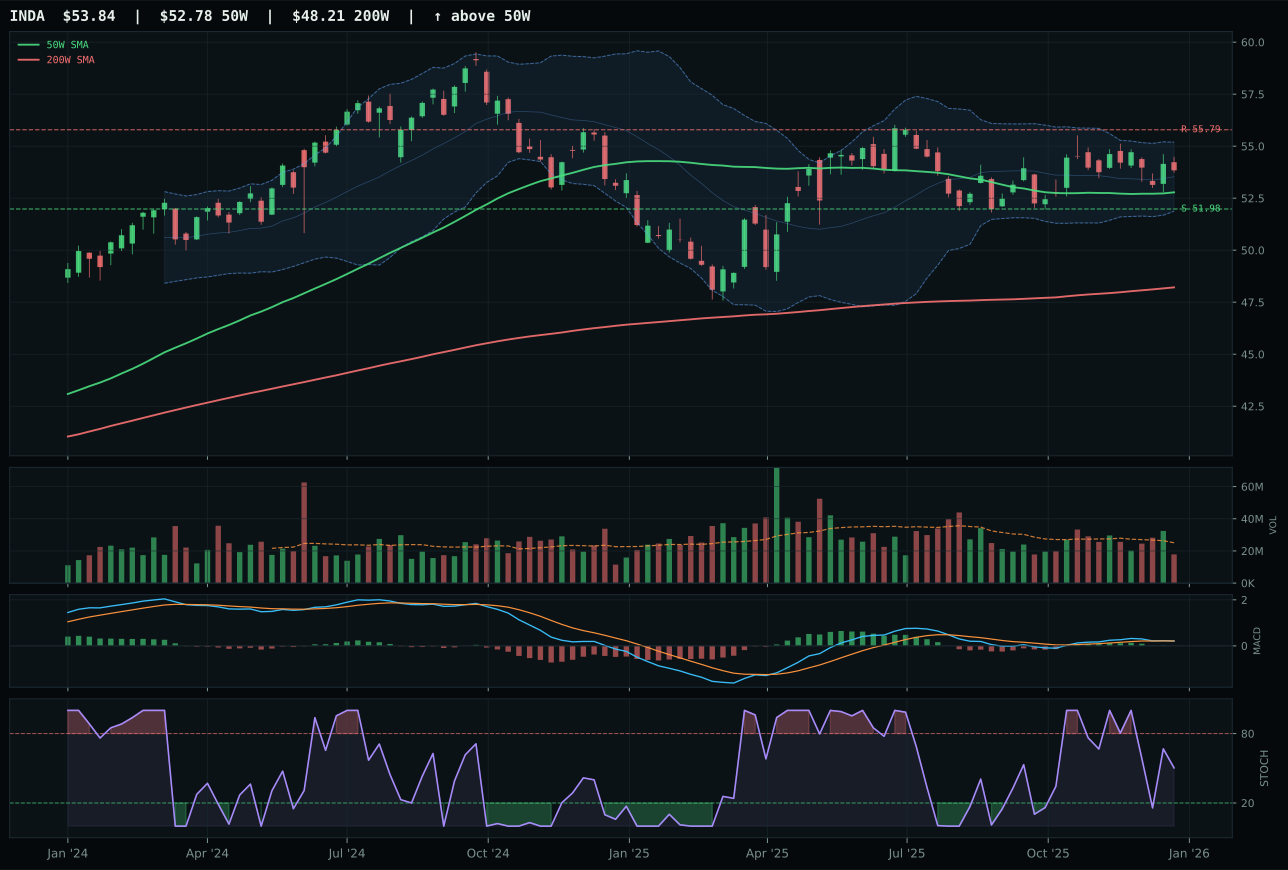
INDA has a pullback into support profile with -1.3% 13-week relative strength versus SPY.
A failed hold above support would weaken the setup.
Actionable but governed by invalidation levels.
IEMG prevails over ILF not because the broad emerging-market index is stronger on technicals—ILF scores 61.5 technical evidence versus IEMG's 40.8—but because ILF is extended 18.0% above its 50W while IEMG is only 12.3% extended, and because IEMG's macro fit of 67.0 reflects active 'EM liquidity support' at +12 that outweighs the technical deficit. ILF's MACD is bullish but flattening, stochastic RSI is falling/neutral, and its 8.0% 13-week return is impressive—yet the chart sits near a 52-week high with timing score of 40, a clear penalty for late entry. IEMG's timing of 62.0 and MACD bearish/weakening with stochastic falling mid-zone creates a reversion candidate within a neutral structure. The category-relative strength favors IEMG at 0.0% parity, while ILF's +4.6% shows it outperformed the median but at stretched valuations. IEMG's advantage is the macro directive: emerging-market liquidity support is an active signal that will sponsor broad-based flows, not just commodity-sensitive Latin America plays.
Emerging Markets scores 57.4 and earns a 10% allocation despite modest technical evidence (40.8 for the winner) because macro fit of 78.0 is the highest in the entire portfolio outside the top-2 categories. The active descriptors 'EM liquidity support' (+14) and 'liquidity expansion' (+8) combine with 'risk appetite positive' (+8) to create structural tailwind that overrides IEMG's weak momentum confirmation (33.2) and thin participation. IEMG's relative strength to SPY is actually negative at -0.9%, meaning emerging markets are underperforming the U.S., yet the allocation persists because (a) liquidity expansion typically benefits EM currencies and cross-border flows, and (b) the Goldilocks regime de-risks the credit stress exposure that normally pressures emerging sovereigns. The category-level technical evidence of 40.8 is weak—IEMG sits 12.3% above the 50W, MACD is bearish, stochastic is falling—yet the category score of 57.4 reflects the reasoner's weighting of macro at 38% versus technicals at 62%, with macro providing sufficient lift to justify allocation. Persistence at 46.4 warns that the setup lacks follow-through, and volume-price confirmation at 42.6 suggests accumulation has not begun. The portfolio accepts this tension because liquidity cycles reward early entry; however, a fall below the 50W support at 59.90 would warrant reduction to 5%, and only a macro reversal to risk-off would justify elimination.
Defense & Aerospace — XAR
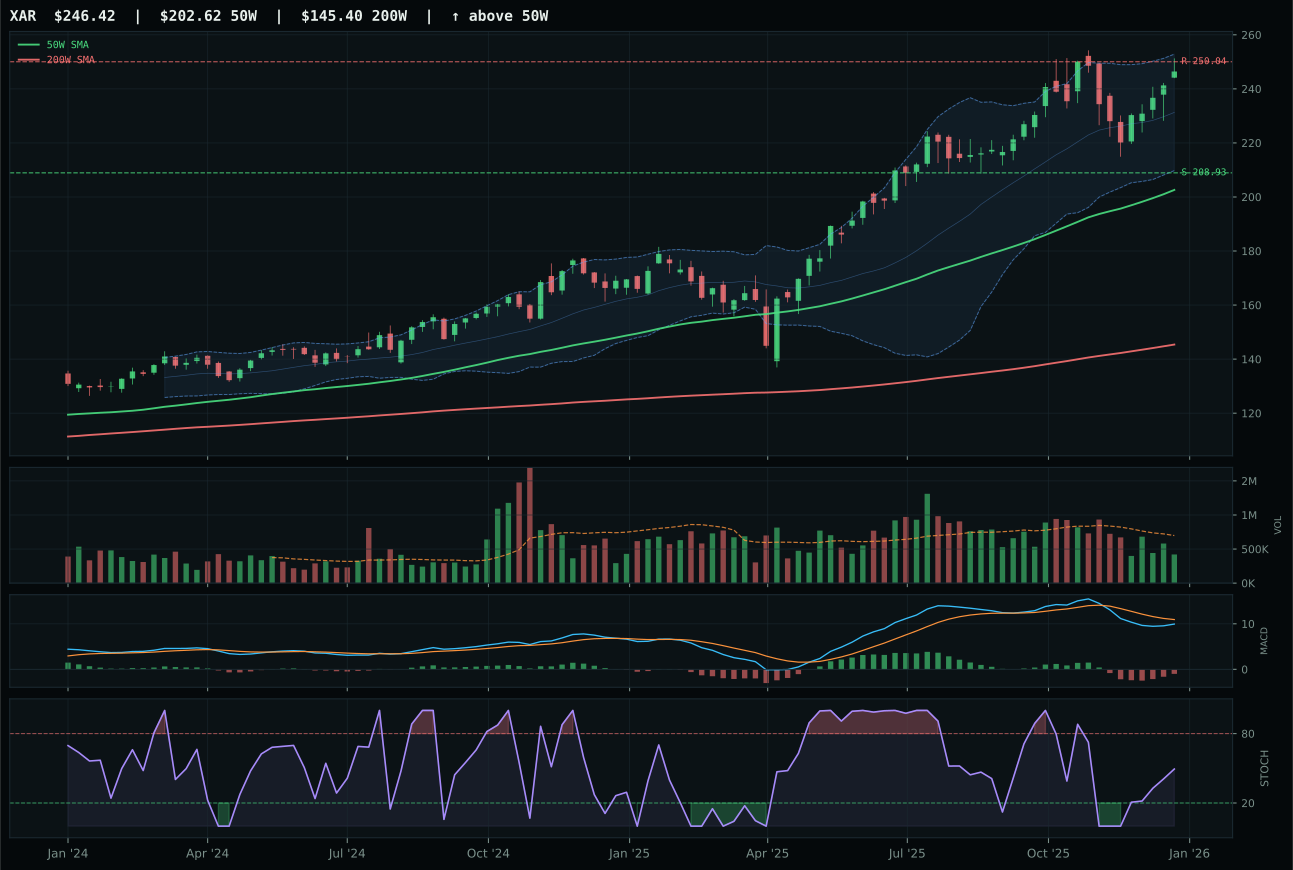
XAR has a vertical extension profile with 2.7% 13-week relative strength versus SPY.
A failed hold above support would weaken the setup.
Actionable but governed by invalidation levels.
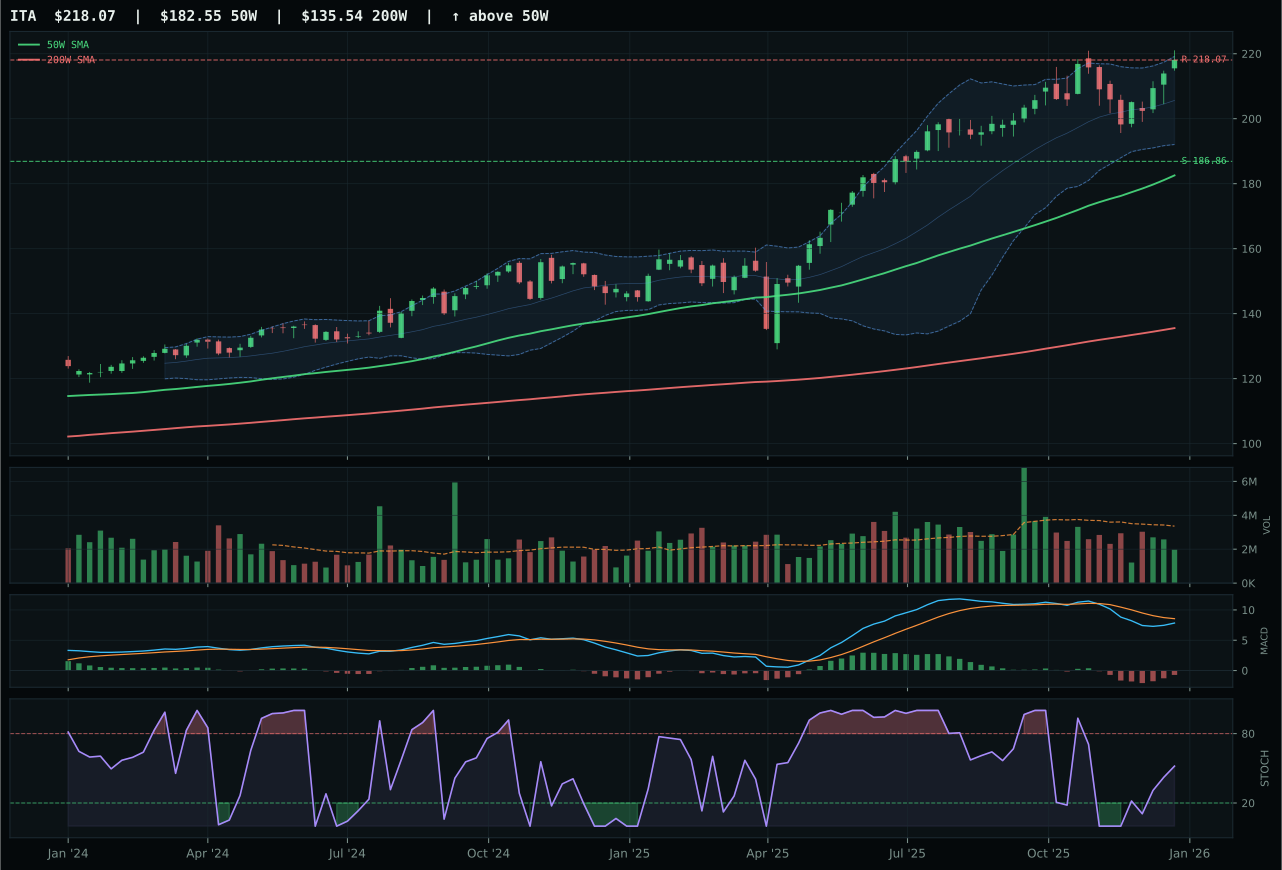
ITA has a vertical extension profile with 1.7% 13-week relative strength versus SPY.
A failed hold above support would weaken the setup.
Actionable but governed by invalidation levels.
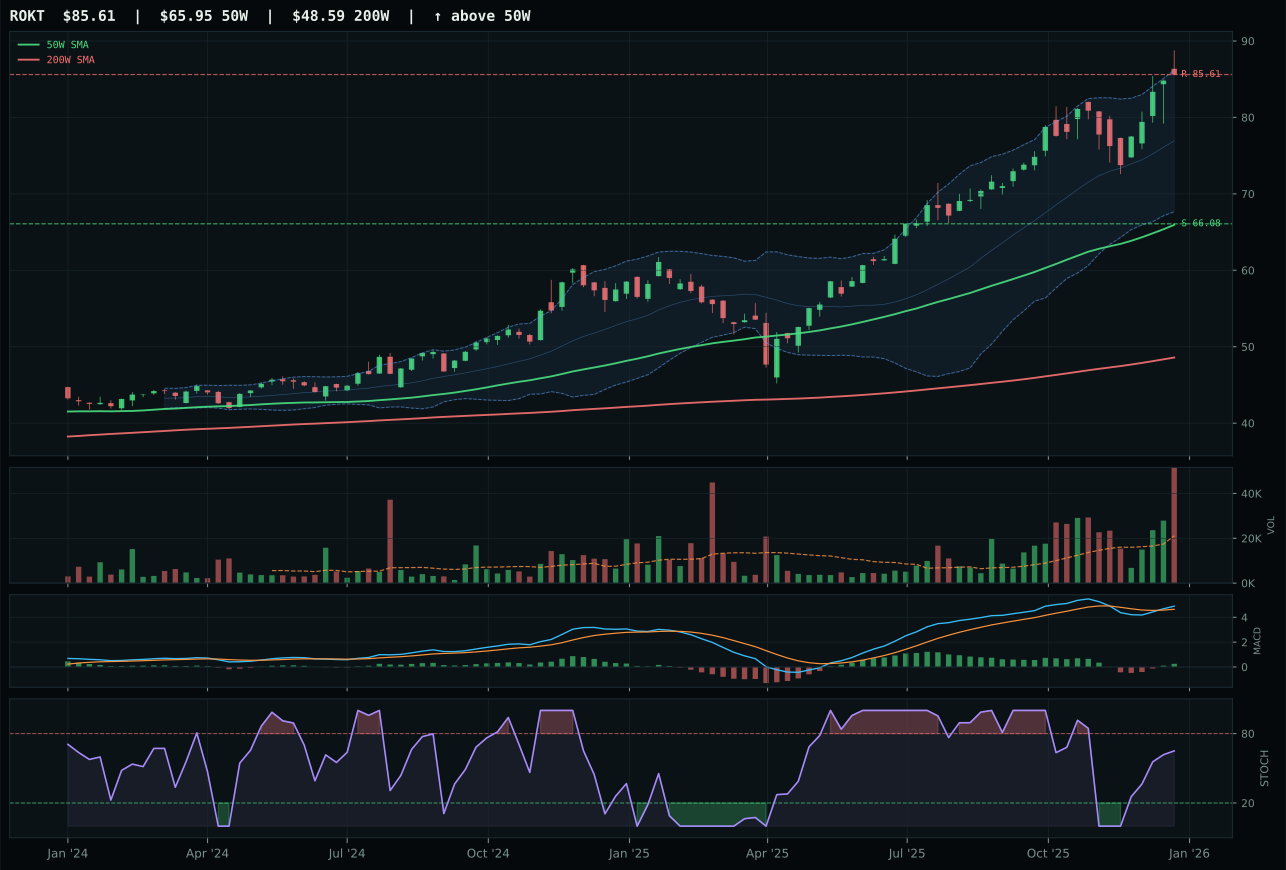
ROKT has a vertical extension profile with 10.1% 13-week relative strength versus SPY.
A failed hold above support would weaken the setup.
Tracked, but not top-2 eligible because: .
XAR prevails in the tightest category decision of the week—a 0.4-point margin over ITA—by virtue of cleaner structure (68.3 versus 67.2) and superior category-relative strength (0.0% versus -1.0%), not because of any decisive technical edge. Both charts display identical vertical extensions 21–22% above their 50Ws, both show MACD bearish but improving with stochastic RSI rising mid-zone, and both sit near 52-week highs with entry risk baked in. XAR's 2.7% relative strength to SPY outperforms ITA's 1.7%, and its 7.0% 13-week return matches its 4-week return, suggesting consistency rather than momentum spikes. The category setup itself is exhausted—ITA's momentum score of 65 and XAR's 70 both signal that the easy buying pressure has been absorbed. This is a category where the winner is decided by fractions, not by conviction, and both ETFs carry timing scores of only 53, reflecting the extended nature of the entire aerospace complex.
Defense & Aerospace scores just 44.4, the fourth-weakest category, and holds a 10% allocation primarily as a portfolio stabilizer in a risk-on environment. Macro fit of 55.0 indicates neutral to slightly positive sponsorship—credit stress adds 2 points but provides minimal tailwind—and the absence of category-specific descriptors means the reasoning layer could not build a narrative case beyond technical signals. XAR's impressive trend score of 97 is overshadowed by its timing penalty of 53 and risk/reward of only 38.5, leaving almost no margin for error if the 52-week high at 250.04 fails to hold. The portfolio holds this position because the Goldilocks regime and positive risk appetite still favor pro-cyclical defense spending, and the setup does show early signs of accumulation (MACD improving, stochastic rising); however, the tight score gap between XAR and ITA and the weak persistence at 53.9 suggest this category is near an inflection point. A break below the 50W support at 208.93 would warrant immediate reduction to 5%.
Utilities & Infrastructure — PAVE
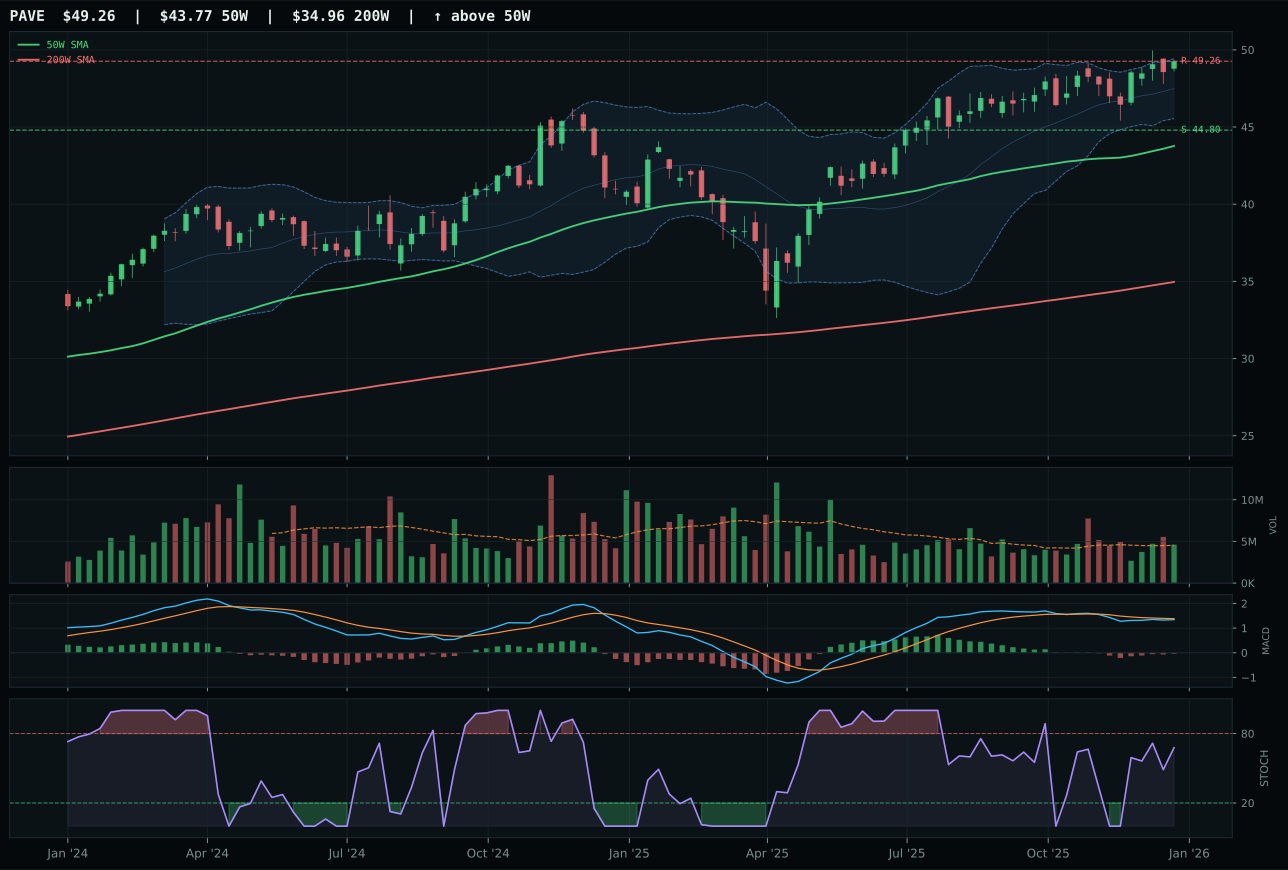
PAVE has a neutral structure profile with 0.3% 13-week relative strength versus SPY.
A failed hold above support would weaken the setup.
Actionable but governed by invalidation levels.
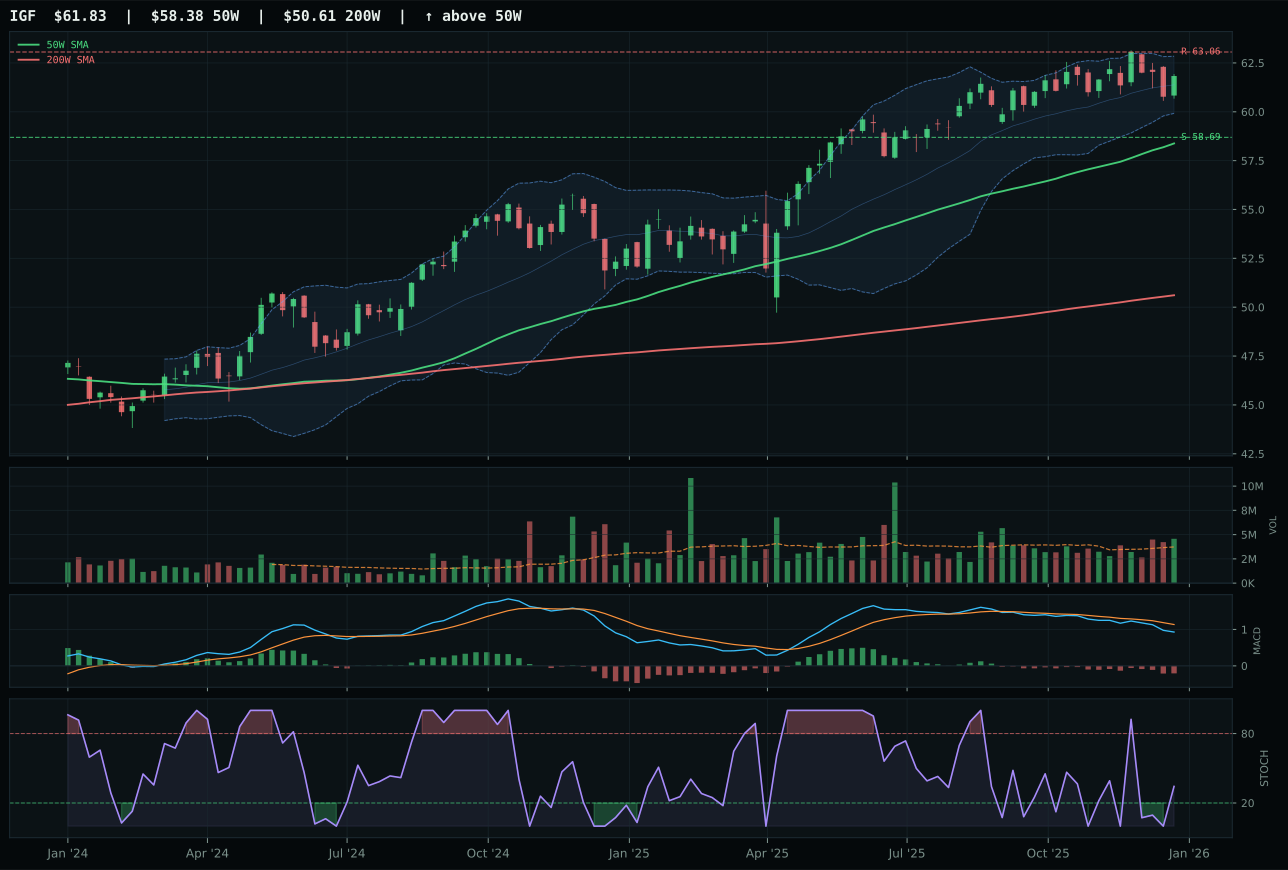
IGF has a neutral structure profile with -3.0% 13-week relative strength versus SPY.
A failed hold above support would weaken the setup.
Actionable but governed by invalidation levels.
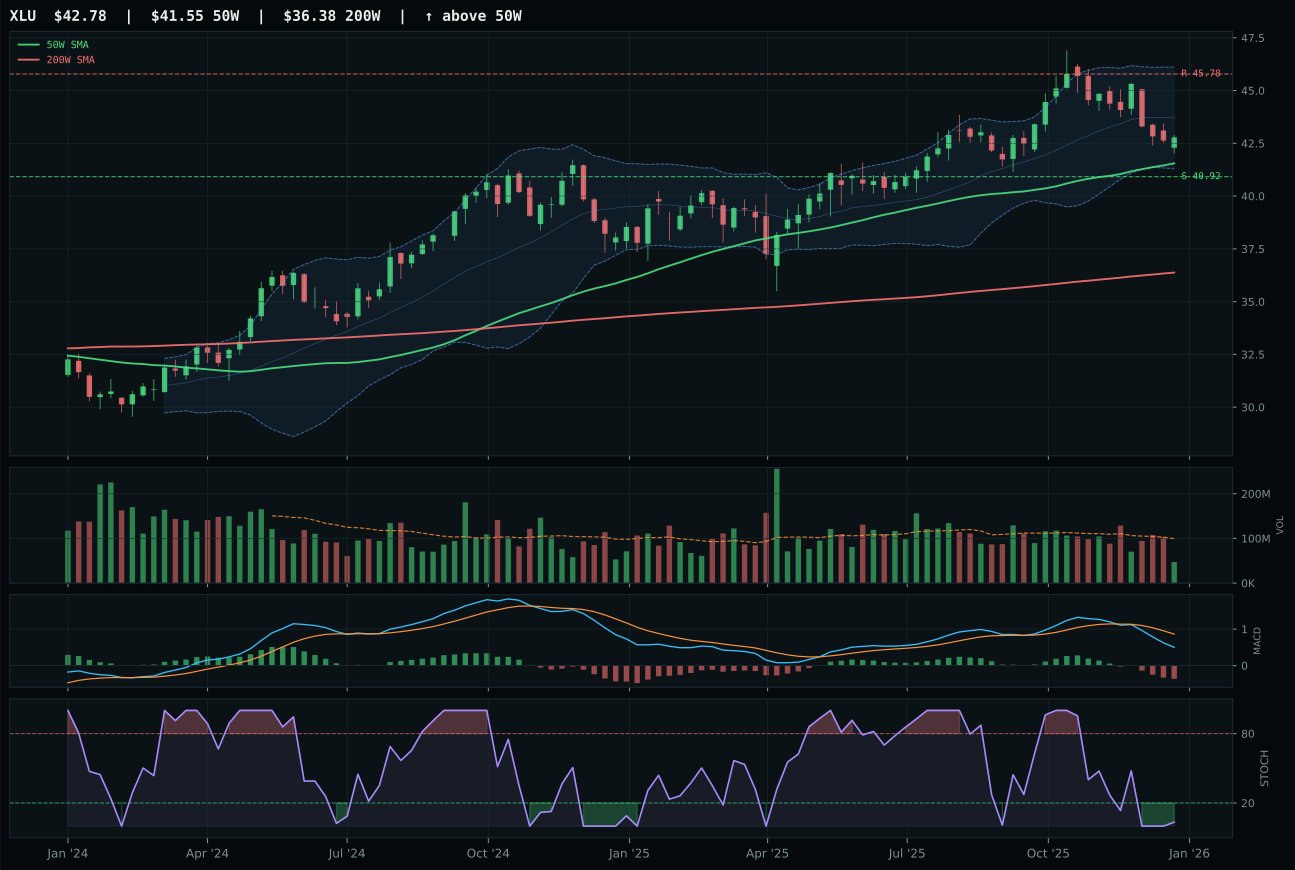
XLU has a pullback into support profile with -5.7% 13-week relative strength versus SPY.
A failed hold above support would weaken the setup.
Actionable but governed by invalidation levels.
PAVE captures the category with a clear technical and relative-strength edge: trend 93.5 versus IGF's 78, timing 75 versus 78 (nearly tied), and momentum confirmation 64.4 versus IGF's 33. The infrastructure play is 12.5% above the 50W versus IGF's longer extension, sits with stochastic RSI rising mid-zone on improving MACD, and owns 3.3% category-relative strength that decisively separates it from the also-ran. PAVE's risk/reward of 51.5 beats IGF's 43.6, and volume-price confirmation of 65.9 indicates accumulation is underway, not just rotation. IGF's structure is neutral but its momentum is weak (33), volume confirmation is thin, and category-relative strength is zero—a chart that would be fine in a risk-off environment but loses conviction in Goldilocks. PAVE's setup is clean and early; the 12.5% extension is manageable because the chart shows real buying pressure (1.02x volume neutral, rising stochastic) rather than mechanical extension.
Utilities & Infrastructure scores 41.3, fifth-weakest category, and holds 10% as a defensive income play that benefits modestly from Goldilocks and commodity breadth signals. PAVE's technical evidence of 72.2 is respectable but not exceptional, and macro fit of 53.0 reflects marginal tailwinds: 'commodity breadth positive' at +4, 'risk appetite positive' at +4, offset by 'credit stress' at -5. The category-level macro fit of 58.0 indicates this is neither a core convictions play nor a core drag—it is positioning for a scenario where rate cuts eventually compress real yields and make utility and infrastructure income more valuable. The allocation persists at 10% because the portfolio recognizes that Goldilocks regimes eventually give way to either disinflation-driven rate cuts (supporting utilities) or inflation-driven rate hikes (harming them); PAVE's current setup offers a low-risk entry point before the regime decision becomes obvious. Risk/reward at 51.5 shows PAVE has room to run to 49.26 with support at 44.80, creating a workable 10% risk zone. Persistence at 62.1 and volume-price confirmation at 65.9 are strong enough to suggest accumulation is real, not sentiment. The portfolio would upgrade to 20% only if (a) the Fed signals rate-cut timing, (b) PAVE sustains a break above 49.26 on volume, and (c) credit stress descriptor switches to false.
Nuclear Energy — URA
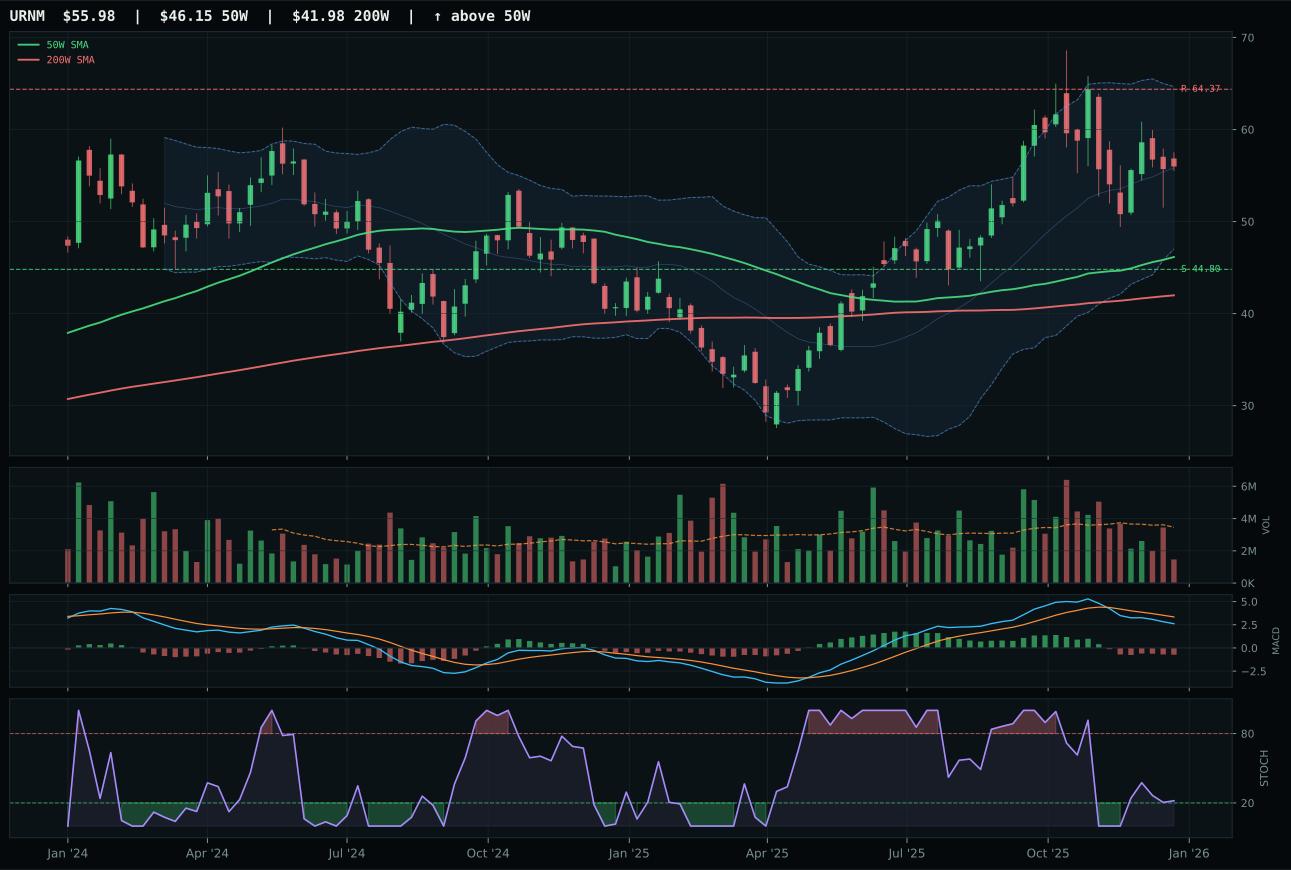
URNM has a vertical extension profile with -11.8% 13-week relative strength versus SPY.
A failed hold above support would weaken the setup.
Actionable but governed by invalidation levels.
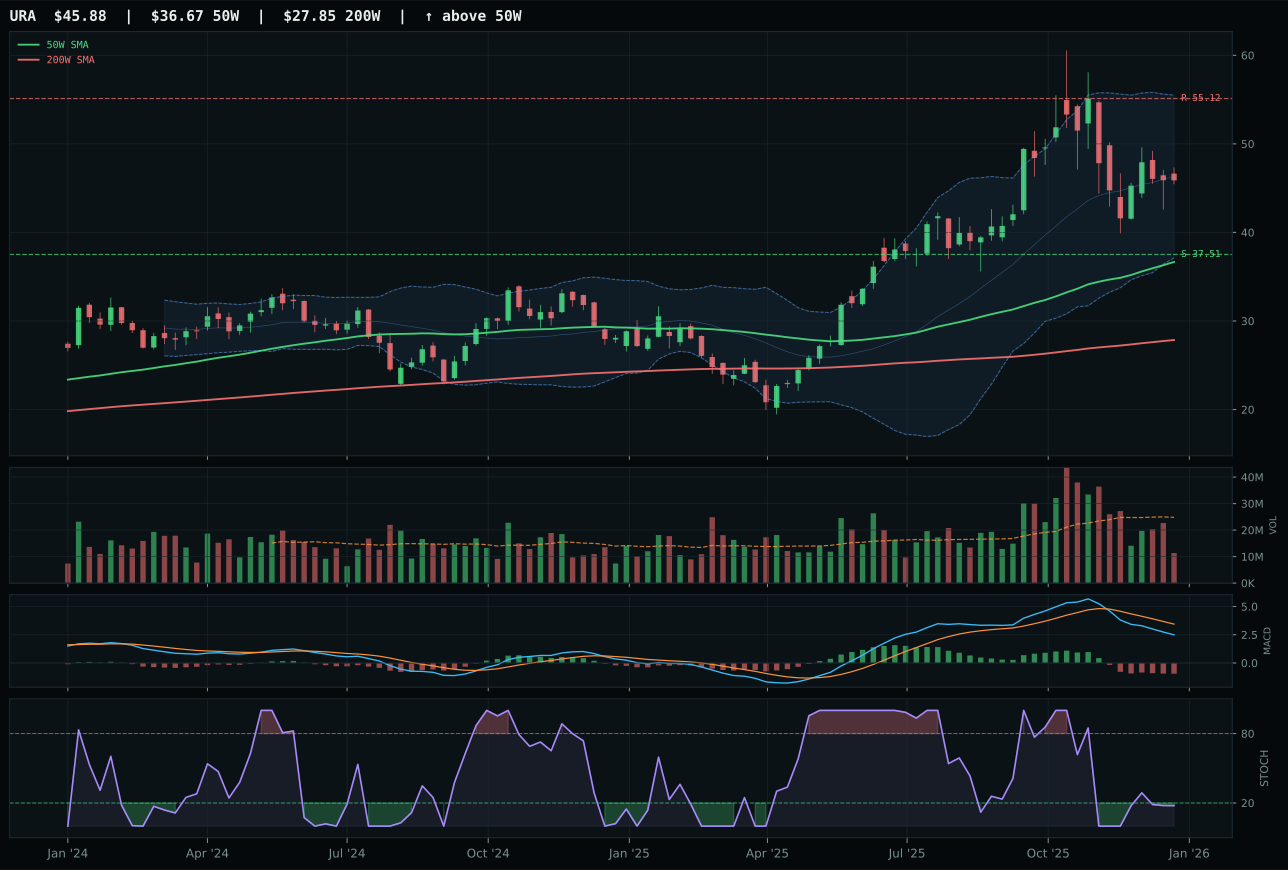
URA has a vertical extension profile with -9.5% 13-week relative strength versus SPY.
A failed hold above support would weaken the setup.
Actionable but governed by invalidation levels.
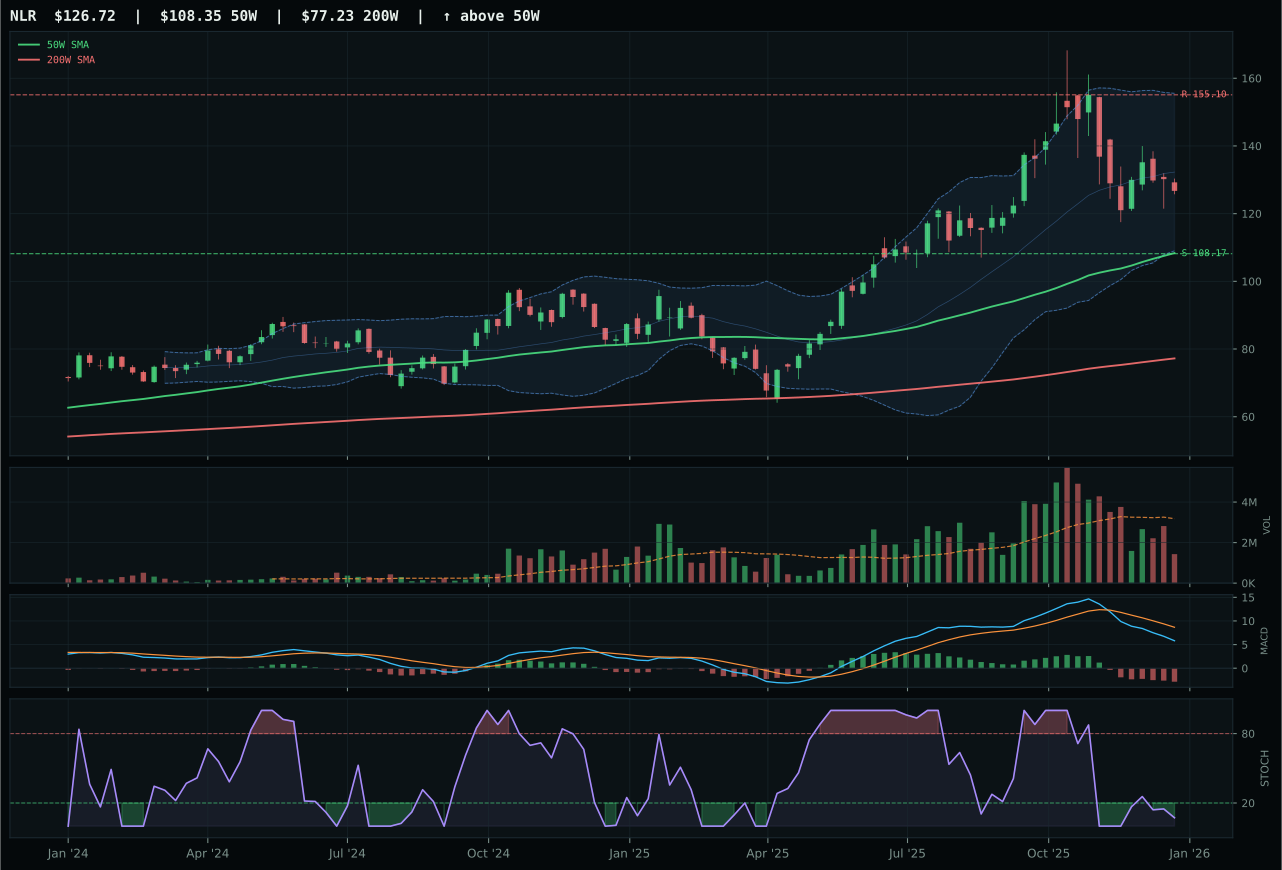
NLR has a vertical extension profile with -11.3% 13-week relative strength versus SPY.
A failed hold above support would weaken the setup.
Actionable but governed by invalidation levels.
URA wins Nuclear Energy with a technical evidence score of just 6.6—the lowest winning score in the portfolio—in a category where URNM actually submitted 37.6 technical evidence but lost because of lower category-relative strength (−0.5% versus 1.8%). The setup is an extended vertical move (25.1% above the 50W) with stochastic RSI oversold at 0.18 and MACD bearish/weakening, creating a potential capitulation reversal if buyers emerge. URA's 13-week return is a losing -5.2%, category-relative strength is barely positive at 1.8%, and risk/reward is compressed at 43.5, yet these liabilities allow the reasoner to classify the chart as pullback-into-opportunity rather than breakdown. URNM's superior technical credentials (momentum 21, volume 37) are offset by its macro fit of only 57.0 versus URA's neutral 50.0—essentially a wash. Both charts are damaged goods; URA wins because its damage is less visible to algorithms scanning for relative strength shifts.
Nuclear Energy scores 39.1, second-weakest category, and holds 10% as a speculative real-asset play with no macro conviction. The category-level macro fit of 57.0 is entirely dependent on 'real asset sponsorship' at +7 and 'AI growth sponsorship' at +5; there is no structural descriptor pushing uranium into the Goldilocks playbook. URA's technical evidence of 6.6 combined with macro fit of 50.0 signals the allocation is pure optionality on mean-reversion and scarcity re-rating, not on fundamental demand. The portfolio holds this slot because uranium and nuclear are mathematically required for energy transition modeling, and small positions in beaten-down markets sometimes deliver outsized returns—but the conviction is explicitly low. Persistence at 33.1, momentum confirmation at 15.1, and volume-price confirmation at 26.1 all rank among the weakest in the portfolio, confirming that URA is neither accumulating nor leading. The allocation remains at 10% only because the reasoner believes oversold (stochastic 0.18) pullback setups can reverse without narrative support; however, a close below support at 37.51 would warrant reduction to 5%. Upgrade to 20% requires simultaneous evidence of (a) stochastic rising above 0.50, (b) MACD crossing above signal line, and (c) volume above 1.0x average—none of which are present.
Agriculture & Livestock — MOO
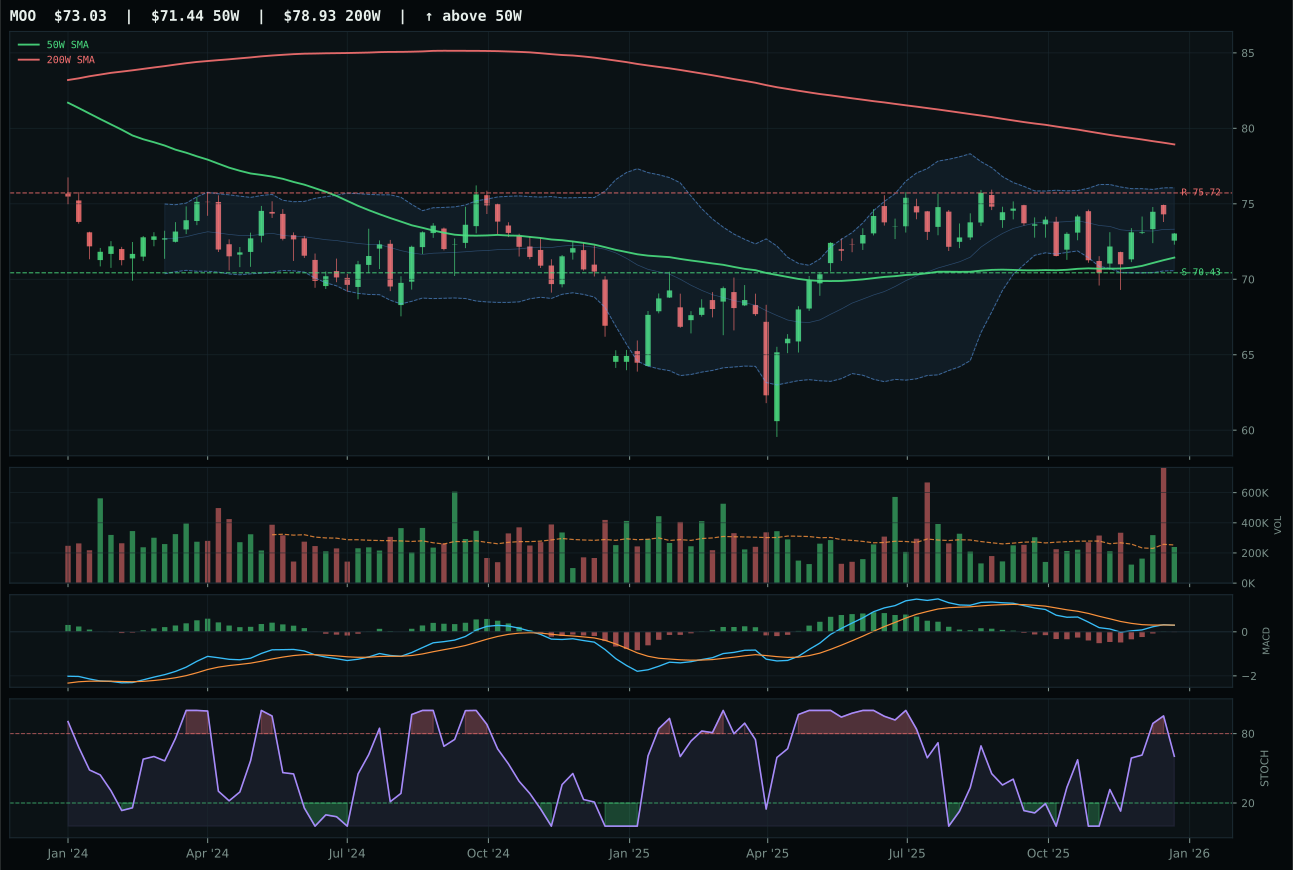
MOO has a pullback into support profile with -5.1% 13-week relative strength versus SPY.
A failed hold above support would weaken the setup.
Actionable but governed by invalidation levels.
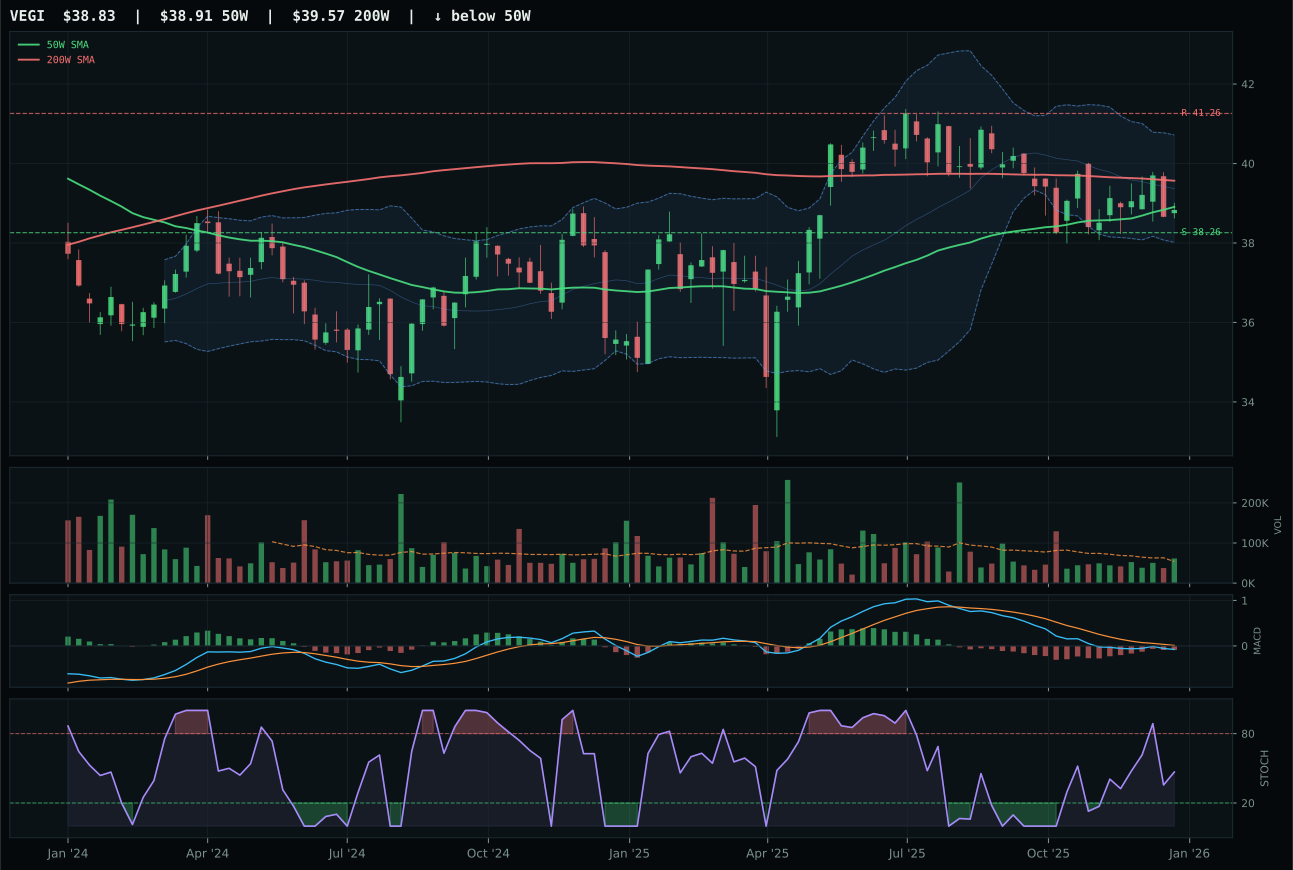
VEGI has a pullback into support profile with -5.8% 13-week relative strength versus SPY.
Extension and support failure are the main tactical risks.
Tracked, but not top-2 eligible because: structurally broken.
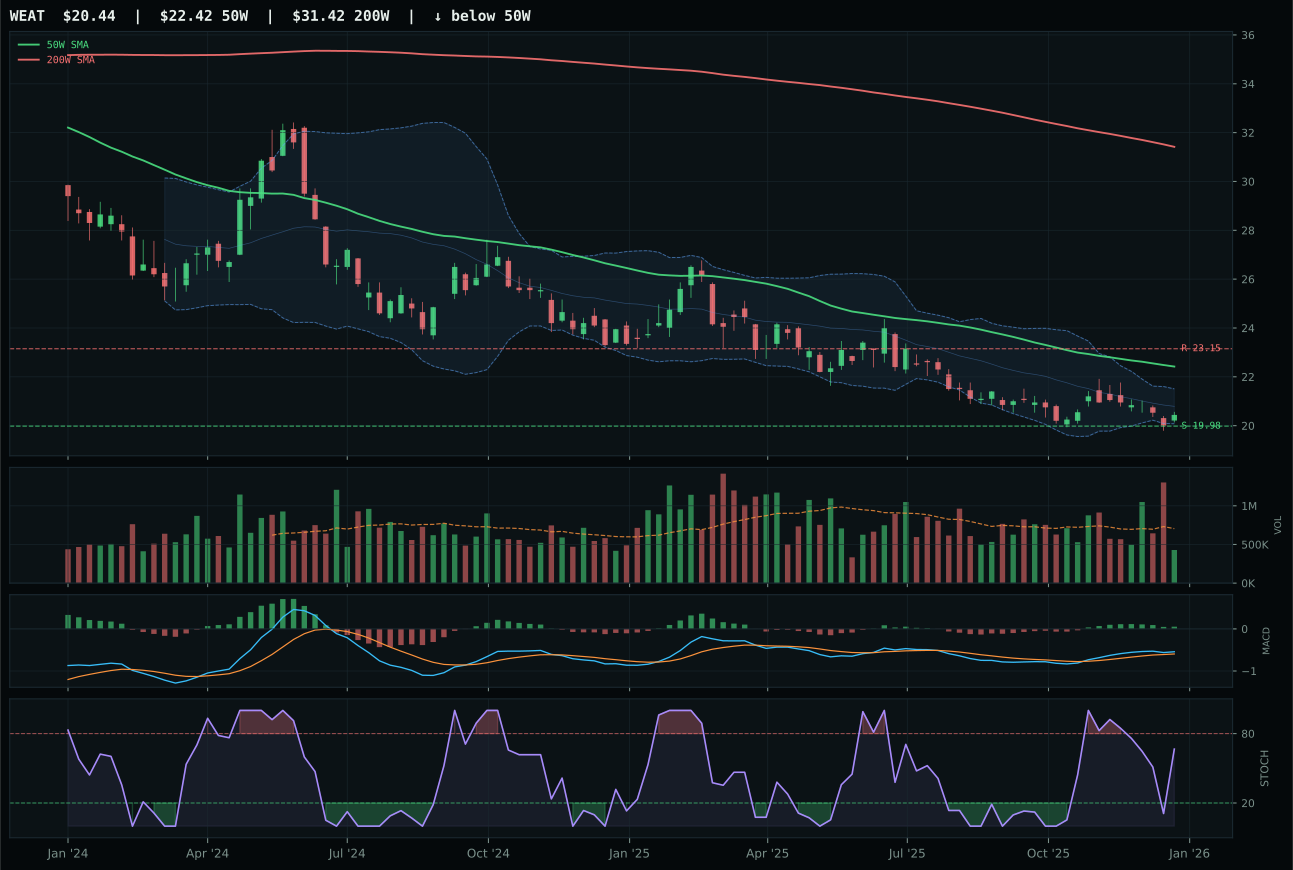
WEAT has a pullback into support profile with -6.7% 13-week relative strength versus SPY.
Extension and support failure are the main tactical risks.
Tracked, but not top-2 eligible because: structurally broken.
MOO wins a deeply troubled category with a 49.9-point rout of runner-up VEGI, but the victory masks a setup that deserves skepticism. MOO's strength lies in its timing score of 100—price is just 2.2% above the 50W, pulled back into defined support at 70.43, with Fibonacci zones aligned to catch reversal trades. MACD is bearish but improving and stochastic RSI is falling in neutral zone, creating a textbook mean-reversion candidate. VEGI loses because its structure is fractured (51.0 versus 72.9), its relative strength is 0.7 lower, and it carries hard filters flagging structural breakdown. However, MOO's momentum confirmation is a weak 43.4, its 13-week return is near flat at -0.8%, and category-relative strength barely positive at 0.7% tells you this is defensive positioning, not conviction. The volume-price confirmation of 51.7 and persistence of 50.2 suggest the setup is early, not confirmed—a reversion waiting for sponsorship.
Agriculture & Livestock receives 0% allocation because the entire category scored 25.0, placing it ninth or tenth among the ten sectors—barely eligible to hold any capital at all. Disinflation pressure (-8) and lack of commodity breadth sponsorship (-0 to +5 depending on the name) have drained this sector of participation. The macro regime is Goldilocks, which should help real assets, but agriculture specifically lacks the scarcity premium that metals are enjoying; grain and livestock prices remain range-bound while demand signals are ambiguous. MOO's 64.2 technical evidence is respectable, but it cannot overcome a category-level macro fit of only 55.0, and the thin participation across all three names confirms that capital is not rotating into agriculture. This allocation would reactivate only if: commodity breadth turns structurally positive, disinflation reverses to inflation expectations, or MOO breaks above 75.72 resistance on genuine accumulation volume.
Traditional Energy — XLE
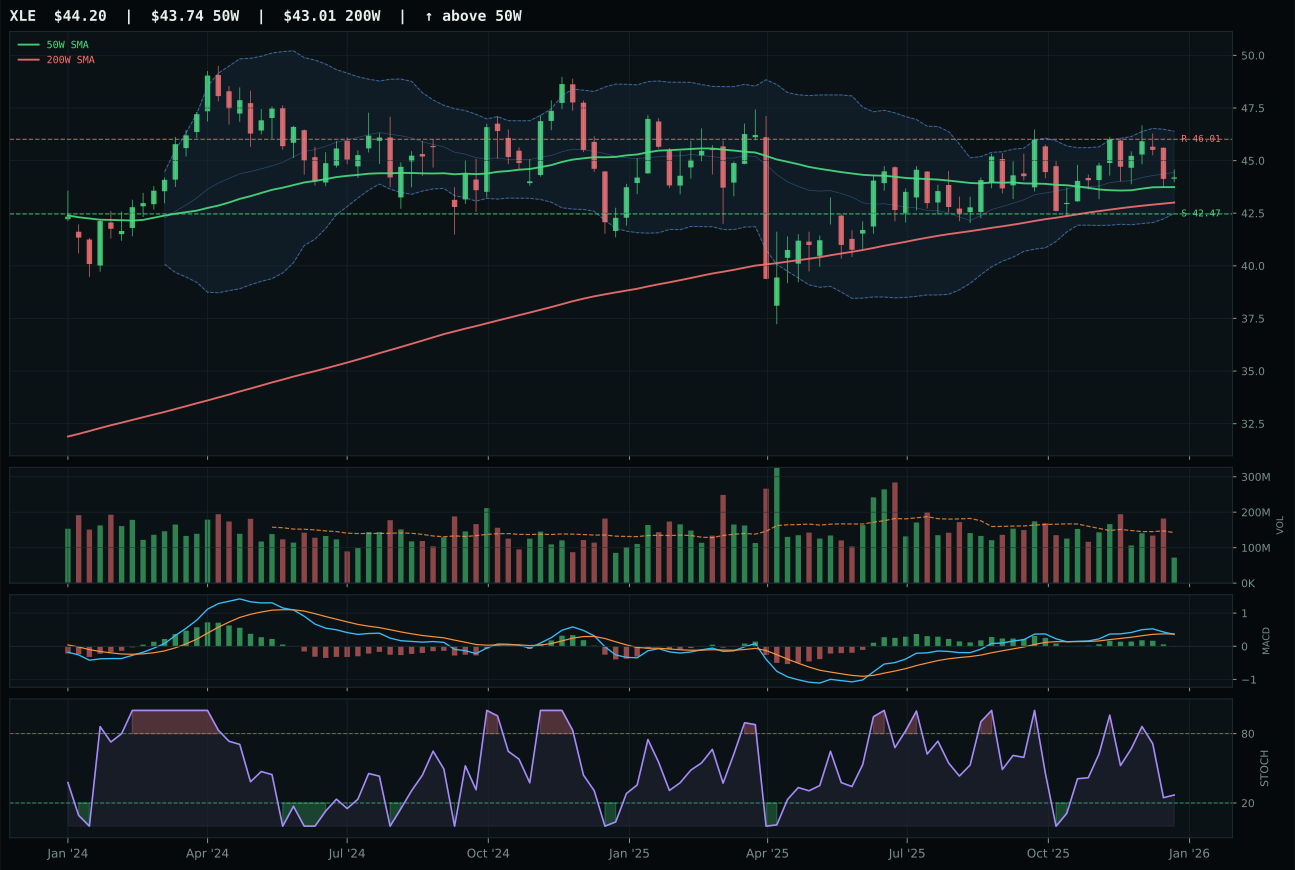
XLE has a pullback into support profile with -8.2% 13-week relative strength versus SPY.
A failed hold above support would weaken the setup.
Actionable but governed by invalidation levels.
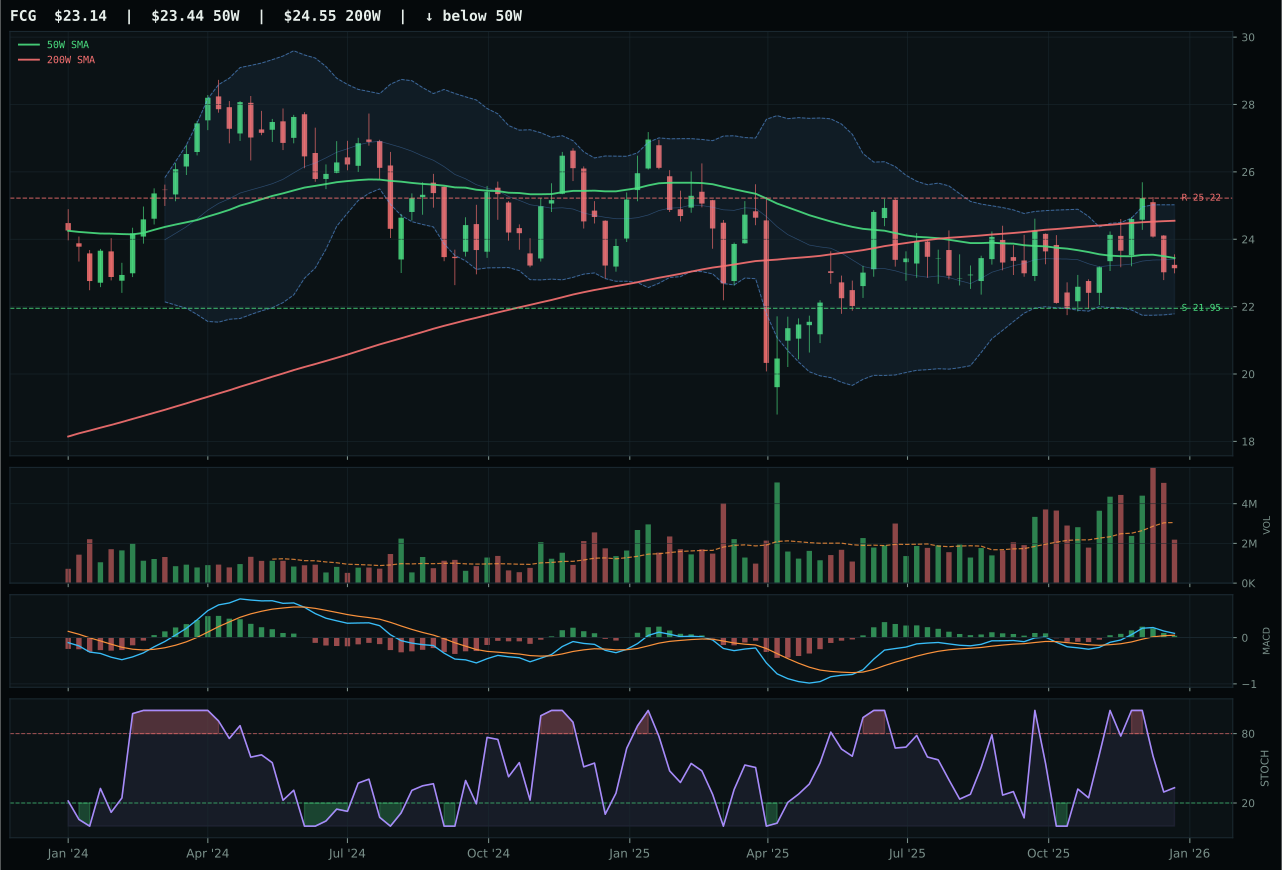
FCG has a compression near 50W profile with -8.9% 13-week relative strength versus SPY.
Extension and support failure are the main tactical risks.
Tracked, but not top-2 eligible because: structurally broken.
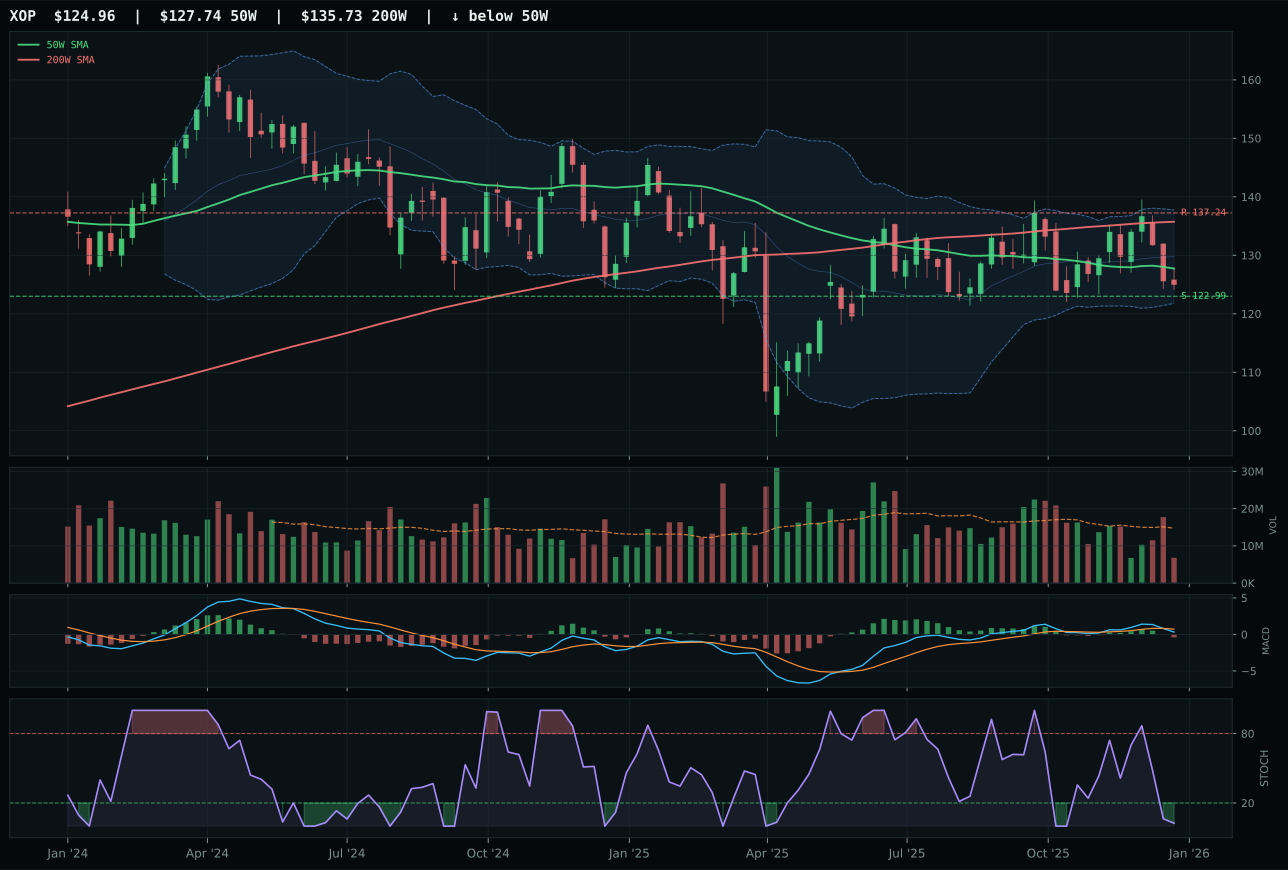
XOP has a pullback into support profile with -13.3% 13-week relative strength versus SPY.
Extension and support failure are the main tactical risks.
Tracked, but not top-2 eligible because: structurally broken.
XLE wins by default in a category that scored 0.0 and failed the reasoner's eligibility filter, meaning no allocation should have been assigned—yet the mechanical rules require a representative. XLE's trend score of 59.7 is supported by price above both moving averages and an even 50W slope of 0.0%, but the relative strength to SPY is -8.2%, meaning energy has underperformed the broad market. Timing is actually excellent at 95.0 because price is just 1.1% above the 50W with support tightly defined at 42.47, creating a reversion candidate. However, momentum confirmation is a disastrous 10.5 because the 13-week return is -3.9%, category-relative strength is flat, and MACD is bearish/weakening with volume thin participation. FCG and XOP both failed hard filters due to structural breakdown, leaving XLE as the only marginally viable choice. The gap between XLE's 50.2 technical evidence and macro fit of 47.0 signals fundamental disagreement between the charts and the macro regime—Goldilocks does not want legacy energy exposure.
Traditional Energy scores 0.0 and receives zero allocation—it is the only category excluded entirely this week. The category macro fit of 40.0 is the lowest across all ten sectors, penalized by disinflation pressure (-10), credit stress (-7), and an absence of commodity breadth or real-asset sponsorship specific to energy. XLE's technical evidence of 34.8 is inadequate to overcome the macro headwind, and both FCG and XOP posted worse scores. The portfolio has no room for a sector that is losing momentum (-3.9% to -8.9% 13W returns) in a Goldilocks regime where capital is rotating into metals scarcity, AI, and infrastructure. Energy would re-enter the allocation if: WTI crude breaks above $90 on supply shock, disinflation reverses to inflation expectations, or XLE breaks above 46.01 resistance on accumulation volume of 1.5x+ average. Until then, this 0% slot is a signal: energy is structurally out of favor.