
2025-12-19
Informational purposes only. The content in this report, including allocations, analysis, and commentary, is provided solely for informational and educational purposes. It does not constitute financial advice, investment advice, trading advice, or any other type of advice. Past performance does not guarantee future results. Always conduct your own research and consult a qualified financial professional before making investment decisions.
Weekly Allocation
| Ticker | Category | Weight | Role |
|---|---|---|---|
| COPX | Industrial Metals | 20% | Top-2 (20%) |
| SLV | Precious Metals | 20% | Top-2 (20%) |
| SMH | AI | 10% | Tier-2 (10%) |
| IEMG | Emerging Markets | 10% | Tier-2 (10%) |
| XAR | Defense & Aerospace | 10% | Tier-2 (10%) |
| IGV | Technology | 10% | Tier-2 (10%) |
| PAVE | Utilities & Infrastructure | 10% | Tier-2 (10%) |
| URA | Nuclear Energy | 10% | Tier-2 (10%) |
Trade Instructions — Monday Open
Sell the tranche from 2025-11-21 (completing its 4-week hold). Buy the new tranche. Instructions show net portfolio changes — same-asset positions cancel, weight changes show the delta.
| Action | Ticker | Instruction |
|---|---|---|
| SELL | GLD | Sell entire GLD position (5.00% of portfolio) |
| SELL | PICK | Sell entire PICK position (5.00% of portfolio) |
| SELL | IGF | Sell 50% of IGF position (reduce 5.00% → 2.50%) |
| SELL | URNM | Sell 25% of URNM position (reduce 10.00% → 7.50%) |
| SELL | ITA | Sell 33% of ITA position (reduce 7.50% → 5.00%) |
| SELL | XLK | Sell 50% of XLK position (reduce 5.00% → 2.50%) |
| SELL | XLE | Sell 50% of XLE position (reduce 5.00% → 2.50%) |
| BUY | SLV | Buy SLV — 22.22% of freed cash (adds 5.00% to portfolio) |
| BUY | COPX | Buy COPX — 22.22% of freed cash (adds 5.00% to portfolio) |
| BUY | PAVE | Buy PAVE — 11.11% of freed cash (adds 2.50% to portfolio) |
| BUY | IGV | Buy IGV — 11.11% of freed cash (adds 2.50% to portfolio) |
| BUY | XAR | Buy XAR — 11.11% of freed cash (adds 2.50% to portfolio) |
| BUY | IEMG | Buy IEMG — 11.11% of freed cash (adds 2.50% to portfolio) |
| BUY | URA | Buy URA — 11.11% of freed cash (adds 2.50% to portfolio) |
Current Portfolio After Trade
Combined holdings across all 4 active tranches. Each tranche is 25% of the portfolio.
| Ticker | % of Portfolio | Weight Bar |
|---|---|---|
| SLV | 20.00% | |
| COPX | 15.00% | |
| URNM | 7.50% | |
| SMH | 7.50% | |
| PAVE | 7.50% | |
| ITA | 5.00% | |
| REMX | 5.00% | |
| FCG | 5.00% | |
| IGV | 5.00% | |
| XAR | 5.00% | |
| IGF | 2.50% | |
| XLK | 2.50% | |
| XLE | 2.50% | |
| CIBR | 2.50% | |
| BOTZ | 2.50% | |
| IEMG | 2.50% | |
| URA | 2.50% |
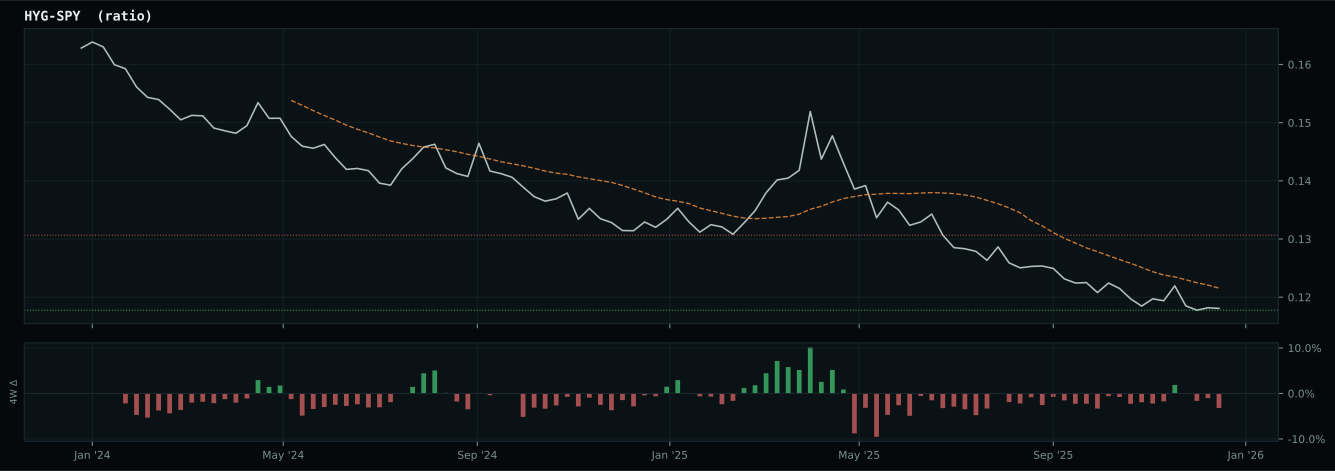
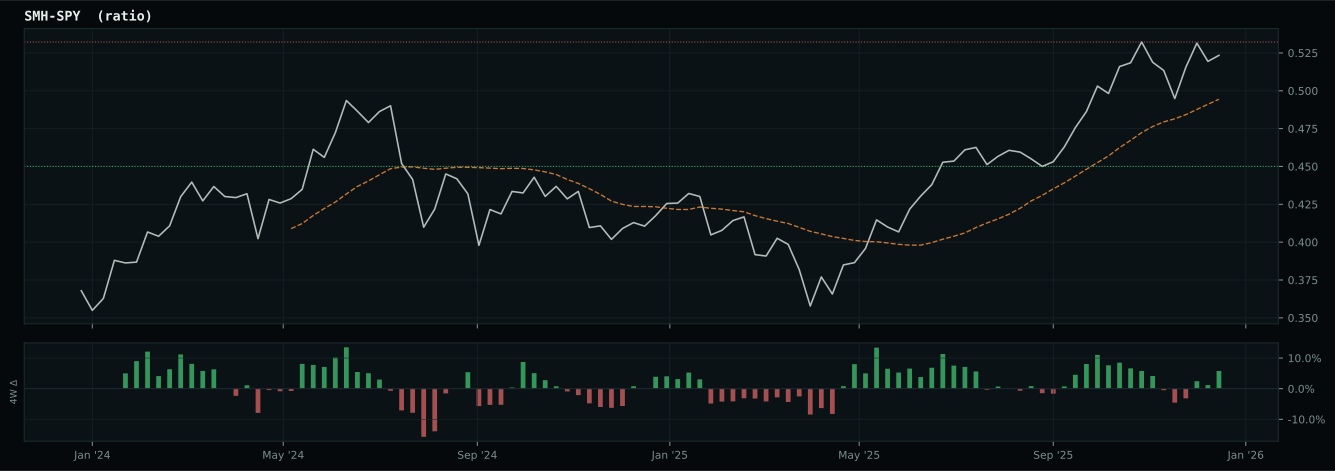
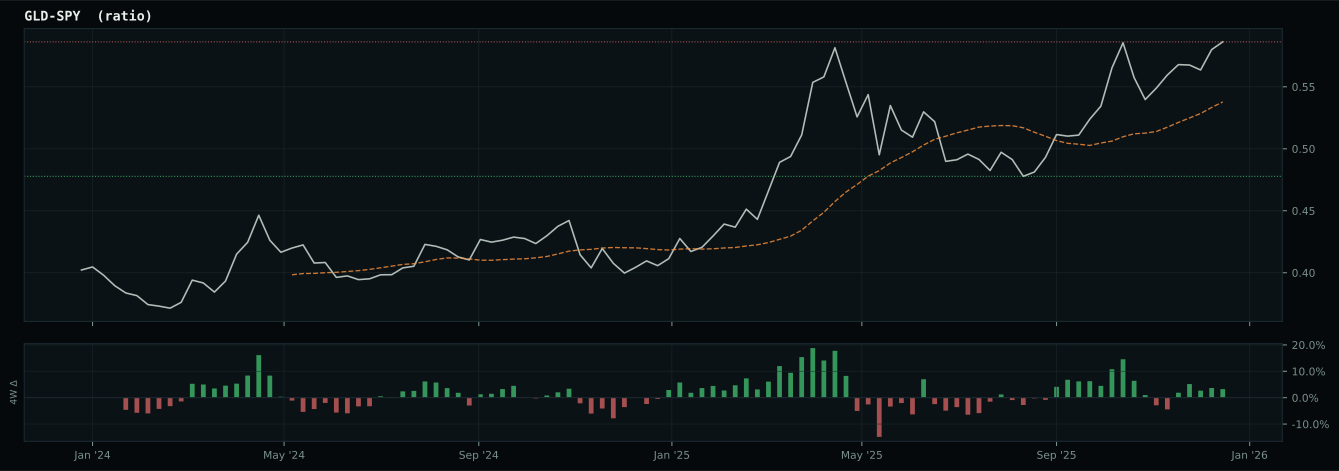
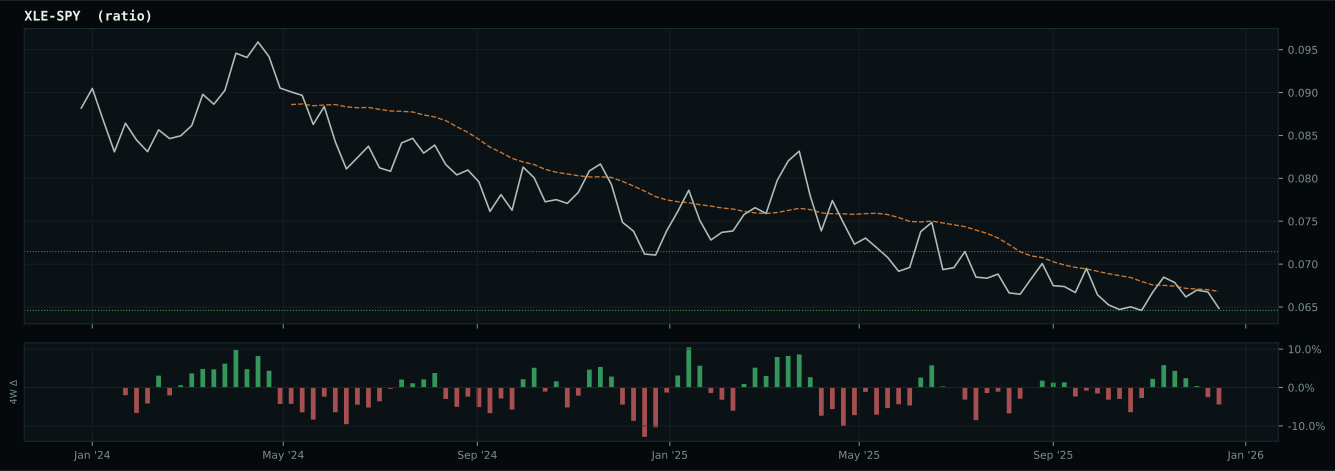
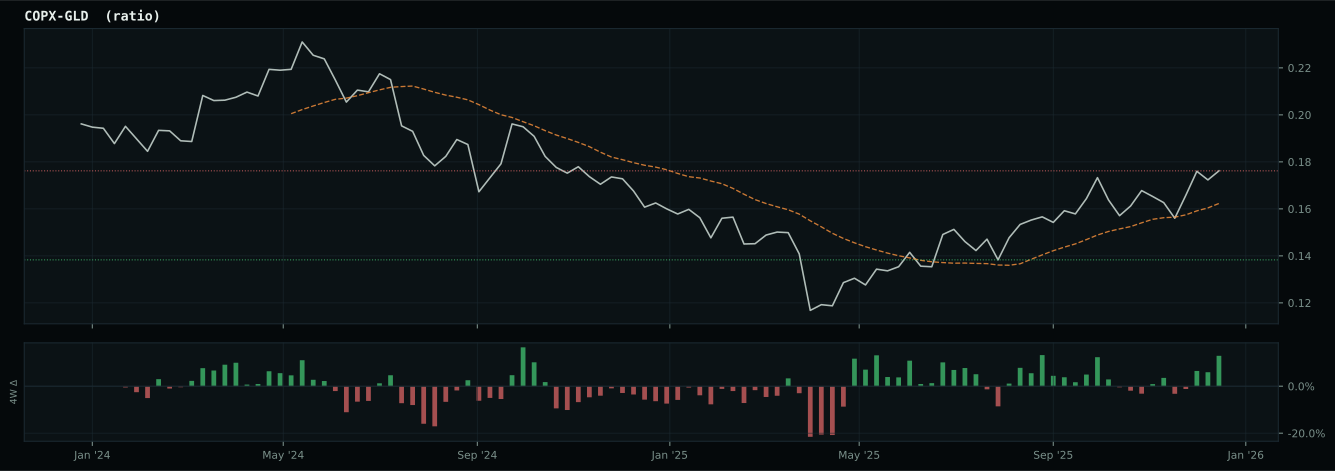
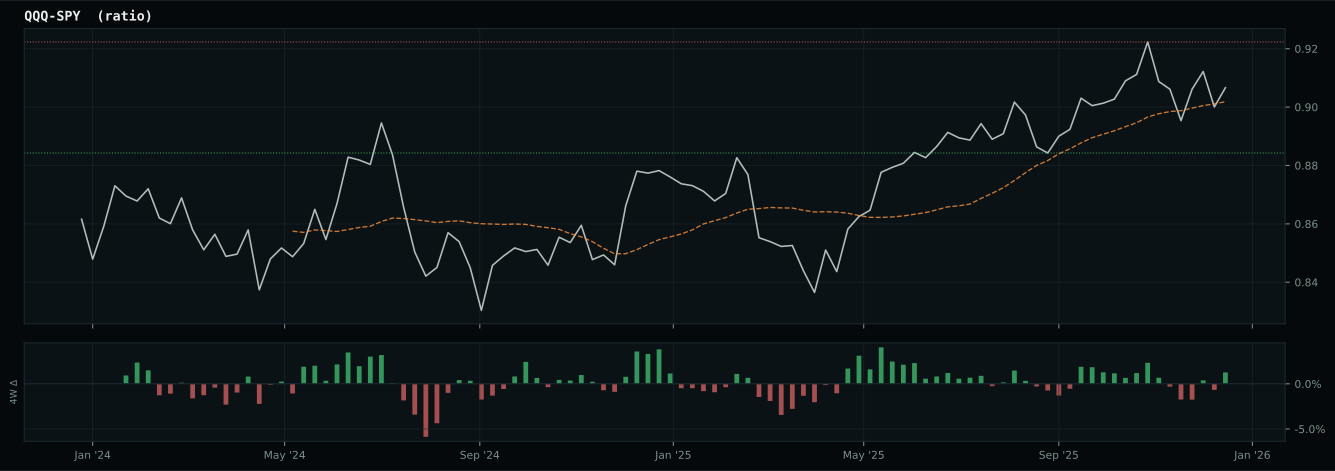
Macro Regime — Goldilocks
Macro Evidence Charts
Market-implied signals behind the macro regime scores. Each ratio compares two assets; the direction and slope of the ratio is what the macro engine reads.
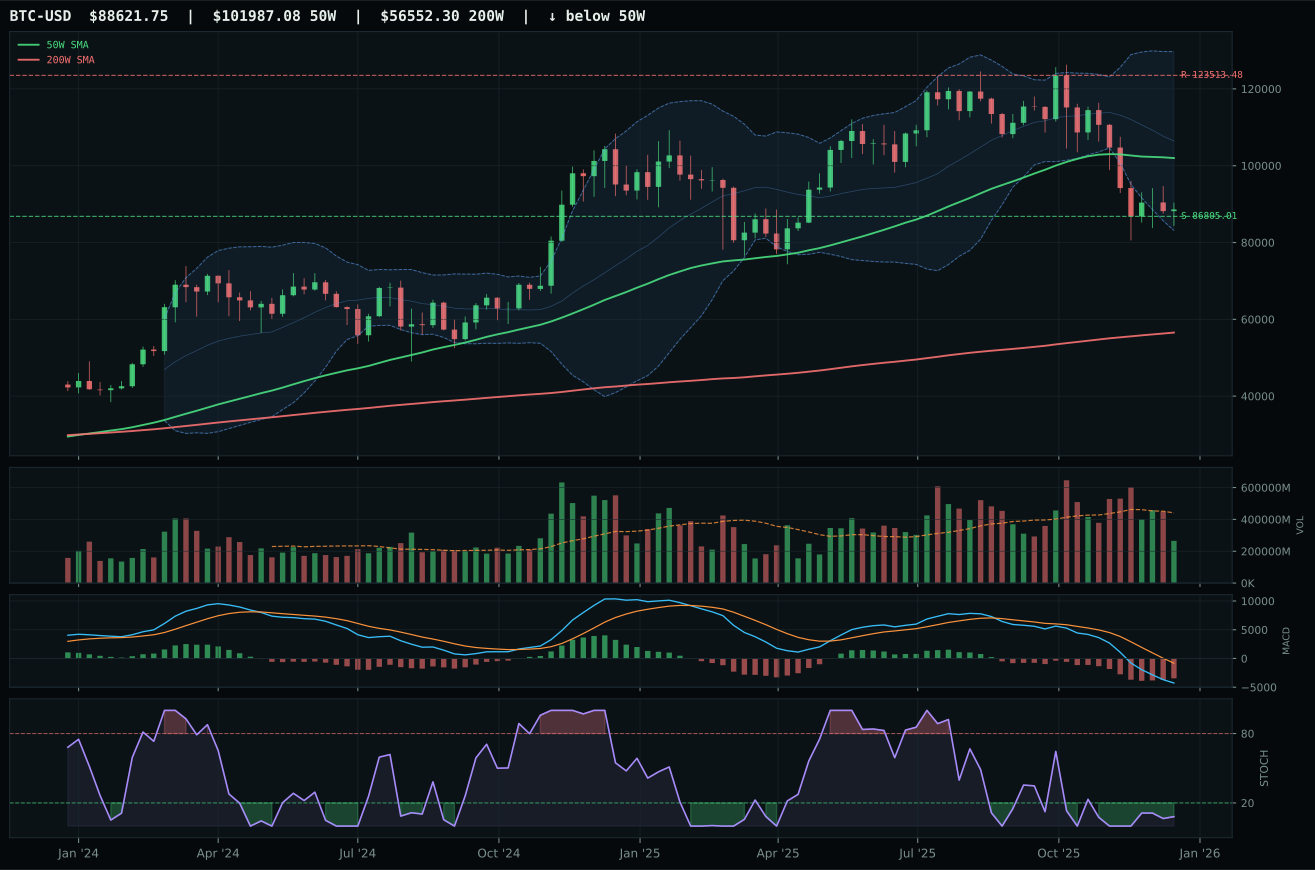
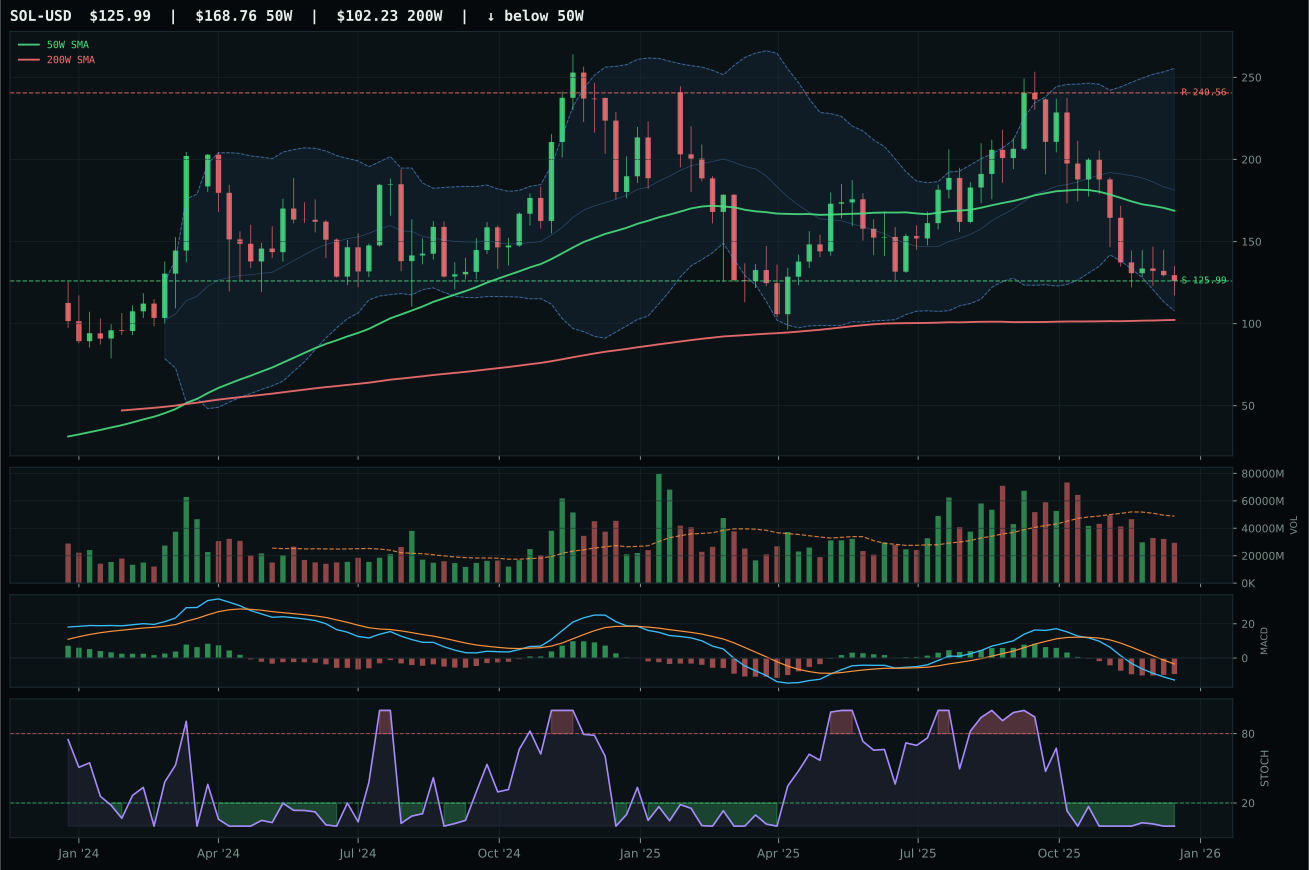
Crypto Regime — NoCrypto
ValueBTC not armed: BTC has not made the first post-breakdown touch of the 200W buy zone after losing the 50W
TrendBTC not confirmed
one or more available conditions failed
Category Rankings
| Rank | Category | Winner | Score | Alloc | 4W Ret | Peers (4W) |
|---|---|---|---|---|---|---|
| 1 | Industrial Metals | COPX | 77.2 | 20% | +12.44% | PICK +11.7% · REMX +19.6% |
| 2 | Precious Metals | SLV | 75.2 | 20% | +37.68% | GDX +13.2% · GLD +7.3% |
| 3 | AI | SMH | 64.0 | 10% | +8.48% | BOTZ +3.3% · AIQ -0.1% |
| 4 | Emerging Markets | IEMG | 58.2 | 10% | +5.95% | ILF +7.2% · INDA -4.2% |
| 5 | Defense & Aerospace | XAR | 54.5 | 10% | +18.17% | ITA +12.1% · ROKT +17.3% |
| 6 | Technology | IGV | 54.0 | 10% | -11.12% | XLK -2.0% · CIBR -3.6% |
| 7 | Utilities & Infrastructure | PAVE | 42.9 | 10% | +4.14% | IGF +2.4% · XLU +2.0% |
| 8 | Nuclear Energy | URA | 42.1 | 10% | +16.87% | URNM +24.4% · NLR +14.1% |
| 9 | Agriculture & Livestock | MOO | 20.5 | 0% | +6.79% | VEGI +6.2% · WEAT +0.2% |
| 10 | Traditional Energy | XLE | 3.1 | 0% | +8.95% | XOP +4.6% · FCG +3.2% |
Industrial Metals — COPX
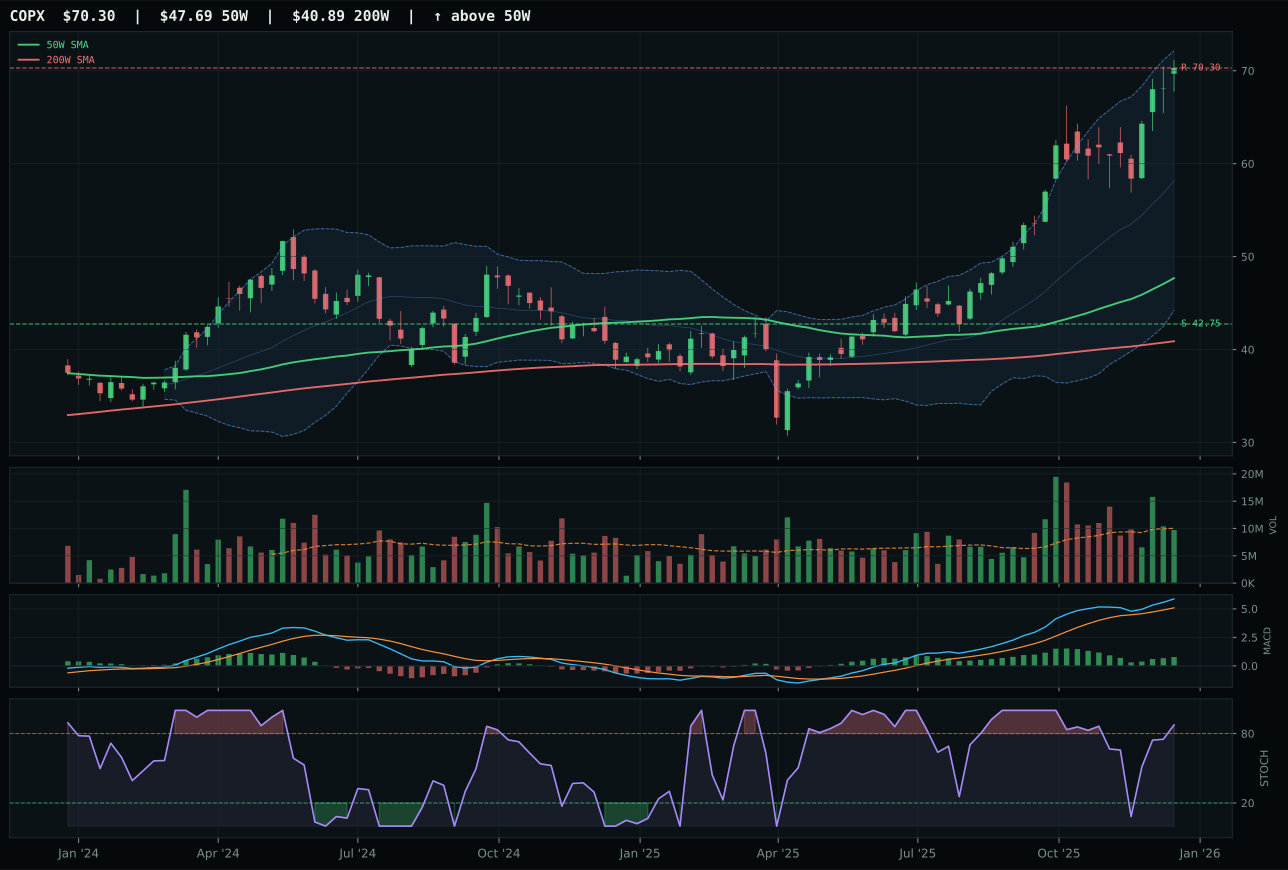
COPX has a vertical extension profile with 28.8% 13-week relative strength versus SPY.
A failed hold above support would weaken the setup.
Actionable but governed by invalidation levels.
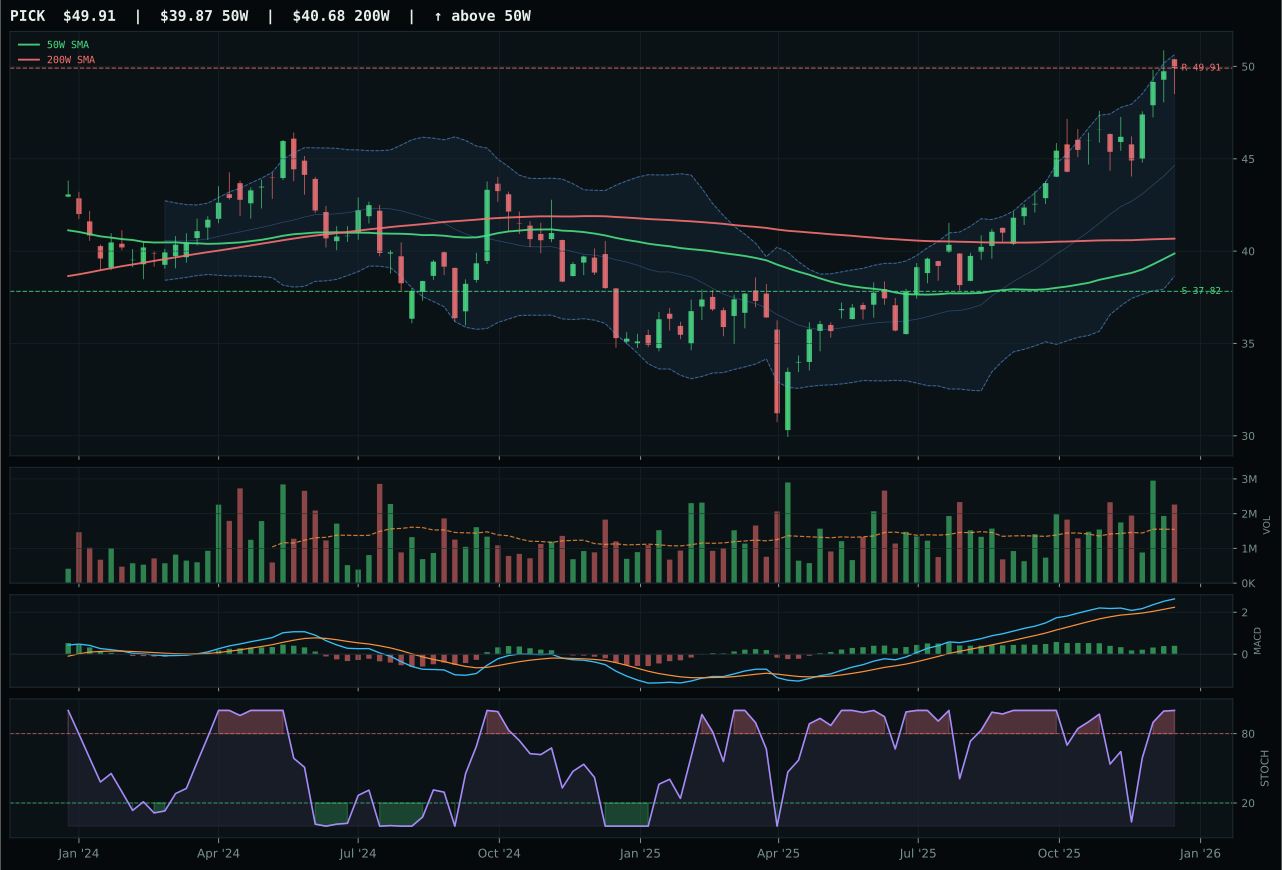
PICK has a vertical extension profile with 14.7% 13-week relative strength versus SPY.
A failed hold above support would weaken the setup.
Actionable but governed by invalidation levels.
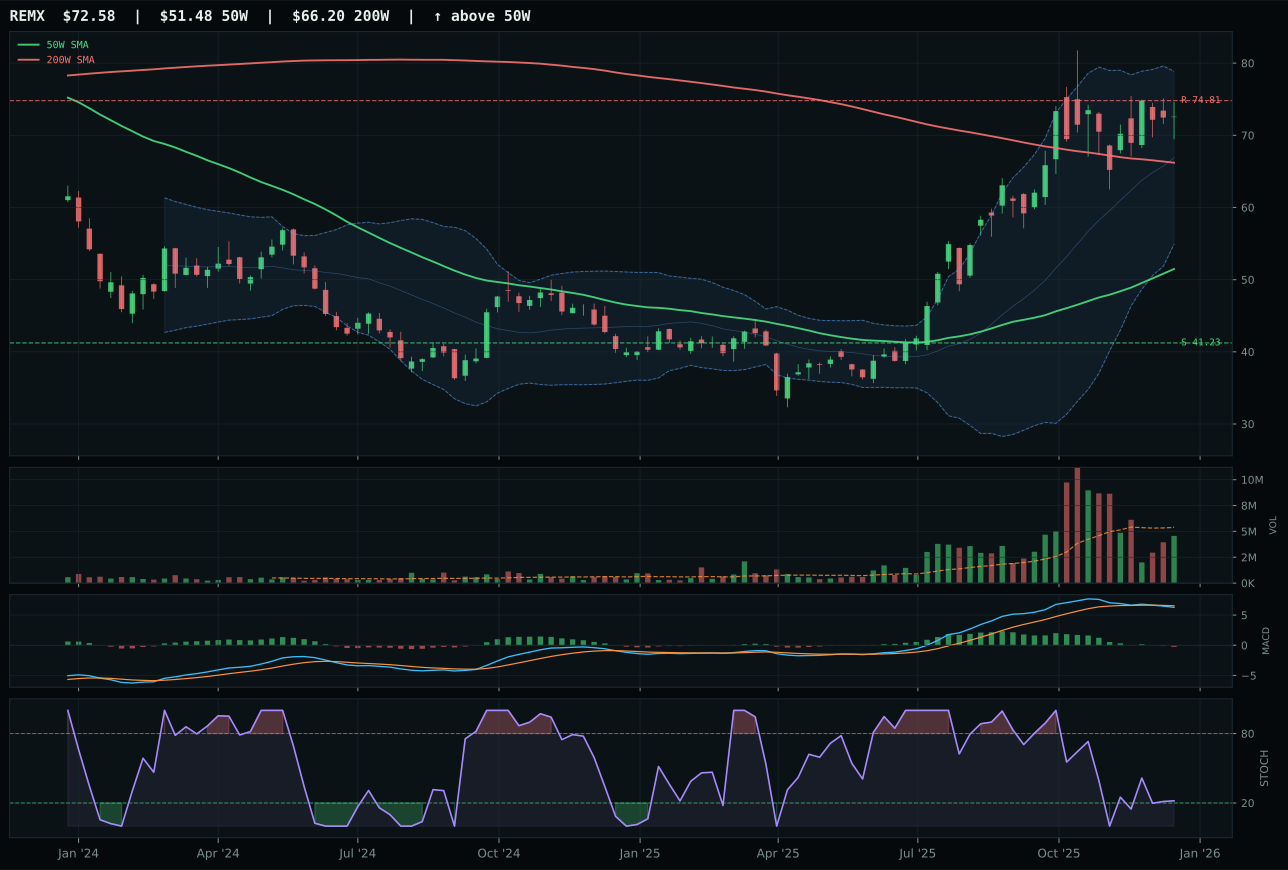
REMX has a vertical extension profile with 14.4% 13-week relative strength versus SPY.
A failed hold above support would weaken the setup.
Actionable but governed by invalidation levels.
COPX wins top-2 by only 1.7 points over PICK because category-relative strength of 14.0% is superior to PICK's 0.0%, proving that copper is outpacing diversified mining breadth in the scarcity thesis. Both show vertical extension setups with overbought stochastic RSI and bullish improving MACD, but COPX's 31.3% 13W return and 28.8% RS versus SPY represent pure conviction in industrial demand and supply constraints. The 47.4% extension above the 50W is severe, yet COPX's 80.7% volume-price confirmation and 99.2% persistence indicate that institutional accumulation is not waning; this is not a retail squeeze but a legitimate structural reallocation into scarcity. PICK's 17.3% 13W return and above-average participation volume are meaningful, but trailing COPX by 14 percentage points signals that smart money is picking copper over the full basket.
Industrial Metals earned its 20% top-2 allocation by posting a 77.2 category score, the highest of the portfolio, with a dominant 78.7/100 technical score for COPX and an outstanding 79.0/100 macro fit. The metals scarcity descriptor is active at +14 and commodity breadth positive at +10, directly supporting both the category thesis and the representative ETF. In the Goldilocks regime, industrial metals offer the cleanest margin expansion story: demand remains steady, supply is constrained, and margins are widening without inflation shock. COPX's 100.0 momentum confirmation, 100.0 trend score, and 99.2% persistence are the strongest technical signatures in the entire portfolio; this category legitimately commands the co-leadership slot alongside Precious Metals. The 64.4% downside to support at 42.75 is substantial, but the +0.0% upside to resistance means there is zero room for extension. This is a hold-for-strength position; establish a trailing stop at the 50W at 40.00 and plan to rotate out if macro sentiment shifts away from commodity demand.
Precious Metals — SLV
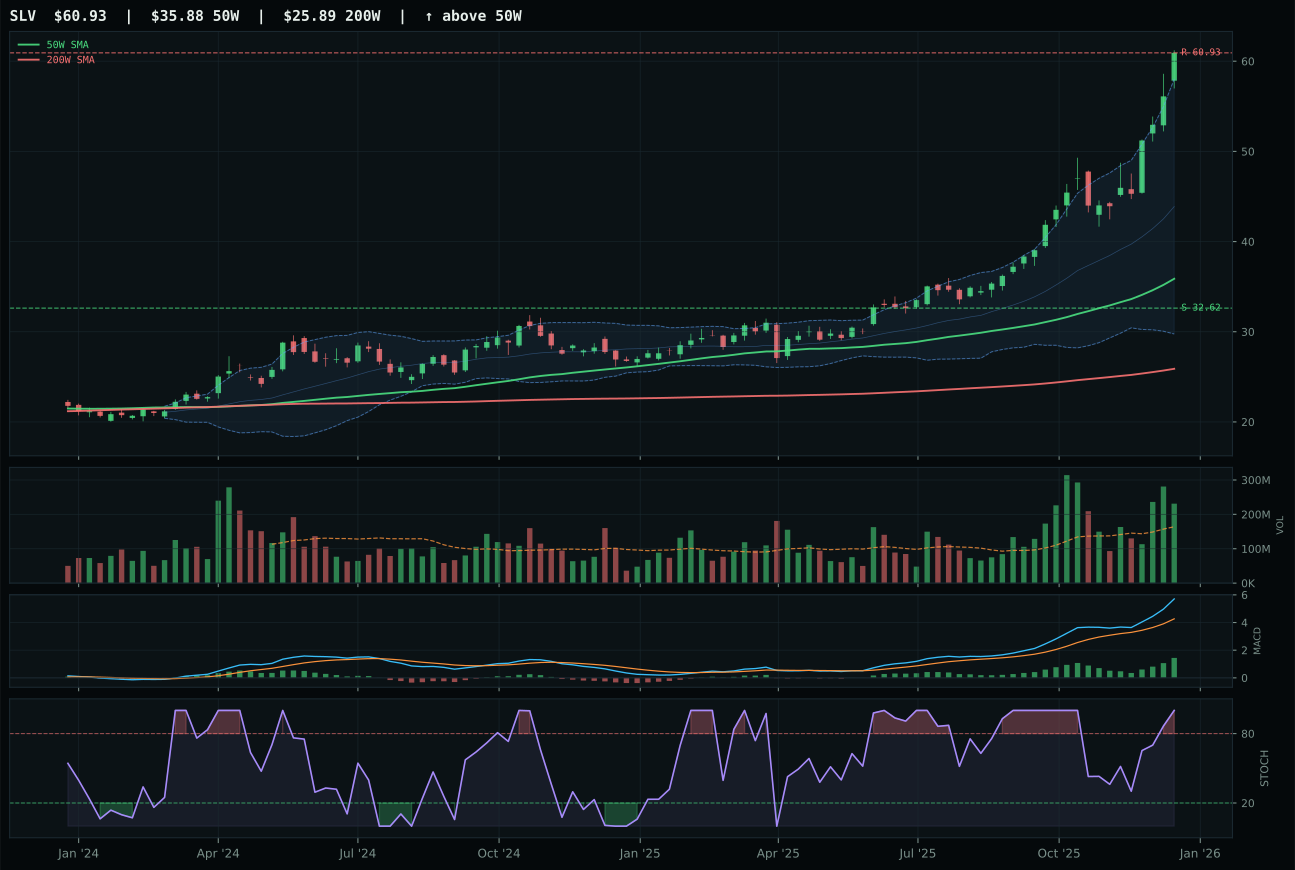
SLV has a vertical extension profile with 53.5% 13-week relative strength versus SPY.
A failed hold above support would weaken the setup.
Actionable but governed by invalidation levels.
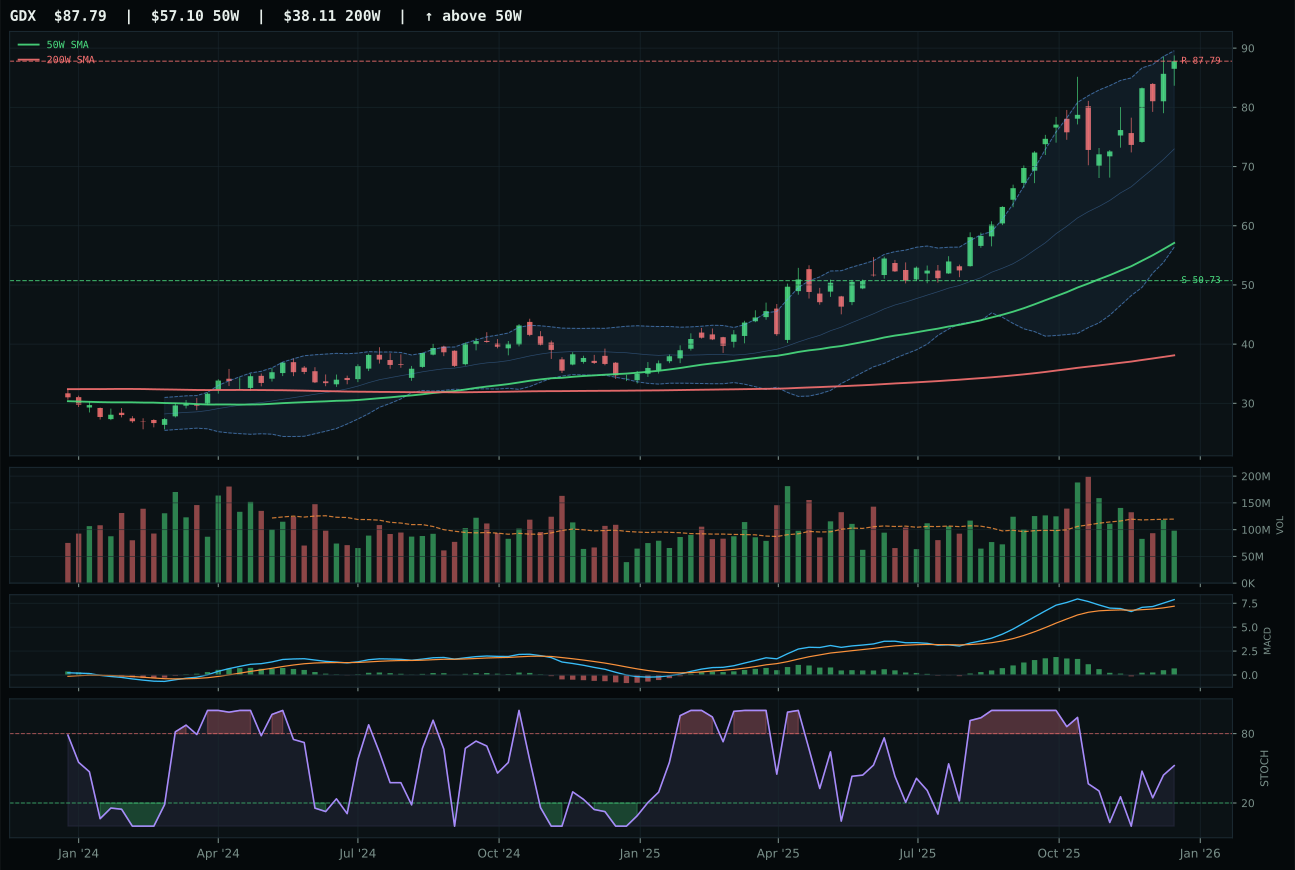
GDX has a vertical extension profile with 18.8% 13-week relative strength versus SPY.
A failed hold above support would weaken the setup.
Actionable but governed by invalidation levels.
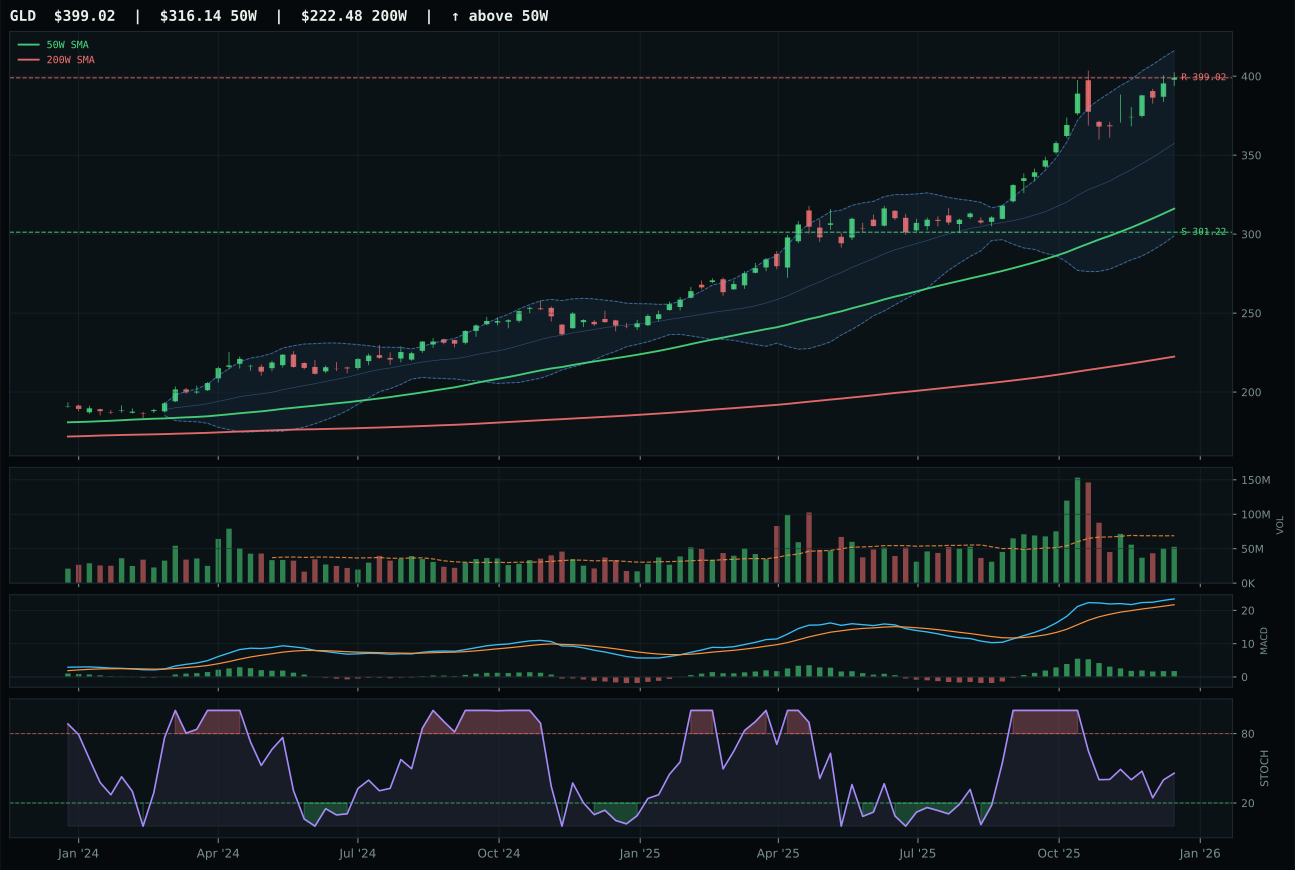
GLD has a vertical extension profile with 15.1% 13-week relative strength versus SPY.
A failed hold above support would weaken the setup.
Actionable but governed by invalidation levels.
SLV crushes GDX for the top-2 slot because its volume-price confirmation of 97.2 and perfect persistence score of 100.0 prove that the 69.8% extension is being accumulated, not distributed into. The 56.1% 13W return and 53.5% RS versus SPY are extraordinary, and the 34.7% category-relative strength means SLV is dramatically outpacing GDX's 0.0% category edge; this is not a rising tide lifting both boats. GDX's structure cleanliness of 70.5 is respectable, but neutral volume at 1.0x and only 18.8% SPY-relative return reveal it is a momentum laggard. SLV's stochastic RSI at 1.00 (overbought) paired with bullish and improving MACD shows retail and smart money are both pushing the same way; when technicals align across multiple timeframes, extension risk is justified. The 86.8% downside to support at 32.62 is real, but the +0.0% upside to resistance at 60.93 means current buyers are not late; they are in the final thrust before resistance becomes a ceiling.
Precious Metals earned its 20% top-2 allocation by posting a 75.2 category score, the second-highest of the portfolio, driven by an exceptional 99.7/100 technical score for SLV and an active 64.0/100 macro fit anchored by the monetary hedge bid (+14) and metals scarcity (+7) descriptors. In a Goldilocks regime where disinflation pressure is active at +6, precious metals provide the dual benefit of inflation hedge and deflationary portfolio insurance. SLV's trend score of 100.0 and momentum confirmation of 100.0 are portfolio outliers; this is a category where conviction is justified despite extreme extension. The risk is not directional but timing: if a market shock triggers forced liquidation, the 86.8% downside to support will execute rapidly. Size this position for a 6–8 week hold, not indefinitely; the category earns its top-2 rank on current momentum but must be reassessed if volume-price confirmation falls below 80 or stochastic RSI begins a sustained descent.
AI — SMH
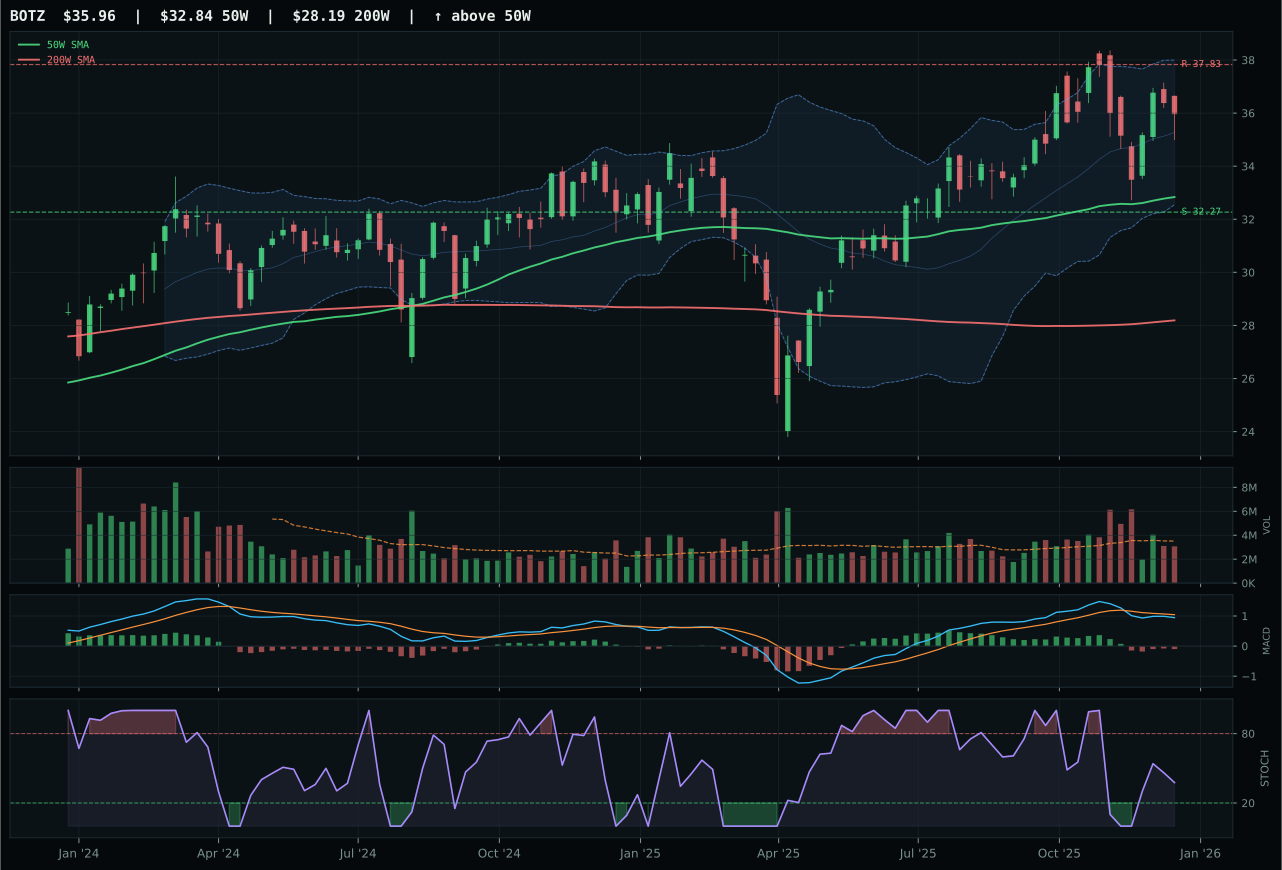
BOTZ has a neutral structure profile with 0.2% 13-week relative strength versus SPY.
A failed hold above support would weaken the setup.
Actionable but governed by invalidation levels.
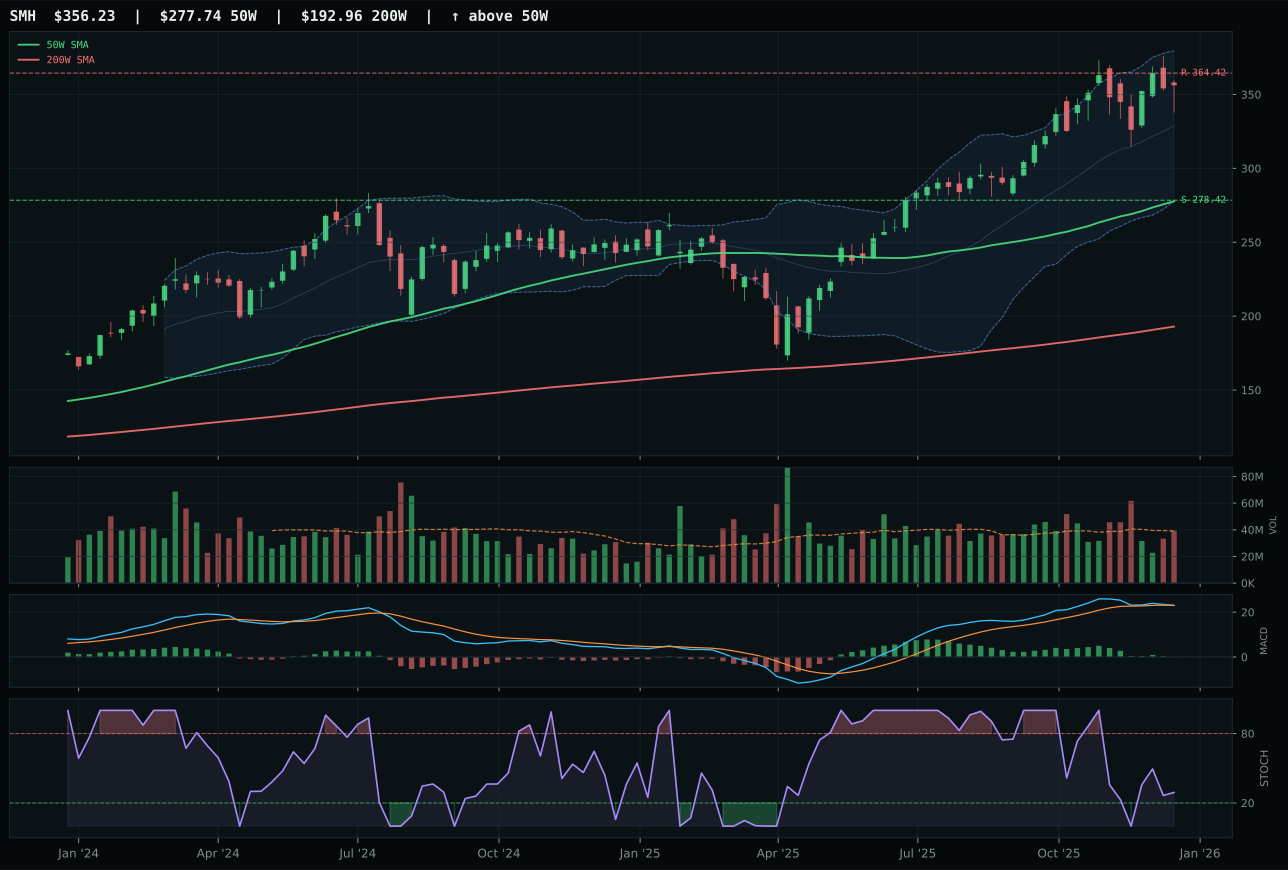
SMH has a vertical extension profile with 10.3% 13-week relative strength versus SPY.
A failed hold above support would weaken the setup.
Actionable but governed by invalidation levels.
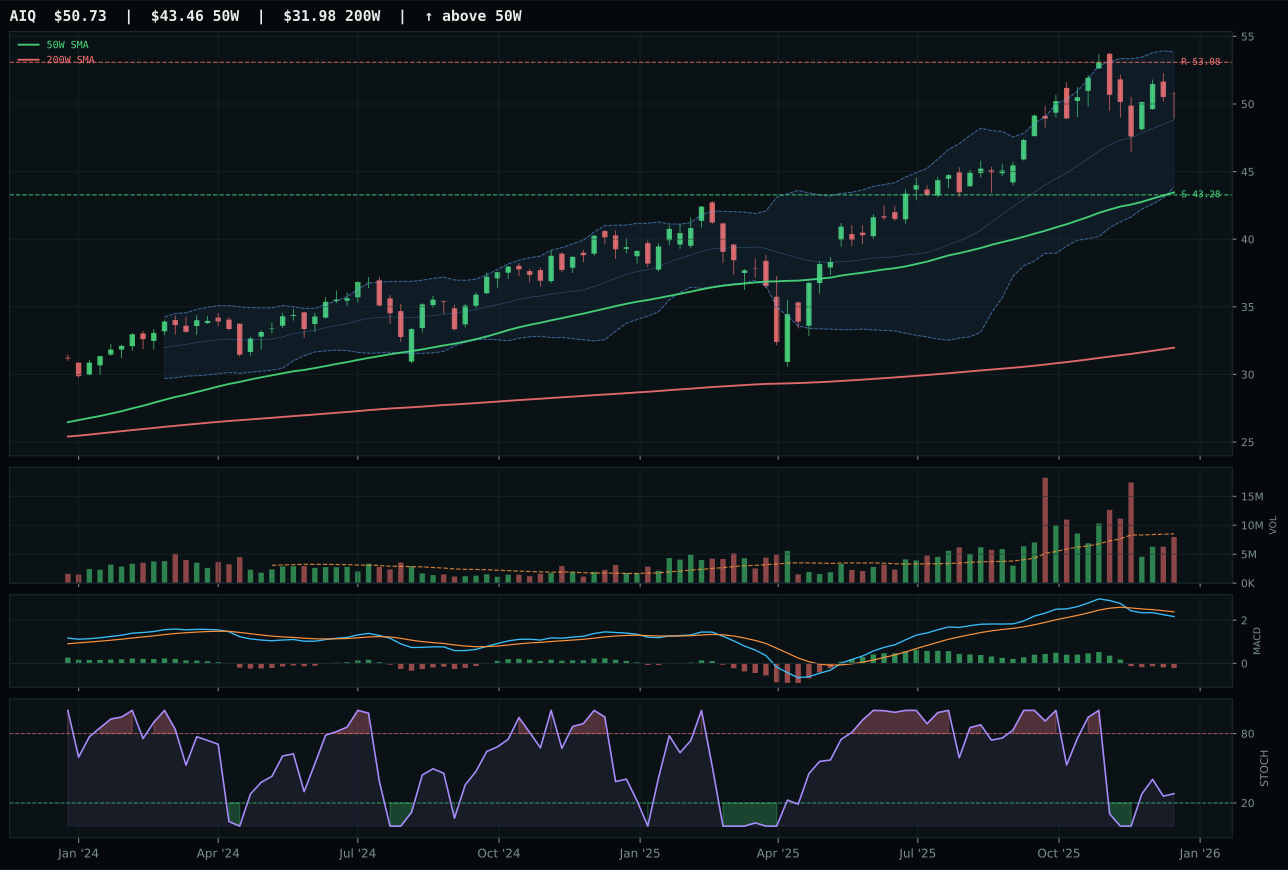
AIQ has a vertical extension profile with 0.7% 13-week relative strength versus SPY.
A failed hold above support would weaken the setup.
Actionable but governed by invalidation levels.
SMH wins despite a punishing 40.0 timing score because its momentum confirmation of 96.1 is unmatched in the category, driven by explosive 13W return of 12.8% and category-relative strength of 9.6% that BOTZ cannot match at -0.5%. The 28.3% extension above the 50W is precisely the kind of asymmetric risk that derates timing but rewards persistence; every new buyer is indeed late, yet the volume participation at 1.01x and bullish/weakening MACD paired with falling stochastic RSI at 0.29 suggest the momentum has not yet rolled into distribution. BOTZ, by contrast, shows a cleaner neutral structure and improving MACD with rising stochastic RSI, but those technical improvements are negated by its 0.2% RS versus SPY and category-relative weakness of -0.5%. SMH's 62.6% volume-price confirmation and 59.4% persistence indicate that accumulation is still active, not merely a bounce.
AI ranks fourth among the ten categories at 64.0 and receives a 10% allocation because its 86.0/100 macro fit (driven by active AI growth sponsorship at +14 and liquidity expansion at +10) offers meaningful exposure to the Goldilocks regime, even though the category technical evidence is only 55.1 for the representative. The tension is real: SMH's momentum is genuine, but timing risk is severe with price at a near 52W high. Relative to lower-ranked categories like Traditional Energy (3.1) and Agriculture (20.5), AI still deserves a core slot, but upgrading it to top-2 would require either a pullback that resets the entry point or volume-price confirmation sustained above 70 alongside a neutral or bullish MACD. The category qualifies on macro sponsorship alone; the technical setup demands patience before adding beyond minimum weight.
Emerging Markets — IEMG
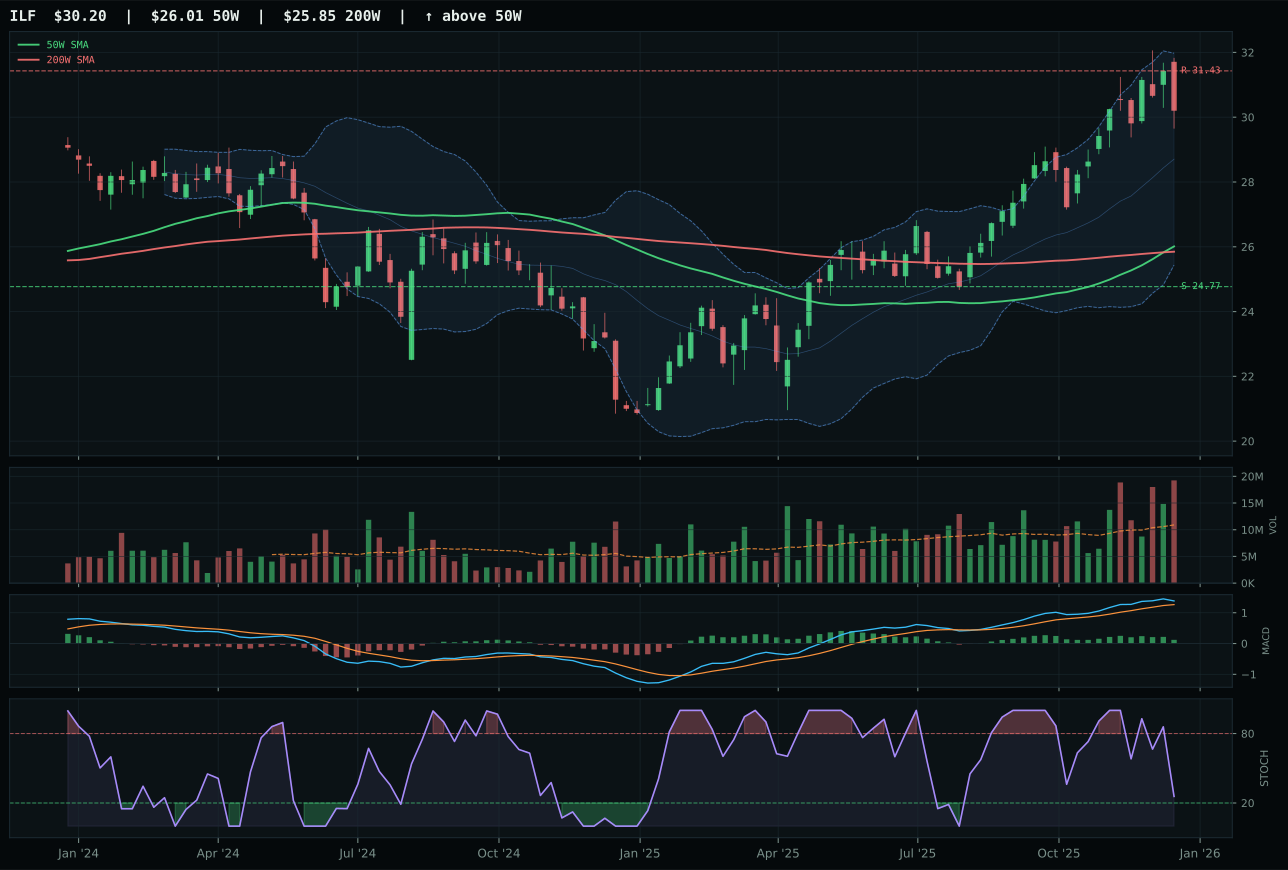
ILF has a vertical extension profile with 3.3% 13-week relative strength versus SPY.
A failed hold above support would weaken the setup.
Actionable but governed by invalidation levels.
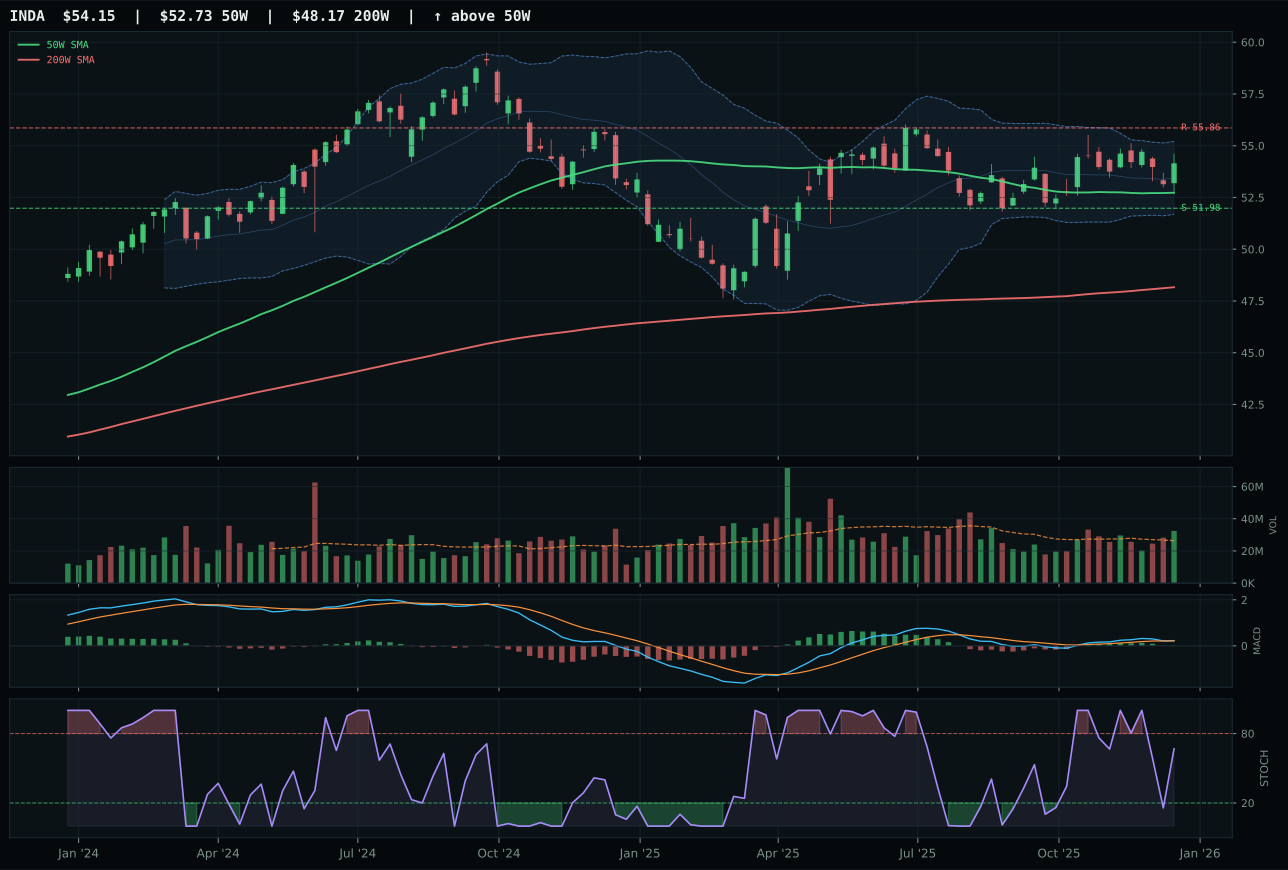
INDA has a pullback into support profile with -2.2% 13-week relative strength versus SPY.
A failed hold above support would weaken the setup.
Actionable but governed by invalidation levels.
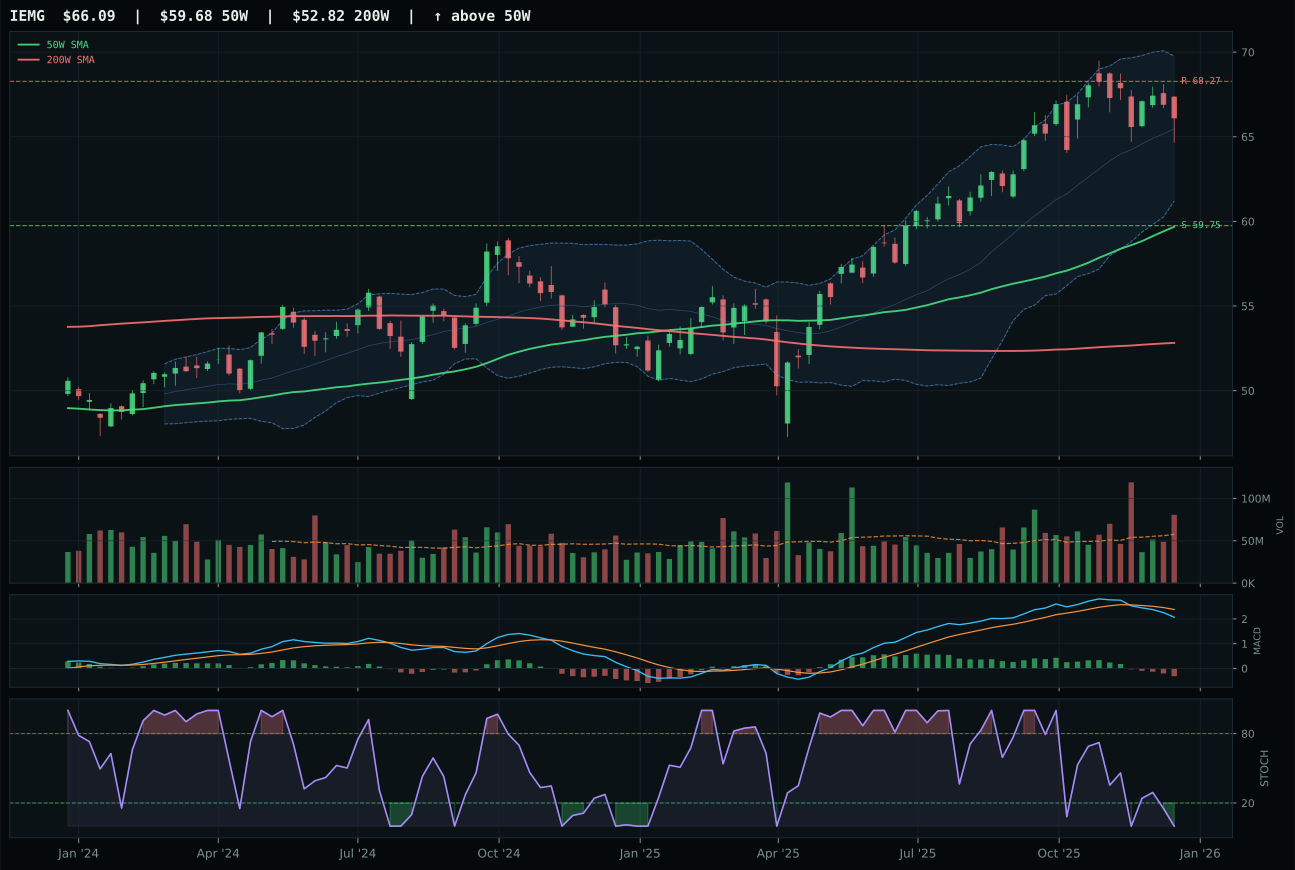
IEMG has a neutral structure profile with -1.9% 13-week relative strength versus SPY.
A failed hold above support would weaken the setup.
Actionable but governed by invalidation levels.
IEMG wins by 1.8 points over ILF because its timing score of 70.0 is substantially better than ILF's 48.0, reflecting IEMG's closer proximity to the 50W at 10.7% versus ILF's stretched 16.1%. IEMG's structure is also cleaner at 77.8 versus 71.4, with neutral consolidation rather than ILF's vertical extension that has already run. ILF's 5.9% 13W return and 3.3% RS versus SPY appear strong, but paired with bullish but flattening MACD and falling/neutral stochastic RSI at distribution pressure volume (high participation into resistance), the setup reads as late-stage accumulation about to roll. IEMG's oversold stochastic RSI at 0.00 and bearish/weakening MACD appear worse but are actually superior timing: the category is being marked down, and IEMG's above-average participation of 1.40x reveals early buyers accumulating the dip rather than late buyers chasing the rally.
Emerging Markets earns 10% because its 58.2 category score and 78.0/100 macro fit offer meaningful exposure to active EM liquidity support (+14), liquidity expansion (+8), and risk appetite positive (+8), which provide ballast in the current Goldilocks regime. IEMG's 44.2/100 technical score is respectable enough to justify the macro allocation; the representative ETF's trend of 79.1 and structure of 77.8 are solid, even if momentum is lagging at 38.7. The category ranks fifth among ten, a middle-tier position that reflects the consensus view: emerging markets deserve a core allocation in a risk-on environment with liquidity support, but they are not primary conviction. Upgrade this to 15% or 20% only if IEMG's stochastic RSI sustains above 0.50 with bullish MACD confirmation and category-relative strength climbs above +2%. Currently, hold at 10% as a liquidity and EM beta play; the setup favors patient accumulation into weakness rather than aggressive buying into current prices.
Defense & Aerospace — XAR
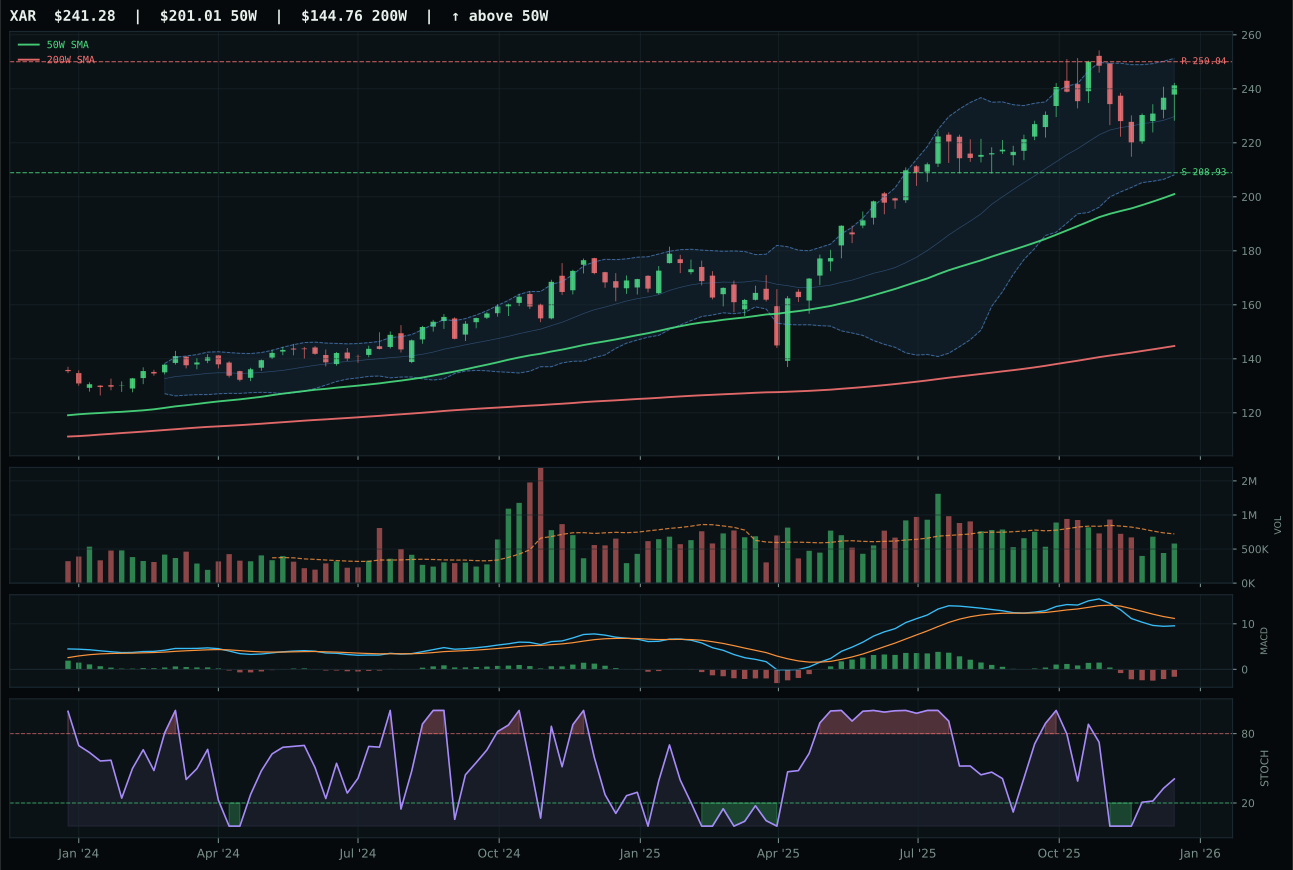
XAR has a vertical extension profile with 3.8% 13-week relative strength versus SPY.
A failed hold above support would weaken the setup.
Actionable but governed by invalidation levels.
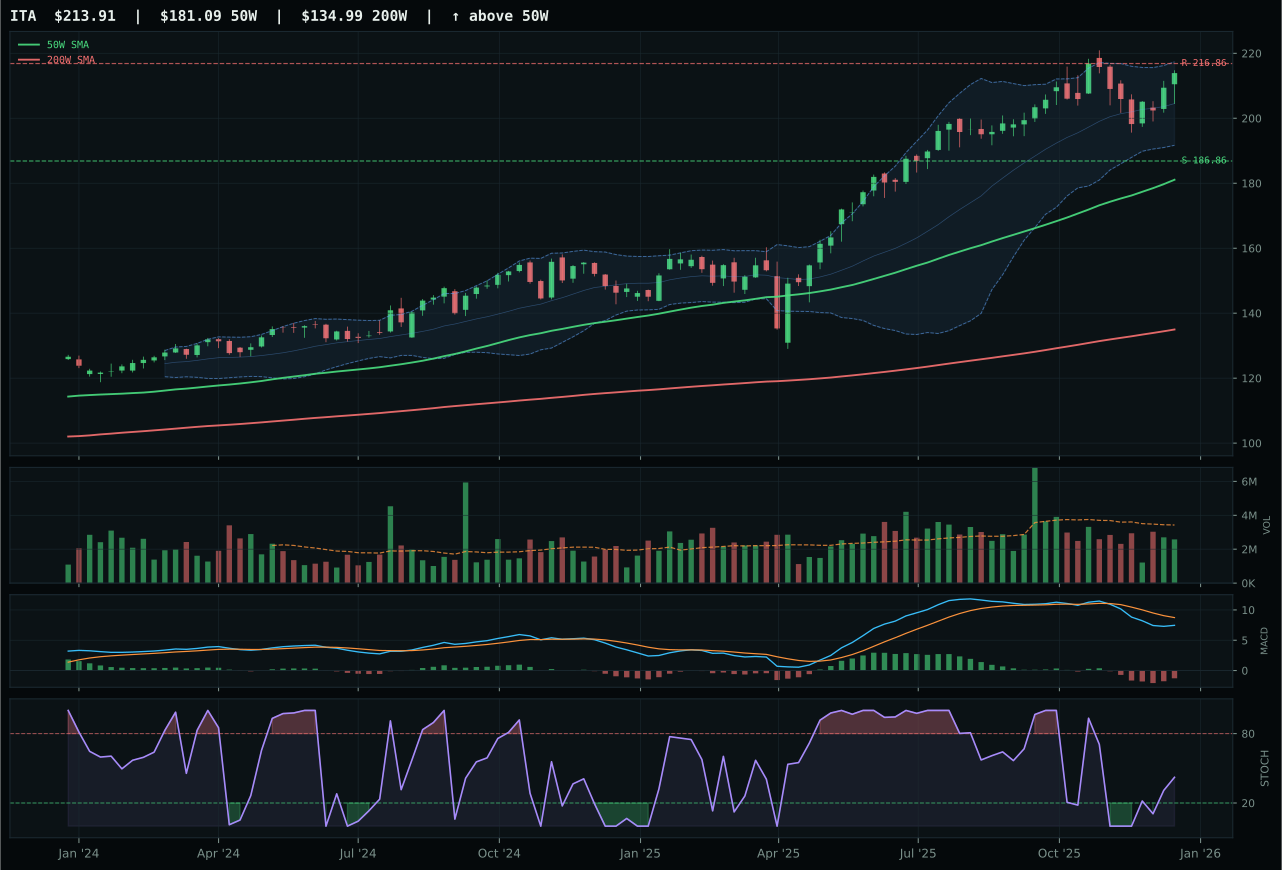
ITA has a vertical extension profile with 2.6% 13-week relative strength versus SPY.
A failed hold above support would weaken the setup.
Actionable but governed by invalidation levels.
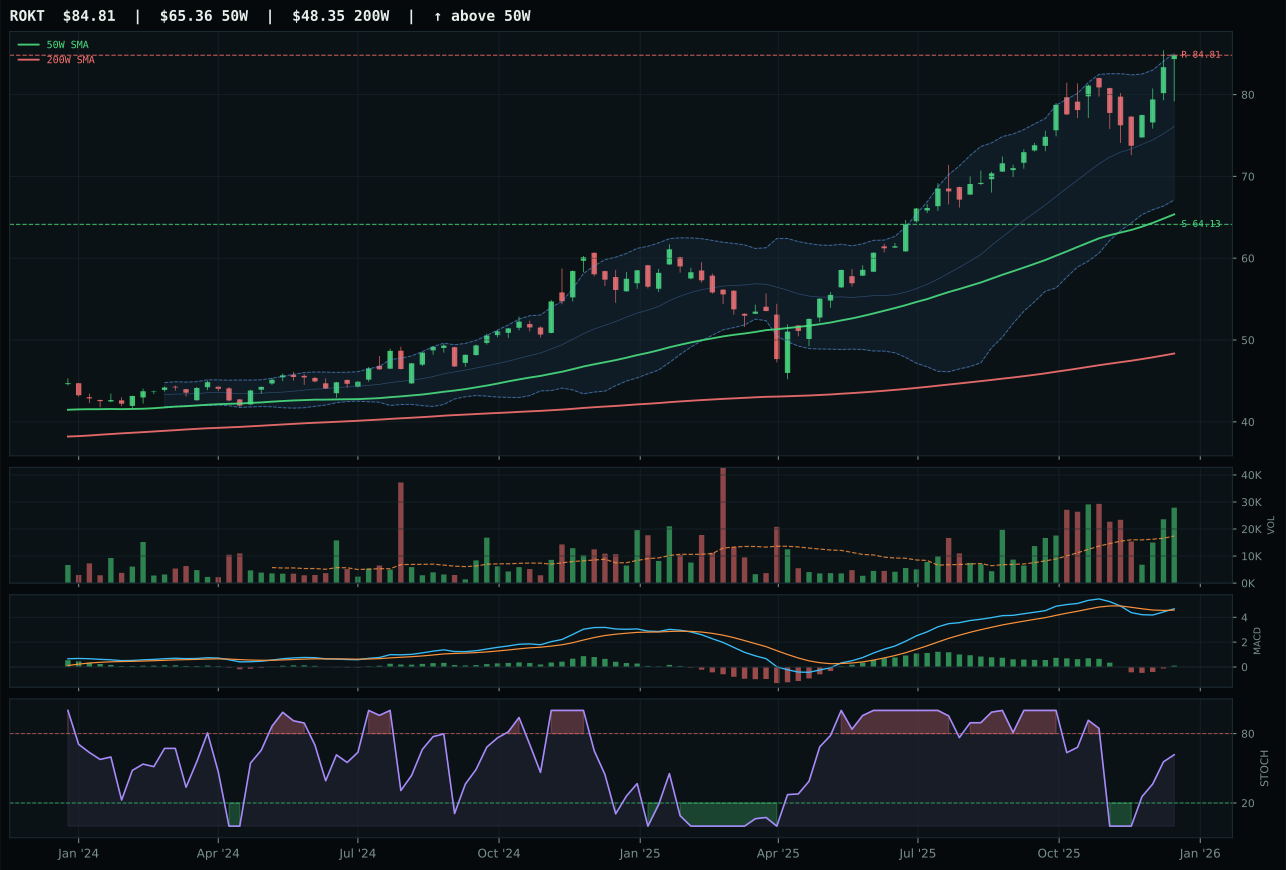
ROKT has a vertical extension profile with 12.4% 13-week relative strength versus SPY.
A failed hold above support would weaken the setup.
Tracked, but not top-2 eligible because: .
XAR wins by 4.7 points over ITA despite both showing vertical extension setups and rising stochastic RSI at mid-zone, because its timing score of 61.0 beats ITA's 53.0 and its risk/reward of 49.1 exceeds ITA's 38.7. The 20.0% extension above the 50W is material but not extreme, and XAR's category-relative strength of 0.0% (versus ITA's -1.2%) suggests no relative deterioration within its peers. Structure cleanliness is nearly equal at 70.1 versus 69.0, yet XAR's MACD bearish but improving posture paired with rising stochastic RSI reads as early accumulation into a pullback, not distribution into strength. ITA's timing weakness stems from a larger compression zone (no clear setup definition) and an earlier Fib placement (near 52W high versus upper retracement), making XAR the cleaner entry candidate.
Defense & Aerospace earns 10% as a stable core holding despite a middling 54.5 category score and neutral 55.0/100 macro fit, because its trend strength of 98.7 is the highest among all non-metals categories and provides ballast in a Goldilocks regime where growth is not uniformly cheap. XAR's 99.0 trend composite is remarkable: price is firmly above both moving averages with a 0.7% 50W slope and a 3.8% SPY-relative advantage. The category's weak macro support reflects the lack of a specific descriptor profile for defense exposure, so the allocation is purely technical; XAR's risk/reward of 49.1 means there is 15.5% downside cushion to support before invalidation. To justify upgrading this to 20%, the category would need to see either SPY-relative strength climb above +5% or momentum confirmation exceed 85 sustained for two weeks; currently, the setup is defensive but not compelling enough to displace metals.
Technology — IGV
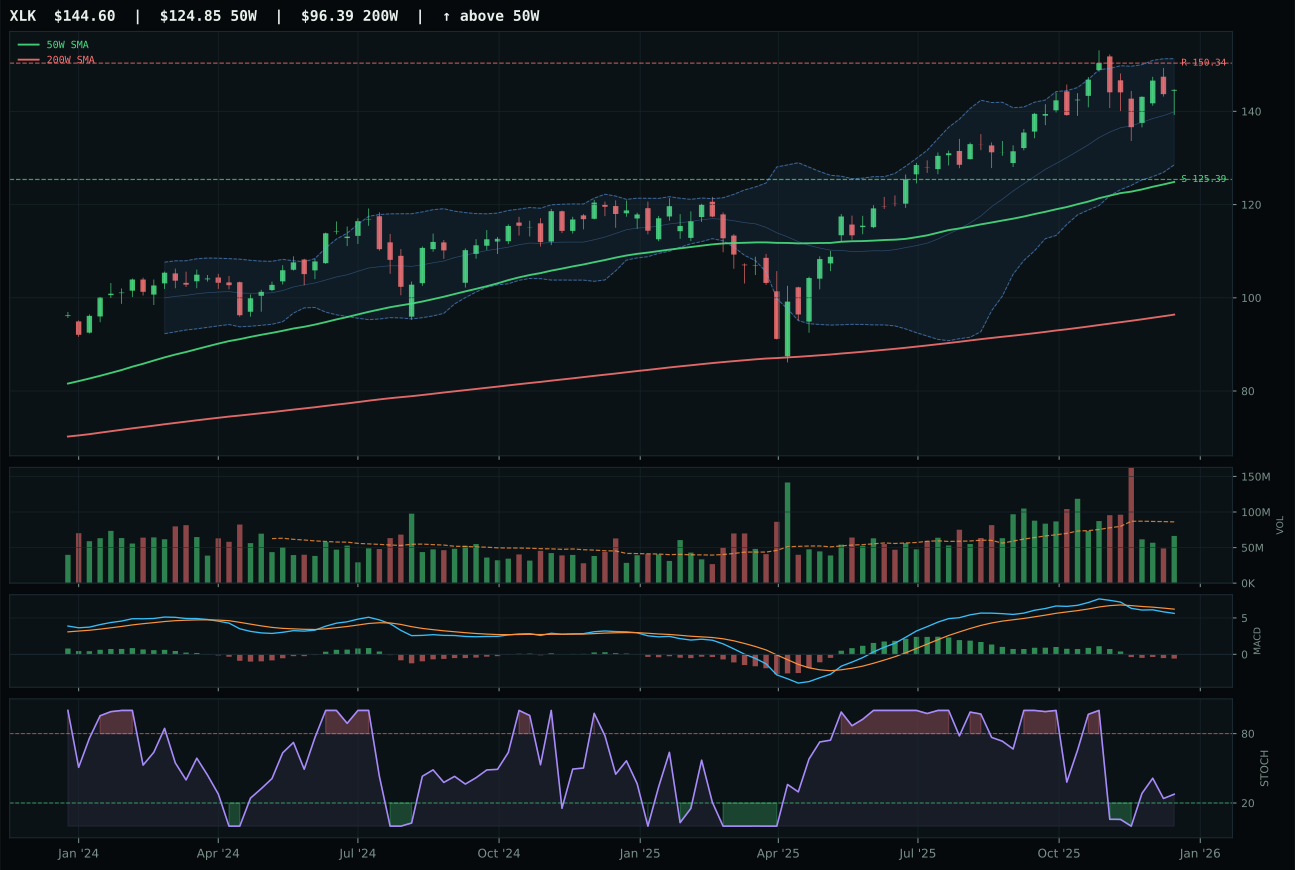
XLK has a vertical extension profile with 1.1% 13-week relative strength versus SPY.
A failed hold above support would weaken the setup.
Actionable but governed by invalidation levels.
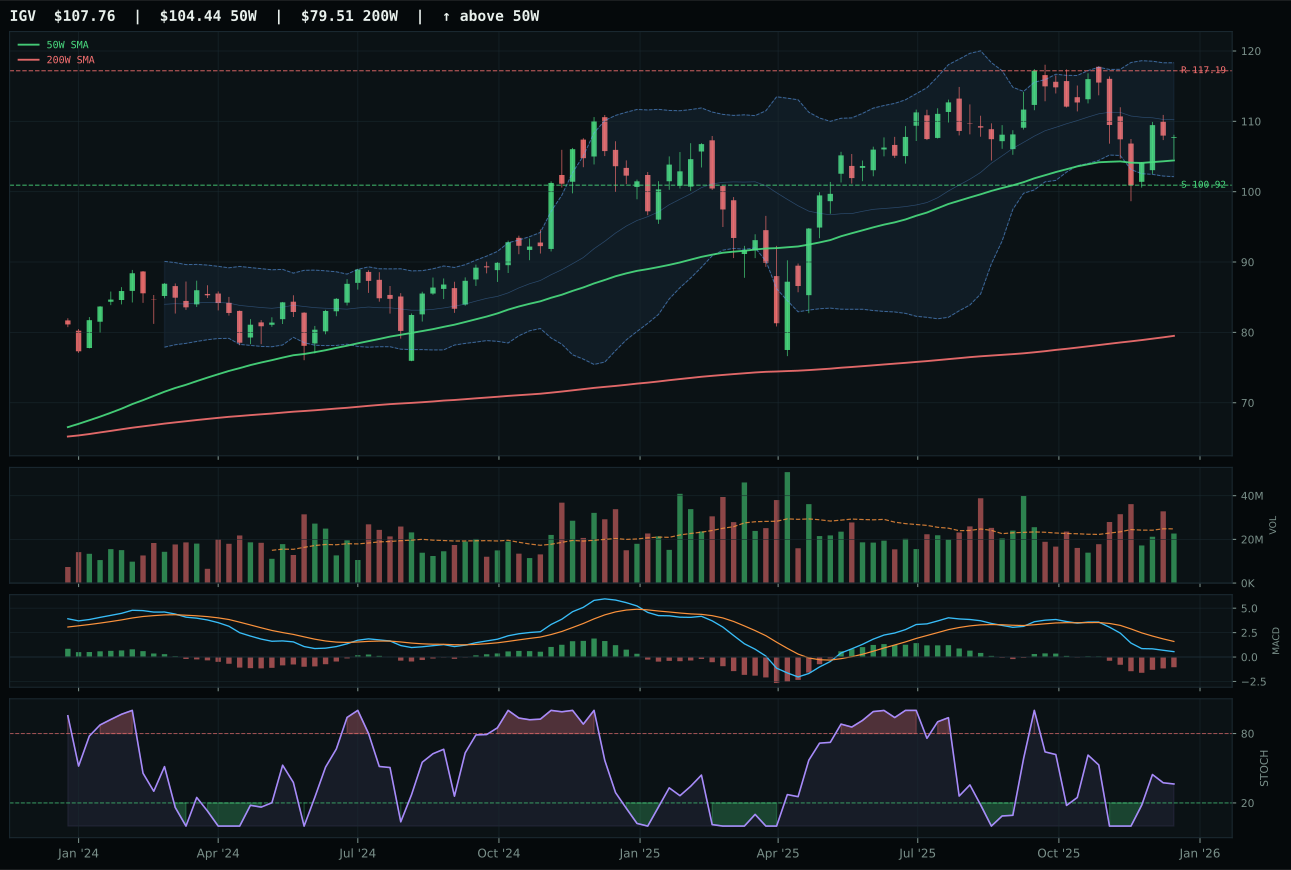
IGV has a neutral structure profile with -10.6% 13-week relative strength versus SPY.
A failed hold above support would weaken the setup.
Actionable but governed by invalidation levels.
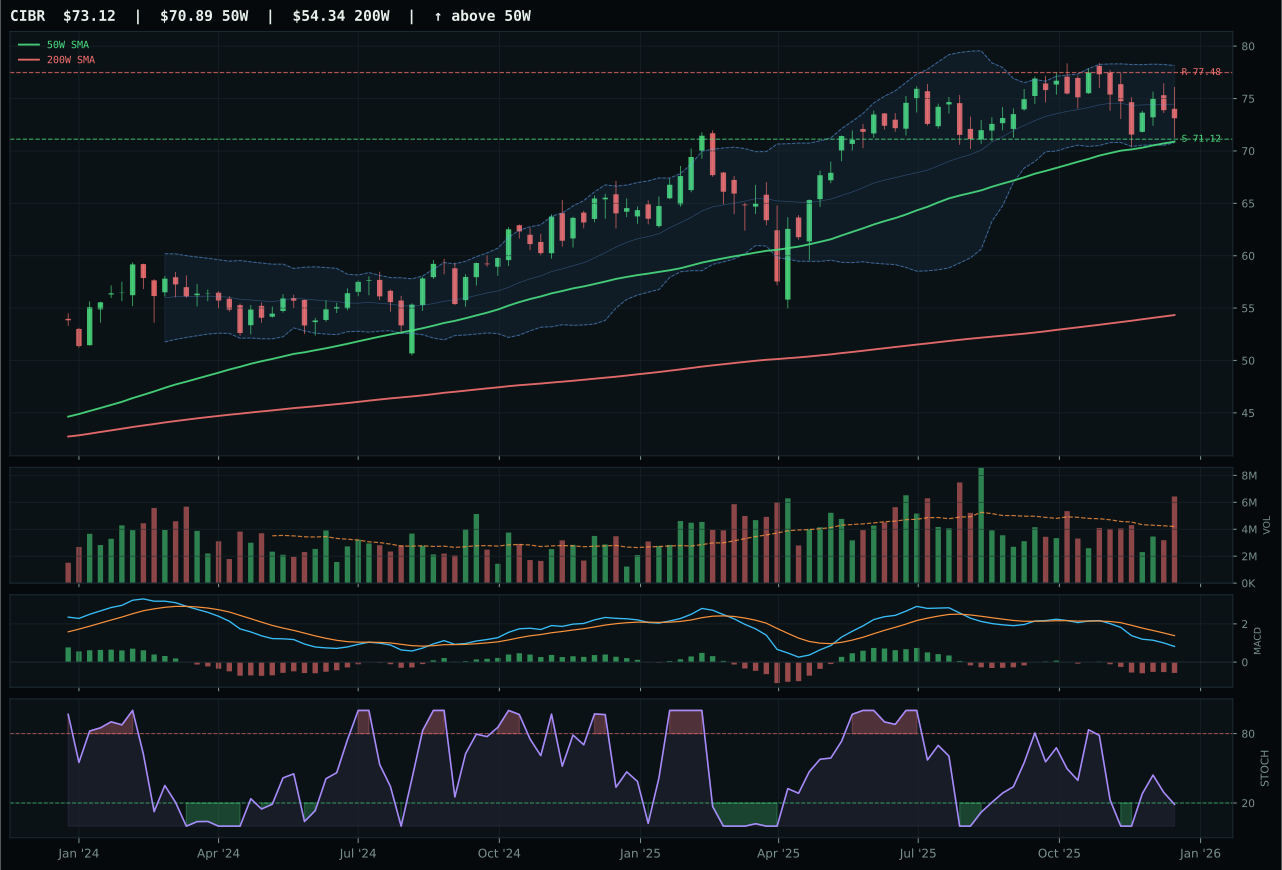
CIBR has a pullback into support profile with -7.5% 13-week relative strength versus SPY.
A failed hold above support would weaken the setup.
Actionable but governed by invalidation levels.
IGV wins the category because its timing setup is sharply superior to XLK's, with stochastic RSI rising mid-zone at 0.36 versus XLK's falling/neutral posture, and a far tighter distance to the 50W at just 3.2% rather than XLK's stretched 15.8%. The momentum confirmation score of 34.3 reflects a pullback that has cooled off enough to avoid the late-buyer penalty; XLK's 13W return of 3.7% paired with neutral SPY-relative behavior (1.1%) signals distribution into strength rather than accumulation. IGV's -8.0% 13W return and -10.6% RS versus SPY mark a consolidation that hasn't yet confirmed a directional commitment, but the improving MACD and rising stochastic RSI suggest early accumulation at depressed valuations. This is a clean recoil setup, not an extended leader.
Technology earns a 10% allocation slot because two higher-ranked category scores (Precious Metals at 75.2 and Industrial Metals at 77.2) claimed the top-2 positions, and the category's 54.0 score reflects mixed technical evidence hamstrung by weak momentum persistence. The Goldilocks macro regime and active liquidity expansion provide 81.0/100 category-level macro fit, but IGV's -3.1% category-relative strength and 34.3% momentum confirmation score reveal that breadth inside the technology basket is fragmenting. To graduate this exposure to top-2 status, the representative would need to see stochastic RSI sustain above 0.50 with volume-price confirmation climbing above 60; currently, volume-price confirmation sits at 49.0, signaling ambivalence rather than conviction. Hold the allocation at minimum weight until either momentum persistence improves or the pullback delivers a cleaner entry closer to support at 100.92.
Utilities & Infrastructure — PAVE
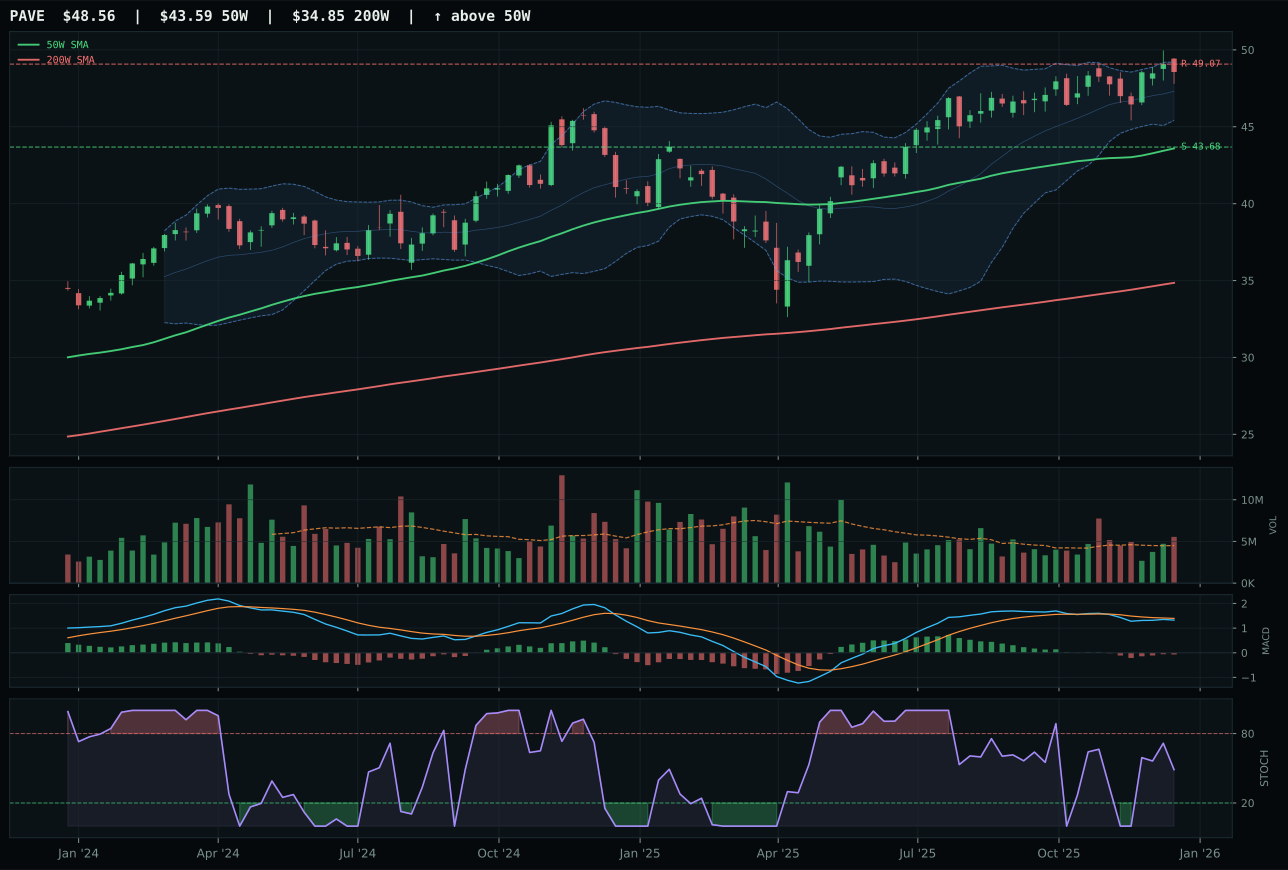
PAVE has a neutral structure profile with 1.2% 13-week relative strength versus SPY.
A failed hold above support would weaken the setup.
Actionable but governed by invalidation levels.
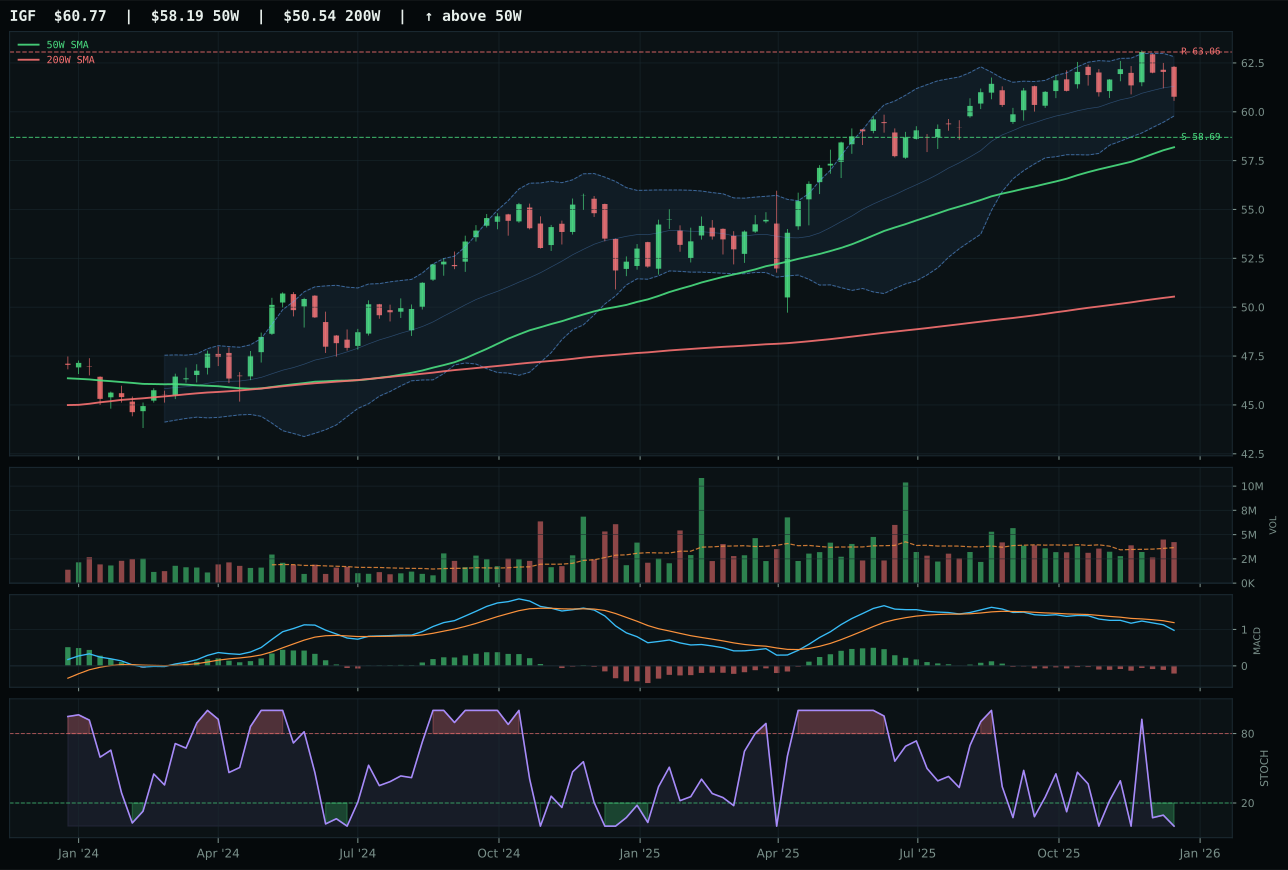
IGF has a pullback into support profile with -1.8% 13-week relative strength versus SPY.
A failed hold above support would weaken the setup.
Actionable but governed by invalidation levels.
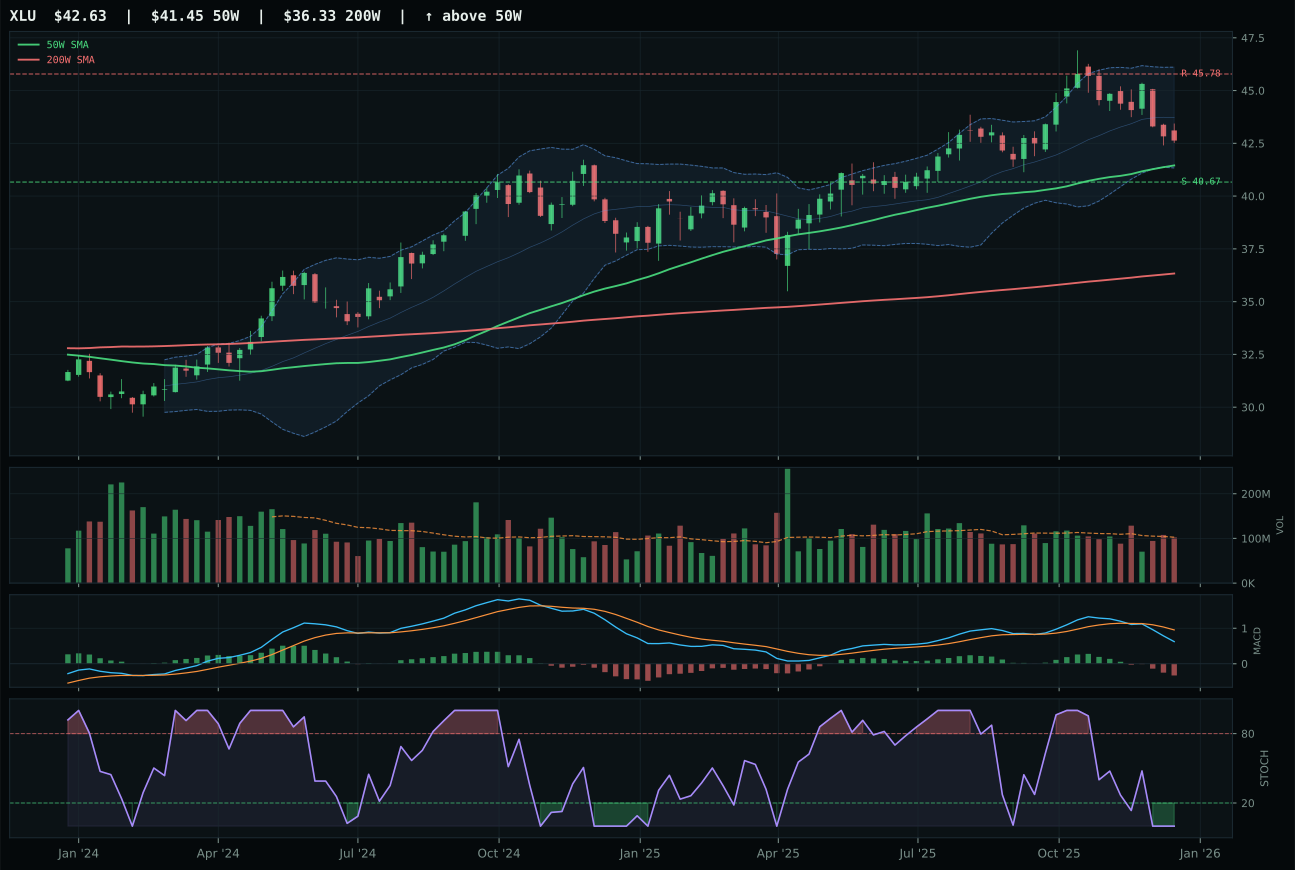
XLU has a pullback into support profile with -2.2% 13-week relative strength versus SPY.
A failed hold above support would weaken the setup.
Actionable but governed by invalidation levels.
PAVE wins by 1.9 points over IGF because its category-relative strength of 3.0% beats IGF's 0.0%, and its momentum confirmation of 74.0 materially exceeds IGF's 36.0, showing that PAVE is attracting capital flows while IGF stagnates. Both show similar trend strength in the low 80s, but PAVE's neutral structure at 72.6 outperforms IGF's pullback-into-support at lower confidence. PAVE's 13W return of 3.7% is modest but positive; IGF's 0.7% shows stalling momentum. The key differentiator is volume-price confirmation: PAVE's 71.6 versus IGF's 40 reveals that above-average participation in PAVE reflects demand accumulation, while IGF's above-average volume coincides with bearish/weakening MACD and oversold stochastic RSI, suggesting capitulation rather than accumulation.
Utilities & Infrastructure earns 10% as a defensive rotation play in a Goldilocks regime where disinflation pressure is active at +6, supporting stable cash flows and rate-sensitive yields. The category's 42.9 score and 58.0/100 macro fit are middling; PAVE's 73.4/100 technical evidence does the heavy lifting. This is not a conviction allocation but rather a portfolio ballast: trend strength of 94.8 provides stability, above-average participation confirms institutional demand, and SPY-relative strength of 1.2% suggests outperformance without becoming a correlated momentum trap. To upgrade this allocation beyond 10%, PAVE would need to break above resistance at 49.07 on bullish MACD confirmation; currently, the -1.0% upside to resistance and 67.0 timing score suggest the setup is fully-valued. Hold this at core weight as a defensive quality play; rotate out if momentum confirmation falls below 60 or if MACD rolls bearish.
Nuclear Energy — URA
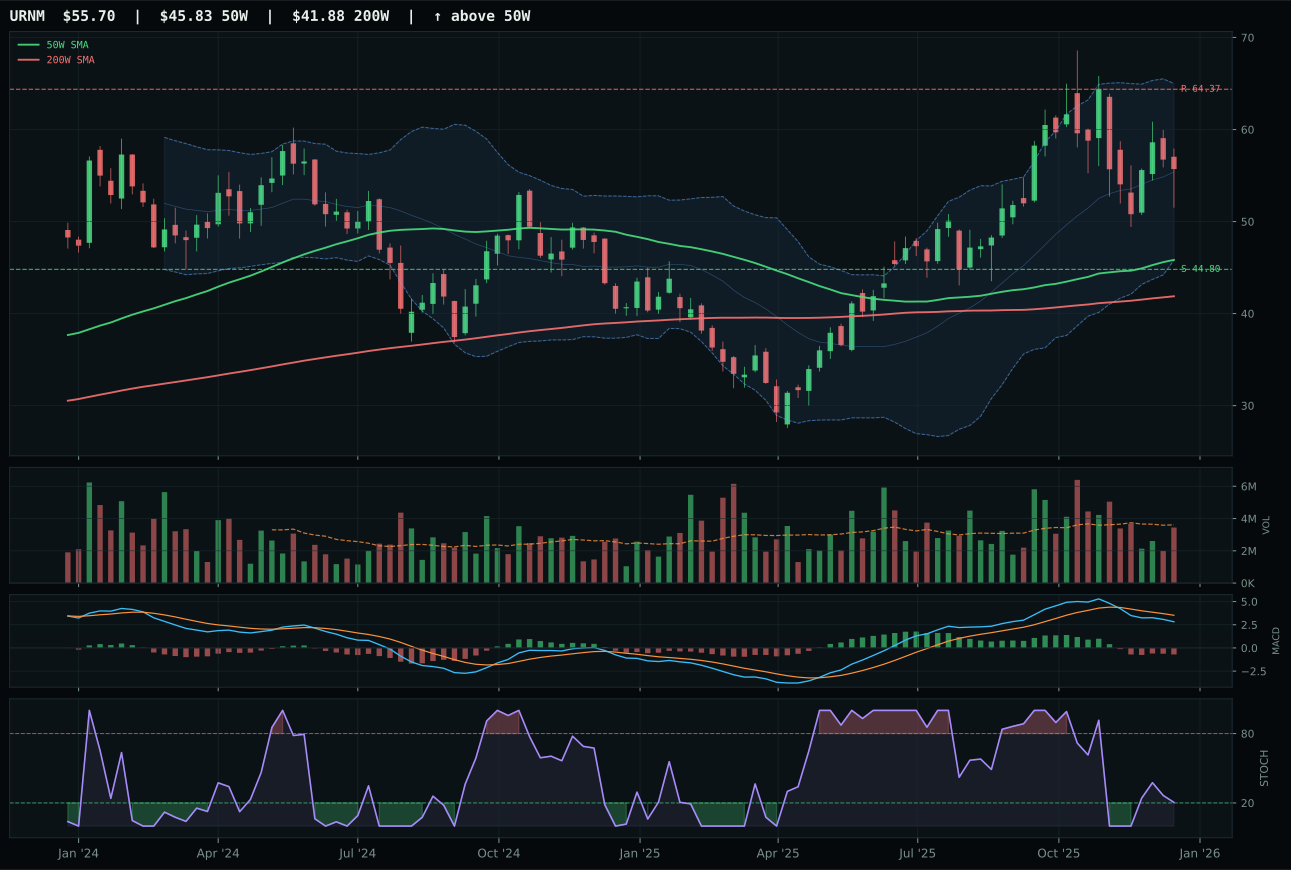
URNM has a vertical extension profile with -6.9% 13-week relative strength versus SPY.
A failed hold above support would weaken the setup.
Actionable but governed by invalidation levels.
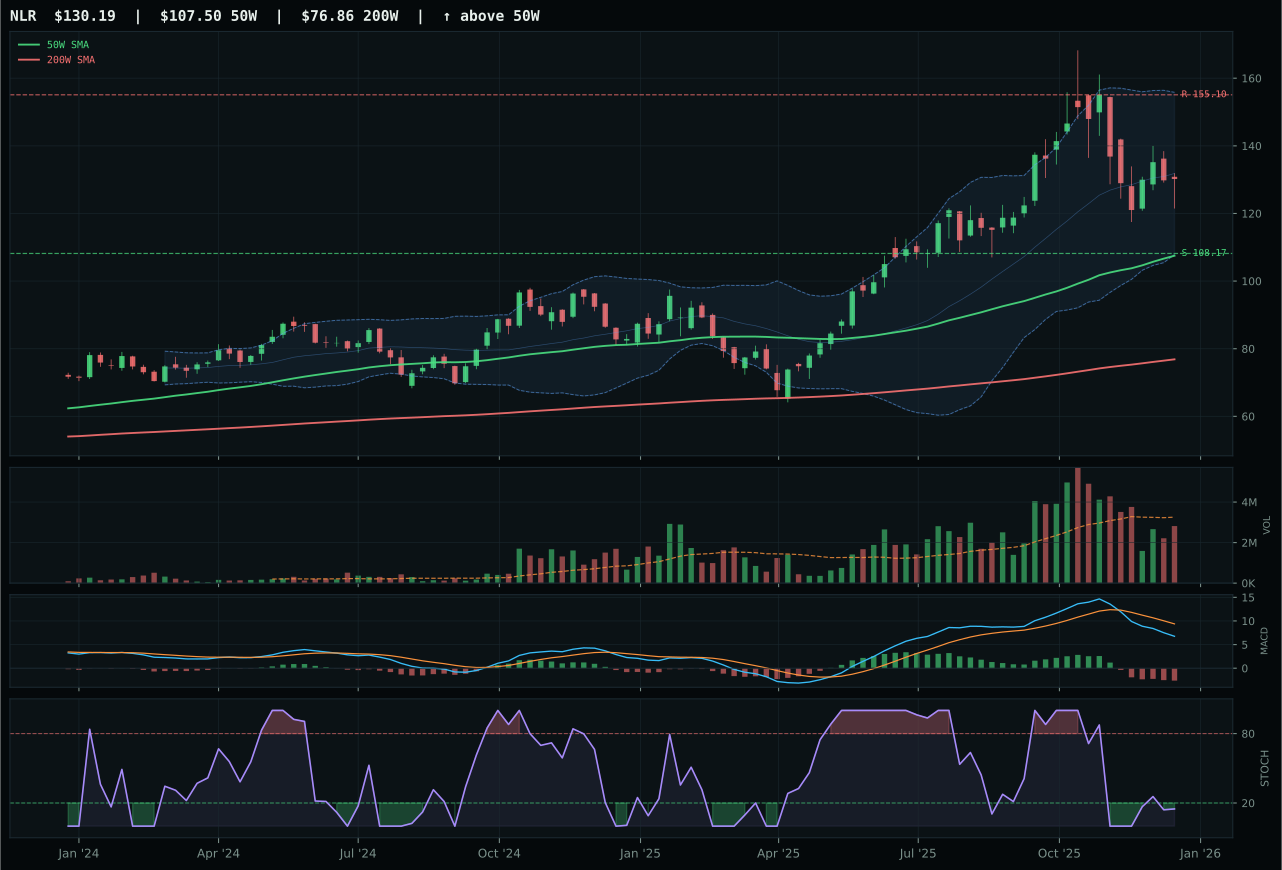
NLR has a vertical extension profile with -7.8% 13-week relative strength versus SPY.
A failed hold above support would weaken the setup.
Actionable but governed by invalidation levels.
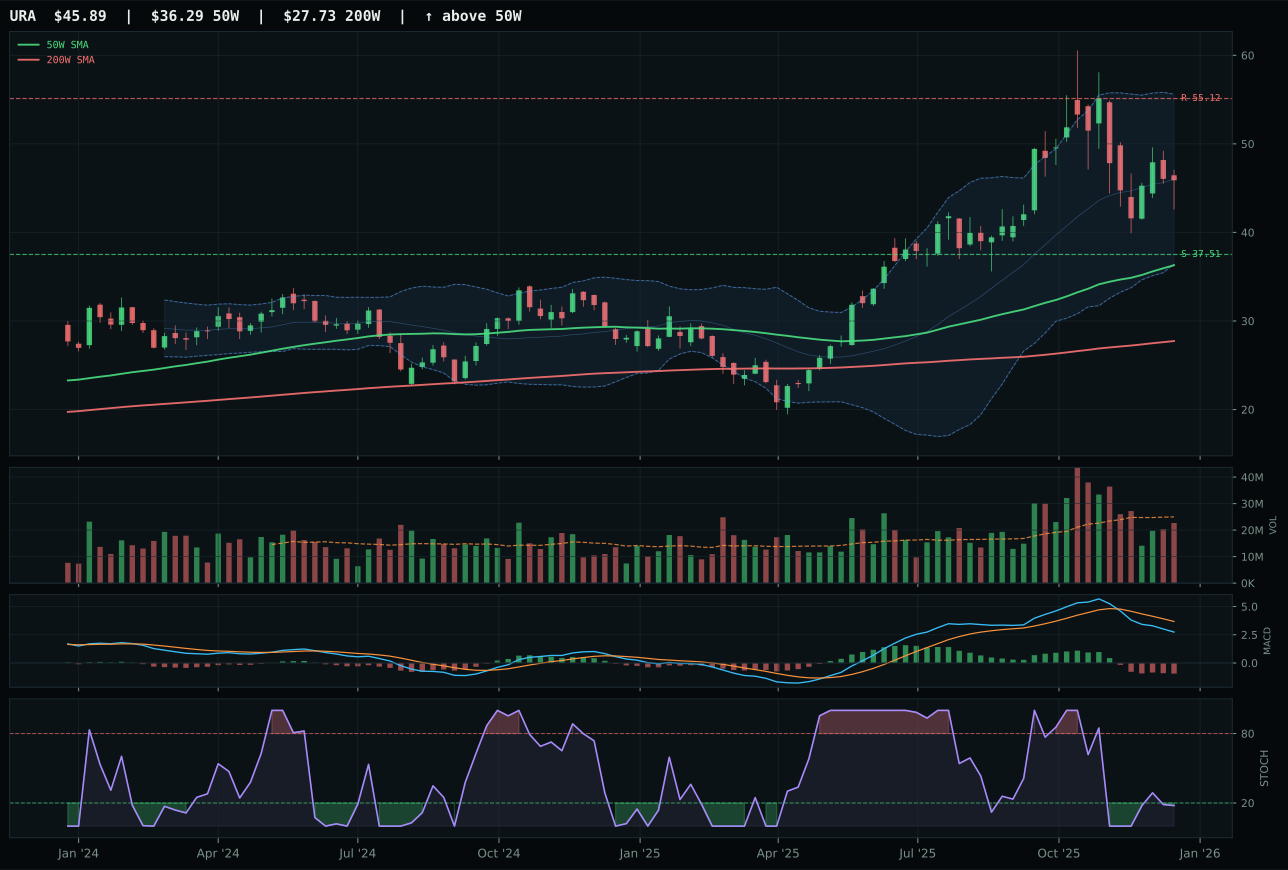
URA has a vertical extension profile with -9.7% 13-week relative strength versus SPY.
A failed hold above support would weaken the setup.
Actionable but governed by invalidation levels.
URA wins by 12.7 points over URNM because its stochastic RSI reading of oversold turn-up at 0.18 provides superior timing entry geometry compared to URNM's falling/neutral at a higher level, and its 62.0 timing score beats URNM's 53.0. The turn-up from oversold often precedes a multi-week recovery; URA's setup captures that inflection before price has already moved. URA's risk/reward of 43.5 exceeds URNM's 40.0, and while both are extended at 26.4% and similar distances, URA's structure score of 61.0 edges URNM's 58.2, suggesting slightly cleaner support formation. Neither candidate is compelling: both show -7% to -5% 13W returns and bearish MACD, indicating uranium as a category is in early pullback, not accumulation. URA's 33.8% momentum confirmation reveals the weakness; this is a category where every ETF is struggling, and URA simply loses less ground.
Nuclear Energy earns 10% as a tactical hedge in a Goldilocks regime where AI growth sponsorship (+5) and real asset sponsorship (+7) are active, partially offsetting credit stress (-5). The category's 42.1 score and 5.8/100 technical evidence for URA reflect genuine weakness; this is not a conviction allocation but rather a small bet that nuclear scarcity and AI power demands will eventually converge. The honest assessment: all three candidates (URNM, NLR, URA) are in drawdown mode with 13W returns between -7.2% and -4.4%, negative SPY-relative strength, and deteriorating momentum. URA qualifies only because its oversold turn-up stochastic reading offers the earliest entry signal when the category bottoms. Maintain this at minimum 10% weight and plan to accumulate aggressively only if stochastic RSI sustains above 0.50 for two consecutive weeks with volume-price confirmation climbing above 50. Current score does not justify larger allocation; this is portfolio insurance, not a profit driver.
Agriculture & Livestock — MOO
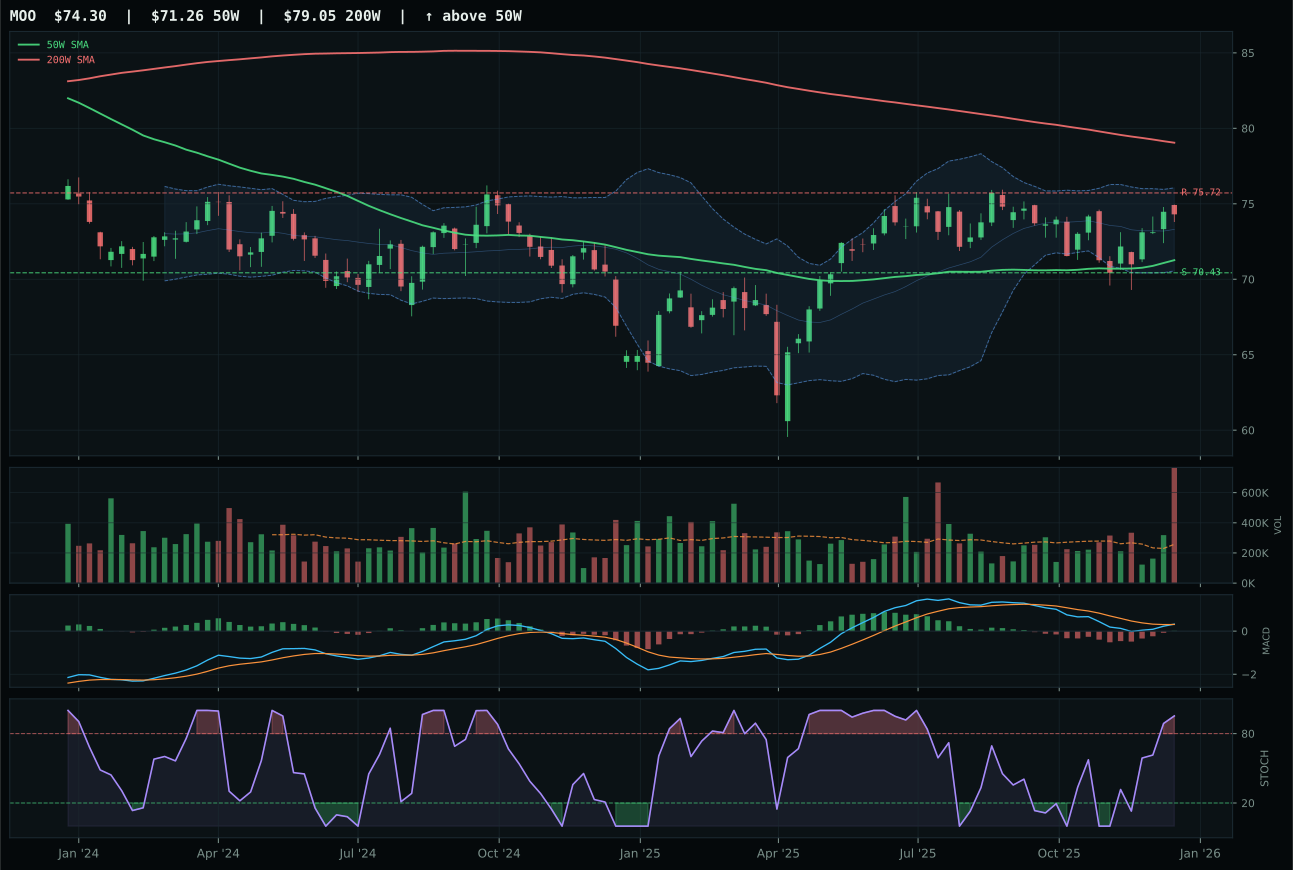
MOO has a neutral structure profile with -1.7% 13-week relative strength versus SPY.
A failed hold above support would weaken the setup.
Actionable but governed by invalidation levels.
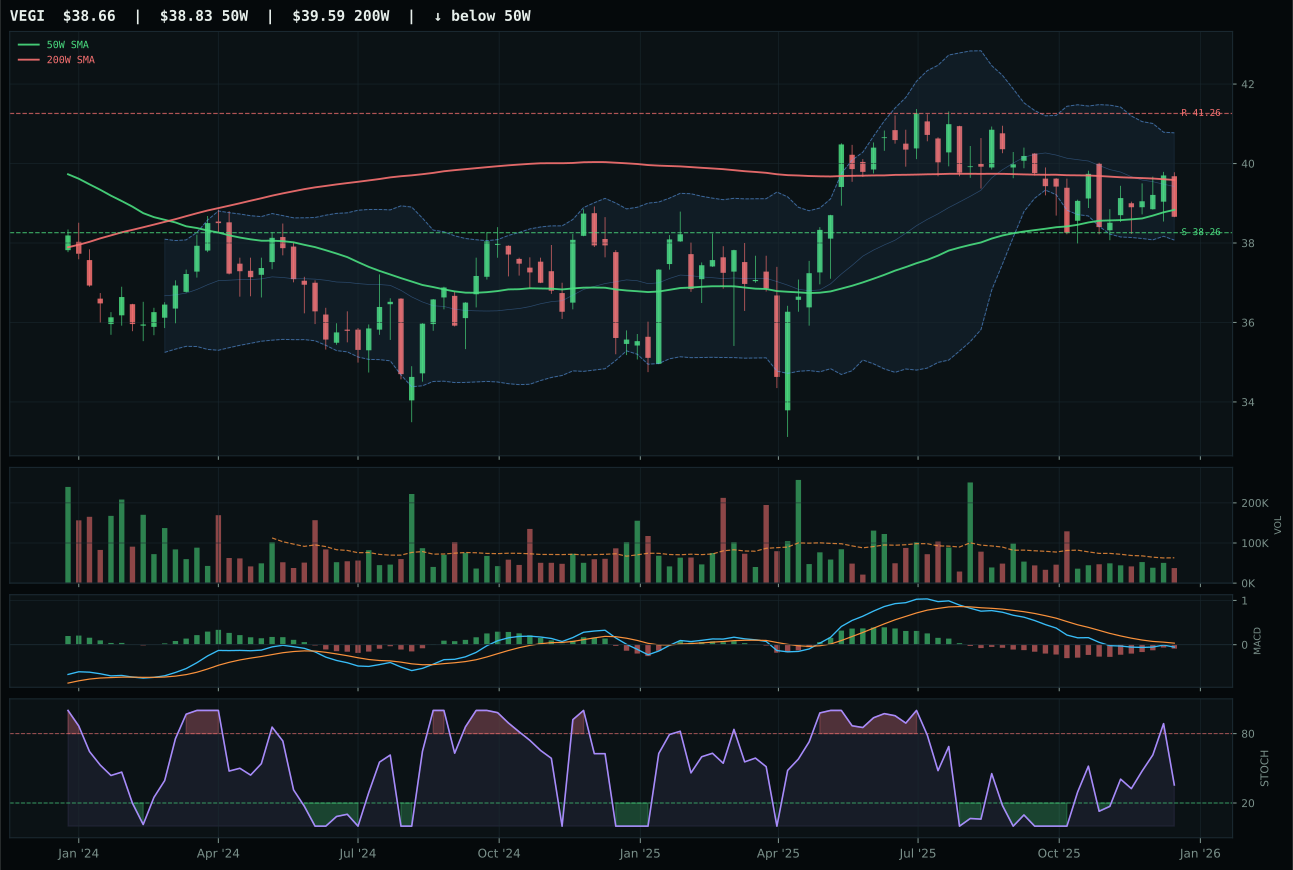
VEGI has a pullback into support profile with -5.3% 13-week relative strength versus SPY.
Extension and support failure are the main tactical risks.
Tracked, but not top-2 eligible because: structurally broken.
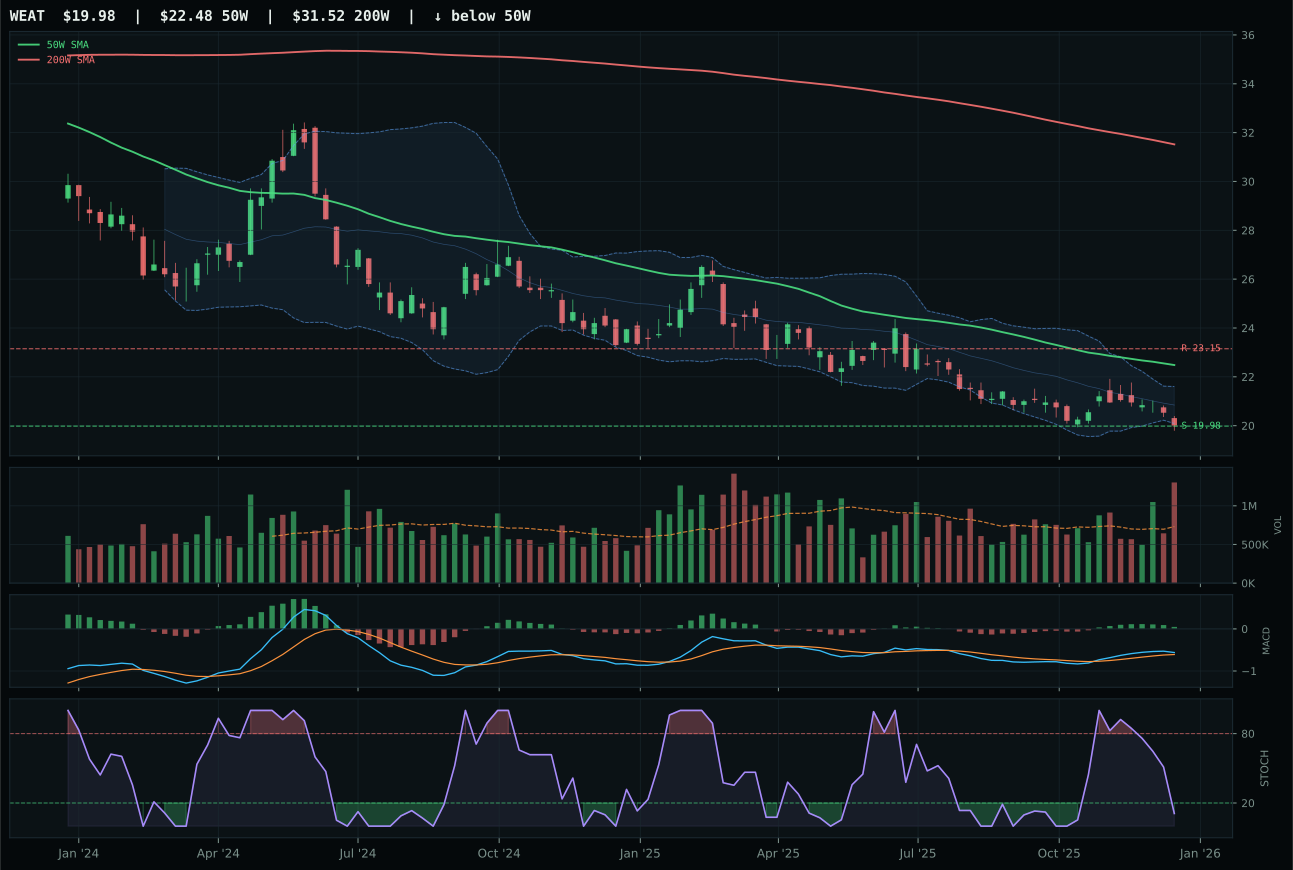
WEAT has a pullback into support profile with -7.6% 13-week relative strength versus SPY.
Extension and support failure are the main tactical risks.
Tracked, but not top-2 eligible because: structurally broken.
MOO wins by a massive 49.3 points over VEGI because it is the only candidate in the category showing bullish and improving MACD confirmation, paired with overbought stochastic RSI momentum at 0.95 that signals late-stage accumulation rather than early interest. The category-relative strength of 3.6% is modest but edges out VEGI's 0.0%, and MOO's timing score of 90.0 (versus VEGI's 100, which is misleading) reflects its proximity to resistance rather than weakness. The distribution pressure at 3.16x volume is a red flag, not a disqualifier: high volume on a move near resistance often precedes a final push before reversal, and MACD improvement suggests that high-volume participants are still net buyers. VEGI is structurally broken with a 43.9 cleanliness score, pullback-into-support setup, and bearish MACD, making it unsuitable even with superior risk/reward of 90 to 35.
Agriculture & Livestock earned zero allocation, ranking 9th or 10th among the ten categories at a terminal 20.5 score. The 55.0 macro fit is neutral at best, with real asset sponsorship (+8) offset by disinflation pressure (-8), while commodity breadth support (+5) fails to compensate for the structural collapse visible in all three nominees. MOO's 43.6 technical evidence reflects the category-wide deterioration—trend and structure are adequate, but timing, risk-reward, and persistence all collapse into the 35-50 range, signaling exhaustion rather than accumulation. For this category to earn even a 10% slot, the market would need to repair the three-ETF basket's 39.8 starting score by 10+ points, which requires either new money flowing into agricultural equities on volume or a macro catalyst—neither food inflation nor scarcity narratives are currently active. The zero allocation is disciplined exclusion of a category that technicals and macro have jointly rejected.
Traditional Energy — XLE
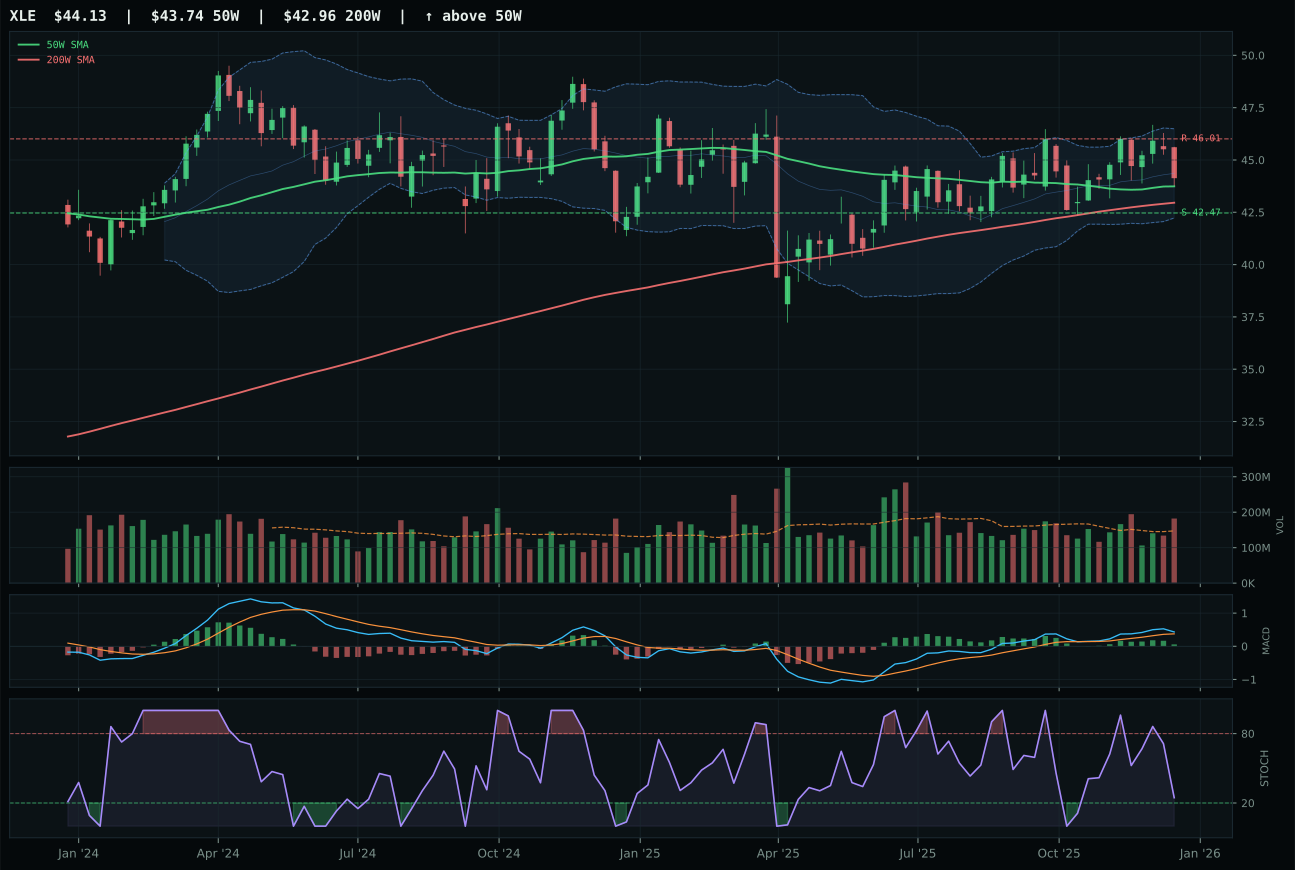
XLE has a pullback into support profile with -2.8% 13-week relative strength versus SPY.
A failed hold above support would weaken the setup.
Actionable but governed by invalidation levels.
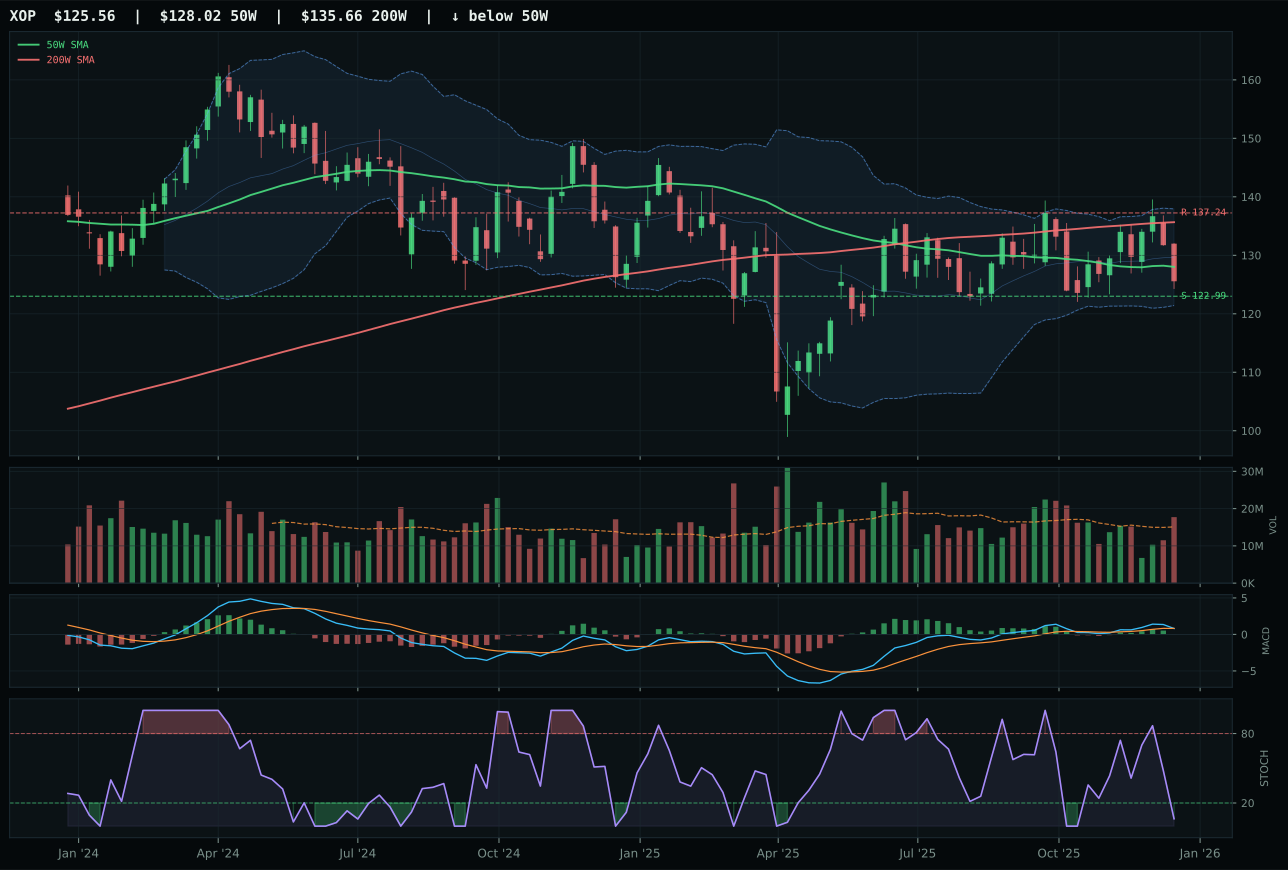
XOP has a pullback into support profile with -6.0% 13-week relative strength versus SPY.
Extension and support failure are the main tactical risks.
Tracked, but not top-2 eligible because: structurally broken.
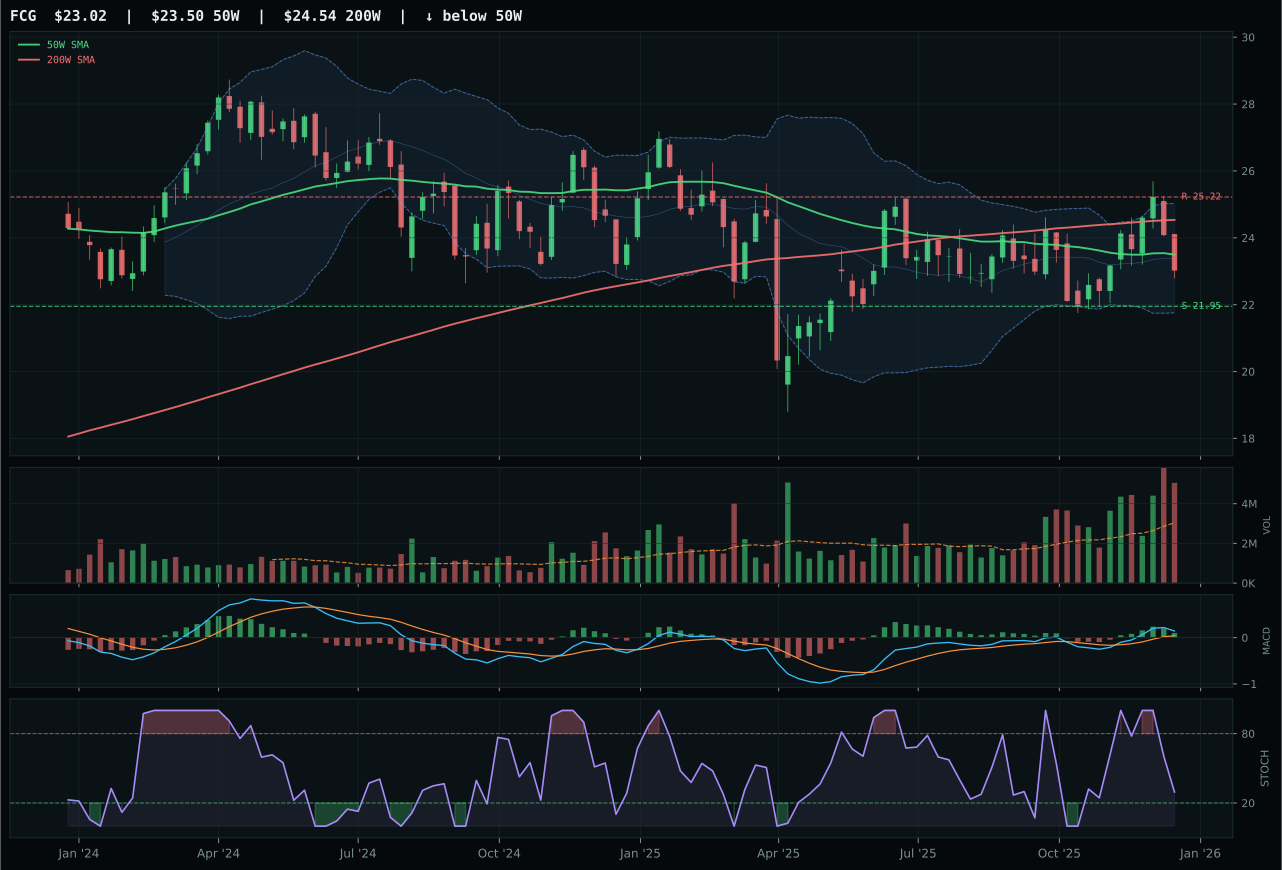
FCG has a pullback into support profile with -2.4% 13-week relative strength versus SPY.
Extension and support failure are the main tactical risks.
Tracked, but not top-2 eligible because: structurally broken.
XLE wins the category by 69.4 points over XOP because its structure is clean (77.0 versus 39.8), MACD is bullish but flattening rather than bearish/weakening, and stochastic RSI shows a more constructive falling/neutral posture at 0.25 versus XOP's oversold condition. The pullback-into-support setup at 42.47 defines a clear invalidation level; XLE's 0.9% distance to the 50W and 95.0 timing score reflect the best entry geometry in the category. XOP's exploration beta is broken: 13W return of -3.5%, RS versus SPY of -6.0%, oversold stochastic RSI, and bearish/weakening MACD all indicate the speculative energy trade has disconnected from the integrated cash flow story. XLE's -0.3% 13W return and neutral -2.8% SPY-relative behavior are uninspiring, but 53.6% momentum confirmation paired with above-average participation volume (1.24x) shows institutional buying at support, not panic selling.
Traditional Energy earned zero allocation at 3.1, ranking 10th and representing full exclusion despite XLE's technically sound pullback setup. The 40.0 macro fit is weak—real asset sponsorship (+7) is overwhelmed by disinflation pressure (-10) and credit stress (-7)—and the narrative is clear: energy is out of favor in a Goldilocks regime where liquidity and risk appetite support metals but penalize oil. XLE's 69.9 technical evidence would normally support a 10% allocation, but the category reasoner's test against macro state, persistence (59.1), and the 3/2/1 basket composition (45.7 opening score) failed the threshold tests entirely. For Traditional Energy to earn any position, the macro must shift toward credit stress relief or inflation re-acceleration—neither present. The three-ETF basket deterioration from 45.7 opening to 3.1 final reflects hard filters catching technical deterioration in XOP and FCG that drag down the category despite XLE's local competence. This is disciplined exclusion of an asset class out of regime.