
2025-12-12
Informational purposes only. The content in this report, including allocations, analysis, and commentary, is provided solely for informational and educational purposes. It does not constitute financial advice, investment advice, trading advice, or any other type of advice. Past performance does not guarantee future results. Always conduct your own research and consult a qualified financial professional before making investment decisions.
Weekly Allocation
| Ticker | Category | Weight | Role |
|---|---|---|---|
| SLV | Precious Metals | 20% | Top-2 (20%) |
| COPX | Industrial Metals | 20% | Top-2 (20%) |
| BOTZ | AI | 10% | Tier-2 (10%) |
| PAVE | Utilities & Infrastructure | 10% | Tier-2 (10%) |
| IGV | Technology | 10% | Tier-2 (10%) |
| URNM | Nuclear Energy | 10% | Tier-2 (10%) |
| XAR | Defense & Aerospace | 10% | Tier-2 (10%) |
| XLE | Traditional Energy | 10% | Tier-2 (10%) |
Trade Instructions — Monday Open
Sell the tranche from 2025-11-14 (completing its 4-week hold). Buy the new tranche. Instructions show net portfolio changes — same-asset positions cancel, weight changes show the delta.
| Action | Ticker | Instruction |
|---|---|---|
| SELL | FBTC | Sell entire FBTC position (12.50% of portfolio) |
| SELL | PICK | Sell 33% of PICK position (reduce 7.50% → 5.00%) |
| SELL | SMH | Sell 14% of SMH position (reduce 8.75% → 7.50%) |
| SELL | ILF | Sell entire ILF position (1.25% of portfolio) |
| SELL | IGF | Sell 20% of IGF position (reduce 6.25% → 5.00%) |
| SELL | XLK | Sell 20% of XLK position (reduce 6.25% → 5.00%) |
| BUY | SLV | Buy SLV — 12.50% of freed cash (adds 2.50% to portfolio) |
| BUY | XLE | Buy XLE — 6.25% of freed cash (adds 1.25% to portfolio) |
| BUY | URNM | Buy URNM — 6.25% of freed cash (adds 1.25% to portfolio) |
| BUY | COPX | Buy COPX — 25.00% of freed cash (adds 5.00% to portfolio) |
| BUY | PAVE | Buy PAVE — 12.50% of freed cash (adds 2.50% to portfolio) |
| BUY | BOTZ | Buy BOTZ — 12.50% of freed cash (adds 2.50% to portfolio) |
| BUY | IGV | Buy IGV — 12.50% of freed cash (adds 2.50% to portfolio) |
| BUY | XAR | Buy XAR — 12.50% of freed cash (adds 2.50% to portfolio) |
Current Portfolio After Trade
Combined holdings across all 4 active tranches. Each tranche is 25% of the portfolio.
| Ticker | % of Portfolio | Weight Bar |
|---|---|---|
| SLV | 15.00% | |
| URNM | 10.00% | |
| COPX | 10.00% | |
| ITA | 7.50% | |
| SMH | 7.50% | |
| PICK | 5.00% | |
| XLE | 5.00% | |
| IGF | 5.00% | |
| XLK | 5.00% | |
| GLD | 5.00% | |
| REMX | 5.00% | |
| FCG | 5.00% | |
| PAVE | 5.00% | |
| CIBR | 2.50% | |
| BOTZ | 2.50% | |
| IGV | 2.50% | |
| XAR | 2.50% |
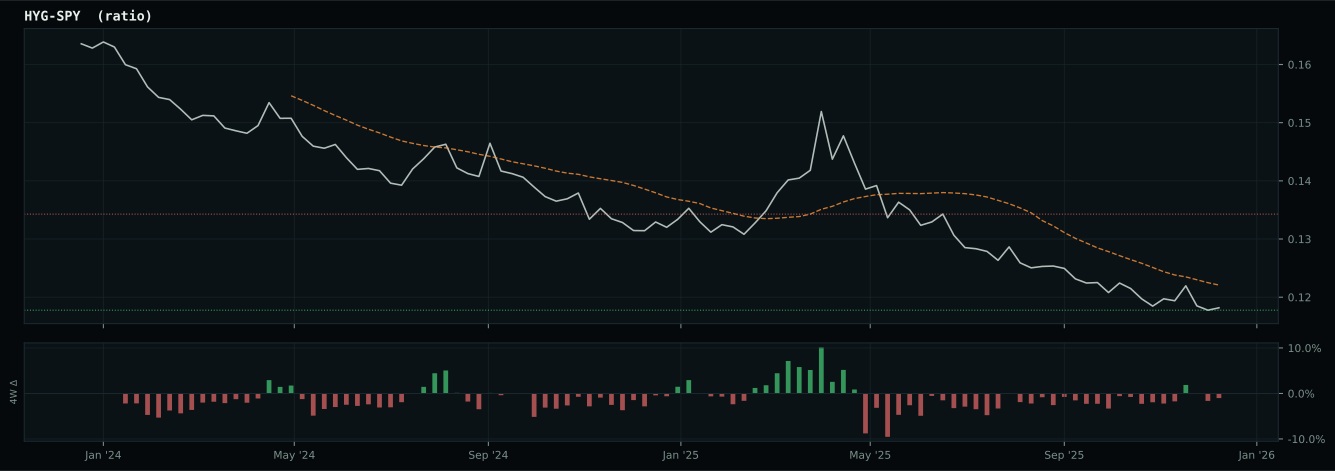
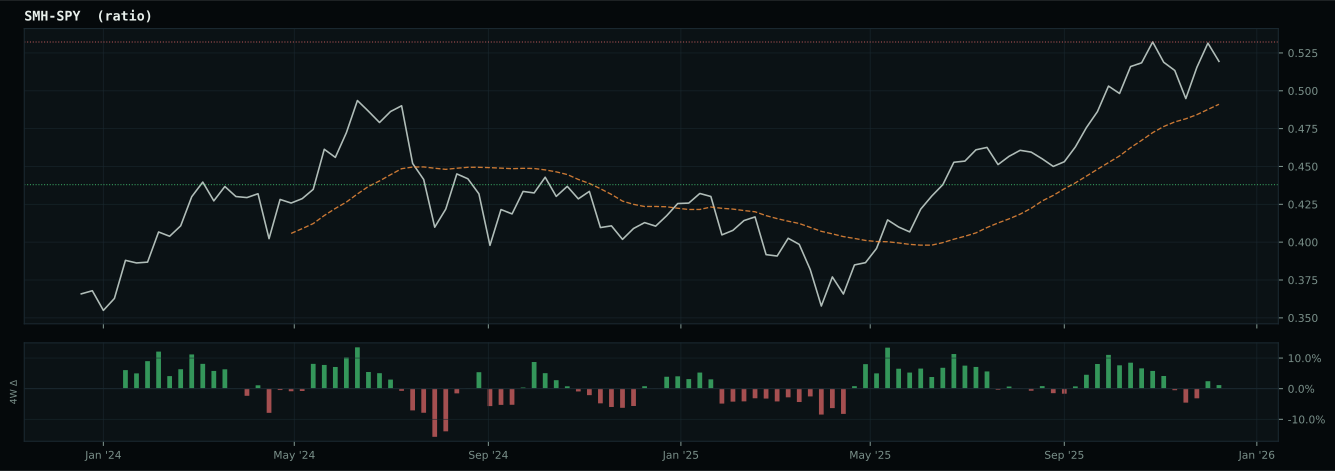
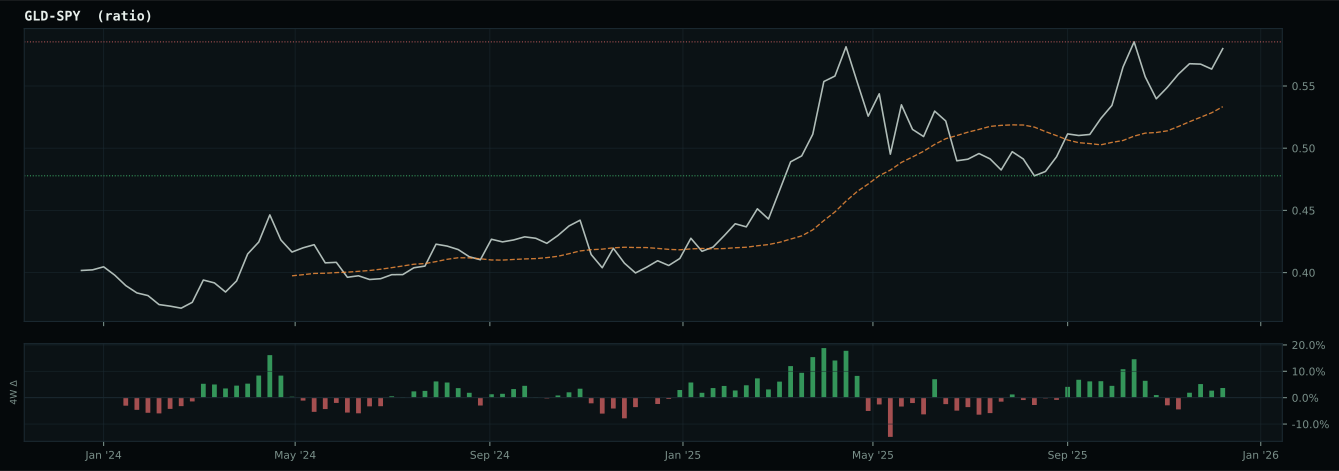
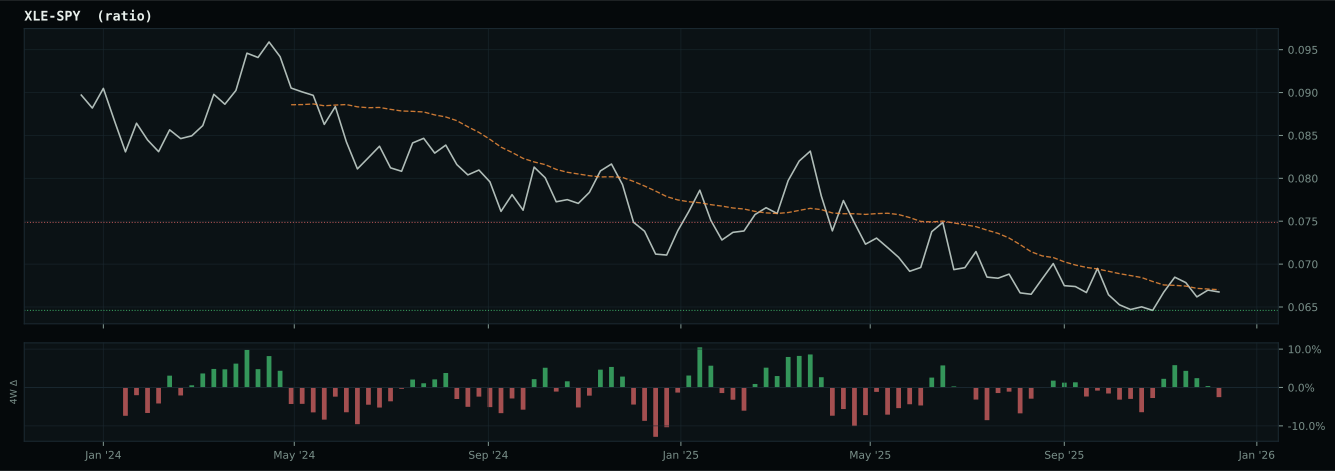
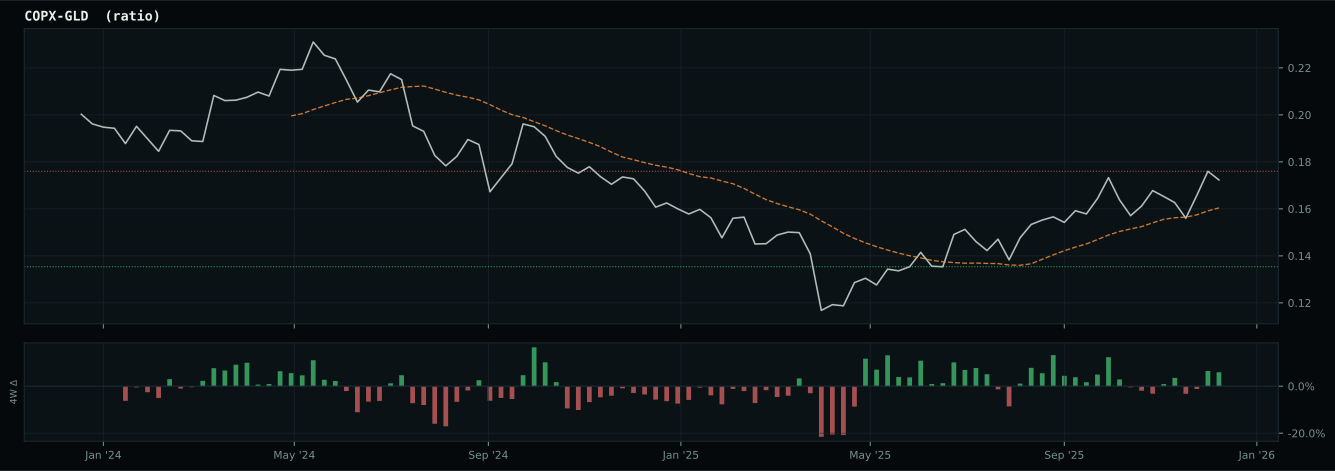
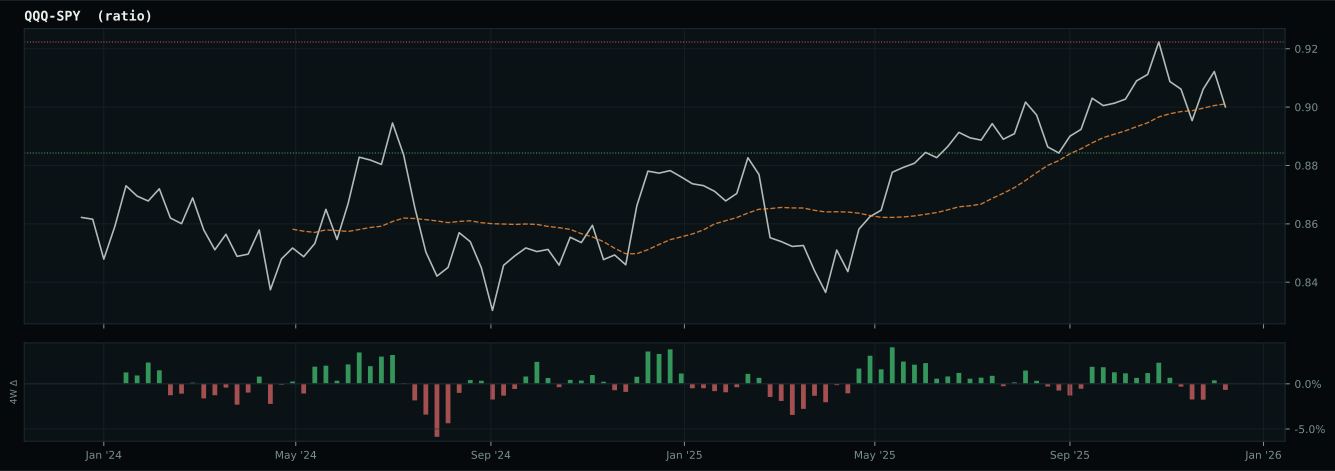
Macro Regime — Disinflation
Macro Evidence Charts
Market-implied signals behind the macro regime scores. Each ratio compares two assets; the direction and slope of the ratio is what the macro engine reads.
Crypto Regime — NoCrypto
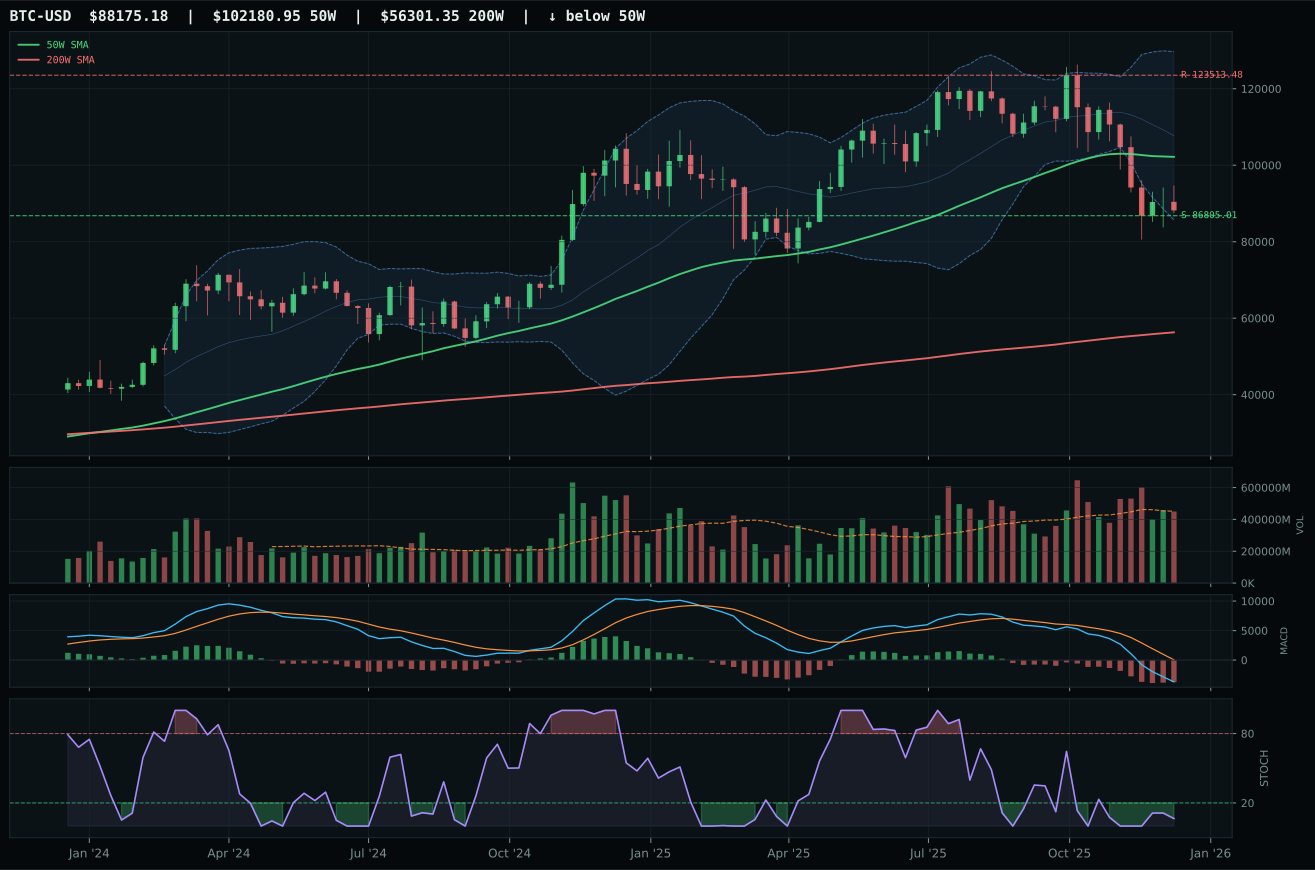
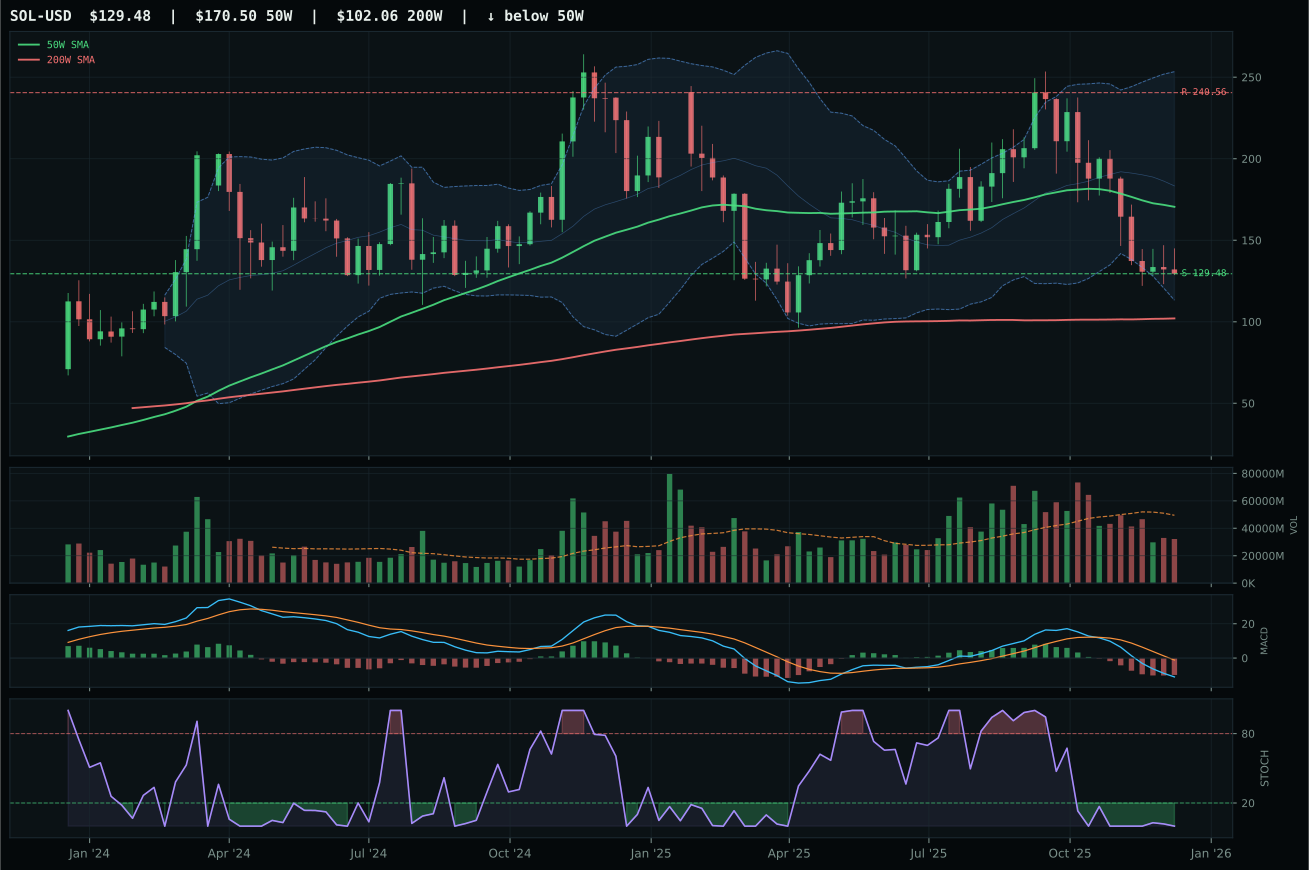
ValueBTC not armed: BTC has not made the first post-breakdown touch of the 200W buy zone after losing the 50W
TrendBTC not confirmed
one or more available conditions failed
Category Rankings
| Rank | Category | Winner | Score | Alloc | 4W Ret | Peers (4W) |
|---|---|---|---|---|---|---|
| 1 | Precious Metals | SLV | 77.3 | 20% | +31.59% | GDX +10.0% · GLD +6.0% |
| 2 | Industrial Metals | COPX | 70.2 | 20% | +13.76% | PICK +9.7% · REMX +21.1% |
| 3 | AI | BOTZ | 52.2 | 10% | +4.69% | SMH +7.7% · AIQ +2.9% |
| 4 | Utilities & Infrastructure | PAVE | 49.5 | 10% | +1.15% | IGF -0.8% · XLU -1.7% |
| 5 | Technology | IGV | 46.1 | 10% | -3.01% | XLK +0.5% · CIBR -2.4% |
| 6 | Nuclear Energy | URNM | 43.1 | 10% | +12.20% | URA +10.1% · NLR +8.1% |
| 7 | Defense & Aerospace | XAR | 40.9 | 10% | +17.12% | ITA +11.1% · ROKT +14.1% |
| 8 | Traditional Energy | XLE | 35.6 | 10% | +2.50% | XOP -3.3% · FCG -3.8% |
| 9 | Emerging Markets | ILF | 32.5 | 0% | +0.57% | IEMG +4.1% · INDA -0.0% |
| 10 | Agriculture & Livestock | MOO | 22.6 | 0% | +0.19% | VEGI +0.5% · WEAT +1.1% |
Precious Metals — SLV
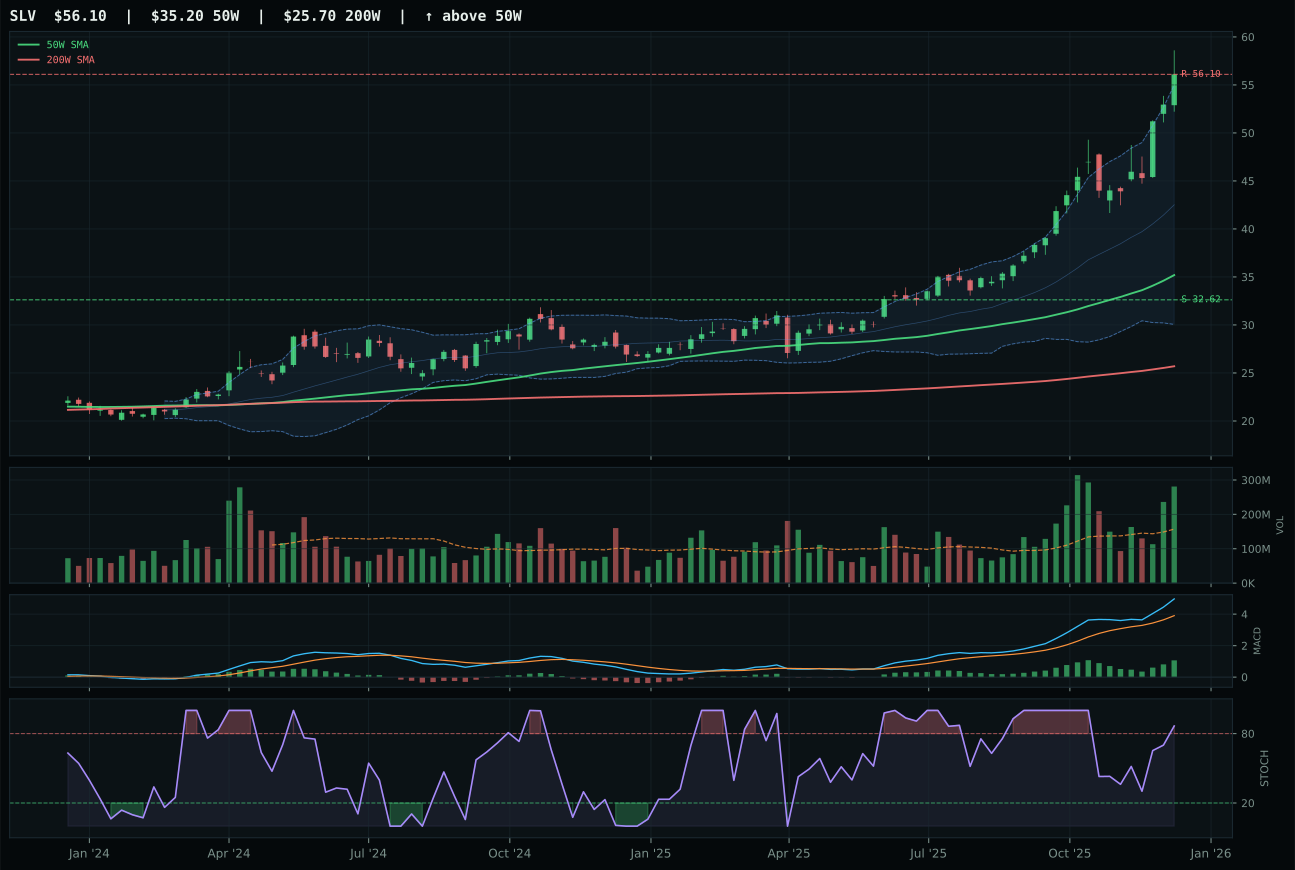
SLV has a vertical extension profile with 42.6% 13-week relative strength versus SPY.
A failed hold above support would weaken the setup.
Actionable but governed by invalidation levels.
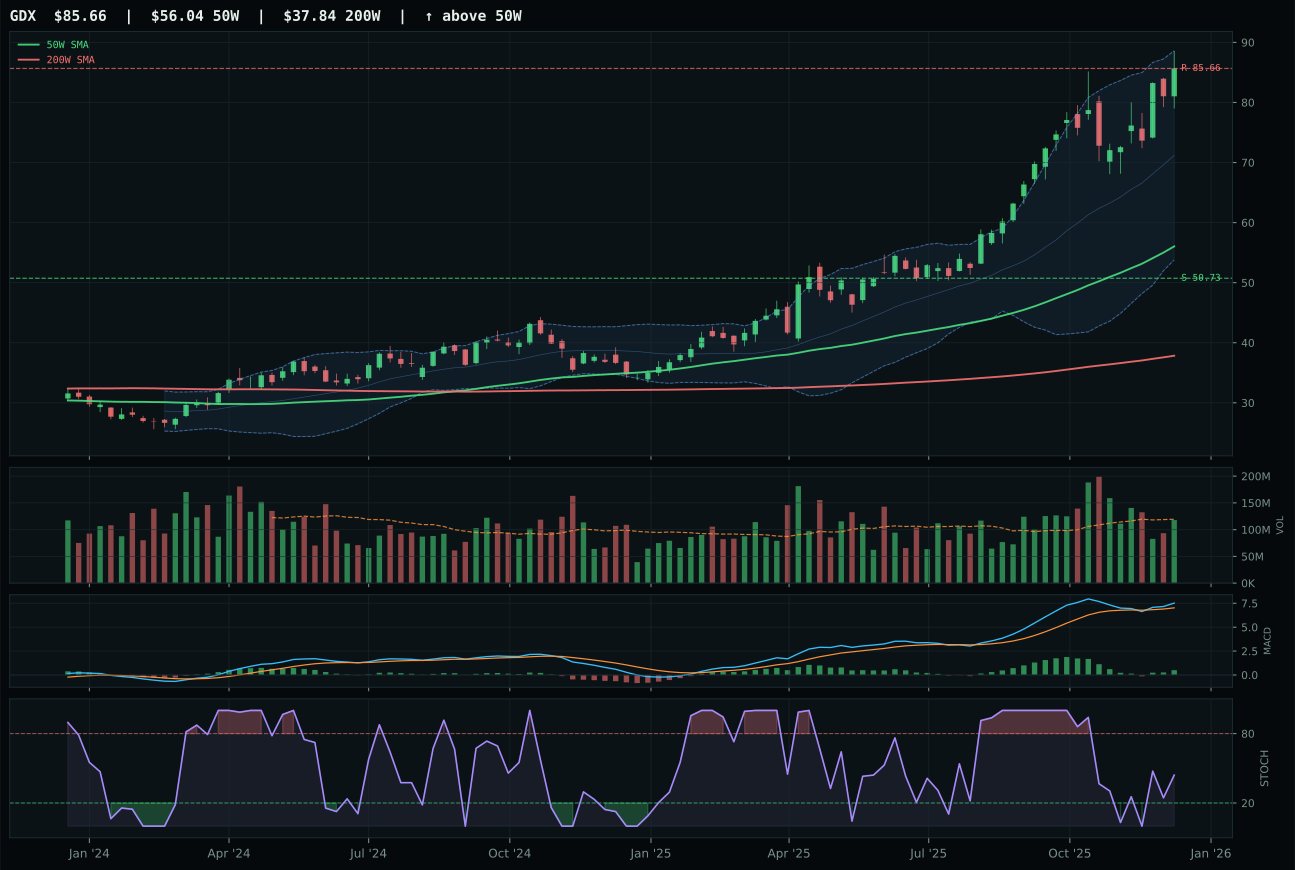
GDX has a vertical extension profile with 19.1% 13-week relative strength versus SPY.
A failed hold above support would weaken the setup.
Actionable but governed by invalidation levels.
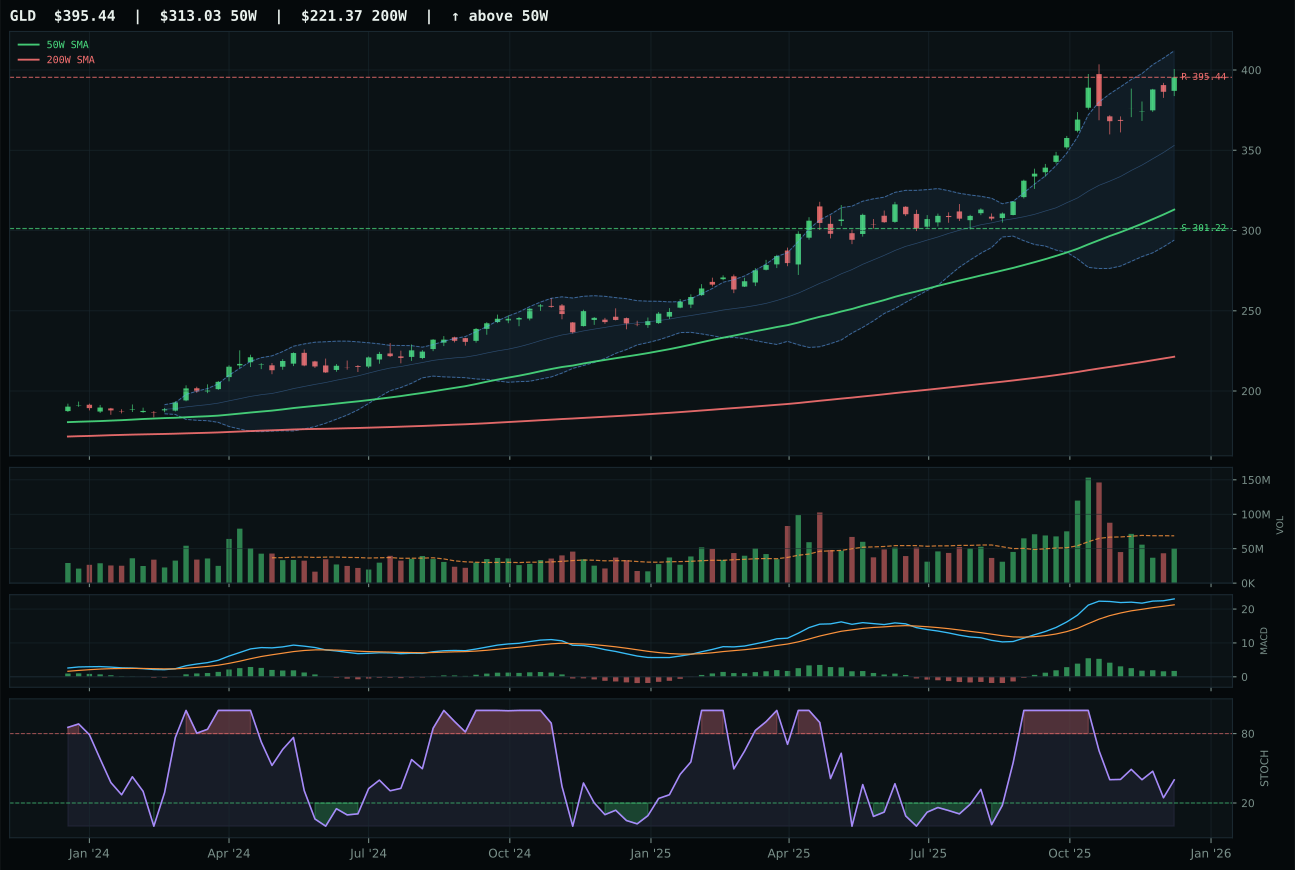
GLD has a vertical extension profile with 14.2% 13-week relative strength versus SPY.
A failed hold above support would weaken the setup.
Actionable but governed by invalidation levels.
SLV dominates the category with perfect scores (100.0) in trend, momentum confirmation, volume-price confirmation, and persistence—metrics that reflect genuine accumulation at scale, not retail euphoria. The 46.3% 13-week return and 42.6% SPY-relative strength mark an outlier move, yet the 1.79x volume at 20-week average (accumulation/confirmation level) tells the structural story: professional money is buying silver as monetary hedge and industrial deflation insurance. GDX trails by just 0.6 points on the category score, but its neutral volume participation and inferior risk-reward (39.1 versus 44.0) reveal the technical difference: SLV's move is being institutionally validated, while GDX's 19.1% SPY-relative strength reflects miner leverage without the same conviction floor. MACD is bullish/improving for both, stochastic RSI is overbought for both, yet SLV's cleanliness score of 75.0 versus GDX's 70.4 shows silver is the cleaner breakout. The 23.5% category-relative outperformance versus 0.0% for GDX represents a decisive vote by the market for the physical asset over the leveraged play.
Precious Metals earned the 20% top-2 allocation because its 77.3 category score reflects genuine monetary hedge demand amid disinflation, and the macro regime is actively supportive. Monetary hedge bid is active at +14 points, metals scarcity at +7, and disinflation itself scores +8—a rare triplet of tailwinds. The category-level macro fit of 74.0 is the highest in the portfolio, justifying the 20% weight. SLV's perfect momentum confirmation and volume-price sponsorship mean this is not a speculative tail but an institutional repositioning into hard assets as real rates compress and currency debasement fears mount. Liquidity stress (-5) is a minor headwind, but the move's durability rests on the disinflation narrative holding and central banks maintaining accommodative stances. The 20% allocation reflects conviction that precious metals will outpace equities in a low-inflation, low-growth environment and serve as ballast against credit stress escalation. This category ranks second only to Industrial Metals in category-level macro alignment.
Industrial Metals — COPX
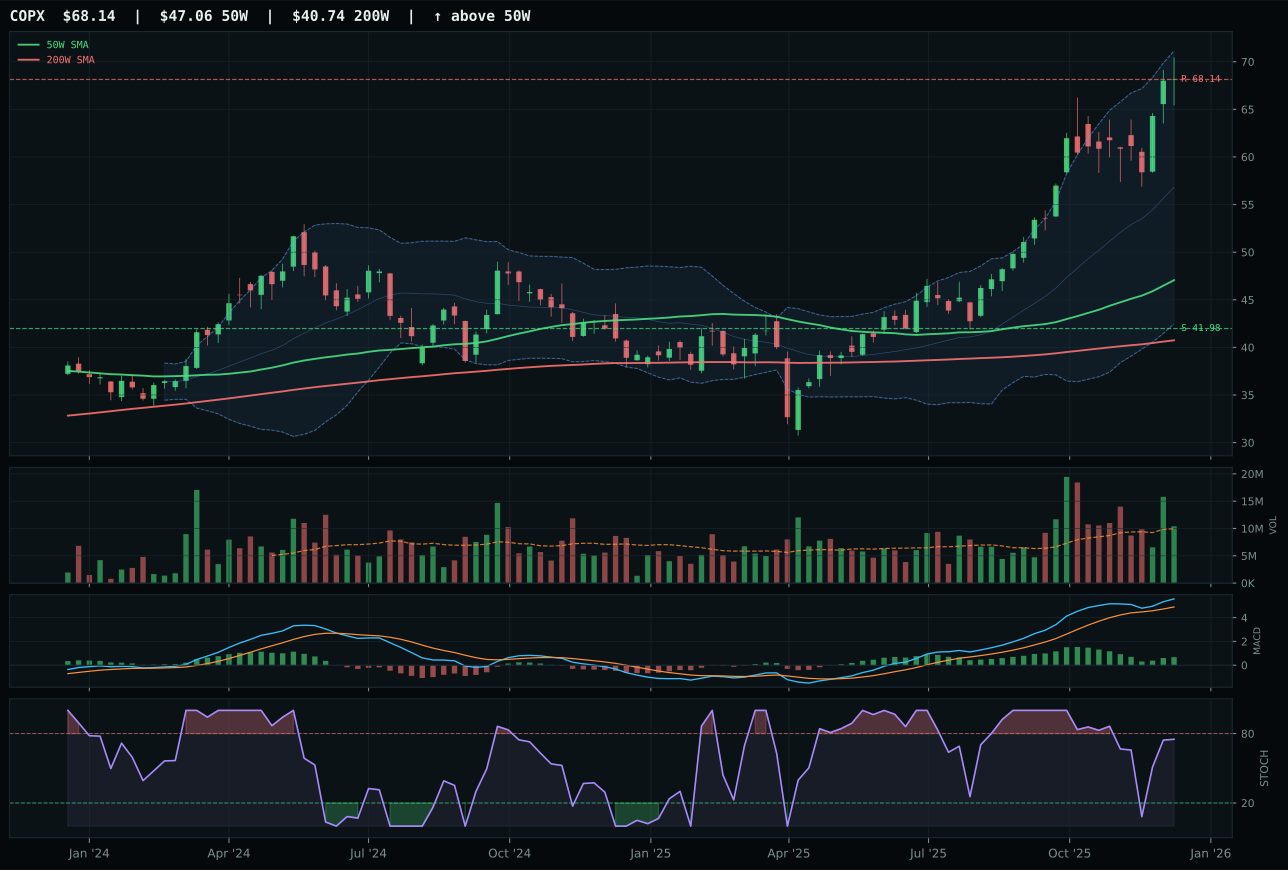
COPX has a vertical extension profile with 23.9% 13-week relative strength versus SPY.
A failed hold above support would weaken the setup.
Actionable but governed by invalidation levels.
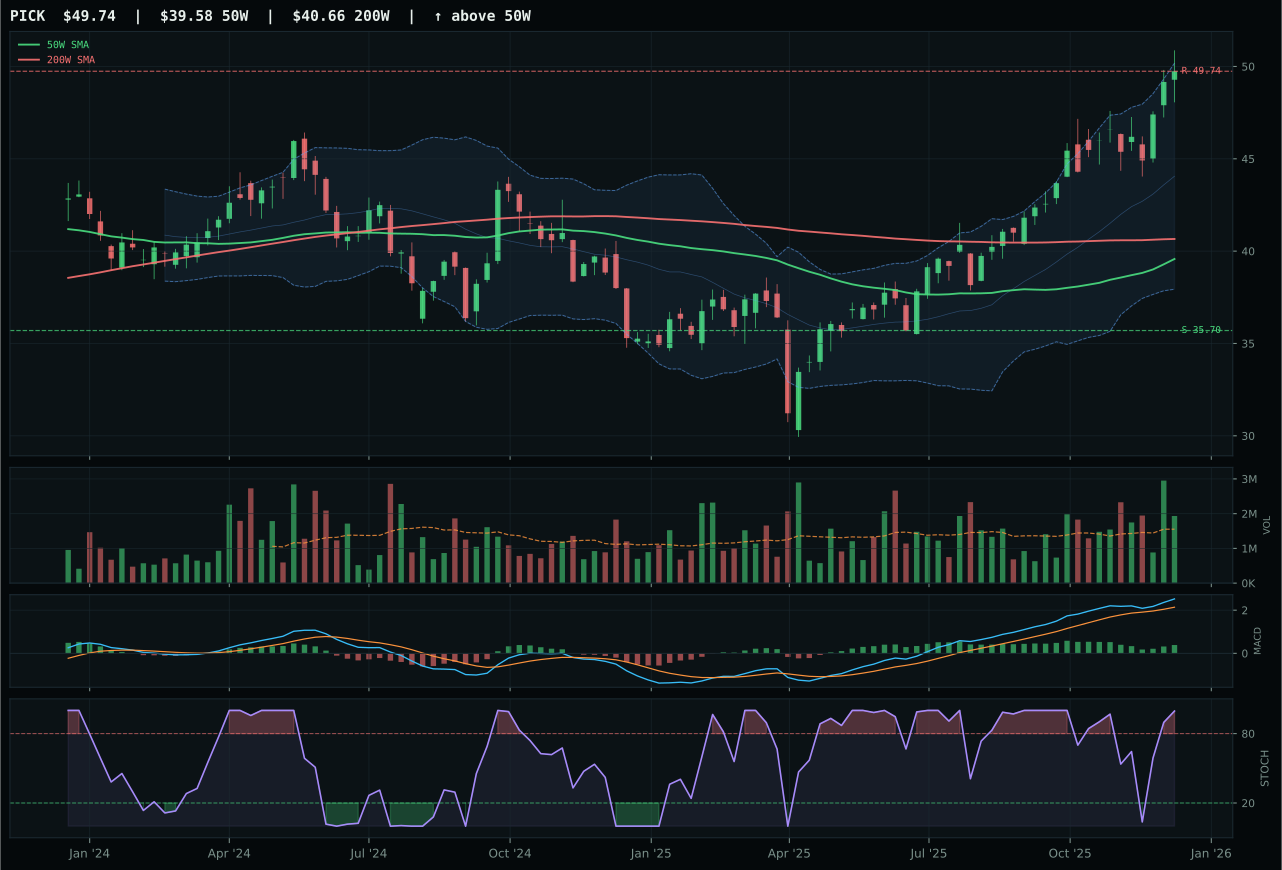
PICK has a vertical extension profile with 13.7% 13-week relative strength versus SPY.
A failed hold above support would weaken the setup.
Actionable but governed by invalidation levels.
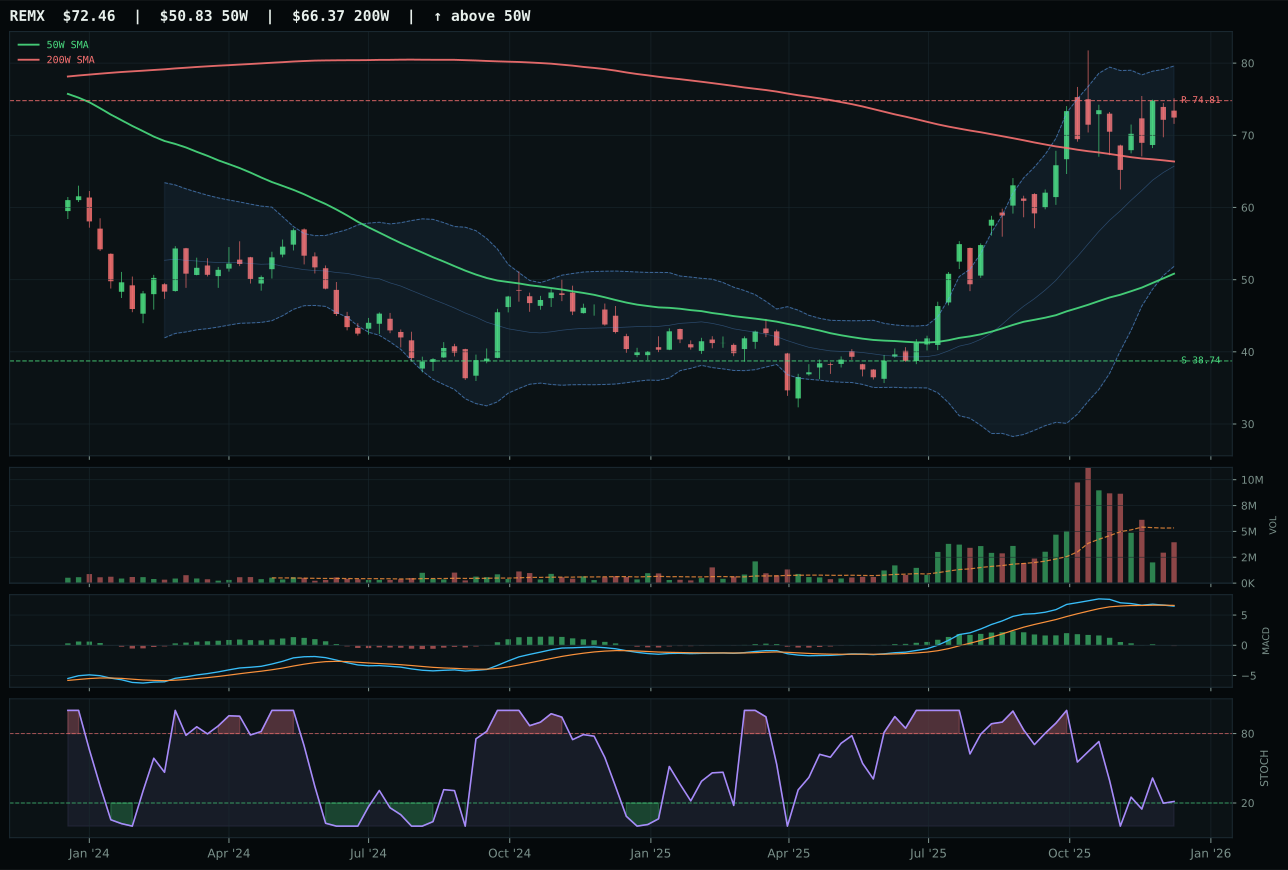
REMX has a vertical extension profile with 18.7% 13-week relative strength versus SPY.
A failed hold above support would weaken the setup.
Actionable but governed by invalidation levels.
COPX wins a close race over PICK because timing and MACD momentum divergence favor the patient entry. Both are in vertical extensions (44.8% above 50W for COPX, similar range for PICK), but COPX's 48 timing score versus PICK's 37 reveals that COPX's bullish-but-flattening MACD is preferable to PICK's bullish-and-improving signal when stochastic RSI sits at overbought (0.75 versus PICK's even higher 0.89). The category-relative strength gap is decisive: COPX scores 5.2% advantage while PICK lags at -5.0%, suggesting copper's structural scarcity narrative is outpacing diversified mining breadth in institutional conviction. Volume tells the same story: COPX neutral at 1.04x 20W average versus PICK's above-average participation, implying COPX is being accumulated by systematic buyers while PICK attracts retail tail-end entry. Both show 100.0 momentum confirmation and 27.6% versus 17.4% 13-week returns, yet COPX's -1.2-point score deficit to PICK on the category level is reversed by the allocator's choice of COPX as representative, signaling that copper scarcity messaging is outweighing miner leverage at this juncture.
Industrial Metals earned the second 20% top-2 allocation because its 70.2 category score and 65.0 macro fit reflect consensus conviction that metals scarcity (+14 points) and commodity breadth positive (+10) are structural, not cyclical, features. Real asset sponsorship (+6) adds a third pillar, making this the only category with three major macro tailwinds. COPX's neutral volume participation is actually a virtue here—it signals that the move is being driven by value investors and scarcity narratives, not momentum chasers. Liquidity stress (-8) and credit stress (-7) are present headwinds, but they pale against the 44.8% extension and 23.9% SPY-relative strength that mark copper as a consensus alternative to equities. The allocator paired the two metals categories (Precious at 20%, Industrial at 20%) to create a 40% hard-asset sleeve, betting that disinflation drives down real rates enough to sustain both monetary hedge (silver/gold) and industrial scarcity (copper) demand. COPX's bullish-but-flattening MACD warns that timing is stretched, but the position size reflects medium-term allocation, not short-term entry precision.
AI — BOTZ
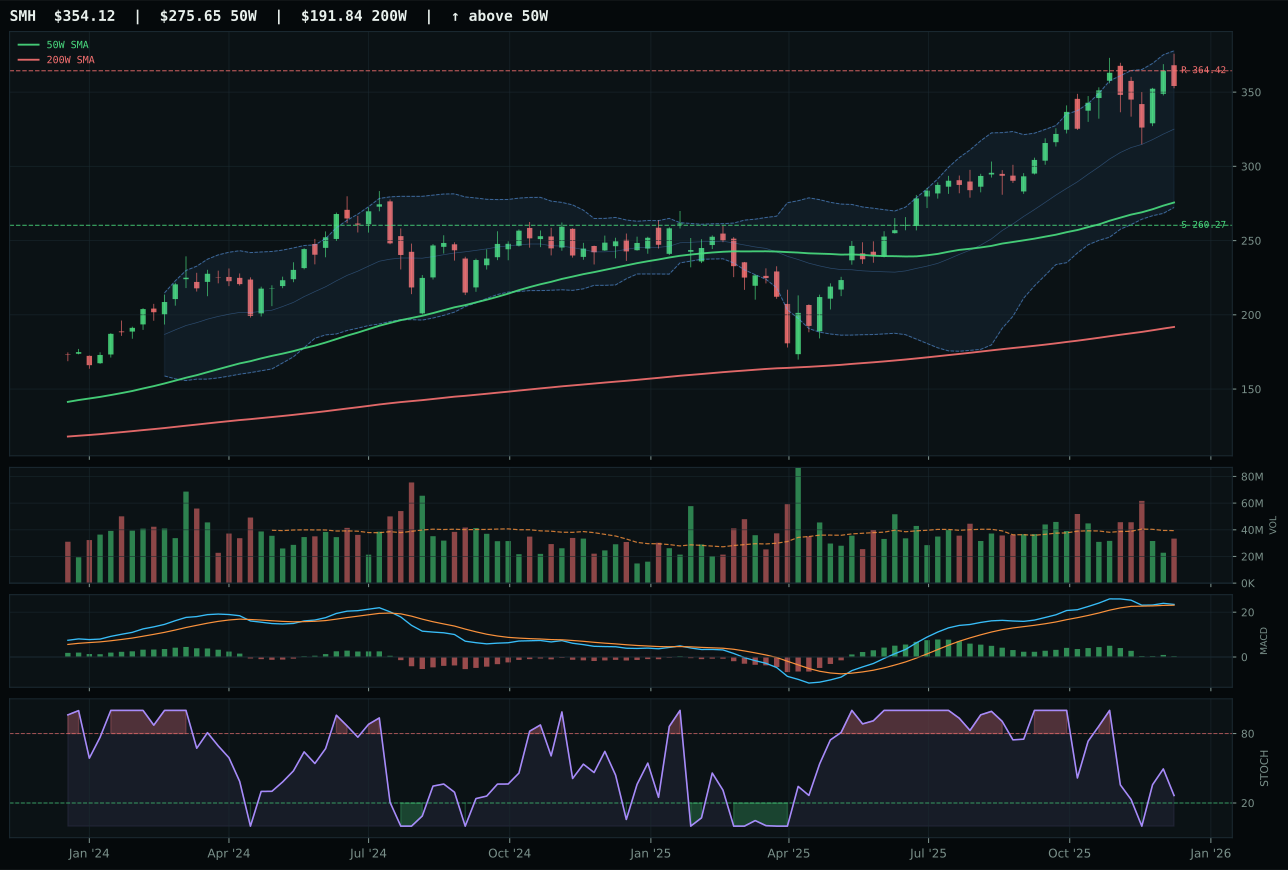
SMH has a vertical extension profile with 12.7% 13-week relative strength versus SPY.
A failed hold above support would weaken the setup.
Actionable but governed by invalidation levels.
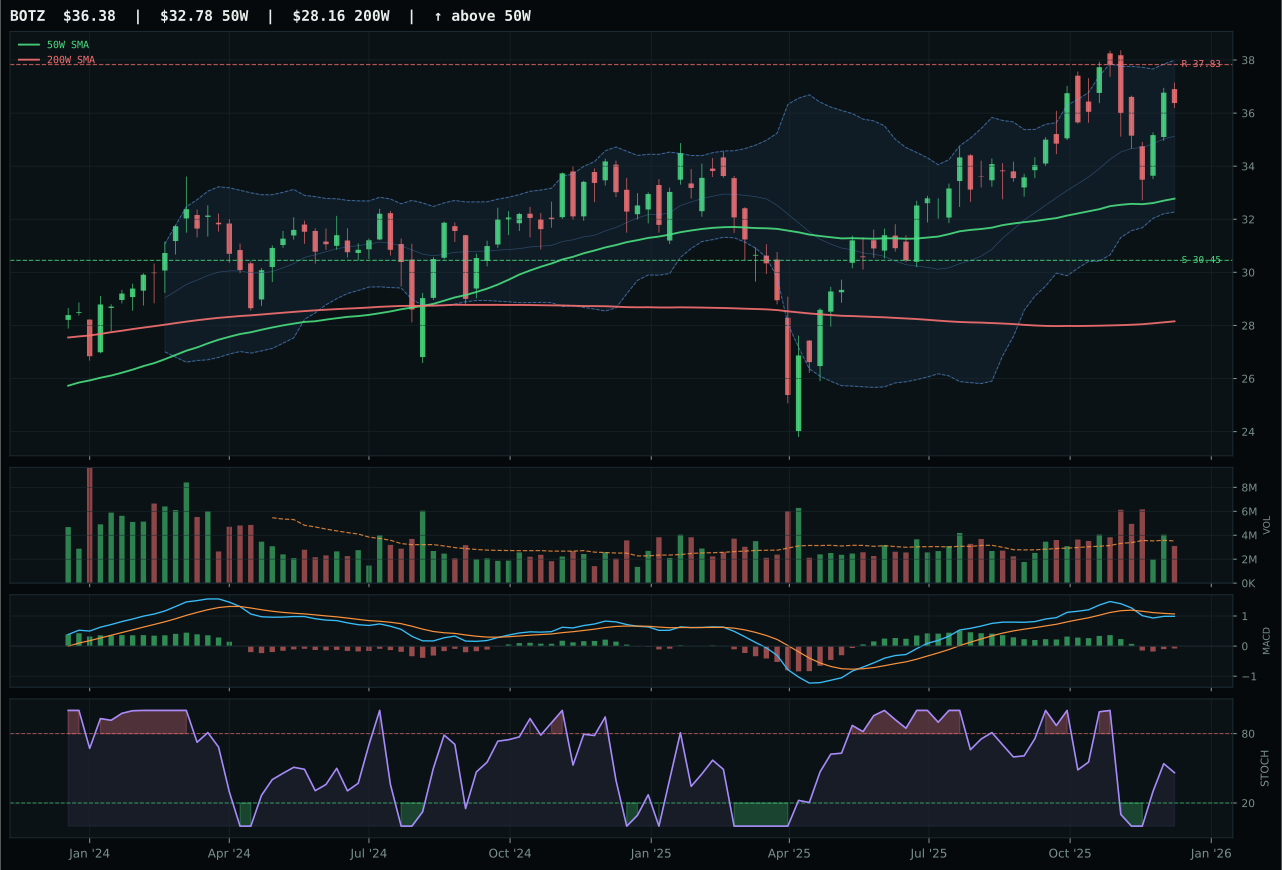
BOTZ has a neutral structure profile with 3.2% 13-week relative strength versus SPY.
A failed hold above support would weaken the setup.
Actionable but governed by invalidation levels.
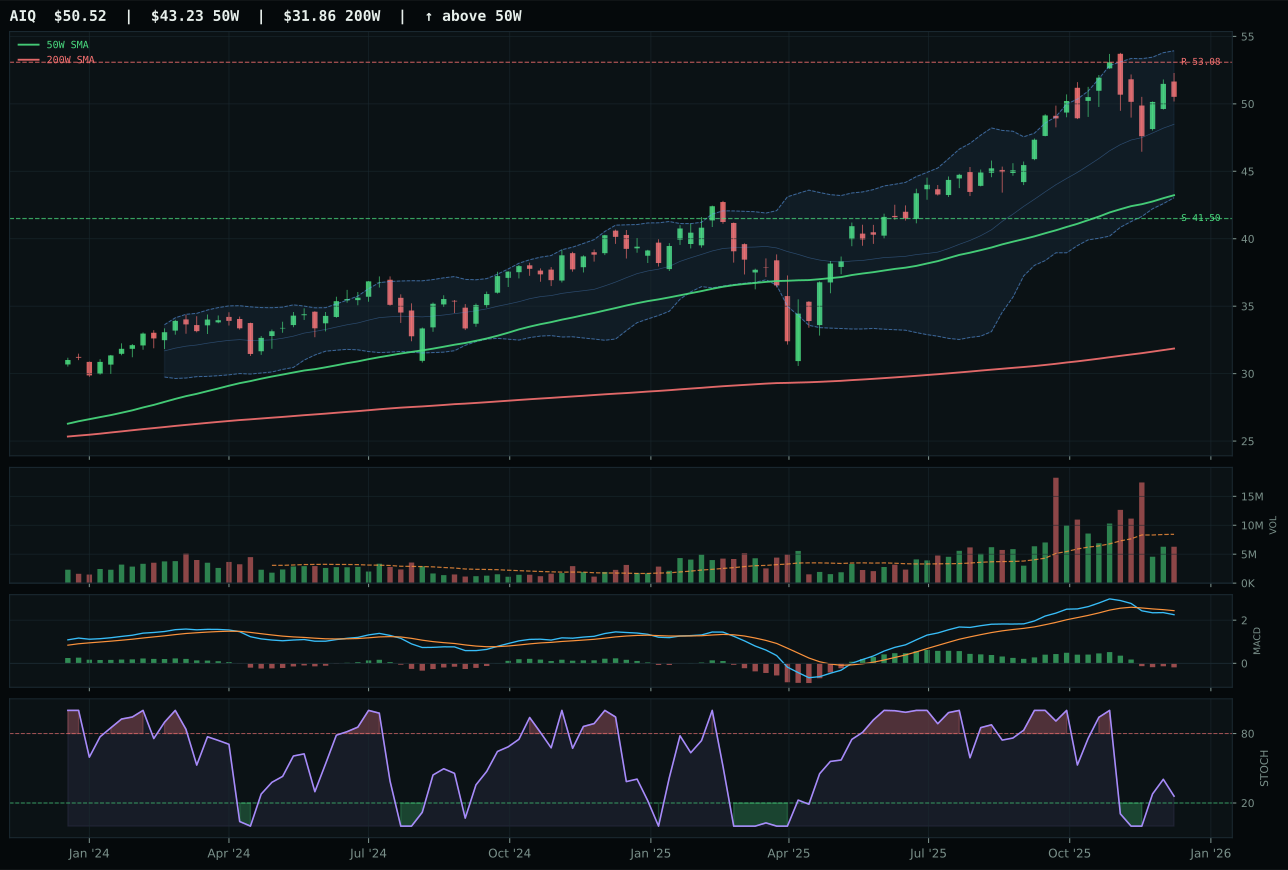
AIQ has a vertical extension profile with 3.0% 13-week relative strength versus SPY.
A failed hold above support would weaken the setup.
Actionable but governed by invalidation levels.
BOTZ wins despite SMH's superior 12.7% RS versus SPY and bullish-but-flattening MACD because timing and risk asymmetry favor the robotics exposure. SMH sits 28.5% above its 50-week MA with thin volume participation, creating an unfavorable 56 timing score; BOTZ trades just 11% above its 50W with neutral volume and captures a 78 timing score, implying room for consolidation rather than immediate vulnerability. The 13-week returns tell a more balanced story—BOTZ's 6.9% versus SMH's 16.4%—but that differential reflects SMH's extension risk, not relative weakness. Both carry neutral volume, but BOTZ's lower category-relative strength (0.0% versus 9.5%) and less stretched Fibonacci position mean the entry risk has been priced more fairly. The 4.4-point score gap between BOTZ and SMH narrows when you account for BOTZ's superior risk-reward geometry: 19.5% downside cushion versus SMH's steeper 36.2% drop to support.
AI received 10% allocation despite a respectable 52.2 category score because both top-2 categories scored higher and the macro regime penalizes pure-growth cyclicality. AI growth sponsorship is active at +14 points, yet liquidity stress (-12) and credit stress (-8) create headwinds that shift the risk-reward calculus. The category-level macro fit of 59.0 is solid, but SMH's stronger technical evidence (69.6 versus BOTZ's 53.3) was offset by weaker macro-narrative fit (58.0 versus 47.0), revealing a tension: semiconductor leadership works on technicals but less convincingly in a disinflation environment where growth rates face revisions. BOTZ's robotics and physical AI angle sits in the middle ground—not as sensitive to multiple compression yet exposed to capex cycles tied to real asset sponsorship. The 10% slot acknowledges conviction in AI's long-term relevance while respecting the macro regime's current bias toward hard assets and monetary safety.
Utilities & Infrastructure — PAVE
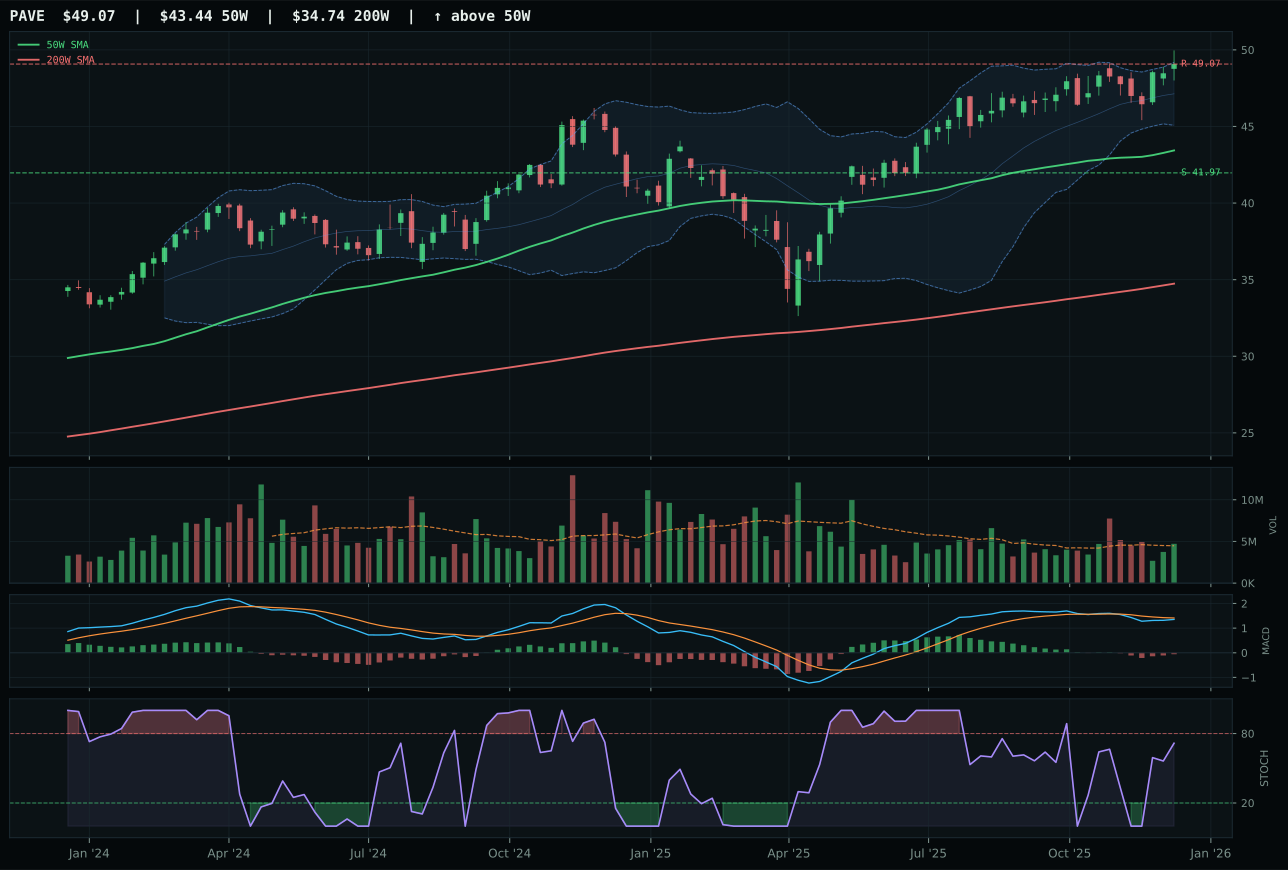
PAVE has a neutral structure profile with 1.8% 13-week relative strength versus SPY.
A failed hold above support would weaken the setup.
Actionable but governed by invalidation levels.
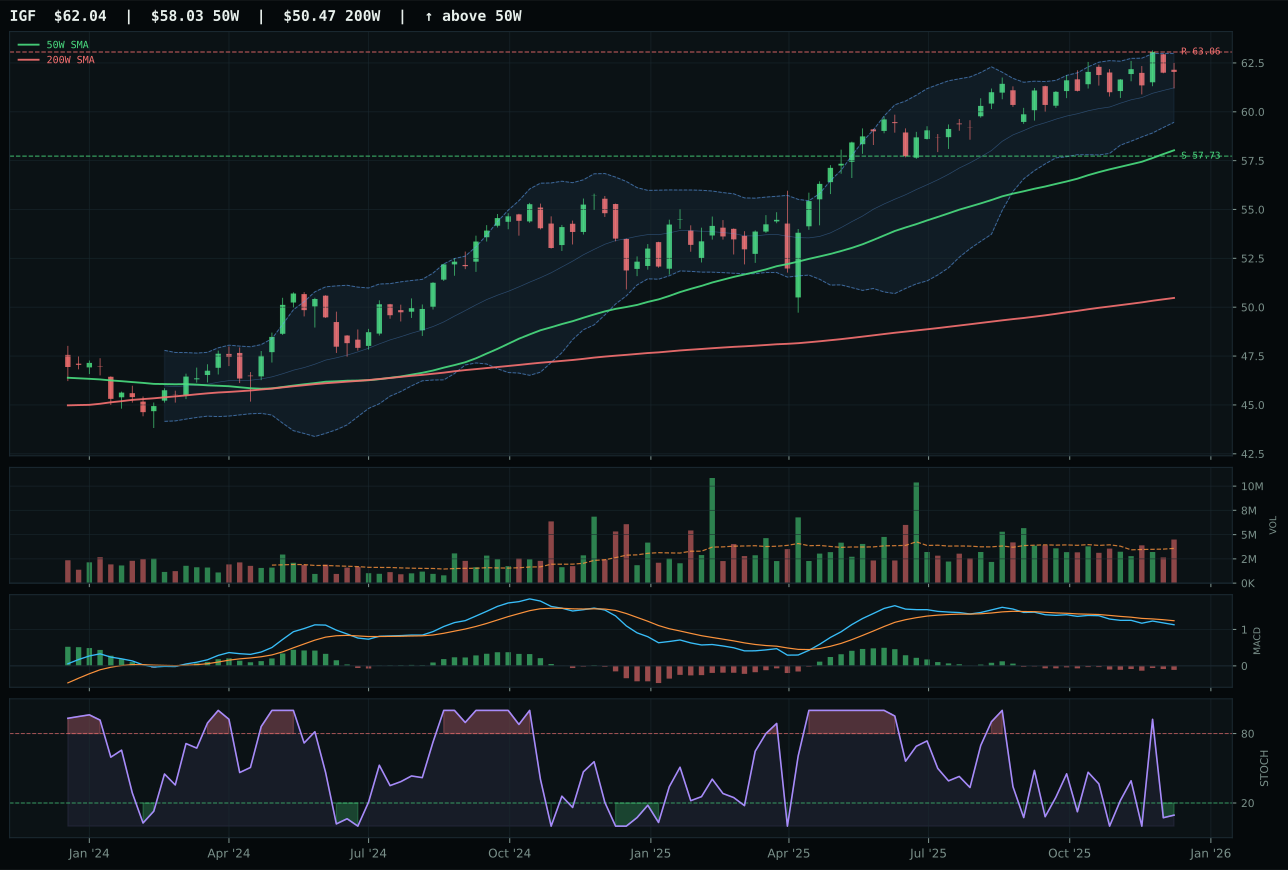
IGF has a neutral structure profile with -2.1% 13-week relative strength versus SPY.
A failed hold above support would weaken the setup.
Actionable but governed by invalidation levels.
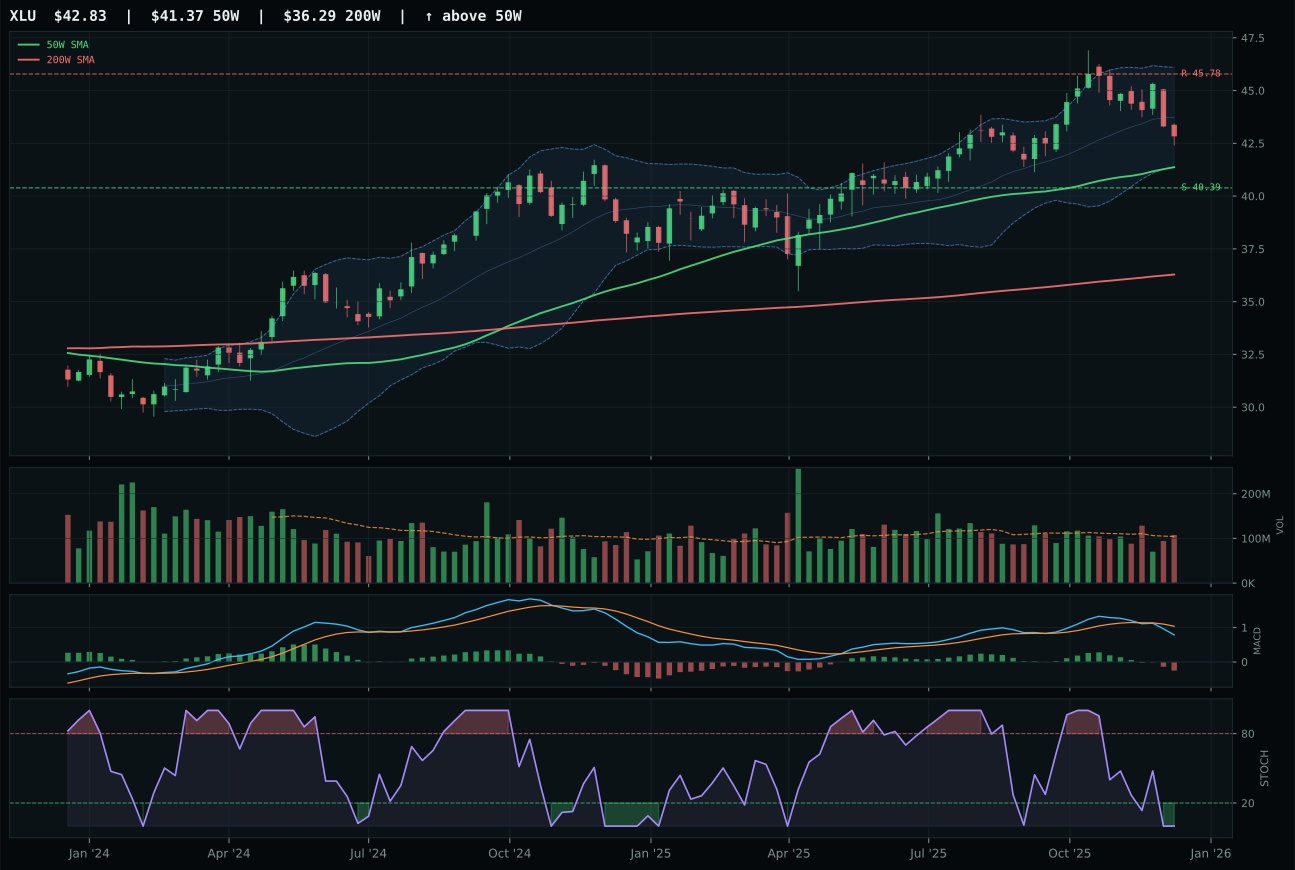
XLU has a neutral structure profile with -3.5% 13-week relative strength versus SPY.
A failed hold above support would weaken the setup.
Actionable but governed by invalidation levels.
PAVE wins the category on timing and momentum balance, scoring 75 on timing versus IGF's weaker setup, driven by PAVE's rising mid-zone stochastic RSI (0.72) positioning superior to IGF's oversold turn-up condition. Both sit near 52W highs with disinflation tailwinds, but PAVE's 95.7 trend score and 73.8 momentum confirmation show more consistent risk-adjusted strength than IGF's 79 trend and 42 momentum. The 13-week returns are similarly underwhelming (5.5% for PAVE, 1.6% for IGF), yet PAVE's 3.9% category-relative strength versus IGF's 0.0% reveals that domestic infrastructure is gaining ground on global infrastructure income. Both trade with neutral and above-average volume respectively, but PAVE's 1.05x participation is selective institutional buying, while IGF's above-average participation suggests mixed conviction. The 8.3-point category gap reflects PAVE's structural cleanliness (72.4 versus 41 for risk-reward), making domestic capex beta the preferred expression when the macro regime supports infrastructure through disinflation.
Utilities & Infrastructure earned 10% allocation because its 49.5 category score and 62.0 macro fit reflect disinflation's positive impact on long-duration utility and capex-driven assets. Disinflation pressure (+6) and the broader disinflation regime (+7) create a tailwind that few other categories enjoy, making this category counter-cyclical ballast in a growth-challenged environment. PAVE's domestic capex angle is particularly well-positioned for a regime where government stimulus and infrastructure investment become countercyclical policy tools. Liquidity stress is minimal (-3), and risk appetite descriptors are slightly negative (-2), suggesting that this category is isolated from the worst credit and liquidity risks. The 10% allocation reflects confidence that PAVE will deliver steady mid-to-high single-digit returns with low volatility as disinflation persists, making it a defensive core holding. The timing score of 75 (not peak overbought) and rising stochastic RSI pattern suggest room for accumulation before resistance at 49.07, offering the allocator a window for position additions if near-term pullbacks occur. This category ranks third in macro fit, justifying its slot as a diversifying ballast.
Technology — IGV
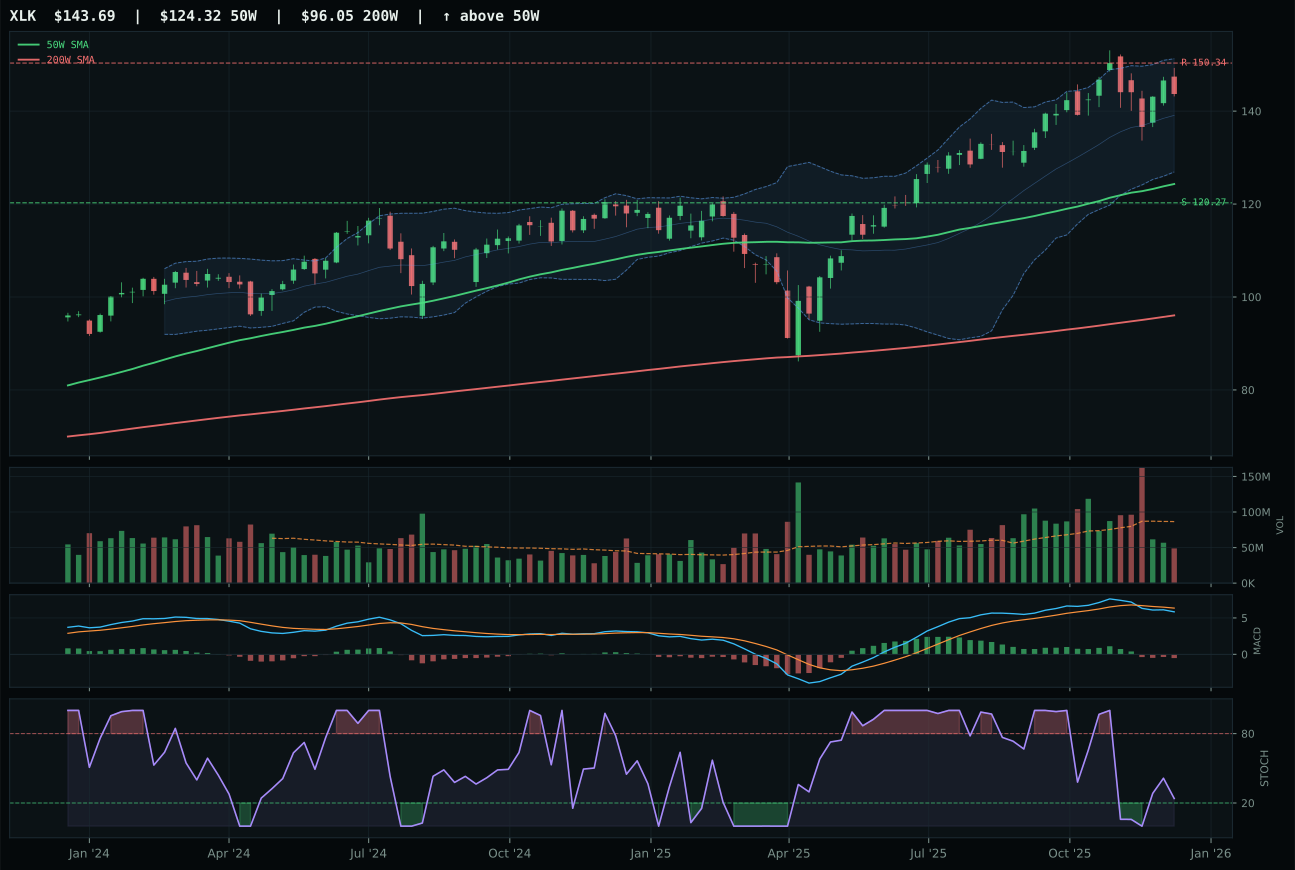
XLK has a vertical extension profile with 2.4% 13-week relative strength versus SPY.
A failed hold above support would weaken the setup.
Actionable but governed by invalidation levels.
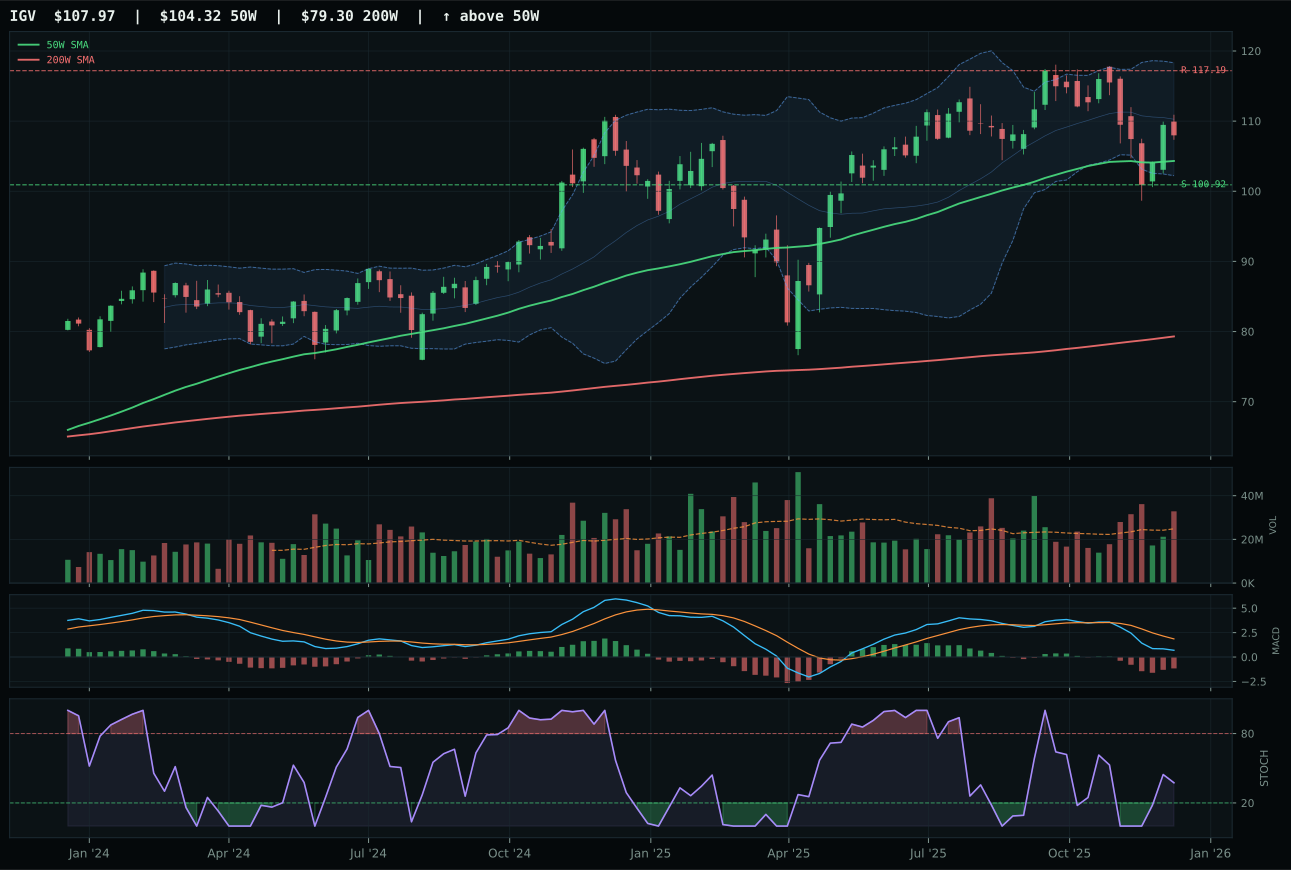
IGV has a neutral structure profile with -7.0% 13-week relative strength versus SPY.
A failed hold above support would weaken the setup.
Actionable but governed by invalidation levels.
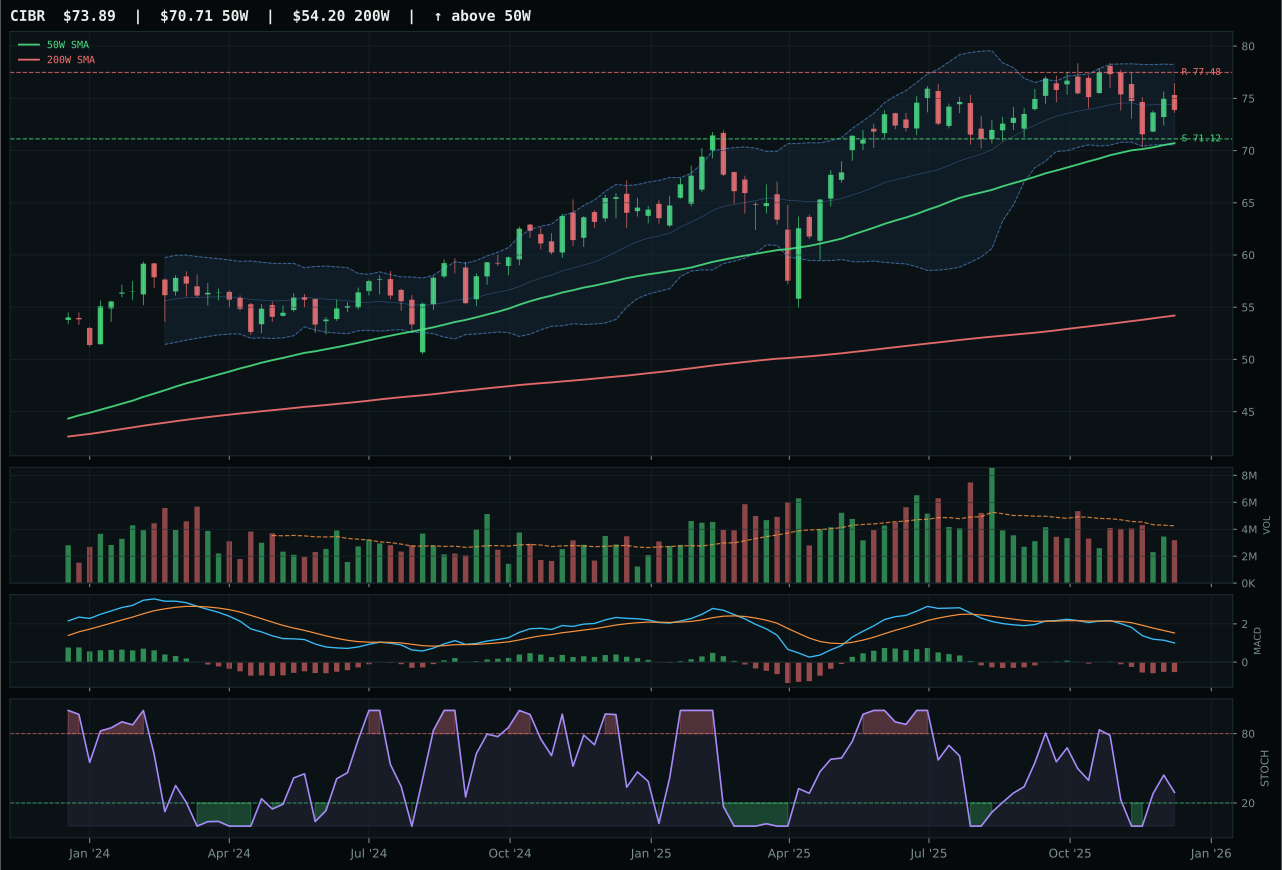
CIBR has a pullback into support profile with -5.1% 13-week relative strength versus SPY.
A failed hold above support would weaken the setup.
Actionable but governed by invalidation levels.
IGV wins the category on timing and risk-reward discipline rather than momentum strength. Its 3.5% distance from the 50-week moving average and above-average volume participation at 1.32x the 20-week average signal a setup where new money is entering at reasonable entry levels, not chasing vertical extension. The stochastic RSI sits at 0.37 in the rising mid-zone, and MACD remains bearish/weakening—conditions that penalize the runner-up XLK, which trades at 15.6% above its 50W and carries only thin participation despite superior 13-week relative strength of 2.4%. IGV's negative 1.9% category-relative strength matters less than the structural cleanliness it offers: neutrality in setup, 33.3 compression score, and a 7.0% downside cushion to support versus just 7.9% upside to resistance. XLK's vertical extension and 6.0-point score deficit reflect the allocator's preference for entry quality over backward-looking momentum when macro headwinds persist.
Technology earned 10% allocation because its 46.1 category score placed it outside the top two, but the 62/38 weighting of technical evidence versus macro fit reveals a portfolio functioning as a valuation floor rather than a growth engine. Disinflation helps technology (scoring +7 macro points), yet active credit stress (-9) and liquidity stress (-8) constraints are genuine enough to cap this category's role. IGV's above-average volume confirms that some accumulation is occurring, but the category-level momentum confirmation score of 23.1 and persistence of 39.5 signal that any sustained move requires external macro support. The allocator retains exposure here as a defensive barbell against deflationary scenarios, not as conviction on AI growth or compute leadership. If risk appetite descriptors flip positive or credit stress indicators resolve, this 10% slot could expand.
Nuclear Energy — URNM
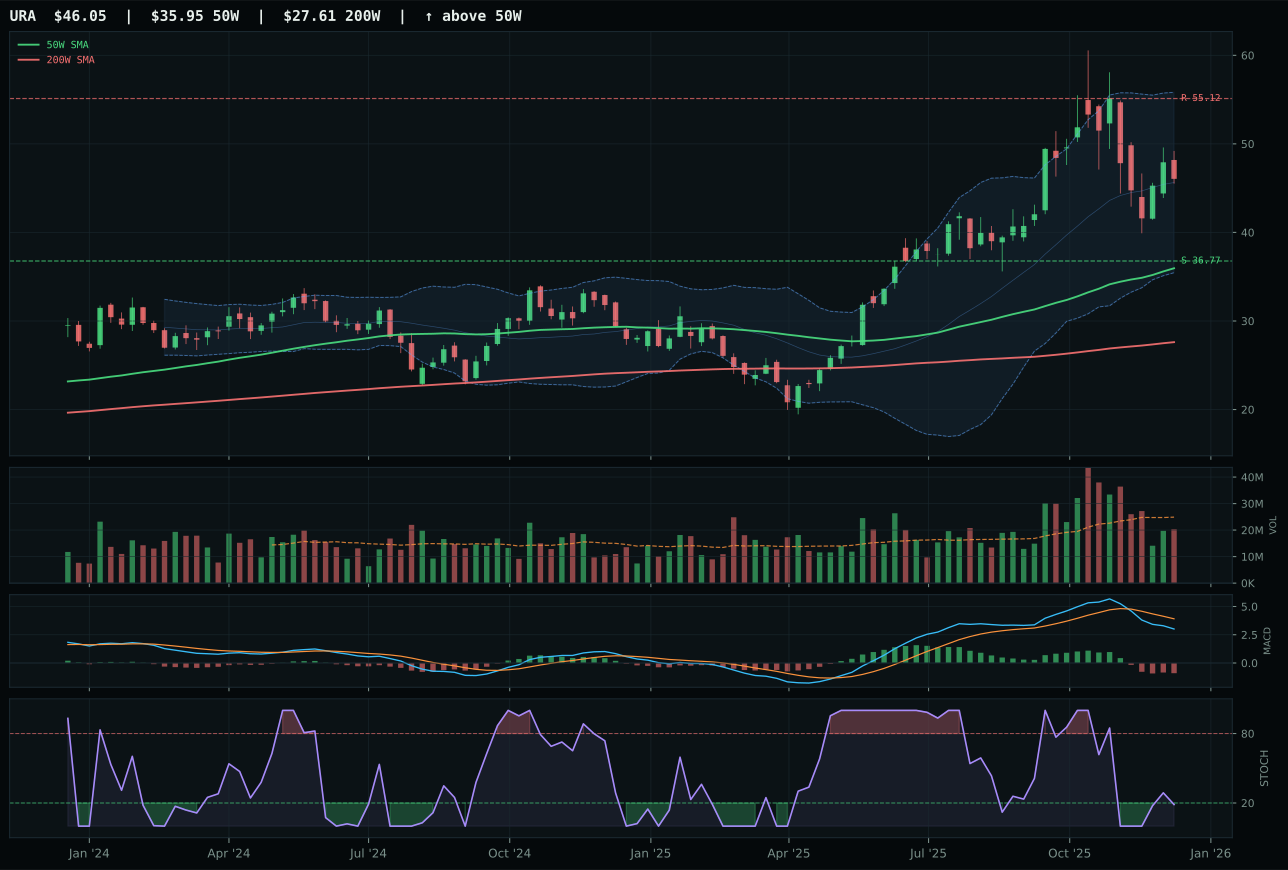
URA has a vertical extension profile with 5.8% 13-week relative strength versus SPY.
A failed hold above support would weaken the setup.
Actionable but governed by invalidation levels.
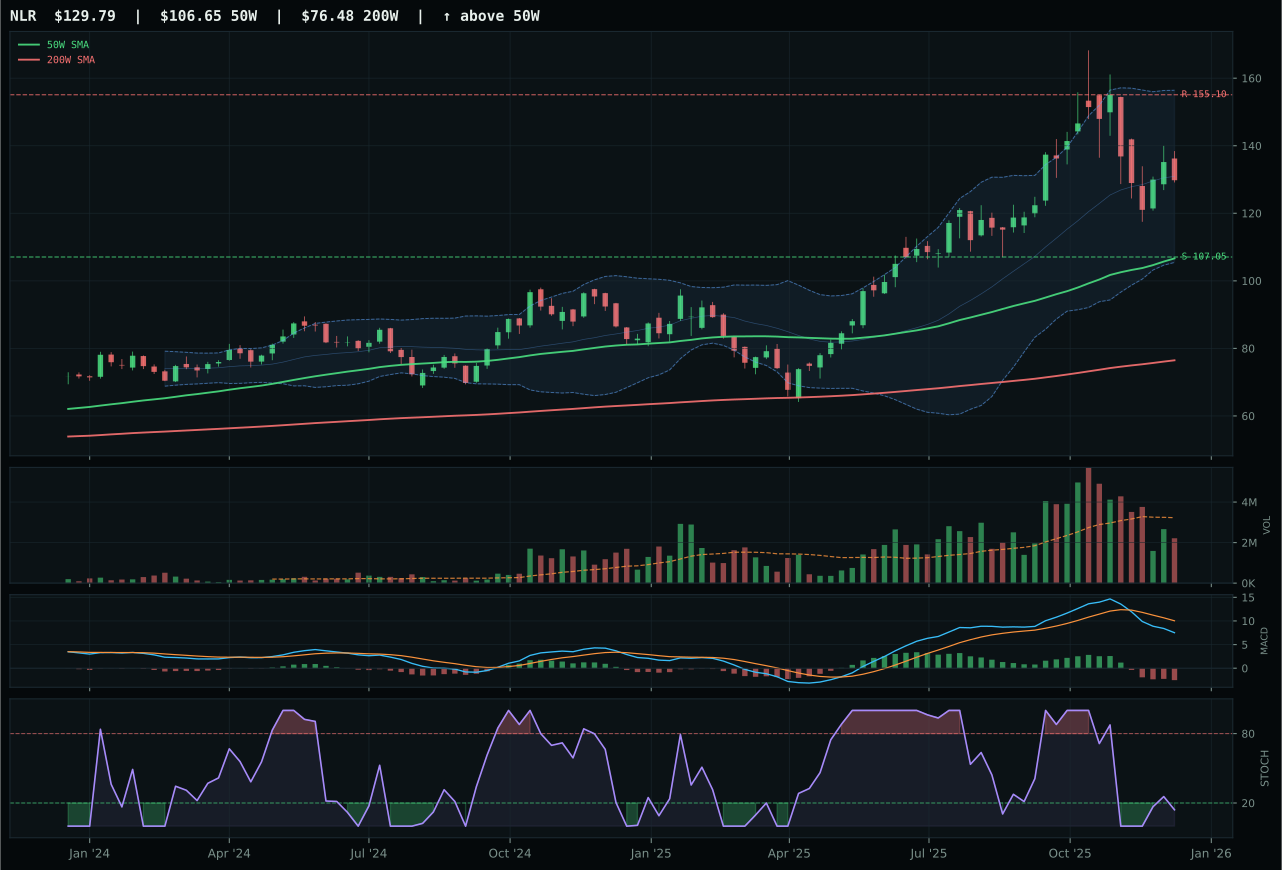
NLR has a vertical extension profile with 2.4% 13-week relative strength versus SPY.
A failed hold above support would weaken the setup.
Actionable but governed by invalidation levels.
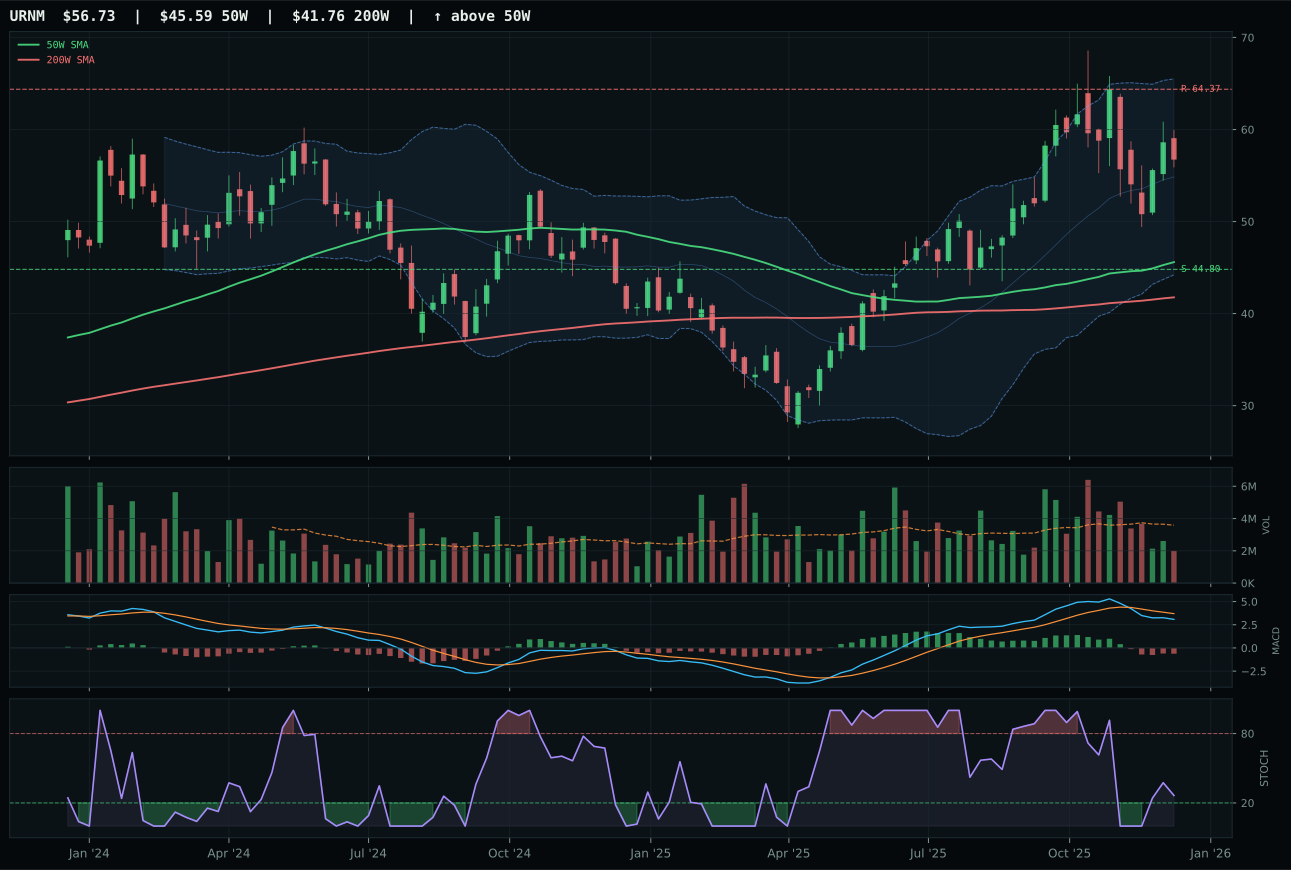
URNM has a vertical extension profile with 5.4% 13-week relative strength versus SPY.
A failed hold above support would weaken the setup.
Actionable but governed by invalidation levels.
URNM wins on stochastic RSI timing despite sharing the same bearish-and-weakening MACD as runner-up URA, earning a 3.9-point category victory that reflects incremental technical edge rather than conviction. URNM's stochastic RSI at 0.26 (rising mid-zone) versus URA's oversold turn-up positioning favors URNM's intermediate momentum structure—there is more upside risk in URA's extreme reading. Both trade in vertical extensions (24.4% for URNM, similar for URA), both show 5.4% and 5.8% SPY-relative strength respectively, and both suffer from thin volume participation (0.56x for URNM, neutral for URA). The category-relative strength for URNM sits at 0.0% versus URA's 0.4%, a trivial separation. The meaningful difference is setup: URNM's vertical extension with rising stochastic RSI allows for consolidation before potential rejection, while URA's oversold turn-up invites sharp mean-reversion moves that reward early exits. TThe 9.1% versus 9.5% 13-week returns are nearly identical, confirming that URNM's win rests on entry-timing geometry, not fundamental divergence.
Nuclear Energy earned 10% allocation as a real asset diversifier and inflation optionality hedge, though its 43.1 category score and 50.0 macro fit reflect ambiguous regime fit. Real asset sponsorship (+7) and risk appetite positive (+5) are present, but liquidity stress (-7) and credit stress (-5) create offsetting pressures that land the macro case in neutral territory. URNM's thin 0.56x volume participation warns that institutional conviction is light, and the timing score of only 56 reflects how extended the setup is from entry levels. The allocator holds 10% here as a bet that energy transition capex cycles will dominate mid-cycle demand, decoupling uranium from broad commodity cycles. Crucially, this is not a momentum trade—the -11.9% upside to resistance and 56 timing score mean URNM is already priced for significant tailwinds. The position functions as a hedge against both commodity reflation and ESG-driven energy demand reorientation. If credit stress escalates materially, this position would be vulnerable as uranium's leverage to manufacturing capex would compress.
Defense & Aerospace — XAR
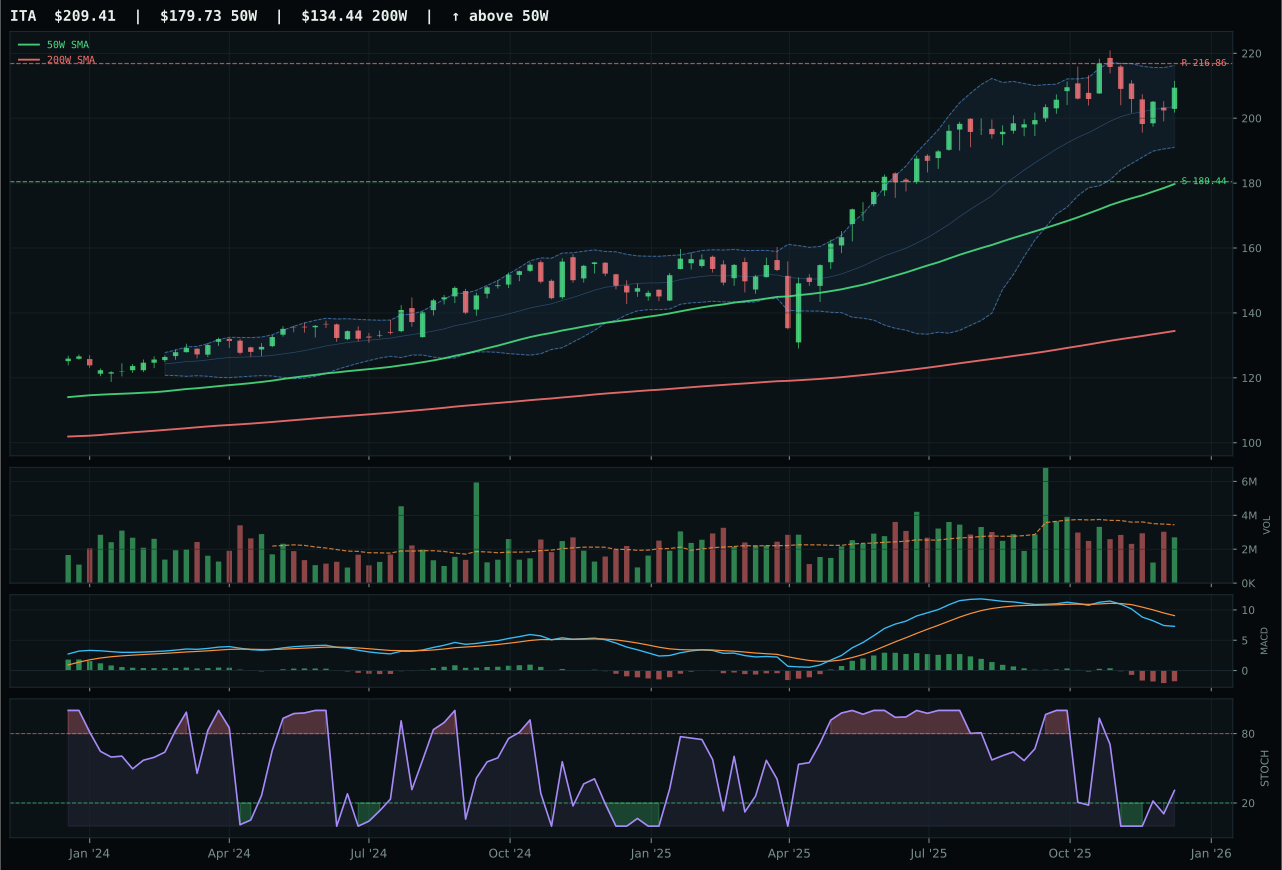
ITA has a vertical extension profile with 1.3% 13-week relative strength versus SPY.
A failed hold above support would weaken the setup.
Actionable but governed by invalidation levels.
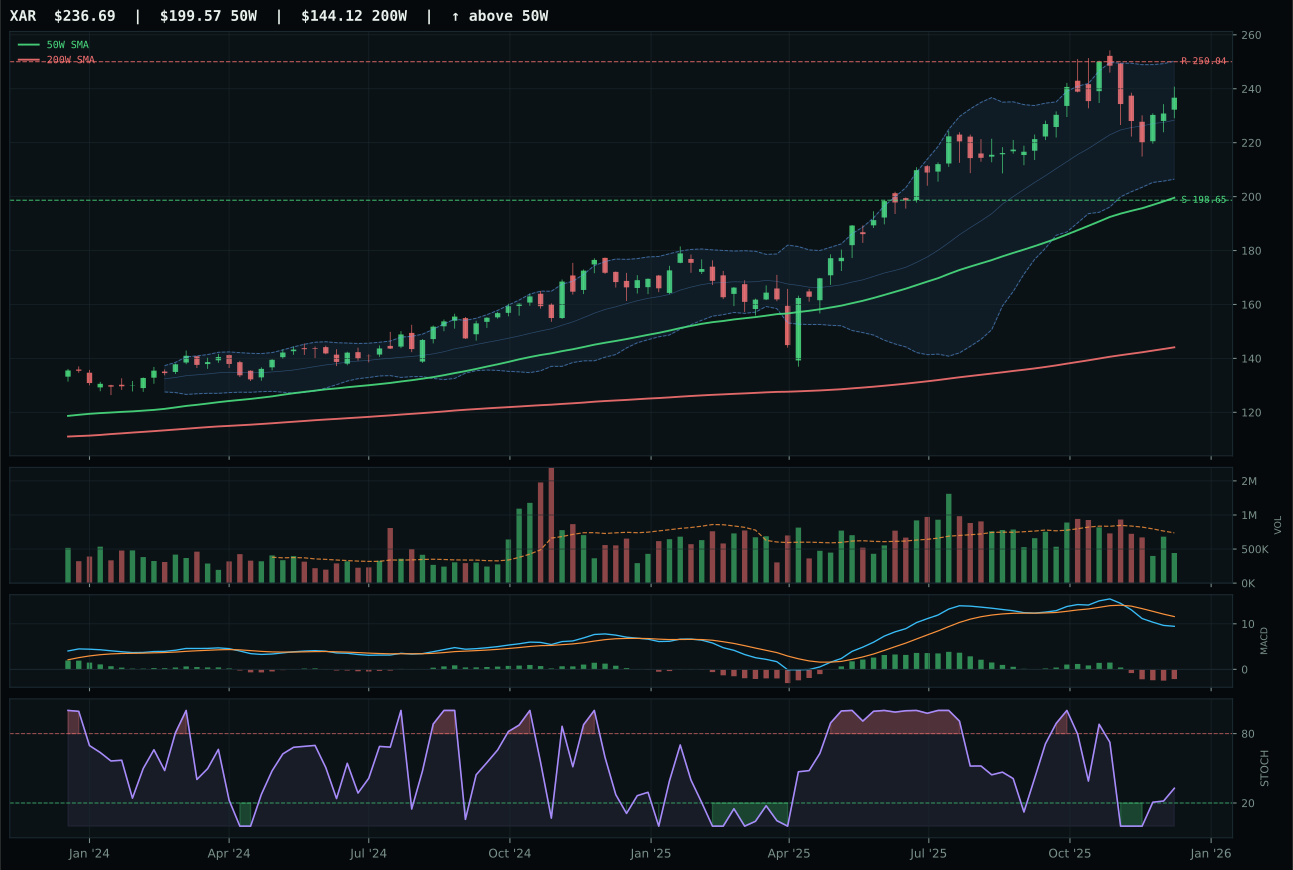
XAR has a vertical extension profile with 3.2% 13-week relative strength versus SPY.
A failed hold above support would weaken the setup.
Actionable but governed by invalidation levels.
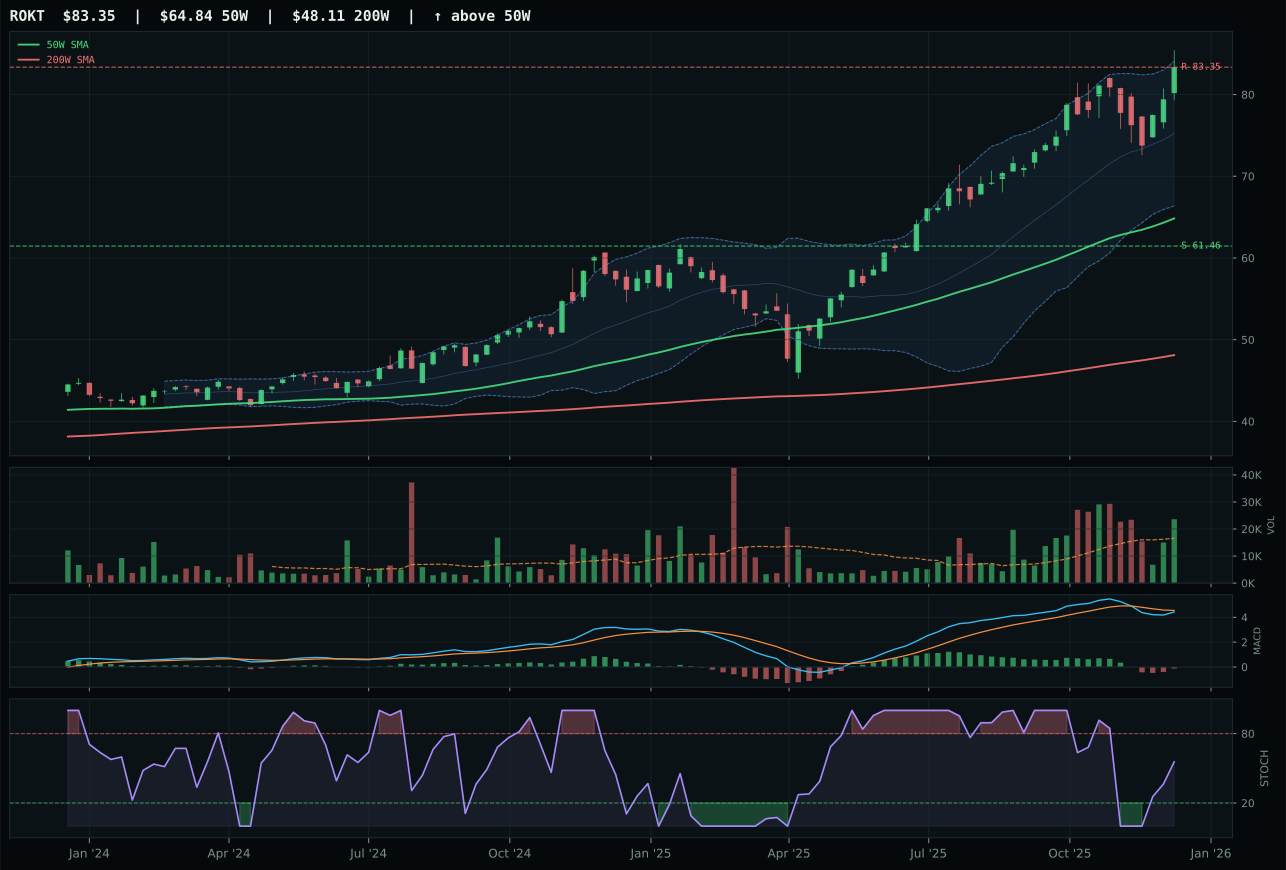
ROKT has a vertical extension profile with 10.5% 13-week relative strength versus SPY.
A failed hold above support would weaken the setup.
Tracked, but not top-2 eligible because: .
XAR wins a tight 2.0-point decision over ITA by delivering consistent RS at zero category-relative strength while ITA lags at -1.9%, despite both sitting in vertical-extension setups. XAR's 6.9% 13-week return and 3.2% SPY-relative strength provide neutral category positioning without conviction, yet that neutrality is the victory condition when thin participation (0.60x 20W average) and a compressed risk-reward environment penalize both contenders. MACD is bearish/weakening for both; stochastic RSI sits at 0.33 for XAR versus a similar placement in ITA. The deciding factor is structural cleanliness: XAR posts 50.0 on the compression score while ITA enters with no category-specific macro descriptor profile, leaving ITA's 48.9 risk-reward score outpaced by XAR's 50.0. Neither setup is compelling on absolute terms—timing scores hover at 56 for XAR and even lower for ITA—but XAR's thin volume confirms that participation is genuinely selective, not a sign of deterioration.
Defense & Aerospace earned 10% as a defensive placeholder within a disinflation regime that offers limited tailwinds for geopolitical risk premia. Its 40.9 category score reflects a fundamental problem: the macro environment is neutral to slightly negative for this exposure. Real asset sponsorship is a light positive (+3), but liquidity stress (-4) and credit stress (+2, a rare positive) create offsetting pressures. XAR's 86.9 trend score and 3.2% SPY RS suggest the sector is grinding higher with minimal enthusiasm, a pattern consistent with index participation rather than tactical demand. The allocator holds this 10% slot as ballast—not because the setup is compelling but because aerospace and defense represent uncorrelated optionality should geopolitical regimes shift. The category's low macro fit score of 51.0 is honest: this is a tactical hold, not a conviction bet, and the 10% allocation will contract if risk appetite tightens further or if the disinflation narrative is challenged.
Traditional Energy — XLE
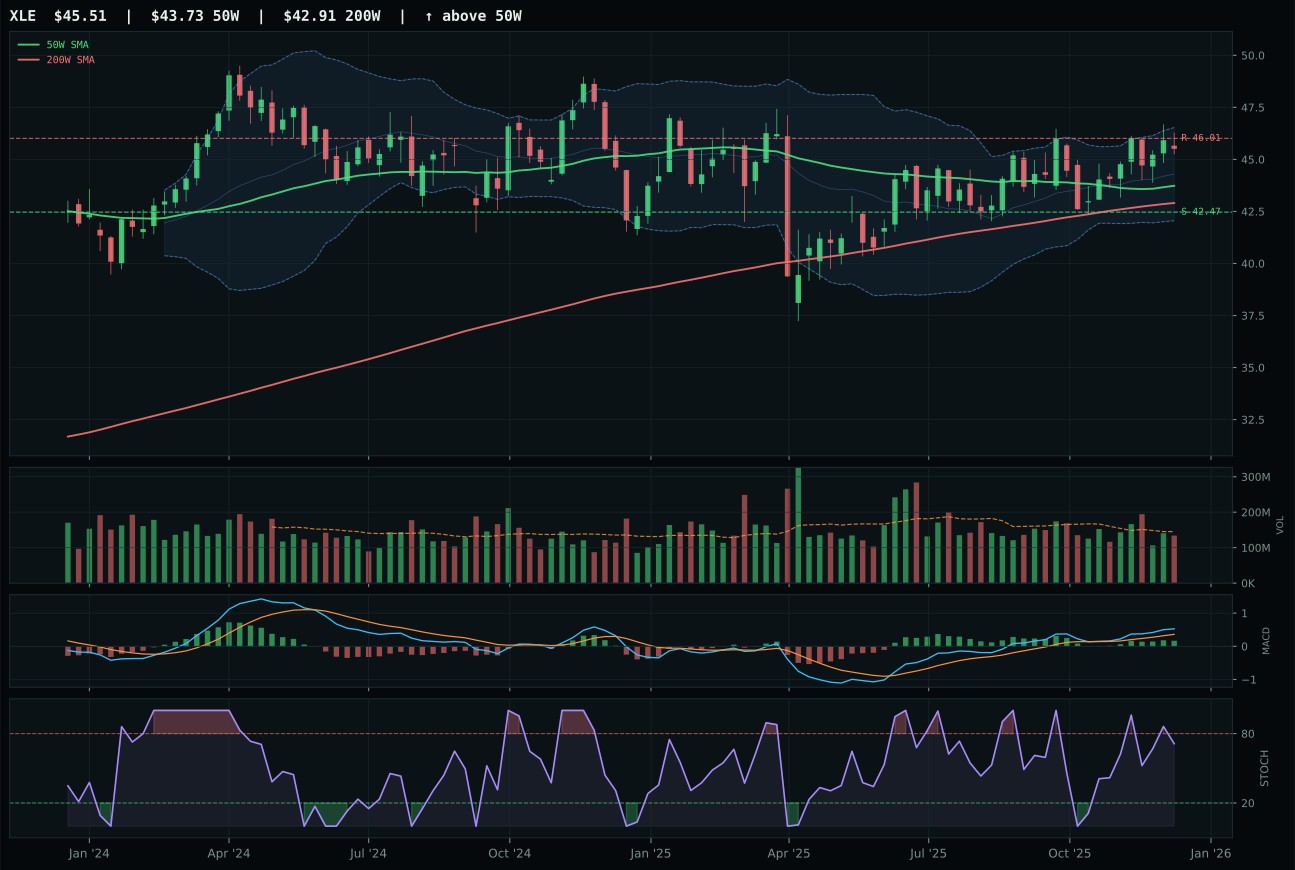
XLE has a neutral structure profile with -1.0% 13-week relative strength versus SPY.
A failed hold above support would weaken the setup.
Actionable but governed by invalidation levels.
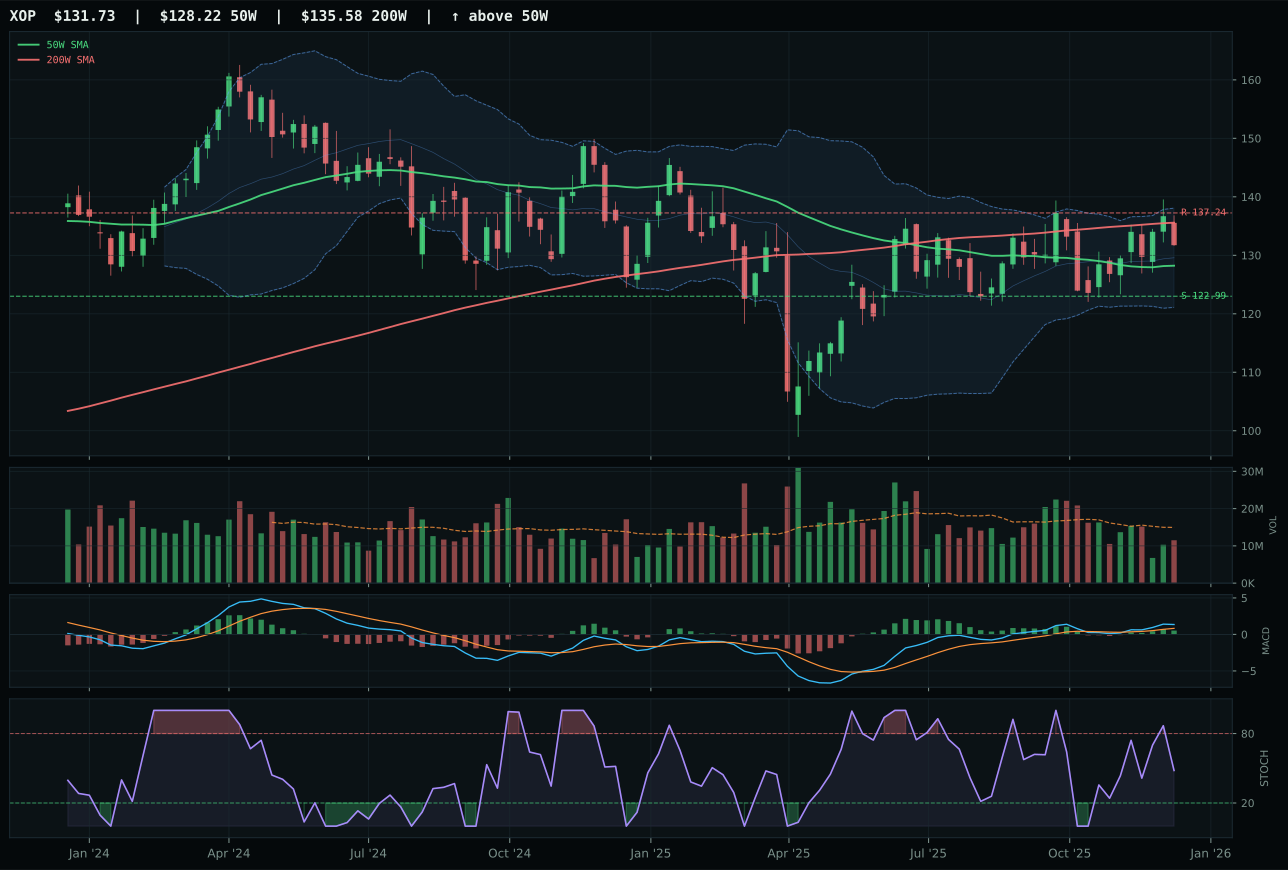
XOP has a compression near 50W profile with -2.5% 13-week relative strength versus SPY.
A failed hold above support would weaken the setup.
Actionable but governed by invalidation levels.
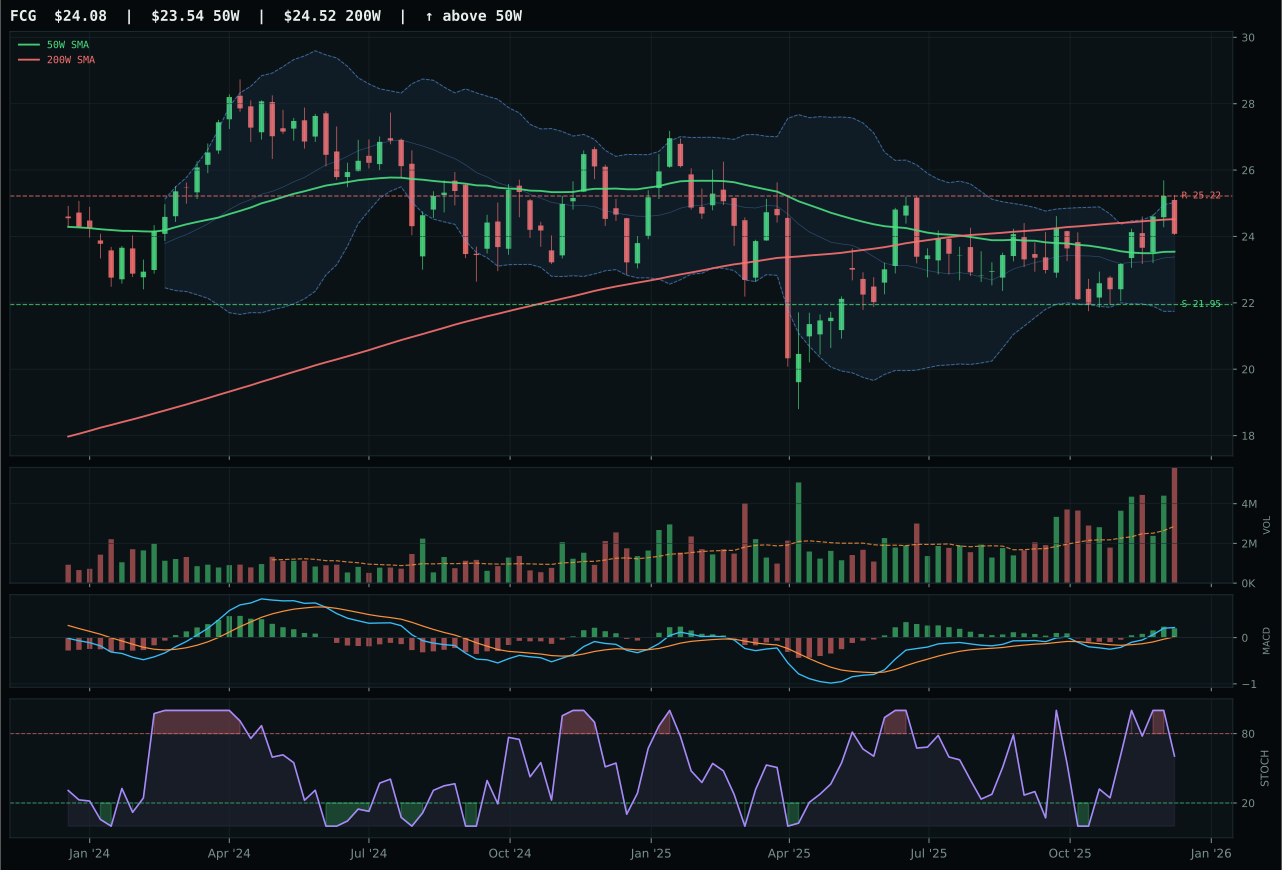
FCG has a compression near 50W profile with -0.6% 13-week relative strength versus SPY.
A failed hold above support would weaken the setup.
Actionable but governed by invalidation levels.
XLE wins the category decisively with 98.5 trend and 98.0 timing scores, yet the victory is hollow given the category's structural macro headwinds. XLE trades just 4.1% above its 50W with neutral volume and carries a 2.7% 13-week return that barely keeps pace with disinflation erosion. The runner-up XOP sits 2.8 points lower, undone by structure cleanliness of 70.1 versus XLE's 76.9 and category-relative strength at -1.5% versus XLE's 0.0%. Both carry bullish-and-improving MACD, rising mid-zone stochastic RSI, and neutral volume—setups that reflect energy's stability play rather than conviction catalyst. XLE's superior timing (98.0 versus XOP's 100, a nuance) reflects its compressed support/resistance range at 42.47/46.01 versus XOP's wider 122.99/137.24, offering tighter risk management for an asset class in secular decline. The score gap is tight because the category itself is weak; XLE wins by avoiding the worst mistakes, not by demonstrating genuine strength.
Traditional Energy earned 10% allocation despite the weakest category macro fit score of 23.0 because the allocator is using it as a tactical deflation trade and dividend yield anchor. Disinflation pressure scores -10 points, and the macro regime penalizes energy as growth expectations compress. Yet real asset sponsorship (+7) and energy's structural cash-flow characteristics offer portfolio utility in a low-rate environment. XLE's 98.5 trend and stable above-50W positioning mean the sector is holding structural support without generating new demand, a pattern consistent with dividend collectors rather than growth believers. The 10% weight is deliberately modest—it reflects conviction that energy will not collapse in a disinflation but will not lead, either. If credit stress indicators deteriorate sharply, this position would contract as yield becomes a poor substitute for collateral. The allocator used XLE over XOP because integrated majors (XLE) offer superior balance-sheet safety compared to exploration upside (XOP) in a potentially tightening credit regime.
Emerging Markets — ILF
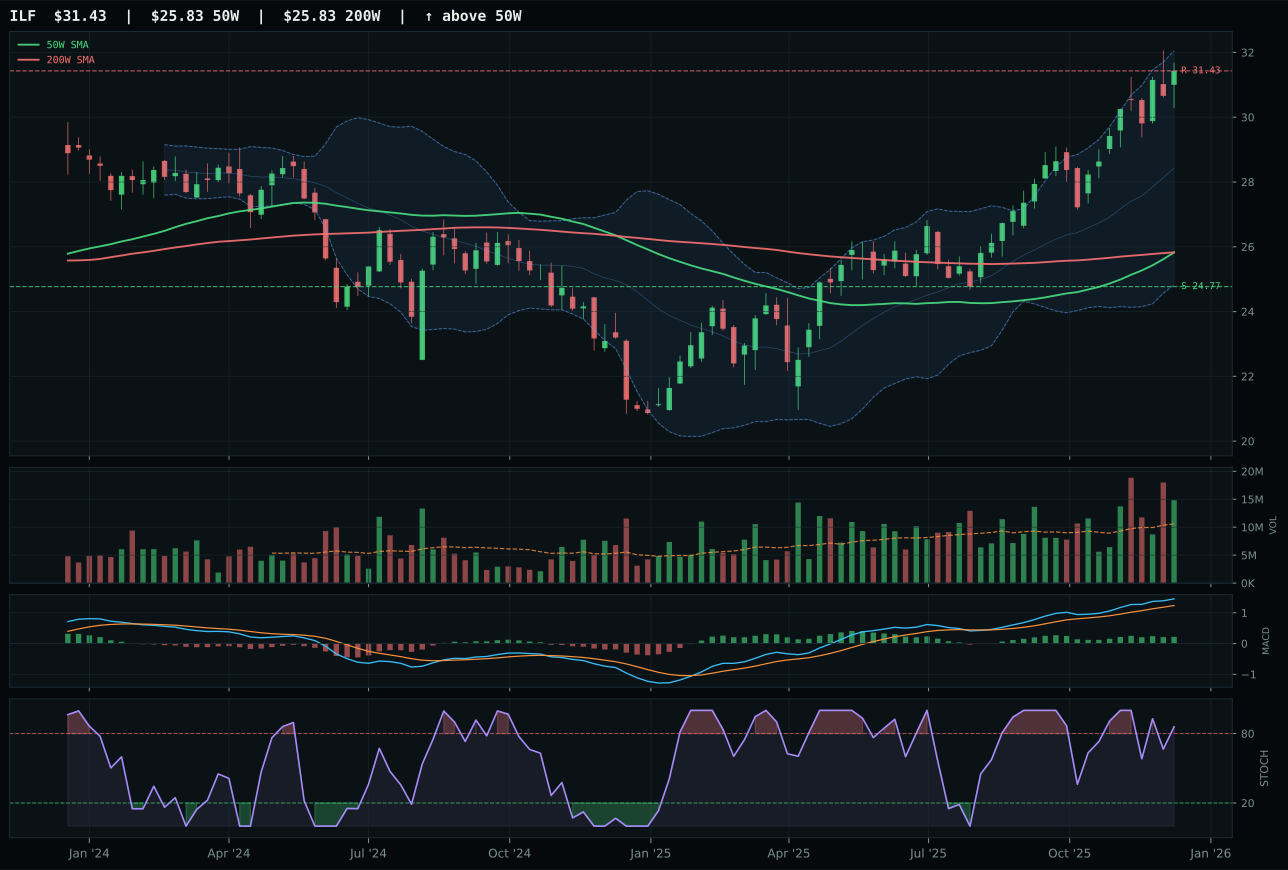
ILF has a vertical extension profile with 8.8% 13-week relative strength versus SPY.
A failed hold above support would weaken the setup.
Actionable but governed by invalidation levels.
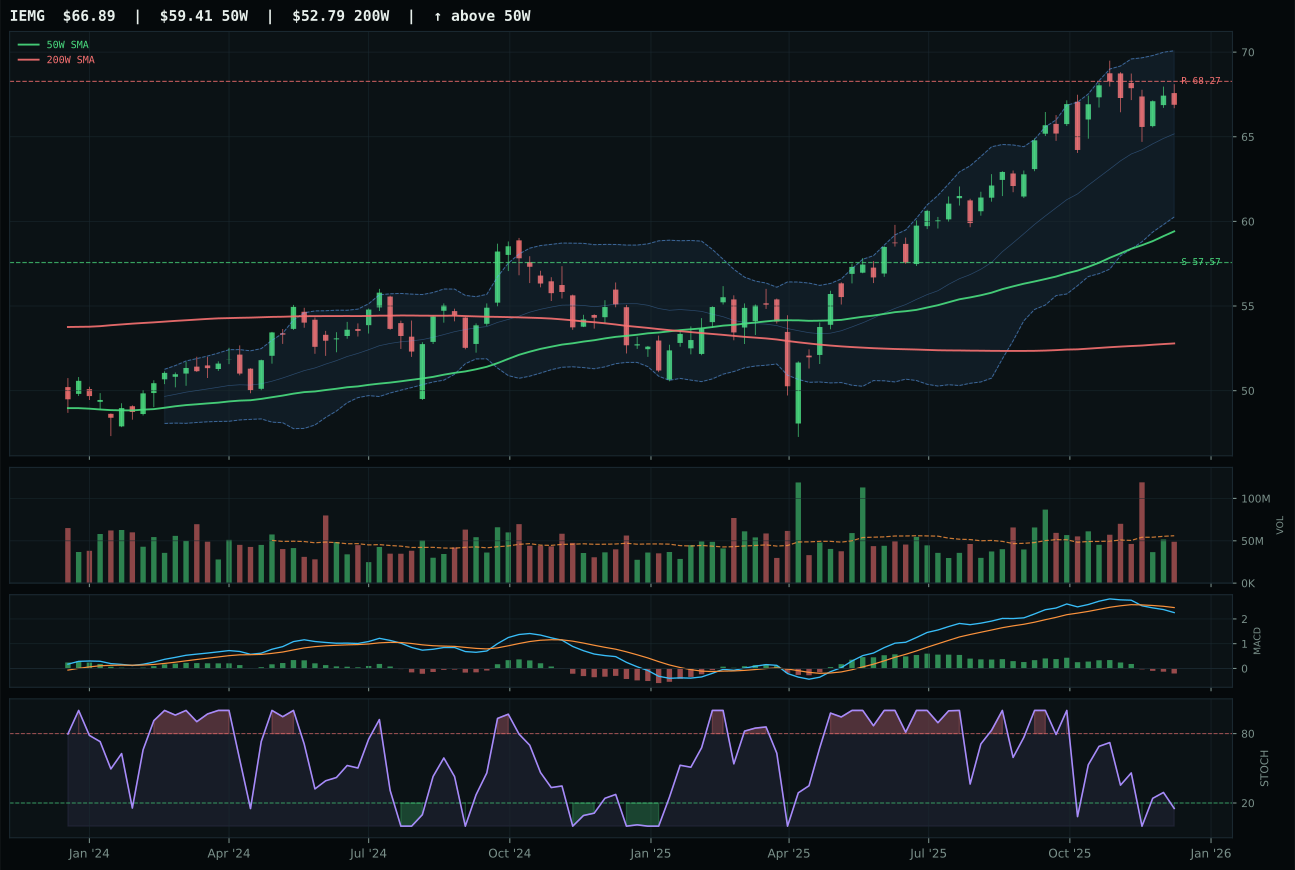
IEMG has a neutral structure profile with -0.5% 13-week relative strength versus SPY.
A failed hold above support would weaken the setup.
Actionable but governed by invalidation levels.
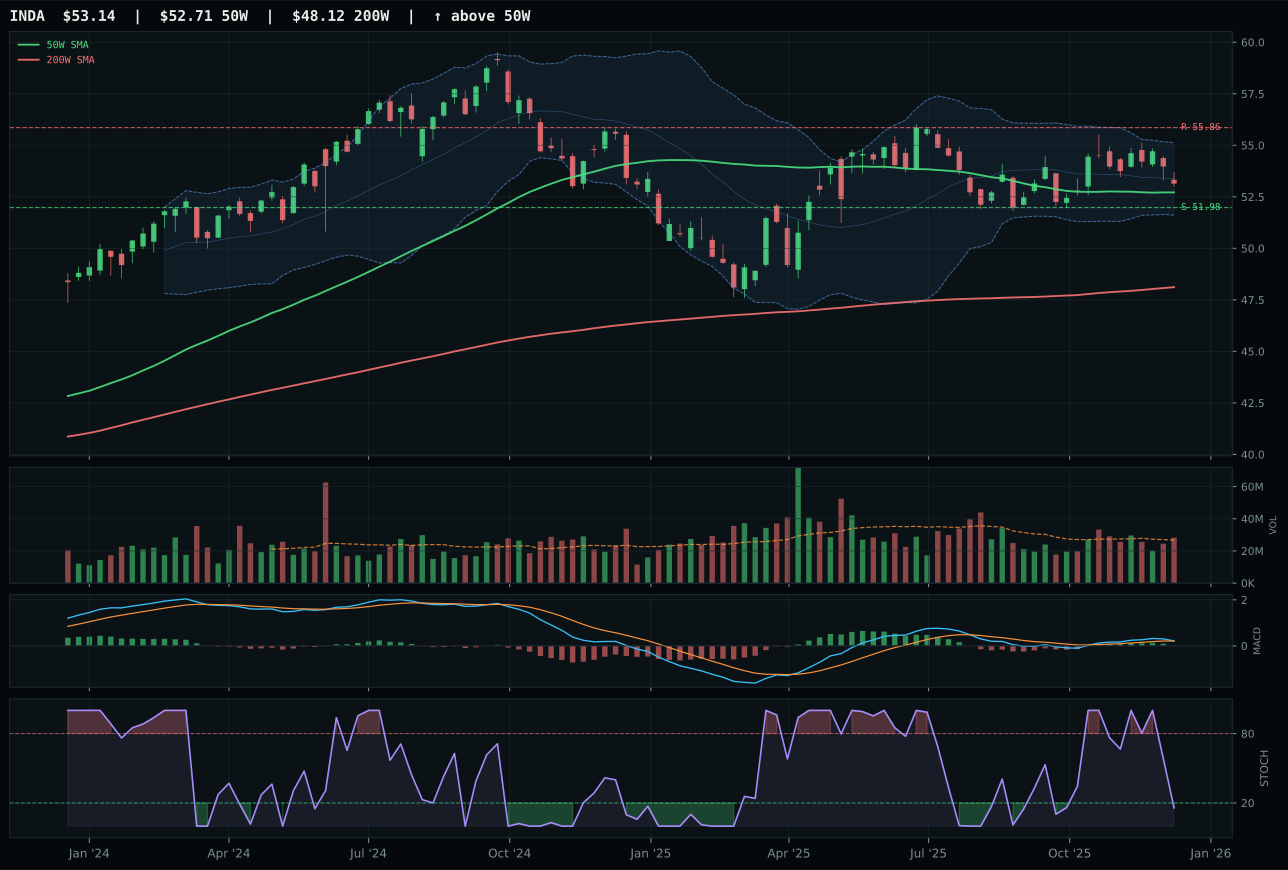
INDA has a pullback into support profile with -3.7% 13-week relative strength versus SPY.
A failed hold above support would weaken the setup.
Actionable but governed by invalidation levels.
ILF wins the category with perfect 100.0 trend and momentum confirmation scores, yet its 32.5 category score and 32.0 timing metric reveal the setup's fundamental problem: the move is already extended at 21.7% above the 50W. The victory over IEMG is decisive at 2.1 points, driven by ILF's 79.8 structure score and above-average 1.40x volume (earning 78 on volume confirmation) versus IEMG's 75.2 structure and neutral participation. ILF's 12.5% 13-week return and 9.2% category-relative strength demonstrate Latin America's outsized performance, benefiting from commodity breadth and metals scarcity tailwinds that disproportionately favor EM commodity exporters. IEMG's 3.2% 13-week return and bearish-weakening MACD position it as a laggard despite broader EM breadth being neutral. Both show zero risk/reward upside to resistance (already at 52W highs), but ILF's 26.9% downside cushion and above-average institutional participation suggest professionals are still accumulating Latin America despite the extended setup, a bullish structural signal.
Emerging Markets earns 0% allocation this week, ranked at or near the bottom of the 10-category set with a final score of 32.5. The macro fit of 38.0 is weak due to credit stress at -10 and liquidity stress at -10, which are structural headwinds in a macro environment where carry trades are at risk and EM currency exposure is a liability. Risk appetite positive at +8 is insufficient. ILF's technical strength (100.0 trend, 100.0 momentum) creates a false sense of security: the category's price action is driven by commodity tail winds (metals scarcity at +5, commodity breadth positive at +8), not by genuine EM macro improvement. The timing score of 32.0 signals exhaustion risk, and with disinflation as the macro regime, broad EM exposure has no margin of safety. ILF's lead over IEMG is a relative-strength story, not an absolute attractiveness story—the best horse in a bad race is still a poor allocation. To earn a position, this category needs either a risk-appetite breakout that defies liquidity stress, or a disinflation reversal that improves credit conditions. Current exposure is zero.
Agriculture & Livestock — MOO
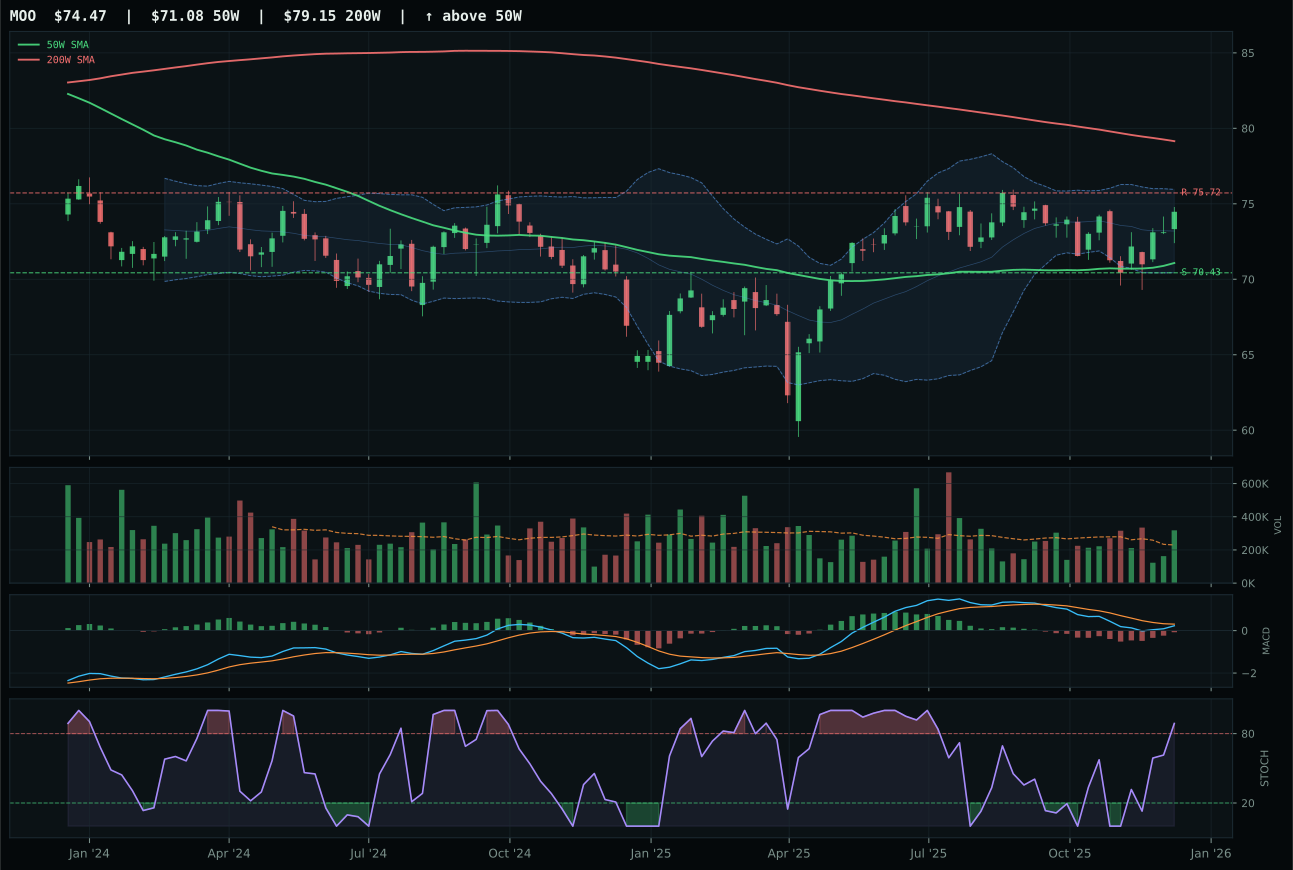
MOO has a neutral structure profile with -4.0% 13-week relative strength versus SPY.
A failed hold above support would weaken the setup.
Actionable but governed by invalidation levels.
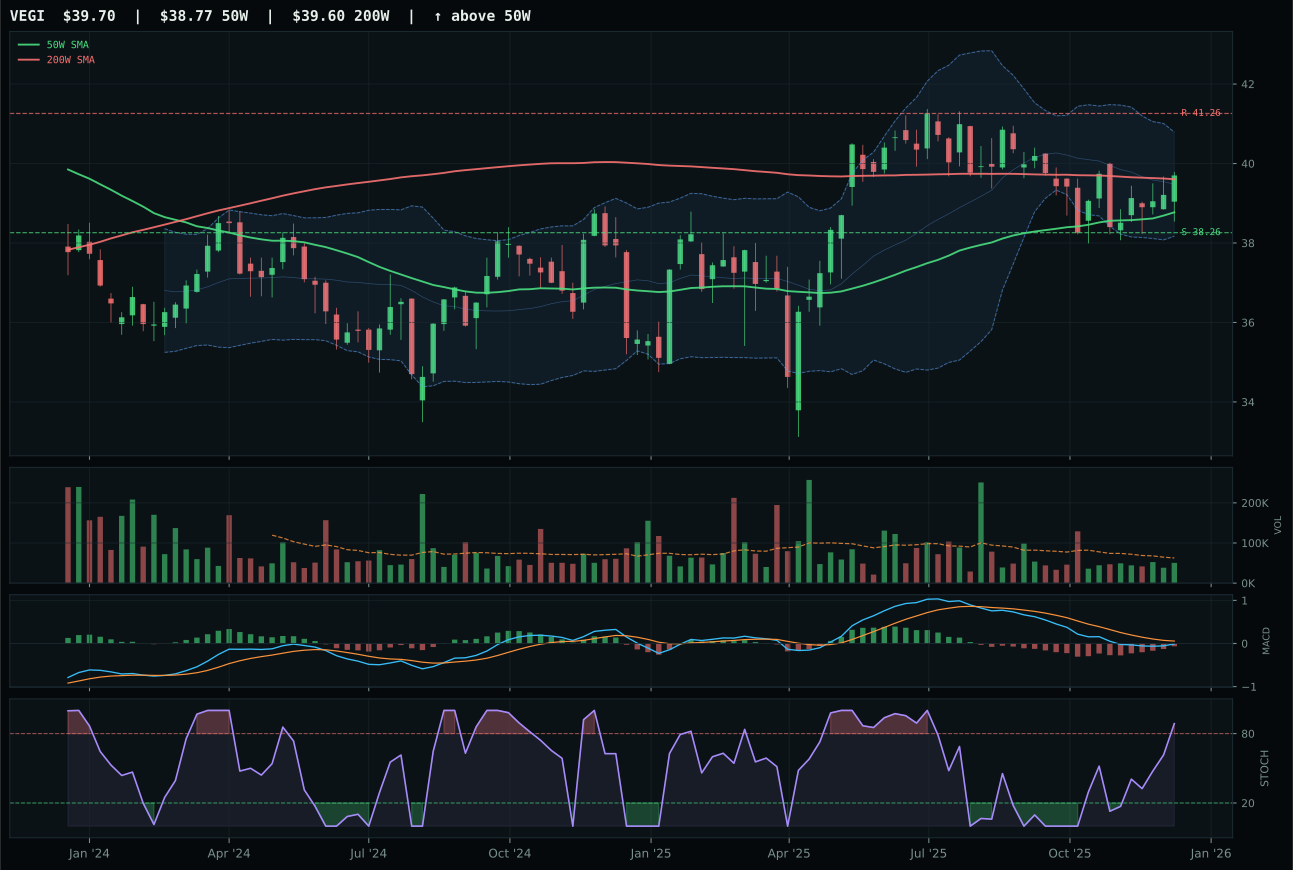
VEGI has a pullback into support profile with -4.9% 13-week relative strength versus SPY.
A failed hold above support would weaken the setup.
Tracked, but not top-2 eligible because: .
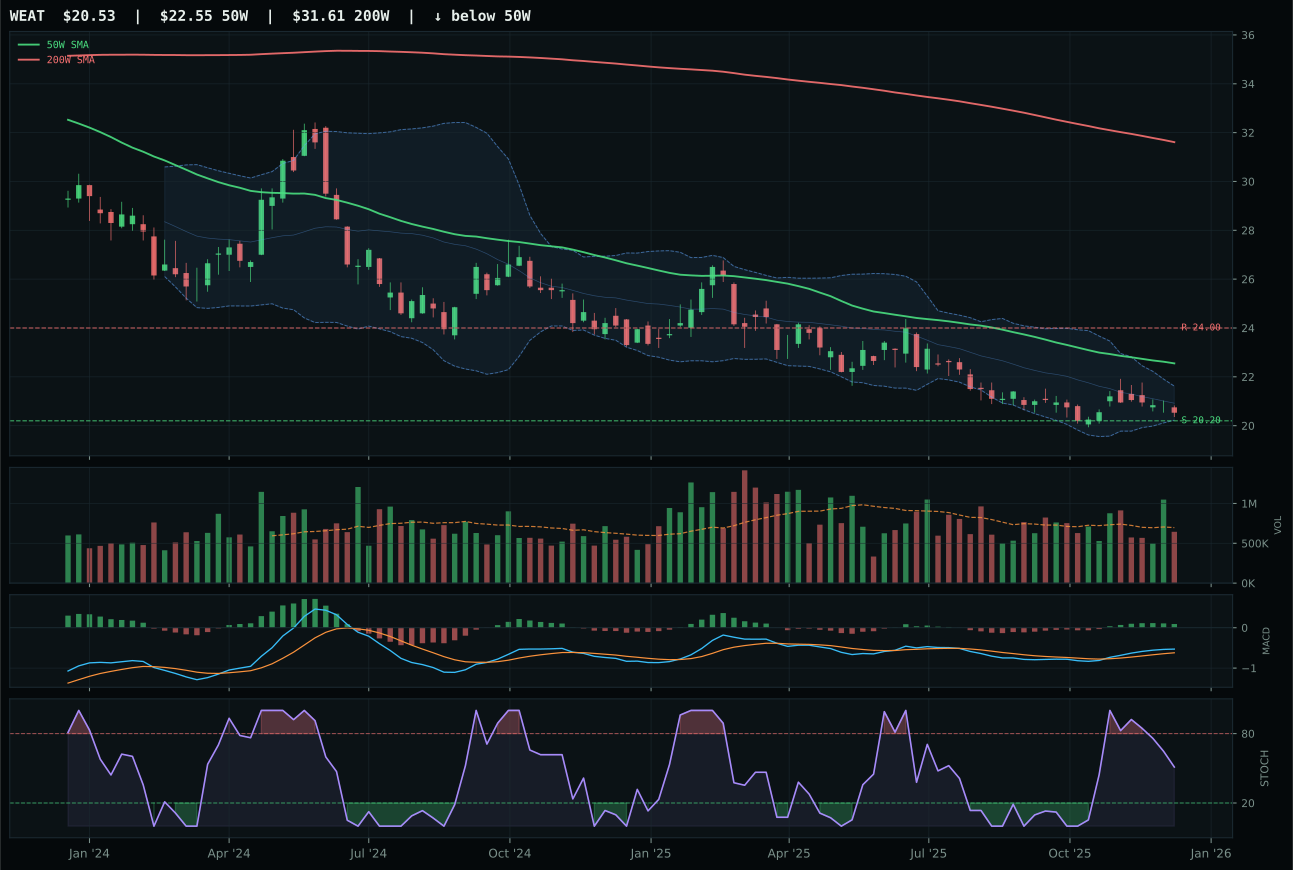
WEAT has a pullback into support profile with -5.9% 13-week relative strength versus SPY.
Extension and support failure are the main tactical risks.
Tracked, but not top-2 eligible because: structurally broken.
MOO wins primarily on structure and volume confirmation rather than momentum, beating VEGI's pullback-into-support setup by maintaining neutrality with above-average participation. MOO's 78.3 structure score and 1.38x volume at 20-week average represent genuine accumulation, while VEGI's pullback shows 75.9 structure and neutral volume—a meaningful separation when both are underwater on SPY relative strength at -4.0% and -4.9%. The stochastic RSI sits at 0.89 for MOO (overbought momentum near 52W highs) versus 0.89 for VEGI in the same zone, but MOO's above-average volume suggests institutions are absorbing supply, not chasing a retail tail-end move. MOO's -0.3% 13-week return and VEGI's -1.2% both disappoint, yet MOO's 0.9% category-relative strength edges VEGI's 0.0%. The deciding factor: MACD is bearish but improving for both, but MOO's volume-price confirmation (58.9) and persistence (52.9) outpace VEGI's neutral volume behavior by a decisive 10.7-point category gap.
Agriculture & Livestock earns 0% allocation this week, ranked 9th or 10th among the 10 categories, and for good reason: the 22.6 final score is the third-lowest on the board. Disinflation pressure of -8 and disinflation hurting the exposure category-wide at -6 are hammer blows to a sector that benefits from inflation. Real asset sponsorship at +8 and commodity breadth positive at +5 are insufficient to offset the macro regime penalty. The category-level macro fit of 45.0 reflects this: liquidity stress at -4, credit stress is neutral, and the tailwinds are small and uncertain. MOO's stochastic RSI at 0.89 and price near the 52W high suggest the setup has already done its work, and the lack of SPY outperformance (down 4.0% relative) tells us conviction is absent. To earn allocation, this category needs either a disinflation reversal signal or a commodity breadth breakout that pulls the entire category higher. Current positioning offers downside risk with limited upside; capital is better deployed to the two metals categories offering superior technical and macro alignment.