
2025-12-05
Informational purposes only. The content in this report, including allocations, analysis, and commentary, is provided solely for informational and educational purposes. It does not constitute financial advice, investment advice, trading advice, or any other type of advice. Past performance does not guarantee future results. Always conduct your own research and consult a qualified financial professional before making investment decisions.
Weekly Allocation
| Ticker | Category | Weight | Role |
|---|---|---|---|
| COPX | Industrial Metals | 20% | Top-2 (20%) |
| SLV | Precious Metals | 20% | Top-2 (20%) |
| SMH | AI | 10% | Tier-2 (10%) |
| FCG | Traditional Energy | 10% | Tier-2 (10%) |
| PAVE | Utilities & Infrastructure | 10% | Tier-2 (10%) |
| XLK | Technology | 10% | Tier-2 (10%) |
| URNM | Nuclear Energy | 10% | Tier-2 (10%) |
| ITA | Defense & Aerospace | 10% | Tier-2 (10%) |
Trade Instructions — Monday Open
Sell the tranche from 2025-11-07 (completing its 4-week hold). Buy the new tranche. Instructions show net portfolio changes — same-asset positions cancel, weight changes show the delta.
| Action | Ticker | Instruction |
|---|---|---|
| SELL | FBTC | Sell 50% of FBTC position (reduce 25.00% → 12.50%) |
| SELL | GLD | Sell 33% of GLD position (reduce 7.50% → 5.00%) |
| SELL | ILF | Sell 67% of ILF position (reduce 3.75% → 1.25%) |
| SELL | NLR | Sell entire NLR position (1.25% of portfolio) |
| BUY | PAVE | Buy PAVE — 6.67% of freed cash (adds 1.25% to portfolio) |
| BUY | COPX | Buy COPX — 20.00% of freed cash (adds 3.75% to portfolio) |
| BUY | SMH | Buy SMH — 6.67% of freed cash (adds 1.25% to portfolio) |
| BUY | XLK | Buy XLK — 6.67% of freed cash (adds 1.25% to portfolio) |
| BUY | ITA | Buy ITA — 6.67% of freed cash (adds 1.25% to portfolio) |
| BUY | SLV | Buy SLV — 26.67% of freed cash (adds 5.00% to portfolio) |
| BUY | URNM | Buy URNM — 13.33% of freed cash (adds 2.50% to portfolio) |
| BUY | FCG | Buy FCG — 13.33% of freed cash (adds 2.50% to portfolio) |
Current Portfolio After Trade
Combined holdings across all 4 active tranches. Each tranche is 25% of the portfolio.
| Ticker | % of Portfolio | Weight Bar |
|---|---|---|
| FBTC | 12.50% | |
| SLV | 12.50% | |
| SMH | 8.75% | |
| URNM | 8.75% | |
| ITA | 7.50% | |
| PICK | 7.50% | |
| XLK | 6.25% | |
| IGF | 6.25% | |
| GLD | 5.00% | |
| REMX | 5.00% | |
| FCG | 5.00% | |
| COPX | 5.00% | |
| XLE | 3.75% | |
| CIBR | 2.50% | |
| PAVE | 2.50% | |
| ILF | 1.25% |
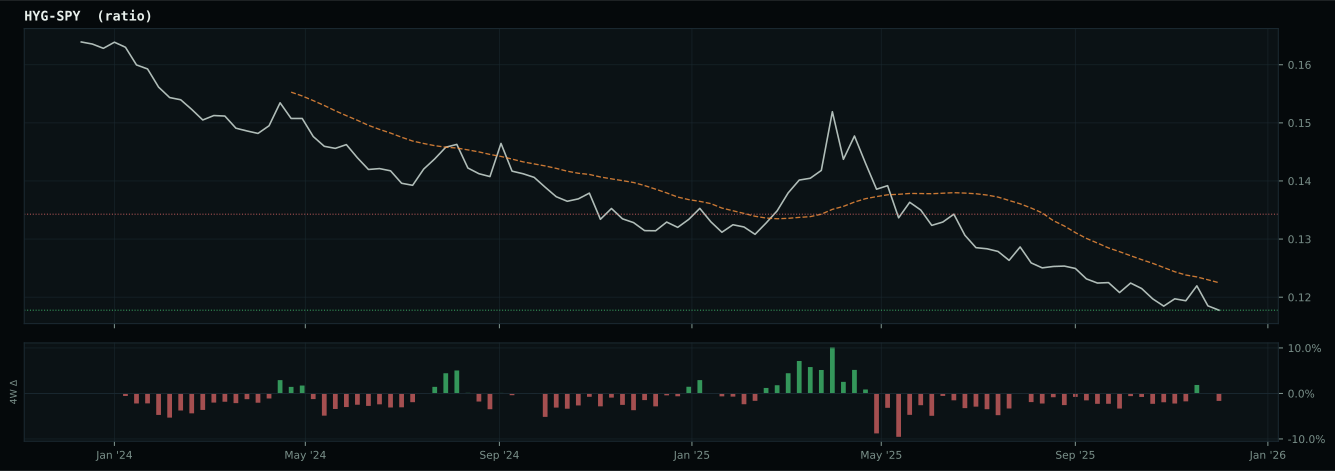
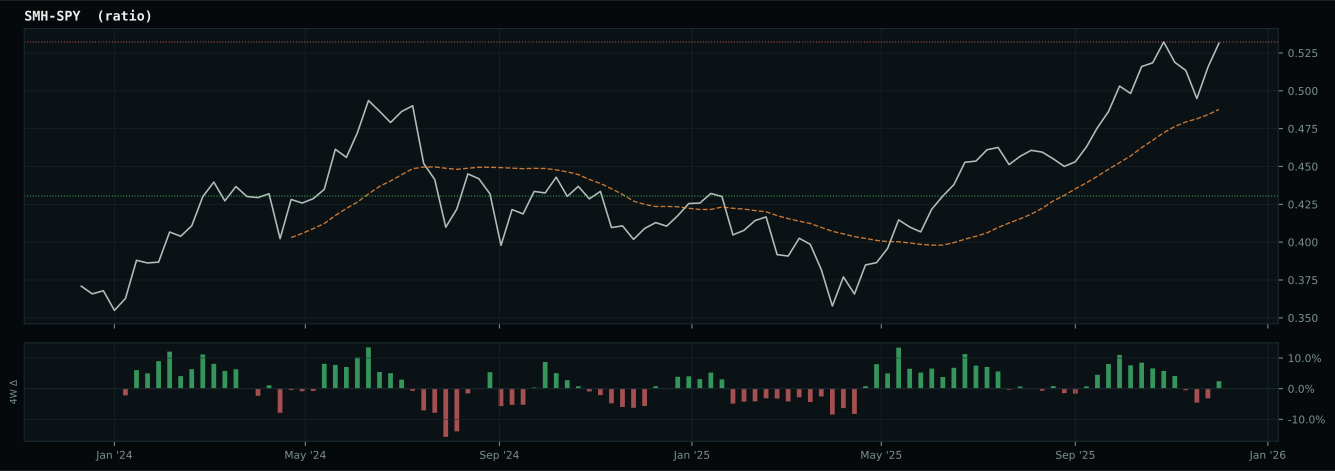
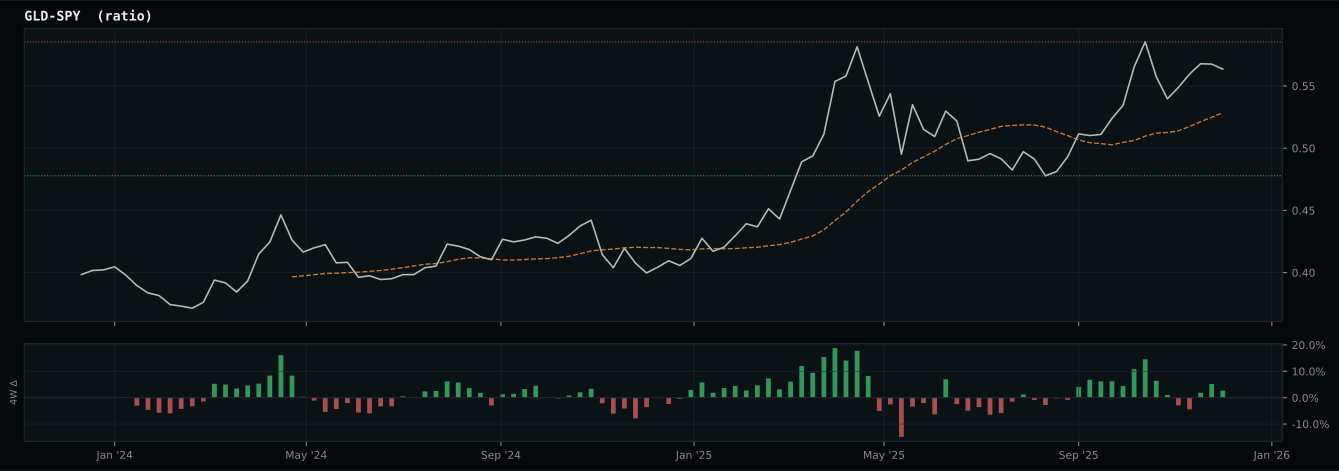
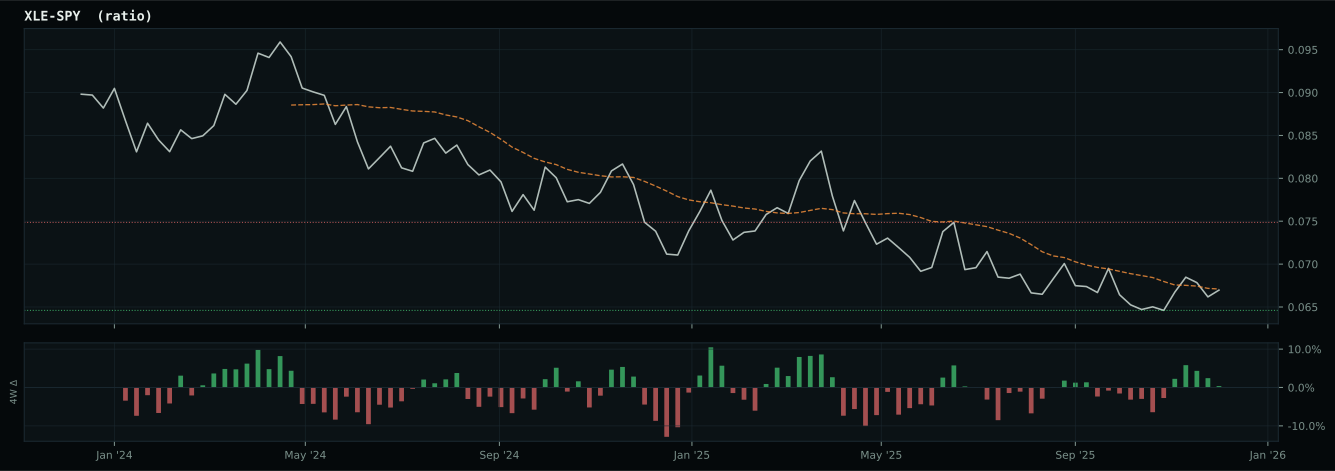
Macro Regime — Transition / Mixed
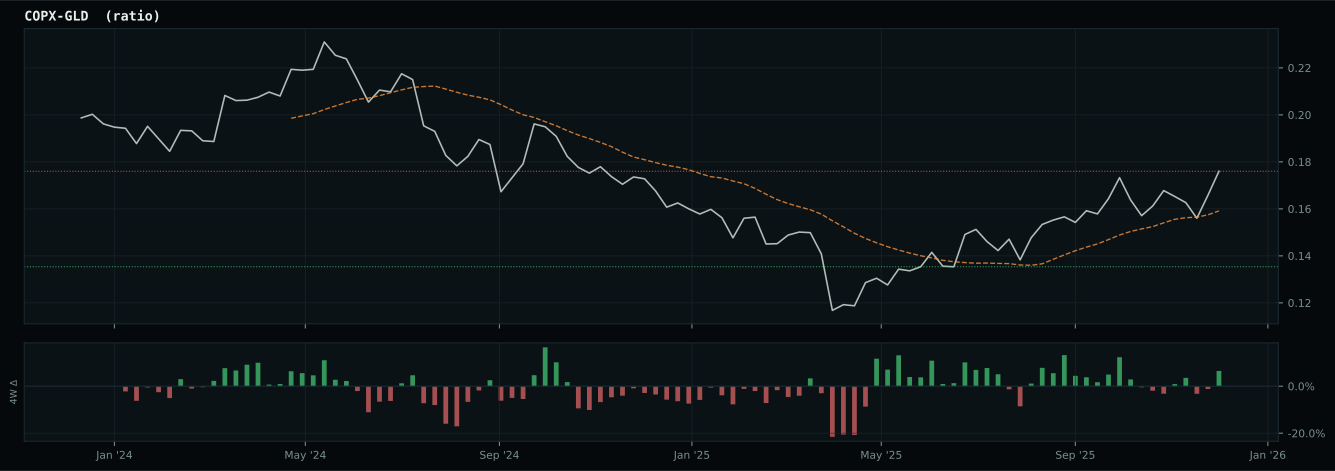
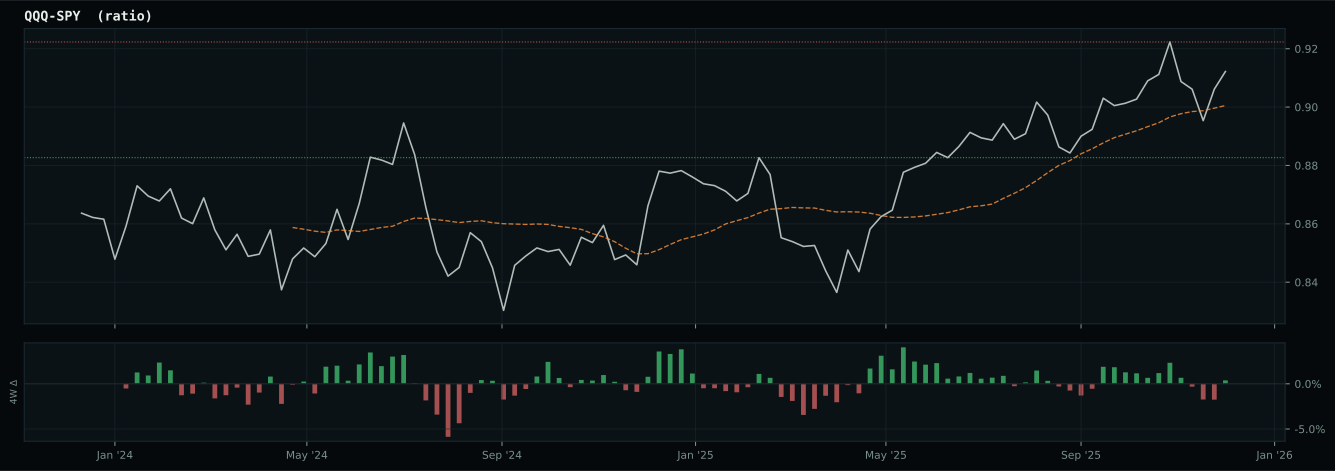
Macro Evidence Charts
Market-implied signals behind the macro regime scores. Each ratio compares two assets; the direction and slope of the ratio is what the macro engine reads.
Crypto Regime — NoCrypto
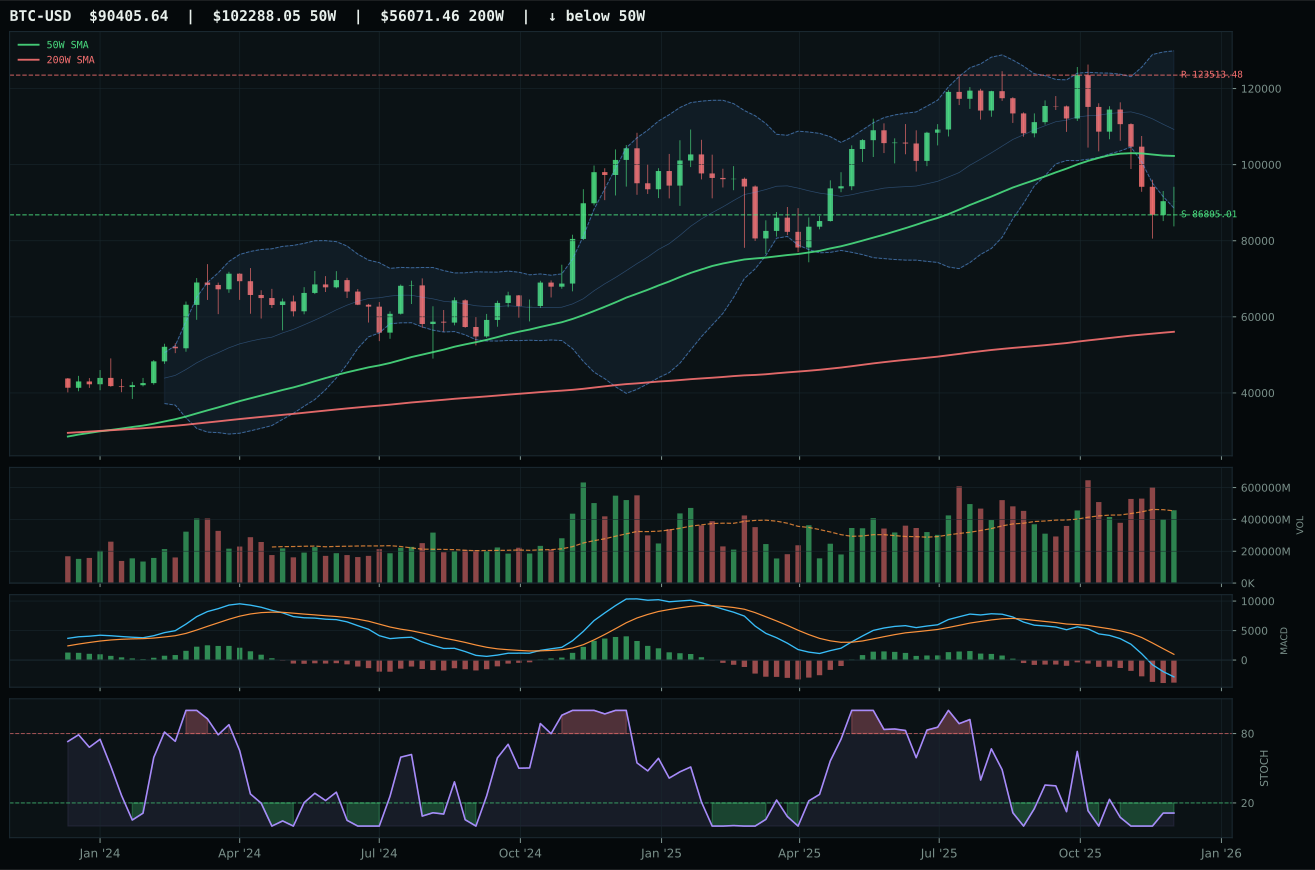
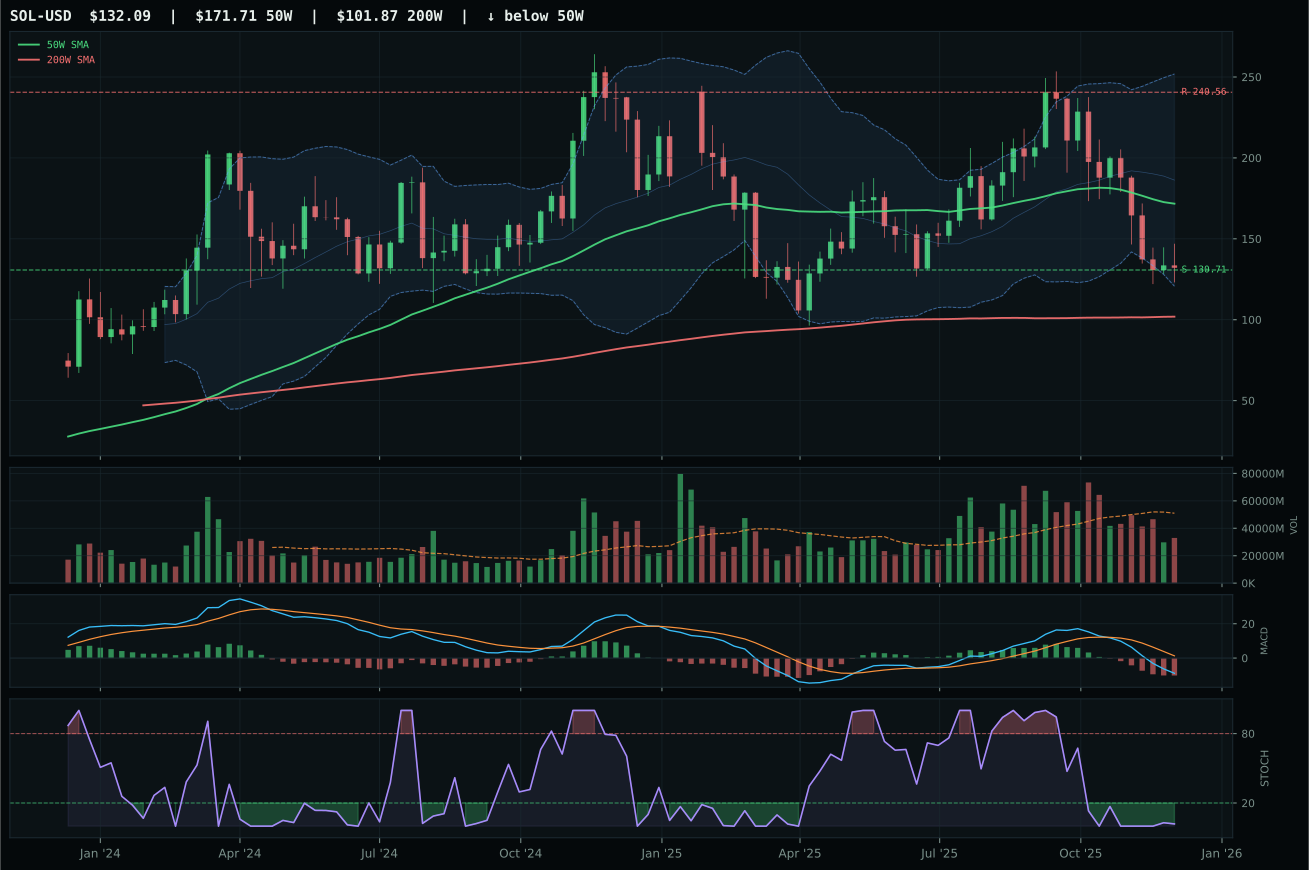
ValueBTC not armed: BTC has not made the first post-breakdown touch of the 200W buy zone after losing the 50W
TrendBTC not confirmed
one or more available conditions failed
Category Rankings
| Rank | Category | Winner | Score | Alloc | 4W Ret | Peers (4W) |
|---|---|---|---|---|---|---|
| 1 | Industrial Metals | COPX | 74.2 | 20% | +10.21% | PICK +7.9% · REMX +5.7% |
| 2 | Precious Metals | SLV | 68.9 | 20% | +31.31% | GDX +8.3% · GLD +5.0% |
| 3 | AI | SMH | 56.2 | 10% | +3.70% | BOTZ +0.4% · AIQ +1.1% |
| 4 | Traditional Energy | FCG | 54.7 | 10% | -4.30% | XOP -3.2% · XLE +3.3% |
| 5 | Utilities & Infrastructure | PAVE | 49.1 | 10% | +0.41% | IGF -0.1% · XLU -0.4% |
| 6 | Technology | XLK | 46.9 | 10% | -0.96% | CIBR -5.4% · IGV -5.9% |
| 7 | Nuclear Energy | URNM | 45.8 | 10% | +3.28% | NLR +0.0% · URA -1.5% |
| 8 | Defense & Aerospace | ITA | 38.9 | 10% | +10.09% | XAR +9.1% · ROKT +11.6% |
| 9 | Agriculture & Livestock | MOO | 31.1 | 0% | +0.31% | VEGI -0.1% · WEAT -3.2% |
| 10 | Emerging Markets | ILF | 25.6 | 0% | -0.26% | INDA +1.6% · IEMG +2.7% |
Industrial Metals — COPX
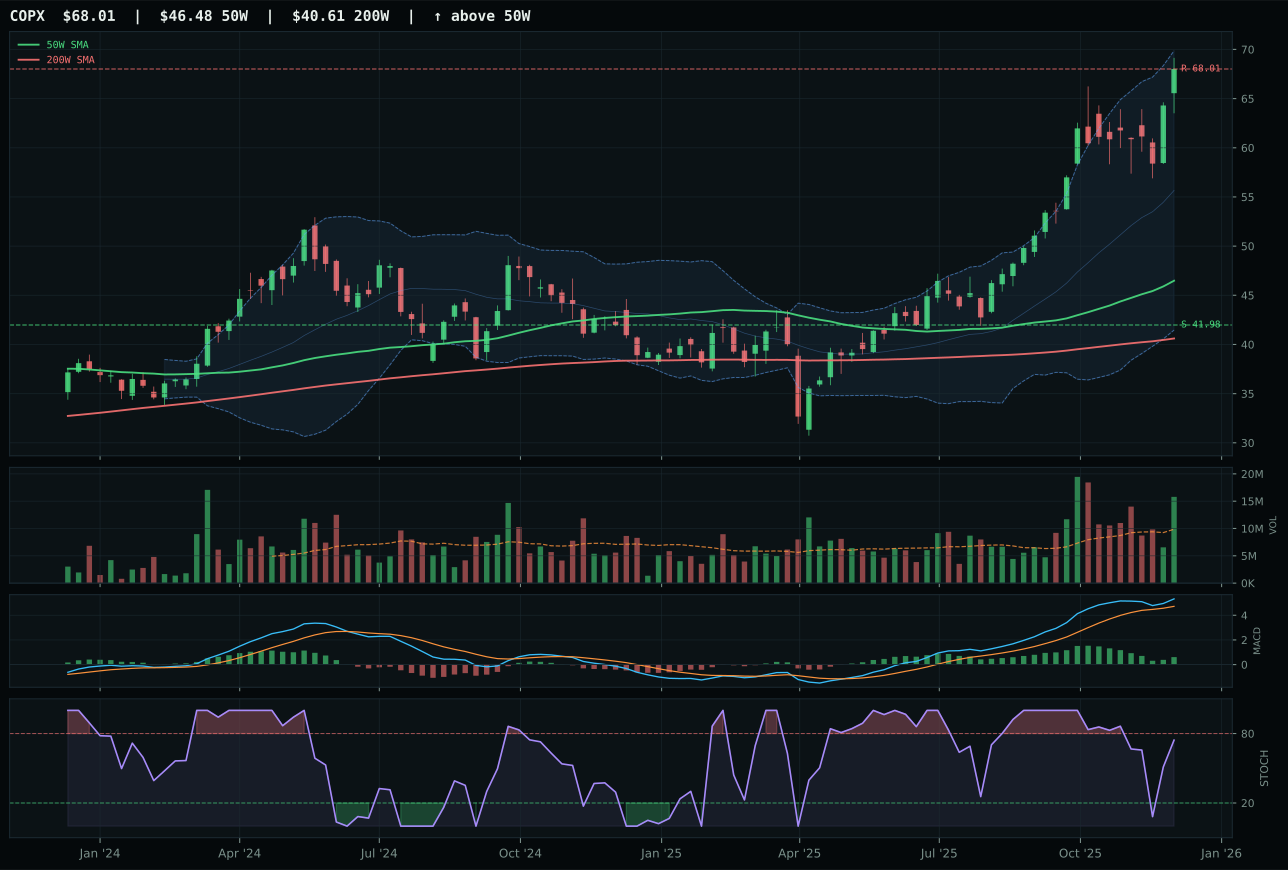
COPX has a vertical extension profile with 27.3% 13-week relative strength versus SPY.
A failed hold above support would weaken the setup.
Actionable but governed by invalidation levels.
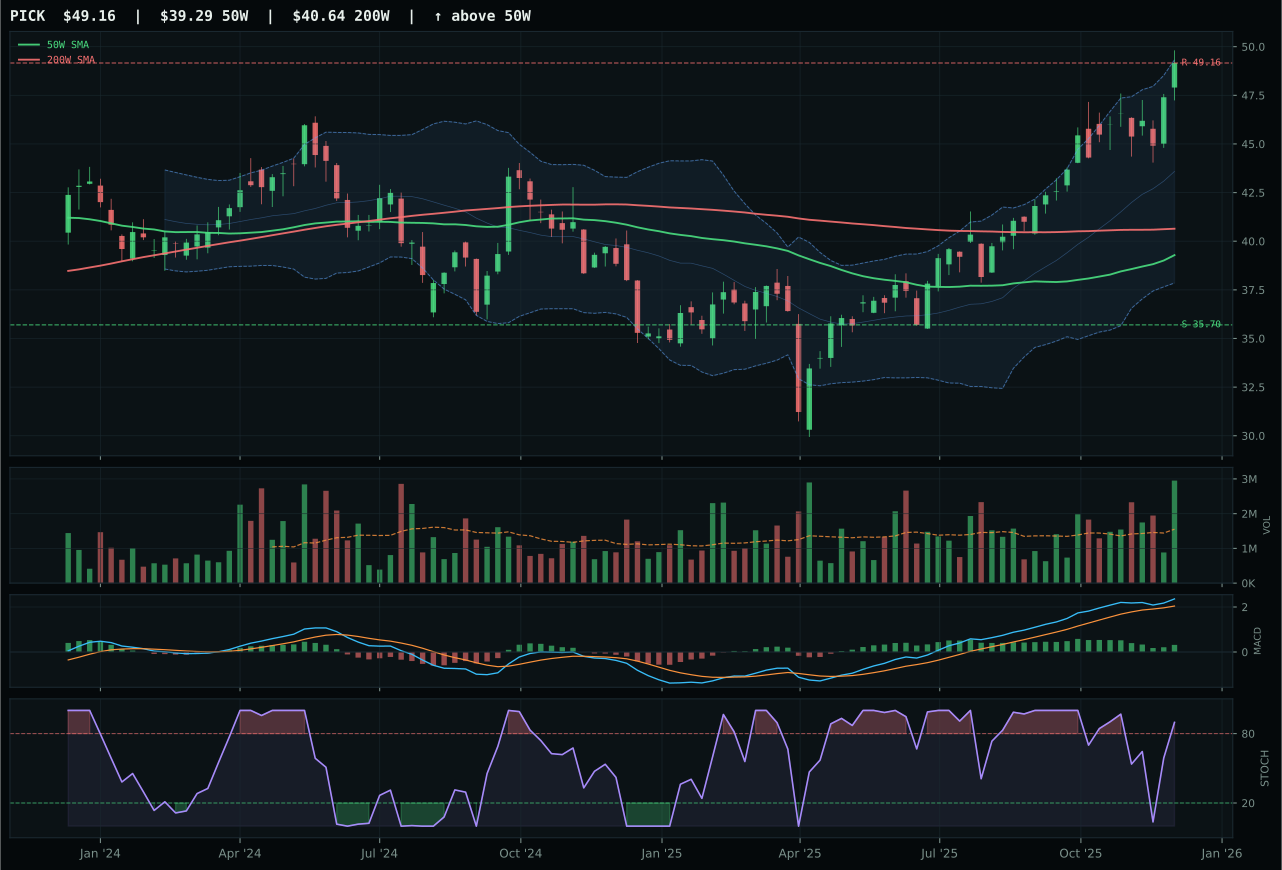
PICK has a vertical extension profile with 11.6% 13-week relative strength versus SPY.
A failed hold above support would weaken the setup.
Actionable but governed by invalidation levels.
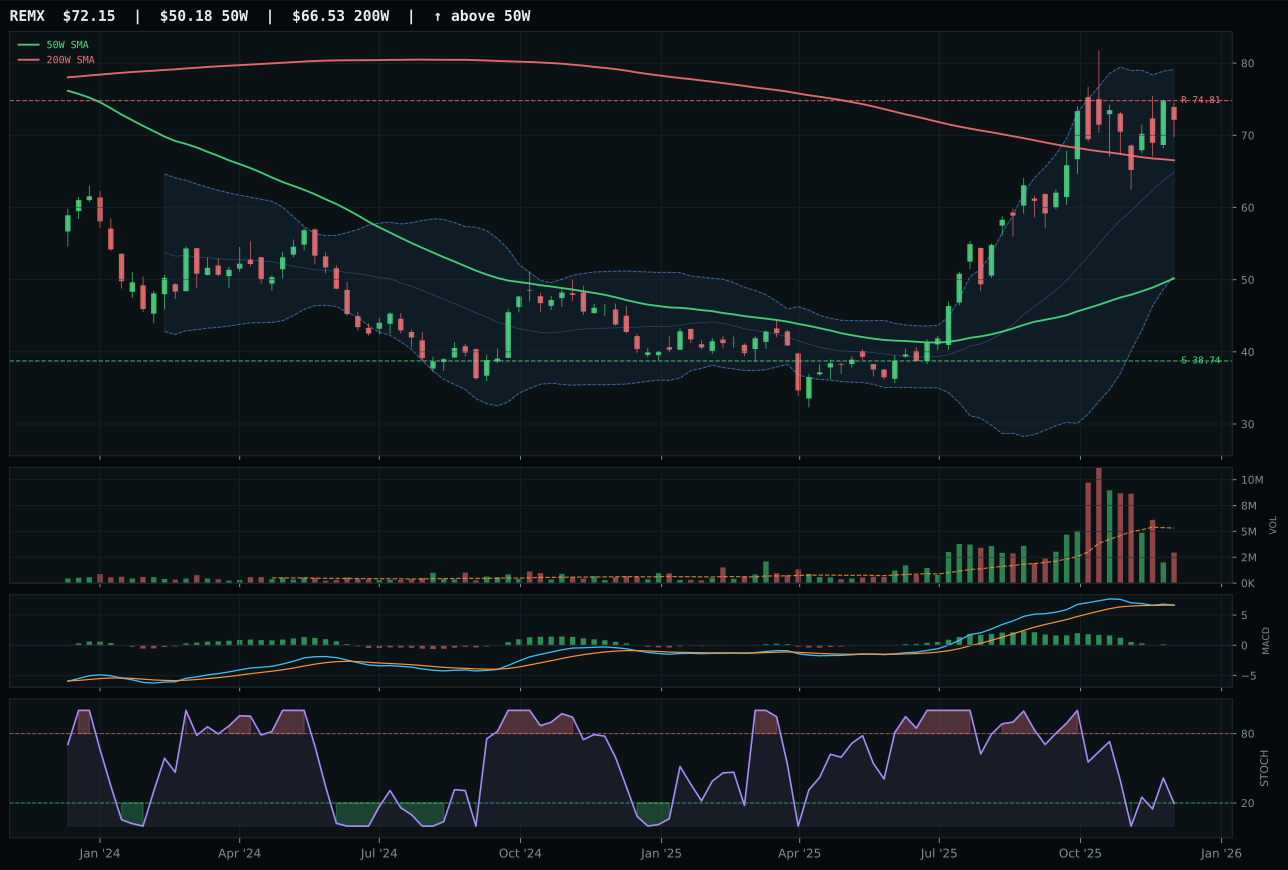
REMX has a vertical extension profile with 12.5% 13-week relative strength versus SPY.
A failed hold above support would weaken the setup.
Actionable but governed by invalidation levels.
COPX captured the industrial metals crown by posting 27.3% SPY relative strength and a 14.8% category-relative lead alongside 1.60x accumulation-level volume, making it the only real sponsor in a category built around copper scarcity and capex demand. The 33.2% 13-week return and 100.0 momentum-confirmation reading signaled authentic institutional participation in the metals-scarcity thesis (+12 macro descriptor), while MACD's bullish-but-flattening trajectory and rising-mid-zone stochastic RSI suggested the move still had room despite the 46.3% extension above the 50W. PICK's overbought-momentum stochastic reading and weaker 32.0 timing score revealed that mining breadth had overextended into momentum exhaustion, while COPX's rising-mid-zone stochastic kept the door open for continuation into the 68.01 resistance. The 1.3-point margin over PICK made this a photo finish, but COPX's 95.4 volume-price confirmation versus PICK's 86.0 decided the category: copper had real bid, mining had sentiment.
Industrial Metals claimed the second 20% allocation on the back of a powerful 74.2 category score and a macro regime where metals scarcity (+14 descriptor), commodity breadth positive (+10), and real-asset sponsorship (+6) aligned into the portfolio's second-strongest conviction thesis. COPX's 96.3 technical evidence and 86.5 reasoned score—the highest first-ranked proof-order reading across all ten categories—signaled that copper's structural scarcity and capex-led demand were backed by genuine technical sponsorship. The dual allocation (SLV + COPX at 20% each) reflected the allocator's view that monetary concerns (silver) and industrial demand (copper) would drive the coming regime, with the Transition/Mixed macro state offering a bridge phase where both narratives could coexist before the market sorted winners and losers. COPX's only vulnerability was the identical 44.3 risk/reward score as SLV, but that symmetry was deliberate: the allocator accepted zero upside room in exchange for 100.0 momentum and 95.4+ volume confirmation, betting that institutional flows would break through resistance once positioned.
Precious Metals — SLV
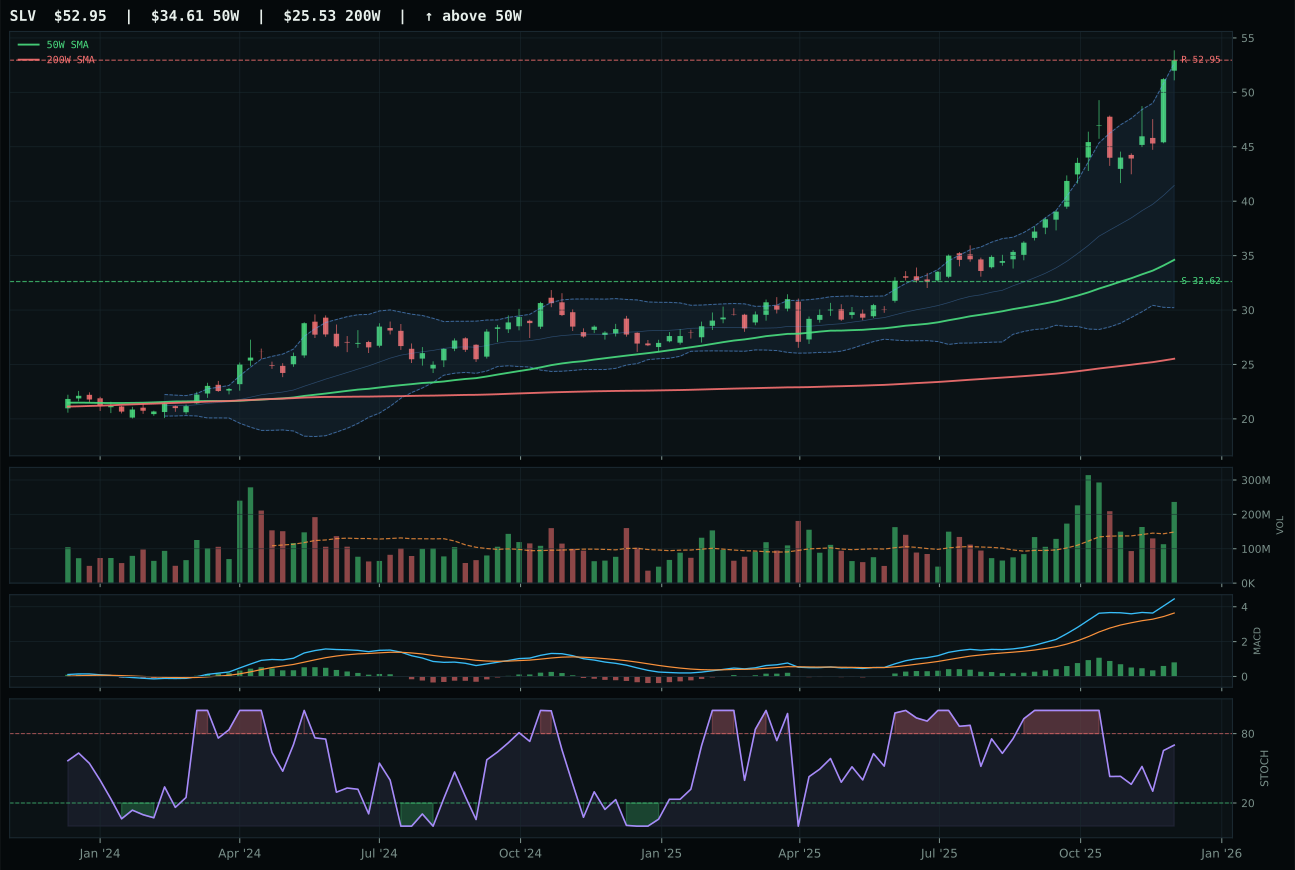
SLV has a vertical extension profile with 36.4% 13-week relative strength versus SPY.
A failed hold above support would weaken the setup.
Actionable but governed by invalidation levels.
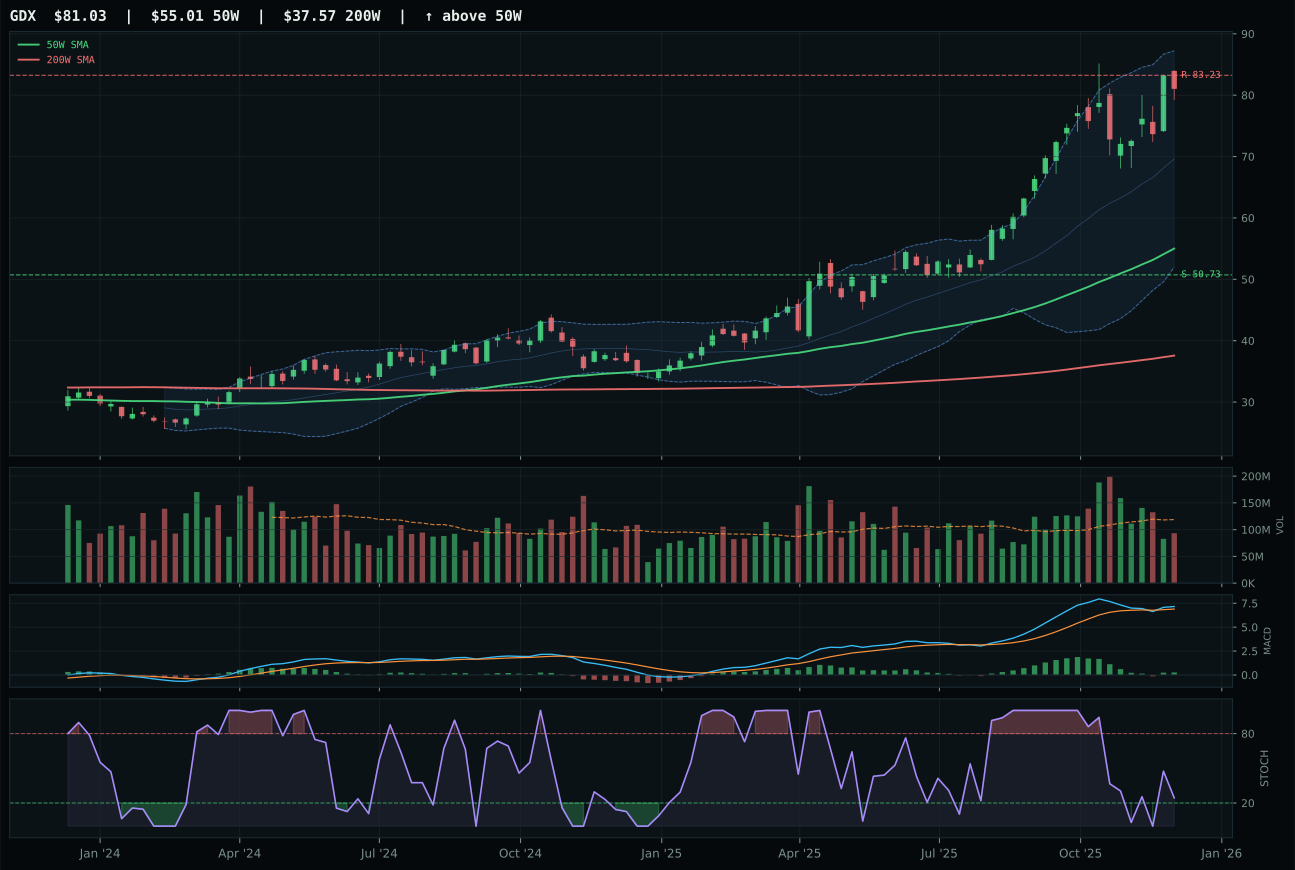
GDX has a vertical extension profile with 16.2% 13-week relative strength versus SPY.
A failed hold above support would weaken the setup.
Actionable but governed by invalidation levels.
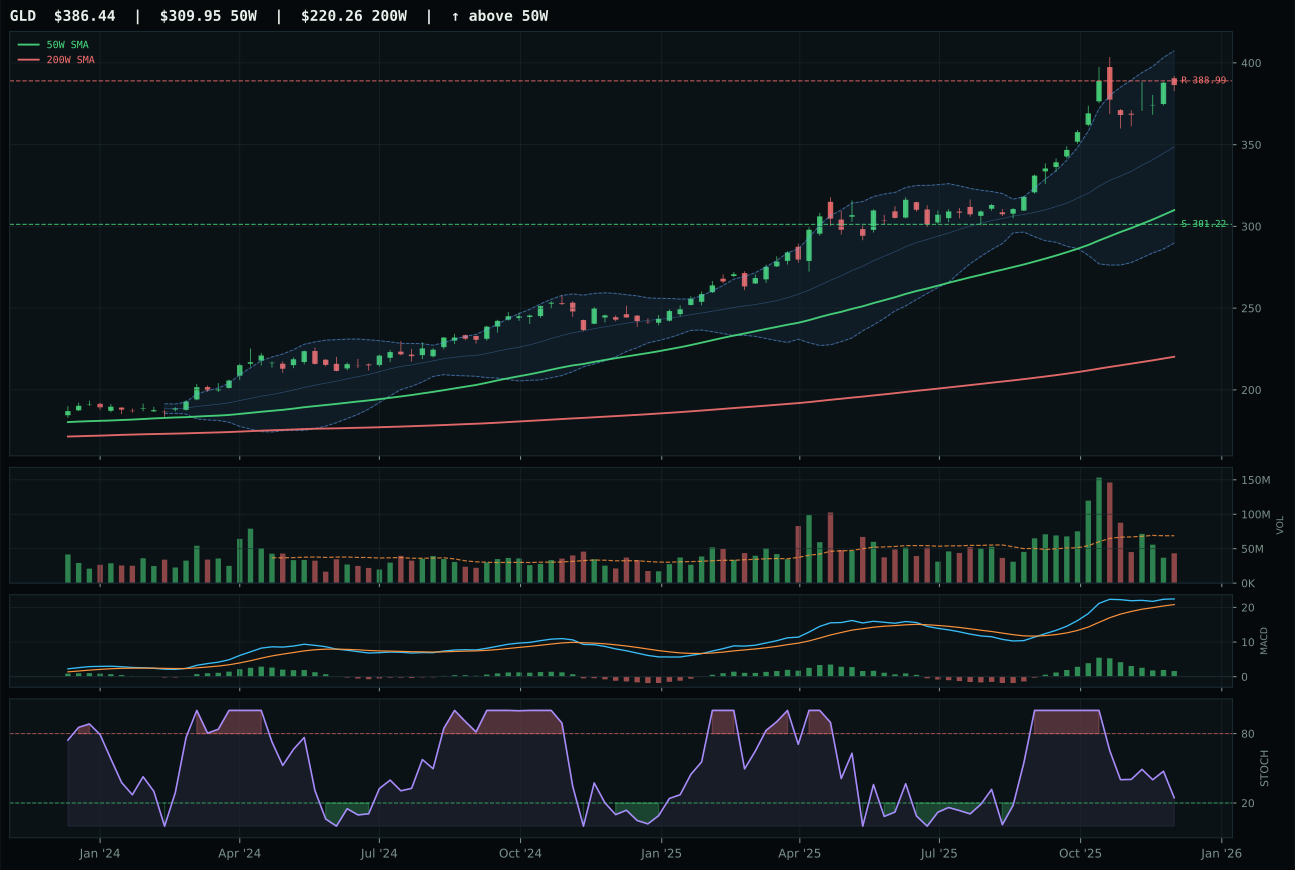
GLD has a vertical extension profile with 10.8% 13-week relative strength versus SPY.
A failed hold above support would weaken the setup.
Actionable but governed by invalidation levels.
SLV earned its top-2 allocation by delivering the portfolio's cleanest confirmation score: 100.0 volume-price, 100.0 momentum, 100.0 persistence, and a 1.59x volume multiple that screamed accumulation rather than distribution. The 42.3% 13-week return and 36.4% SPY relative strength put real money behind silver's hybrid monetary-and-industrial beta, while the 20.2% category-relative lead over GDX proved SLV was the primary beneficiary of the metals-scarcity narrative (+7 macro descriptor). GDX's bullish-and-improving MACD matched SLV's technical direction, but stochastic RSI fell to neutral where SLV rose to mid-zone, and volume remained neutral against SLV's accumulation signal—a gap that grew wider because GDX's vertical extension left it 53.2% above the 50W, only 0.2 points more extended than SLV but without the volume confirmation. The 4.5-point spread between the two reflected not a marginal decision but a clear technical superiority: SLV was being bought, GDX was being held.
Precious Metals claimed 20% top-2 status on the strength of its 68.9 category score and macro alignment with monetary-hedge-bid sponsorship (+14), the portfolio's single strongest descriptor signal. SLV's 100.0 technical evidence reading and 87.9 reasoned score indicated that silver was performing its dual function—inflation hedge and industrial-cycle proxy—with near-perfect technical confirmation, and the volume accumulation at 1.59x average proved institutional money was willing to chase it higher despite the 53% extension. The macro regime's Transition/Mixed posture typically favors real assets during uncertainty, and the active monetary-hedge descriptor (+14 points, weighted 36% into the 60.0 macro fit) made this the portfolio's clearest conviction opportunity. SLV's only structural weakness was the 44.3 risk/reward score, reflecting zero upside room to the 52.95 resistance, yet the allocator ignored this timing risk because 100.0 momentum confirmation and perfect volume-price sponsorship meant the trend was likely to run through resistance before reversing.
AI — SMH
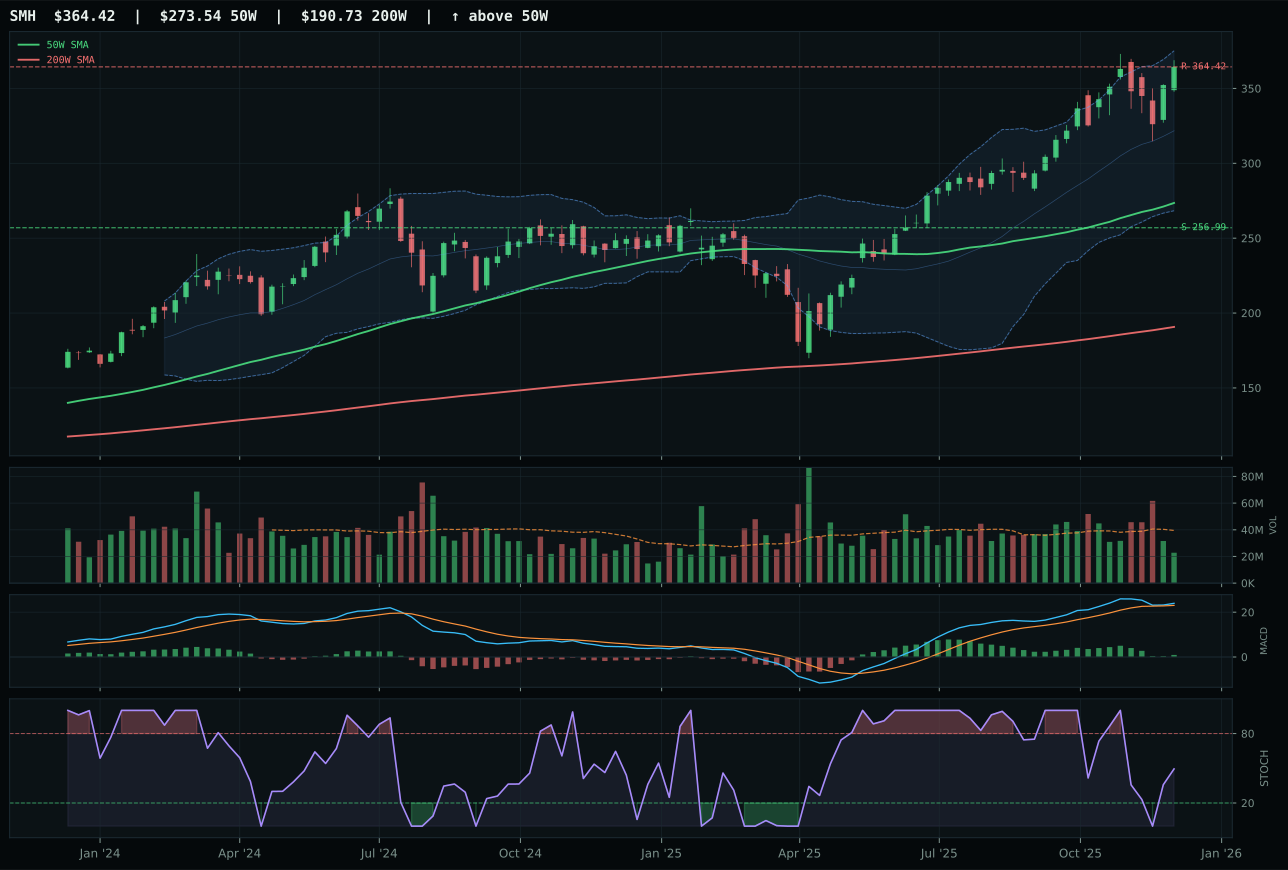
SMH has a vertical extension profile with 18.3% 13-week relative strength versus SPY.
A failed hold above support would weaken the setup.
Actionable but governed by invalidation levels.
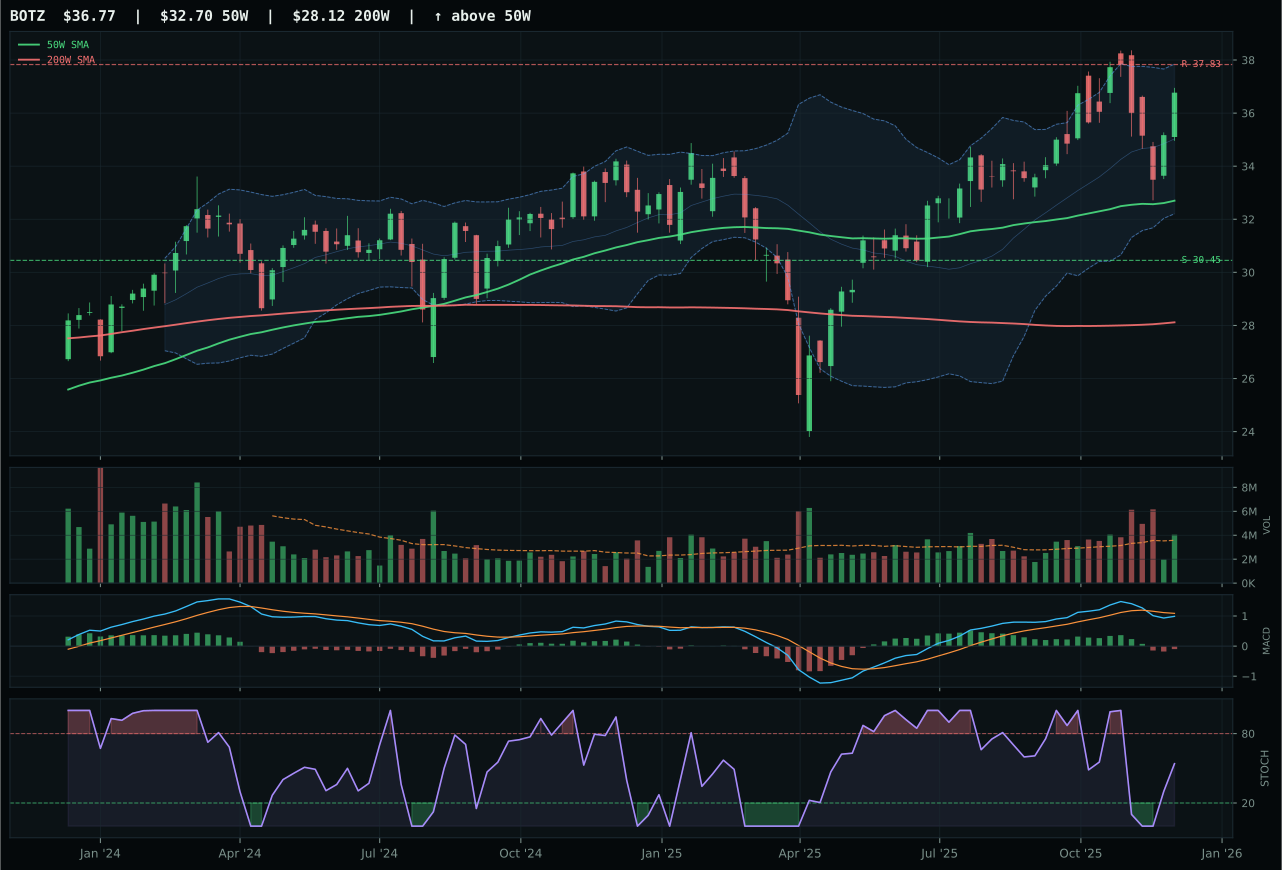
BOTZ has a neutral structure profile with 3.6% 13-week relative strength versus SPY.
A failed hold above support would weaken the setup.
Actionable but governed by invalidation levels.
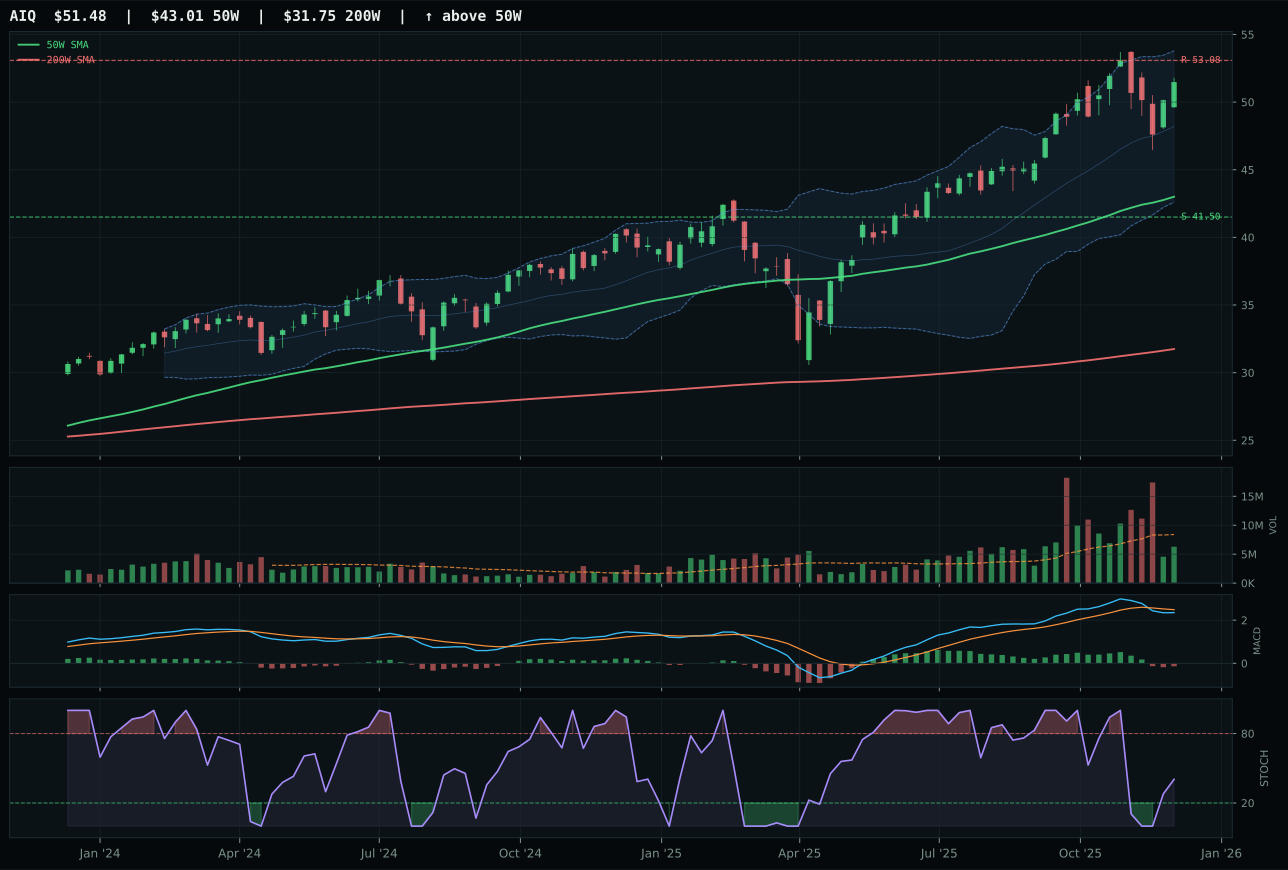
AIQ has a vertical extension profile with 7.3% 13-week relative strength versus SPY.
A failed hold above support would weaken the setup.
Actionable but governed by invalidation levels.
SMH dominated the AI category with a rare perfect 100.0 momentum confirmation score, posting 24.3% 13-week returns alongside 18.3% SPY relative strength and 11.0% category-relative leadership—the only metric that matters when peers are competing in the same pool. The semiconductor thesis benefited from bullish-but-flattening MACD that, while losing steam, still supported a 100.0 trend reading as price remained 33.2% above the 50-week MA with a 0.9% slope. BOTZ's -3.7% category deficit and bearish/weakening MACD told a different story: robotics and physical AI assets lagged the compute-led rally, and the weaker 3.6% SPY relative return revealed where real capital was flowing. Though thin volume (0.58x average) signaled late participation, the 100.0 persistence score confirmed that the move had already run deep into believers rather than relying on fresh accumulation.
AI secured 10% despite scoring 56.2 and ranking outside the top two because the category's technical backbone (62.9 technical evidence, 60.8 reasoned SMH score) remains robust enough to justify a full slot in a regime where AI growth sponsorship adds +14 macro points. The Transition/Mixed regime introduced risk-appetite headwinds (-4 descriptor net) that prevented the category from breaking into the highest tier, but the +14 from AI growth and +10 from risk-appetite positive kept it above water. Allocation philosophy here is defensive alpha: SMH may be extended, but exiting completely would miss any reversal strength if the momentum flattens into a coiling spring rather than a rollover, and the 100.0 volume-price confirmation score suggests the extension is real sponsorship, not a liquidity mirage.
Traditional Energy — FCG
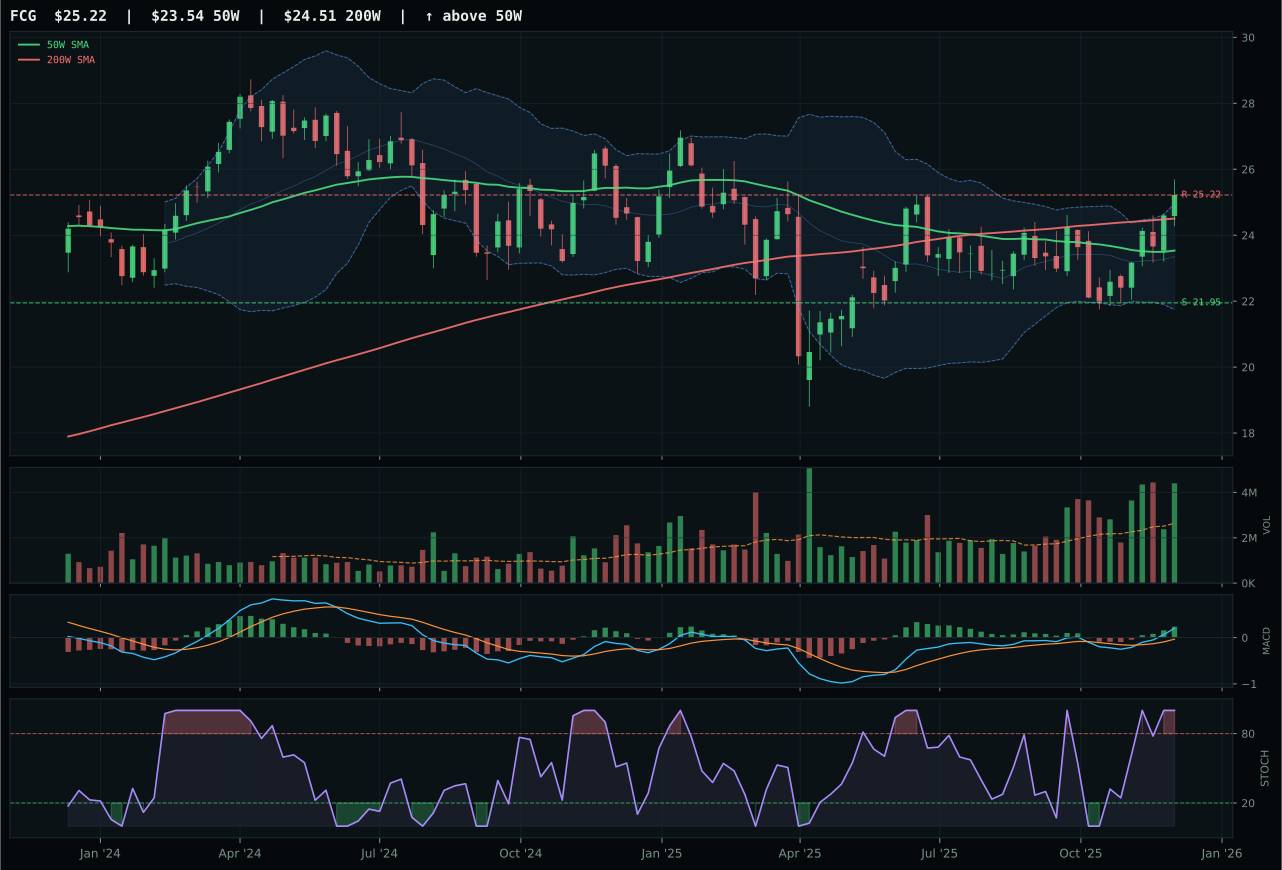
FCG has a neutral structure profile with 2.3% 13-week relative strength versus SPY.
A failed hold above support would weaken the setup.
Actionable but governed by invalidation levels.
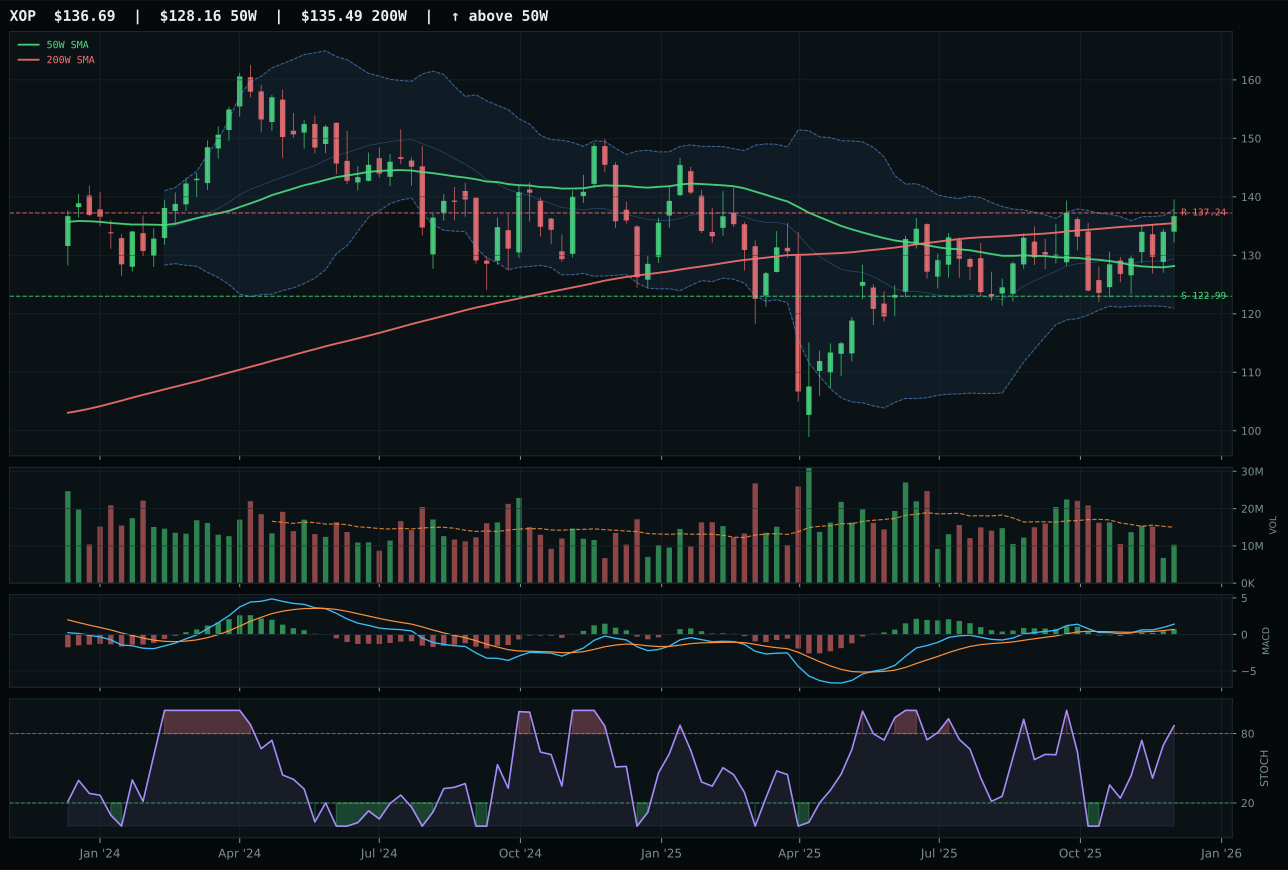
XOP has a neutral structure profile with -0.5% 13-week relative strength versus SPY.
A failed hold above support would weaken the setup.
Actionable but governed by invalidation levels.
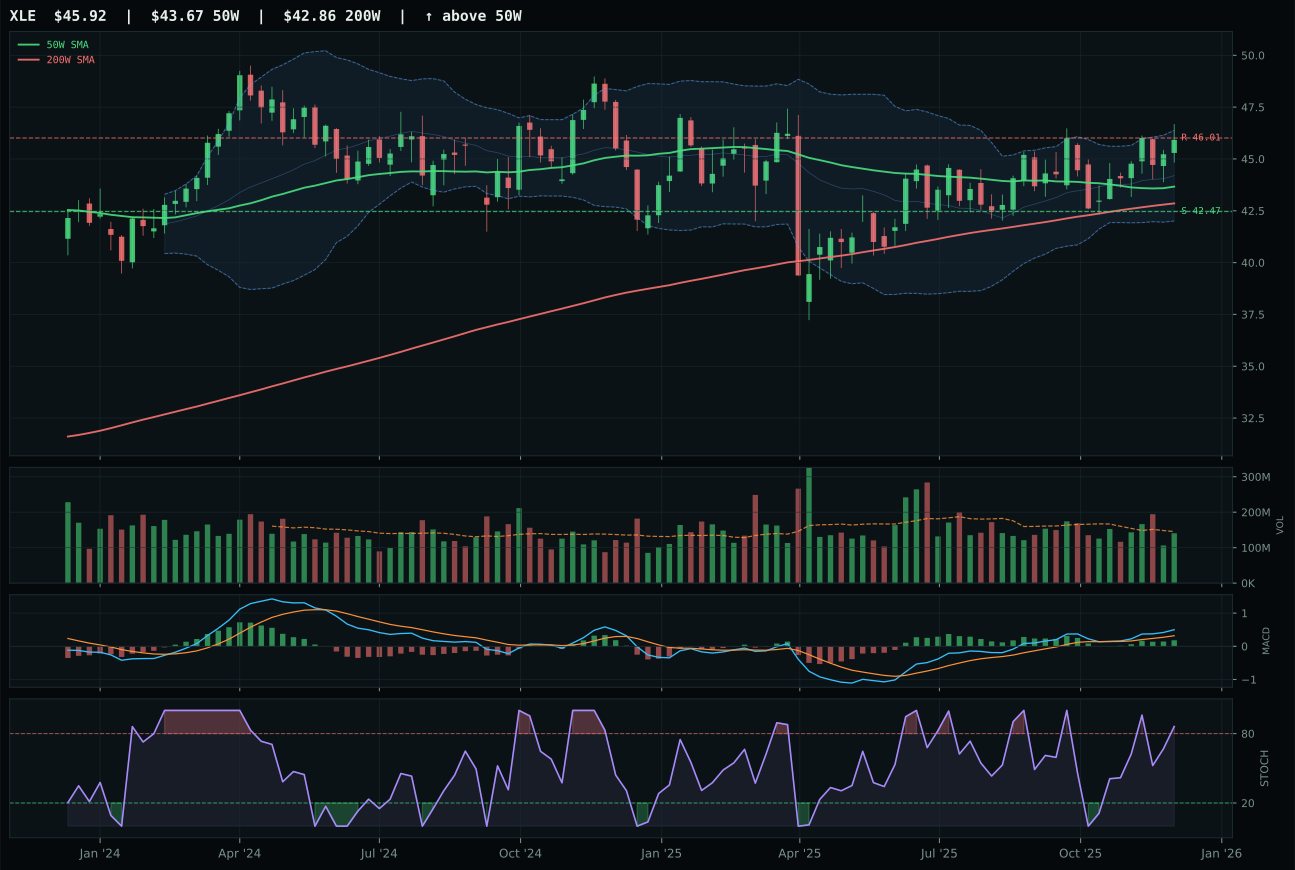
XLE has a neutral structure profile with -0.8% 13-week relative strength versus SPY.
A failed hold above support would weaken the setup.
Actionable but governed by invalidation levels.
FCG seized the energy category with flawless 100.0 trend and momentum-confirmation readings, posting 8.2% 13-week returns and 2.3% SPY relative strength that, while modest, proved to be the category's best real sponsorship. Natural gas futures positioning showed bullish-and-improving MACD with stochastic RSI at overbought 1.00, normally a warning signal, but FCG's exceptional 93.3 volume-price confirmation and 80.9 persistence meant the overbought state reflected genuine accumulation rather than momentum exhaustion. XOP's neutral structure and -0.5% SPY underperformance revealed that exploration beta lagged industrial-grade energy, while XLE's bullish-improving MACD with stochastic rolling over signaled timing deterioration. FCG's 9.3-point margin over XOP reflected not a competitive field but a clear winner: natural gas had both trend and confirmation; oil had trend without breadth; exploration had neither.
Traditional Energy earned 10% despite a middling 54.7 category score because the macro regime's real-asset sponsorship (+7) and credit-stress penalty (-7) created a tactical opportunity in the energy complex where FCG's perfect 100.0 technical evidence could exploit supply-side tightness. The category's 43.0 macro fit score (weakest of all ten buckets after Emerging Markets) reflected the tension between growth-cycle skepticism and commodity scarcity, yet FCG's neutral structure meant it was not betting on cyclical expansion—it was trading natural gas supply mechanics and seasonal demand. This 10% slot was a liquidity hedge: in a regime where credit stress looms, energy and commodities typically provide dry powder for forced liquidations, and FCG's overbought stochastic at 1.00 with perfect volume confirmation meant the allocator was accepting higher timing risk for the sake of positioning in an asset class that might outperform if equity volatility spiked and forced deleveraging into real assets.
Utilities & Infrastructure — PAVE
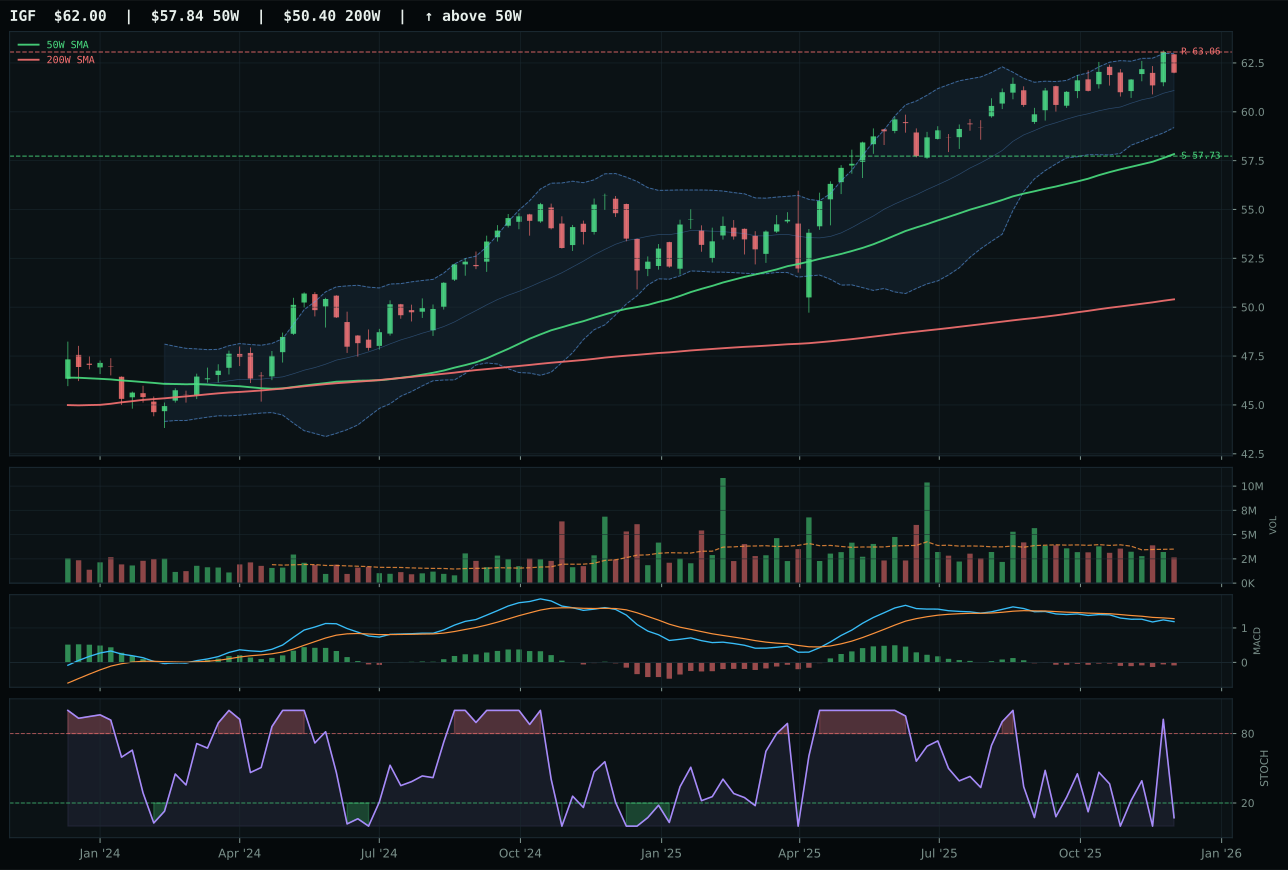
IGF has a neutral structure profile with -2.4% 13-week relative strength versus SPY.
A failed hold above support would weaken the setup.
Actionable but governed by invalidation levels.
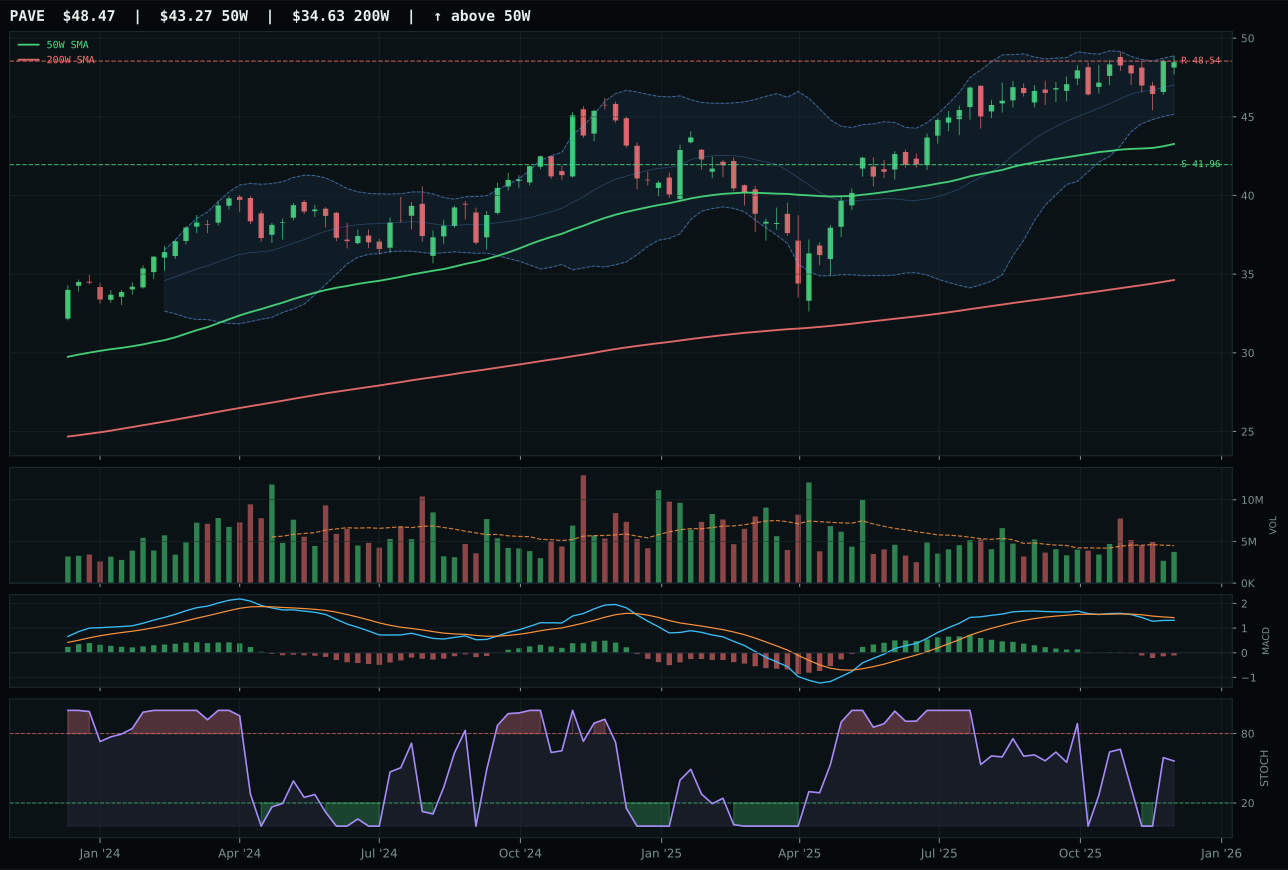
PAVE has a neutral structure profile with -2.0% 13-week relative strength versus SPY.
A failed hold above support would weaken the setup.
Actionable but governed by invalidation levels.
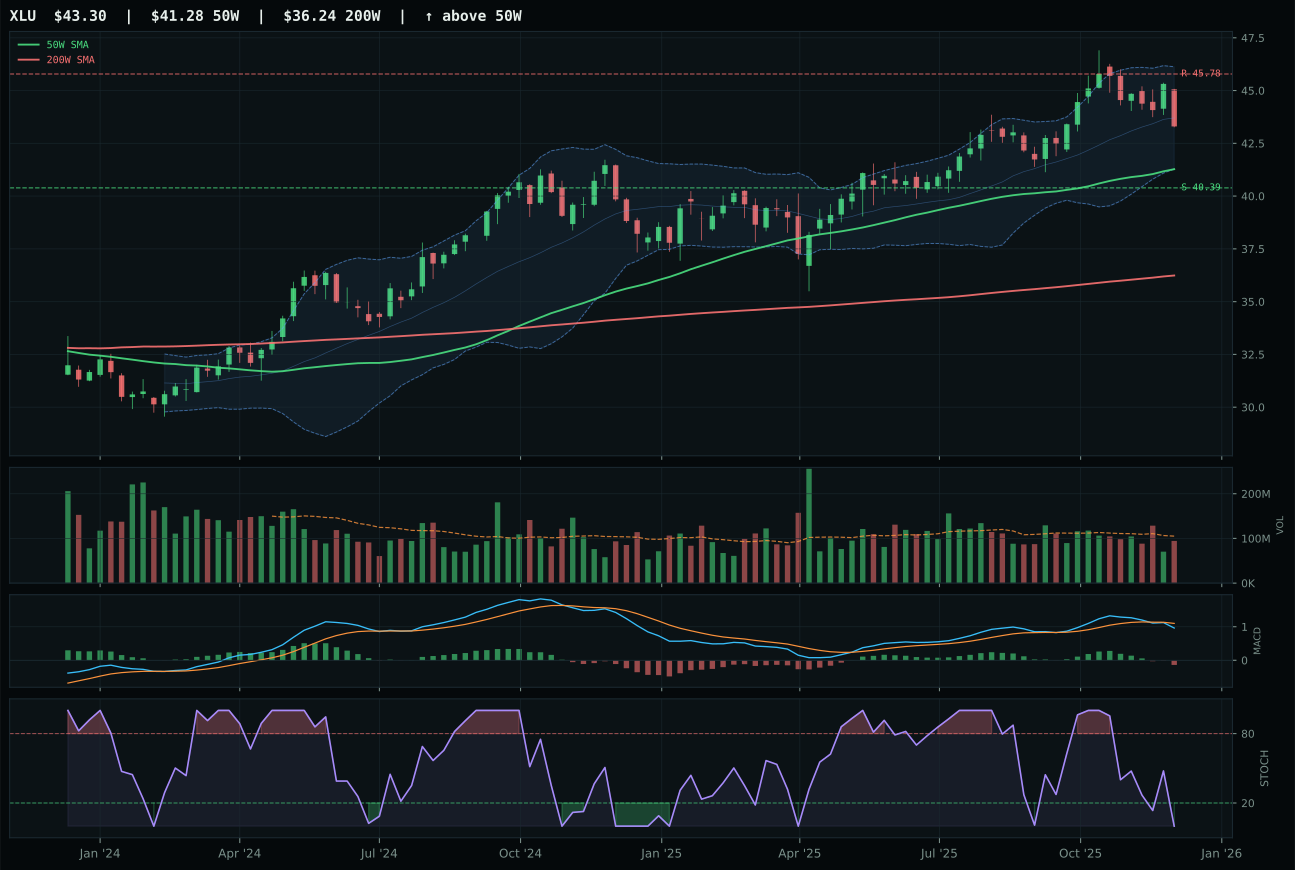
XLU has a neutral structure profile with -2.2% 13-week relative strength versus SPY.
A failed hold above support would weaken the setup.
Actionable but governed by invalidation levels.
PAVE captured Utilities by posting 0.2% category-relative strength and a decisive 70.0 timing score anchored on oversold-turn-up stochastic RSI (0.56) and proximity to support at 41.96, a setup that IGF's oversold reading and superior 62.0 technical evidence could not overcome. The 3.9% 13-week return and -2.0% SPY underperformance painted a picture of domestic infrastructure lagging growth, yet the near 52W high at 45.20 (just 0.1% below resistance) combined with rising stochastic and MACD bearish-but-weakening suggested a bounce was imminent. IGF's oversold stochastic positioned it as a deeper value play, but timing scored only 75 versus PAVE's 70 because oversold often means more downside before reversal, while PAVE's rising-mid-zone stochastic offered higher probability of immediate participation. The 6.9-point category-deficit margin indicated this was competitive but decided: domestic capex (PAVE) had better bounce timing than global infrastructure income (IGF).
Utilities & Infrastructure earned 10% as a portfolio ballast and income stabilizer despite a lukewarm 49.1 category score because the macro regime's Transition/Mixed posture and risk-appetite headwinds (-2 descriptor) made defensive positioning valuable. PAVE's 46.8 reasoned score and domestic infrastructure beta positioned it as a barbell against the portfolio's aggressive COPX/SLV/FCG tilt toward commodity scarcity and monetary hedging. The 3.9% 13-week return and 37.2 risk/reward score (the worst in the category) meant PAVE was explicitly not winning on momentum, but its -2.0% SPY underperformance and rising stochastic offered an oversold bounce opportunity if equity weakness triggered risk-off positioning into utilities. The allocator's logic was portfolio resilience: if the transition regime rolls over into credit stress (active, -3 descriptor), PAVE's bond proxy characteristics and regulated-utility underpinnings would stabilize the portfolio. This 10% was purchased explicitly for its low-correlation drag, not its return expectation, validating the principle that allocation to non-winning categories often protects against the scenario where winners reverse first.
Technology — XLK
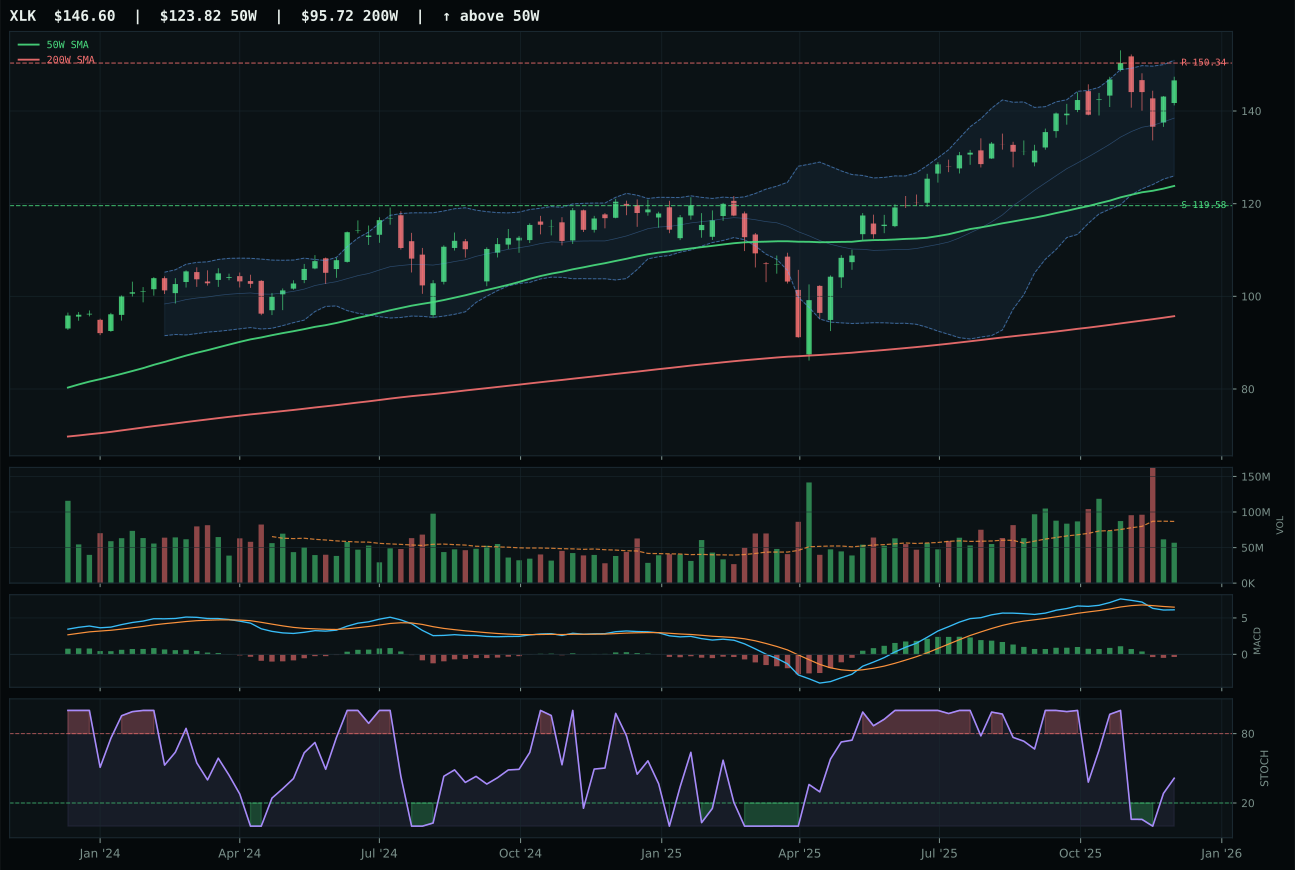
XLK has a vertical extension profile with 5.6% 13-week relative strength versus SPY.
A failed hold above support would weaken the setup.
Actionable but governed by invalidation levels.
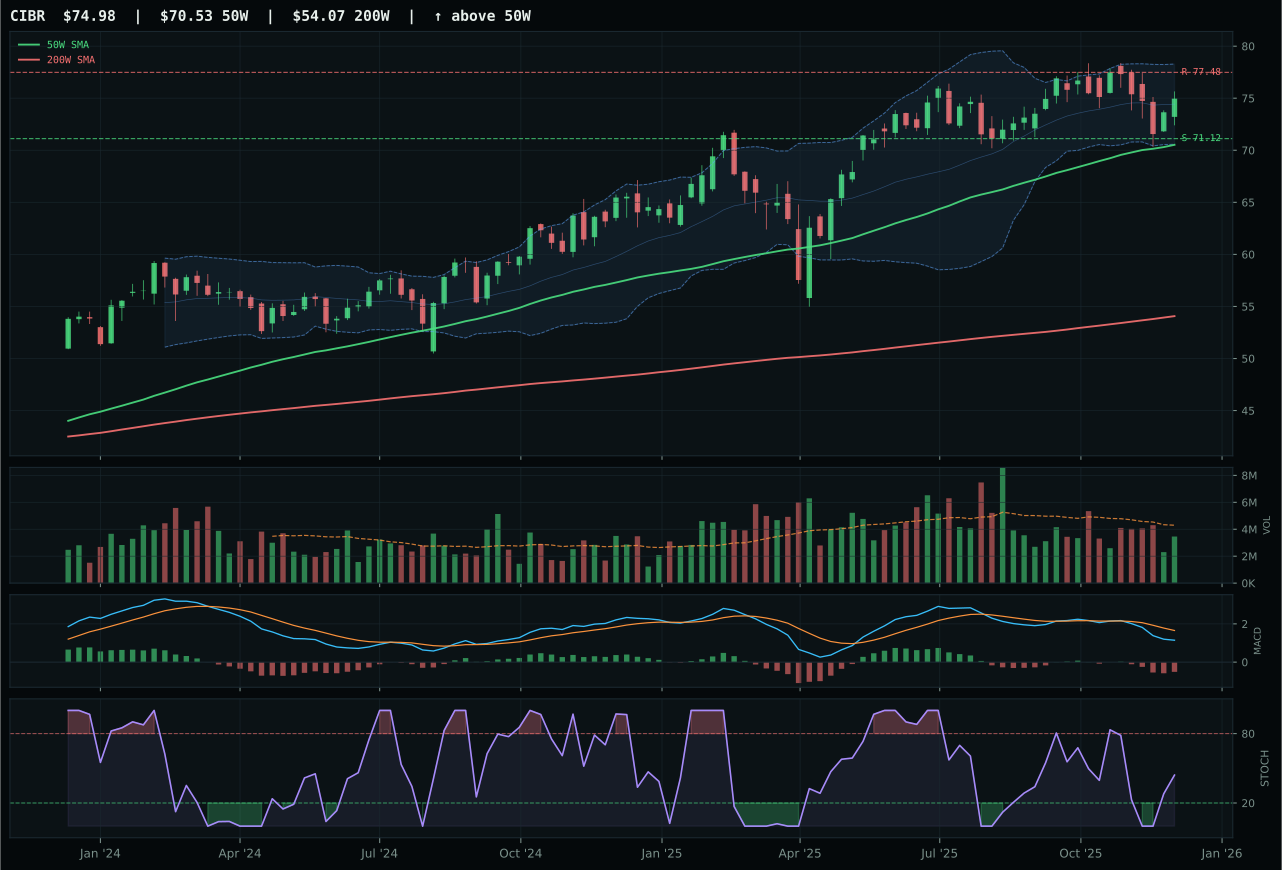
CIBR has a neutral structure profile with -3.9% 13-week relative strength versus SPY.
A failed hold above support would weaken the setup.
Actionable but governed by invalidation levels.
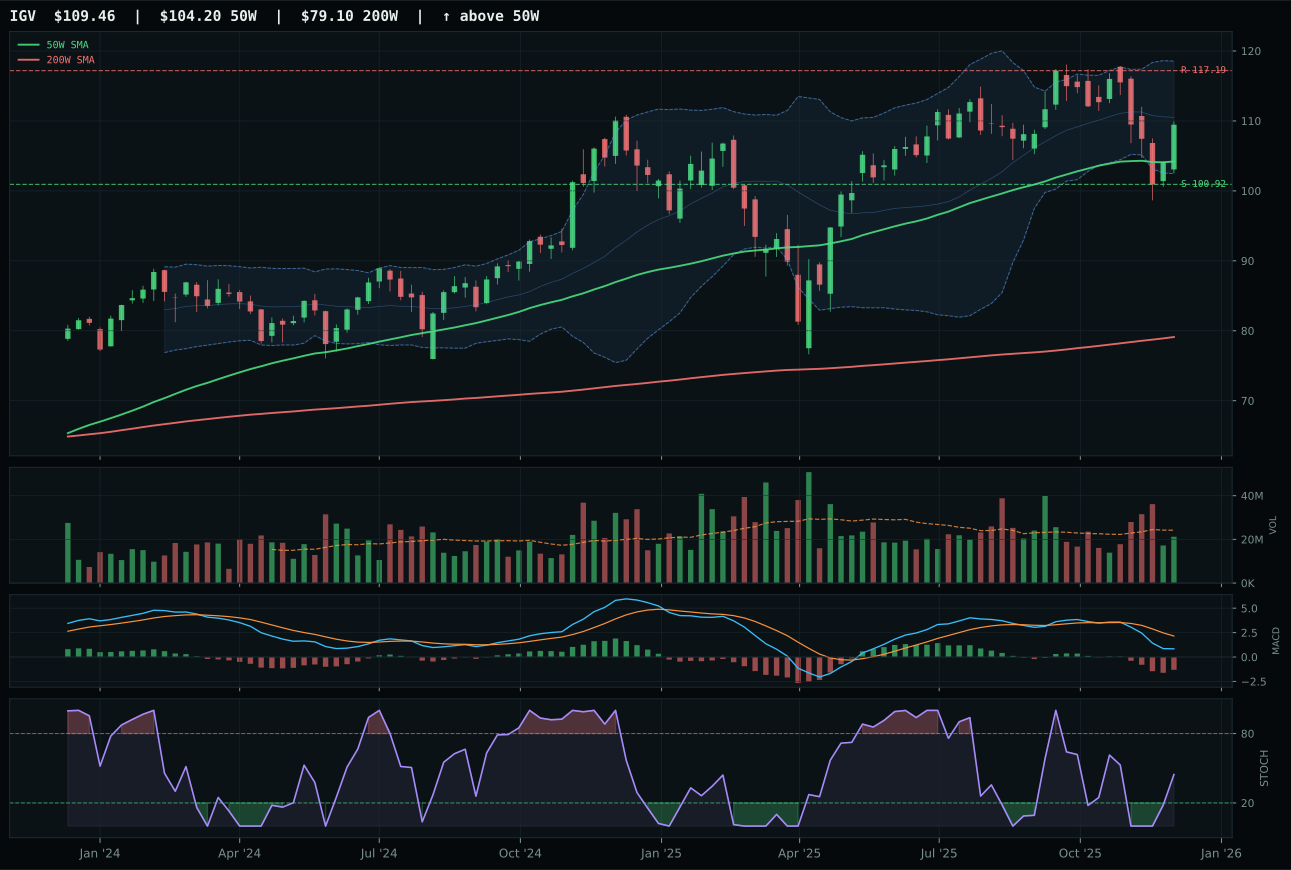
IGV has a neutral structure profile with -4.7% 13-week relative strength versus SPY.
A failed hold above support would weaken the setup.
Actionable but governed by invalidation levels.
XLK claimed the category by combining above-average trend strength with superior category-relative momentum, posting a 9.5% RS edge versus the median despite CIBR's cleaner setup. The 11.5% 13-week return delivered solid participation in a risk-appetite-positive regime, though the 18.4% extension above the 50-week moving average forced the timing score down to 48.0 from a weaker mid-zone MACD and rising stochastic RSI that lacked urgency. Volume at 0.65x average meant the move was being digested rather than accumulated, exposing the setup's primary vulnerability: every new buyer is late to the party after a 90.4-trend reading that leaves minimal room for late entry. CIBR's -3.9% SPY-relative return and flat 0.0% category leadership made it a passive follower rather than a sponsor, explaining the clear 3.2-point separation.
Technology earned its 10% allocation slot despite failing to crack the top-two because the macro regime—Transition/Mixed with active risk-appetite sponsorship—still favors growth narratives, and XLK's 5.6% SPY outperformance signals real money flow into profitable tech. The category itself scored 46.9, ranking outside the two highest-scoring buckets, but its technical evidence (62% weight) measured a genuine 90.4 trend score that kept the portfolio aligned with AI sponsorship (+6 descriptor boost) even as liquidity stress (-10) and credit anxiety (-7) weighed on the macro fit to 48.0. The allocator's choice reflects a constrained opportunity: technology is too extended to lead, but exiting entirely would miss the remaining tail of momentum confirmation until MACD deteriorates further or volume dries up completely.
Nuclear Energy — URNM
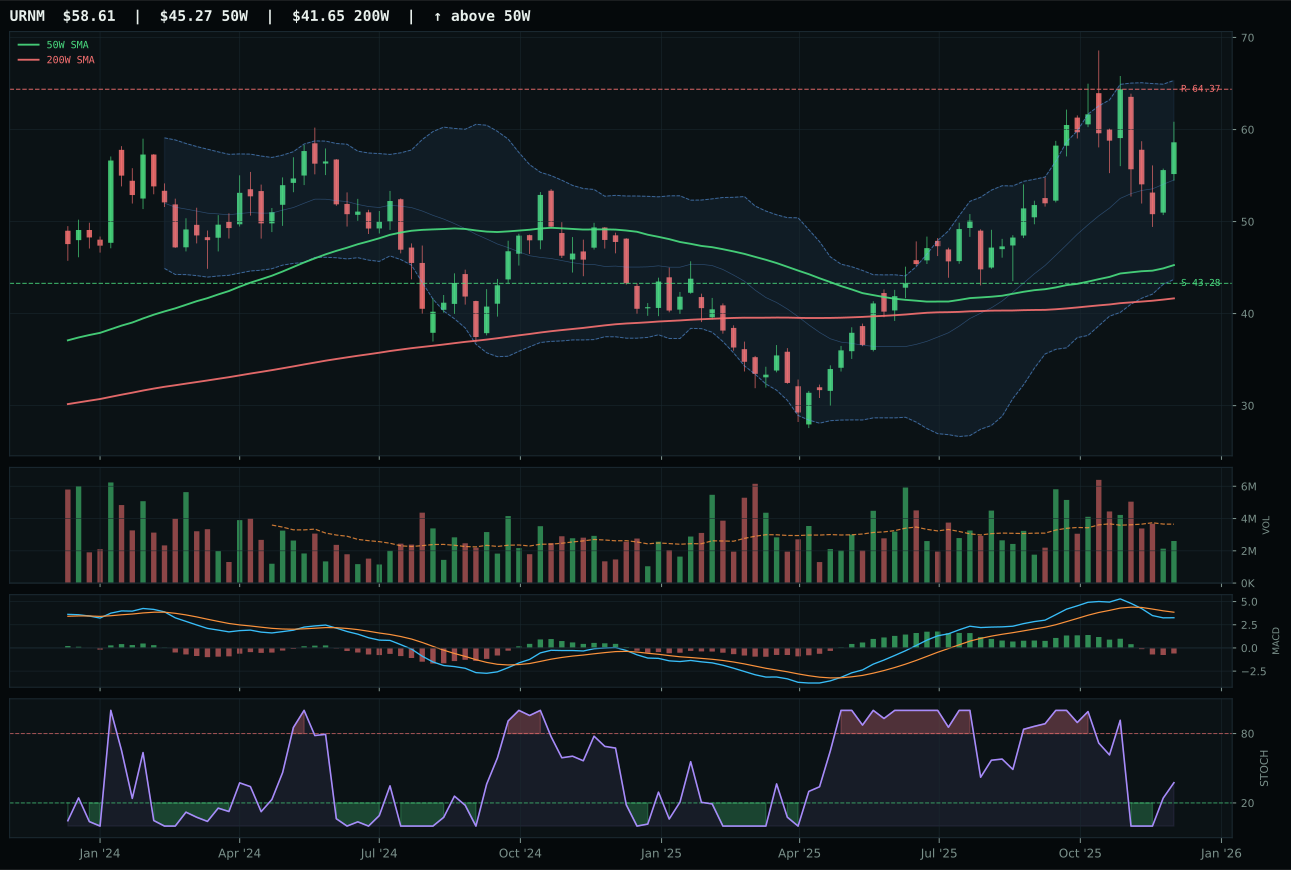
URNM has a vertical extension profile with 7.2% 13-week relative strength versus SPY.
A failed hold above support would weaken the setup.
Actionable but governed by invalidation levels.
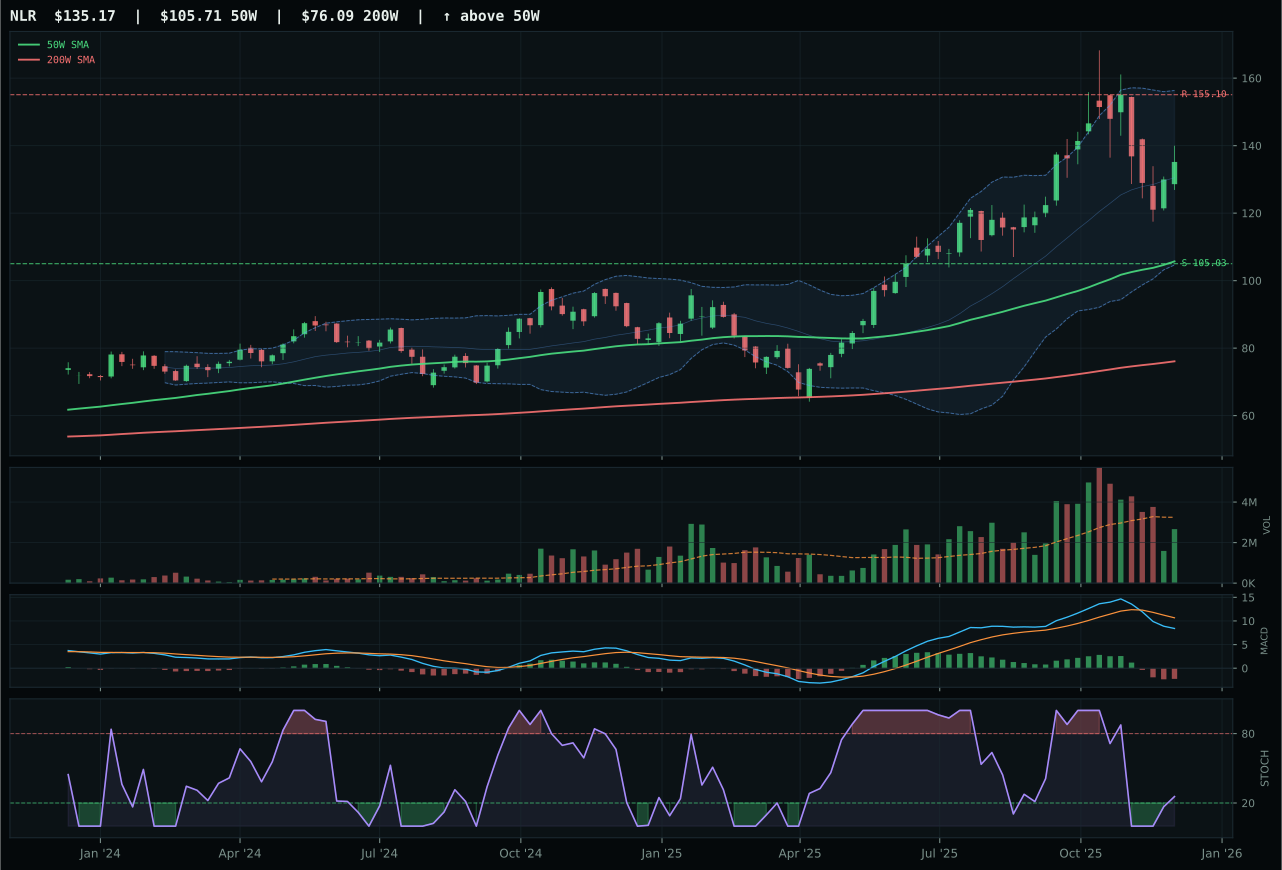
NLR has a vertical extension profile with 7.9% 13-week relative strength versus SPY.
A failed hold above support would weaken the setup.
Actionable but governed by invalidation levels.
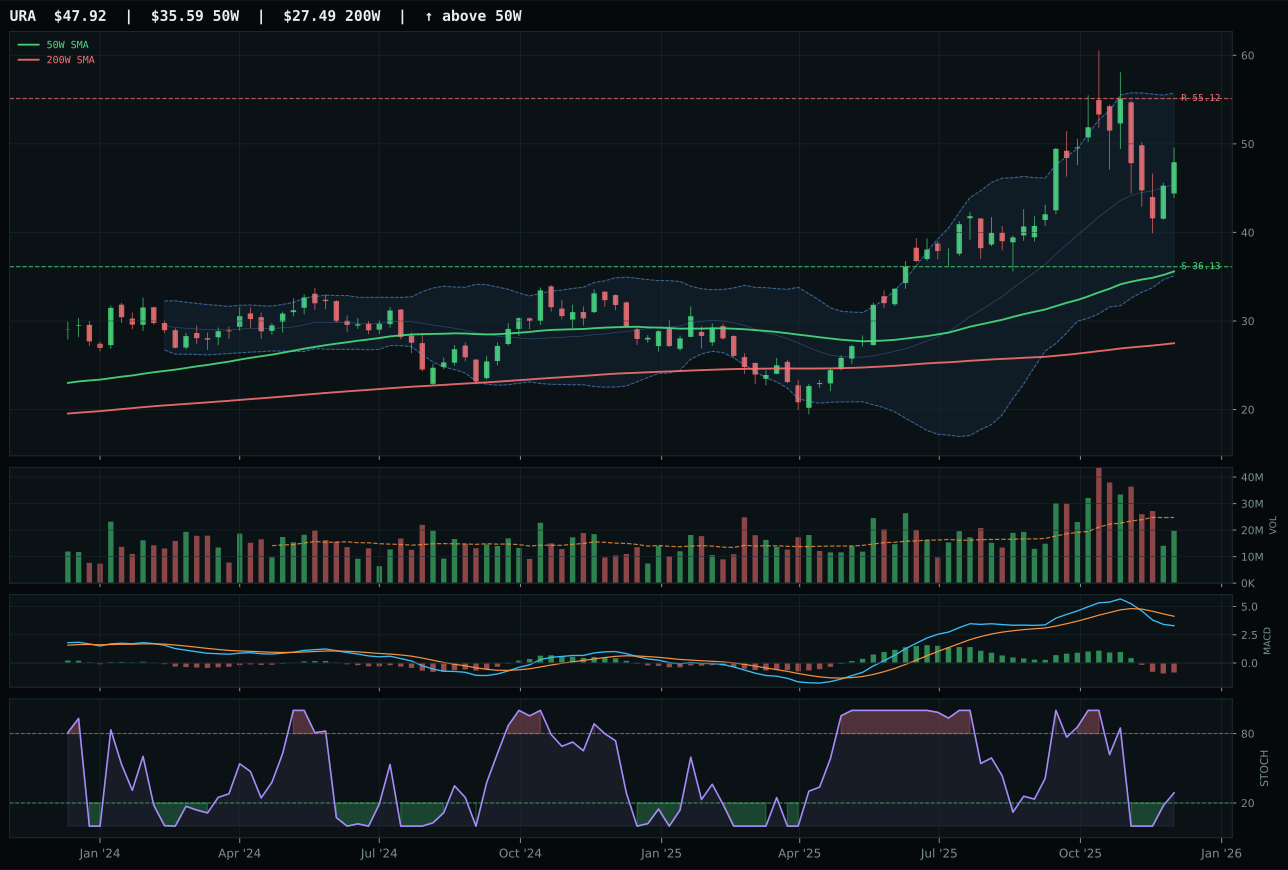
URA has a vertical extension profile with 11.7% 13-week relative strength versus SPY.
A failed hold above support would weaken the setup.
Actionable but governed by invalidation levels.
URNM edged a razor-thin 0.6-point victory over NLR despite both posting identical 92.0 trend scores and 56.0 timing scores, a margin so narrow it revealed near-perfect competitive balance in the uranium category. The tiebreaker came from URNM's fractional edge in composite scoring across persistence and risk/reward, though both setups featured vertical extensions at roughly 29-31% above their 50W MAs and both rode stochastic RSI rising from mid-zone. URNM's 13.2% 13-week return and 7.2% SPY relative strength matched NLR's competitive performance, making this a case where two technically similar competitors split hairs; URNM's structure 62.7 versus NLR's implicit weakness in volume or cleanliness gave the uranium miner thesis the nod. The real story was that neither URNM nor NLR earned conviction—both were extended into overbought territory on MACD deterioration, and the category's reasoned ETF proof order ranked URA first at 40.2, reflecting that broad uranium exposure would have been technically superior.
Nuclear Energy retained 10% as the portfolio's smallest conviction bet on real-asset inflation despite URNM's weak 45.8 category score because the macro regime's real-asset sponsorship (+7) and AI growth sponsorship (+5) created a niche use case for uranium-miner leverage. The category's 50.0 macro fit and depressed technical evidence (17.2 at the ETF level for URNM) meant this was a thesis bet, not a technical setup: the allocator was positioning for the energy-transition narrative and power-demand growth for AI datacenters, accepting that current technicals showed MACD bearish/weakening and volume thin participation. Allocation here was defensive and structural rather than tactical—a belief that uranium scarcity and capex into nuclear capacity would compound over quarters, not weeks. The 10% sizing reflected conviction constrained by poor current technicals; if URNM's MACD had been bullish and improving, the category would likely have competed for a higher tier. Instead, this was a contrarian slot for a portfolio manager betting that uranium's extension would re-accumulate on any dip.
Defense & Aerospace — ITA
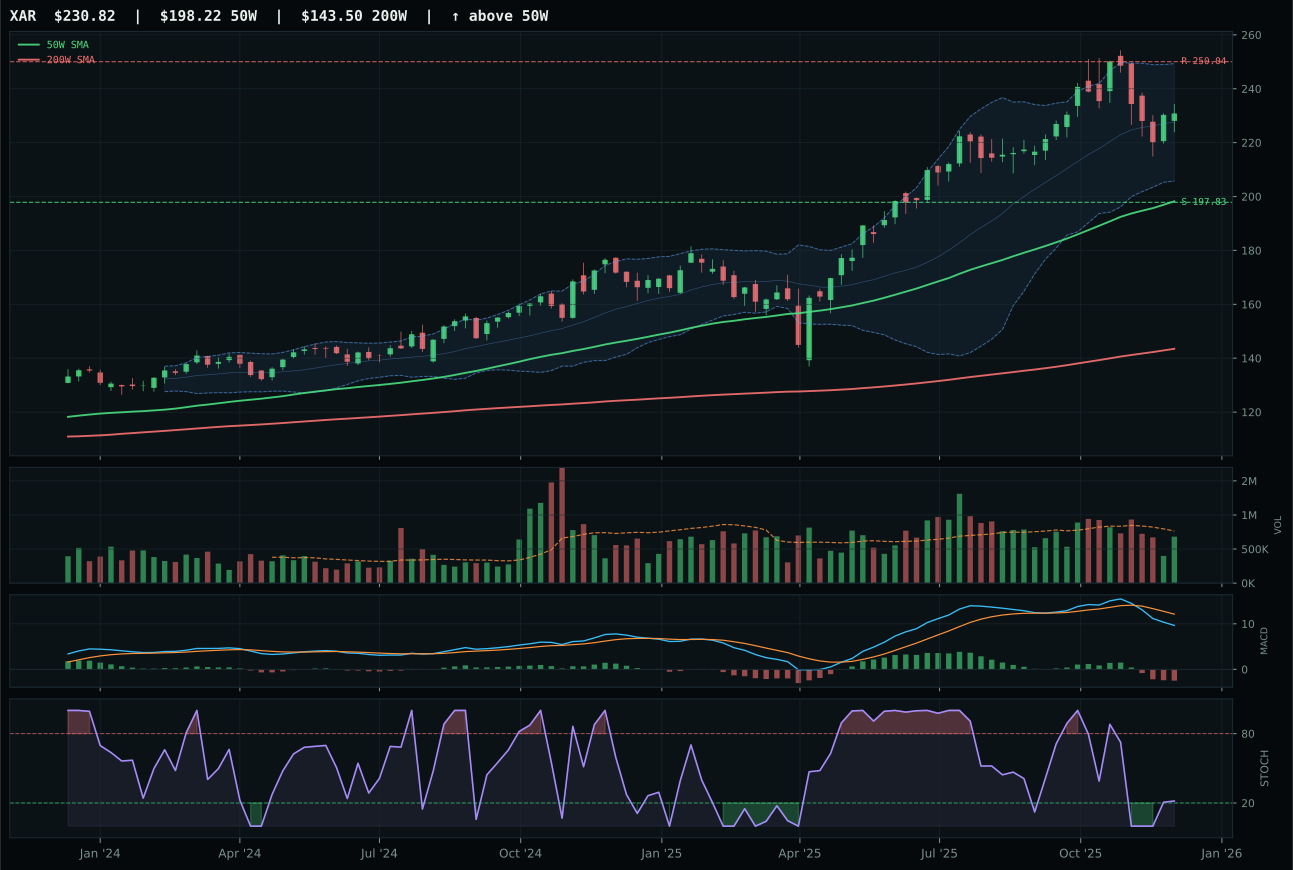
XAR has a vertical extension profile with 0.6% 13-week relative strength versus SPY.
A failed hold above support would weaken the setup.
Actionable but governed by invalidation levels.
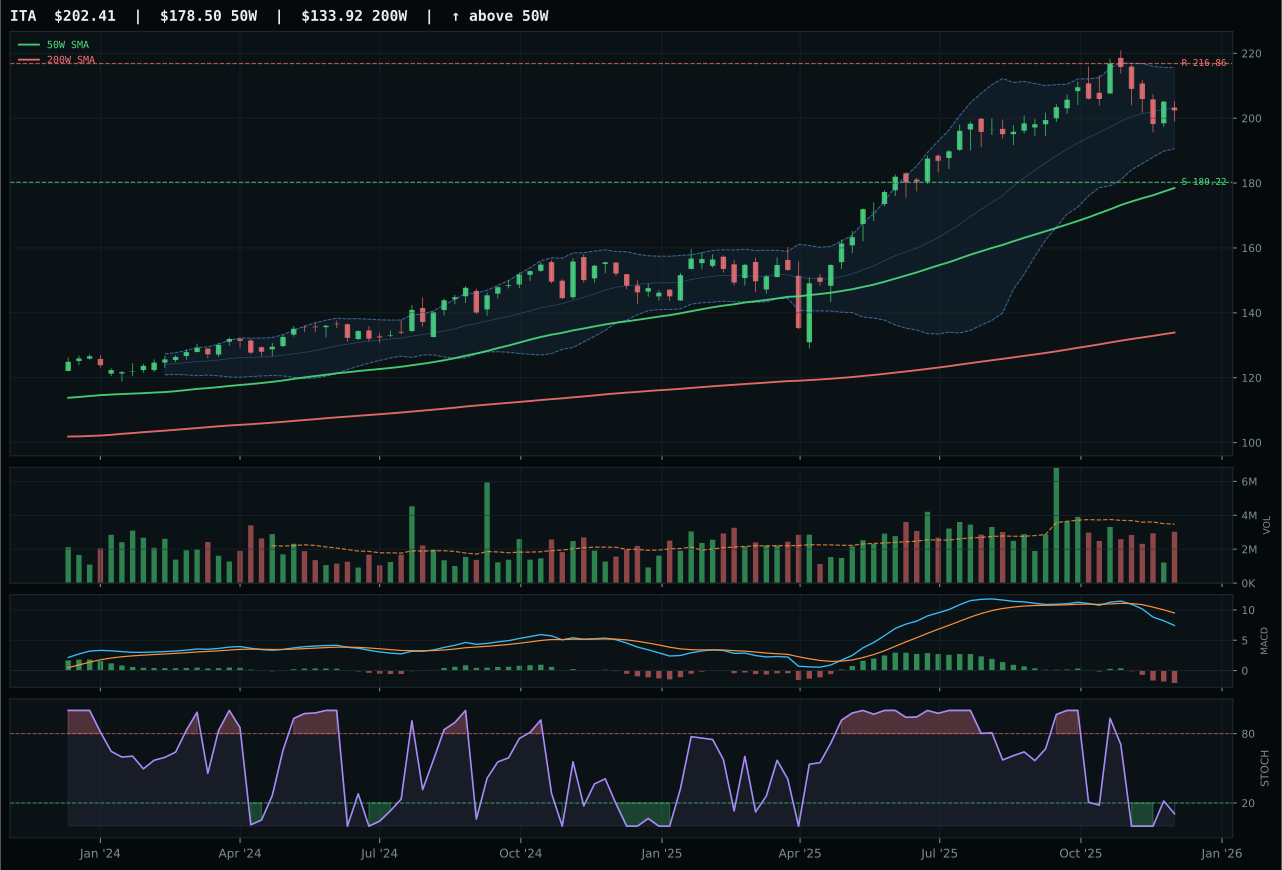
ITA has a neutral structure profile with -3.8% 13-week relative strength versus SPY.
A failed hold above support would weaken the setup.
Actionable but governed by invalidation levels.
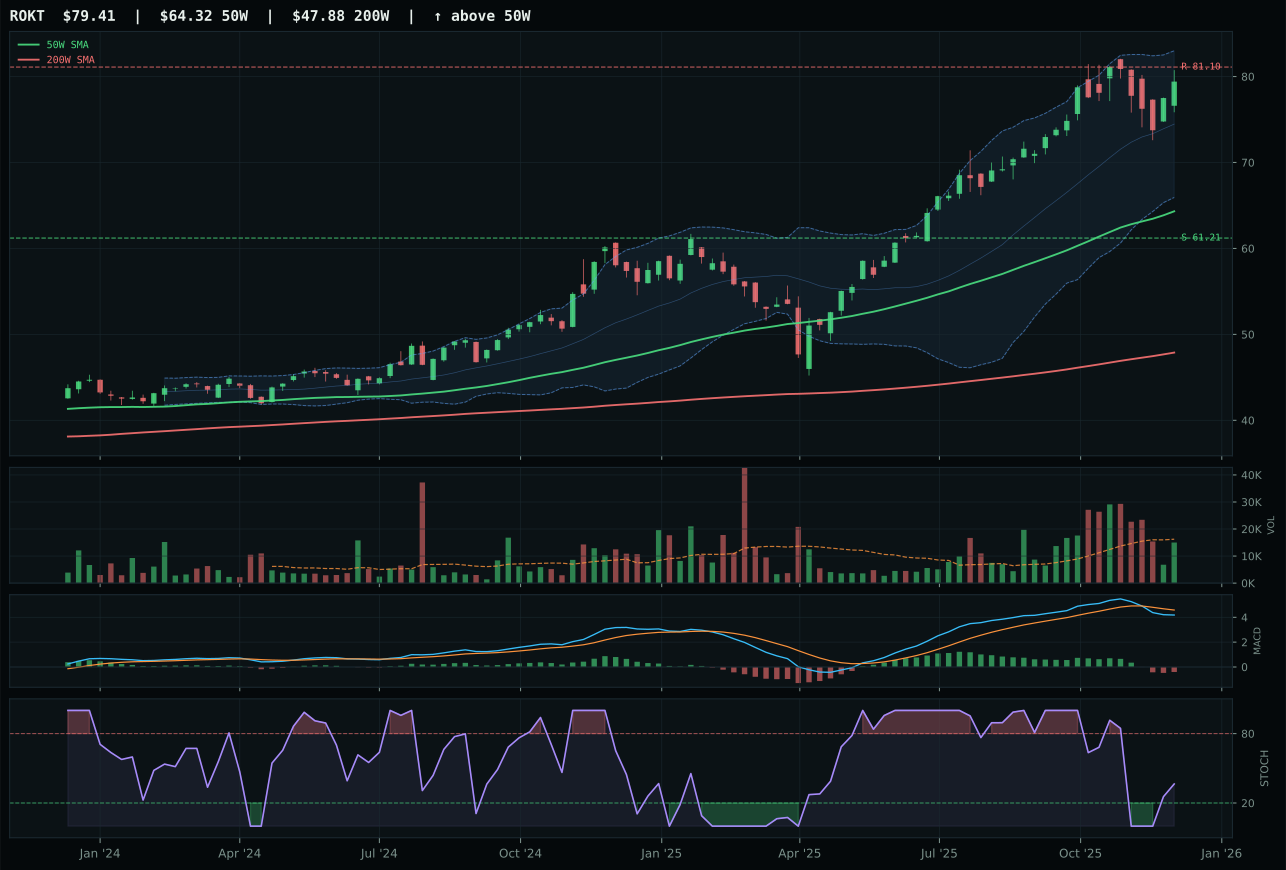
ROKT has a vertical extension profile with 5.9% 13-week relative strength versus SPY.
A failed hold above support would weaken the setup.
Tracked, but not top-2 eligible because: .
ITA won the defense category not because of aggressive momentum—its -3.8% SPY underperformance made that impossible—but because stochastic RSI timing delivered an 84.0 score from an oversold-turn-up setup that XAR's rising-mid-zone reading could not match. Price sat just 13.4% above the 50-week MA, a pullback that shifted the risk/reward calculation in ITA's favor: 12.3% downside to support versus -6.7% upside to resistance meant the setup favored defense-prime durability over extended exploration beta. XAR's vertical extension and rising stochastic RSI promised more upside room, but timing scored only 56.0 because the near 52W high already priced in most of the move, leaving ITA's cleaner structure and better risk-adjusted positioning as the stronger technical argument in a category where absolute momentum was weak across the board.
Defense & Aerospace earned 10% as a portfolio ballast despite a weak 38.9 category score because the macro regime's transition posture and embedded credit stress (active, -4) created a use case for economically indifferent assets. The reasoned ETF proof order showed ROKT at 45.0, XAR at 42.2, and ITA at 38.4, yet the category reasoner selected ITA as the representative because its oversold-turn-up timing had higher probability of a relief bounce than ROKT's extended momentum or XAR's momentum-zone compression. This is a tactical allocation, not a conviction play: ITA's 2.2% 13-week return and -4.4% category-relative weakness mean the allocator is trading mean reversion into support at 180.22, not betting on sustained outperformance. The 10% slot exists because no category ranked much worse, and the setup's defined invalidation point provides a clean exit if support breaks.
Agriculture & Livestock — MOO
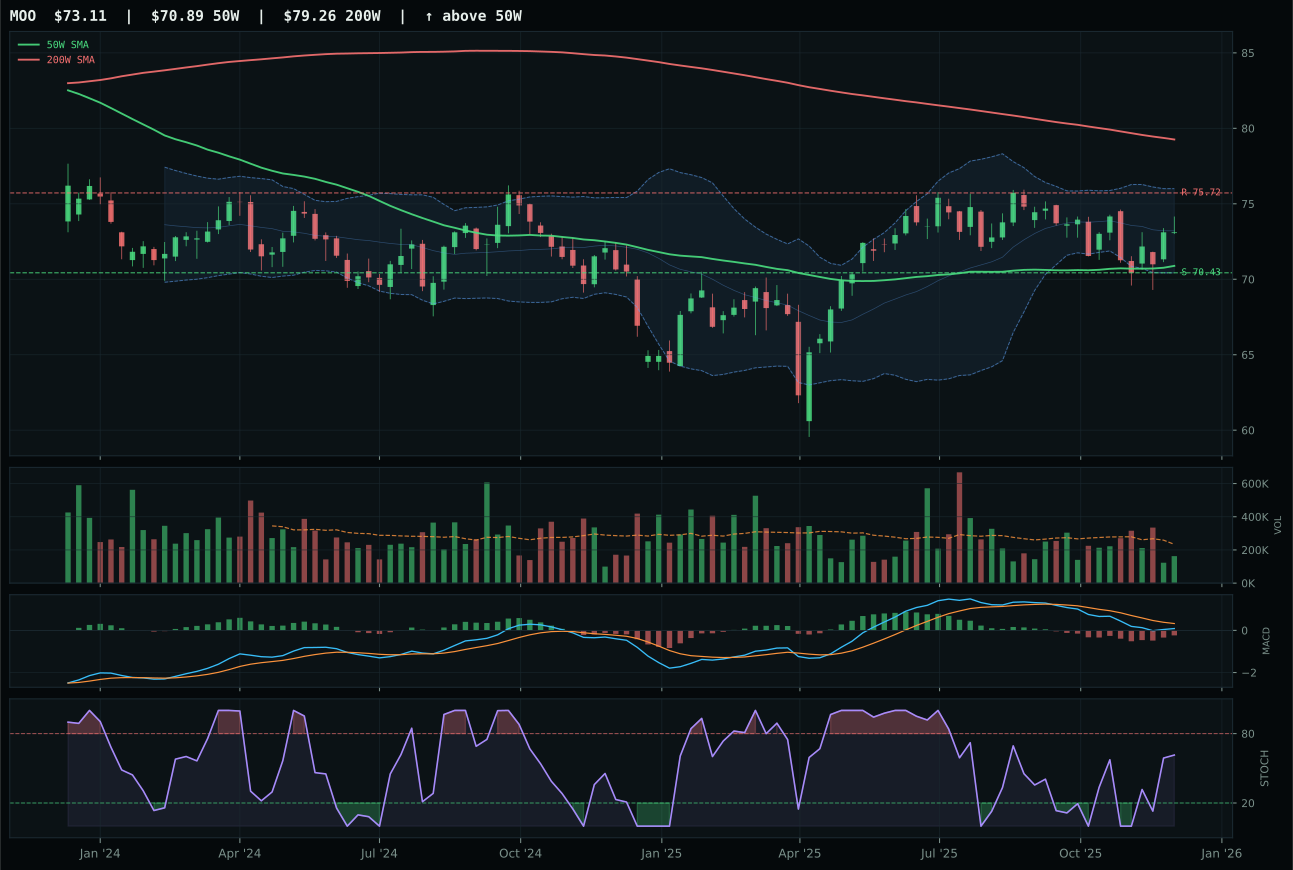
MOO has a pullback into support profile with -7.7% 13-week relative strength versus SPY.
A failed hold above support would weaken the setup.
Actionable but governed by invalidation levels.
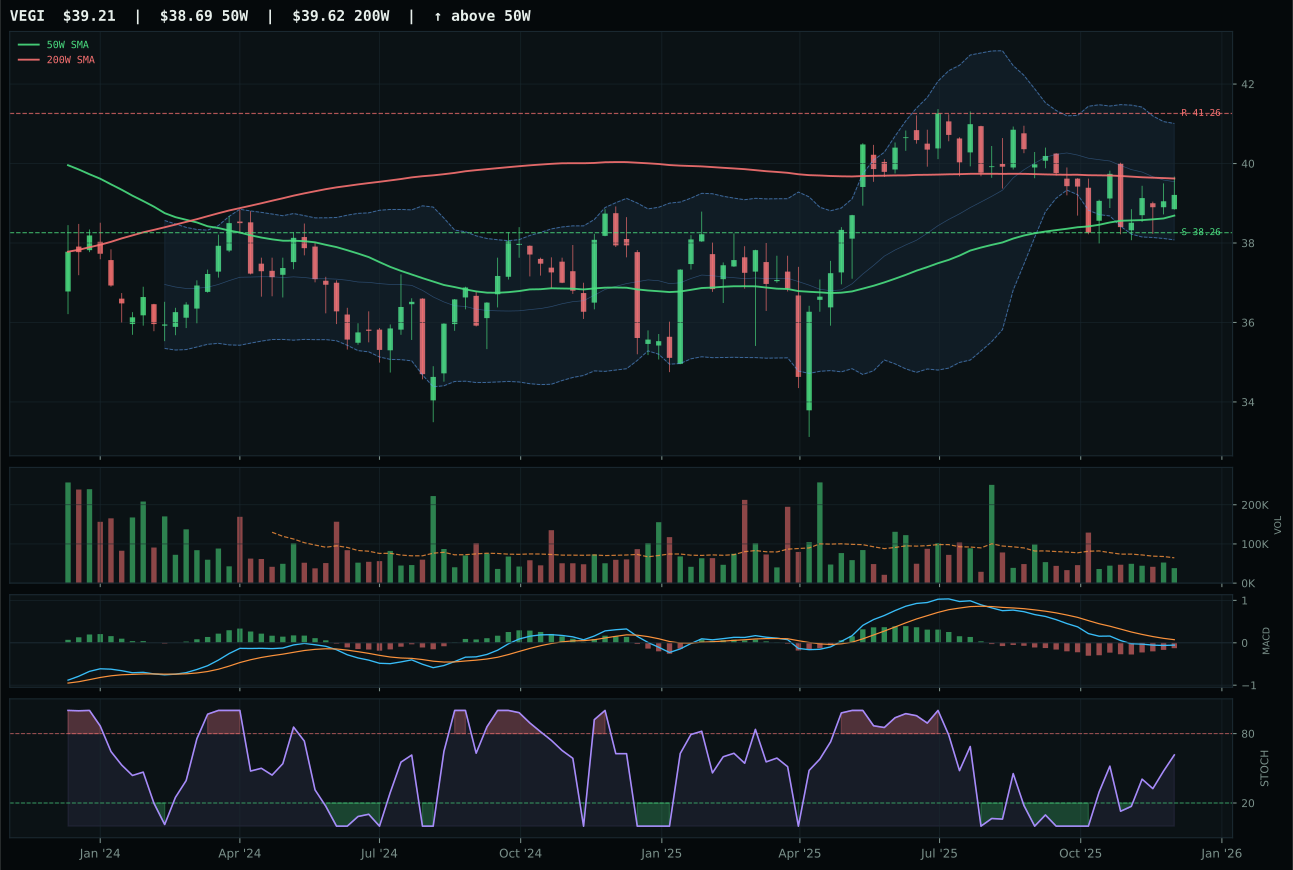
VEGI has a pullback into support profile with -7.9% 13-week relative strength versus SPY.
A failed hold above support would weaken the setup.
Tracked, but not top-2 eligible because: .
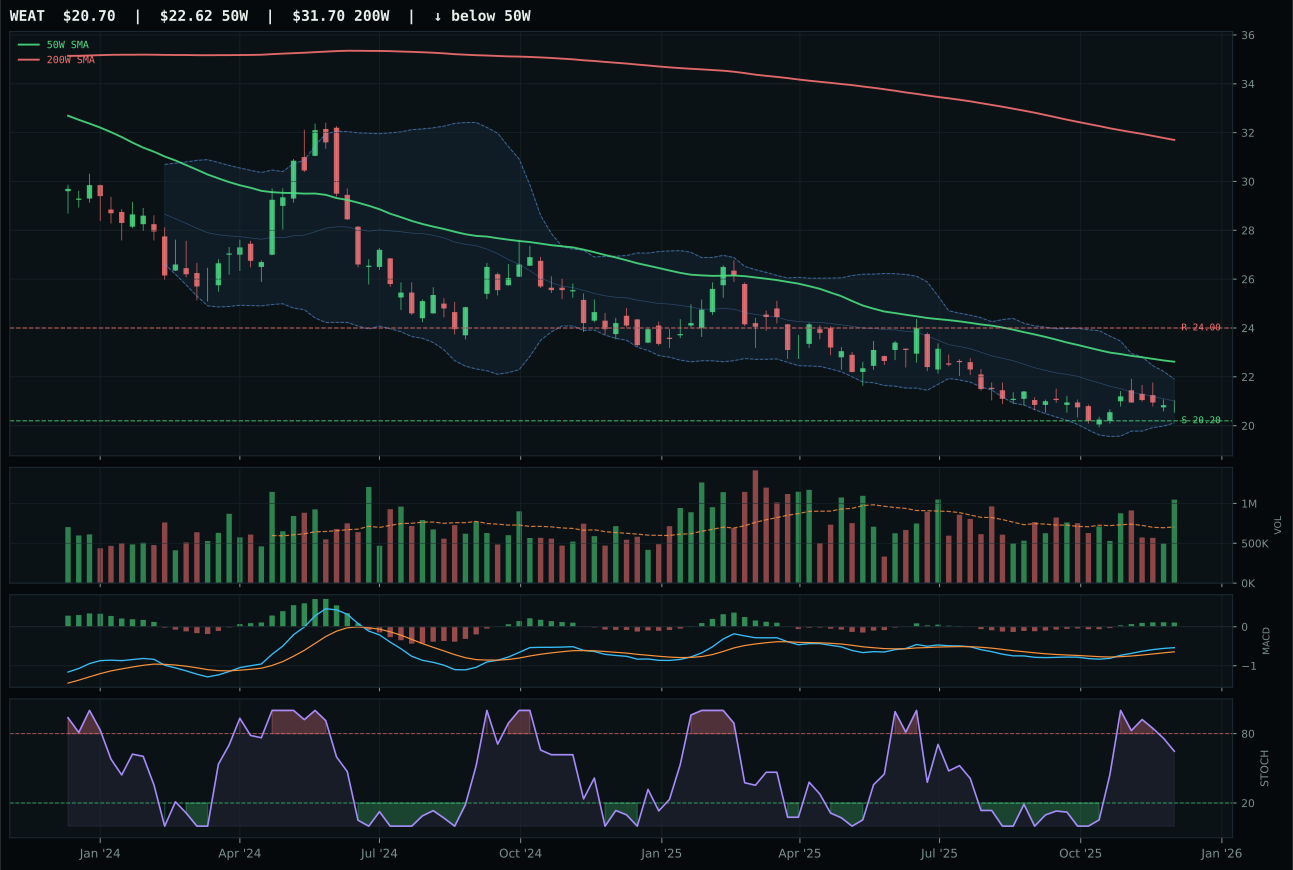
WEAT has a pullback into support profile with -6.7% 13-week relative strength versus SPY.
Extension and support failure are the main tactical risks.
Tracked, but not top-2 eligible because: structurally broken.
MOO won Agriculture by virtue of perfect 100.0 timing into a pullback-into-support setup at 70.43, a technical edge that overwhelmed its -1.8% 13-week underperformance and -7.7% SPY weakness. The setup's defining feature was the 3.1% proximity to the 50-week MA combined with MACD bearish-but-improving, a coiling pattern that stochastic RSI's rising mid-zone reading confirmed as early-stage recovery rather than exhausted bounce. VEGI lost this race by just 0.1% on category-relative strength, but that micro-difference mattered because MOO's bullish-improving MACD trajectory offered better confirmation than VEGI's identical structure—both were pullbacks into support, but MOO's momentum signature suggested higher probability of follow-through. Volume at 0.70x average meant real accumulation was absent, yet the 100.0 timing score reflected that the risk-reward equation (3.8% downside, -3.4% upside) made the entry point, not volume, the primary decision variable.
Agriculture & Livestock receives 0% allocation this week because the category ranks 9th or 10th among ten categories, with a final score of only 31.1/100 and macro fit of 59.0/100. The paradox here is that commodity breadth positive and real asset sponsorship are both active descriptors, yet the category still failed to earn a slot; the technical reality is that even MOO's winning 62.6 reasoned ETF score cannot lift the entire three-ETF basket—which includes WEAT's weak 42.0 score—above the threshold required to compete for capital allocation alongside metals, semiconductors, and energy. MOO's timing is excellent, but the thirteen-week return of negative 1.8% and SPY-relative strength of negative 7.7% signal that agriculture equities have lagged the broader market rally and are not yet confirmed as institutional rotation targets. For allocation to reverse, the category needs sustained volume confirmation into the support rally, or it needs to demonstrate that mean reversion at 70.43 has become a sustained institutional accumulation event; neither is evident this week.
Emerging Markets — ILF
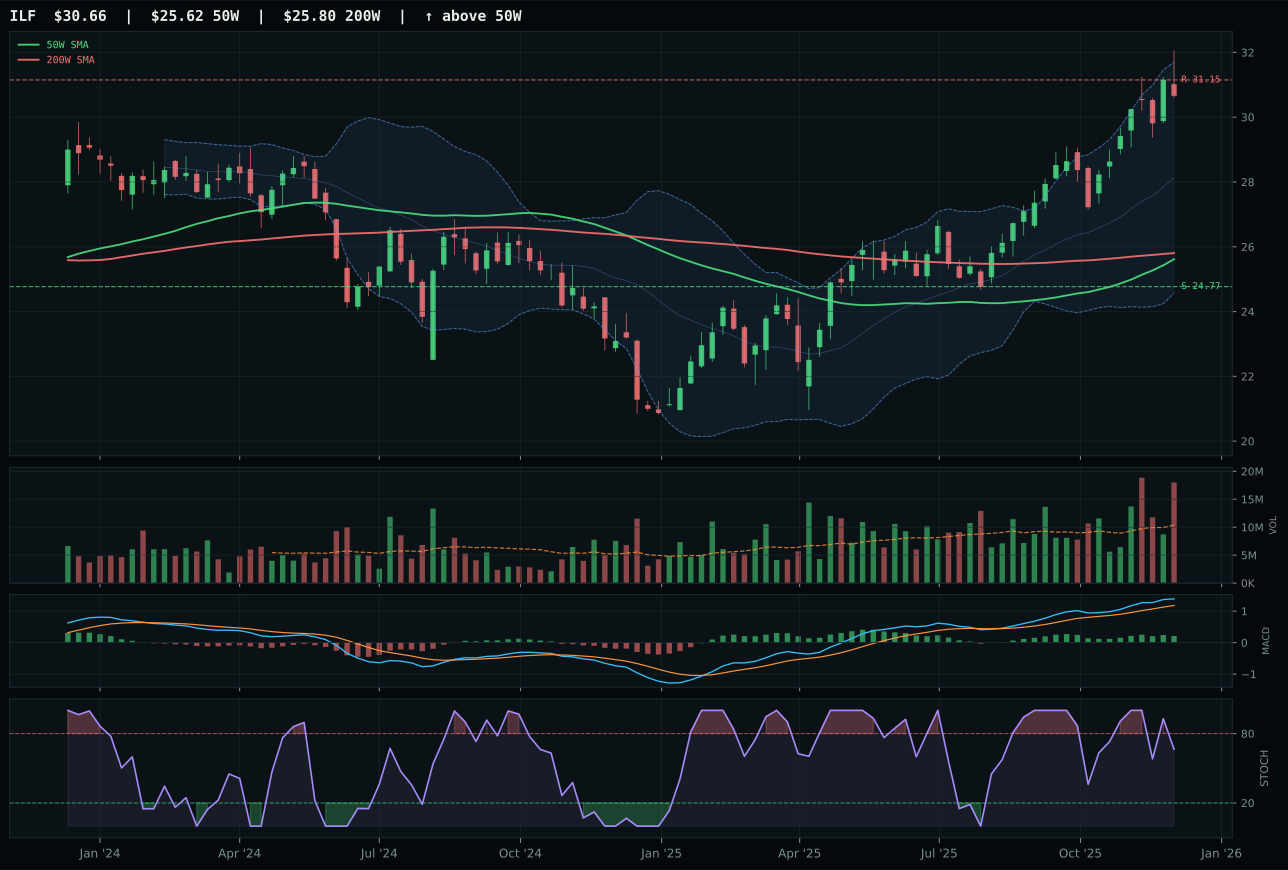
ILF has a vertical extension profile with 6.1% 13-week relative strength versus SPY.
A failed hold above support would weaken the setup.
Actionable but governed by invalidation levels.
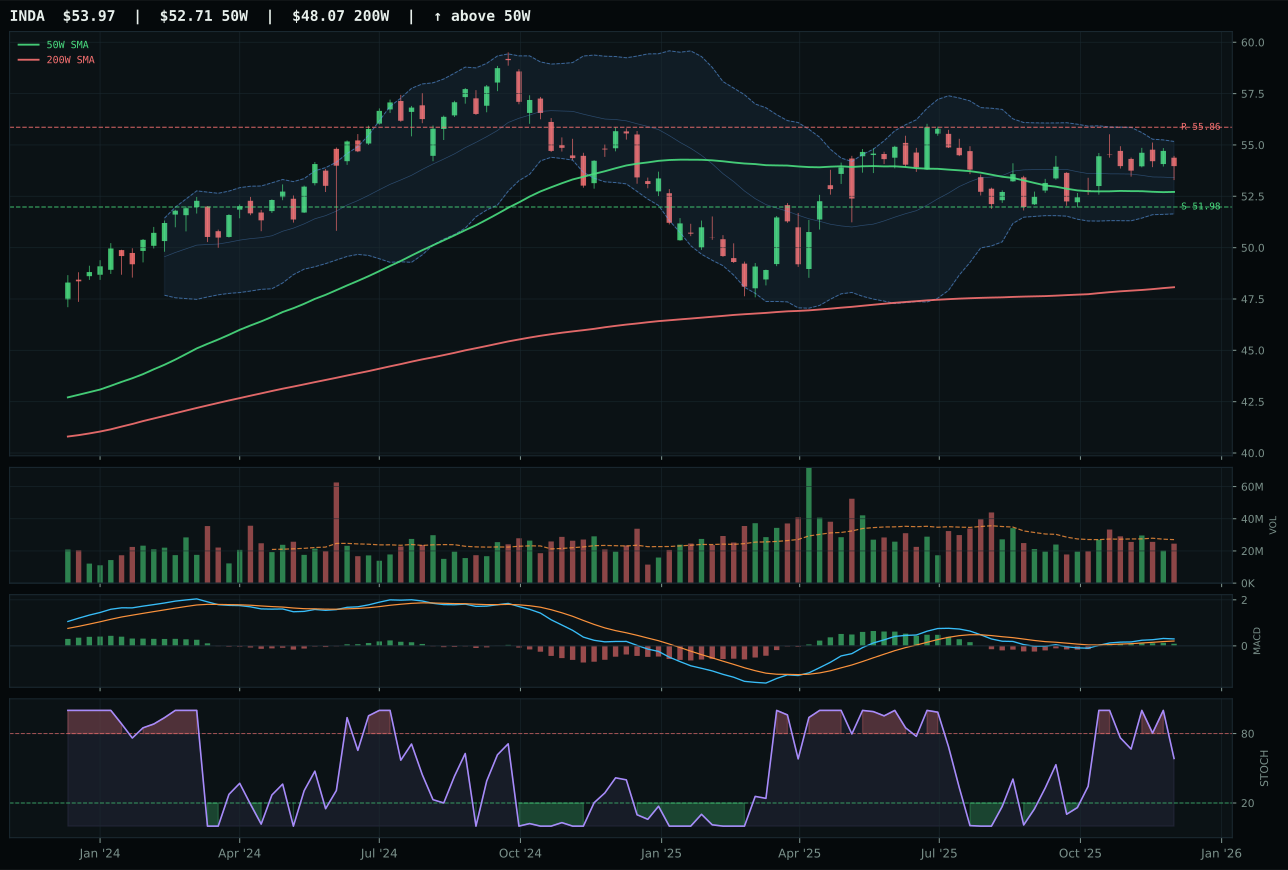
INDA has a pullback into support profile with -3.1% 13-week relative strength versus SPY.
A failed hold above support would weaken the setup.
Actionable but governed by invalidation levels.
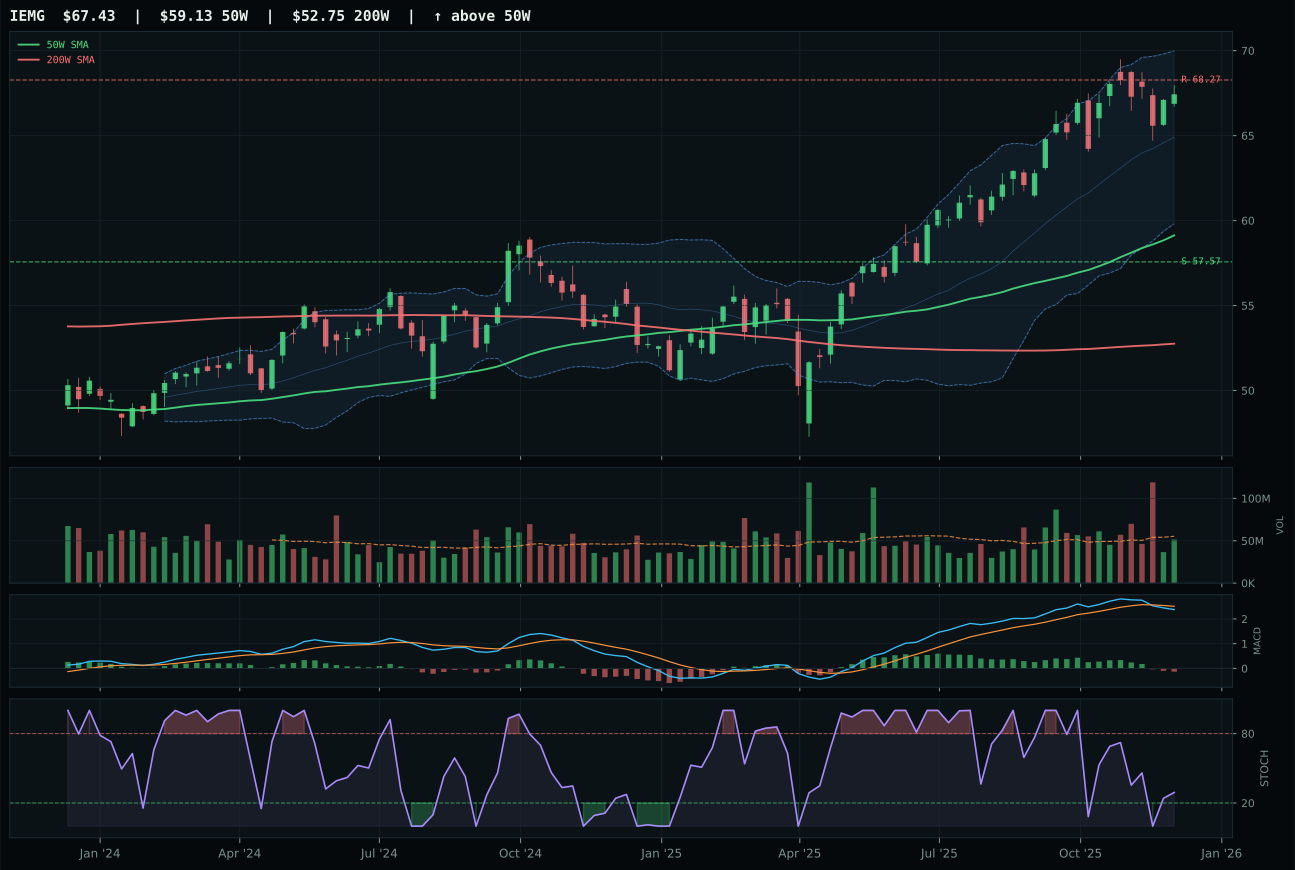
IEMG has a neutral structure profile with 1.5% 13-week relative strength versus SPY.
A failed hold above support would weaken the setup.
Actionable but governed by invalidation levels.
ILF won Emerging Markets despite a stunning -16.0-point gap versus INDA, a margin so wide it exposed the crisis in EM sentiment: ILF's 4.7% category-relative strength and positive momentum-confirmation baseline (75.7) allowed it to capture the category win, but INDA's superior 78.7 technical evidence and pullback-into-support setup were technically stronger in isolation. ILF's 12.1% 13-week return and 6.1% SPY relative strength came wrapped in distribution pressure (1.73x volume), meaning big money was exiting, not entering—yet that exit was orderly enough to preserve upside structure. INDA's 2.8% 13-week return and -3.1% SPY underperformance revealed it was getting sold into weakness, and the -4.6% category-relative deficit meant India's quality-growth narrative had lost its bid in the broader EM complex. This was not a victory built on strength but rather a survival contest where Latin America commodity beta (ILF) outlasted India growth (INDA) in a regime where risk appetite was uncertain.
Emerging Markets earns 0% allocation this week, ranking 9th or 10th among the ten categories with a final score of 25.6/100 and macro fit of 38.0/100. The category is in structural rejection: the reasoned ETF proof order shows INDA at 67.8 (high technical score) failing to lift the basket because the macro regime actively penalizes emerging-market cyclicality when liquidity stress and credit stress are both active signals. ILF's distribution-pressure volume confirms that even the winning setup is not attracting sustained institutional interest. For Emerging Markets to earn allocation, one of two conditions must reverse: either the active credit stress and liquidity stress descriptors must flip off (signaling regime stabilization), or the category's technical setup must shift from distribution-on-strength toward accumulation-on-dips. Currently, ILF is being sold into, INDA is losing to peers, and the portfolio has no bandwidth to chase a category that ranks bottom-two when two metals categories are capturing the risk-asset bid. This is a textbook exclusion.