
2025-11-28
Informational purposes only. The content in this report, including allocations, analysis, and commentary, is provided solely for informational and educational purposes. It does not constitute financial advice, investment advice, trading advice, or any other type of advice. Past performance does not guarantee future results. Always conduct your own research and consult a qualified financial professional before making investment decisions.
Weekly Allocation
| Ticker | Category | Weight | Role |
|---|---|---|---|
| SLV | Precious Metals | 20% | Top-2 (20%) |
| REMX | Industrial Metals | 20% | Top-2 (20%) |
| IGF | Utilities & Infrastructure | 10% | Tier-2 (10%) |
| SMH | AI | 10% | Tier-2 (10%) |
| CIBR | Technology | 10% | Tier-2 (10%) |
| URNM | Nuclear Energy | 10% | Tier-2 (10%) |
| FCG | Traditional Energy | 10% | Tier-2 (10%) |
| ITA | Defense & Aerospace | 10% | Tier-2 (10%) |
Trade Instructions — Monday Open
Sell the tranche from 2025-10-31 (completing its 4-week hold). Buy the new tranche. Instructions show net portfolio changes — same-asset positions cancel, weight changes show the delta.
| Action | Ticker | Instruction |
|---|---|---|
| SELL | FBTC | Sell 33% of FBTC position (reduce 37.50% → 25.00%) |
| SELL | GLD | Sell 25% of GLD position (reduce 10.00% → 7.50%) |
| SELL | PICK | Sell 25% of PICK position (reduce 10.00% → 7.50%) |
| SELL | URA | Sell entire URA position (1.25% of portfolio) |
| SELL | XLK | Sell 20% of XLK position (reduce 6.25% → 5.00%) |
| SELL | ILF | Sell 25% of ILF position (reduce 5.00% → 3.75%) |
| SELL | XAR | Sell entire XAR position (1.25% of portfolio) |
| SELL | XLU | Sell entire XLU position (1.25% of portfolio) |
| BUY | SMH | Buy SMH — 5.26% of freed cash (adds 1.25% to portfolio) |
| BUY | ITA | Buy ITA — 10.53% of freed cash (adds 2.50% to portfolio) |
| BUY | SLV | Buy SLV — 21.05% of freed cash (adds 5.00% to portfolio) |
| BUY | IGF | Buy IGF — 10.53% of freed cash (adds 2.50% to portfolio) |
| BUY | URNM | Buy URNM — 10.53% of freed cash (adds 2.50% to portfolio) |
| BUY | REMX | Buy REMX — 21.05% of freed cash (adds 5.00% to portfolio) |
| BUY | CIBR | Buy CIBR — 10.53% of freed cash (adds 2.50% to portfolio) |
| BUY | FCG | Buy FCG — 10.53% of freed cash (adds 2.50% to portfolio) |
Current Portfolio After Trade
Combined holdings across all 4 active tranches. Each tranche is 25% of the portfolio.
| Ticker | % of Portfolio | Weight Bar |
|---|---|---|
| FBTC | 25.00% | |
| GLD | 7.50% | |
| PICK | 7.50% | |
| SMH | 7.50% | |
| SLV | 7.50% | |
| ITA | 6.25% | |
| IGF | 6.25% | |
| URNM | 6.25% | |
| XLK | 5.00% | |
| REMX | 5.00% | |
| ILF | 3.75% | |
| XLE | 3.75% | |
| CIBR | 2.50% | |
| FCG | 2.50% | |
| NLR | 1.25% | |
| PAVE | 1.25% | |
| COPX | 1.25% |
Macro Regime — Disinflation
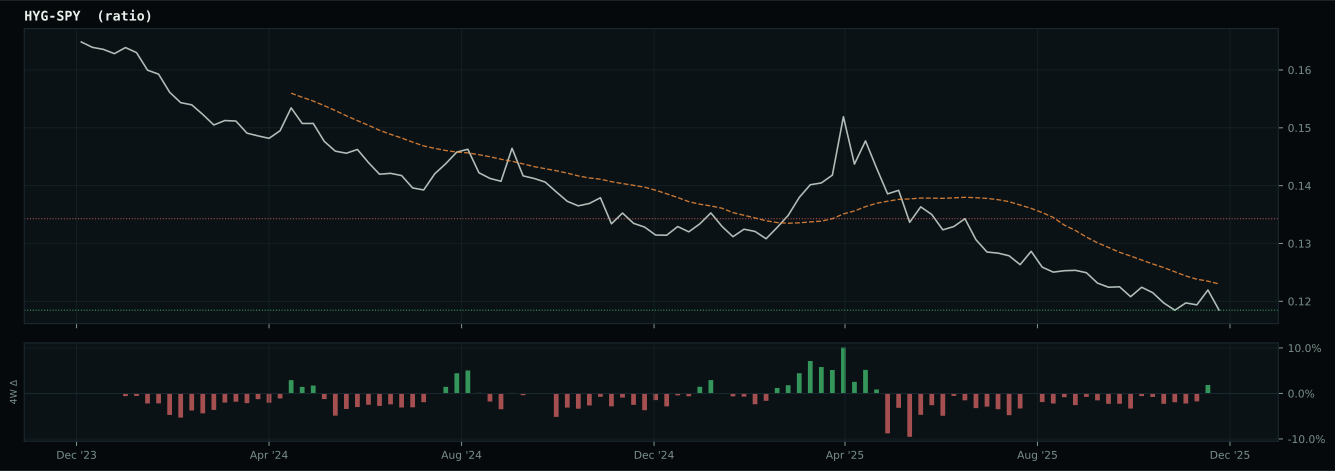
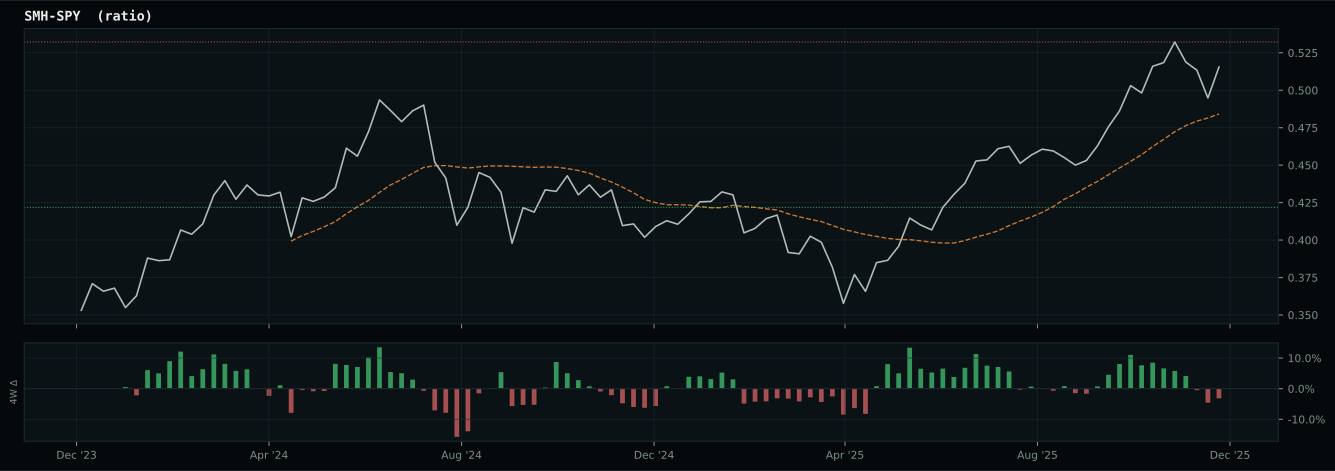
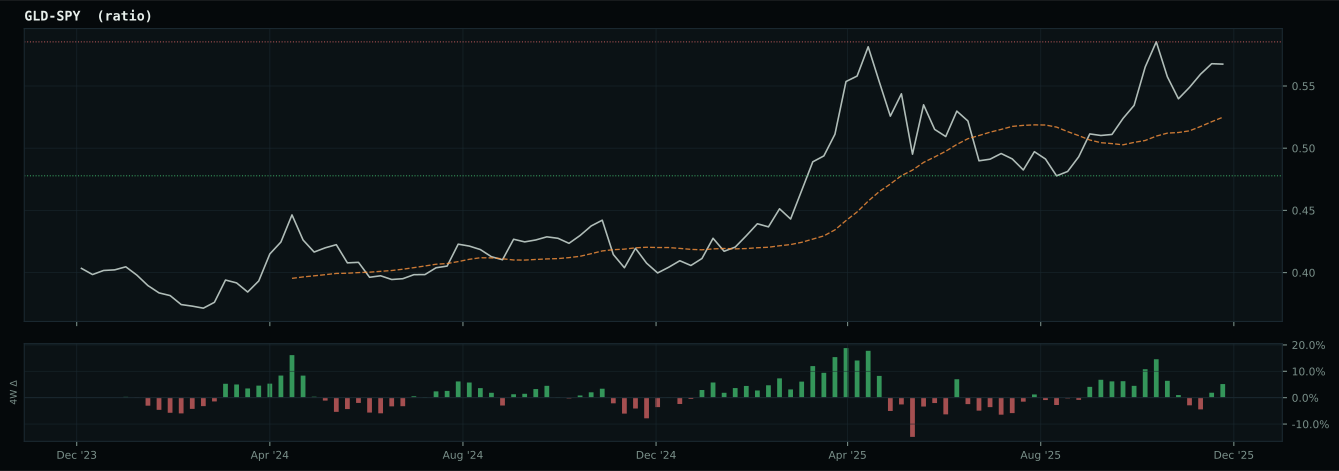
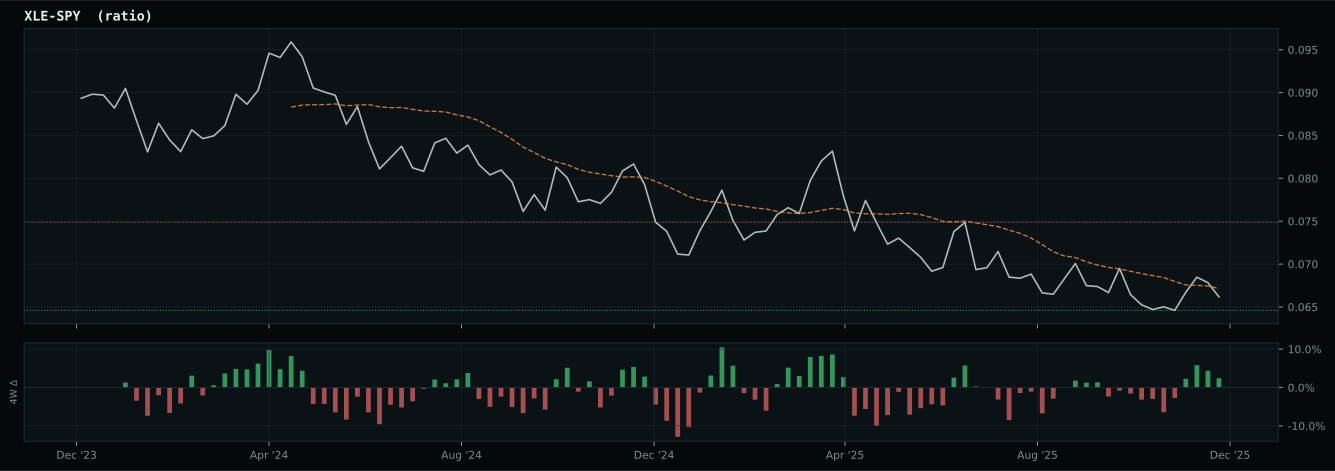
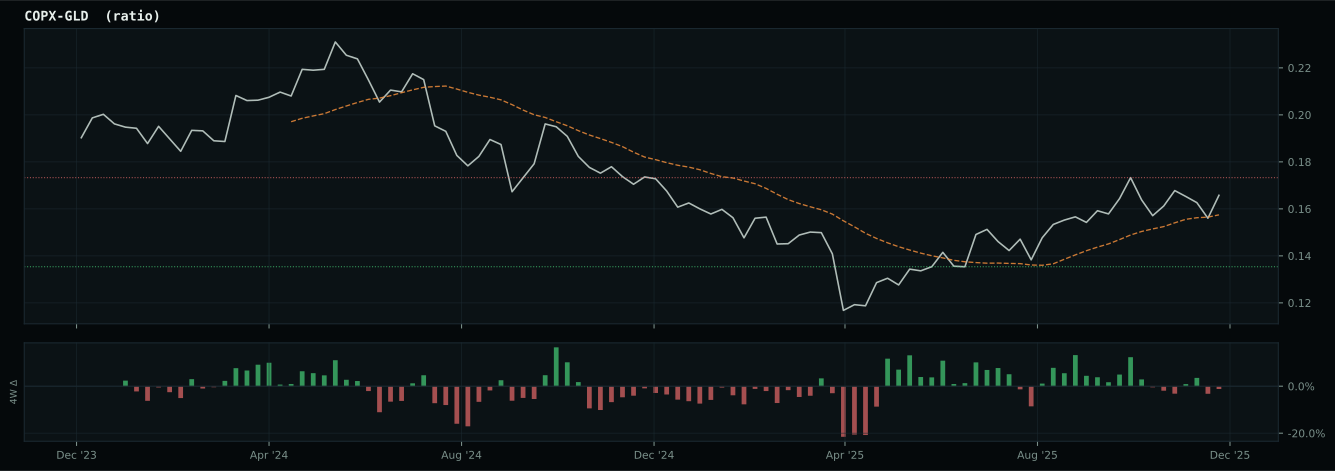
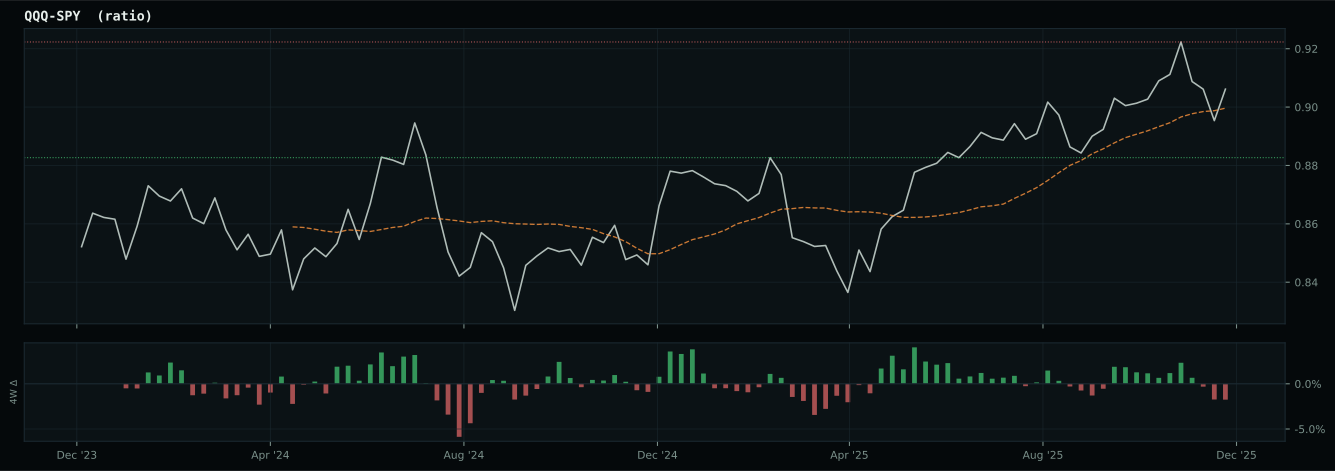
Macro Evidence Charts
Market-implied signals behind the macro regime scores. Each ratio compares two assets; the direction and slope of the ratio is what the macro engine reads.
Crypto Regime — NoCrypto
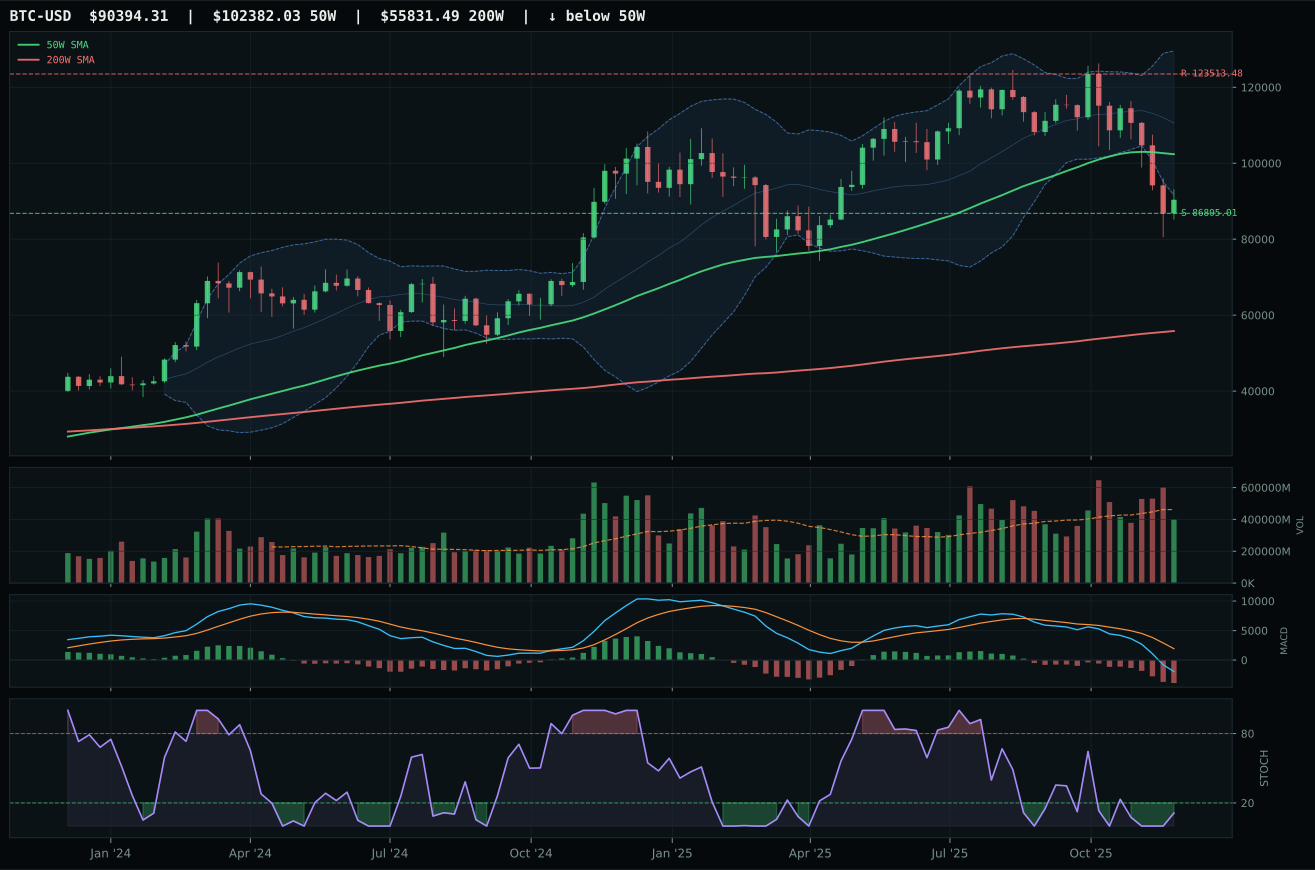
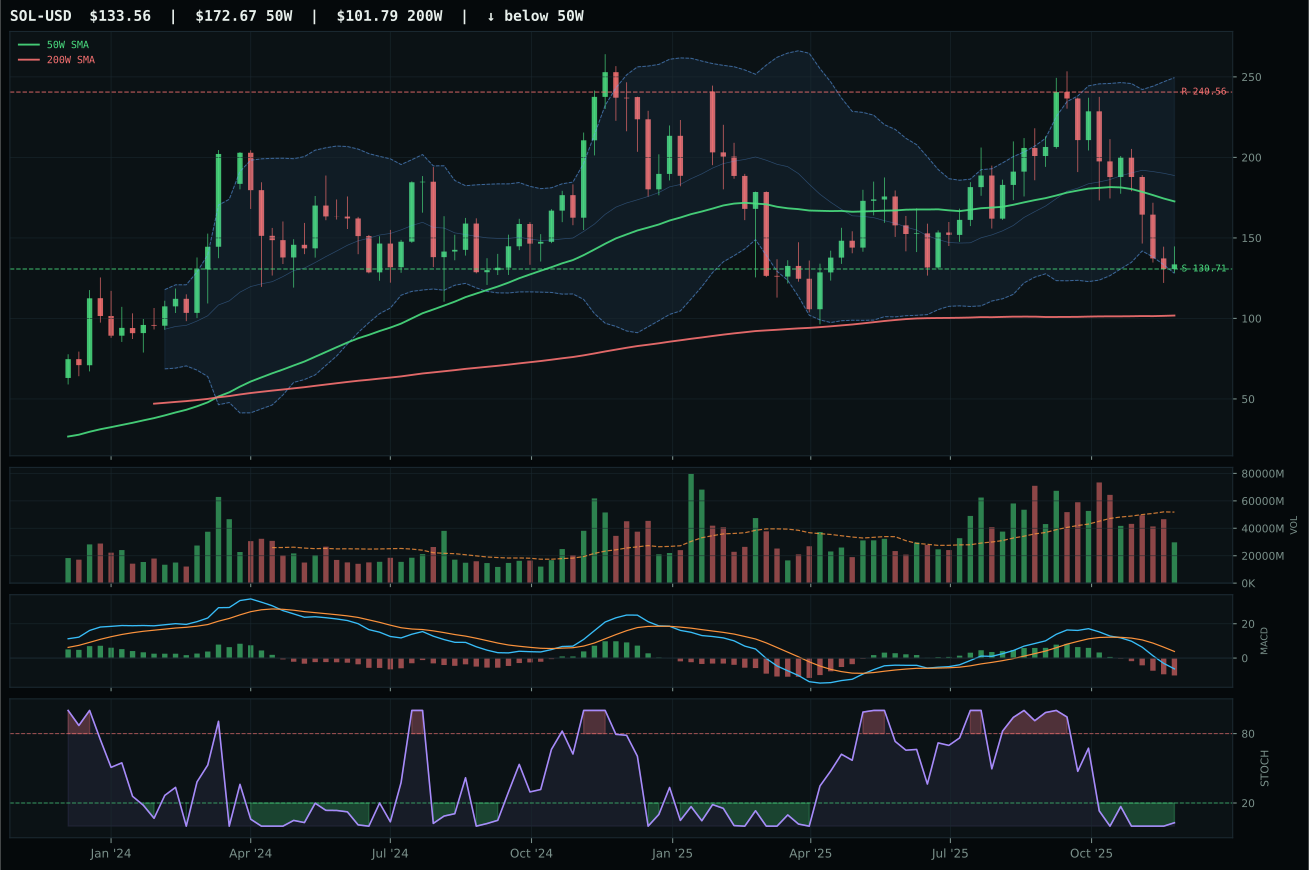
ValueBTC not armed: BTC has not made the first post-breakdown touch of the 200W buy zone after losing the 50W
TrendBTC not confirmed
one or more available conditions failed
Category Rankings
| Rank | Category | Winner | Score | Alloc | 4W Ret | Peers (4W) |
|---|---|---|---|---|---|---|
| 1 | Precious Metals | SLV | 70.8 | 20% | +26.29% | GDX +3.5% · GLD +3.3% |
| 2 | Industrial Metals | REMX | 65.3 | 20% | +1.46% | COPX +13.1% · PICK +7.3% |
| 3 | Utilities & Infrastructure | IGF | 51.7 | 10% | -2.05% | XLU -5.0% · PAVE +2.0% |
| 4 | AI | SMH | 48.4 | 10% | +3.96% | AIQ +3.4% · BOTZ +4.3% |
| 5 | Technology | CIBR | 43.9 | 10% | -0.75% | XLK +2.6% · IGV +4.1% |
| 6 | Nuclear Energy | URNM | 40.5 | 10% | +0.73% | URA +2.3% · NLR -2.5% |
| 7 | Traditional Energy | FCG | 36.8 | 10% | -5.33% | XOP -6.2% · XLE -1.7% |
| 8 | Defense & Aerospace | ITA | 36.0 | 10% | +6.99% | ROKT +11.3% · XAR +7.6% |
| 9 | Emerging Markets | ILF | 31.4 | 0% | -1.10% | INDA -1.6% · IEMG +0.2% |
| 10 | Agriculture & Livestock | MOO | 22.1 | 0% | -0.26% | VEGI -0.2% · WEAT -2.0% |
Precious Metals — SLV
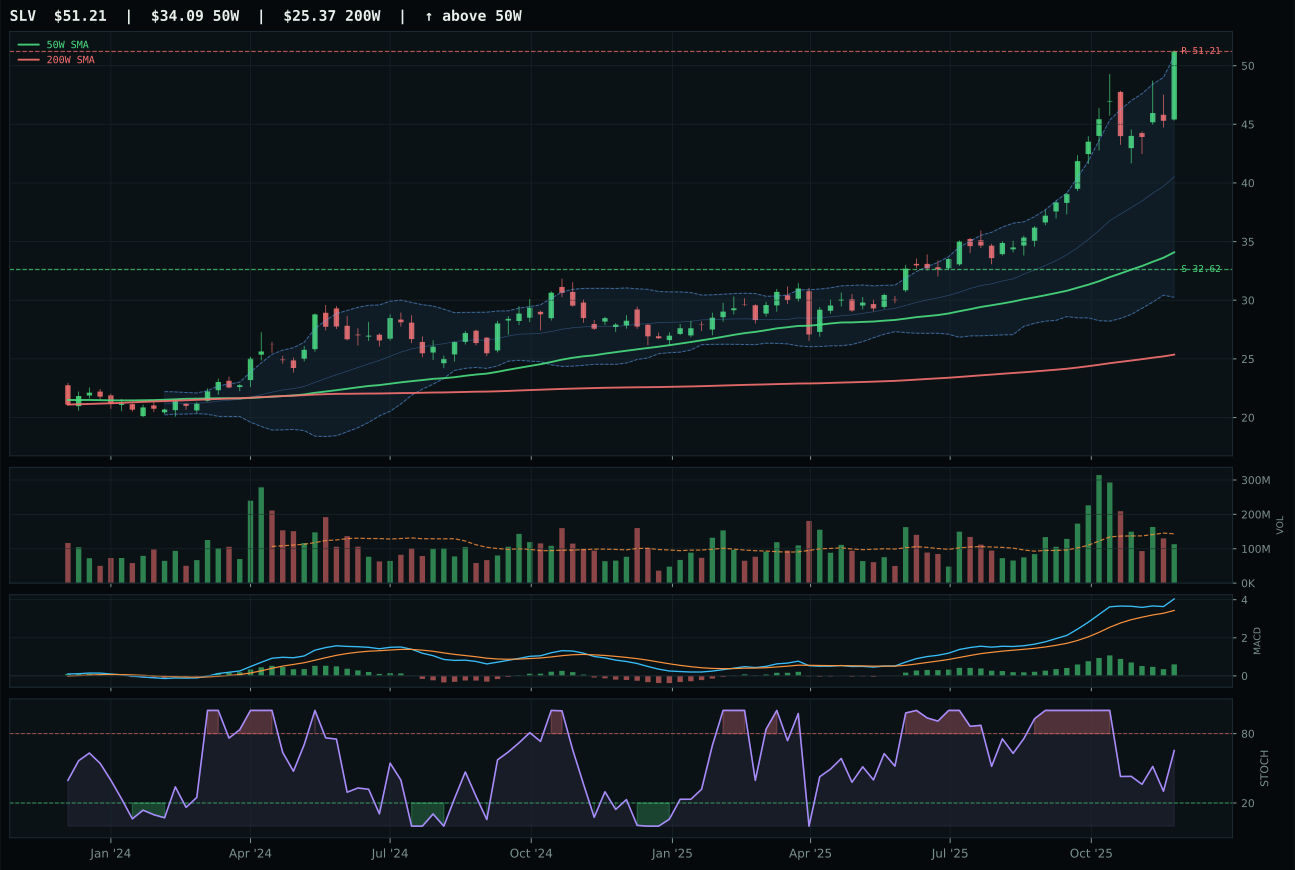
SLV has a vertical extension profile with 35.6% 13-week relative strength versus SPY.
A failed hold above support would weaken the setup.
Actionable but governed by invalidation levels.
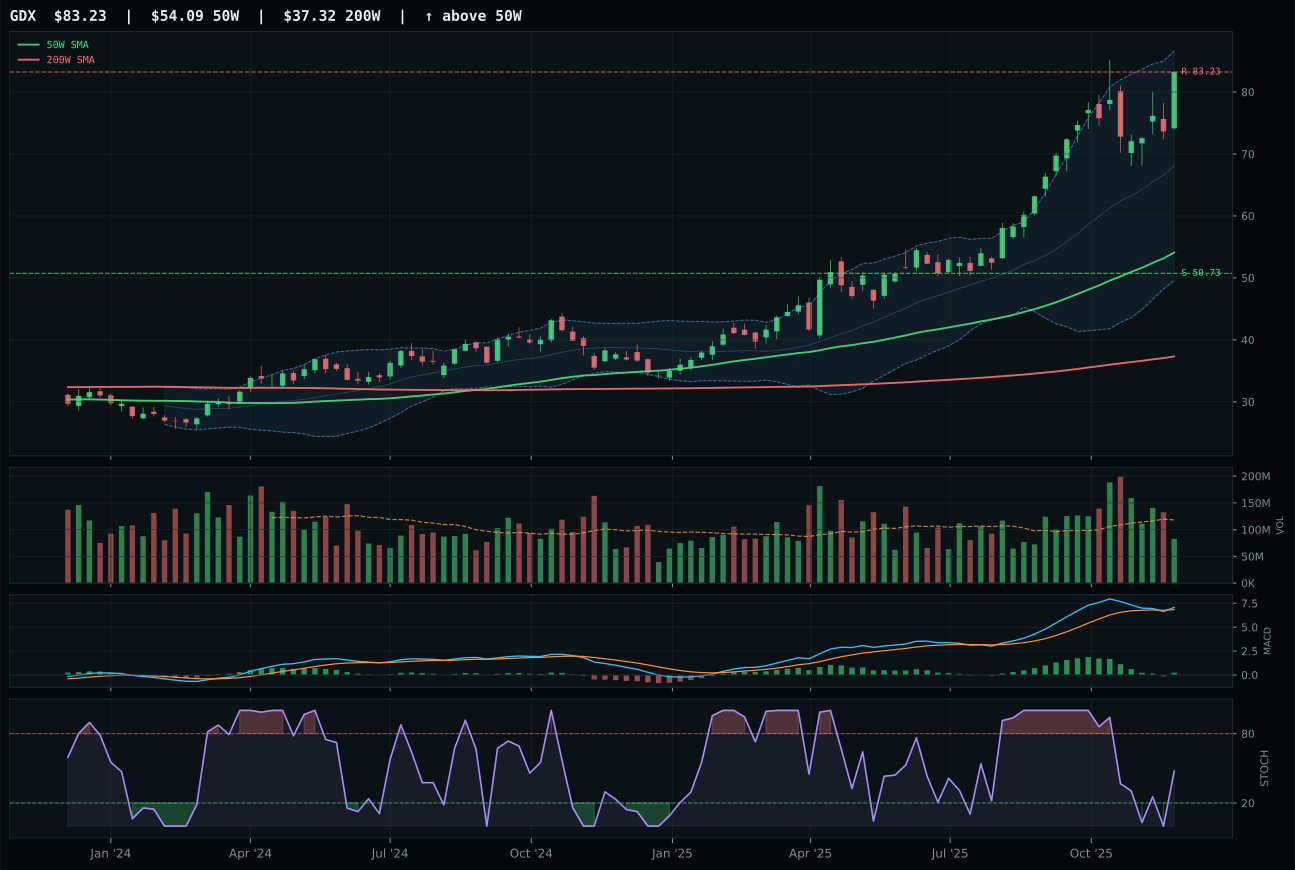
GDX has a vertical extension profile with 25.8% 13-week relative strength versus SPY.
A failed hold above support would weaken the setup.
Actionable but governed by invalidation levels.
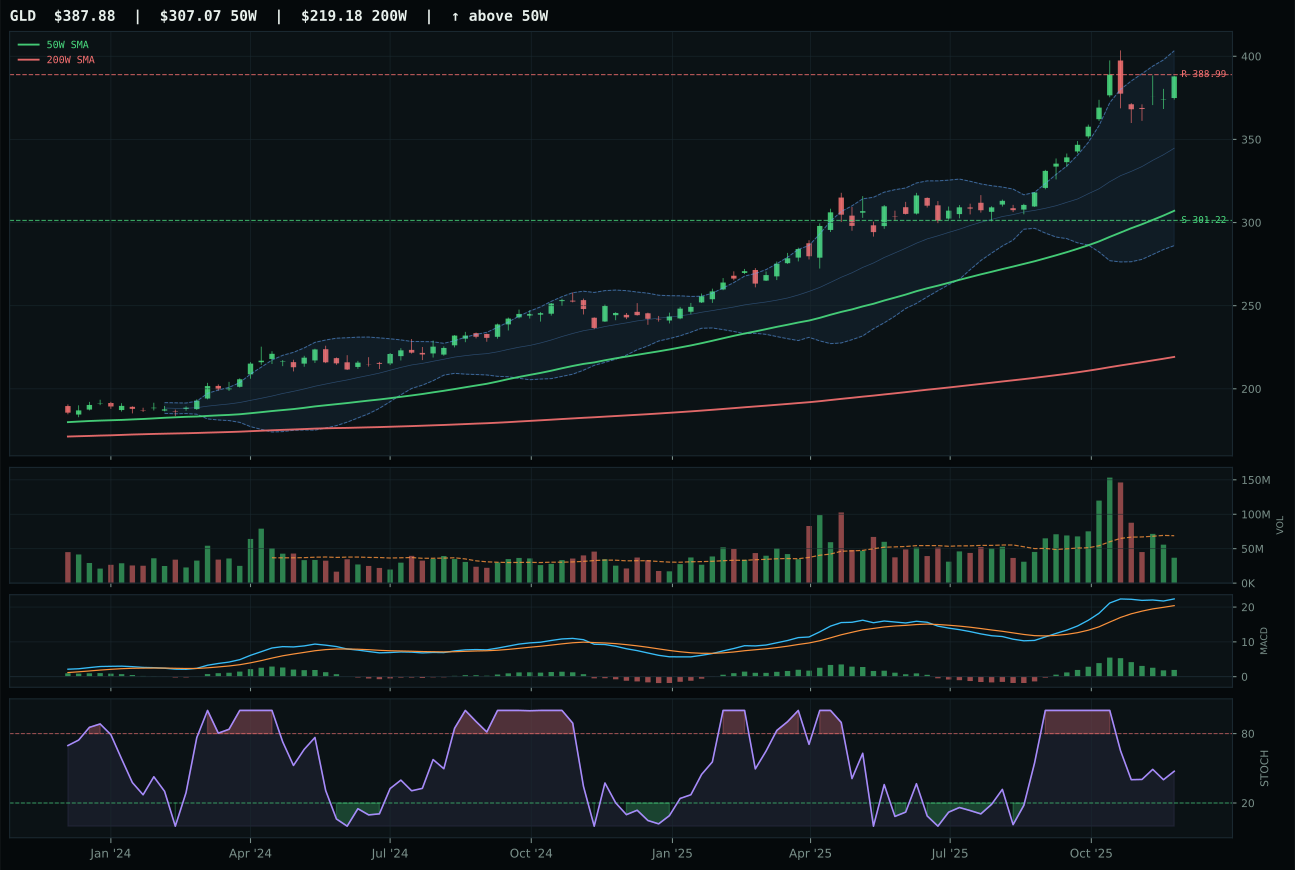
GLD has a vertical extension profile with 16.0% 13-week relative strength versus SPY.
A failed hold above support would weaken the setup.
Actionable but governed by invalidation levels.
SLV claimed the 20% top-2 allocation slot by narrowly edging GDX (70.8 vs 69.8 score, just 1.0 point) despite both commanding near-identical trend scores (100) and momentum confirmation (100). The decisive margin lies in structure cleanliness (77.1 vs 71.6), volume confirmation (79.4 vs lower levels in GDX), and category-relative strength (9.7% vs 0.0%)—silver's hybrid monetary and industrial beta resonates across both hedging and demand narratives. SLV's 50.2% extension above the 50W mirrors GDX's but the neutral volume participation (0.79x) versus GDX's thin participation (0.66x) signals distributed accumulation rather than specialist positioning. The 41.5% thirteen-week return with 35.6% SPY outperformance reflects a move off lows into genuine structural demand; MACD bullish but flattening in both cases means the persistence is real, not momentum-derived.
Precious Metals earned 20% top-2 allocation because the 70.8 category score ranks among the portfolio's two highest, driven by strong technical evidence (76.7) and robust macro fit (59.0/100) from active monetary hedge (+7) and metals scarcity (+7) descriptors in a disinflation backdrop. The category macro benefit (+8 disinflation help) is structural: falling real yields and currency uncertainty bid for monetary assets independent of near-term growth. SLV's perfect trend and momentum scores (100 each) combined with 79.4 volume-price confirmation and 100 persistence demonstrate conviction despite the extended entry (50.2% above 50W). The risk/reward score of 39.5 reflects capped upside, but in a 20% allocation the asymmetry is acceptable because downside support sits 57% away and the category macro tailwind remains durable. Precious metals anchors portfolio defense alongside growth.
Industrial Metals — REMX
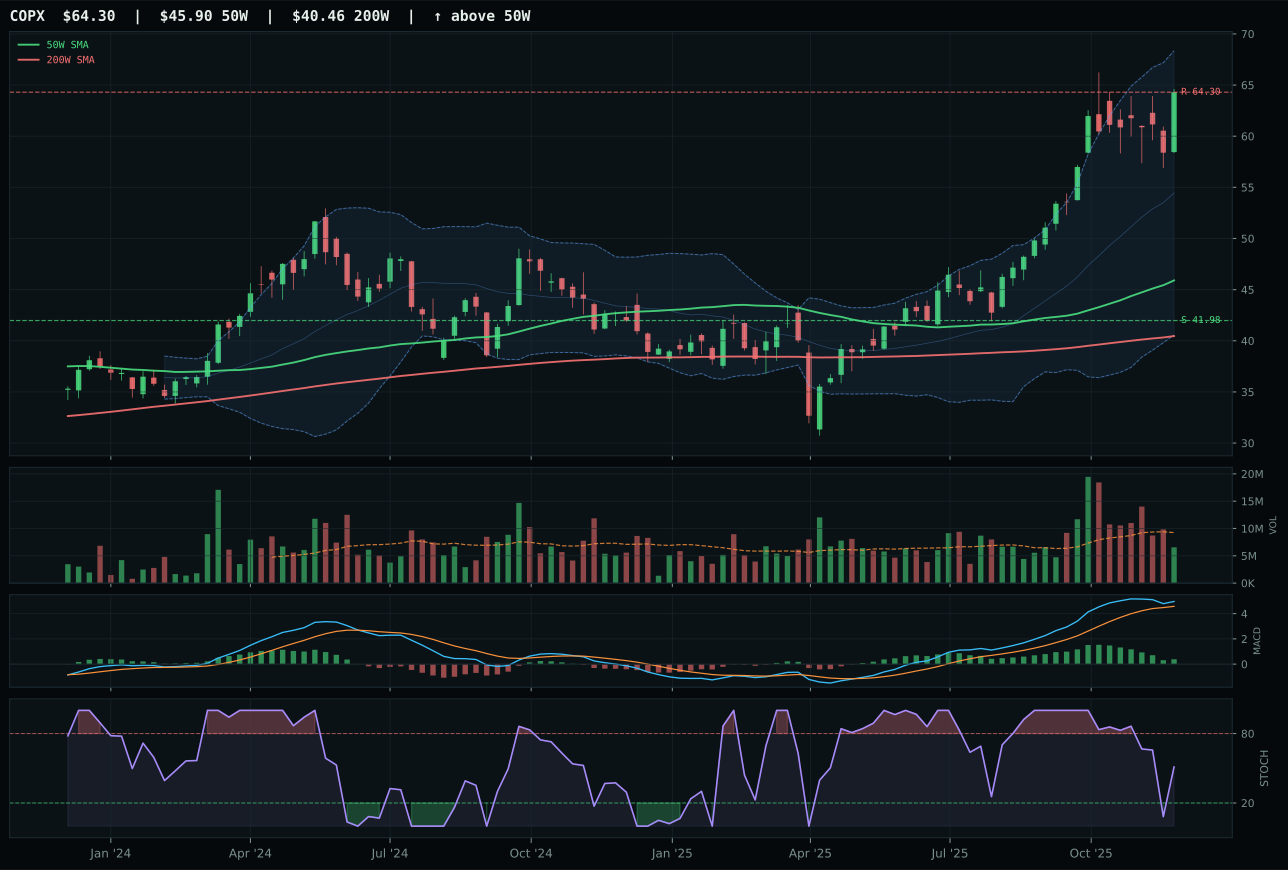
COPX has a vertical extension profile with 23.1% 13-week relative strength versus SPY.
A failed hold above support would weaken the setup.
Actionable but governed by invalidation levels.
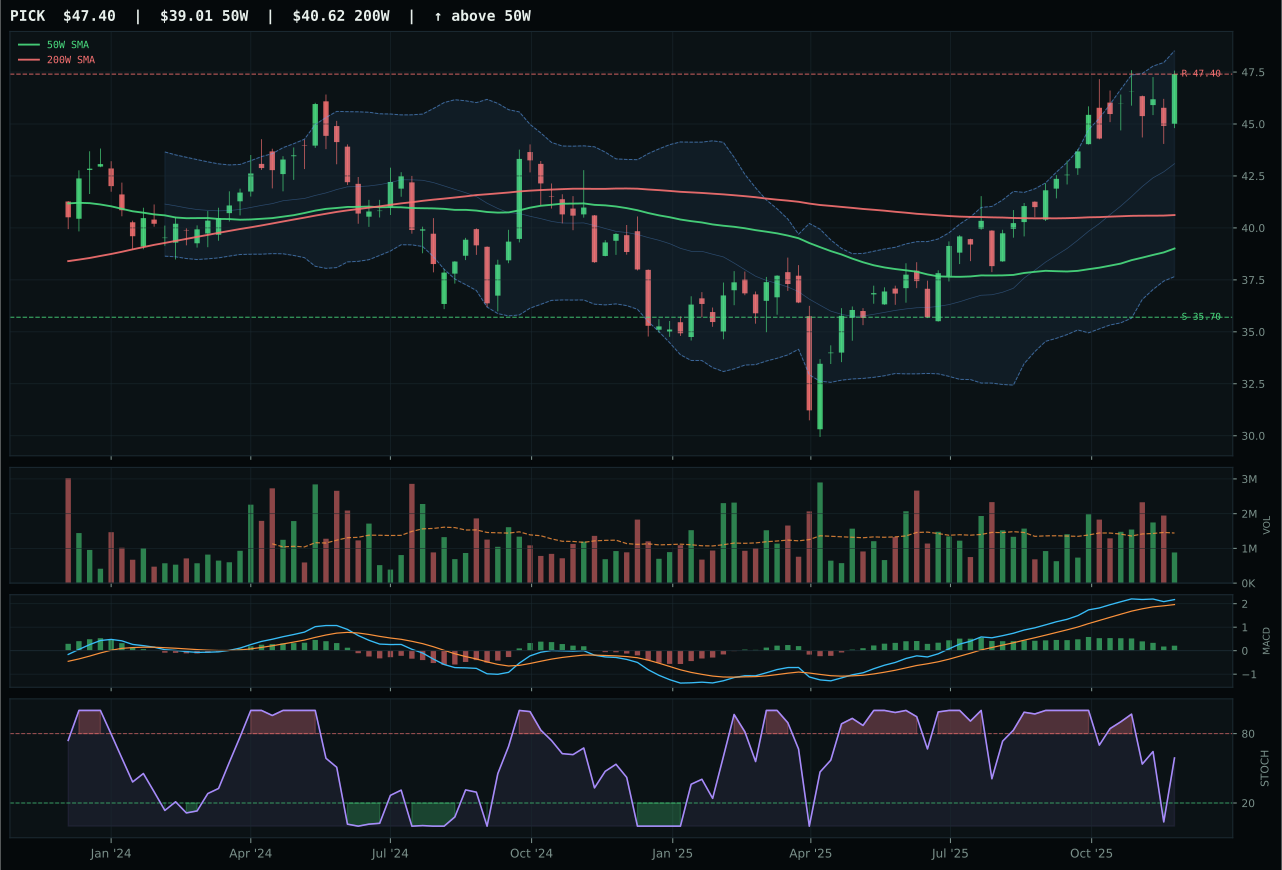
PICK has a vertical extension profile with 9.7% 13-week relative strength versus SPY.
A failed hold above support would weaken the setup.
Actionable but governed by invalidation levels.
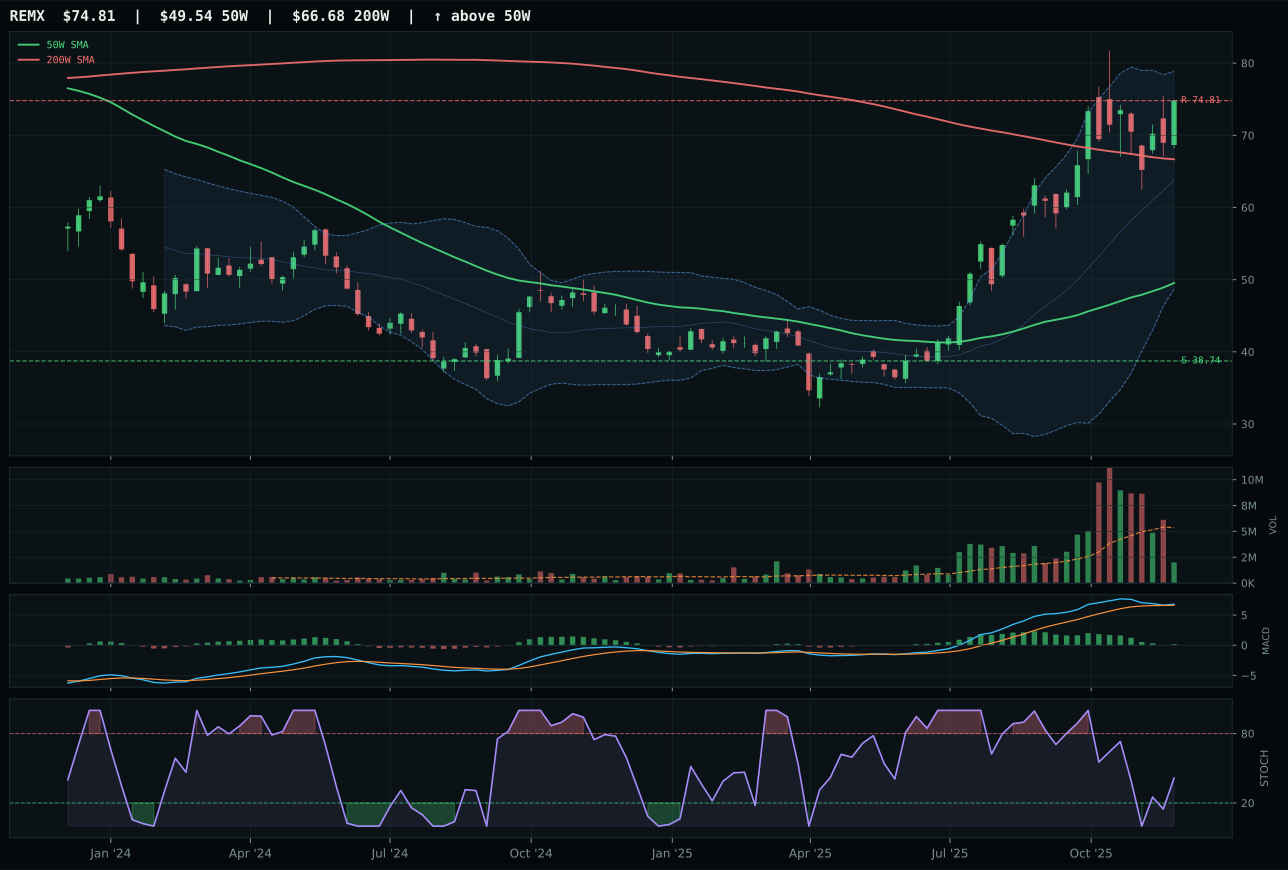
REMX has a vertical extension profile with 12.7% 13-week relative strength versus SPY.
A failed hold above support would weaken the setup.
Actionable but governed by invalidation levels.
REMX wins the category representative slot despite the basket reasoned proof order favoring PICK (63.9) and COPX (60.9) because the category reasoner prioritizes technical representativeness over weighted proof rank. REMX's timing score (56) exceeds COPX's (40) due to superior stochastic RSI positioning (rising mid-zone vs falling/neutral), a signal that momentum is turning rather than rolling over. The 13W return of 18.6% trails COPX's 29.1% but category-relative strength ties at 0.0%, preserving the category median; REMX's advantage is structural resilience. COPX's higher RS versus SPY (23.1%) and macro fit (62.0) reflect copper's industrial demand, but the declining stochastic pattern at near-term highs suggests timing risk. Volume participation at 0.37x (thin) across REMX limits conviction, but the rising stochastic and 100-point momentum confirmation (13W return 18.6%, 4W return 6.1%) indicate the rare-earth scarcity narrative is sustainable.
Industrial Metals earned 20% top-2 allocation as the portfolio's second-highest scoring category (65.2) because technical evidence (55.3 for REMX) and macro fit (65.0) both exceed most peers, anchored by metals scarcity (+14), commodity breadth (+10), and real asset sponsorship (+6) descriptors in disinflation. The 51.0% extension above the 50W carries risk, but REMX's trend score (96), momentum confirmation (100), and persistence (84.3) signal the move is not speculative—industrial demand for rare earths and supply-chain resilience logic sustain the bid. COPX's timing advantage (40.0) via falling stochastic hints mean-reversion setup, but that reversal has not materialized; REMX's rising stochastic at 0.42 suggests continuation. Risk/reward of 31.6 is tight (0.0% upside, 93.1% downside), acknowledging extension, but paired with 20% allocation the portfolio accepts entry risk for structural exposure to scarcity premiums.
Utilities & Infrastructure — IGF
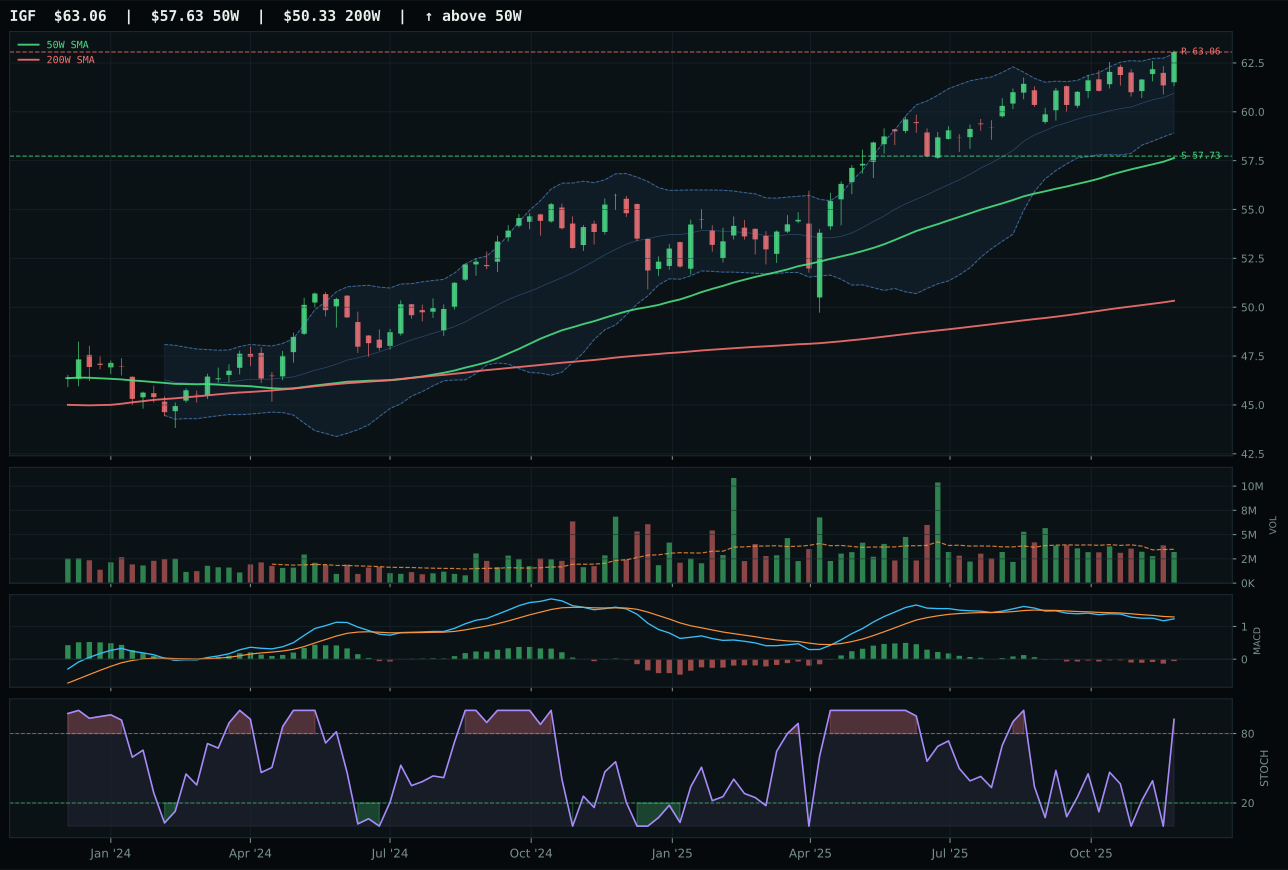
IGF has a neutral structure profile with -1.5% 13-week relative strength versus SPY.
A failed hold above support would weaken the setup.
Actionable but governed by invalidation levels.
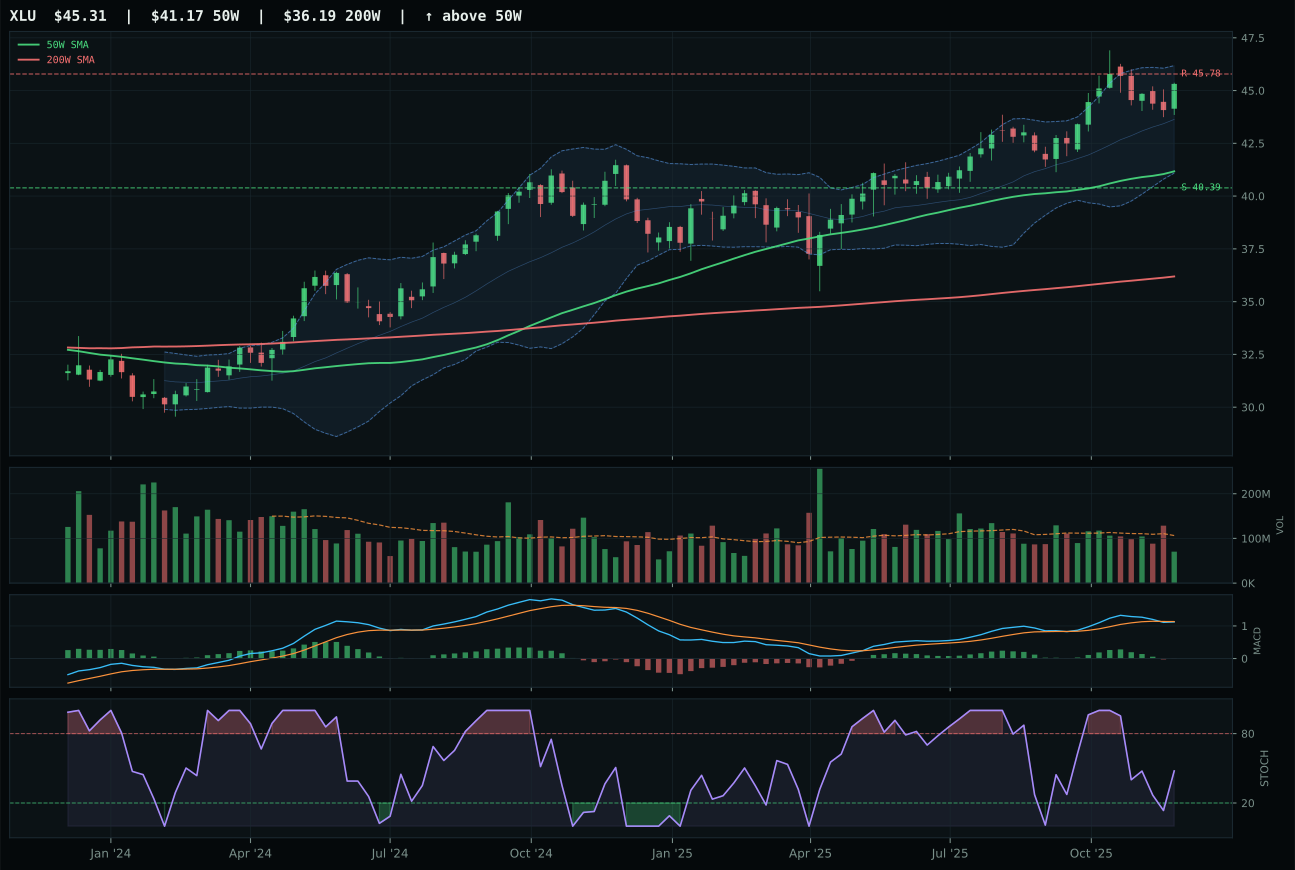
XLU has a neutral structure profile with 1.5% 13-week relative strength versus SPY.
A failed hold above support would weaken the setup.
Actionable but governed by invalidation levels.
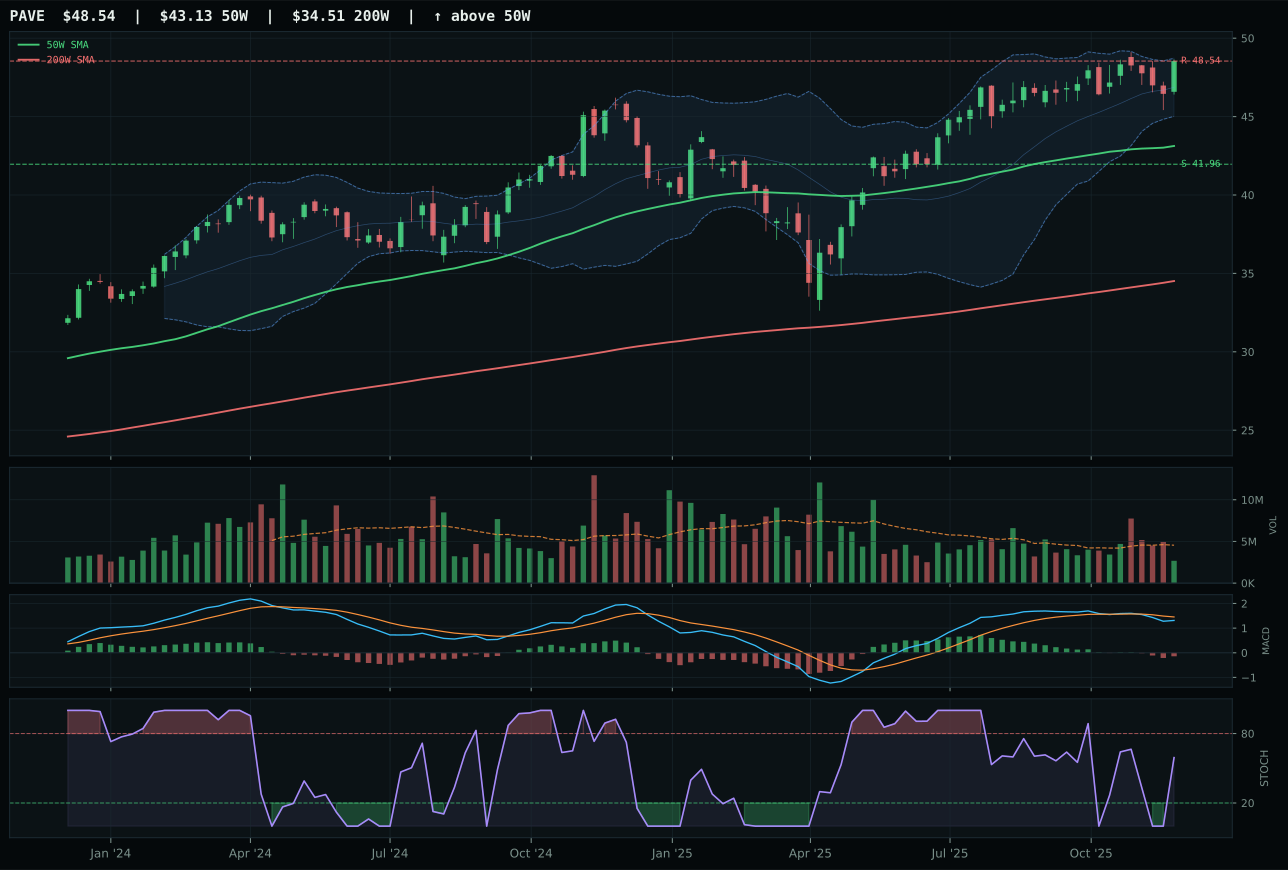
PAVE has a neutral structure profile with -1.6% 13-week relative strength versus SPY.
A failed hold above support would weaken the setup.
Actionable but governed by invalidation levels.
IGF defeats XLU through superior risk/reward (52.6 vs 46.5) and volume confirmation (62.4 vs 50): at only 9.4% above the 50W, IGF offers defined risk with support at 57.73 and resistance capped at 63.06, while XLU's structure (73.5 vs 76.4) and volume (thin participation vs neutral) flag looser positioning. Both carry overbought stochastic momentum (IGF 0.92, XLU rising mid-zone), but IGF's neutral volume suggests distributed accumulation rather than specialist positioning; XLU's thin volume argues the move lacks conviction. The 13W return (4.5% vs XLU's 7.5%) is lower for IGF, but category-relative strength ties at 0.0%, keeping IGF anchored to the median. IGF's trend score (90.8) trails XLU's (84) due to slightly positive SPY relative strength (-1.5% vs XLU's 1.5%), a minor advantage in the macro context. The 4.8-point score gap confirms clear category decision; global infrastructure income beats regulated utilities in the current environment.
Utilities & Infrastructure earned 10% allocation with the 51.7 category score because disinflation pressure (+6) and disinflation help (+7) from the macro regime provide meaningful tailwind, while liquidity stress (-3) remains modest, netting to 62.0/100 macro fit that supports allocation. IGF's trend (90.8) and neutral volume (92%) signal the infrastructure theme is well-bid and distributing to new money, not gathering into specialist hands; this breadth justifies allocation despite the tight risk/reward (52.6, capped at 63.06). The 4.5% thirteen-week return reflects the lagging income/stability narrative versus growth assets, but in a disinflation regime real yield compression favors bonds and long-duration equities, making infrastructure's steady cash flows and inflation-hedge characteristics valuable. Elevation to 20% would require either a reversal in credit stress or liquidity stress descriptors (currently negative) or a breakout above 63.06 resistance on volume confirmation, neither of which is present. The 10% slot acknowledges portfolio ballast without claiming outperformance.
AI — SMH
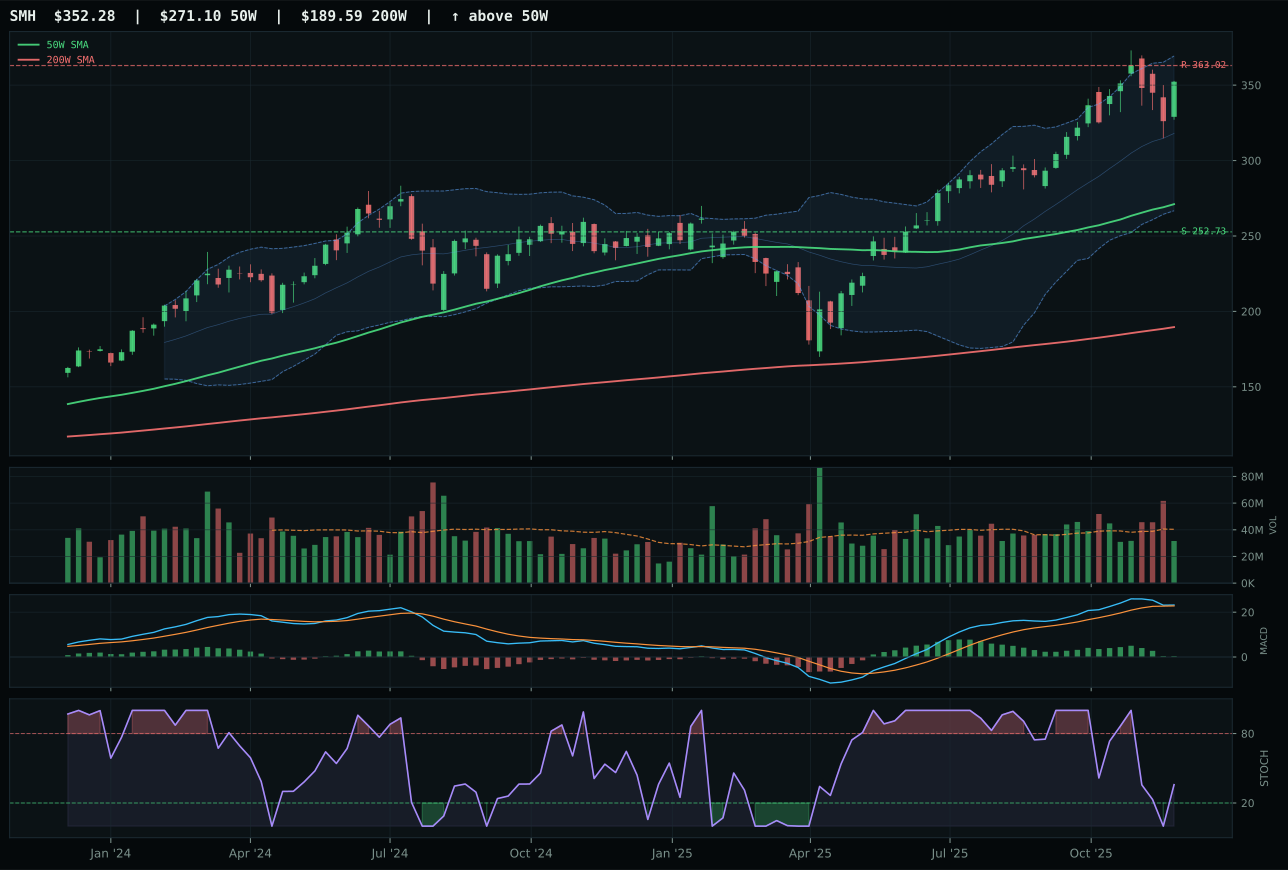
SMH has a vertical extension profile with 15.4% 13-week relative strength versus SPY.
A failed hold above support would weaken the setup.
Actionable but governed by invalidation levels.
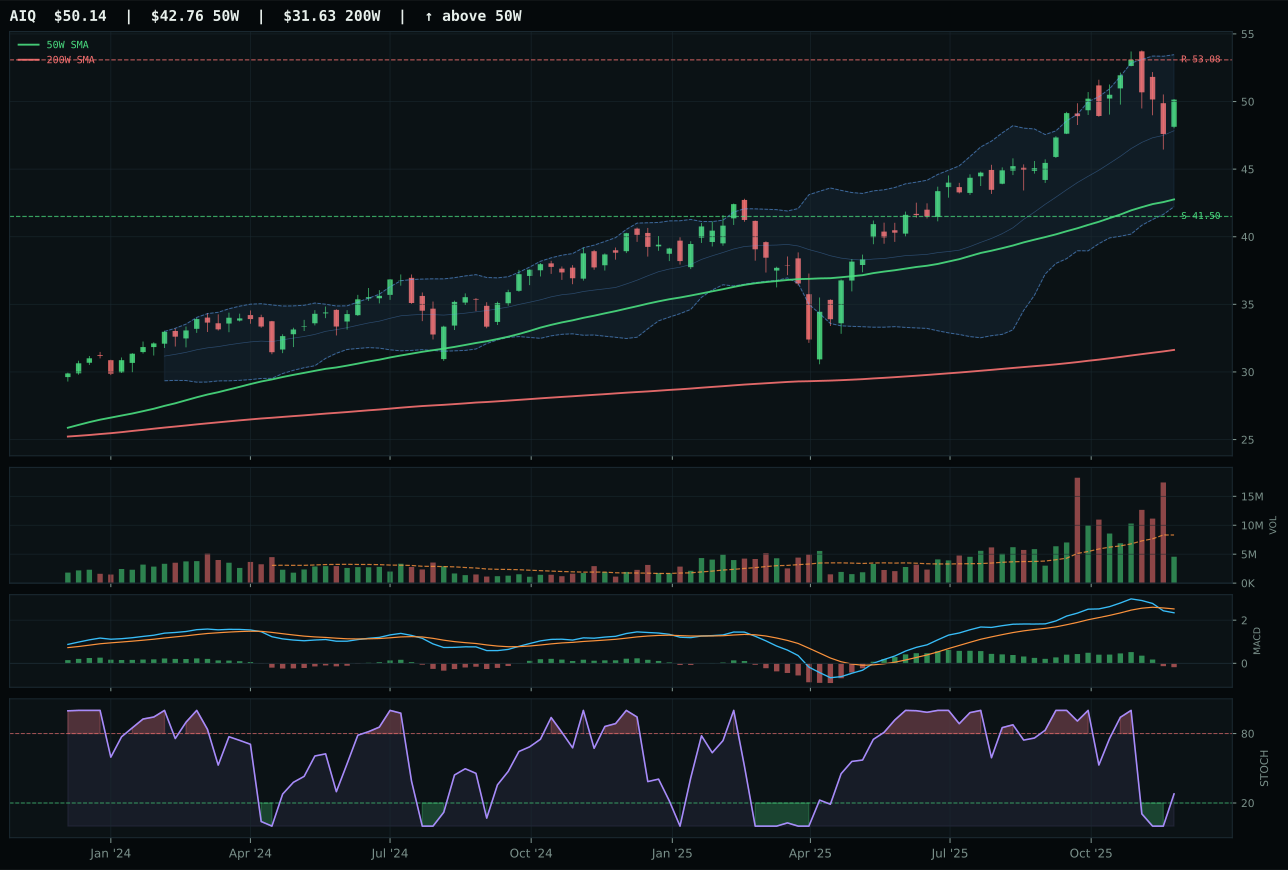
AIQ has a vertical extension profile with 5.3% 13-week relative strength versus SPY.
A failed hold above support would weaken the setup.
Actionable but governed by invalidation levels.
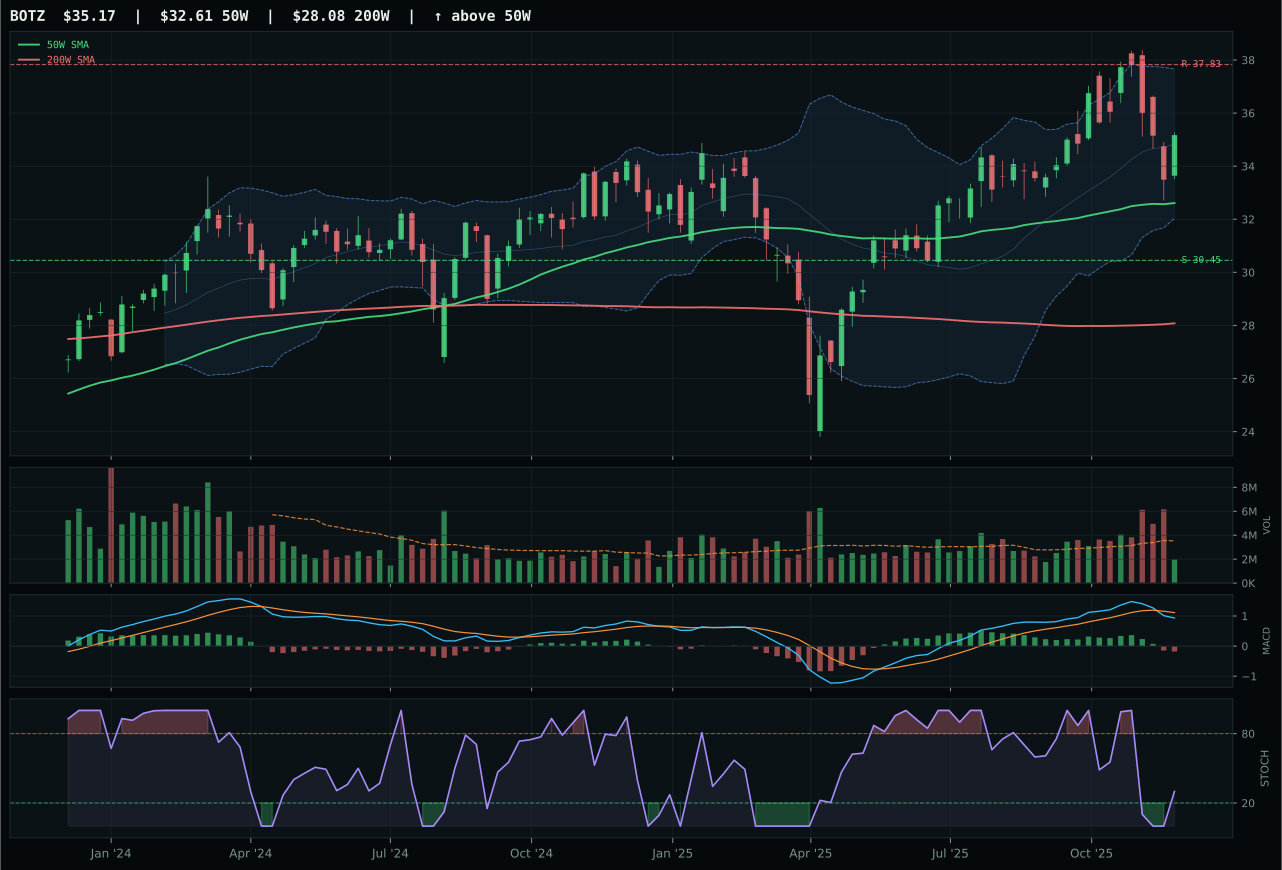
BOTZ has a neutral structure profile with -1.1% 13-week relative strength versus SPY.
A failed hold above support would weaken the setup.
Actionable but governed by invalidation levels.
SMH won through superior momentum confirmation and structure cleanliness despite its 29.9% extension above the 50W—a distance that normally invites caution but here combines with bullish MACD (vs AIQ's bearish/weakening) and neutral volume (vs AIQ's thin participation) to signal continued accumulation rather than distribution. The 13W return of 21.4% paired with 10.1% category-relative strength demonstrates AI compute leadership where the semiconductor complex is being bought into strength; AIQ's 11.2% thirteen-week return and 0.0% basket relative strength reveal software breadth as a lagging peer. Volume-price confirmation reached 76.4 for SMH against 40 for AIQ, and persistence (83.7 vs lower levels) shows the move is sticky, not a bounce. The risk/reward of 46.4 (upside capped at -3.0%) acknowledges entry cost; persistence justifies accepting it.
AI earned 10% despite scoring 48.4—well behind Precious Metals and Industrial Metals—because the macro descriptor set activates AI growth sponsorship (+14) and risk appetite (+10) with offset from liquidity stress (-12) and credit stress (-8), netting to 59.0/100 macro fit. The fundamental tension is directional: SMH's trend and momentum are clean (100 and 100), but timing (56) and risk/reward (46) penalize late entry on a 29.9% extension. In a disinflation regime, real assets outrank compute infrastructure; however, AI remains eligible and holds allocation because growth sponsorship and earnings quality sustain it. Elevation to 20% requires either a mean-reversion pullback with momentum persistence or a macro shift away from real-asset dominance toward growth re-acceleration.
Technology — CIBR
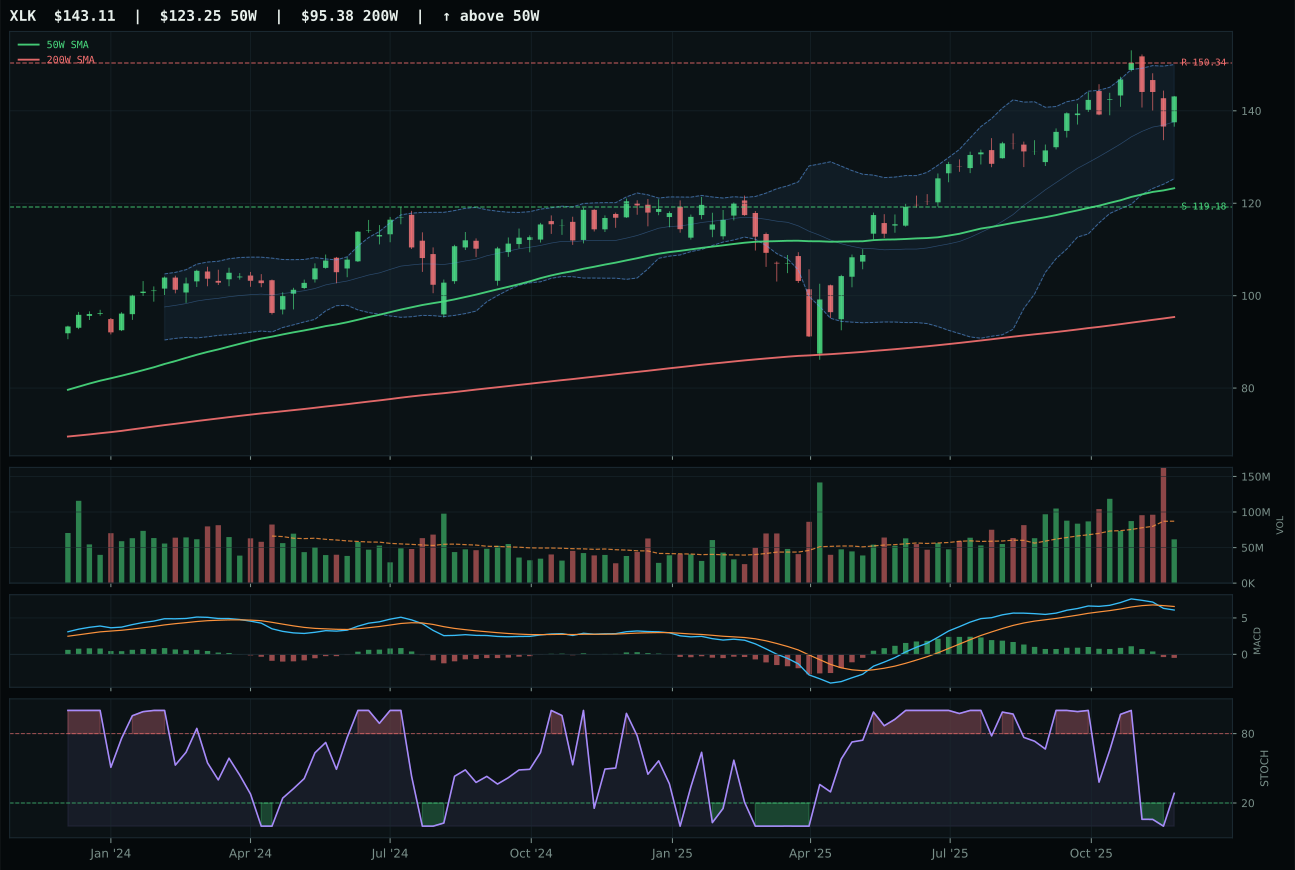
XLK has a vertical extension profile with 3.1% 13-week relative strength versus SPY.
A failed hold above support would weaken the setup.
Actionable but governed by invalidation levels.
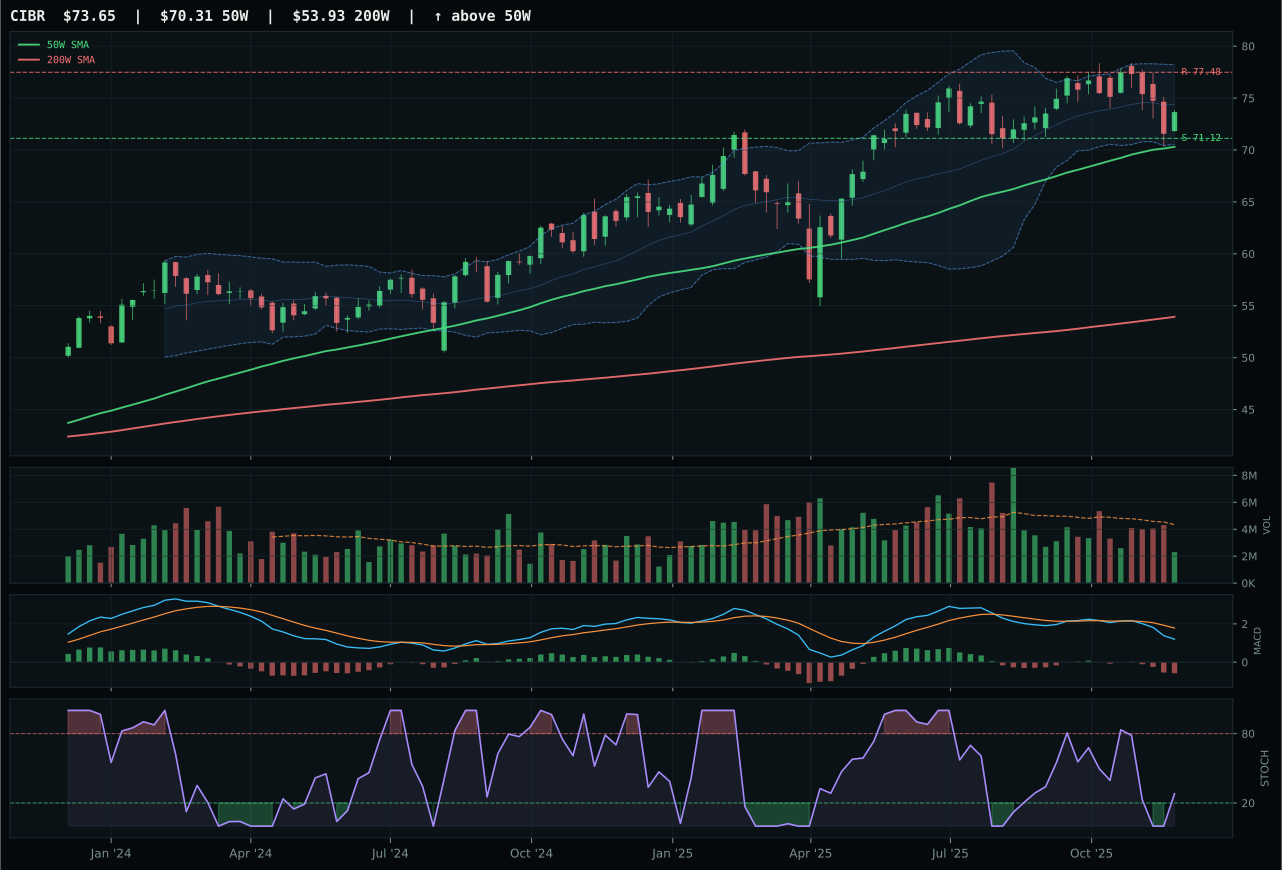
CIBR has a pullback into support profile with -5.2% 13-week relative strength versus SPY.
A failed hold above support would weaken the setup.
Actionable but governed by invalidation levels.
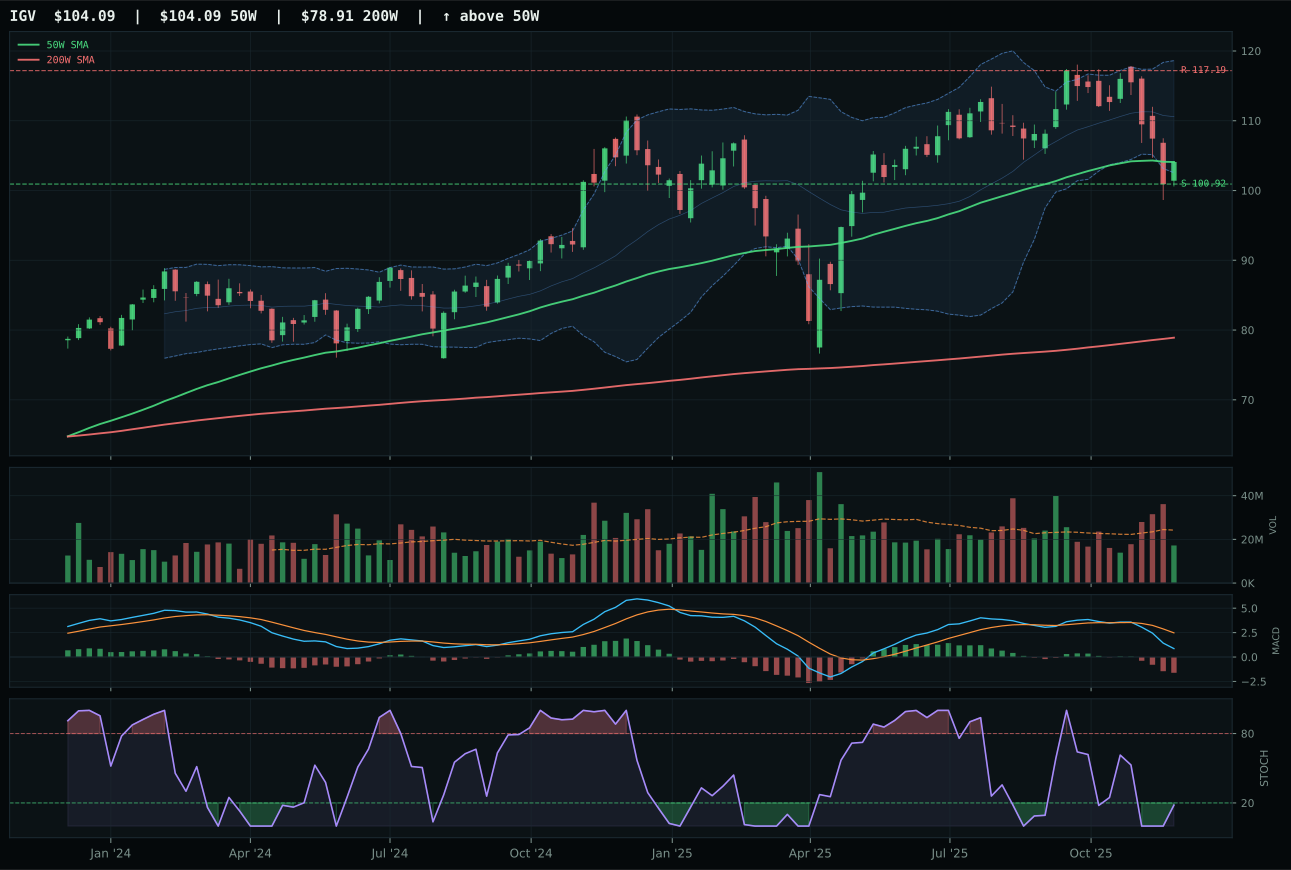
IGV has a pullback into support profile with -9.7% 13-week relative strength versus SPY.
A failed hold above support would weaken the setup.
Actionable but governed by invalidation levels.
CIBR defeated XLK by claiming the timing advantage that matters most in a stretched market: at only 4.8% above the 50W, CIBR offers a defined support zone at 71.12 where invalidation is clear, while XLK at 16.1% overhead has already exhausted its margin of safety. The category composite favored CIBR's pullback-into-support setup (timing score 100 vs XLK's 56) because MACD is bearish/weakening in both cases, but proximity to support creates asymmetric risk. CIBR's 0.0% relative strength within the three-ETF basket tied the category median, whereas XLK's 8.4% basket outperformance could not overcome its vertical extension and thin participation at 0.53x and 0.45x average volume respectively. The cybersecurity thesis trades at reasonable entry tension; the broad profitable tech thesis does not.
Technology earned 10% allocation because two categories—Precious Metals and Industrial Metals—scored materially higher (70.8 and 65.2) in a disinflation regime favoring real assets and monetary hedges. The 43.9 composite reflects credit stress (-4 macro descriptor weight) and liquidity stress (-10) dragging the category despite positive risk appetite and AI sponsorship signals (+9 and +6). Technical evidence scored 42.7/100, weak for a top-tier allocation, driven by thin volume participation across the three-ETF basket and MACD deterioration that prevents conviction. Technology would require either mean-reversion off support with volume confirmation or a shift in the active macro descriptor set (credit normalization, risk-appetite intensification) to justify elevation to 20% capital.
Nuclear Energy — URNM
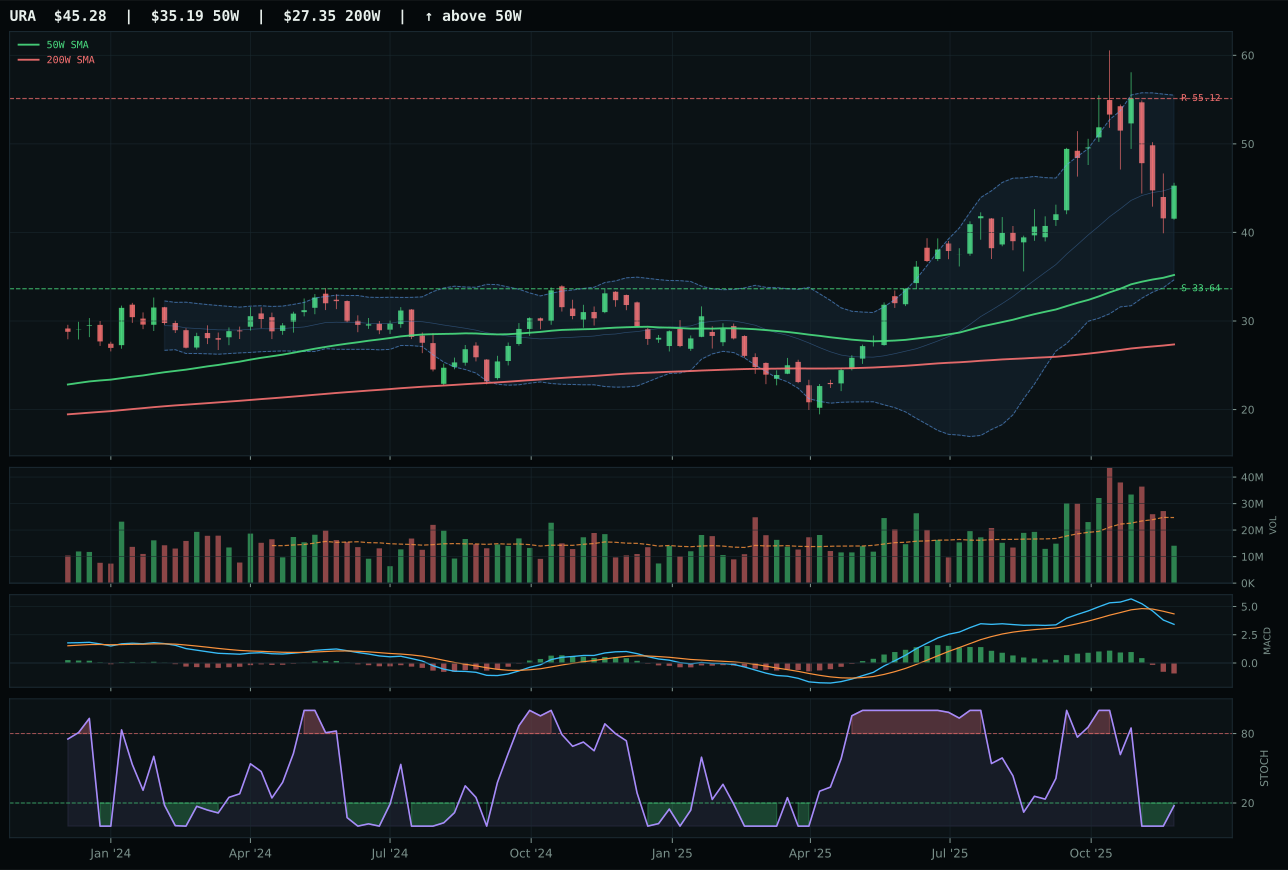
URA has a vertical extension profile with 5.4% 13-week relative strength versus SPY.
A failed hold above support would weaken the setup.
Actionable but governed by invalidation levels.
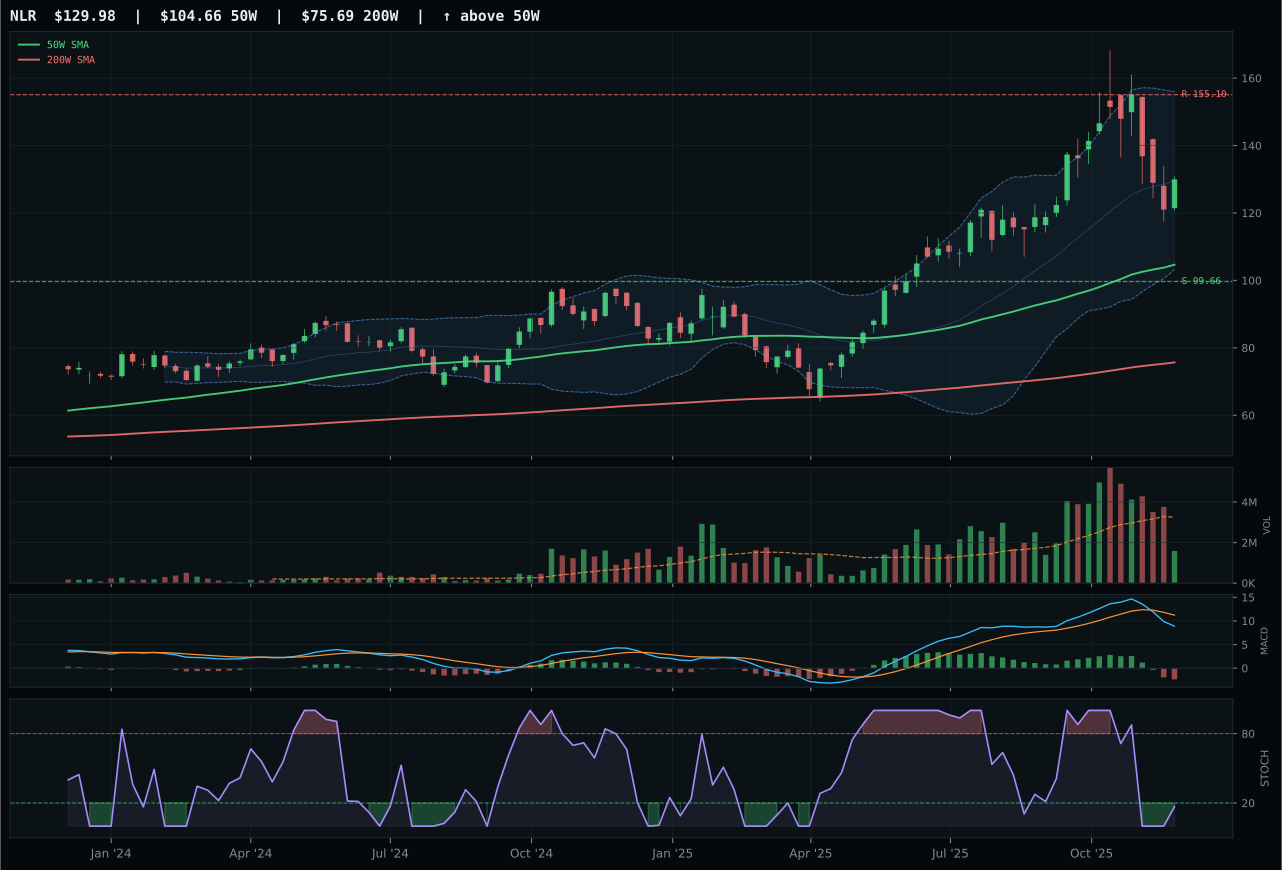
NLR has a vertical extension profile with 3.5% 13-week relative strength versus SPY.
A failed hold above support would weaken the setup.
Actionable but governed by invalidation levels.
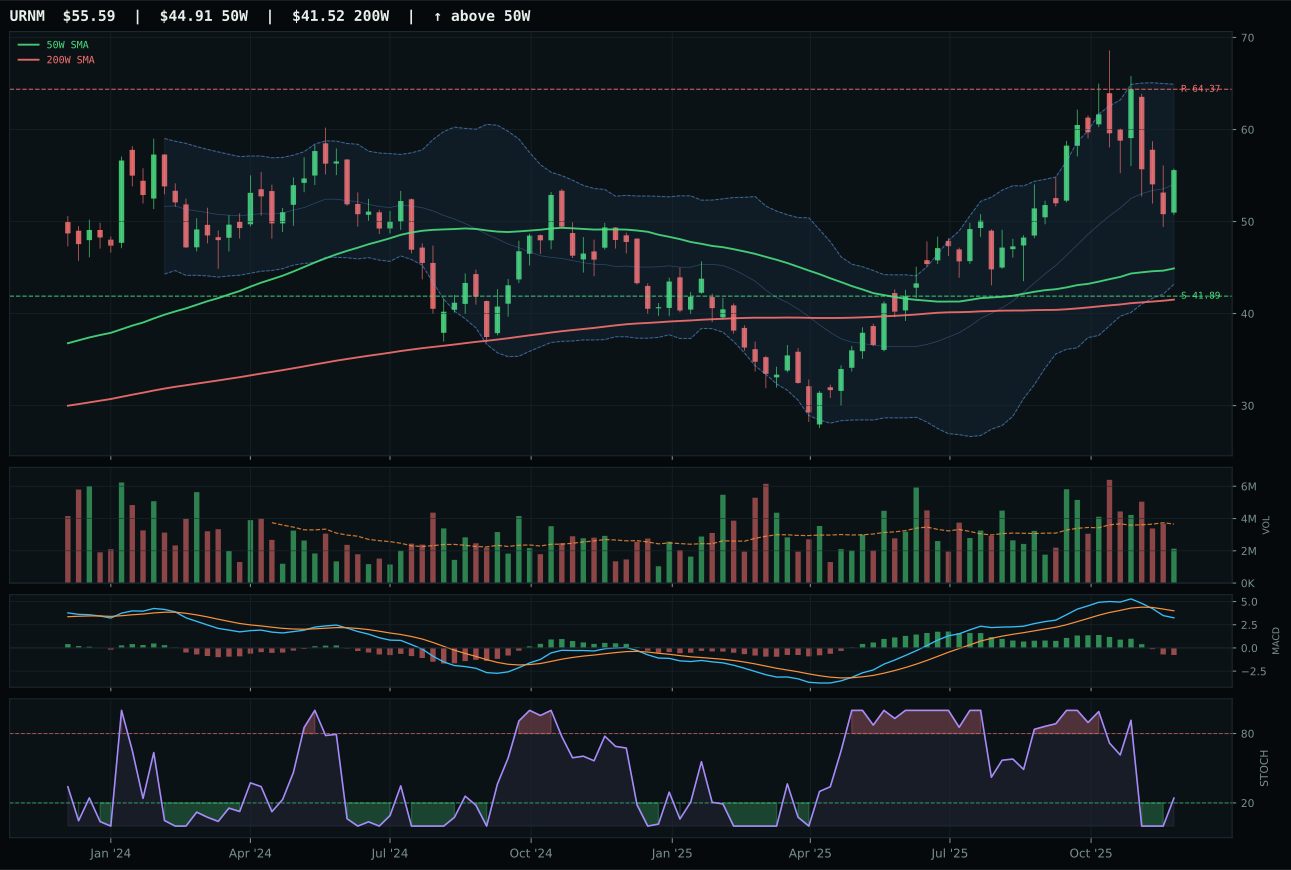
URNM has a vertical extension profile with 2.1% 13-week relative strength versus SPY.
A failed hold above support would weaken the setup.
Actionable but governed by invalidation levels.
URNM edges URA (score 40.5 vs lower peers) by a narrow margin because its stochastic RSI positioning (rising mid-zone at 0.24) provides superior timing to URA's oversold turn-up pattern, signaling earlier-stage momentum rather than late-stage reversal. The 13W return (8.1% vs URA's 11.3%) trails, but category-relative strength is -1.4% for URNM versus 1.9% for URA, implying URNM is holding the median more evenly. Both charts are extended (23.8% above 50W for URNM, similar range for URA), and MACD is bearish/weakening for both, preventing either from claiming conviction. The 2.6-point score gap reflects URNM's superior entry timing rather than fundamental superiority; in a weak category, this margin decides the representative slot. Volume thin participation (0.58x) and momentum confirmation at 15.3 (4W return -13.6%) constrain the category score, but URNM's rising stochastic avoids the reversal trap that URA's oversold setup invites.
Nuclear Energy received 10% allocation despite the 40.5 category score—second-lowest in the portfolio—because real asset sponsorship (+7) and AI growth sponsorship (+5) descriptors provide modest macro support in disinflation, offsetting liquidity stress (-7) and credit stress (-5) for a neutral 50.0/100 macro fit. The fundamental case rests on energy transition optionality: uranium supply scarcity and AI demand for carbon-free power create long-term structural tailwinds. However, URNM's 8.1% thirteen-week return, -1.4% category-relative strength, and 15.3 momentum confirmation reveal the trade lacks current momentum; the extended chart (23.8% above 50W) with bearish MACD and thin volume argues the move has already been priced. Allocation to 10% acknowledges the theme without overstating near-term setup quality. Elevation to higher weight requires either mean-reversion into support (41.89) with stochastic recovery or new macro catalyst around energy policy or AI power demand acceleration.
Traditional Energy — FCG
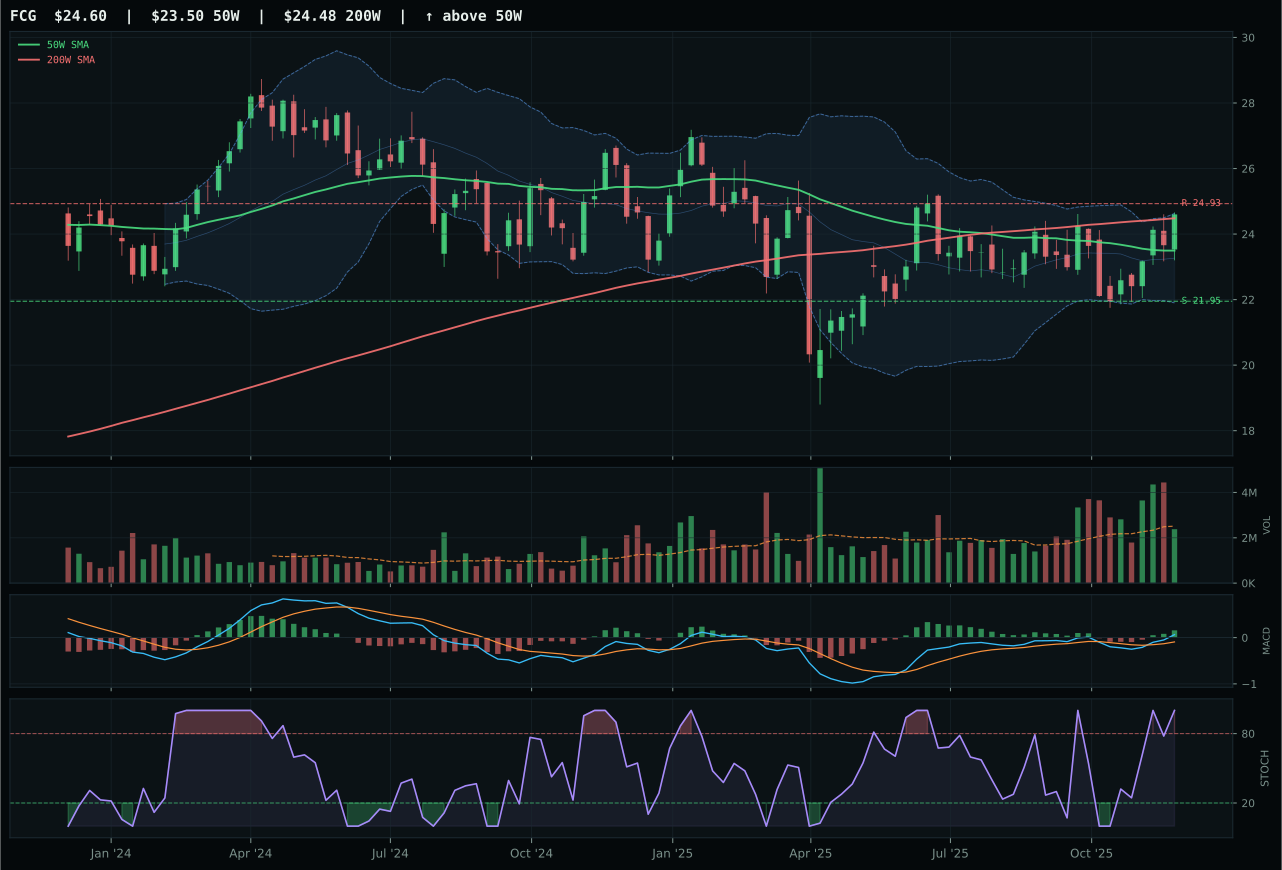
FCG has a neutral structure profile with -3.7% 13-week relative strength versus SPY.
A failed hold above support would weaken the setup.
Actionable but governed by invalidation levels.
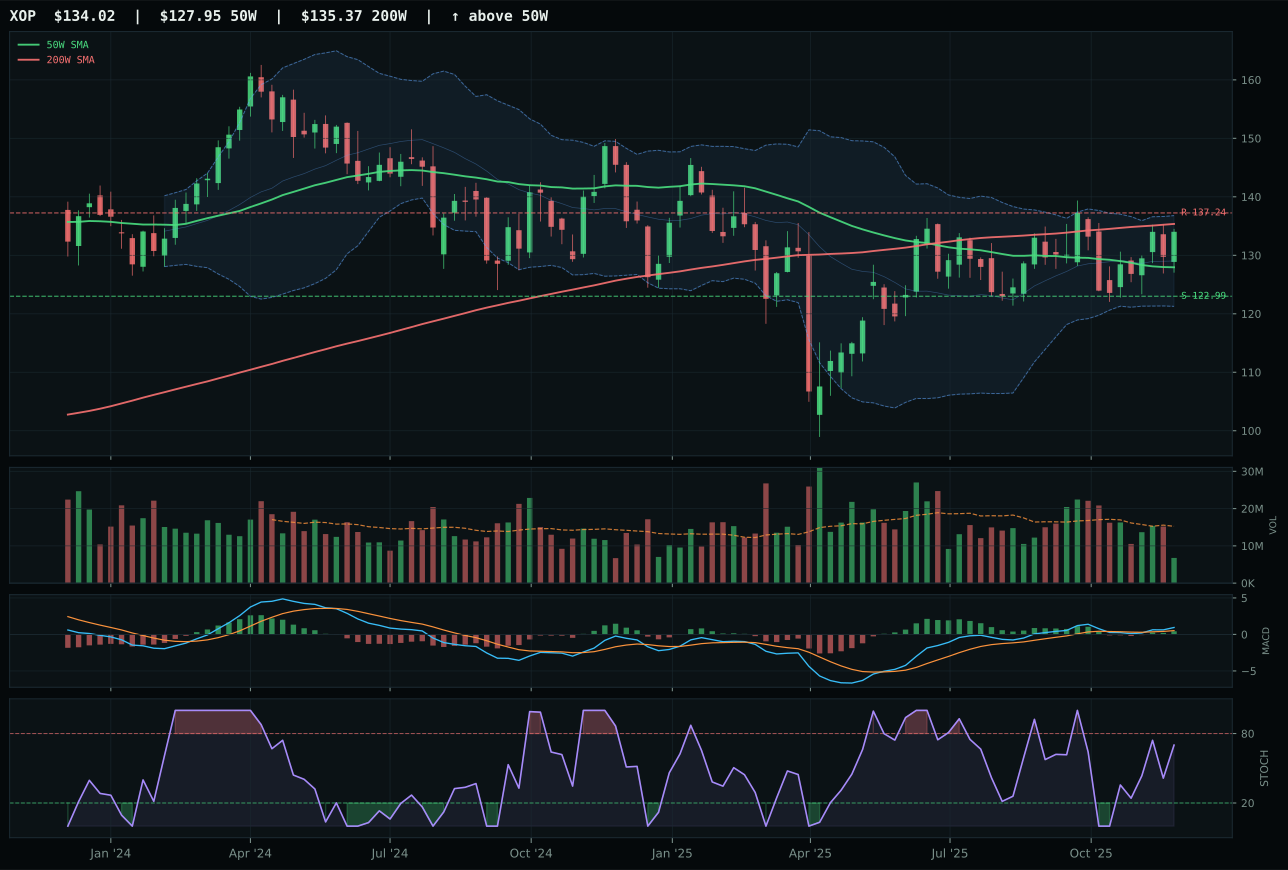
XOP has a neutral structure profile with -5.2% 13-week relative strength versus SPY.
A failed hold above support would weaken the setup.
Actionable but governed by invalidation levels.
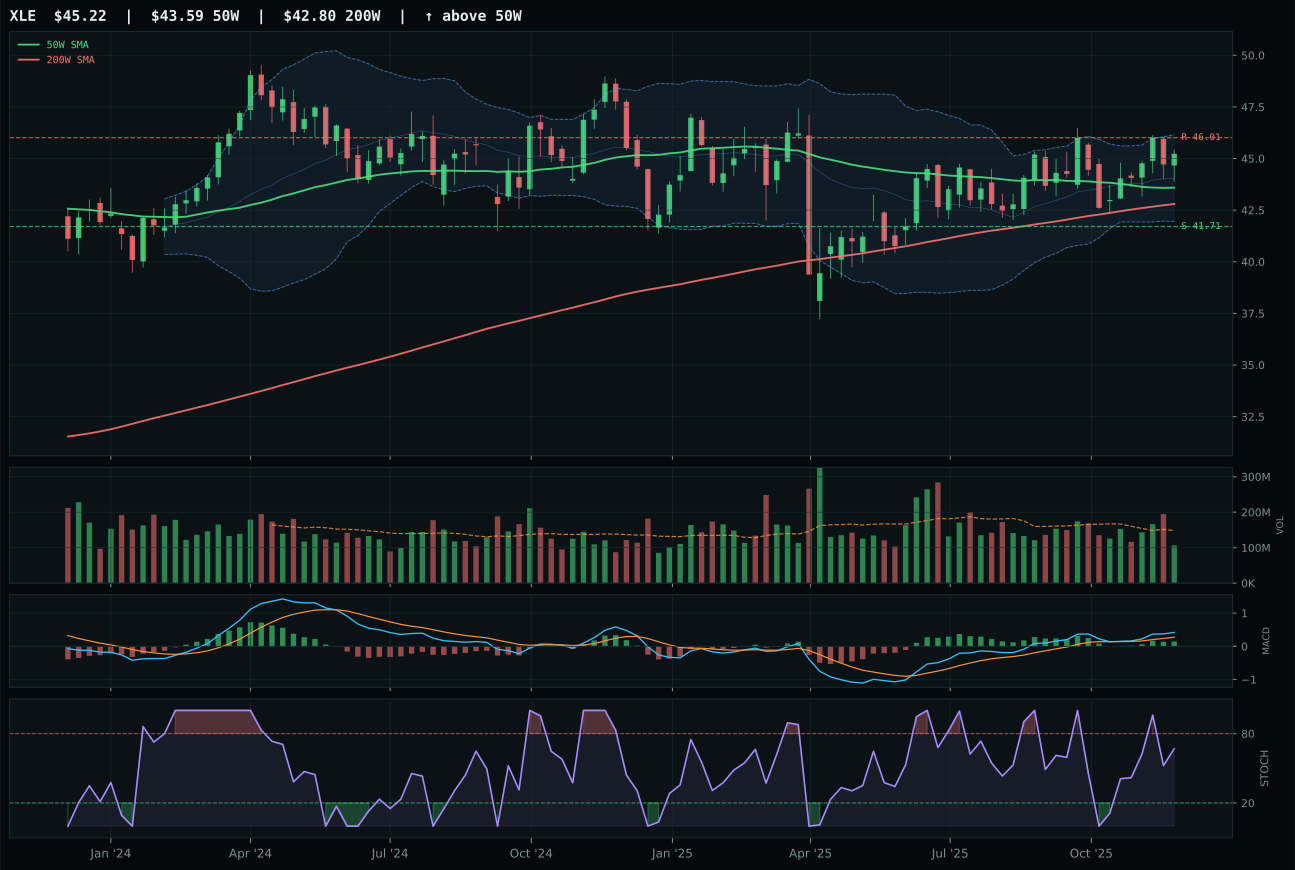
XLE has a neutral structure profile with -5.9% 13-week relative strength versus SPY.
A failed hold above support would weaken the setup.
Actionable but governed by invalidation levels.
FCG defeats XOP and XLE by combining superior momentum confirmation (77.4 vs weaker levels in peers) with neutral volume (0.95x, vs thin participation elsewhere) and the highest category-relative strength (1.4% vs 0.0% for XOP). The 13W return of 2.2% is muted, reflecting energy sector headwinds, but FCG's timing score of 90 (vs XOP's 98 and XLE's 98) places price at 4.7% from the 50W with MACD bullish and improving and stochastic RSI at overbought momentum (1.00), signaling tight setup that can resolve quickly. XOP and XLE both score higher on individual trend metrics (62 and 91 vs FCG's 84), but they suffer from thin participation, limiting the conviction available to anchor a category decision. FCG's risk/reward (47.0) acknowledges limited upside to 24.93 resistance, but the structure score (70.5) and neutral volume endorses this as the cleanest tactical expression within an energy category depressed by disinflation macro.
Traditional Energy received 10% allocation despite FCG's strong individual technical evidence (75.1) because the category-level macro fit (23.0) is the portfolio's weakest, dragged by disinflation pressure (-10), credit stress (-7), and liquidity stress (-7) that overwhelm real asset sponsorship (+7). The energy sector is fundamentally out of favor in a disinflationary environment where monetary demand and scarcity premiums favor precious and industrial metals over hydrocarbons. FCG's neutral volume and MACD improvement offer tactical merit, but the 2.2% thirteen-week return and near-zero SPY relative strength (-3.7%) confirm energy's structural lag. Allocation to 10% honors optionality and portfolio breadth; elevation would require either a shift in macro descriptors (inflation re-acceleration, credit stress reversal) or completion of FCG's nascent uptrend with volume confirmation and breakout above 24.93 resistance.
Defense & Aerospace — ITA
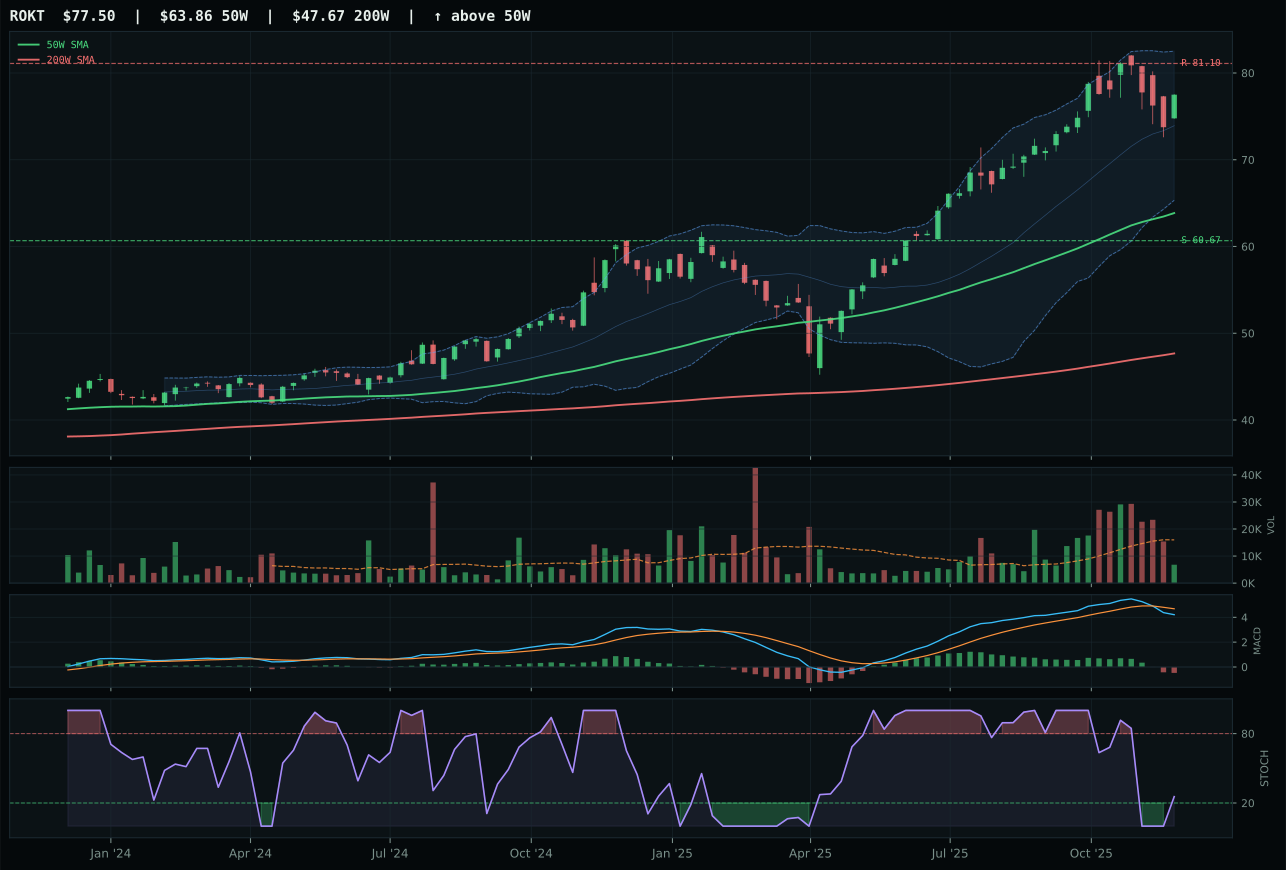
ROKT has a vertical extension profile with 2.3% 13-week relative strength versus SPY.
A failed hold above support would weaken the setup.
Tracked, but not top-2 eligible because: .
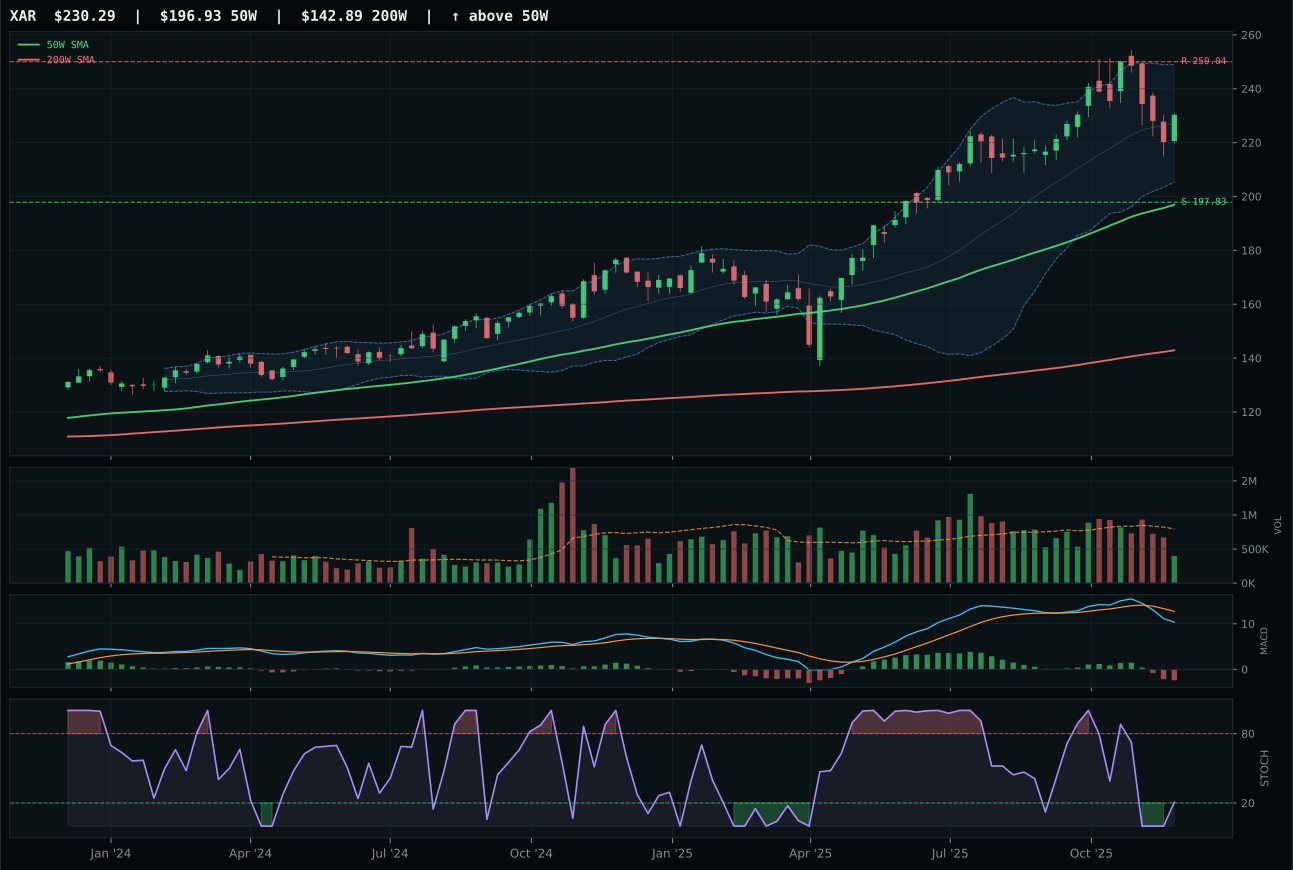
XAR has a vertical extension profile with -0.0% 13-week relative strength versus SPY.
A failed hold above support would weaken the setup.
Actionable but governed by invalidation levels.
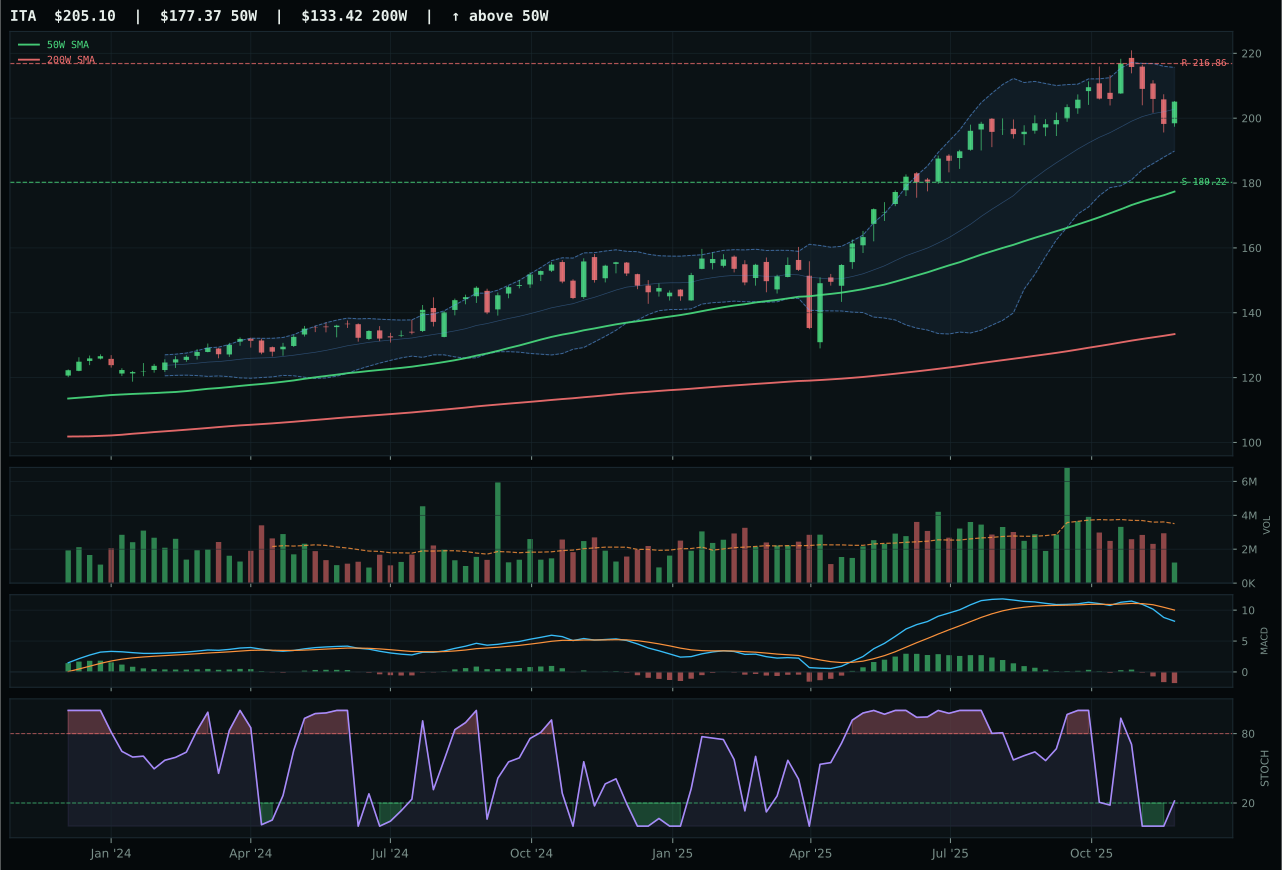
ITA has a vertical extension profile with -2.6% 13-week relative strength versus SPY.
A failed hold above support would weaken the setup.
Actionable but governed by invalidation levels.
ITA wins the category despite the third-best reasoned proof order (32.9 vs ROKT's 40.8 and XAR's 38.9) because the category reasoner elevates the representative ETF—not the weighted basket—and ITA's superior risk/reward (52.1 vs ROKT's 47.9) combined with tighter distance to the 50W (15.6% vs 21.4%) creates better odds that any pause-and-reversal setup holds intact. ROKT's strength in the reasoned proof order reflects higher 13W return (8.2%) and category-relative RS (2.3%), but it is overextended and offers less downside cushion to invalidation. ITA's -2.6% SPY relative strength and 3.4% thirteen-week return reflect durability over momentum, a trade-off the timing score (56 for both) and MACD (bearish/weakening for both) endorses when extension is the risk variable. The score gap of 14.7 favors ITA, confirming clean category decision.
Defense & Aerospace received 10% allocation in a disinflation regime because the category macro fit (51.0) falls below the threshold for top-2 consideration; Precious Metals, Industrial Metals, and AI all score higher. Liquidity stress (-4) and credit stress (+2 offset) weigh modestly on the category, but the core impediment is that neither geopolitical risk nor defense spending momentum appears embedded in the active macro descriptor set—only real asset and growth sponsorship clauses matter. ITA's 3.4% thirteen-week return and extended chart structure (15.6% above 50W) suggest the category's appeal has already been priced; further moves require either new catalyst confirmation or macro descriptor activation around geopolitical risk. The 36.0 final score places it below half the portfolio's categories, justifying equal-weight allocation alongside four other 10% slots.
Emerging Markets — ILF
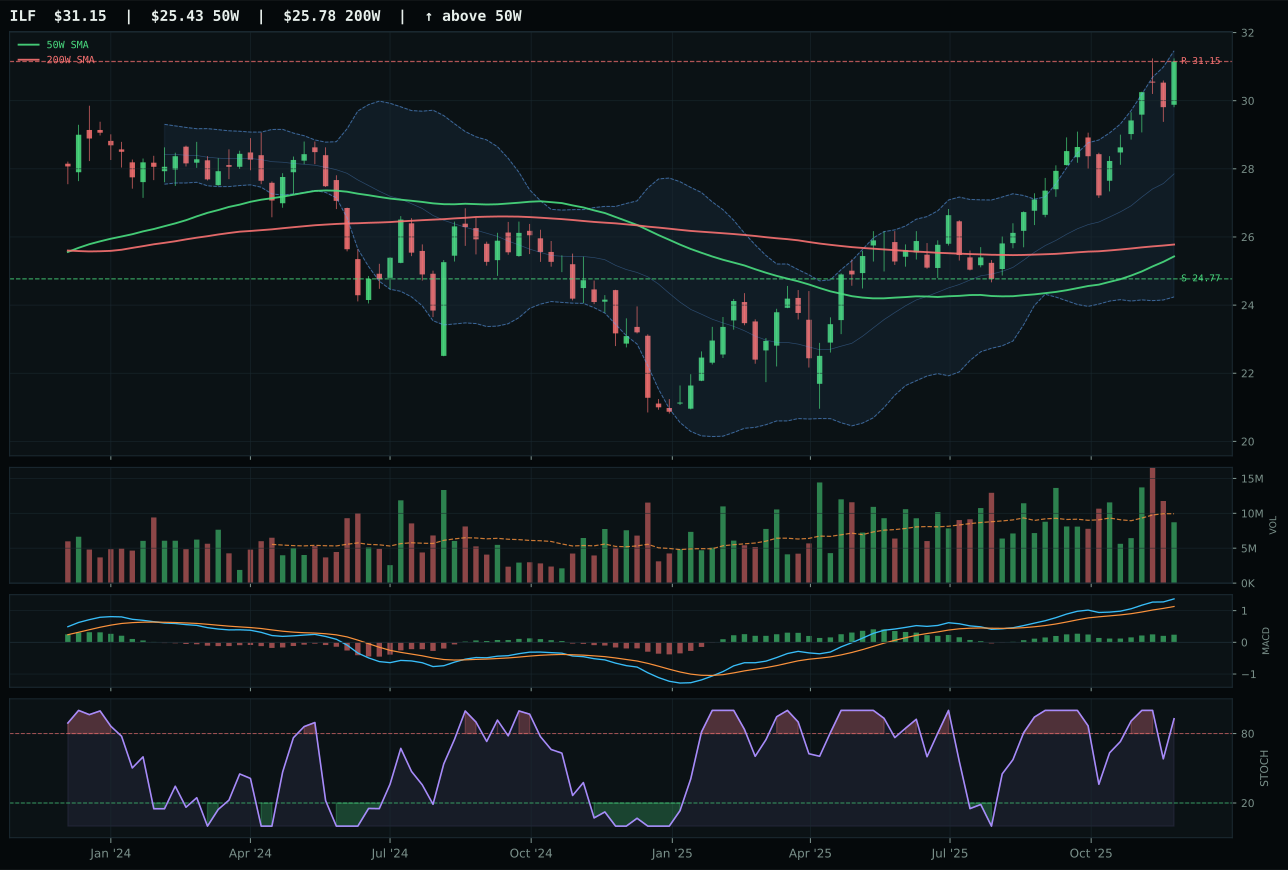
ILF has a vertical extension profile with 9.0% 13-week relative strength versus SPY.
A failed hold above support would weaken the setup.
Actionable but governed by invalidation levels.
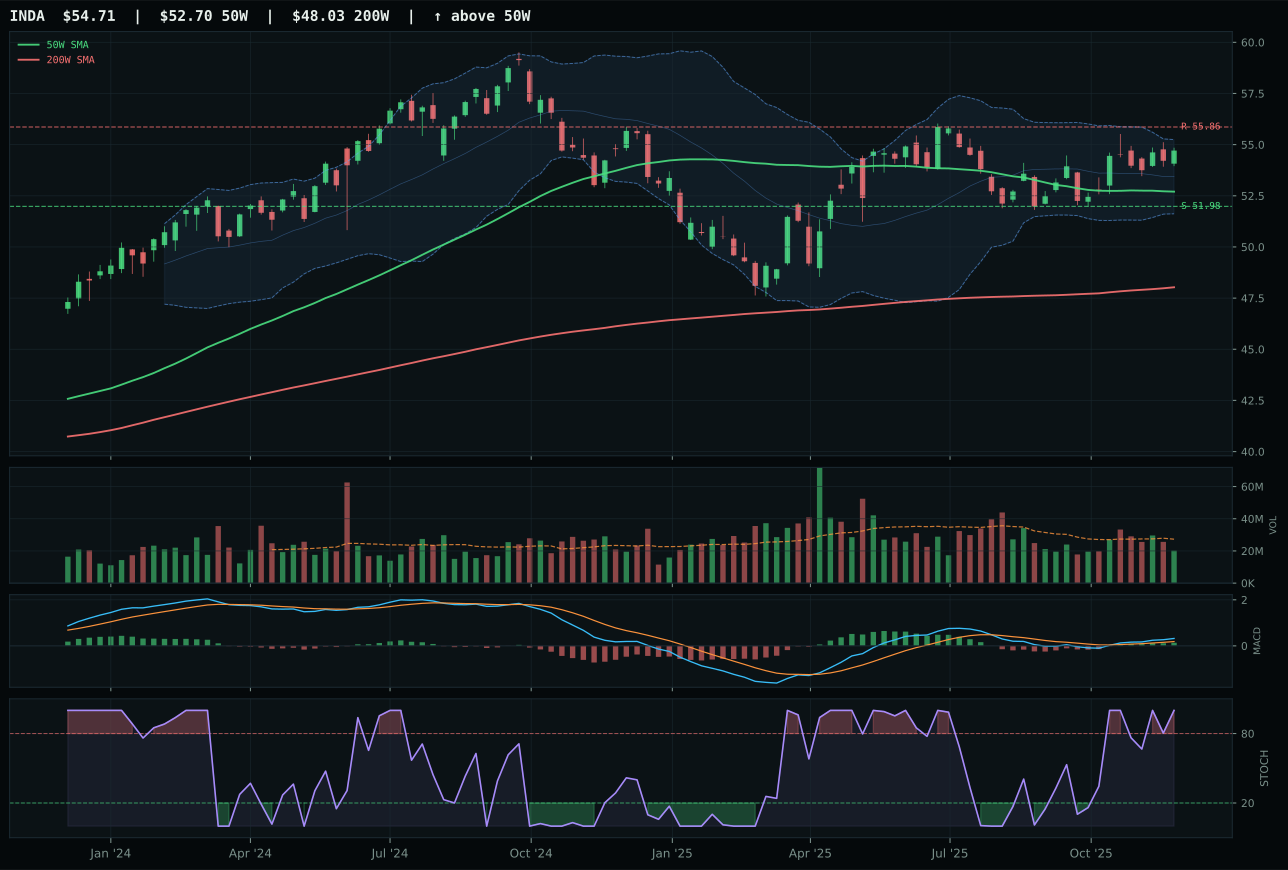
INDA has a neutral structure profile with -0.7% 13-week relative strength versus SPY.
A failed hold above support would weaken the setup.
Actionable but governed by invalidation levels.
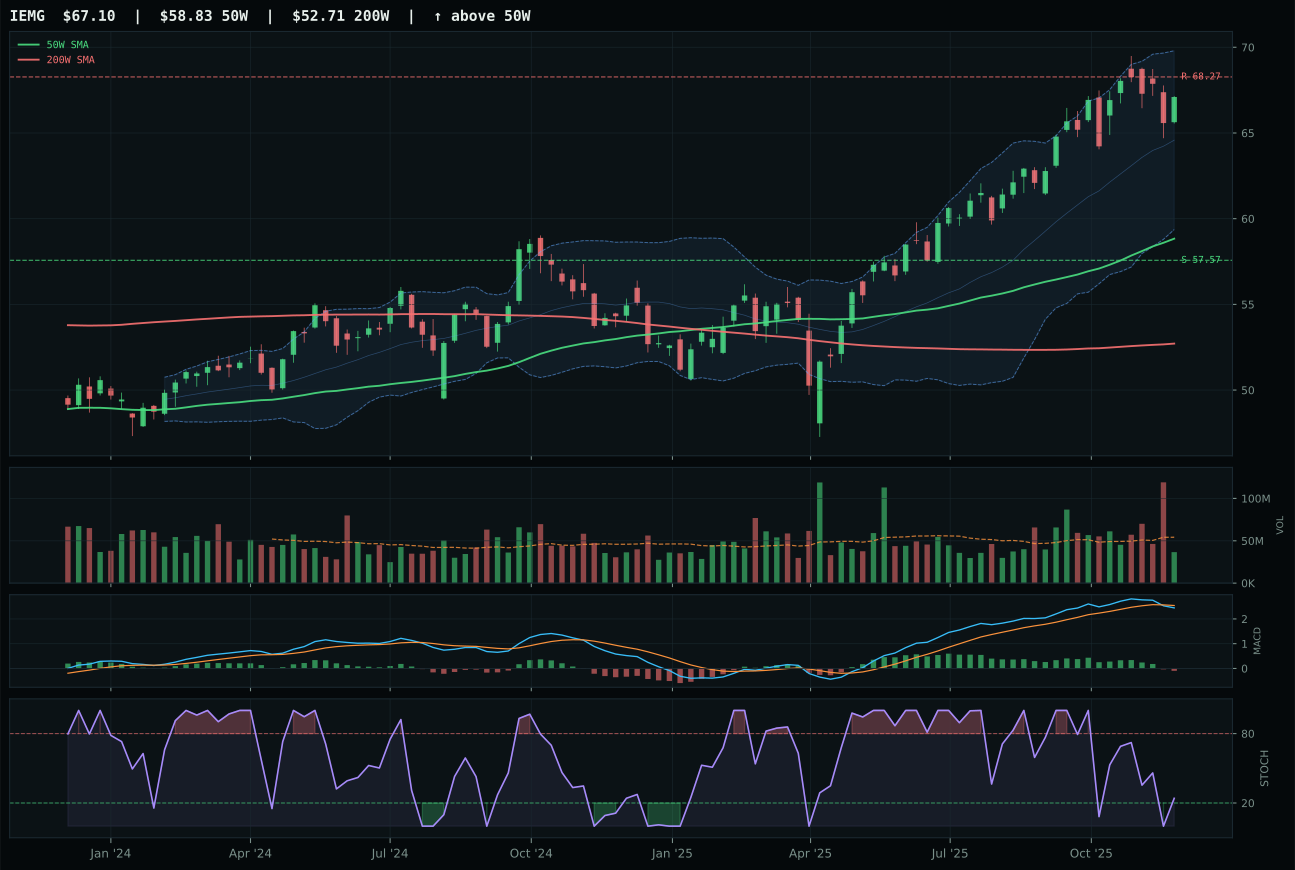
IEMG has a neutral structure profile with 2.1% 13-week relative strength versus SPY.
A failed hold above support would weaken the setup.
Actionable but governed by invalidation levels.
ILF defeats INDA (score 31.4 vs INDA's higher reasoned proof at 63.1) because the category reasoner selects the technical representative rather than the basket-weighted leader, and ILF's timing score (27) combined with perfect trend (100) and momentum (100) better explain the price action even though INDA's structure (76.9 vs ILF's 79.7) and macro fit (48.0 vs 54.0) appear stronger. ILF's 14.9% thirteen-week return and 9.0% SPY relative strength show Latin America commodity and value beta capturing metals scarcity (+5) and commodity breadth (+8) without INDA's India concentration risk. ILF's stochastic RSI overbought rolling over (0.93) versus INDA's overbought momentum signals ILF near a potential retest, making it a safer representative entry than INDA's extended neutral structure. The 4.4-point score gap reflects representative decision protocol; INDA's higher technical evidence (71.9) cannot overcome ILF's superior entry structure.
Emerging Markets earned 0% allocation because the category scores 31.4, ranking 9th among ten and falling outside the eight-position portfolio. The macro environment is explicitly hostile: credit stress subtracts –10, liquidity stress subtracts –10, and risk appetite provides only +8 offset. ILF's technical evidence of 62.8 would normally warrant consideration, but the category-level macro fit is just 38.0, meaning the environment is pulling emerging-market risk down faster than technicals can prop it up. ILF's overbought stochastic rolling over (0.93) signals momentum exhaustion even as the trend remains bullish, creating a timing mismatch. The allocation decision is direct: emerging markets lack macro sponsorship in a disinflation, credit-stressed environment. ILF can re-enter only if risk appetite accelerates, credit spreads compress, and commodity breadth broadens across Latin America. Until then, this category remains excluded in favor of higher-conviction real-asset trades (metals, energy, infrastructure).
Agriculture & Livestock — MOO
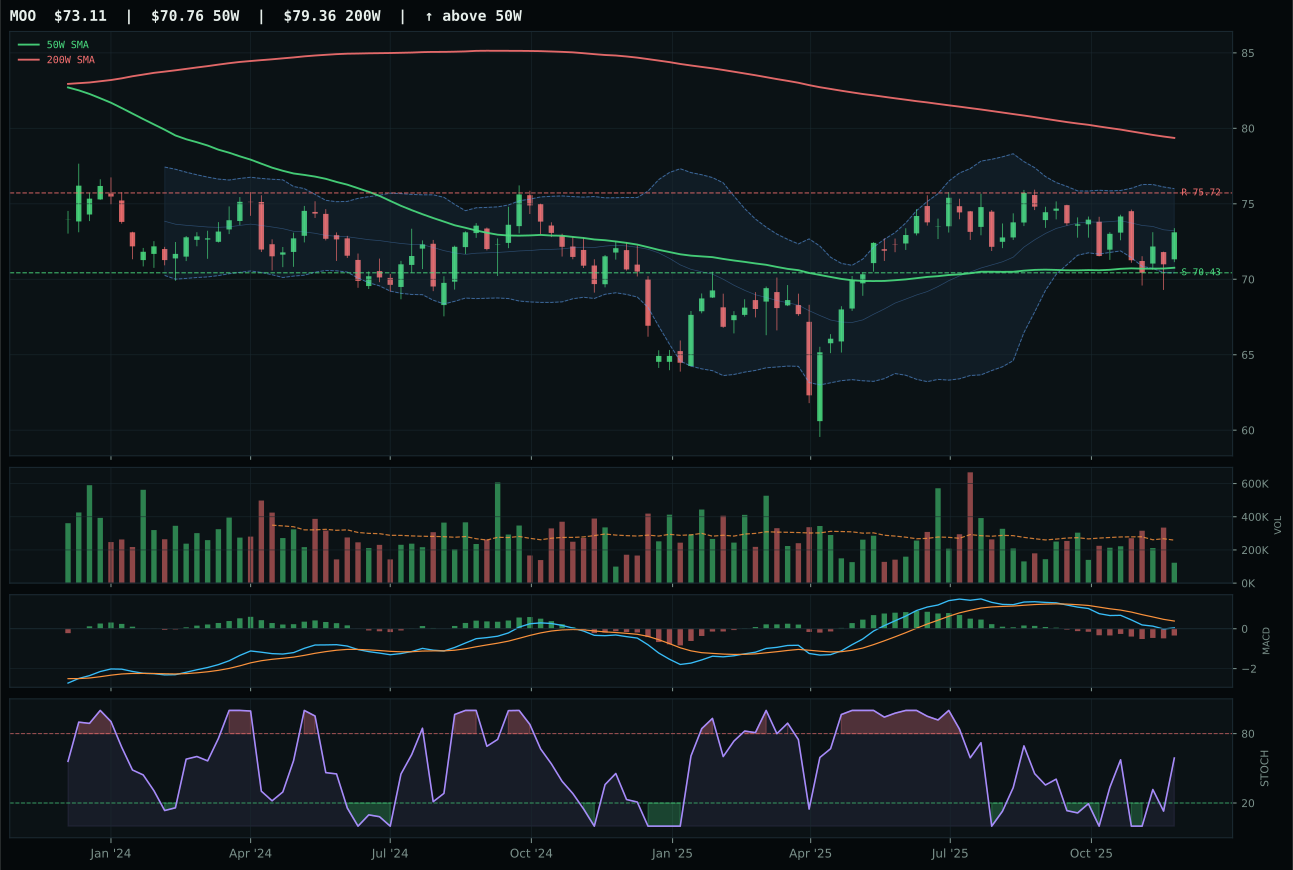
MOO has a pullback into support profile with -8.2% 13-week relative strength versus SPY.
A failed hold above support would weaken the setup.
Actionable but governed by invalidation levels.
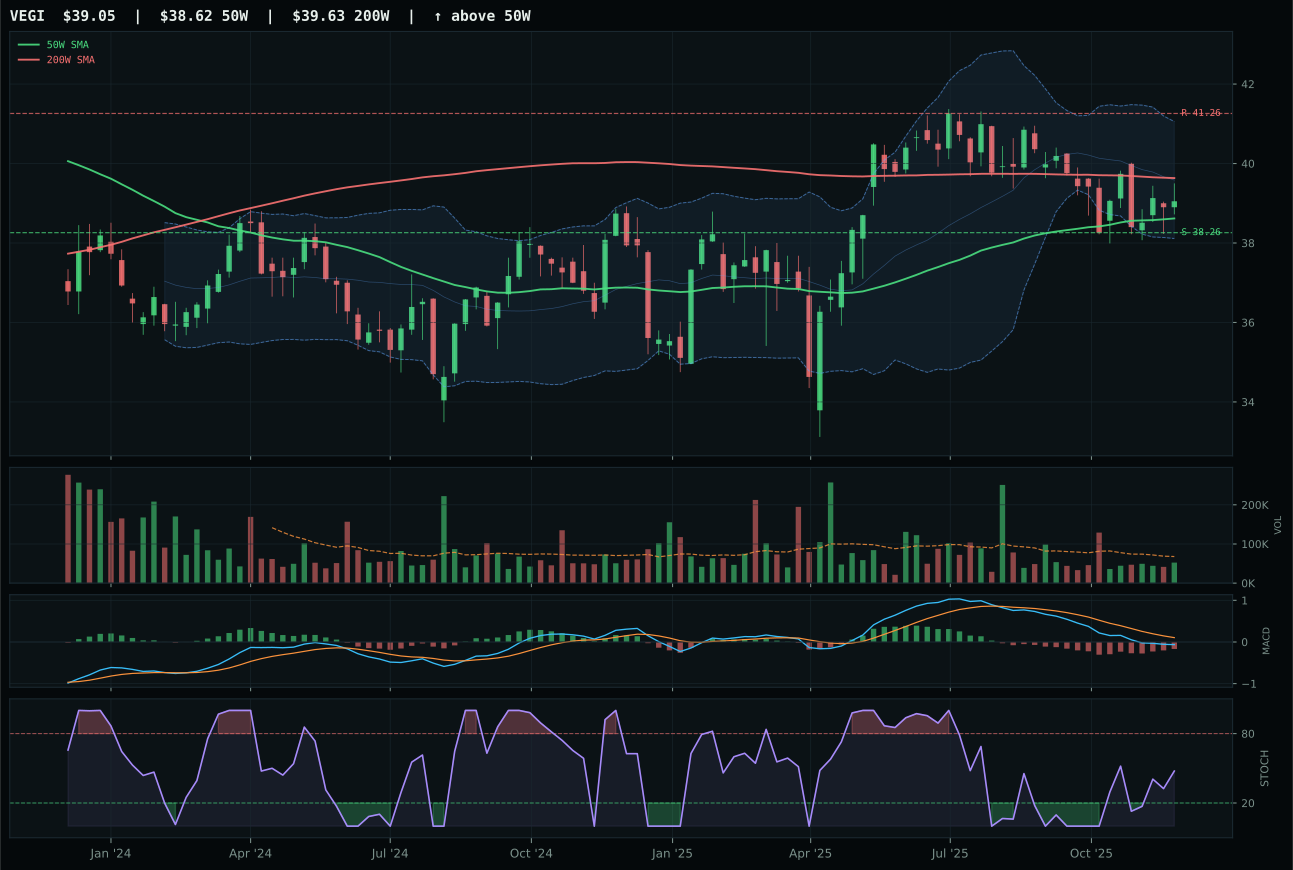
VEGI has a pullback into support profile with -9.2% 13-week relative strength versus SPY.
A failed hold above support would weaken the setup.
Tracked, but not top-2 eligible because: .
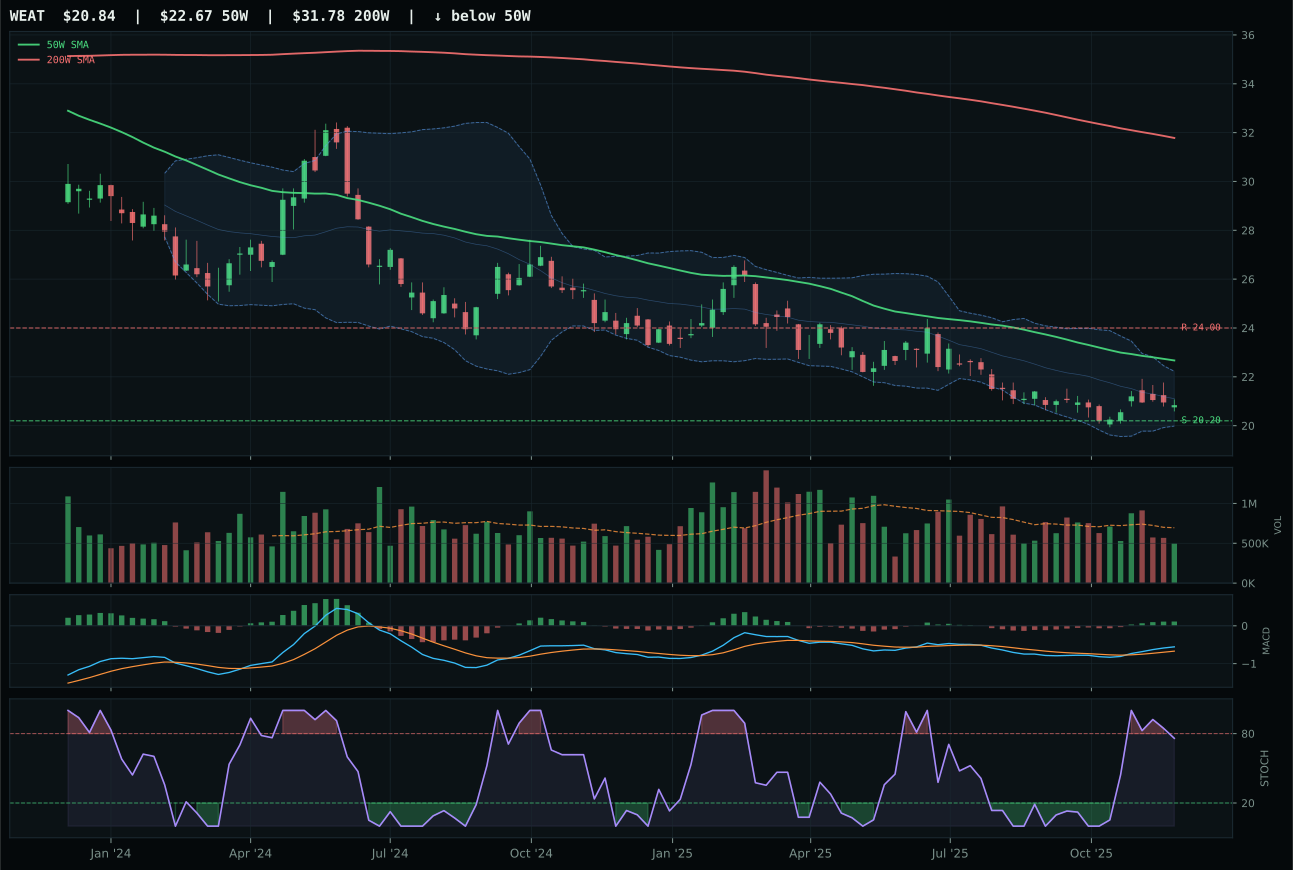
WEAT has a pullback into support profile with -8.6% 13-week relative strength versus SPY.
Extension and support failure are the main tactical risks.
Tracked, but not top-2 eligible because: structurally broken.
MOO wins through timing precision and defined support: at only 3.3% from the 50W, the pullback-into-support setup at 70.43 delivers a 100-point timing score (vs category median lower scores) because price sits at the exact pivot where invalidation becomes measurable. The 13W return of -2.3% and -8.2% SPY relative strength reflect agribusiness headwinds from disinflation, but the category-relative strength of 0.3% keeps MOO at the median rather than below it—critical for winning a weak category. VEGI offers better macro positioning with neutral volume (vs MOO's thin participation), but the -0.6% category-relative RS (vs MOO's 0.3%) tips the category decision. The 15.9-point gap versus VEGI is decisive; MOO's support zone and rising stochastic (0.59) provide a cleaner tactical entry despite the category's macro headwinds.
Agriculture & Livestock earned 0% allocation because the category scores 22.1, ranking 10th and falling outside the eight-position portfolio. The category is damaged by disinflation pressure, which subtracts –8 points—a direct headwind to farm commodities and livestock prices. Real asset sponsorship (+8) and commodity breadth (+5) provide some offset, but the net macro fit is just 45.0, and the technical evidence (MOO at 59.2 in the reasoning layer) is insufficient to overcome the environmental headwind. The setup itself—pullback into support with improving MACD—would normally warrant consideration, but neither MOO nor VEGI shows the kind of relative strength or volume confirmation that signals accumulation by committed capital. This category will re-enter the portfolio only if disinflation pressures reverse, credit conditions stabilize further, and commodity breadth spreads widen. For now, it sits excluded.