
2025-11-21
Informational purposes only. The content in this report, including allocations, analysis, and commentary, is provided solely for informational and educational purposes. It does not constitute financial advice, investment advice, trading advice, or any other type of advice. Past performance does not guarantee future results. Always conduct your own research and consult a qualified financial professional before making investment decisions.
Weekly Allocation
| Ticker | Category | Weight | Role |
|---|---|---|---|
| GLD | Precious Metals | 20% | Top-2 (20%) |
| PICK | Industrial Metals | 20% | Top-2 (20%) |
| IGF | Utilities & Infrastructure | 10% | Tier-2 (10%) |
| URNM | Nuclear Energy | 10% | Tier-2 (10%) |
| ITA | Defense & Aerospace | 10% | Tier-2 (10%) |
| XLK | Technology | 10% | Tier-2 (10%) |
| SMH | AI | 10% | Tier-2 (10%) |
| XLE | Traditional Energy | 10% | Tier-2 (10%) |
Trade Instructions — Monday Open
Sell the tranche from 2025-10-24 (completing its 4-week hold). Buy the new tranche. Instructions show net portfolio changes — same-asset positions cancel, weight changes show the delta.
| Action | Ticker | Instruction |
|---|---|---|
| SELL | FBTC | Sell 25% of FBTC position (reduce 50.00% → 37.50%) |
| SELL | XLU | Sell 67% of XLU position (reduce 3.75% → 1.25%) |
| SELL | REMX | Sell entire REMX position (2.50% of portfolio) |
| SELL | NLR | Sell 50% of NLR position (reduce 2.50% → 1.25%) |
| SELL | XAR | Sell 50% of XAR position (reduce 2.50% → 1.25%) |
| BUY | SMH | Buy SMH — 6.25% of freed cash (adds 1.25% to portfolio) |
| BUY | GLD | Buy GLD — 18.75% of freed cash (adds 3.75% to portfolio) |
| BUY | XLK | Buy XLK — 6.25% of freed cash (adds 1.25% to portfolio) |
| BUY | XLE | Buy XLE — 6.25% of freed cash (adds 1.25% to portfolio) |
| BUY | PICK | Buy PICK — 25.00% of freed cash (adds 5.00% to portfolio) |
| BUY | ITA | Buy ITA — 12.50% of freed cash (adds 2.50% to portfolio) |
| BUY | IGF | Buy IGF — 12.50% of freed cash (adds 2.50% to portfolio) |
| BUY | URNM | Buy URNM — 12.50% of freed cash (adds 2.50% to portfolio) |
Current Portfolio After Trade
Combined holdings across all 4 active tranches. Each tranche is 25% of the portfolio.
| Ticker | % of Portfolio | Weight Bar |
|---|---|---|
| FBTC | 37.50% | |
| GLD | 10.00% | |
| PICK | 10.00% | |
| SMH | 6.25% | |
| XLK | 6.25% | |
| ILF | 5.00% | |
| XLE | 3.75% | |
| ITA | 3.75% | |
| IGF | 3.75% | |
| URNM | 3.75% | |
| SLV | 2.50% | |
| XLU | 1.25% | |
| NLR | 1.25% | |
| XAR | 1.25% | |
| URA | 1.25% | |
| PAVE | 1.25% | |
| COPX | 1.25% |
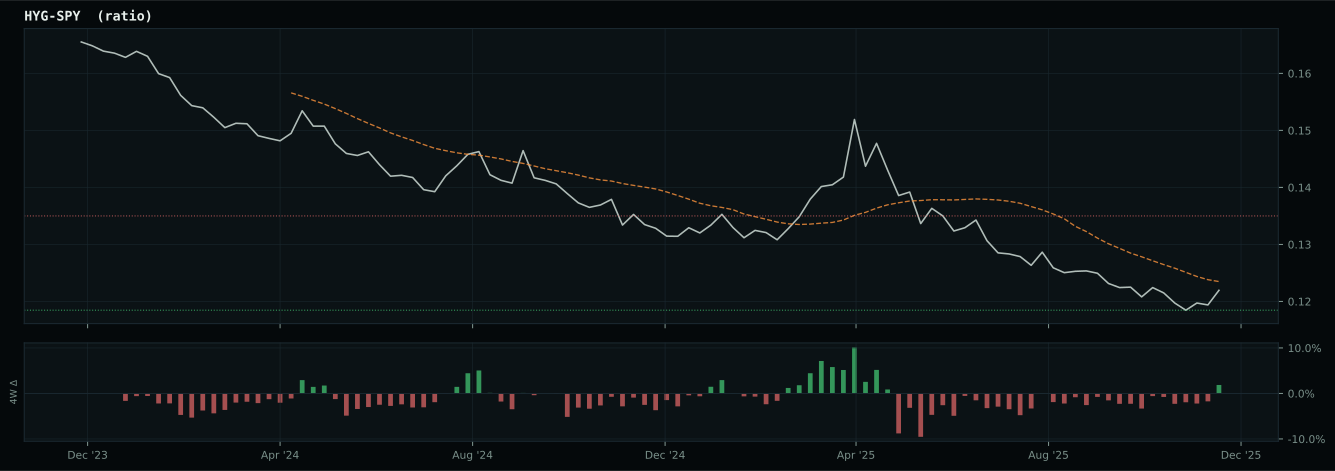
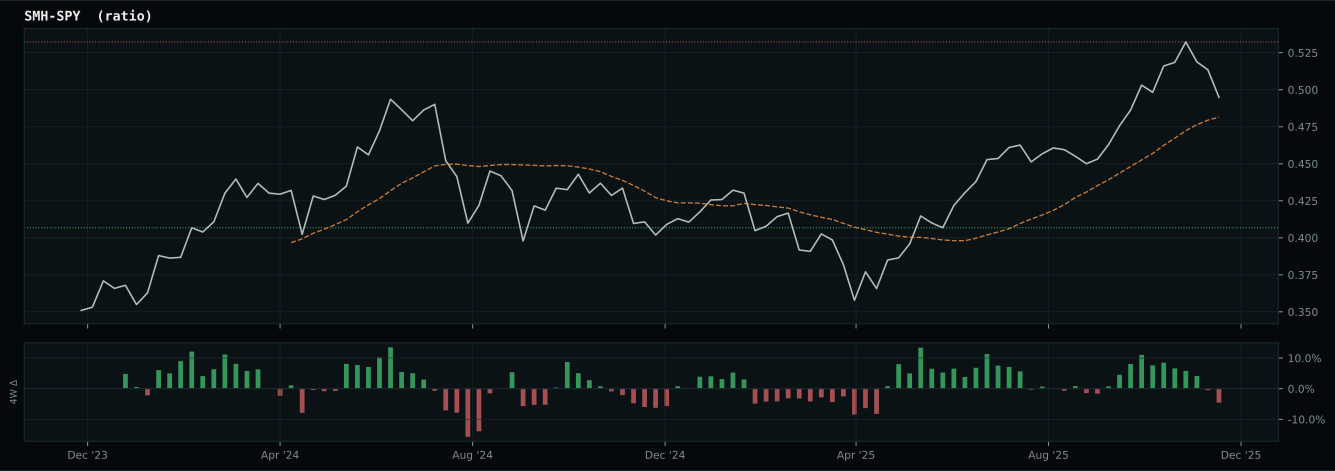
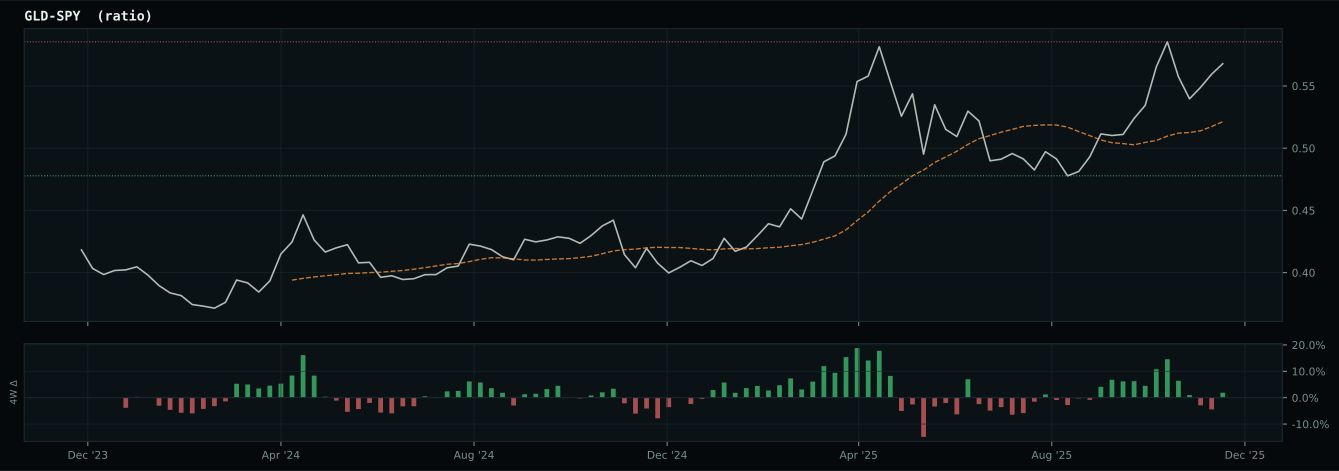
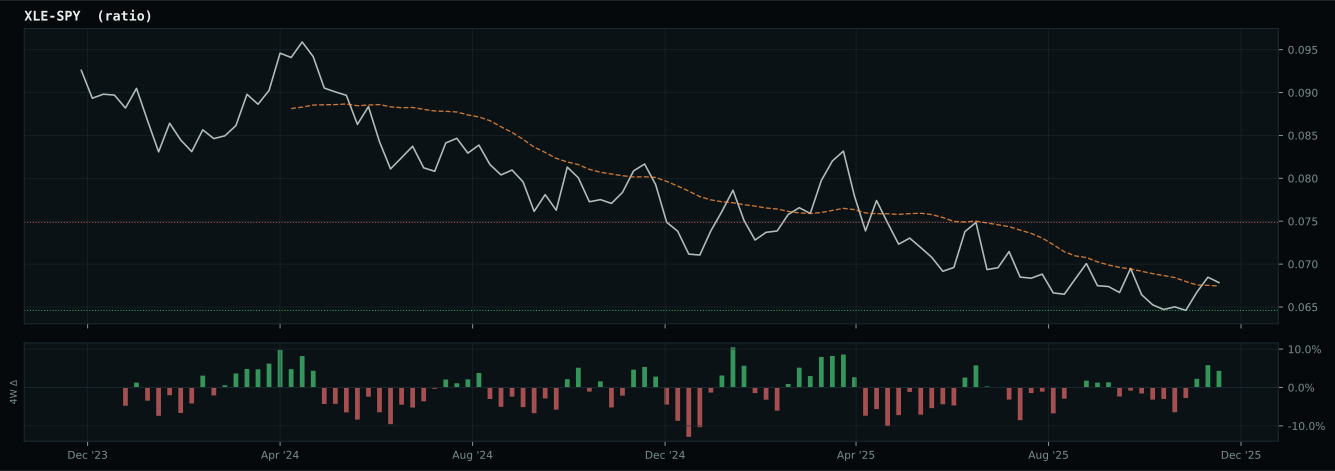
Macro Regime — Disinflation
Macro Evidence Charts
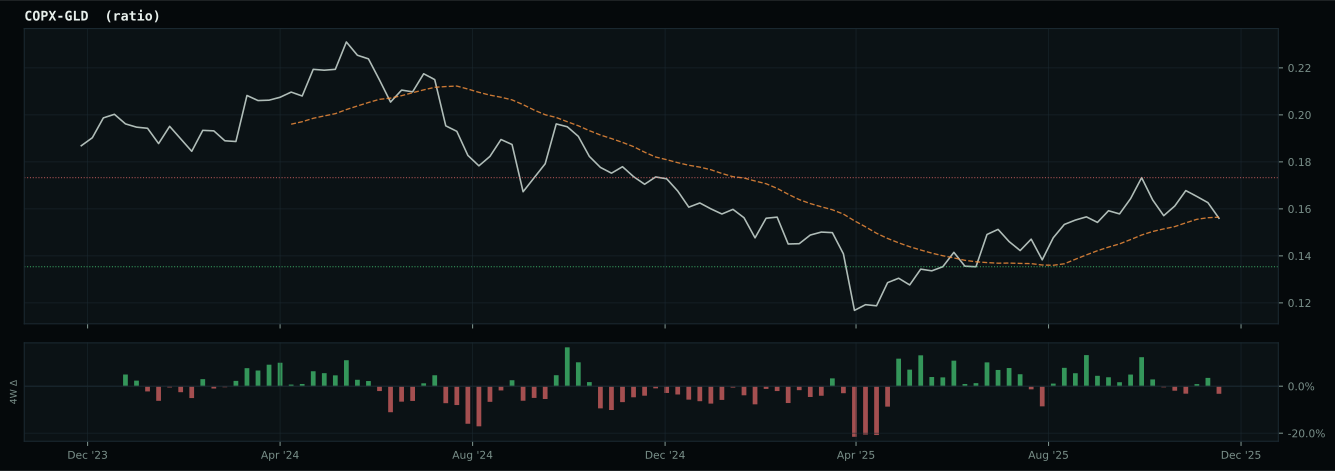
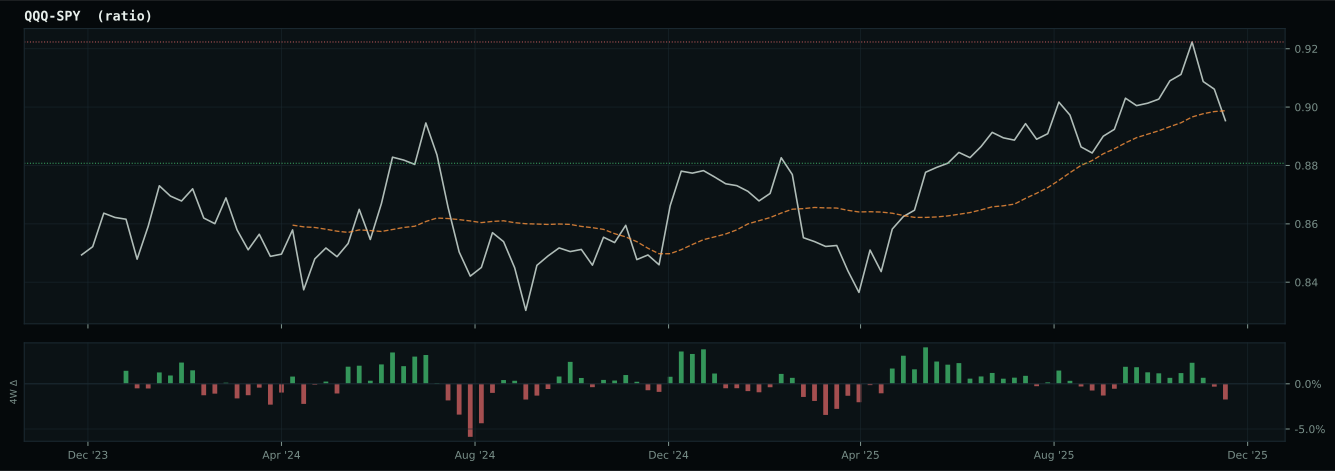
Market-implied signals behind the macro regime scores. Each ratio compares two assets; the direction and slope of the ratio is what the macro engine reads.
Crypto Regime — NoCrypto
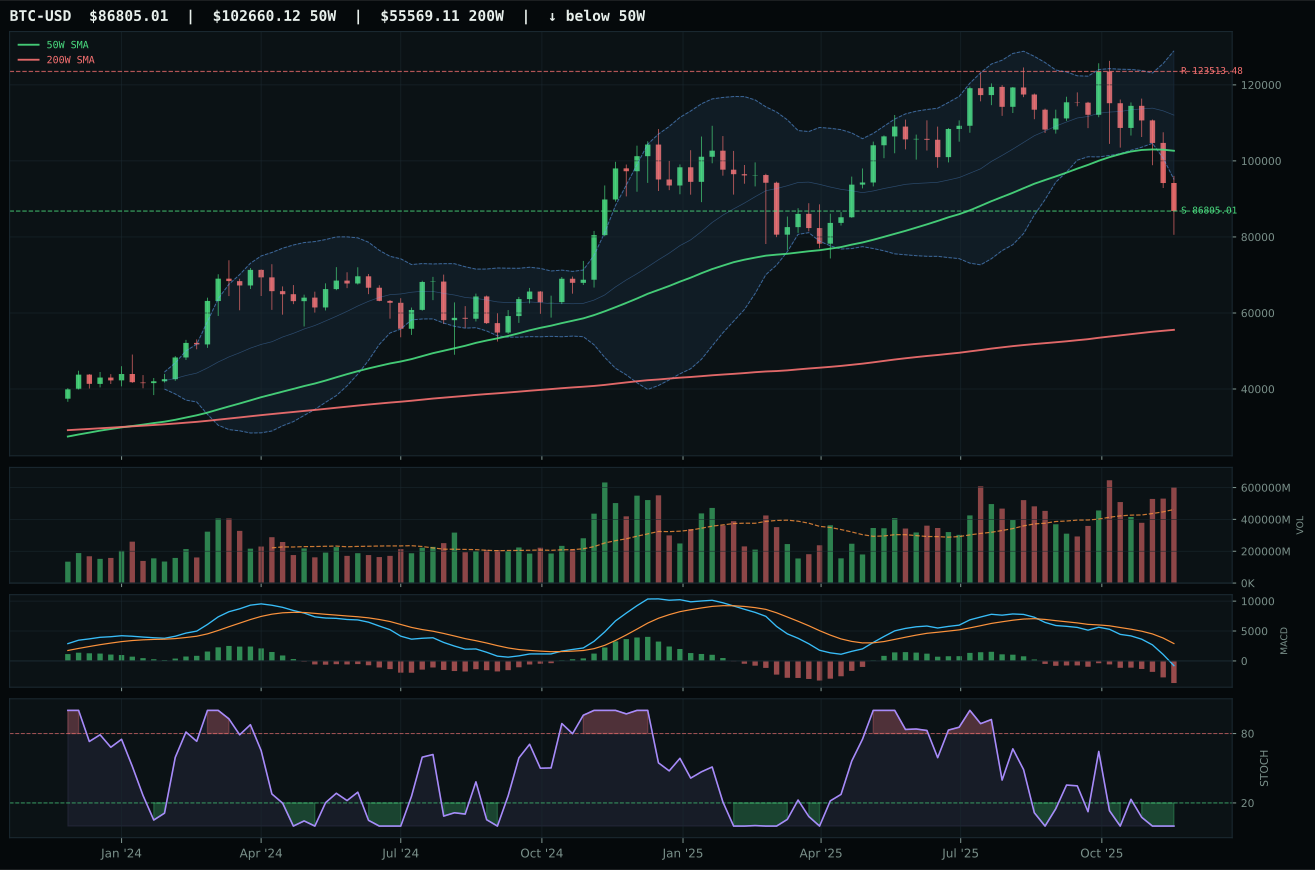
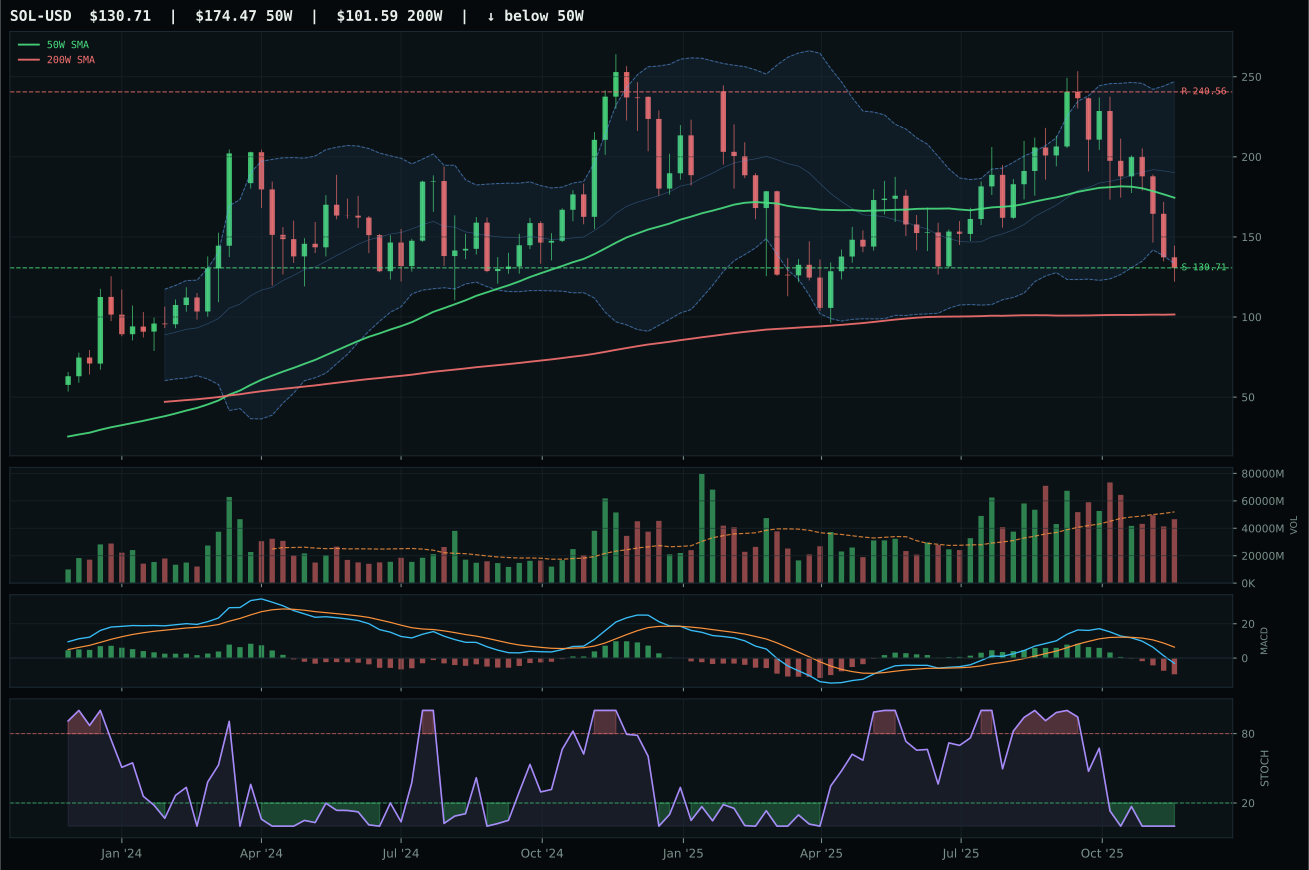
ValueBTC not armed: BTC has not made the first post-breakdown touch of the 200W buy zone after losing the 50W
TrendBTC not confirmed
one or more available conditions failed
Category Rankings
| Rank | Category | Winner | Score | Alloc | 4W Ret | Peers (4W) |
|---|---|---|---|---|---|---|
| 1 | Precious Metals | GLD | 75.5 | 20% | +8.56% | SLV +37.9% · GDX +20.9% |
| 2 | Industrial Metals | PICK | 62.1 | 20% | +12.42% | COPX +24.1% · REMX +7.4% |
| 3 | Utilities & Infrastructure | IGF | 48.2 | 10% | -1.11% | XLU -4.2% · PAVE +4.7% |
| 4 | Nuclear Energy | URNM | 42.2 | 10% | +11.54% | NLR +6.4% · URA +12.3% |
| 5 | Defense & Aerospace | ITA | 40.6 | 10% | +8.60% | ROKT +15.5% · XAR +10.7% |
| 6 | Technology | XLK | 40.4 | 10% | +6.17% | CIBR +2.3% · IGV +6.9% |
| 7 | AI | SMH | 37.6 | 10% | +10.16% | AIQ +6.5% · BOTZ +8.2% |
| 8 | Traditional Energy | XLE | 36.6 | 10% | -1.16% | XOP -2.4% · FCG -1.2% |
| 9 | Emerging Markets | ILF | 31.8 | 0% | +1.14% | INDA +0.3% · IEMG +1.2% |
| 10 | Agriculture & Livestock | MOO | 14.8 | 0% | +1.74% | VEGI -0.4% · WEAT -2.6% |
Precious Metals — GLD
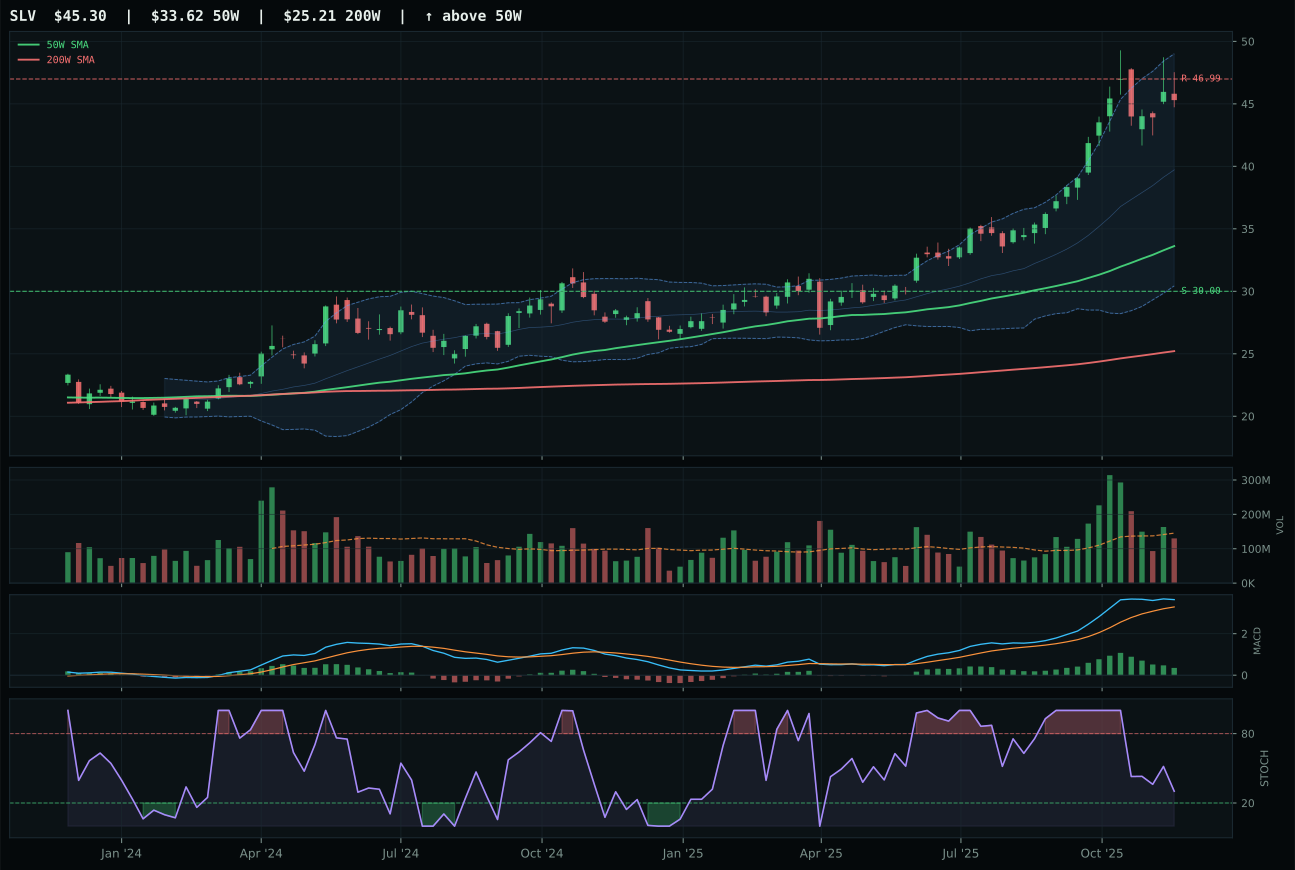
SLV has a vertical extension profile with 26.1% 13-week relative strength versus SPY.
A failed hold above support would weaken the setup.
Actionable but governed by invalidation levels.
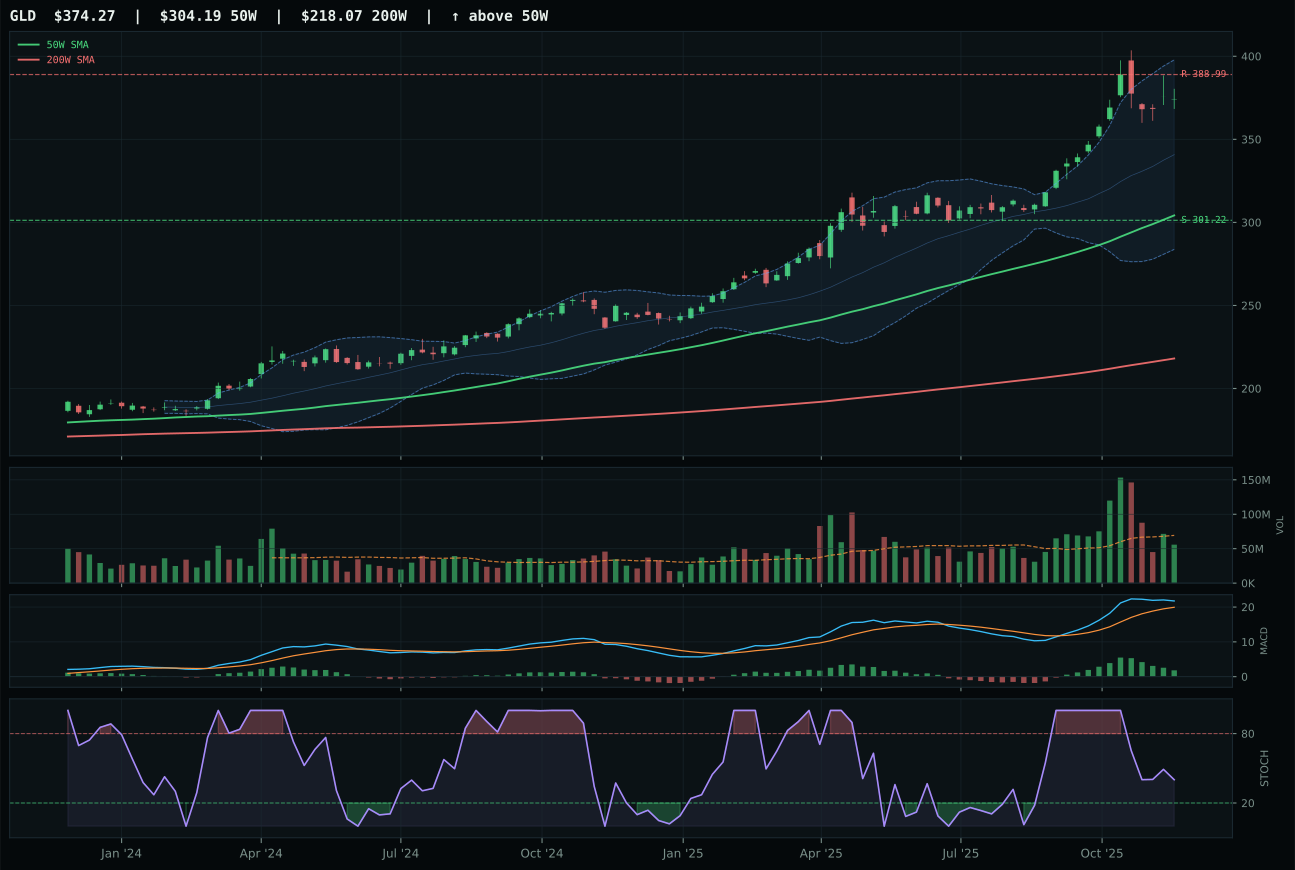
GLD has a vertical extension profile with 18.4% 13-week relative strength versus SPY.
A failed hold above support would weaken the setup.
Actionable but governed by invalidation levels.
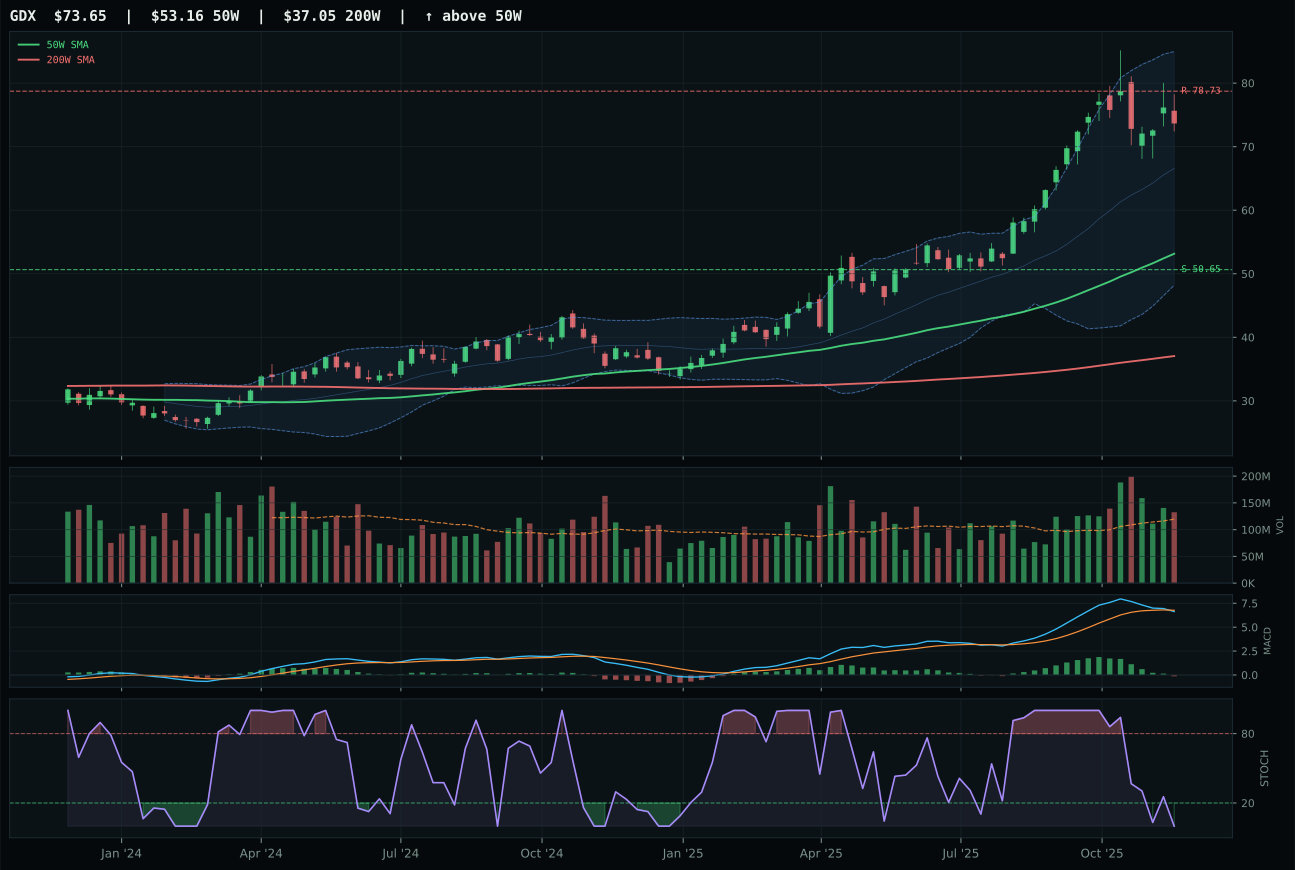
GDX has a vertical extension profile with 20.3% 13-week relative strength versus SPY.
A failed hold above support would weaken the setup.
Actionable but governed by invalidation levels.
GLD earned the top-2 allocation at 20% because it combines a perfect 100.0 trend score (price above both the 50W and 200W, 50W slope 0.9%, RS 18.4% versus SPY) with 100.0 momentum confirmation despite sitting 23.0% above the 50W in vertical extension. The win over SLV reflects superior risk/reward (47.8 vs 46.3) and cleaner structure (79.2 vs 77.0), but the real story is the 70% macro fit score driven by the active monetary hedge bid (+14 points), disinflation pressure (+8 points), and dollar pressure (+2 points)—three macro descriptors firing simultaneously to justify the extended position. Price sits at 364.46 near Fib 0.236, and while MACD is bullish but flattening, the volume-price confirmation at 70.6 and persistence at 71.1 confirm that the upside move is real institution buying, not retail chase. The -0.9% 4W return alongside the +20.5% 13W return shows this is not momentum acceleration into new highs—it's consolidation, and consolidation in an extended chart is exactly when large players defend established positions rather than chase new money.
Precious Metals ranks first overall at 75.5 and earns the 20% top-2 allocation because the macro regime is now actively signaling a flight to monetary hedges, with the monetary hedge bid descriptor driving +14 points (the highest single positive in any category). Disinflation at the macro level typically punishes real assets, but the active liquidity stress (-10 points in Technical Energy) and credit stress (-7 points in AI) suggest that equity capital is repricing risk assets downward, and gold is capturing that rotation as insurance rather than as a growth asset. The 67.5 technical evidence score for GLD is the second-highest in the portfolio (after ILF's 90.7), and the 70.0 macro fit is the highest outside of Industrial Metals, meaning this allocation is anchored in both momentum and macro conviction. At 23.0% above the 50W, entry timing is objectively poor, but the category's 75.5 score reflects that the macro regime has shifted hard enough to justify paying full price—this is not a value call, it's a structural hedge allocation that will feel expensive until the next market correction validates the insurance purchase.
Industrial Metals — PICK
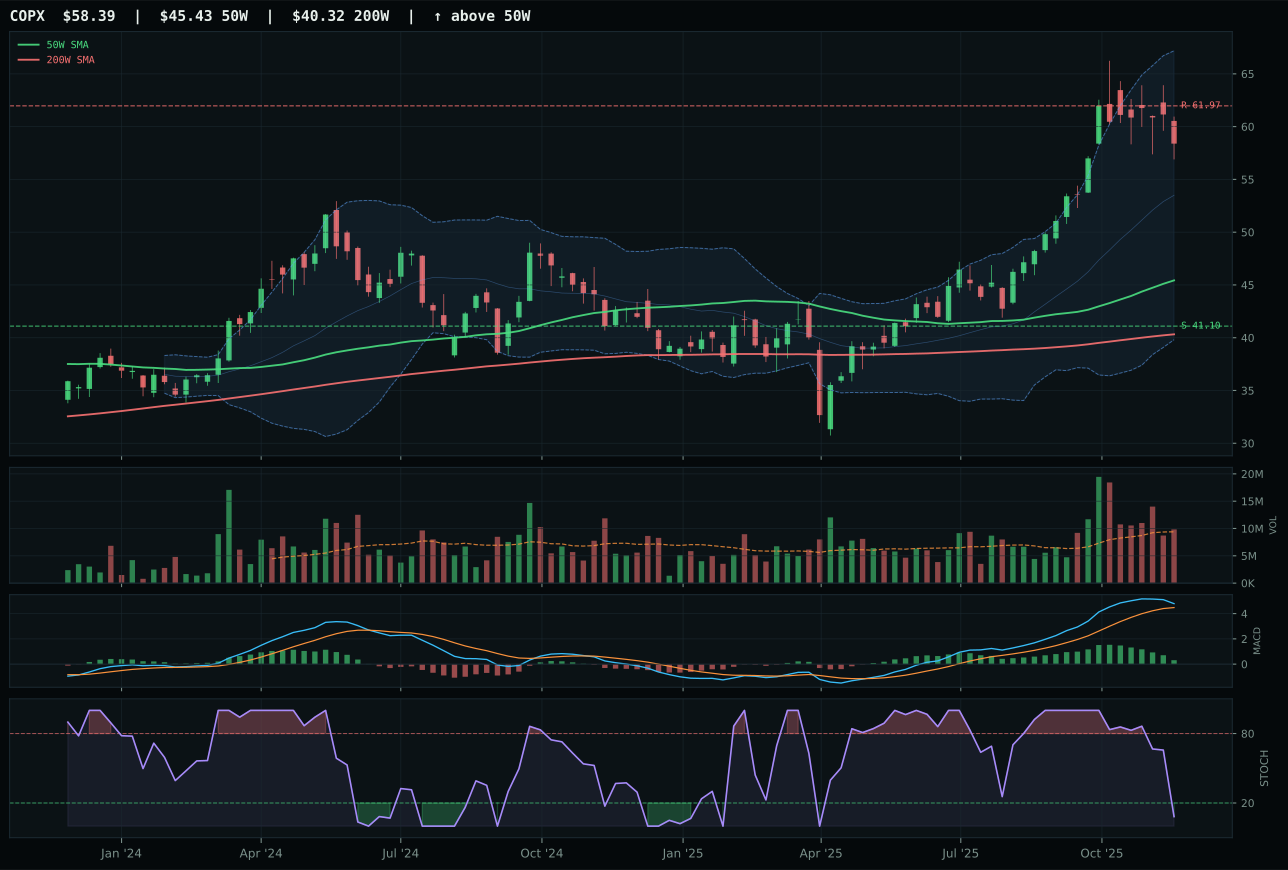
COPX has a vertical extension profile with 19.0% 13-week relative strength versus SPY.
A failed hold above support would weaken the setup.
Actionable but governed by invalidation levels.
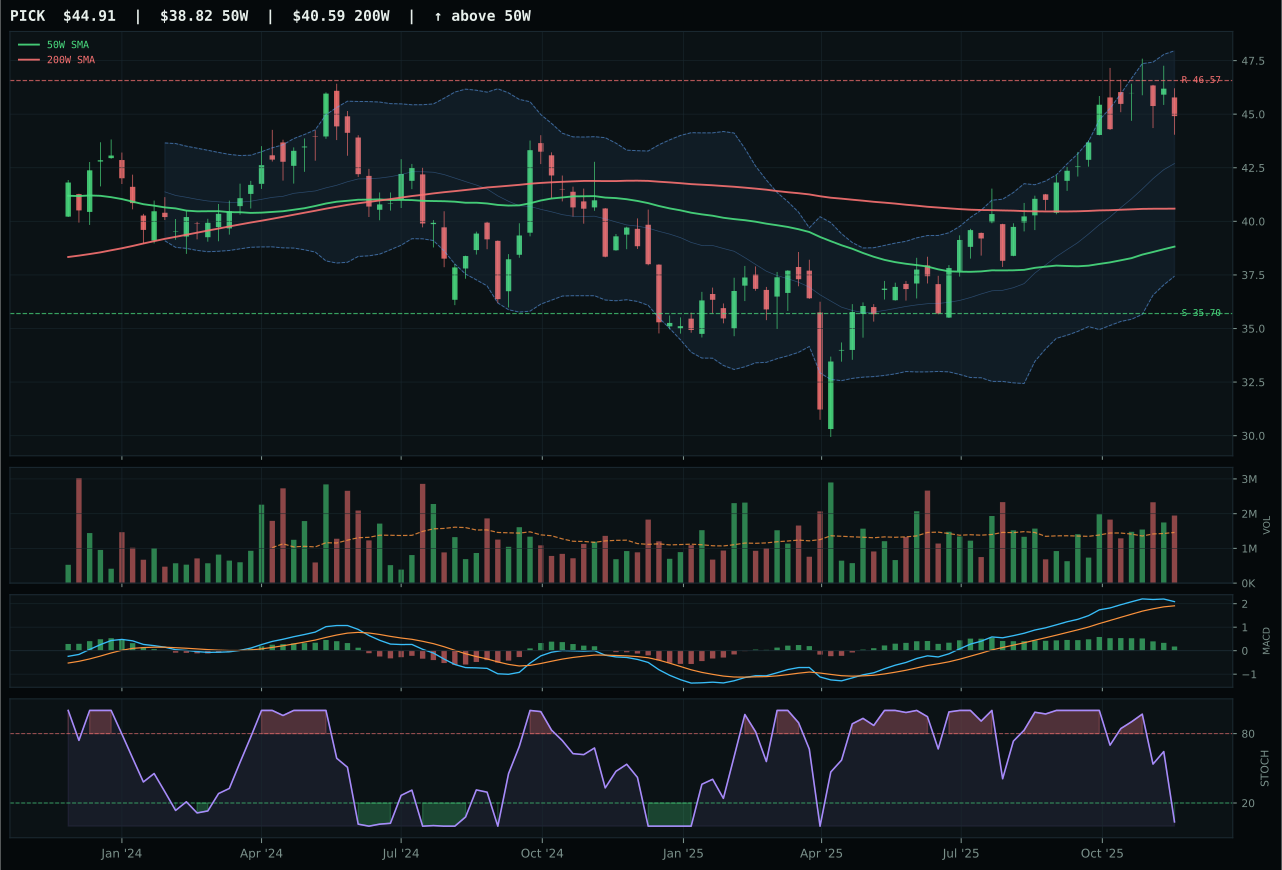
PICK has a vertical extension profile with 7.3% 13-week relative strength versus SPY.
A failed hold above support would weaken the setup.
Actionable but governed by invalidation levels.
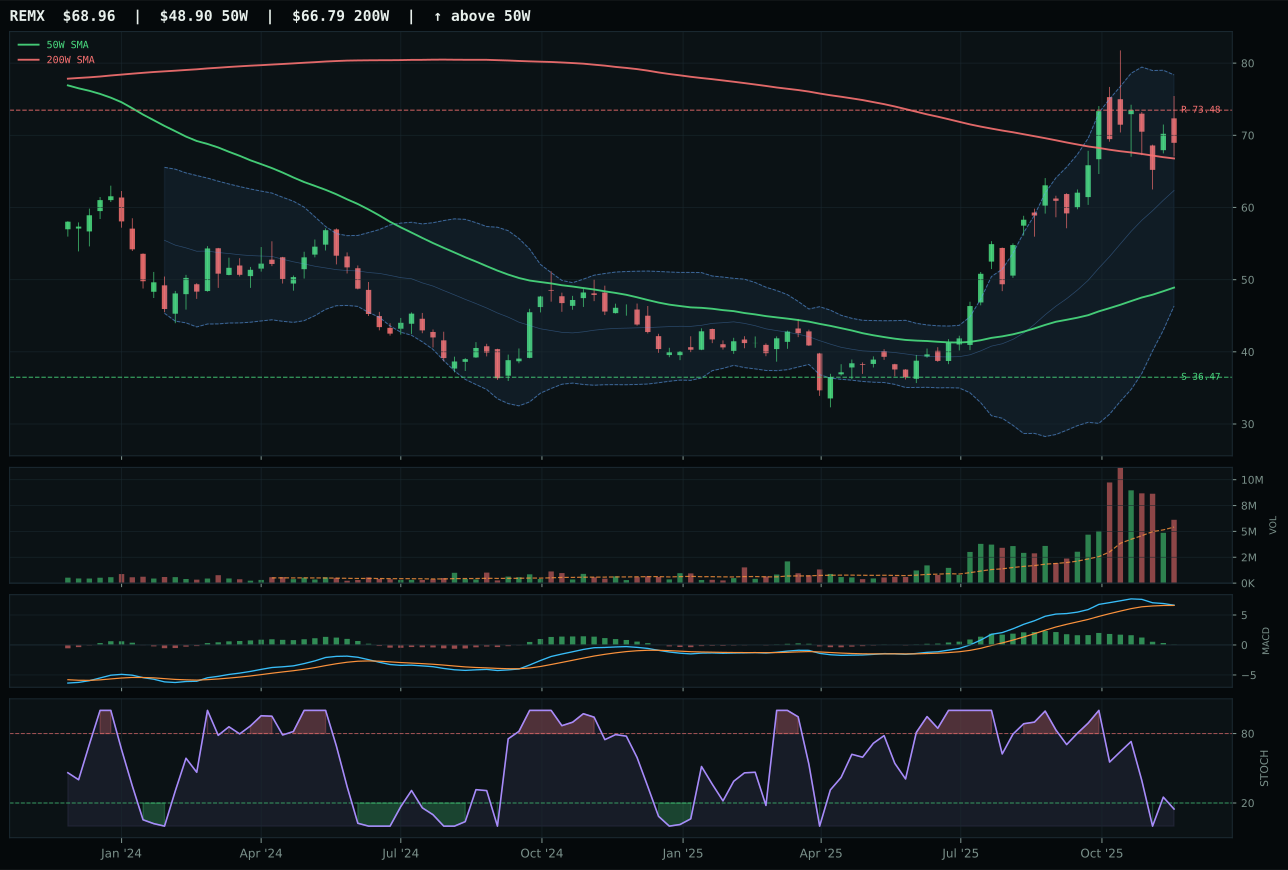
REMX has a vertical extension profile with 15.0% 13-week relative strength versus SPY.
A failed hold above support would weaken the setup.
Actionable but governed by invalidation levels.
PICK clinches the Industrial Metals top-2 at 62.1 by combining perfect 100.0 trend (price above both moving averages, 50W slope 0.3%, RS 7.3% vs SPY) with superior structure (81.9 vs COPX's 74.1) and decisive volume-price confirmation—above-average participation at 1.33x the 20W average while COPX sits neutral. The structural cleanliness of 75.0 and compression of 80.7 translate to a vertical extension that is tight and controlled rather than volatile and extended; at 15.7% above the 50W, PICK is extended but not as extreme as COPX's 28.5%, giving PICK better positioning for future extension if the commodity breadth thesis survives. Category-relative strength of -7.7% versus the category median (versus COPX's +4.0%) might seem like a weakness, but it reflects PICK's broader diversification across zinc, lead, nickel, and cobalt rather than the copper scarcity bet that's concentrated in COPX; the -7.7% penalty is a diversification discount, not a technical failure. Persistence at 68.7 and volume-price confirmation at 51.7 prove that the vertical extension is being accumulated into, with institutional follow-through rather than retail chase.
Industrial Metals ranks second overall at 62.1 and earns the 20% top-2 allocation alongside GLD because the metals scarcity descriptor is firing at +14 points (matching AI growth sponsorship's power) and commodity breadth positive adds another +10—a combined +24-point macro headwind that is not a headwind in this regime, it's a feature. The 64.5 technical evidence score is the second-highest in the category basket (after PICK at 64.5 itself), and the 58.0 macro fit reflects that both the tech transition (AI capex into semiconductor manufacturing, EV capex into lithium supply chains) and the real asset sponsorship descriptors are actively driving allocations into this space. Unlike GLD, which is a defensive monetary hedge, PICK is an offensive real asset play that benefits from positive risk appetite and capex cycles; if disinflation continues to push nominal yields lower and credit spreads widen, PICK's 25.8% downside to support at 35.70 is asymmetric against the 3.6% upside room to resistance at 46.57, making this a momentum ride dependent on continued commodity sponsorship. Hold it at 20% because the macro regime is favorable and the technical setup is clean, but recognize that this is the first allocation to cut if the risk appetite descriptor rolls over.
Utilities & Infrastructure — IGF
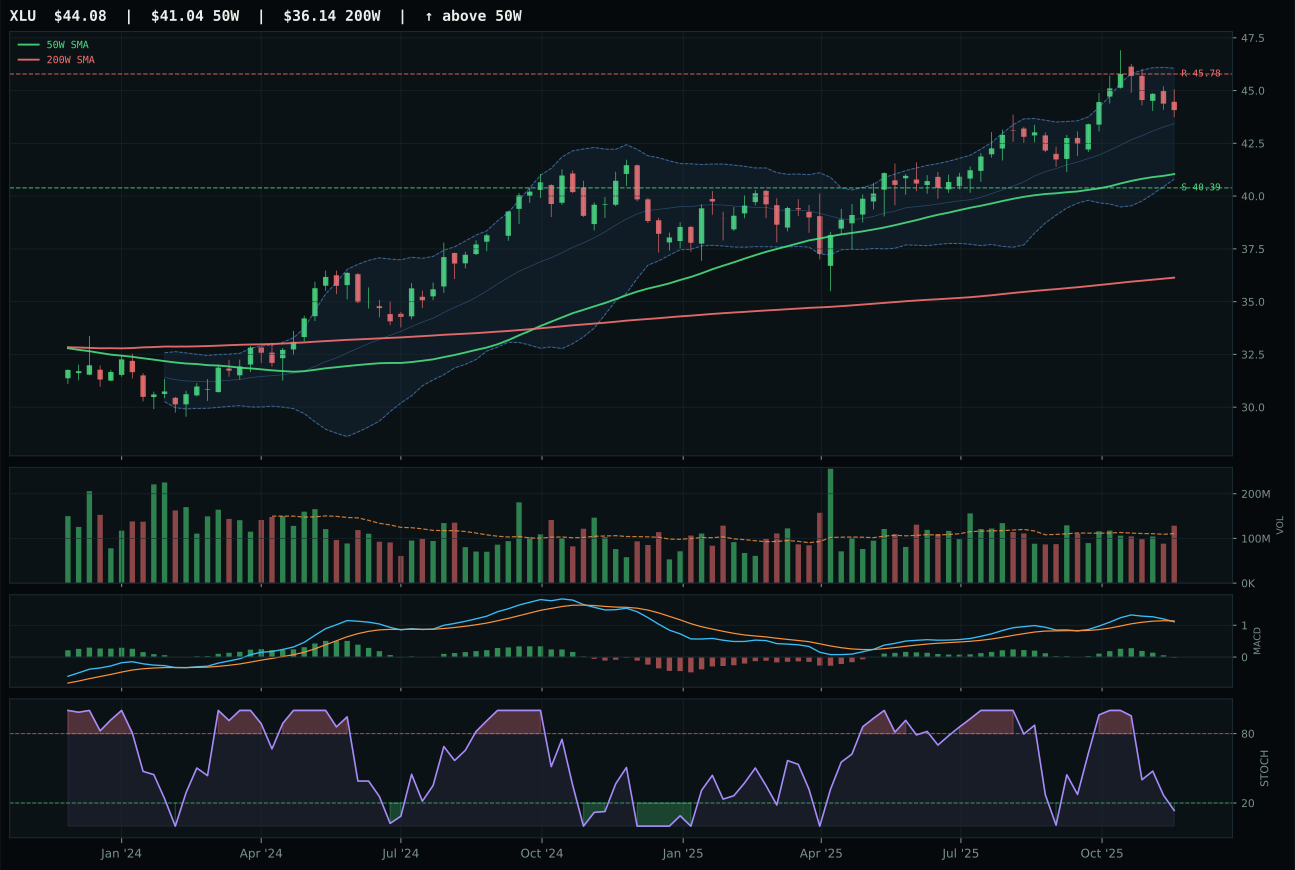
XLU has a neutral structure profile with 0.3% 13-week relative strength versus SPY.
A failed hold above support would weaken the setup.
Actionable but governed by invalidation levels.
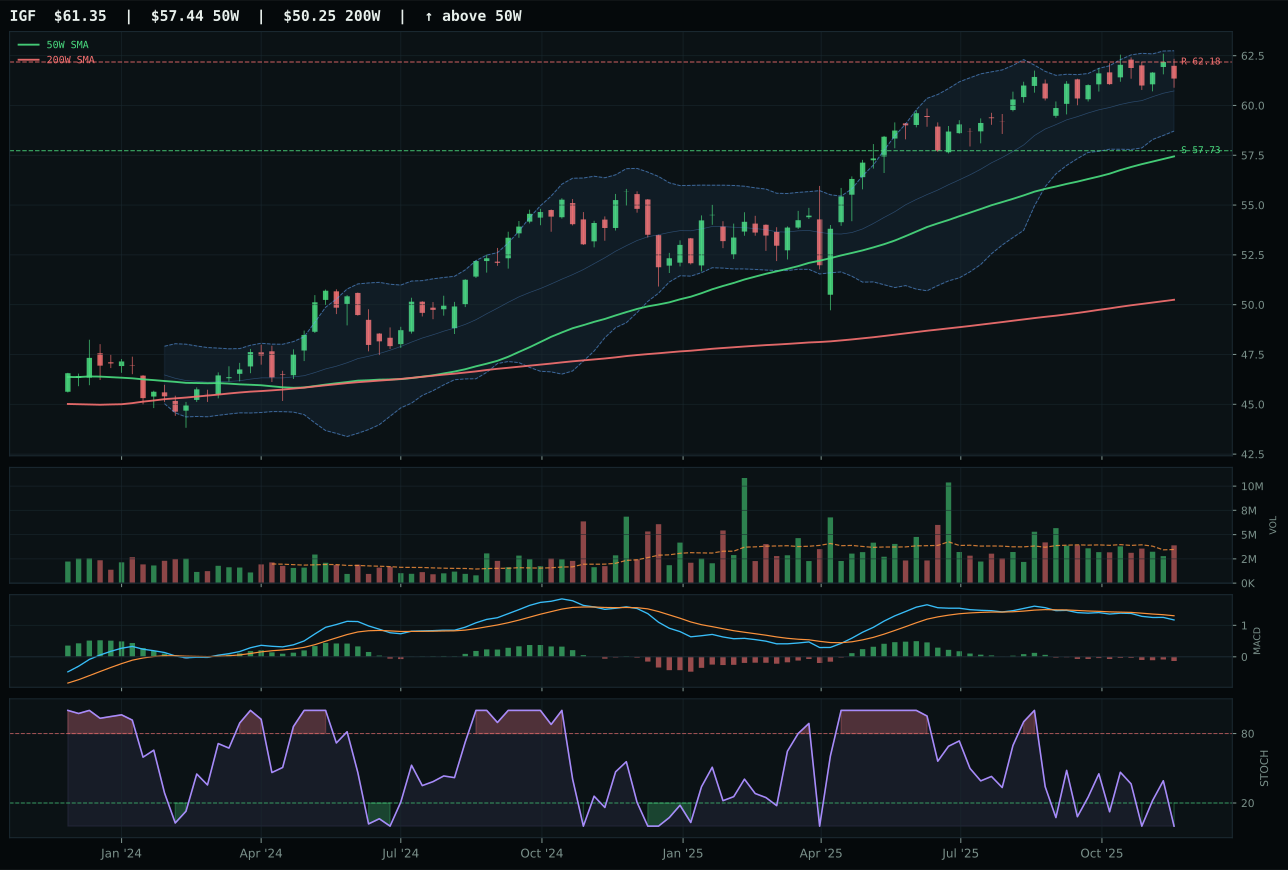
IGF has a neutral structure profile with -2.3% 13-week relative strength versus SPY.
A failed hold above support would weaken the setup.
Actionable but governed by invalidation levels.
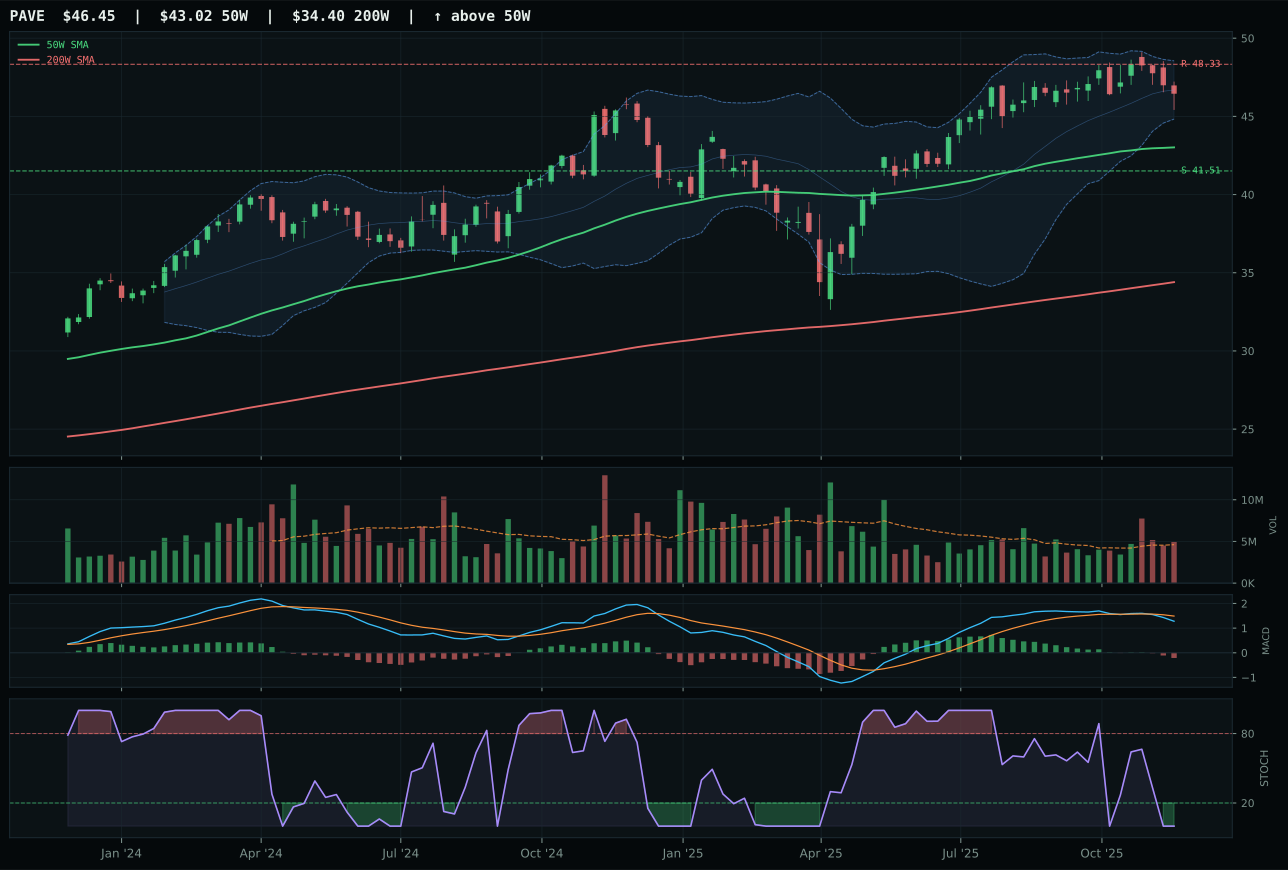
PAVE has a neutral structure profile with -3.0% 13-week relative strength versus SPY.
A failed hold above support would weaken the setup.
Actionable but governed by invalidation levels.
IGF edges XLU in Utilities & Infrastructure despite XLU's higher technical evidence score because IGF's structure at 76.6 (versus XLU's 75.5) and risk/reward profile align better with the category's disinflation tailwind (+7 points at the category level). Price sits 6.8% above the 50W in neutral compression with a near 52W high extension, and while momentum confirmation at 34.5 is weak, this actually reflects stability rather than weakness—the position is quiet rather than extended, and quietness is exactly what a defensive allocation should offer. IGF's -2.3% RS versus SPY is weaker than XLU's 0.3%, but both are essentially flat to the broad market; the category win is decided by structure cleanliness and the Fib zone location near the 52W high, which suggests that this chart is consolidating after a run and is now in a decision zone. Volume at 1.12x the 20W shows above-average participation without the distribution pressure that would signal weakness, a balanced technical picture that matches the disinflation regime where income assets benefit but growth is capped.
Utilities & Infrastructure scores 48.2 and earns a 10% allocation because the category's 66.0 macro fit is the third-highest in the portfolio (after Precious Metals at 77.0 and Industrial Metals at 58.0), driven by +7 for disinflation help and +6 for disinflation pressure active, supplemented by +4 for Transition/Mixed regime and +4 for broad market bear. This is a classic disinflation hedge—when real yields decline and growth slows, regulated utilities with stable cash flows and inflation-protected revenue become relative outperformers. IGF's global infrastructure income diversification and above-average participation volume provide ballast without the single-sector risk of XLU's pure utility exposure. At -0.1% 13W return and -2.3% RS versus SPY, this allocation is genuinely not participating in the current rally, but that's the point: the 10% slot is meant to anchor the portfolio against volatility, not to chase upside. If the risk appetite descriptor rolls over from positive to neutral, expect IGF and XLU to outperform as capital rotates into defensive yield; if risk appetite stays positive, this allocation will lag—hold it because the macro regime supports it, not because the technical evidence is compelling.
Nuclear Energy — URNM
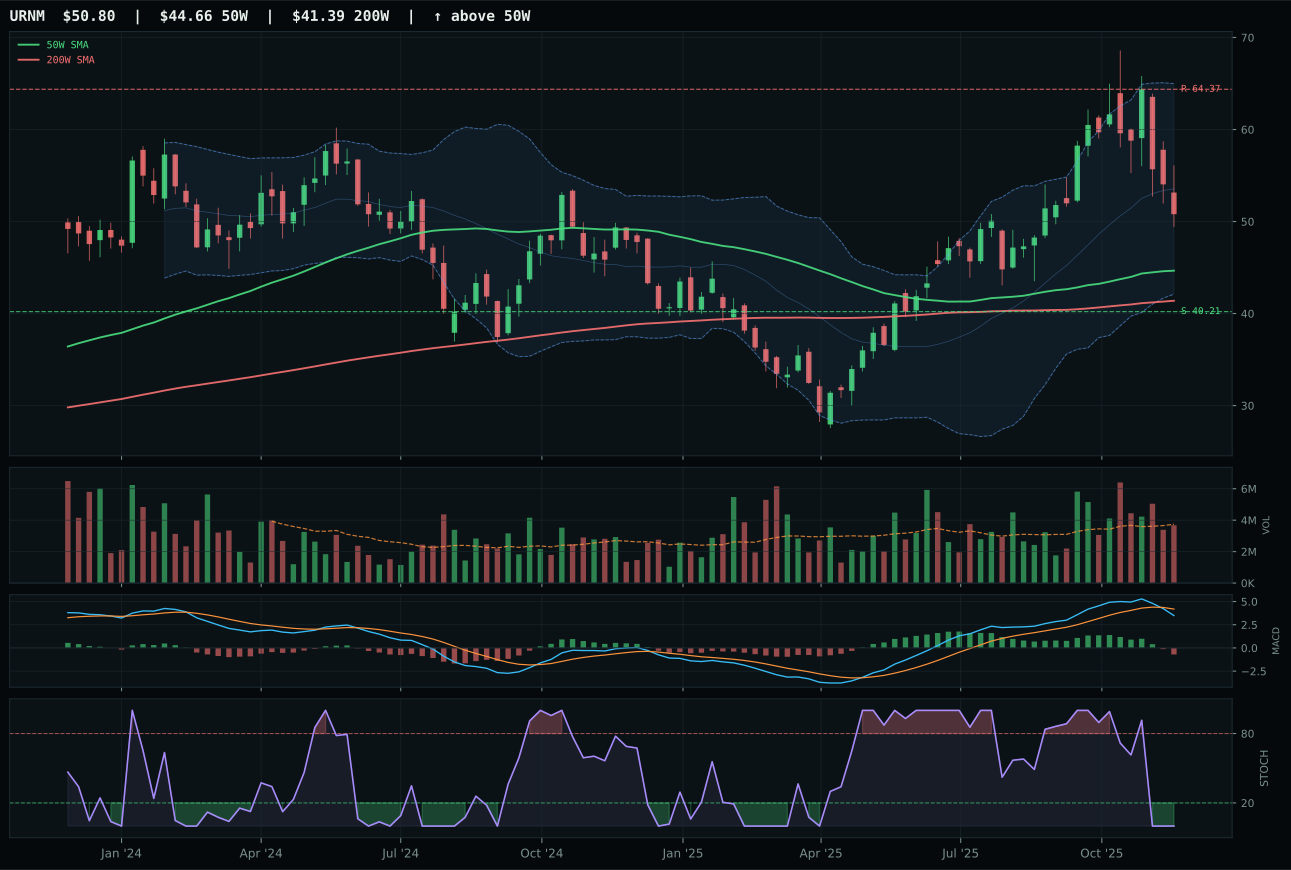
URNM has a neutral structure profile with 3.1% 13-week relative strength versus SPY.
A failed hold above support would weaken the setup.
Actionable but governed by invalidation levels.
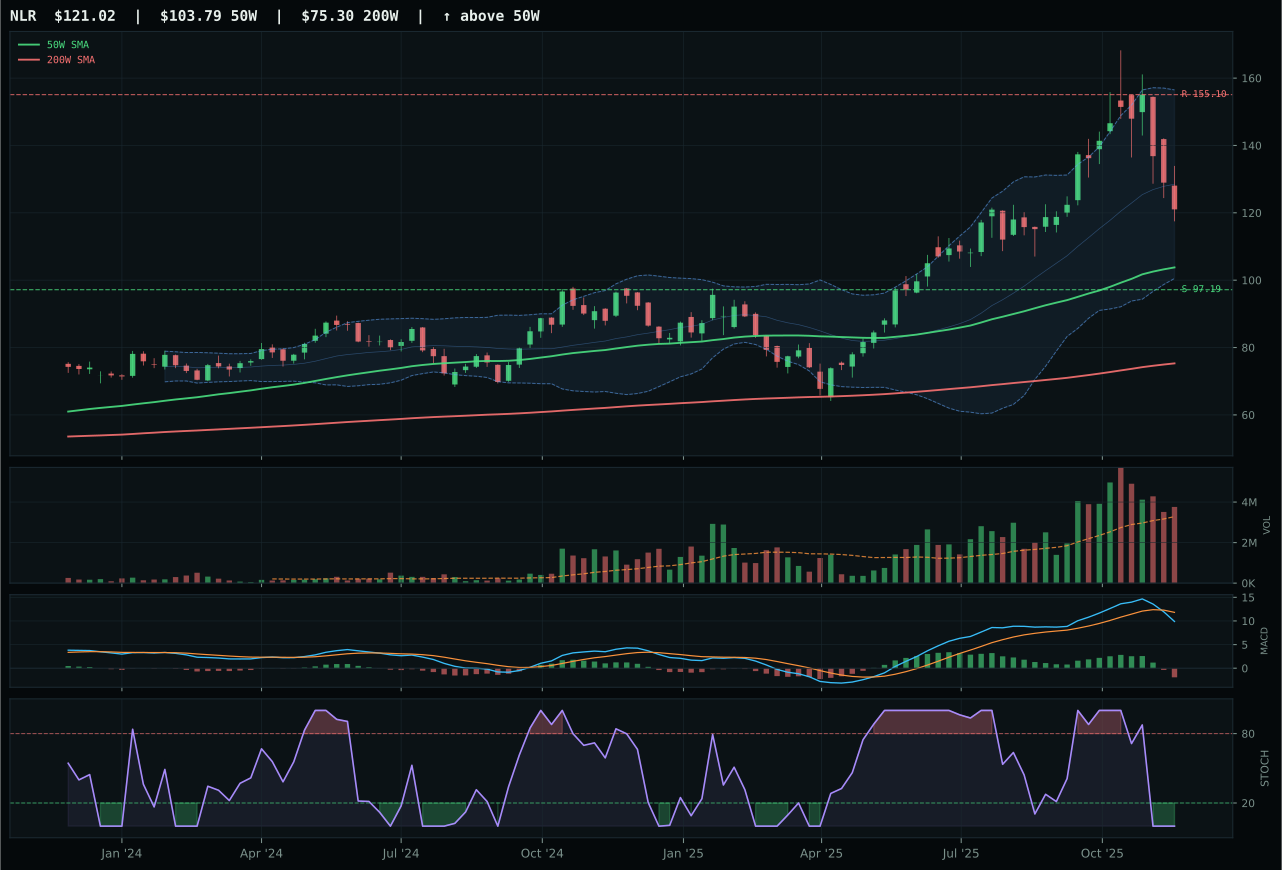
NLR has a vertical extension profile with 3.0% 13-week relative strength versus SPY.
A failed hold above support would weaken the setup.
Actionable but governed by invalidation levels.
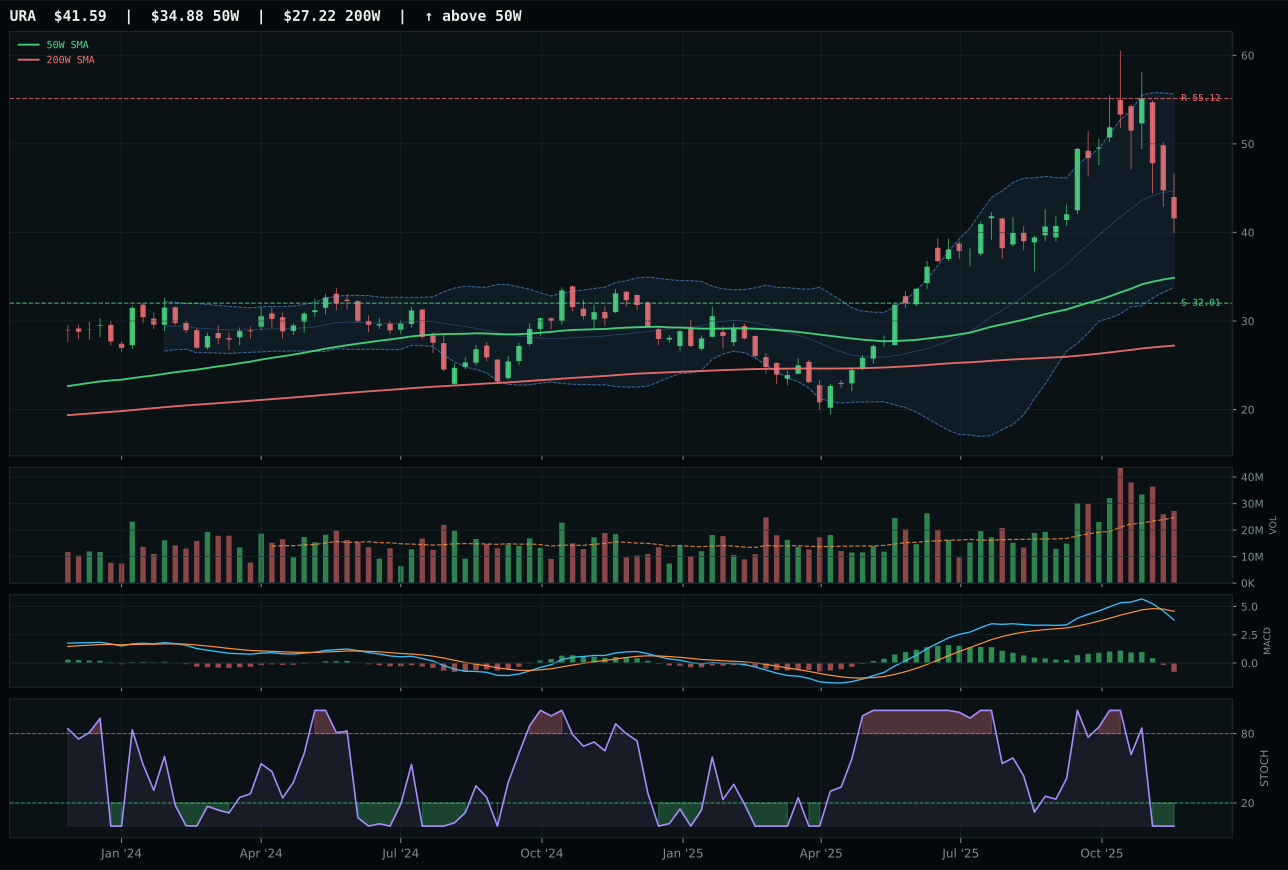
URA has a vertical extension profile with 3.3% 13-week relative strength versus SPY.
A failed hold above support would weaken the setup.
Actionable but governed by invalidation levels.
URNM wins the nuclear category with a 77.0 timing score that reflects price sitting 13.7% above the 50W in a neutral structure with oversold stochastic RSI and bearish/weakening MACD—a mean-reversion setup that beats NLR's 55.0 timing despite NLR's vertical extension. URNM's structure at 62.8 is lower than NLR's, but structure cleanliness and compression matter less when the stochastic RSI is at 0.00 oversold and turning up; the technical oscillators are calling for a bounce, not a continuation, and URNM's neutral setup gives that bounce room to develop. Category-relative strength at 0.0% is a tiebreaker advantage over NLR's -0.2%, and the +13.7% 4W drawdown into the entry point created better risk/reward than NLR's more extended position. Volume is neutral at 0.98x the 20W, which counts against explosive upside, but it also means that when the bounce comes, it won't be chased by retail—it will be accumulated by patient hands defending support at 40.21.
Nuclear Energy scores 42.2 and earns a 10% allocation despite ranking seventh because the real asset sponsorship descriptor (+7) and AI growth sponsorship (+5) are both live, reflecting that uranium is being bid as both a commodity hedge and as an energy solution for AI capex. URNM's 33.8 technical evidence score is weak, and the category's 50.0 macro fit reflects that there's no structural tailwind beyond the real asset sponsorship; this is a tactical trade on an oversold bounce, not a structural conviction. The -13.6% 4W return compressed into the entry point creates a defined-risk trade where support at 40.21 sits 26.3% below—it's a wide drawdown, but it's also behind us, meaning the worst-case scenario has already happened and URNM is trying to bounce. Rank this lower than Technology (40.4) and Defense (40.6) because the macro fit is weaker and the technical evidence is lower, but hold it because the momentum confirmation at 21.6% should improve if the oversold bounce gains traction. This is a position meant to scale back if the bounce fails to clear resistance at 64.37, and to scale forward if real asset sponsorship accelerates in the next 2-3 weeks.
Defense & Aerospace — ITA
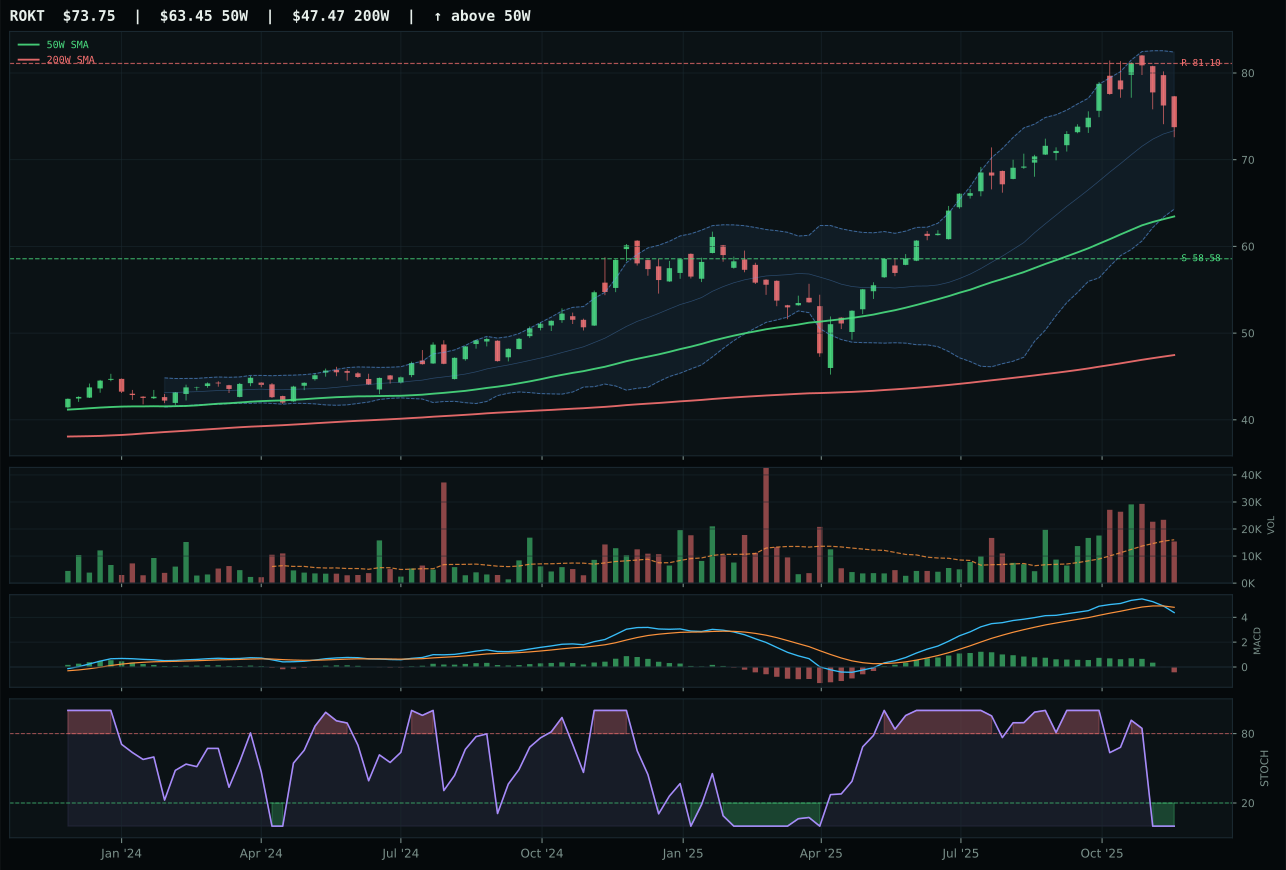
ROKT has a vertical extension profile with 2.7% 13-week relative strength versus SPY.
A failed hold above support would weaken the setup.
Tracked, but not top-2 eligible because: .
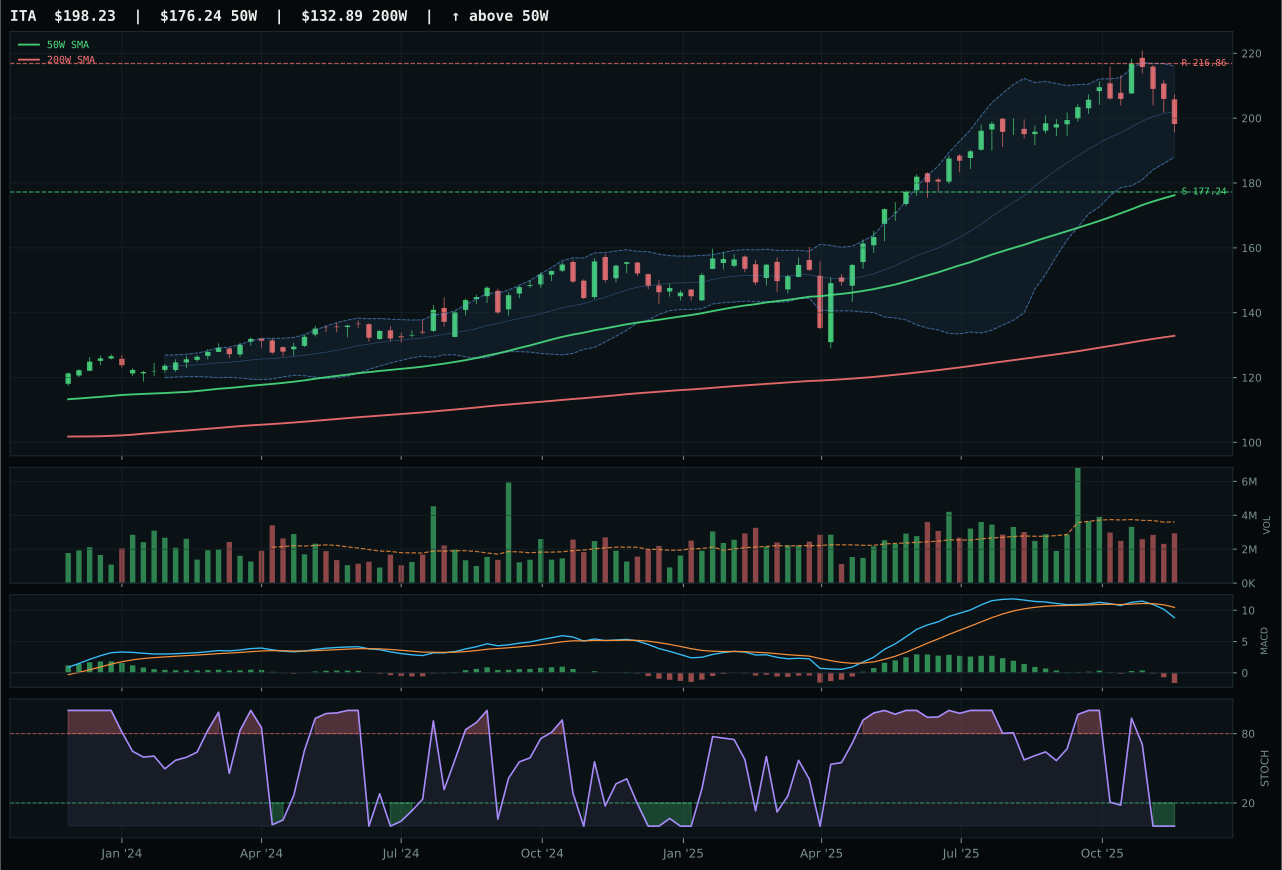
ITA has a neutral structure profile with -0.9% 13-week relative strength versus SPY.
A failed hold above support would weaken the setup.
Actionable but governed by invalidation levels.
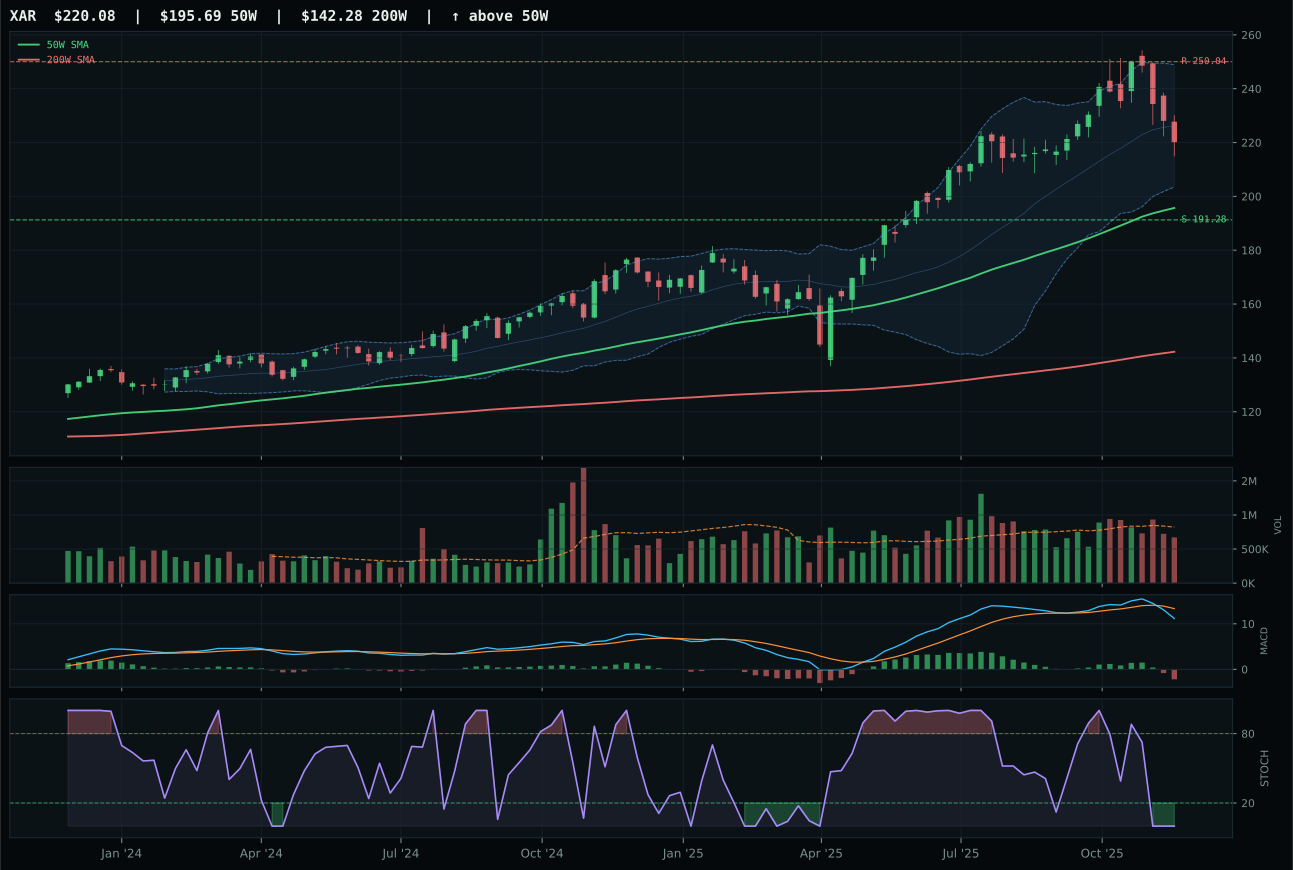
XAR has a neutral structure profile with -0.3% 13-week relative strength versus SPY.
A failed hold above support would weaken the setup.
Actionable but governed by invalidation levels.
ITA defeats a crowded field by trading neutral structure with a dominant 27.2-point gap over ROKT, the runner-up, a gap that reflects ITA's superior risk/reward (58.1 vs 51.3) and timing score (70.0 vs 48.0)—both critical in a chart where price is pulling back into the upper retracement zone rather than extending. Defense primes like ITA benefit from the exact opposite macro regime that hurts growth: the active broad market bear descriptor (+6 points) and dollar pressure (+3 points) actually provide a relative-value halo, positioning integrated defense contractors as havens when credit stress rises. At only 0.9% from SPY on a 13W basis, ITA is a quiet accumulation rather than a chase, with volume at neutral 0.81x the 20W average and support sitting 11.8% below—a setup that rewards patience over aggression. ROKT's vertical extension at 4.8% 13W return looks stronger on the surface, but it's stretched 22.5% from support at 58.58 into resistance at 81.10, and timing at 48.0 reflects that extended position where risk/reward has already turned negative.
Defense & Aerospace scores 40.6 and earns its 10% allocation as a defensive hedge inside a disinflation regime where equities are repricing on duration risk and flight-to-quality flows favor boring stability over growth beta. The category's 60.0 macro fit is the highest outside of the top-2 picks (Precious Metals and Industrial Metals), benefiting from +6 for broad market bear, +3 for dollar pressure, and +3 for the Transition/Mixed regime signal—all tailwinds for defensive sectors. ITA's 80.7 trend score and neutral structure at 12.5% above the 50W provide ballast without the extension risk that would penalize entry timing; the 19.3 momentum confirmation is weak, but that's actually the point—this is a position meant to survive volatility, not capture extension moves. Rank it lower than the commodity plays (GLD, PICK) because disinflation is a longer-term tailwind for metals scarcity while defense is a shorter-term tactical hedge, but hold it because the macro regime is signaling stress and ITA's risk/reward makes sense at current levels.
Technology — XLK
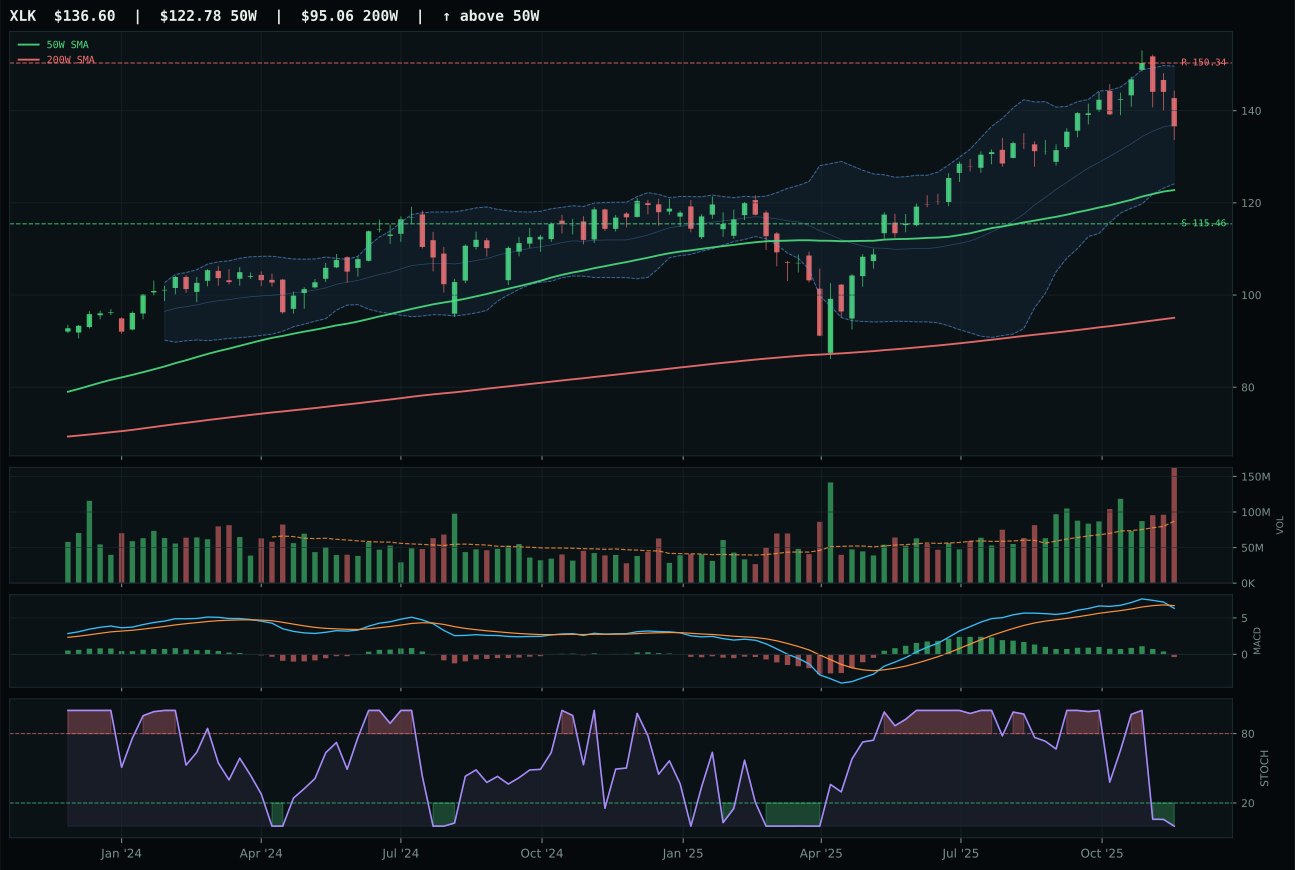
XLK has a neutral structure profile with 2.0% 13-week relative strength versus SPY.
A failed hold above support would weaken the setup.
Actionable but governed by invalidation levels.
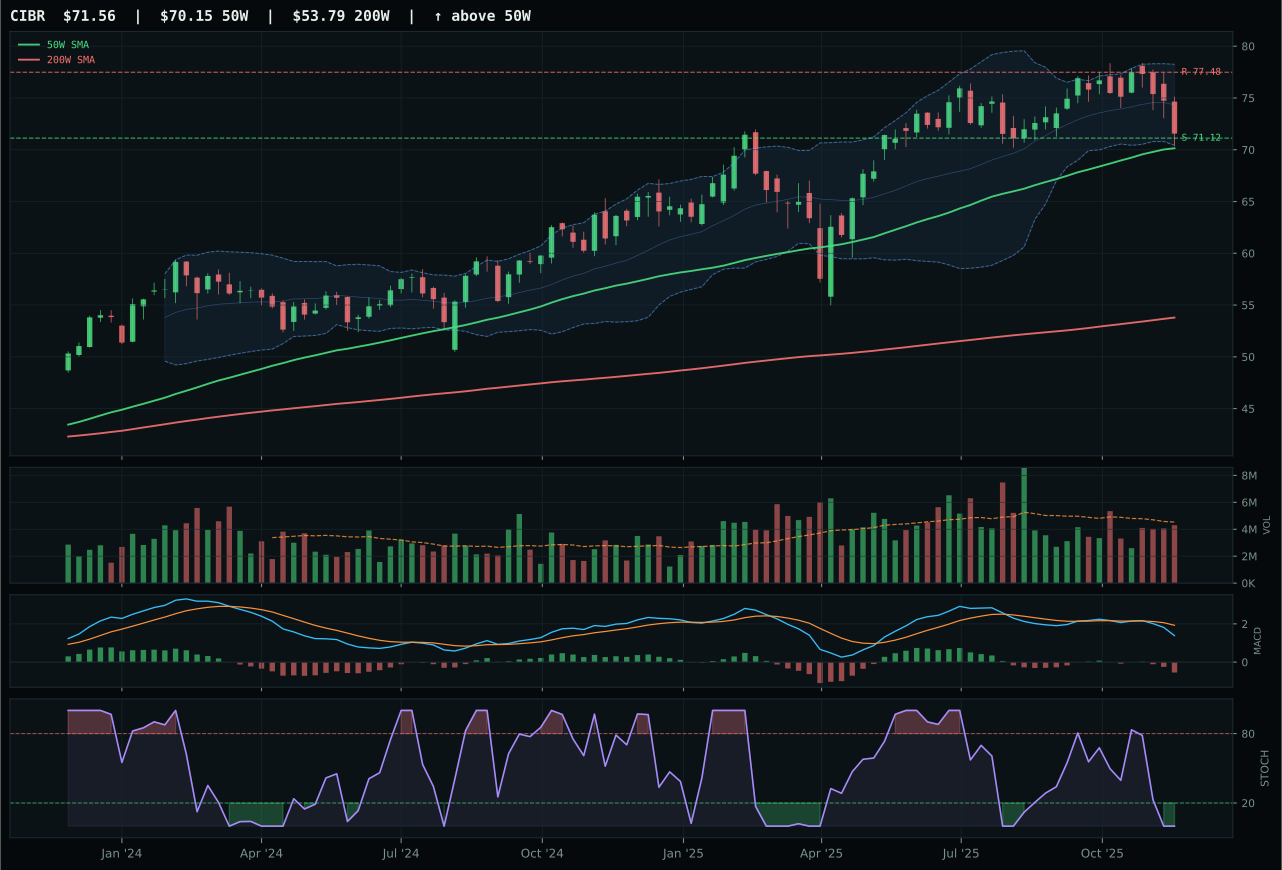
CIBR has a pullback into support profile with -3.5% 13-week relative strength versus SPY.
A failed hold above support would weaken the setup.
Actionable but governed by invalidation levels.
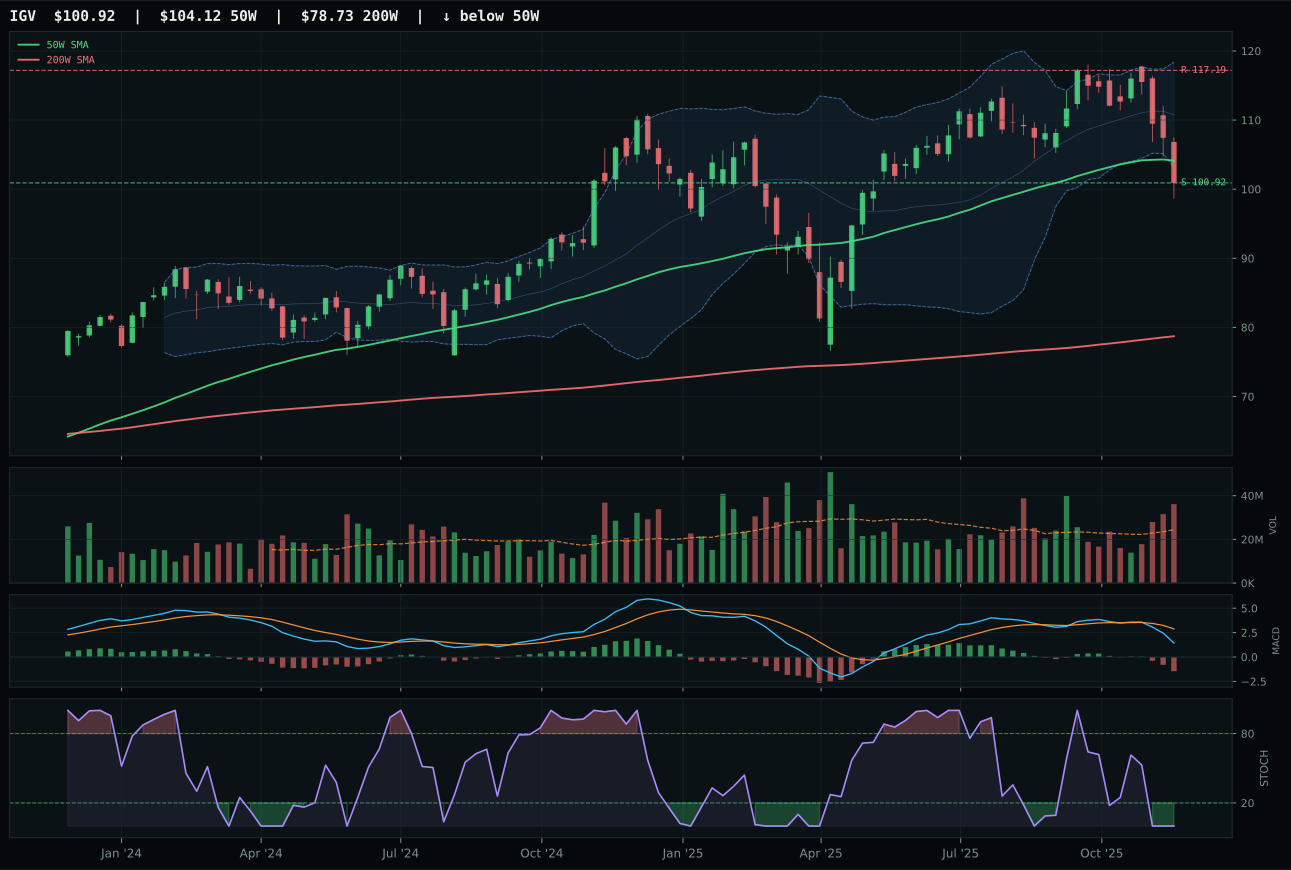
IGV has a pullback into support profile with -8.2% 13-week relative strength versus SPY.
A failed hold above support would weaken the setup.
Actionable but governed by invalidation levels.
XLK claimed the category by demonstrating the strongest category-relative strength at 5.5% versus SPY's 2.0%, positioning it as the only technology vehicle capturing domestic institutional sponsorship inside its own basket. CIBR stumbled on both structure cleanliness (69.1 vs 70.9) and relative performance, posting -3.5% RS versus SPY while XLK stayed positive, a technical divergence that matters when risk appetite is active but liquidity stress is eroding conviction. The chart setup is neutral compression with price holding above both major moving averages—not a breakout, but a defended level where support at 115.46 sits 18.3% below current levels and resistance at 150.34 sits 9.1% above, creating asymmetry that favors patient holders over fresh buyers. Volume distribution pressure at 2.19x the 20W average signals institutional distribution into strength rather than accumulation, and MACD's bearish/weakening condition confirms momentum is fading even as price holds—a technical warning that this strength is borrowed rather than structural.
Technology ranks fifth overall at 40.4 and merits a 10% slot despite macro headwinds because technical leadership is real and the setup avoids the catastrophic timing risk of extended leaders. The 62/38 technical-to-macro weighting favors XLK's 85-point trend score and 70-point timing score, which together argue for stability even though the category's 55.0 macro fit is dragged down by -10 points from active liquidity stress. Disinflation does help this exposure (+7 basis points), and AI growth sponsorship adds another +6, but those tailwinds are modest against the structural headwind of credit stress weighing the category. This allocation represents a tactical hedge on duration risk—technology has repriced significantly lower if real rates stay elevated, and the compressed entry point (11.3% above the 50W) offers better risk-reward than the extended leaders elsewhere in the portfolio.
AI — SMH
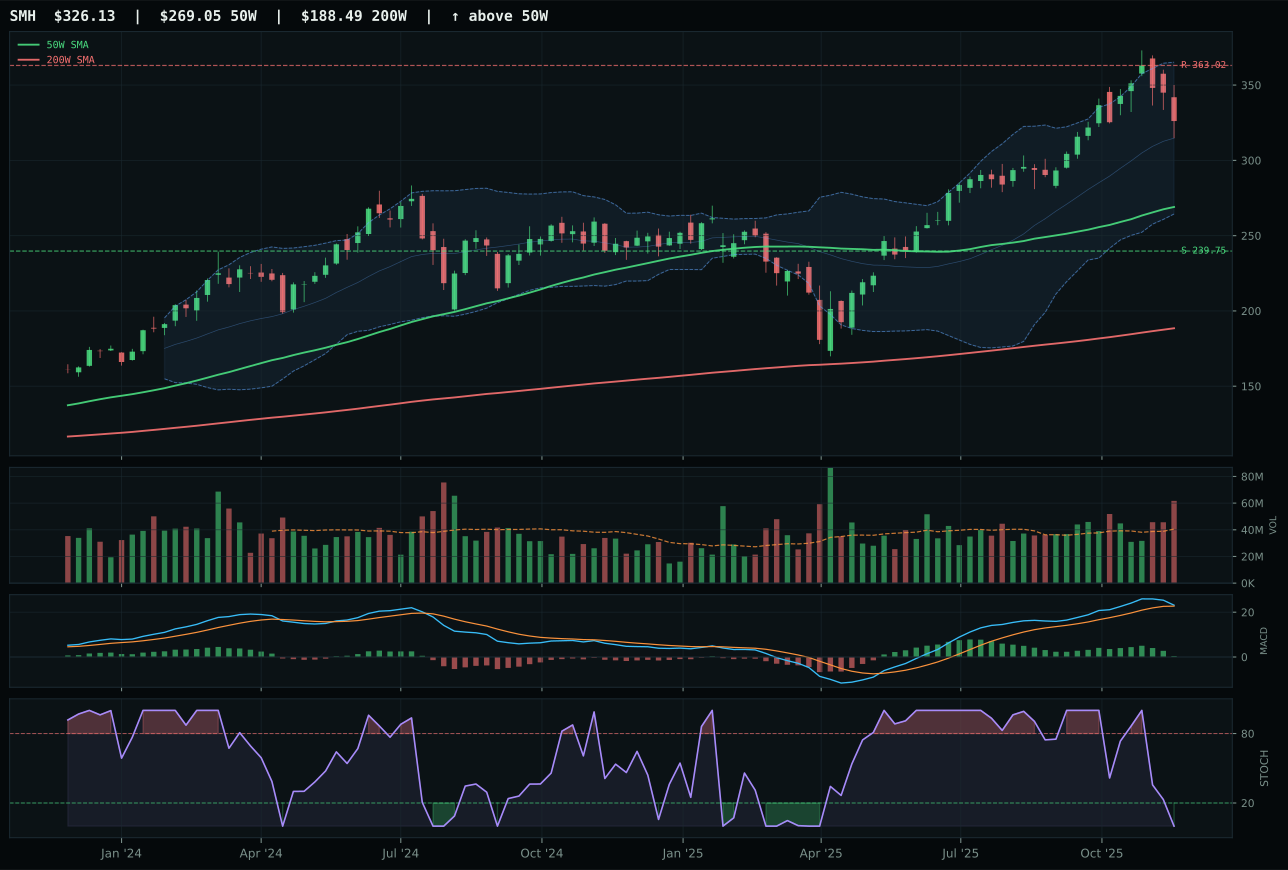
SMH has a vertical extension profile with 8.9% 13-week relative strength versus SPY.
A failed hold above support would weaken the setup.
Actionable but governed by invalidation levels.
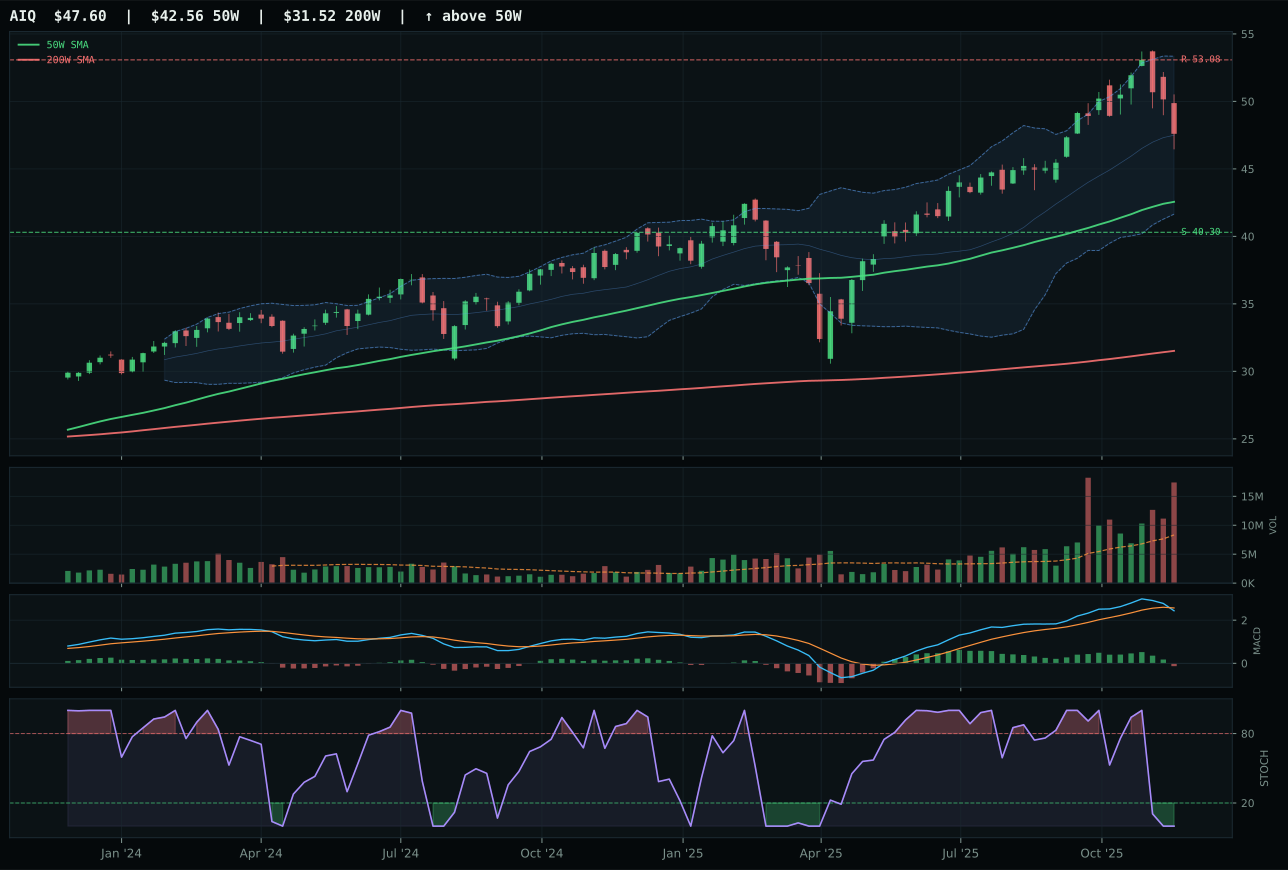
AIQ has a neutral structure profile with 3.8% 13-week relative strength versus SPY.
A failed hold above support would weaken the setup.
Actionable but governed by invalidation levels.
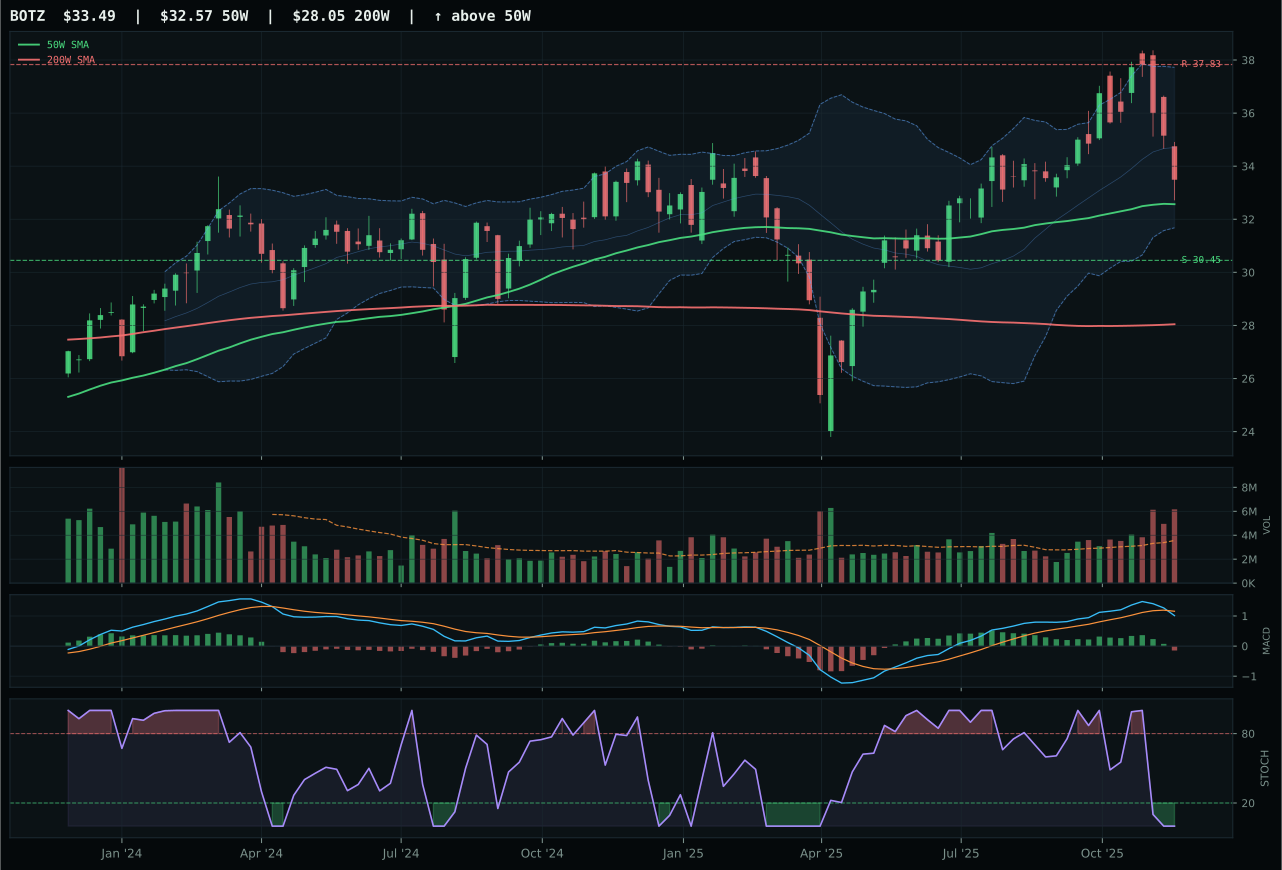
BOTZ has a compression near 50W profile with -3.1% 13-week relative strength versus SPY.
A failed hold above support would weaken the setup.
Actionable but governed by invalidation levels.
SMH wins the AI category with a cleaner structure (71.5 vs 70.5 on AIQ) and decisively superior MACD confirmation—bullish but flattening versus AIQ's bearish/weakening—a one-point divergence that translates to real momentum sponsorship despite both sitting oversold on stochastic RSI. The 13W return of 11.1% and SPY-relative strength of 8.9% dominate the category-median comparison at +5.1%, meaning every buyer is bidding on compute and semiconductor muscle, not the broader software story that AIQ represents. Price sits 21.2% above the 50W in vertical extension, putting SMH in the risk zone where new entrants are chasing late momentum, yet the bullish MACD slope and 37.4% 26W return justify holding the position for momentum persistence—the category's +14 points for active AI growth sponsorship don't come from financial engineering, they come from real capex allocation into training infrastructure. Persistence at 49.5 and volume-price confirmation at 47.7 confirm that this vertical extension has institutional follow-through, not just short-covering noise.
AI scores 37.6 and takes a 10% allocation despite ranking fourth because SMH's technical evidence (33.0/100) and the macro regime's +14-point AI growth sponsorship create a high-conviction short-term trade even if the category lacks structural rank. The setup depends entirely on momentum persistence—if MACD rolls over, SMH's 21.2% extension from the 50W becomes a liability, not an asset, putting downside support 36% away at 239.75. However, the current regime is disinflation with active risk appetite and AI sponsorship, and SMH's 8.9% RS versus SPY proves capital is flowing into this name faster than into the broader market; holding a 10% weight is a statement that the momentum is real enough to carry through the next four to eight weeks, but not so structural that we'd overweight into price acceleration. This is a momentum ride, not a structural conviction, and the 10% sizing reflects that constraint.
Traditional Energy — XLE
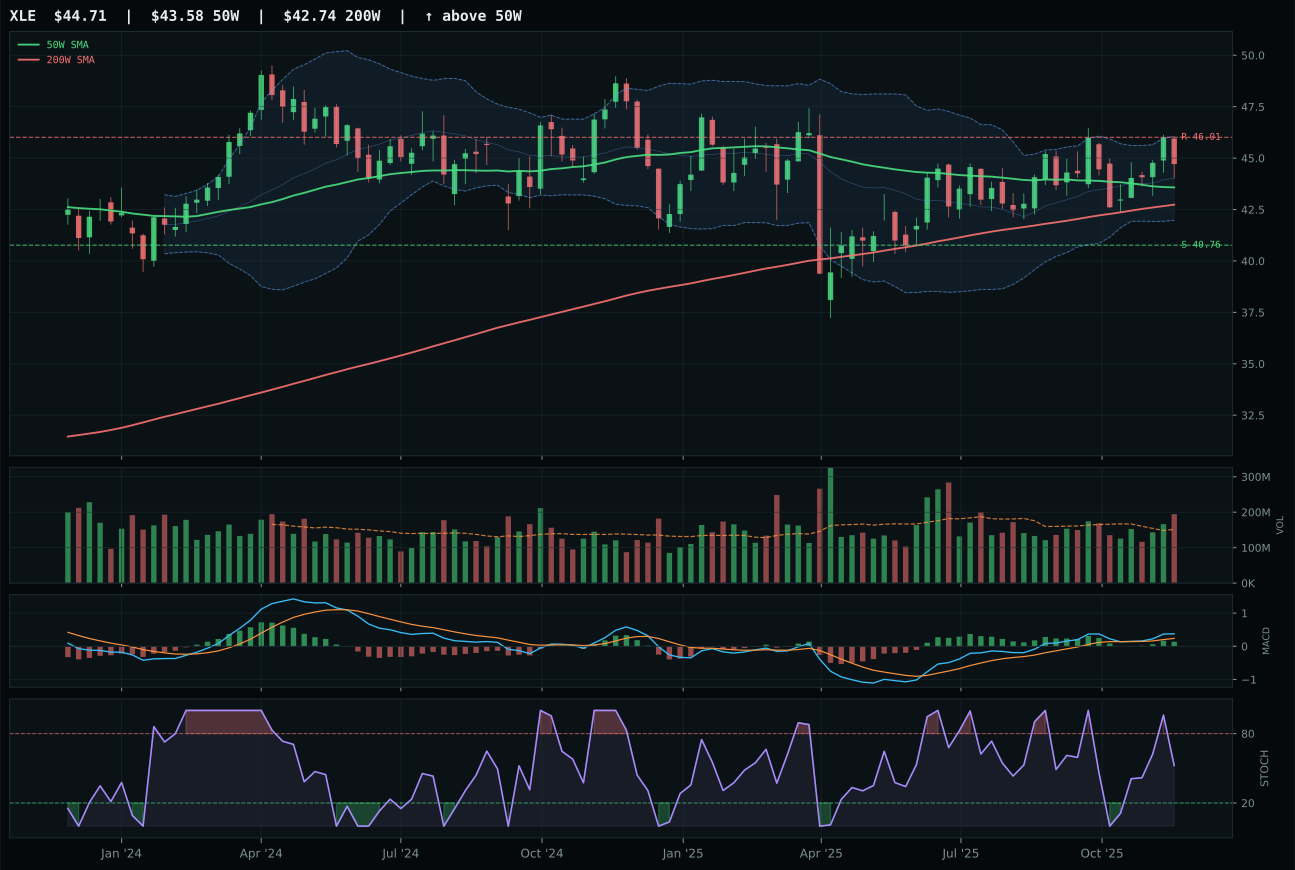
XLE has a compression near 50W profile with -0.7% 13-week relative strength versus SPY.
A failed hold above support would weaken the setup.
Actionable but governed by invalidation levels.
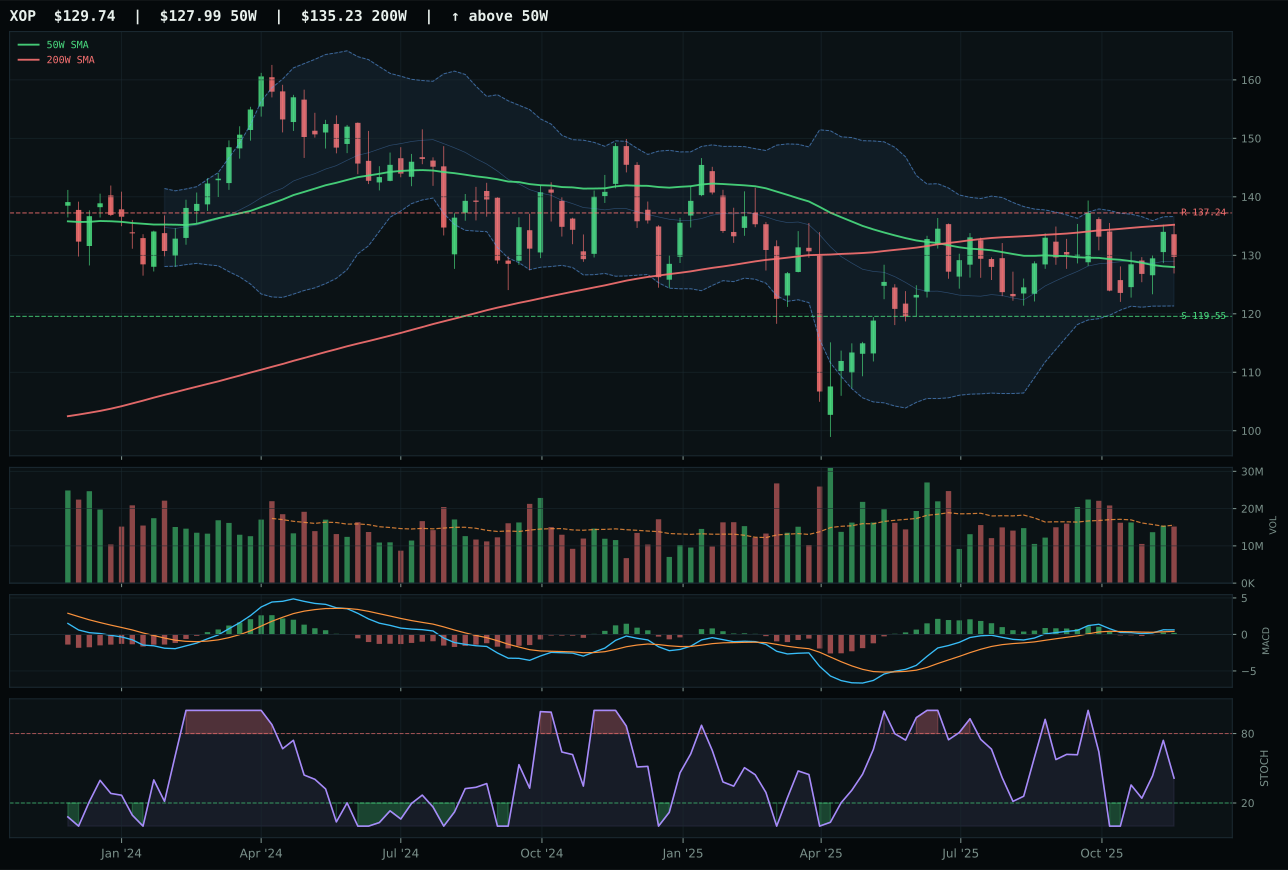
XOP has a compression near 50W profile with -1.3% 13-week relative strength versus SPY.
A failed hold above support would weaken the setup.
Actionable but governed by invalidation levels.
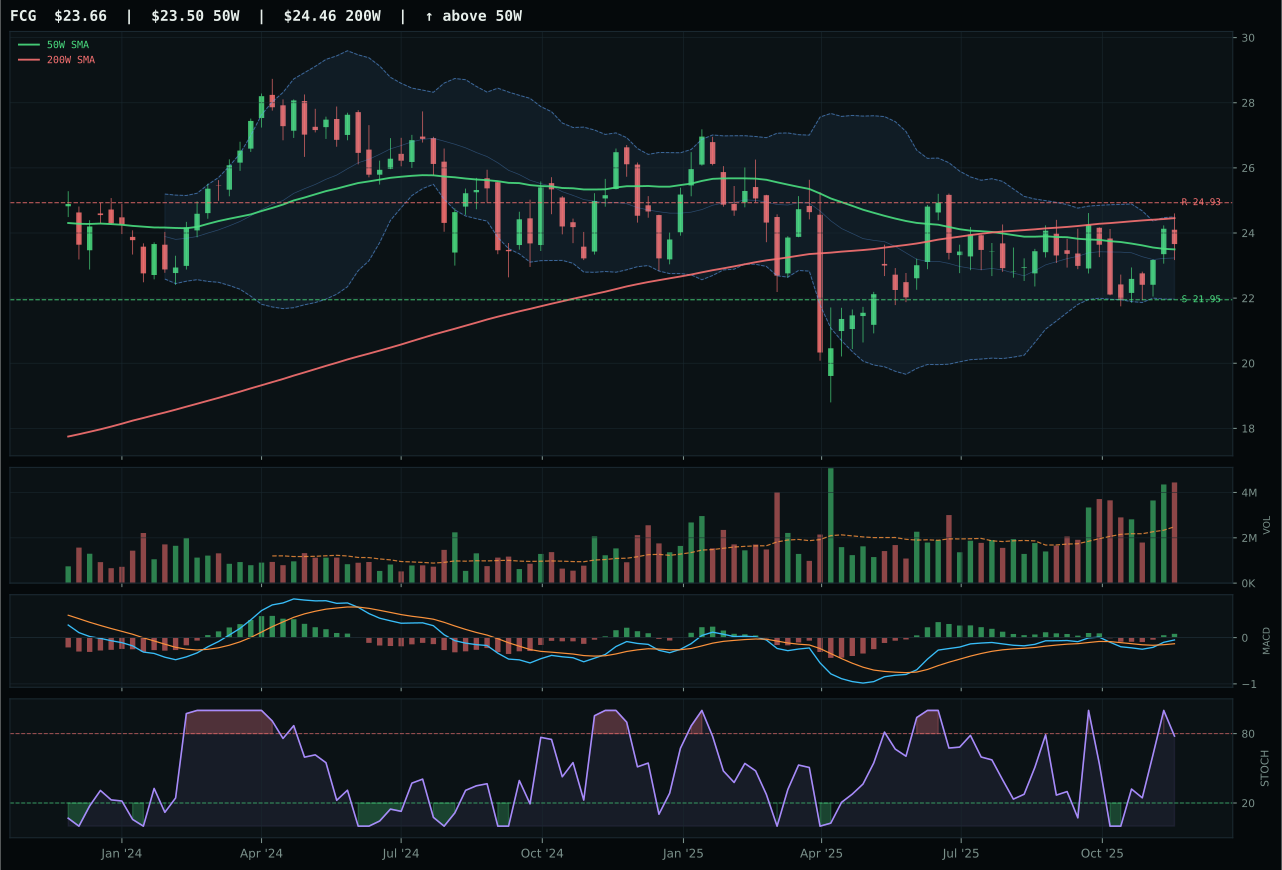
FCG has a compression near 50W profile with -1.2% 13-week relative strength versus SPY.
A failed hold above support would weaken the setup.
Actionable but governed by invalidation levels.
XLE defeats XOP by combining superior structure (76.8 vs 67.5) with above-average participation volume (1.28x the 20W vs XOP's neutral) and the highest timing score in the energy category at 100.0/100—price sits 2.6% from the 50W in compression with bullish and improving MACD and rising mid-zone stochastic RSI (0.52). This is a coiled setup, not an extended one; compression near the 50W with positive momentum divergence signals that institutional buying is defending support while technical indicators flash green, creating the kind of entry-point setup that typically precedes directional movement. XOP's 28.5% extension above the 50W and 20.9% above the 200W makes it technically stretched, and while RS at 2.7% versus SPY is stronger than XLE's -0.7%, the timing cost of that extended position outweighs the relative strength benefit—XLE is the play for patience, XOP is the play for momentum chasers. Risk/reward at 50.3% for XLE reflects that upside to resistance at 46.01 sits 2.8% above while downside to support sits 9.7% below, not a favorable asymmetry, but the compression setup means that risk is confined and defined rather than open-ended.
Traditional Energy scores 36.6 and earns a 10% allocation as a tactical coiled-spring setup despite the category's dismal 23.0 macro fit, dragged down by -10 from disinflation pressure and -10 for liquidity stress. XLE's 86.2 technical evidence score is the highest in the category and reflects that the compression setup with bullish MACD is a real institutional signal, not a narrative-driven play; the macro regime is hostile to energy (disinflation typically means lower growth demand, lower inflation, lower oil prices), but XLE's technical setup suggests that patient capital is positioning for a reversal. This is a 10% allocation because the technical evidence is strong enough to justify a small tactical position against a macro headwind, not because the macro regime has shifted in energy's favor. If XLE breaks below support at 40.76, this allocation should be exited decisively—the disinflation regime is not favorable, and the tactical edge depends entirely on the compression setup holding together. Real asset sponsorship (+7) and the broad market bear descriptor (+3) do provide modest tailwinds, but these are not structural in a disinflation environment.
Emerging Markets — ILF
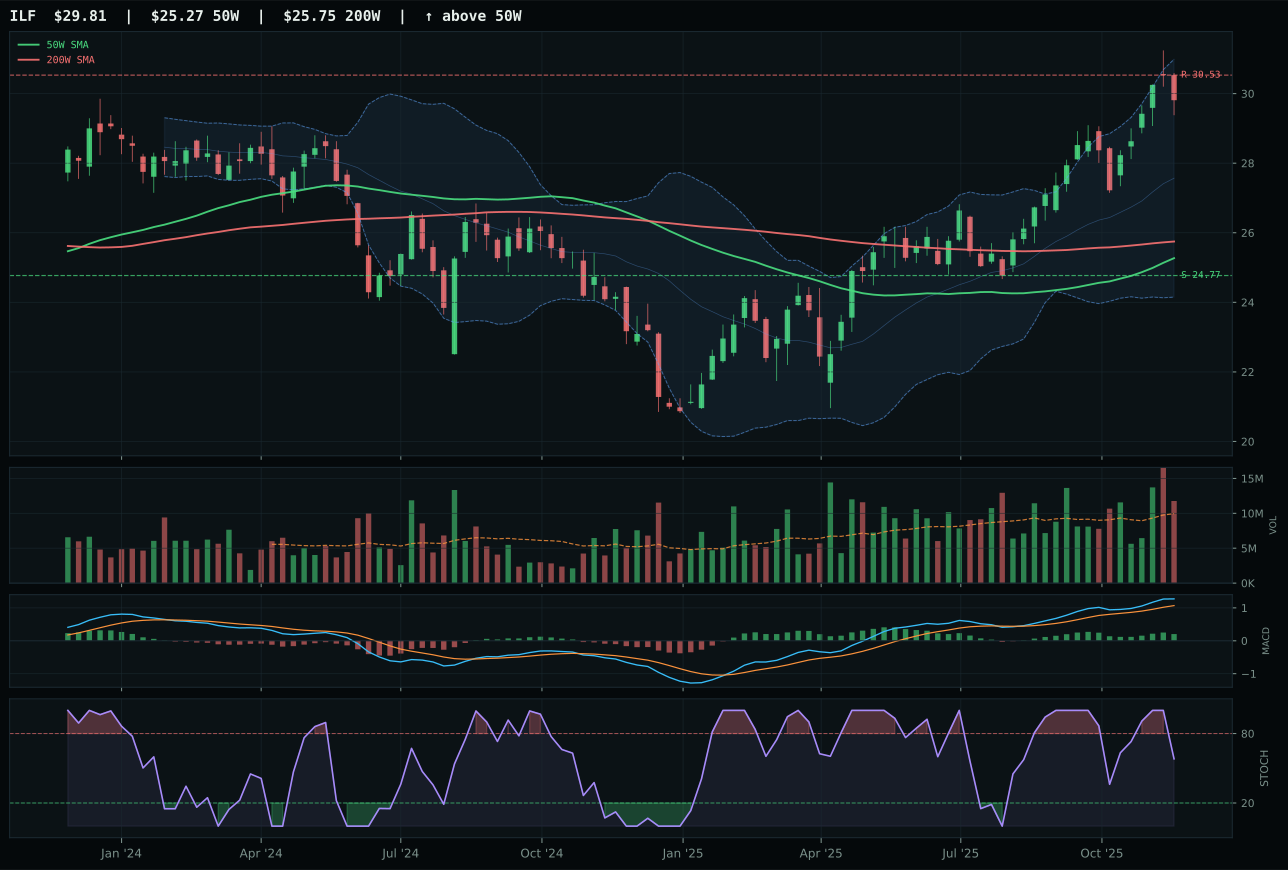
ILF has a vertical extension profile with 9.4% 13-week relative strength versus SPY.
A failed hold above support would weaken the setup.
Actionable but governed by invalidation levels.
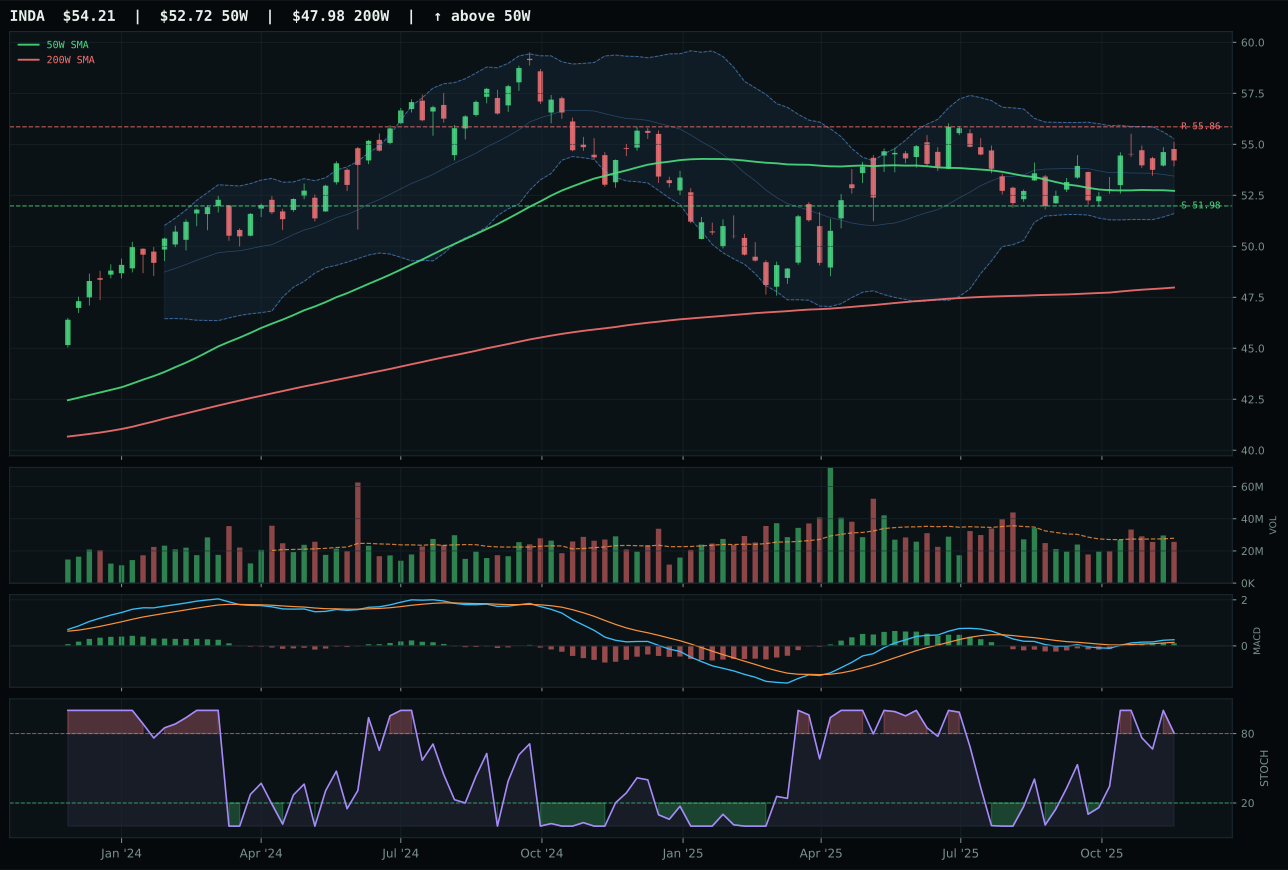
INDA has a pullback into support profile with -1.0% 13-week relative strength versus SPY.
A failed hold above support would weaken the setup.
Actionable but governed by invalidation levels.
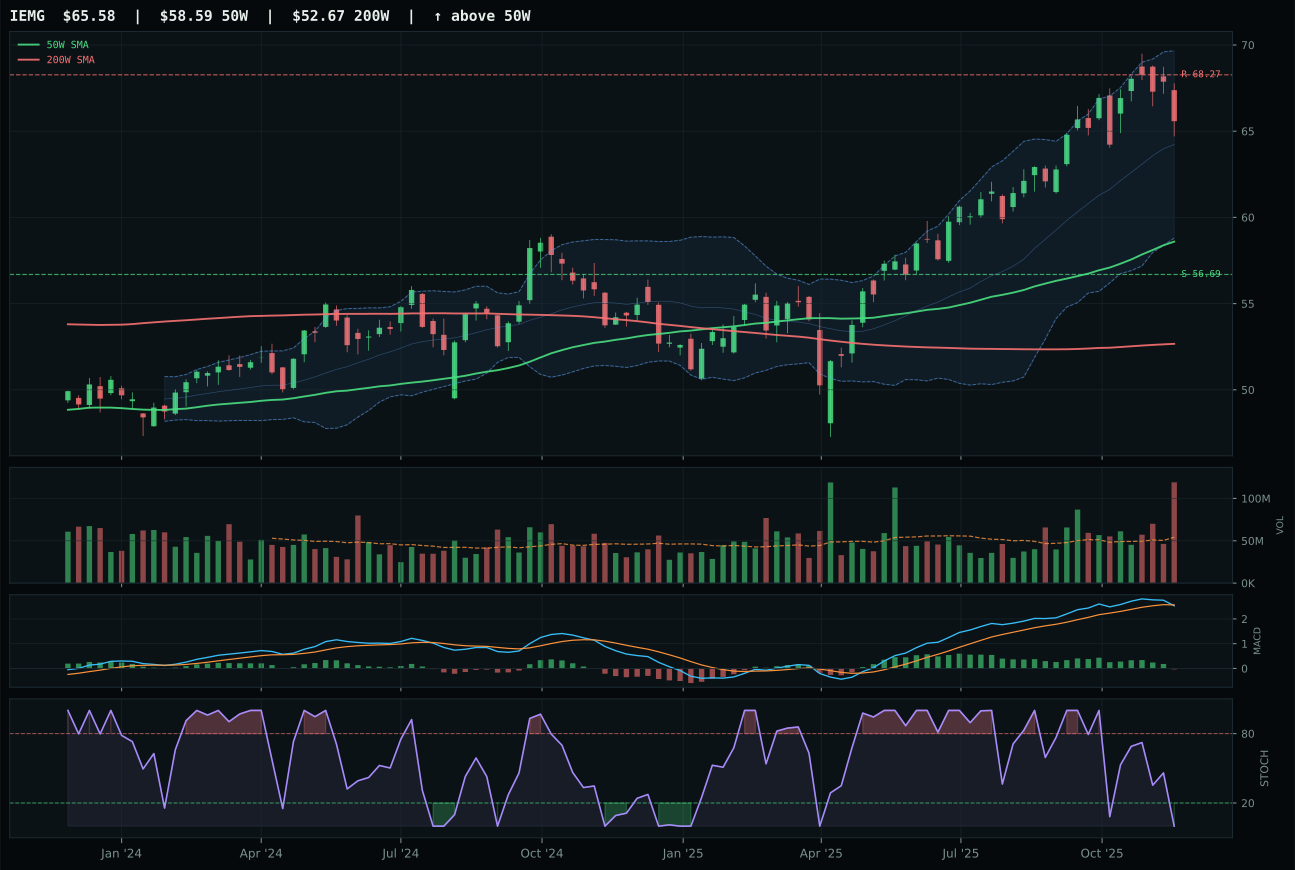
IEMG has a neutral structure profile with 2.1% 13-week relative strength versus SPY.
A failed hold above support would weaken the setup.
Actionable but governed by invalidation levels.
ILF commands the Emerging Markets category with the second-highest technical evidence score in the entire portfolio at 90.7, combining a perfect 100.0 trend (price above both moving averages, 50W slope 0.5%, RS 9.4% vs SPY) with perfect 100.0 momentum confirmation and 82.4 structure—a triple-confirmation setup that makes ILF technically the strongest chart in this report. The 18.0% extension above the 50W is controlled, not chaotic, with volume at above-average participation (1.18x the 20W) and MACD bullish and improving; this is the opposite of extended exhaustion, it's institutional accumulation into a strong trend. ILF's 7.3% category-relative strength dominates INDA's -3.1%, and the 11.5% 13W return on 4.1% 4W return shows that this is not a late-stage momentum chase but rather a continuation of an established move that's gaining traction. Latin America's commodity and value beta is a leveraged play on the commodity breadth and real asset sponsorship descriptors that are driving PICK and GLD, but ILF adds a third macro dimension: the broad market bear descriptor, which benefits defensive, lower-volatility equity regions.
Emerging Markets earned zero allocation at 31.8, ranked 9th or 10th, because macro headwinds are ferocious and technical leadership isn't strong enough to override them. Dollar pressure docks -14 points, credit stress subtracts -10, and liquidity stress another -10; these three factors total -34 against only +8 for risk appetite positive. The category-level macro fit is 15/100—the weakest among all ten categories—because emerging markets are margin accounts getting liquidated in a dollar-strong, liquidity-tight regime. ILF's 90.7 technical evidence is impressive on its own, but it cannot fight the macro current; the 11.5% thirteen-week return looks good until you realize it's happening alongside a weakening EM currency basket. This category needs either dollar reversal or emerging market breadth to prove the setup is durable; neither has appeared yet. Zero is correct.
Agriculture & Livestock — MOO
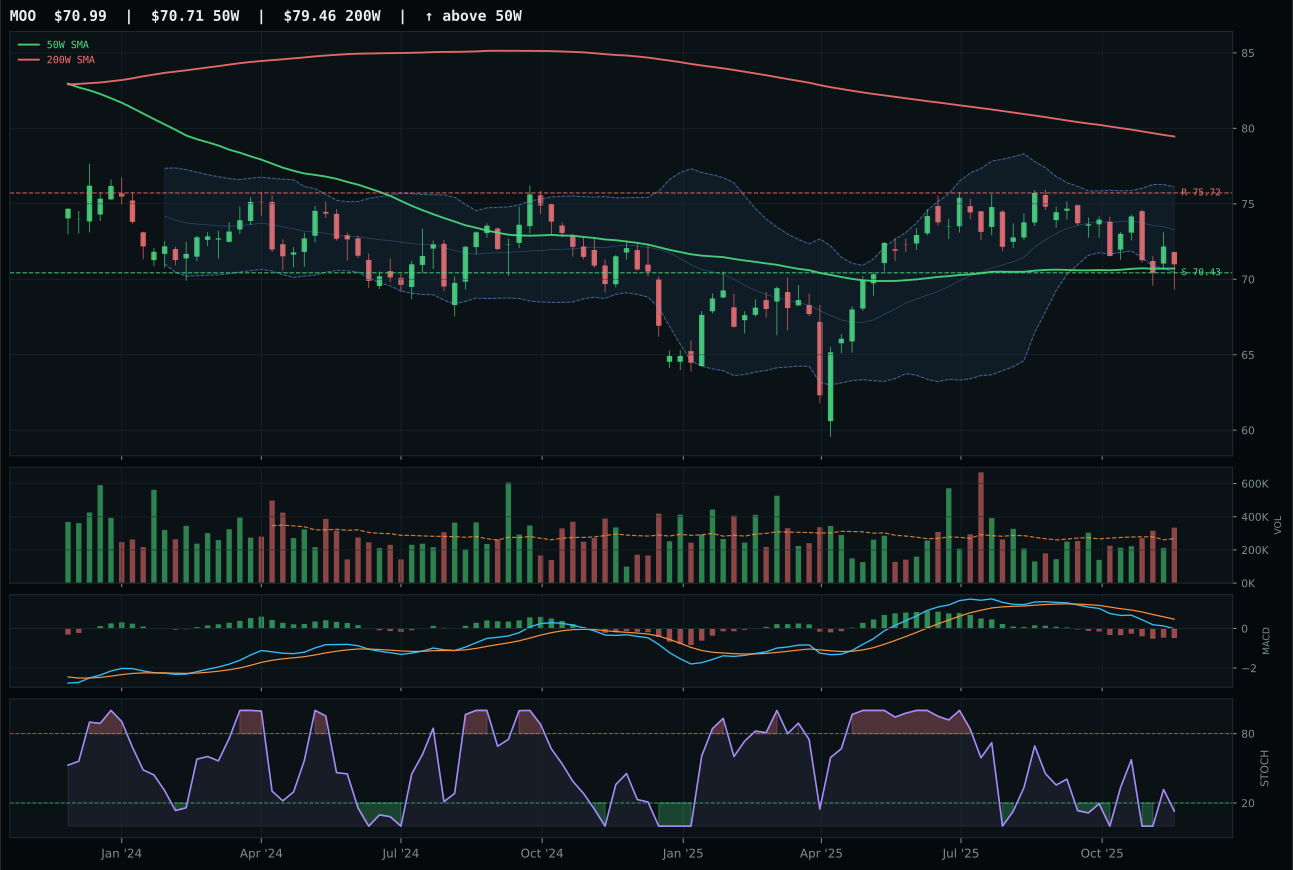
MOO has a pullback into support profile with -8.4% 13-week relative strength versus SPY.
A failed hold above support would weaken the setup.
Actionable but governed by invalidation levels.
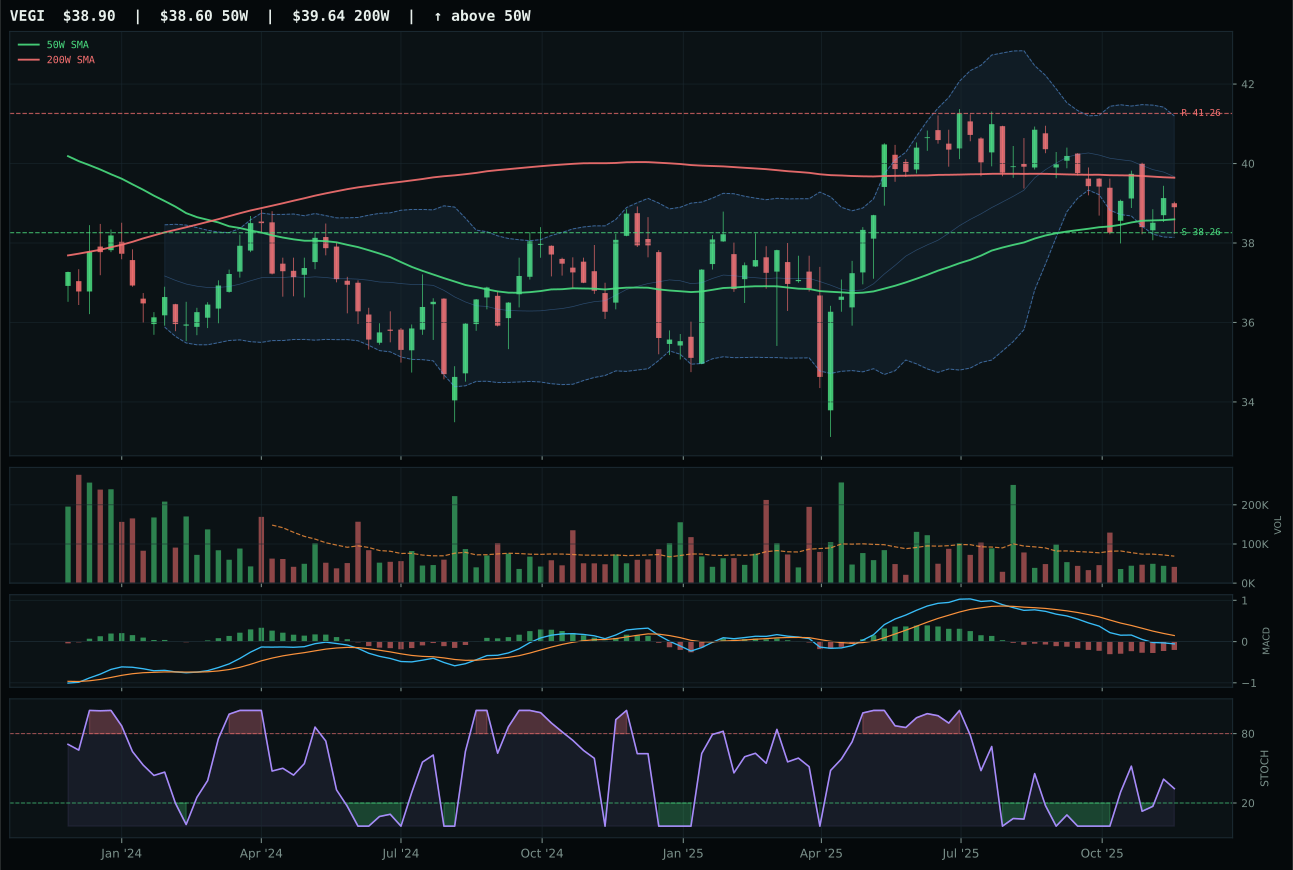
VEGI has a pullback into support profile with -6.9% 13-week relative strength versus SPY.
A failed hold above support would weaken the setup.
Tracked, but not top-2 eligible because: .
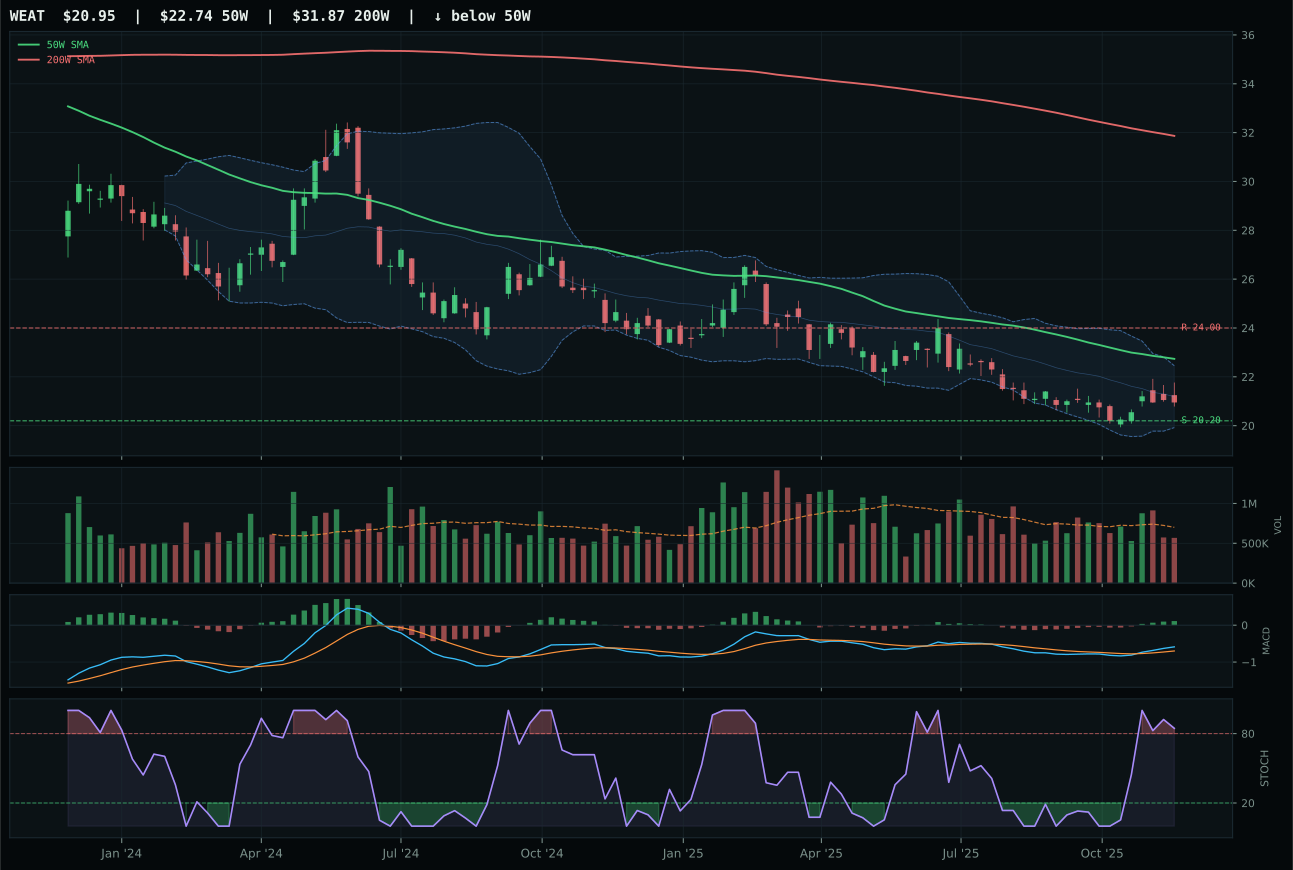
WEAT has a pullback into support profile with -2.8% 13-week relative strength versus SPY.
Extension and support failure are the main tactical risks.
Tracked, but not top-2 eligible because: structurally broken.
MOO wins Agriculture & Livestock with the highest timing score in the portfolio at 100.0/100 because price is sitting 0.4% from the 50W with stochastic RSI at oversold turn up (0.13)—the exact setup where mean reversion has the highest probability of success. The structure scores 73.2 against VEGI's 69.1, and crucially, MOO's above-average participation volume (1.25x the 20W) combined with bearish/weakening MACD and oversold stochastic RSI suggests accumulation into the dip rather than continuation of a sell-off—a three-part confirmation that this pullback is being bought. The 90.0 risk/reward score reflects that upside to resistance sits only 6.2% away at 75.72 while downside to support sits 0.8% below at 70.43, a tight range that favors short-term directional players willing to defend the support level. VEGI's rising mid-zone stochastic RSI (less extreme oversold) and improving MACD actually count against it in this timing regime; the oscillator has already bounced, meaning timing entry is harder and the risk of continued deterioration is real.
Agriculture & Livestock earned zero allocation at 14.8—ranked 9th or 10th—because the macro regime is openly hostile and the technical setup is purely defensive. Disinflation pressure docks -8 points, liquidity stress subtracts -4, and commodity breadth positive adds only +5 to offset them. MOO's 27.1 technical evidence score is the lowest of any winner, and the category's macro/narrative fit of 45/100 reflects that real assets are fighting a falling-price environment, not sailing with it. The thirteen-week return is negative (-6.2%), and both leading ETFs show MACD deterioration. This category needs either disinflation to reverse into inflation fears or commodity breadth to prove itself genuine; neither has occurred yet. Zero allocation is correct.