
2025-11-14
Informational purposes only. The content in this report, including allocations, analysis, and commentary, is provided solely for informational and educational purposes. It does not constitute financial advice, investment advice, trading advice, or any other type of advice. Past performance does not guarantee future results. Always conduct your own research and consult a qualified financial professional before making investment decisions.
Weekly Allocation
| Ticker | Category | Weight | Role |
|---|---|---|---|
| FBTC | 50% | Overlay | |
| SLV | Precious Metals | 10% | Top-2 (10%) |
| PICK | Industrial Metals | 10% | Top-2 (10%) |
| SMH | AI | 5% | Tier-2 (5%) |
| XLE | Traditional Energy | 5% | Tier-2 (5%) |
| ILF | Emerging Markets | 5% | Tier-2 (5%) |
| IGF | Utilities & Infrastructure | 5% | Tier-2 (5%) |
| XLK | Technology | 5% | Tier-2 (5%) |
| URNM | Nuclear Energy | 5% | Tier-2 (5%) |
Trade Instructions — Monday Open
Sell the tranche from 2025-10-17 (completing its 4-week hold). Buy the new tranche. Instructions show net portfolio changes — same-asset positions cancel, weight changes show the delta.
| Action | Ticker | Instruction |
|---|---|---|
| SELL | GLD | Sell 29% of GLD position (reduce 8.75% → 6.25%) |
| SELL | SMH | Sell 20% of SMH position (reduce 6.25% → 5.00%) |
| SELL | REMX | Sell 33% of REMX position (reduce 3.75% → 2.50%) |
| SELL | XLU | Sell 25% of XLU position (reduce 5.00% → 3.75%) |
| SELL | NLR | Sell 33% of NLR position (reduce 3.75% → 2.50%) |
| SELL | IEMG | Sell entire IEMG position (1.25% of portfolio) |
| SELL | XAR | Sell 33% of XAR position (reduce 3.75% → 2.50%) |
| BUY | XLE | Buy XLE — 12.50% of freed cash (adds 1.25% to portfolio) |
| BUY | PICK | Buy PICK — 25.00% of freed cash (adds 2.50% to portfolio) |
| BUY | ILF | Buy ILF — 12.50% of freed cash (adds 1.25% to portfolio) |
| BUY | SLV | Buy SLV — 25.00% of freed cash (adds 2.50% to portfolio) |
| BUY | IGF | Buy IGF — 12.50% of freed cash (adds 1.25% to portfolio) |
| BUY | URNM | Buy URNM — 12.50% of freed cash (adds 1.25% to portfolio) |
Current Portfolio After Trade
Combined holdings across all 4 active tranches. Each tranche is 25% of the portfolio.
| Ticker | % of Portfolio | Weight Bar |
|---|---|---|
| FBTC | 50.00% | |
| GLD | 6.25% | |
| SMH | 5.00% | |
| XLK | 5.00% | |
| PICK | 5.00% | |
| ILF | 5.00% | |
| XLU | 3.75% | |
| REMX | 2.50% | |
| NLR | 2.50% | |
| XAR | 2.50% | |
| XLE | 2.50% | |
| SLV | 2.50% | |
| URA | 1.25% | |
| PAVE | 1.25% | |
| COPX | 1.25% | |
| ITA | 1.25% | |
| IGF | 1.25% | |
| URNM | 1.25% |
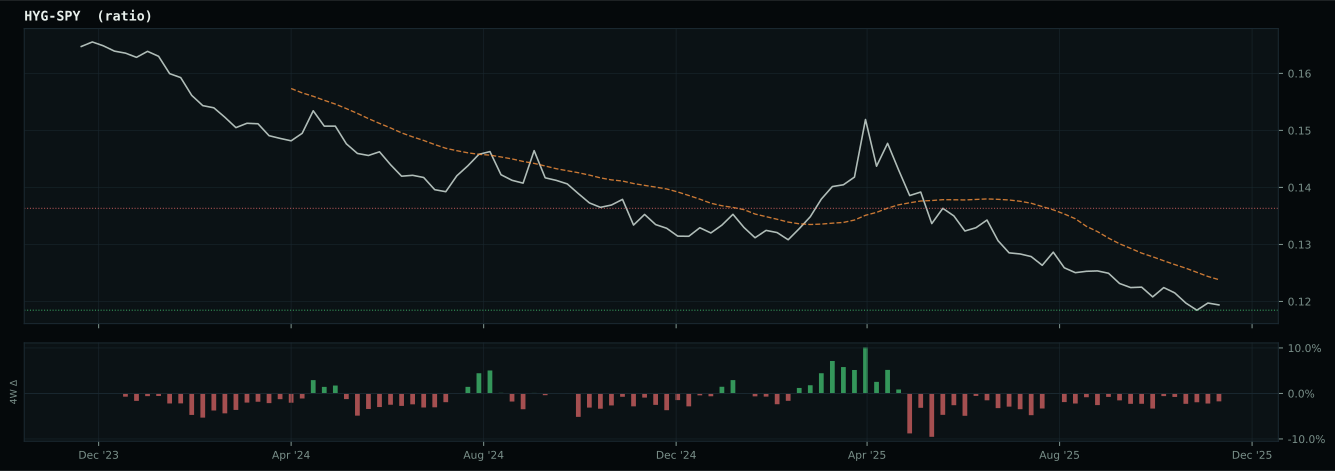
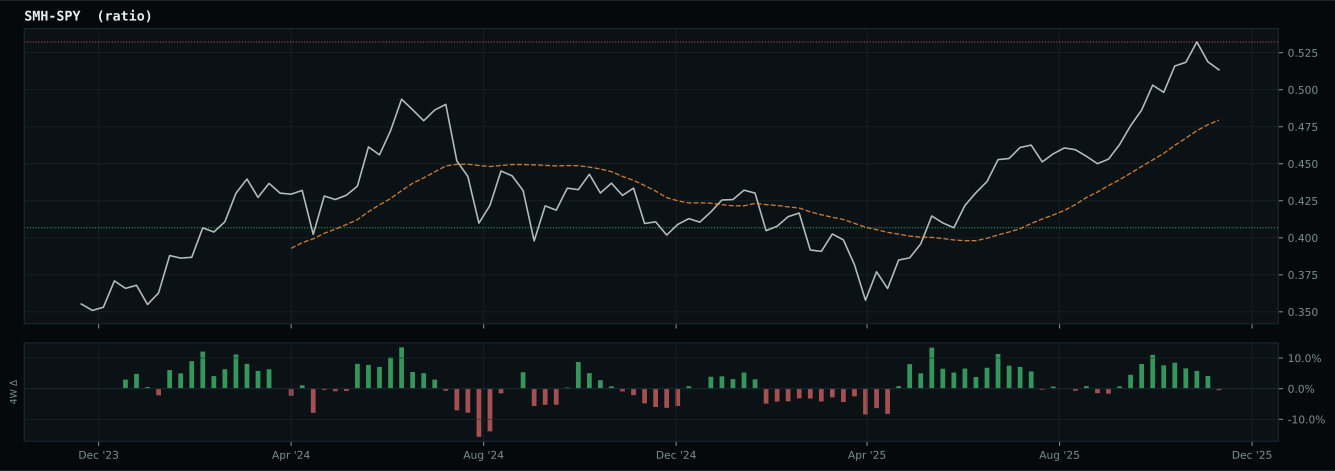
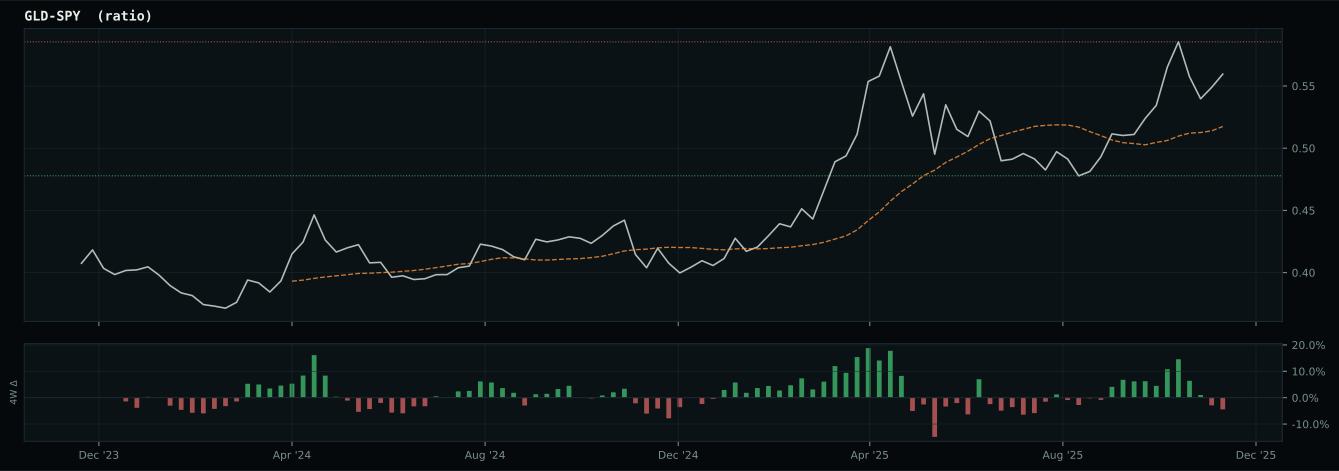
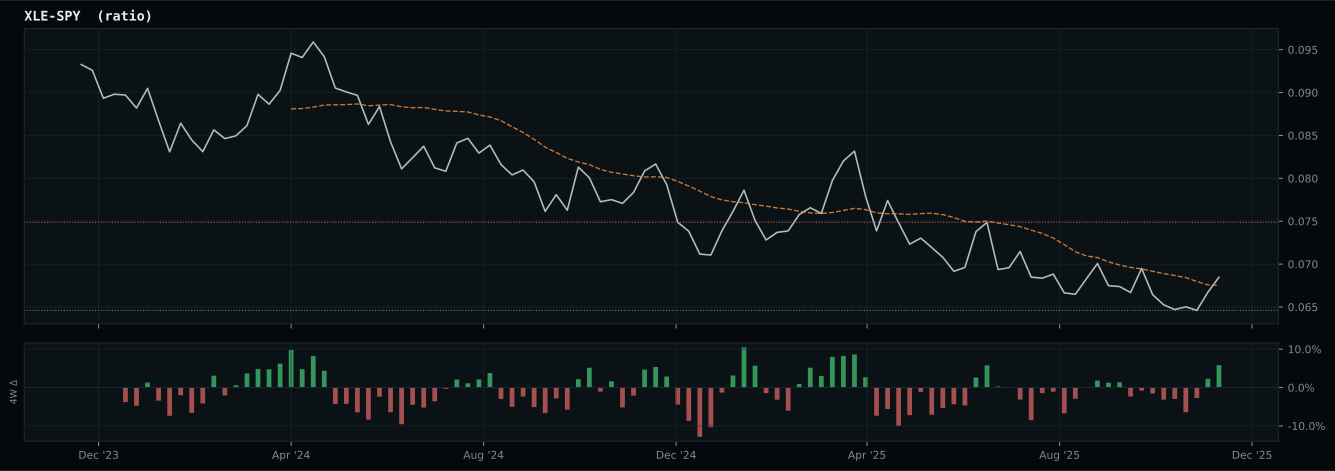
Macro Regime — Disinflation
Macro Evidence Charts
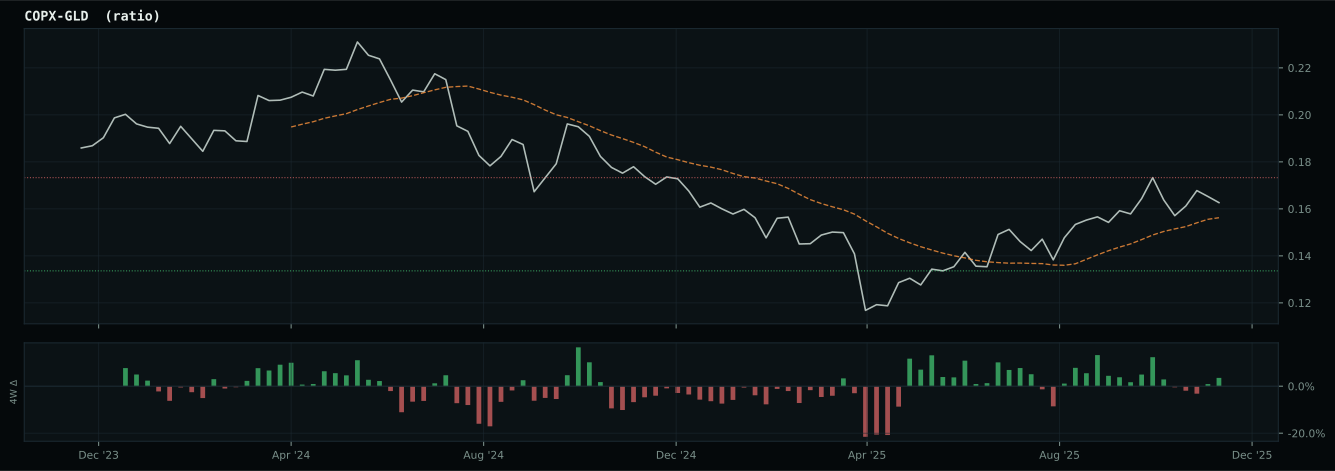
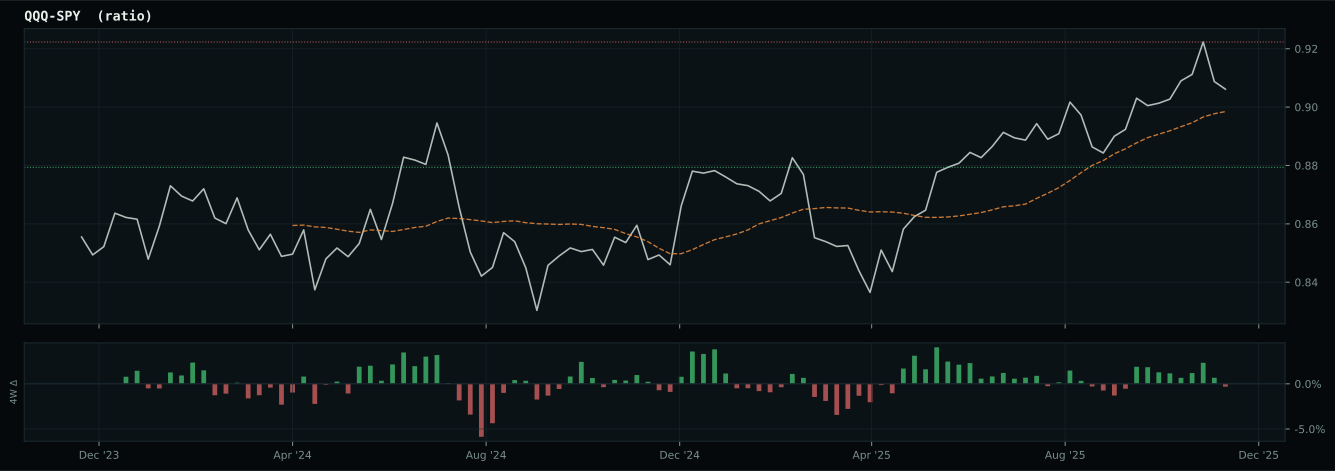
Market-implied signals behind the macro regime scores. Each ratio compares two assets; the direction and slope of the ratio is what the macro engine reads.
Crypto Regime — TrendBTC
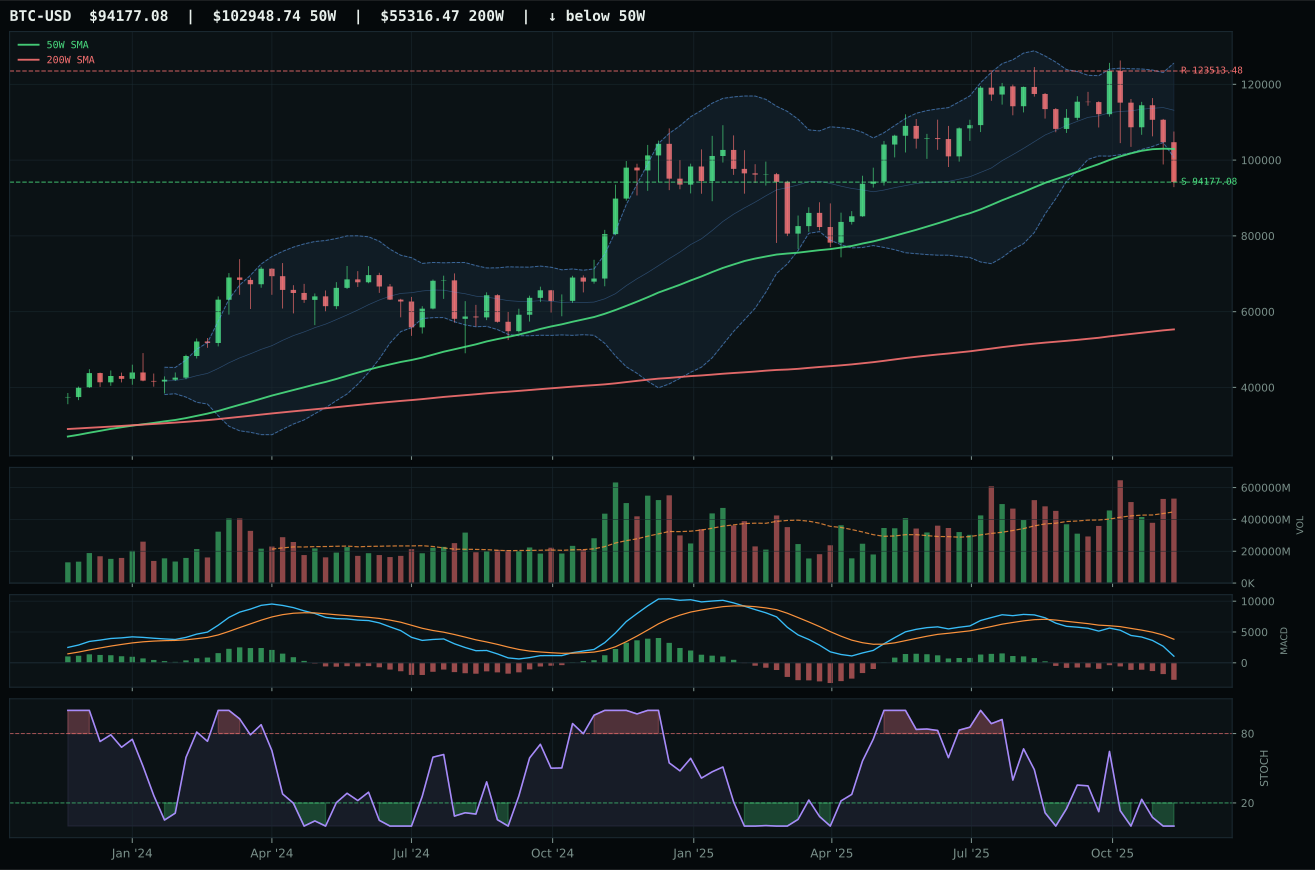
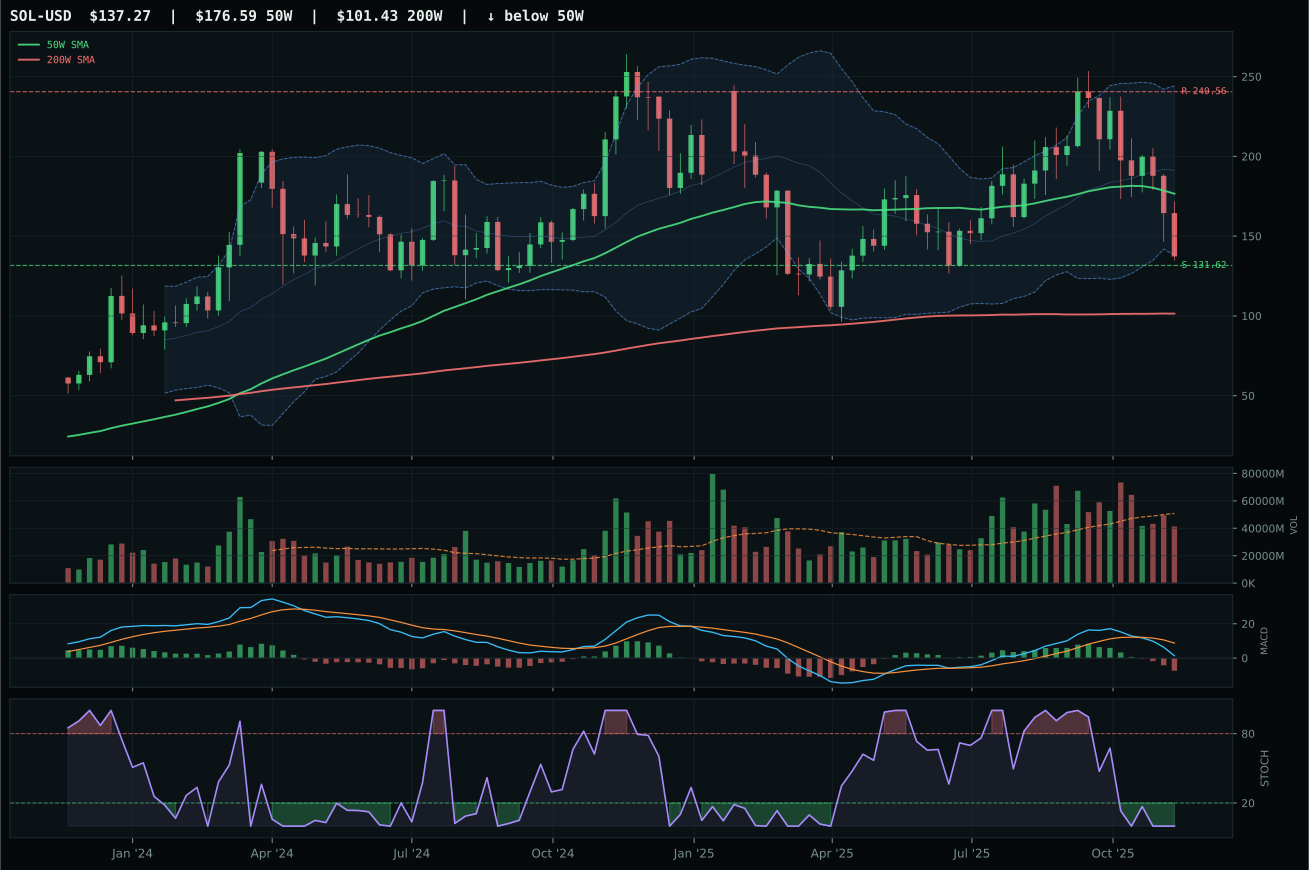
ValueBTC not armed: BTC has not made the first post-breakdown touch of the 200W buy zone after losing the 50W
TrendBTC not confirmed
one or more available conditions failed
Category Rankings
| Rank | Category | Winner | Score | Alloc | 4W Ret | Peers (4W) |
|---|---|---|---|---|---|---|
| 1 | Precious Metals | SLV | 72.7 | 20% | +26.26% | GDX +14.4% · GLD +6.3% |
| 2 | Industrial Metals | PICK | 71.4 | 20% | +10.07% | COPX +15.1% · REMX +0.2% |
| 3 | AI | SMH | 65.6 | 10% | +4.73% | AIQ +1.8% · BOTZ +5.5% |
| 4 | Traditional Energy | XLE | 61.0 | 10% | -0.75% | FCG +0.0% · XOP -1.2% |
| 5 | Emerging Markets | ILF | 55.4 | 10% | +3.87% | IEMG -0.0% · INDA -2.9% |
| 6 | Utilities & Infrastructure | IGF | 49.9 | 10% | +0.50% | XLU -3.0% · PAVE +5.2% |
| 7 | Technology | XLK | 48.0 | 10% | +1.19% | CIBR -0.8% · IGV +0.8% |
| 8 | Nuclear Energy | URNM | 43.6 | 10% | +7.32% | URA +5.6% · NLR +2.2% |
| 9 | Defense & Aerospace | ITA | 38.5 | 0% | +2.27% | XAR +4.4% · ROKT +9.1% |
| 10 | Agriculture & Livestock | MOO | 15.9 | 0% | +4.35% | VEGI +1.7% · WEAT -4.4% |
Precious Metals — SLV
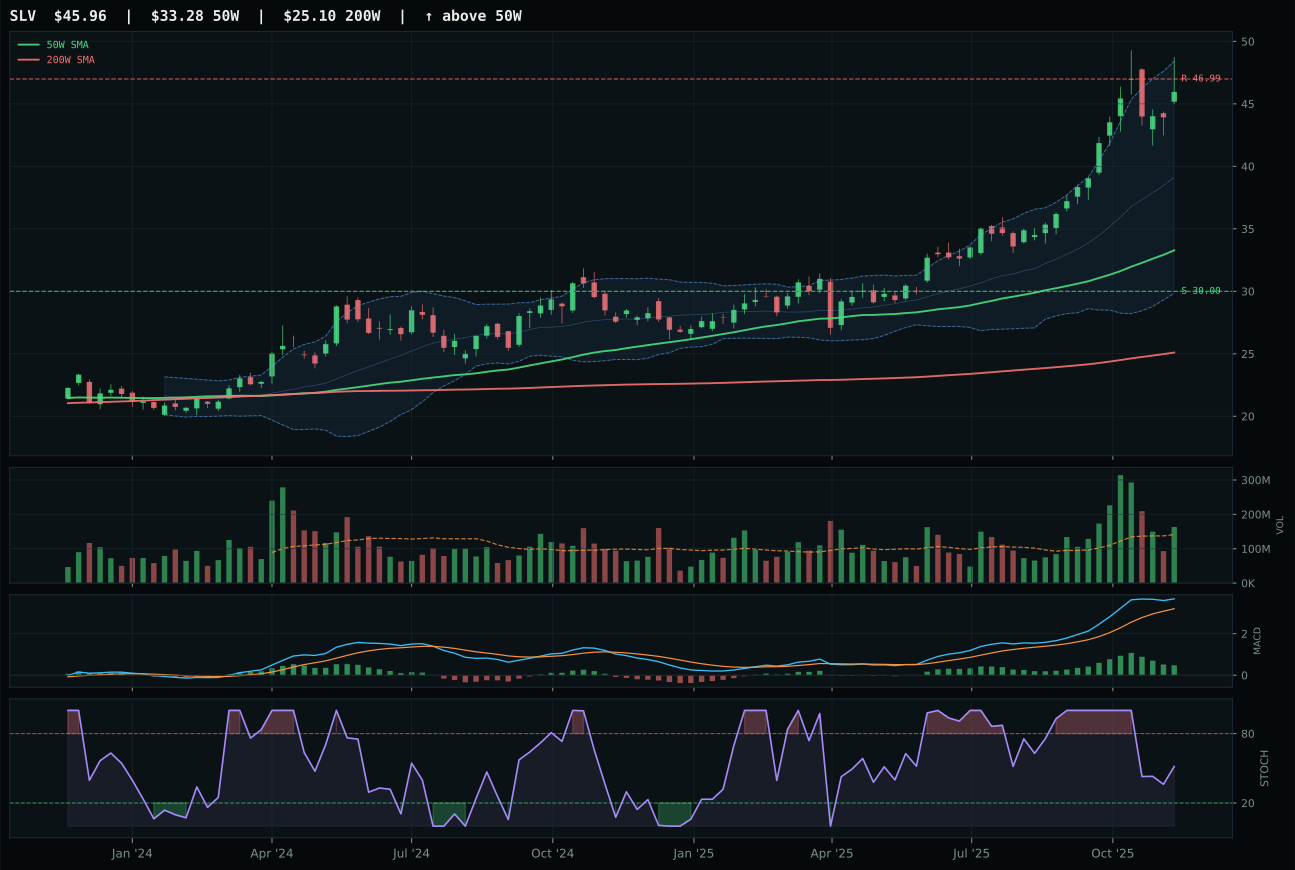
SLV has a vertical extension profile with 28.8% 13-week relative strength versus SPY.
A failed hold above support would weaken the setup.
Actionable but governed by invalidation levels.
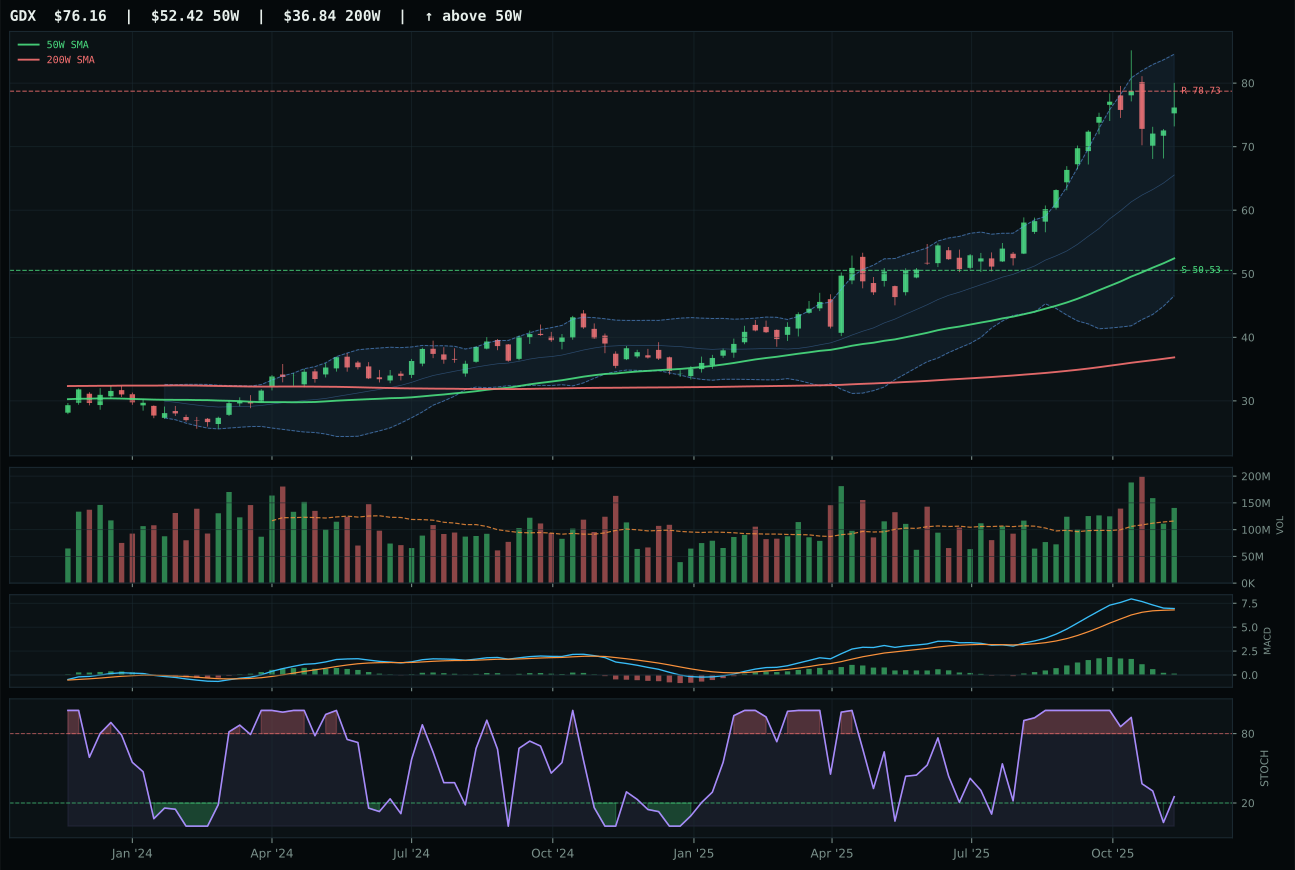
GDX has a vertical extension profile with 26.3% 13-week relative strength versus SPY.
A failed hold above support would weaken the setup.
Actionable but governed by invalidation levels.
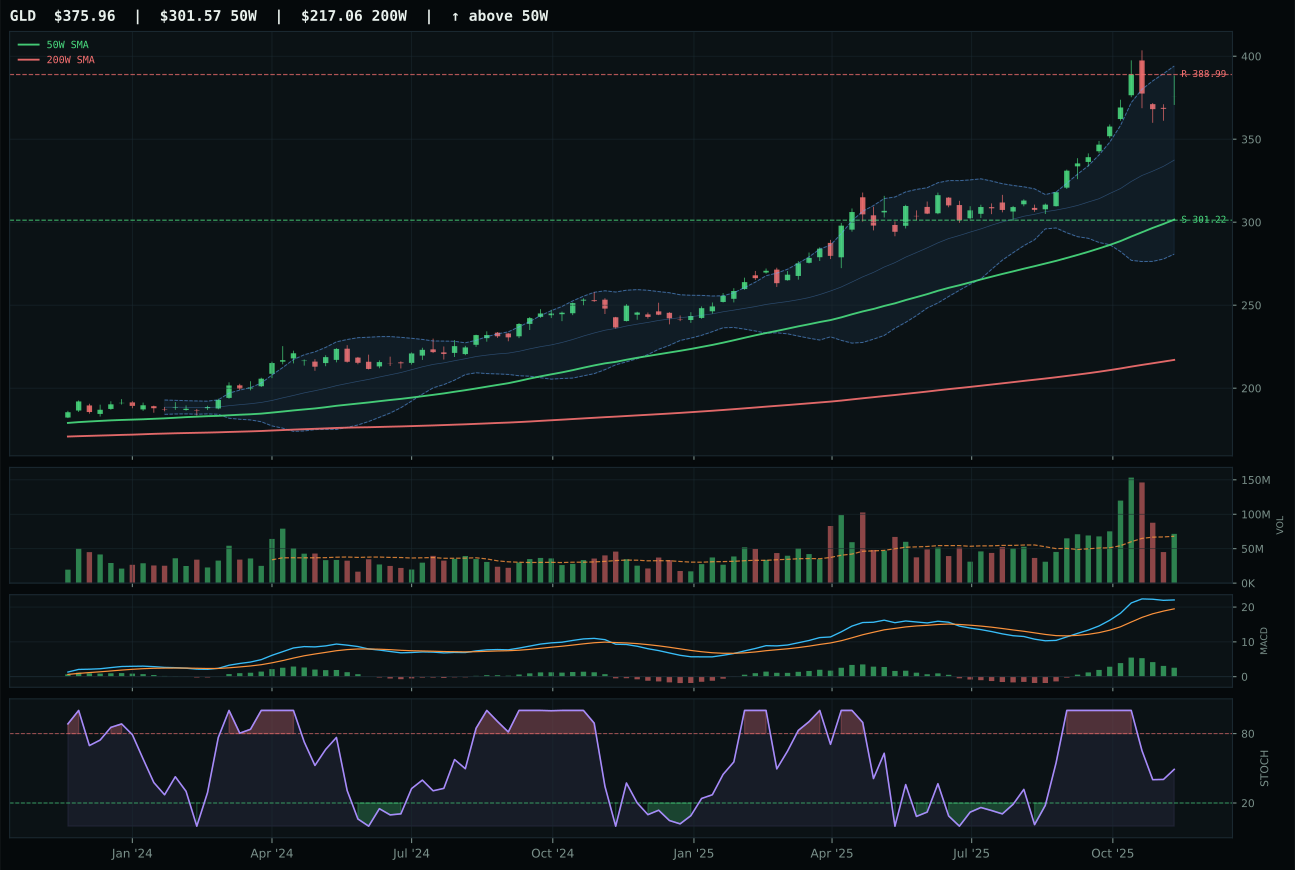
GLD has a vertical extension profile with 17.9% 13-week relative strength versus SPY.
A failed hold above support would weaken the setup.
Actionable but governed by invalidation levels.
SLV wins decisively as the metals leaders align, delivering a perfect 100.0 momentum confirmation score powered by 33.2% thirteen-week returns and 28.8% SPY-relative strength that signals institutional accumulation into disinflation. The setup is extended 38.1% above the fifty-week moving average, which ordinarily triggers timing penalties, but the combination of bullish MACD (even if flattening), stochastic RSI rising into mid-zone territory at 0.52, and above-average volume at 1.15x confirms that late-stage buyers are still being accepted. Structure is clean at 82.6/100 with tight Fibonacci compression and defined support/resistance levels. GDX, the runner-up, has identical trend quality and momentum power but suffers from a weaker 48.0 timing score (versus 56.0 for SLV), stochastic RSI falling/neutral instead of rising, and 45.3% distance from the fifty-week that stretches risk asymmetry. SLV's internal strength and better timing confirmation earn the top slot inside precious metals.
Precious Metals ranks second overall with a final score of 72.7 and claims its 10% top-2 allocation because monetary-hedge sponsorship is explicitly active (+14 descriptor points) in the disinflation regime, metals scarcity is driving real supply constraints (+7), and the category's macro/narrative fit is strong at 74.0/100. SLV's technical evidence at 76.1/100 is excellent, and the 3/2/1 weighted basket generates clean 69.7/100 category-level support. The macro case is straightforward: as disinflation pressures accumulate and central banks defend liquidity, precious metals—especially silver's dual monetary-and-industrial beta—become the preferred hedge. The 10% allocation reflects both technical strength and genuine macro alignment. The sole risk is that the extended setups in both SLV and GDX mean there is limited room for new buyers above current levels; a retracement to support would relieve timing risk but would also test whether accumulation demand persists. At 10%, this is a core hedge sleeve, not a timing trade.
Industrial Metals — PICK
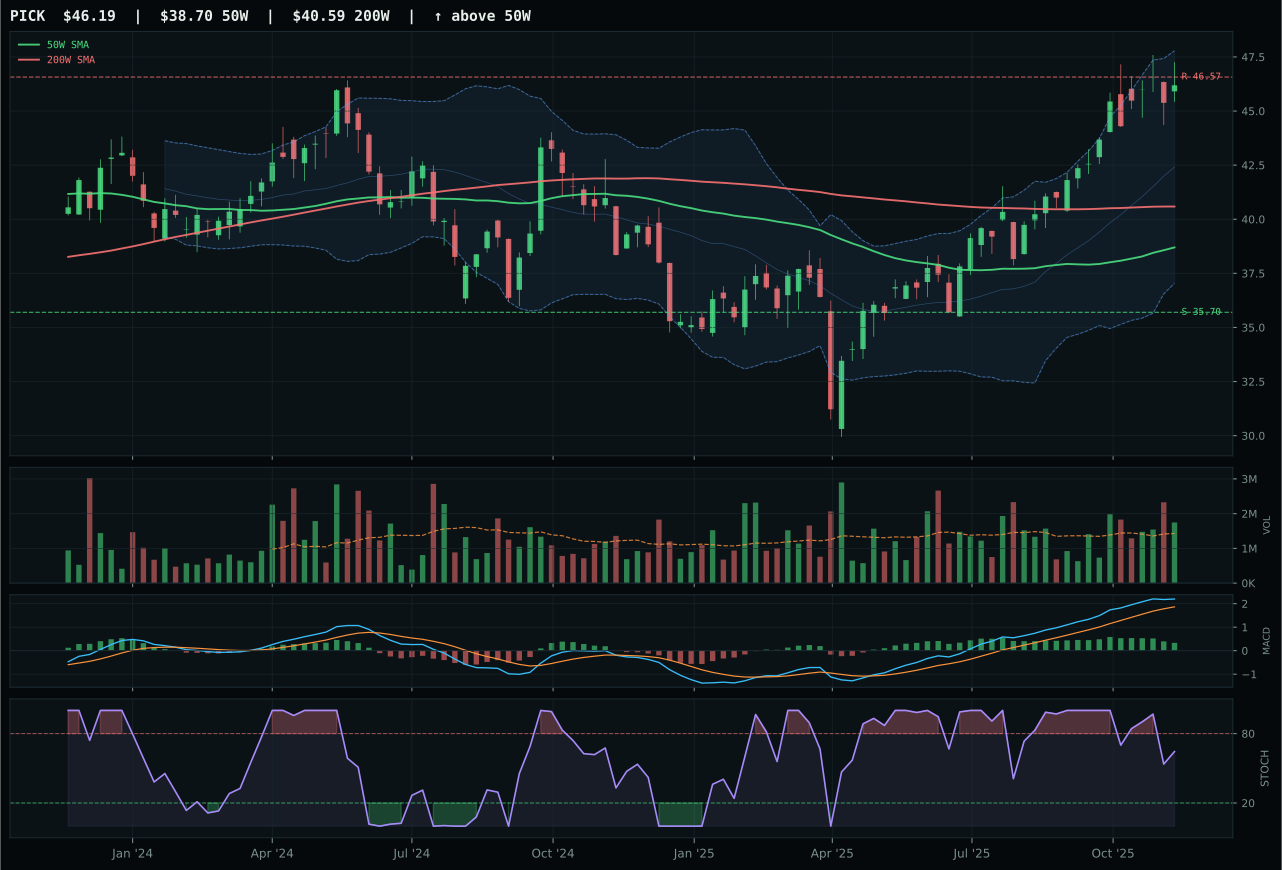
PICK has a vertical extension profile with 10.4% 13-week relative strength versus SPY.
A failed hold above support would weaken the setup.
Actionable but governed by invalidation levels.
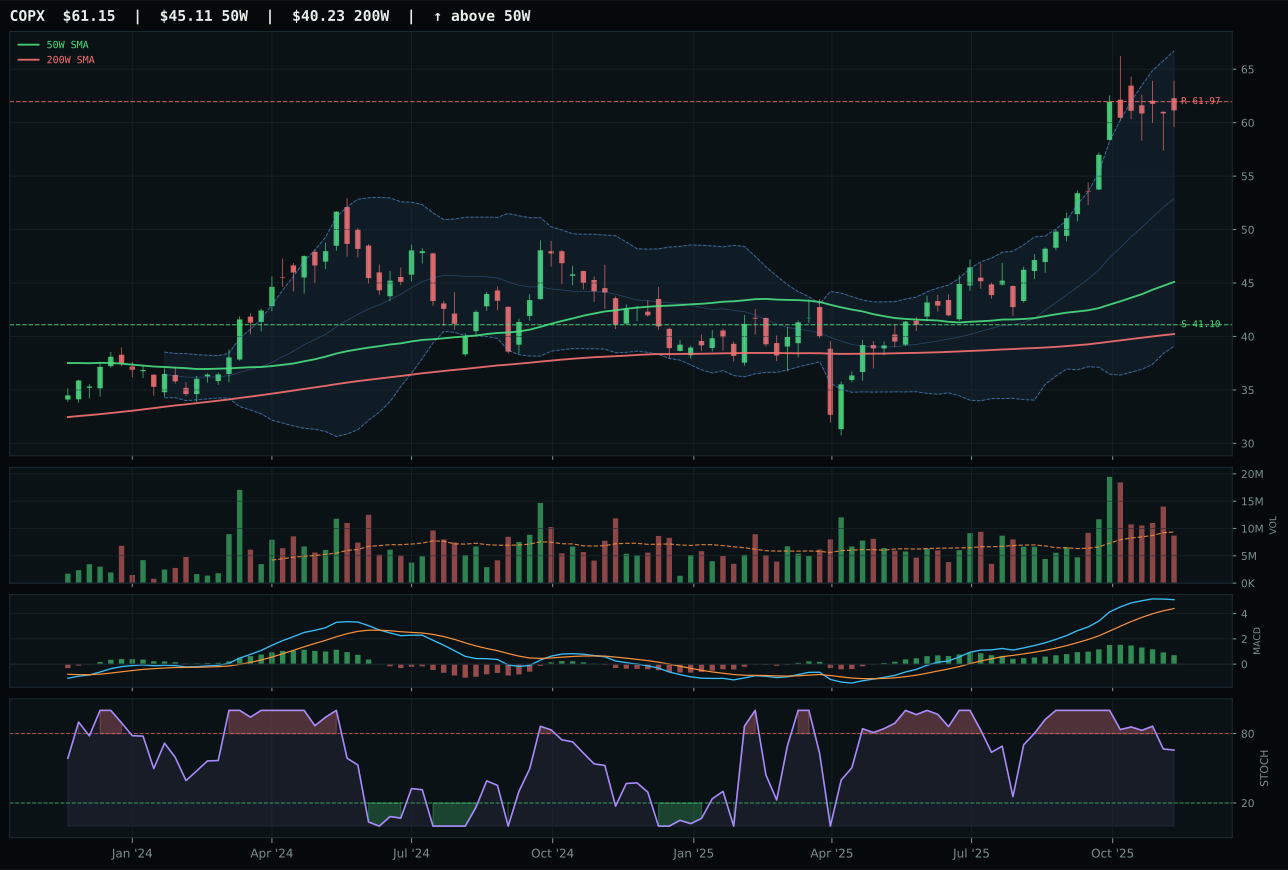
COPX has a vertical extension profile with 25.3% 13-week relative strength versus SPY.
A failed hold above support would weaken the setup.
Actionable but governed by invalidation levels.
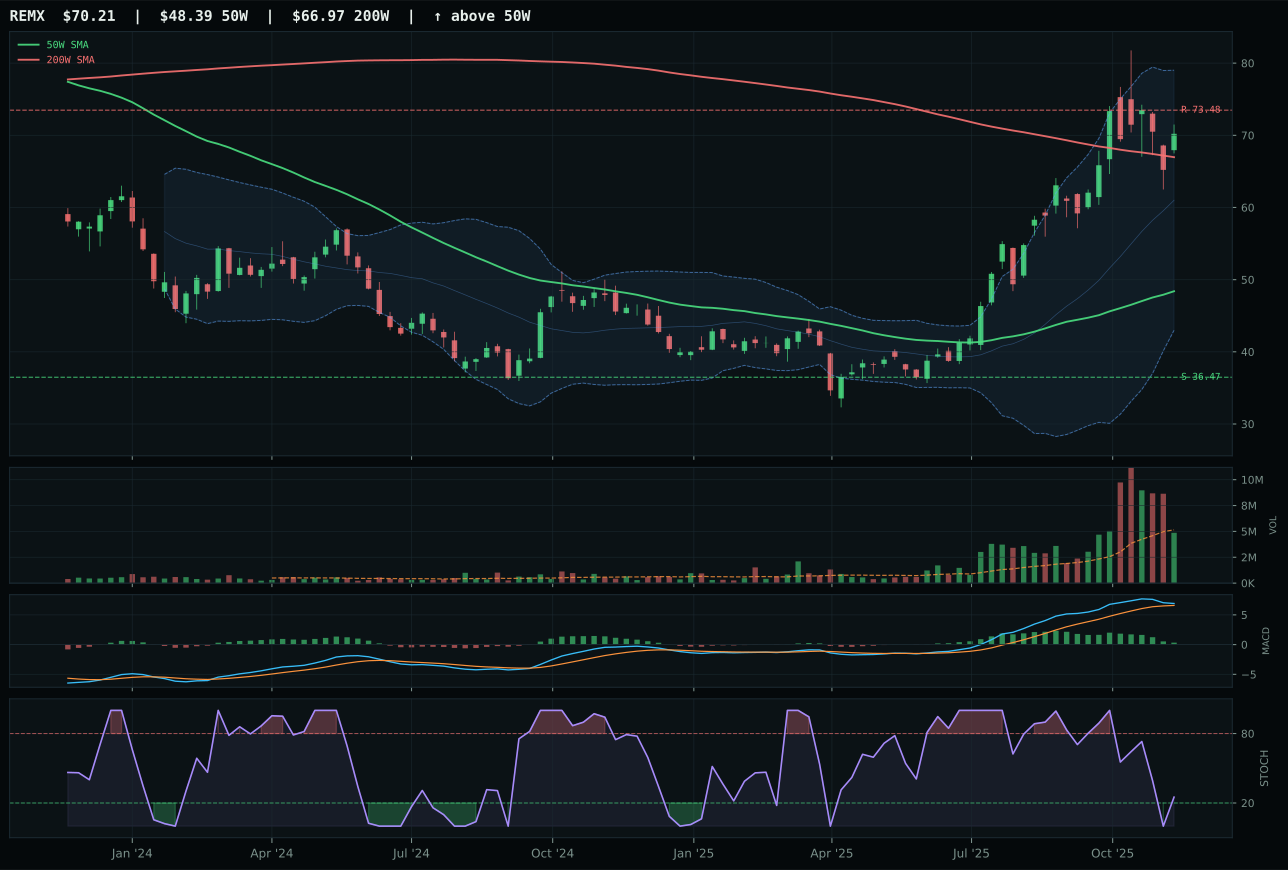
REMX has a vertical extension profile with 16.0% 13-week relative strength versus SPY.
A failed hold above support would weaken the setup.
Actionable but governed by invalidation levels.
PICK wins through superior structure and volume confirmation, carrying an 82.2/100 structure score that reflects tight Fibonacci compression, clean cleanliness at 75.0/100, and defined support at 35.70 with resistance at 46.57 near the fifty-two-week high. The 14.8% thirteen-week return and 10.4% SPY-relative strength are solid, and at 1.22x twenty-week volume, PICK demonstrates above-average institutional buying even though the MACD is bullish but flattening and stochastic RSI is falling/neutral. COPX, the runner-up, is more extended at 35.6% above the fifty-week (versus PICK's 19.4%), runs neutral volume participation, and while it delivers a higher 29.7% thirteen-week return with a perfect 100.0 momentum score, it sacrifices timing precision and structure quality. PICK's category-relative strength of −5.6% signals it is underperforming within the basket, but its cleaner technical setup and better volume-price confirmation make it the representative. The trade-off is explicit: PICK trades momentum for structural integrity.
Industrial Metals earns its 10% top-2 allocation (tied with Precious Metals at 71.4 final score) because metals scarcity is the dominant macro signal (+14 descriptor points), commodity breadth is active (+10), and real-asset sponsorship (+6) creates a powerful alignment with disinflation dynamics. The category's technical evidence is robust at 70.2/100 for the winner, and macro/narrative fit is 65.0/100—solid support for a top-2 position. PICK's volume-price confirmation at 67.2/100 and persistence at 74.1/100 prove that accumulation is genuine. The risk is that both PICK and COPX are extended into or near fifty-two-week highs with MACD flattening, meaning there is limited runway before mean-reversion risk emerges. At 10%, Industrial Metals deserves its slot alongside Precious Metals as the portfolio's real-asset rotation hedge; however, position-takers should be aware that any break below the defined support levels would invalidate both trades simultaneously. Monitor volume and MACD slope closely for early warning of momentum breakdown.
AI — SMH
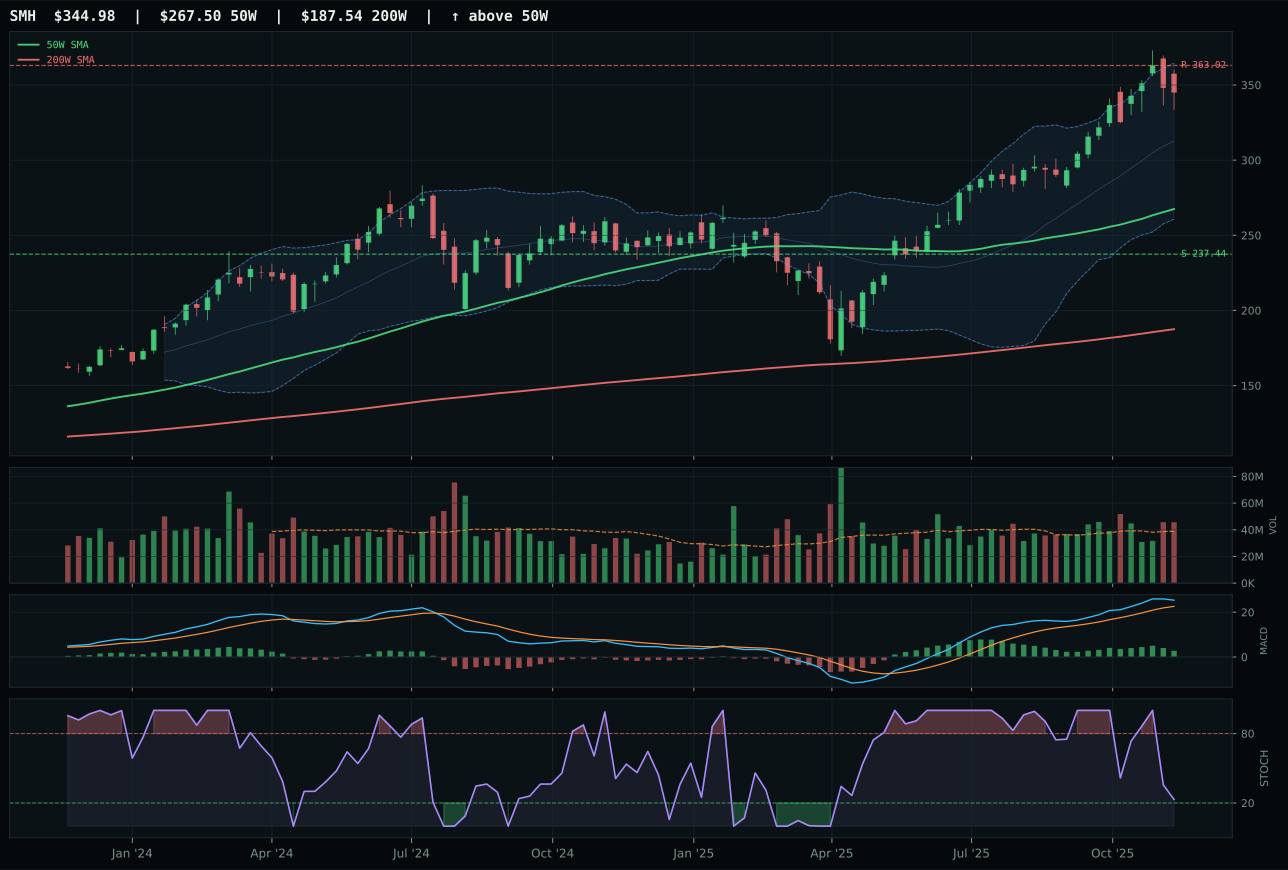
SMH has a vertical extension profile with 12.3% 13-week relative strength versus SPY.
A failed hold above support would weaken the setup.
Actionable but governed by invalidation levels.
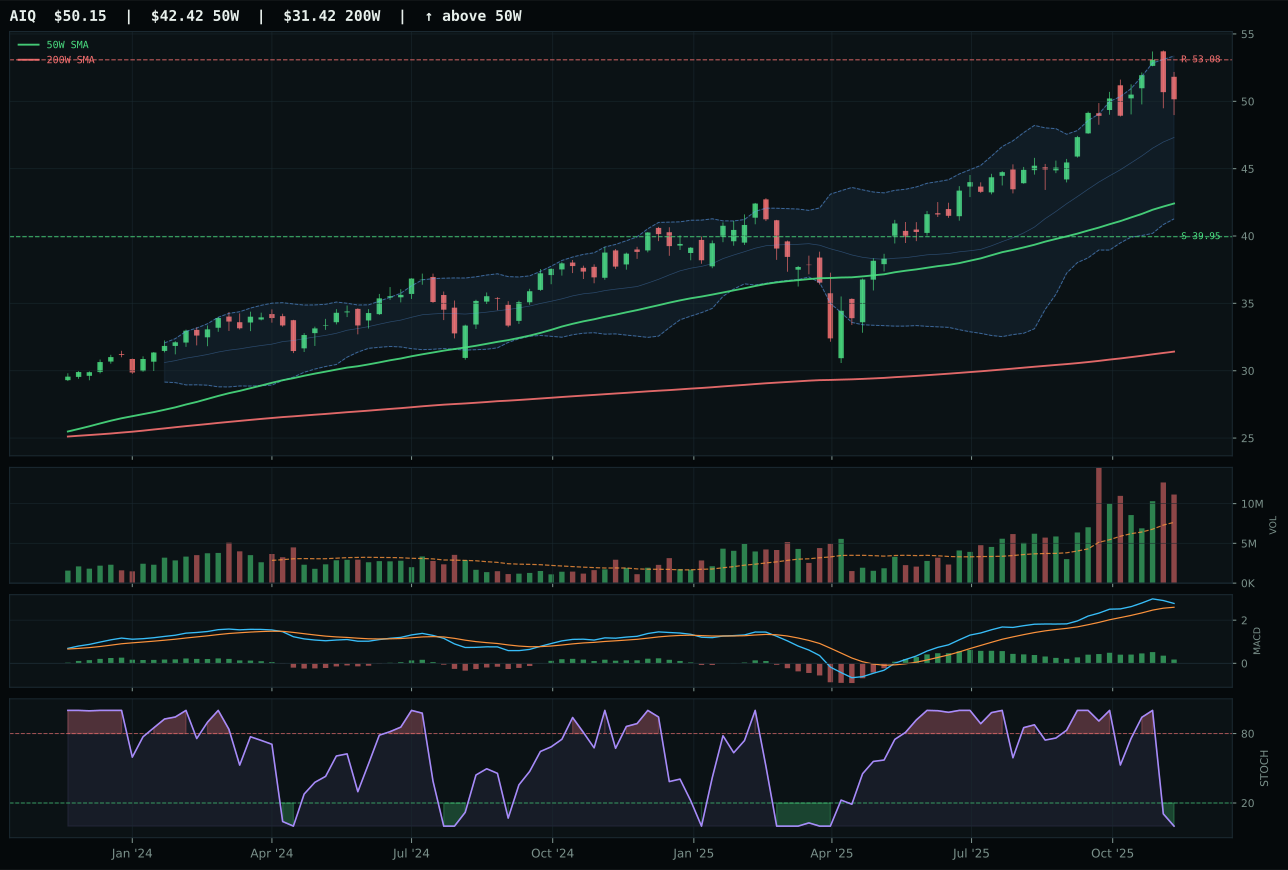
AIQ has a vertical extension profile with 6.5% 13-week relative strength versus SPY.
A failed hold above support would weaken the setup.
Actionable but governed by invalidation levels.
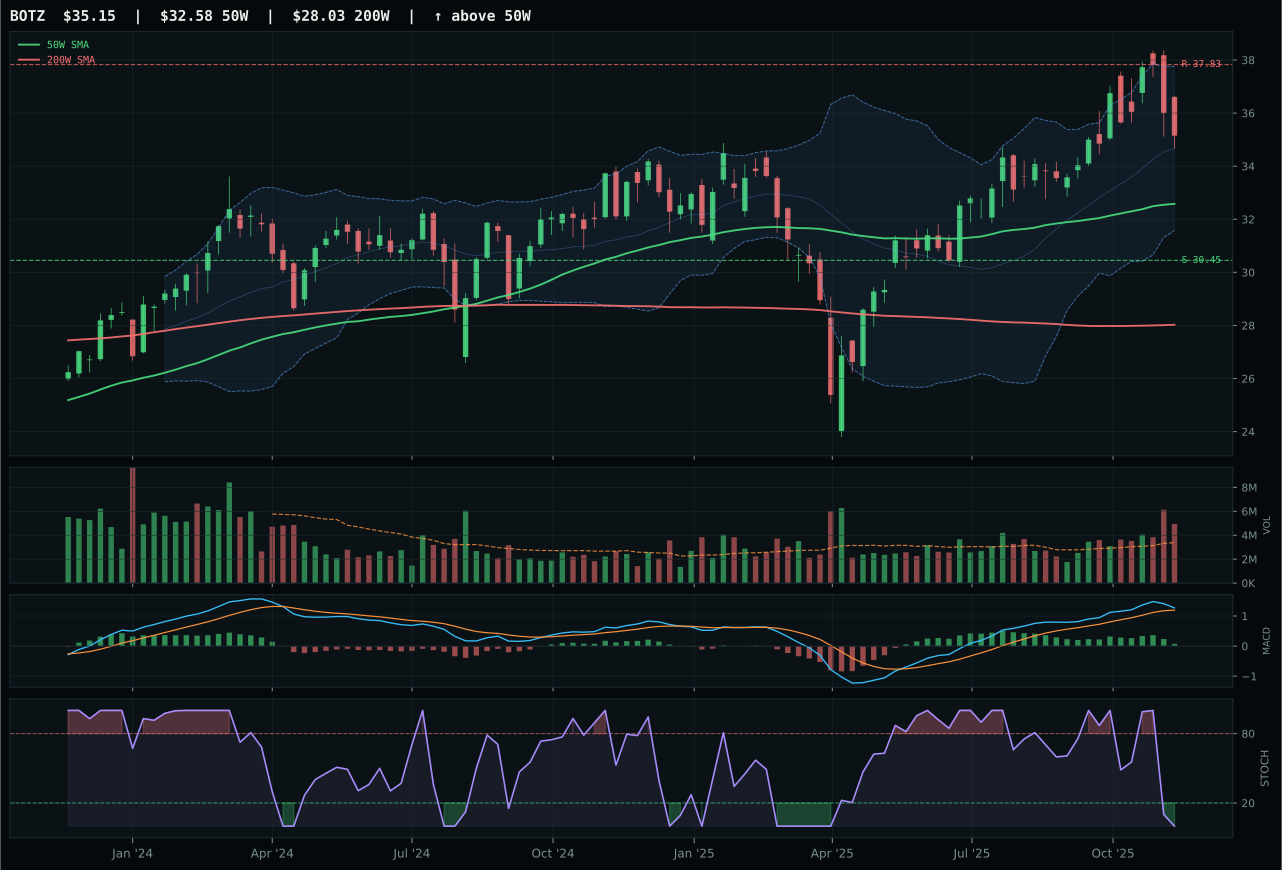
BOTZ has a neutral structure profile with -1.3% 13-week relative strength versus SPY.
A failed hold above support would weaken the setup.
Actionable but governed by invalidation levels.
SMH wins because it delivers the highest category-relative strength at 5.8% and the cleanest momentum confirmation with a perfect 100.0 momentum score driven by 16.7% thirteen-week returns and above-average volume participation at 1.17x the twenty-week average. Price is extended 29.0% above the 50W, so entry risk is material, yet the MACD bullish-but-flattening setup combined with stochastic RSI falling into neutral territory signals that late-stage buying is still being absorbed rather than rejected. AIQ, the runner-up, matches SMH's trend quality and hits a superior 70.4 technical evidence score, but loses on category-relative strength (0.0% versus 5.8%) and carries an oversold stochastic RSI reading that suggests momentum confirmation may be deteriorating. SMH's 12.3% SPY-relative strength is the true differentiator—it proves that semiconductor and AI-compute exposure is winning capital allocations, not just bouncing on oversold technicals.
AI ranks sixth with a final score of 65.6, below the top-2 threshold despite its macro alignment and technical quality. AI-growth sponsorship is active (+14 descriptor points) and risk appetite is strong (+10), yet liquidity stress (−12) and credit stress (−8) are cutting into the category's net macro support. The macro/narrative fit of 59.0/100 is respectable, but technical evidence at the category level does not exceed the precious-metals or industrial-metals baskets, which are both more extended and better-positioned for real-asset rotation. SMH sits at a vertical extension with negative upside/resistance of −5.0%, meaning buyers face a near-term risk if the setup fails to hold. For AI to reclaim top-2 status, either the category would need MACD to firm and breadth to expand, or macro conditions would need to shift in a way that liquidates the precious-metals and industrial-metals gains. At 5%, it remains a core holding because the technical setup is sound and AI sponsorship is real, but the timing risk is too high for overweight exposure.
Traditional Energy — XLE
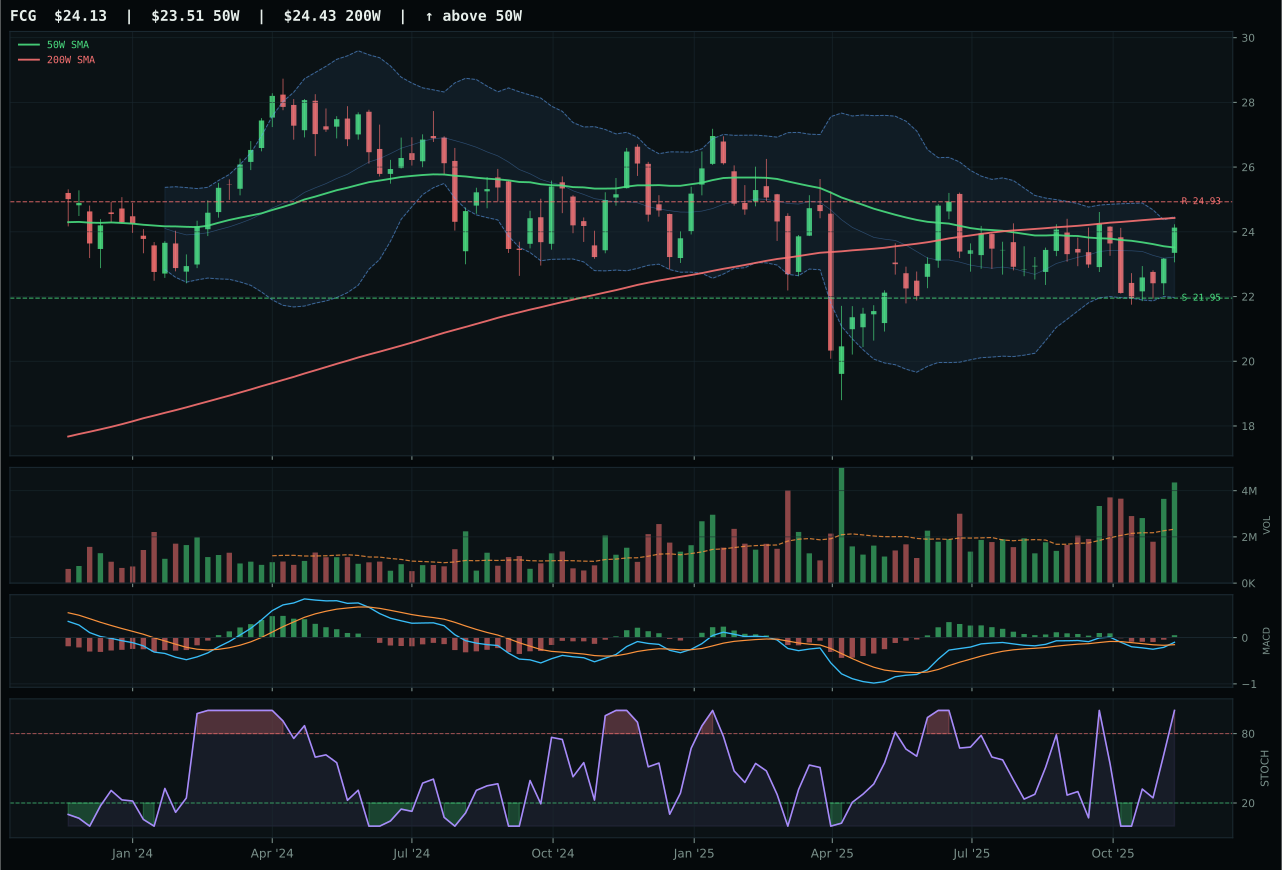
FCG has a compression near 50W profile with 0.7% 13-week relative strength versus SPY.
A failed hold above support would weaken the setup.
Actionable but governed by invalidation levels.
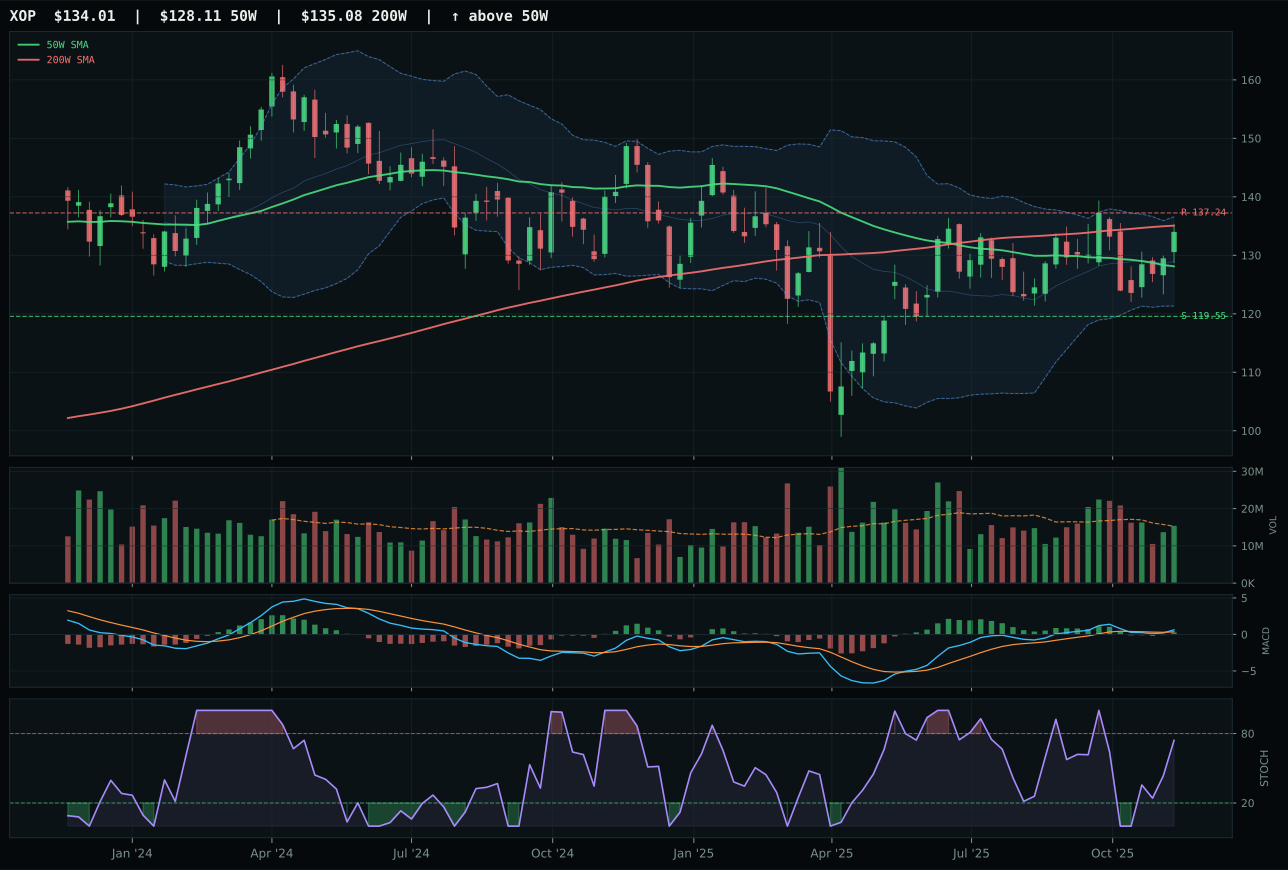
XOP has a neutral structure profile with 3.2% 13-week relative strength versus SPY.
A failed hold above support would weaken the setup.
Actionable but governed by invalidation levels.
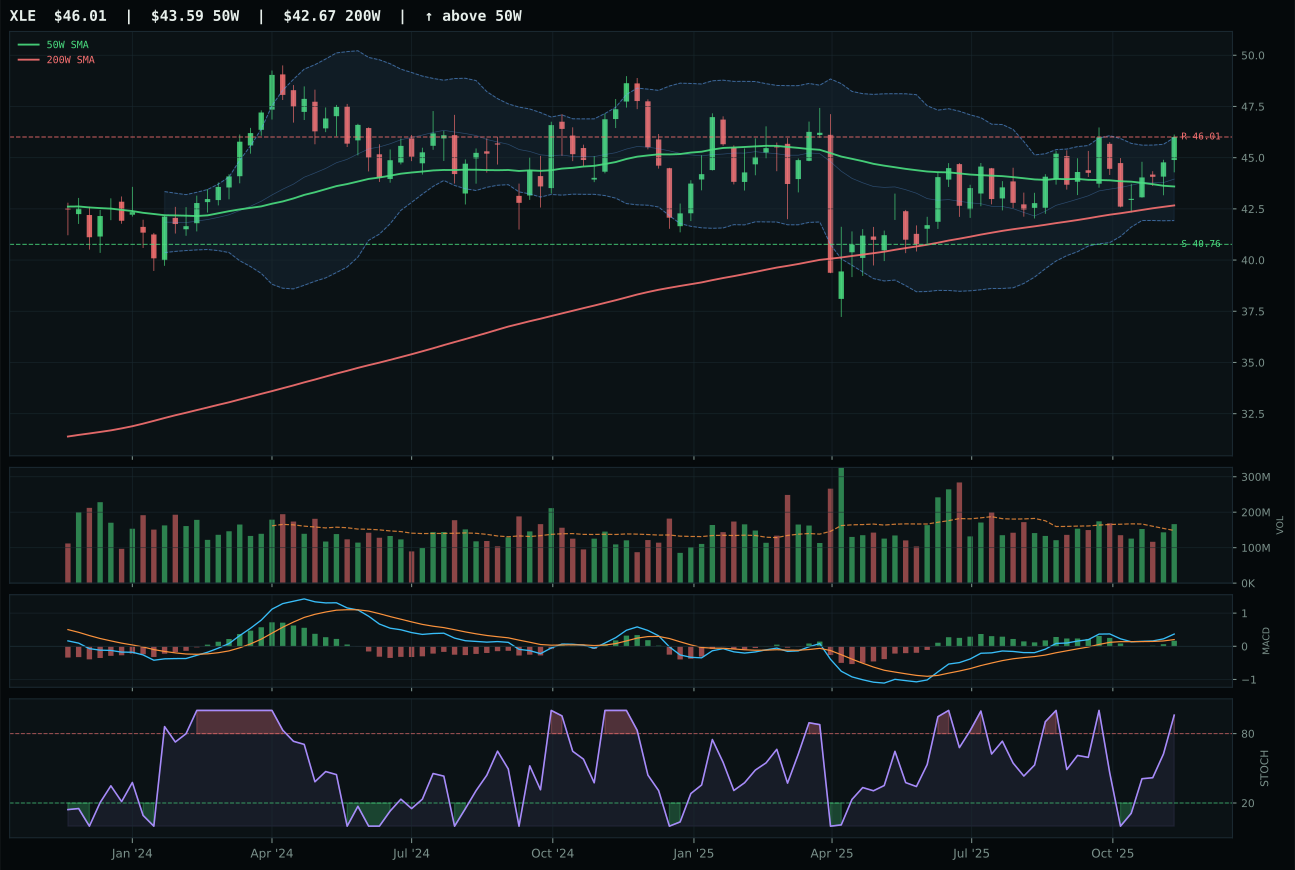
XLE has a neutral structure profile with 3.1% 13-week relative strength versus SPY.
A failed hold above support would weaken the setup.
Actionable but governed by invalidation levels.
XLE wins a tight category race because it balances trend strength (94.7/100) with timing discipline, sitting only 5.5% above the fifty-week moving average—a much tighter entry than peers—while still maintaining bullish MACD momentum (improving, not flattening) and above-average volume at 1.12x the twenty-week average. The thirteen-week return of 7.6% is modest, but category-relative strength at 0.0% shows XLE is neither leading nor lagging, suggesting balanced internal support. Stochastic RSI is overbought momentum at 0.96, which is a late-stage signal, but the setup's proximity to the moving average and improving MACD give it more credibility than extended peers. FCG, the runner-up, scores higher on technical evidence (89.1 versus 85.8) and timing (100 versus 75) due to compression near the fifty-week, but it surrenders category-relative strength (−2.4% versus 0.0%) and structure quality (77.1 versus 79.6), suggesting it lacks the internal accumulation breadth that XLE captures. XLE's neutral structure and solid volume confirmation edge it out in a category where cleanliness matters.
Traditional Energy earns 5% tier-2 allocation despite a middling 61.0 final category score because energy scarcity is explicitly active (+14 descriptor points) and real-asset sponsorship (+7) provides genuine macro support. However, the category's macro/narrative fit is weak at 39.0/100 because disinflation pressure (−10) and disinflation itself (−10) are working against cyclical energy demand. XLE's excellent technical evidence of 85.8/100 is carrying the category's allocation case; without that technical strength, Traditional Energy would rank much lower. The tension is real: energy scarcity is a structural supply story, but disinflation cools demand and timing risk is high with stochastic RSI overbought across the entire basket. To upgrade Energy to top-2, either energy would need to prove that supply constraints override demand concerns (stronger pricing and margin data), or macro conditions would need to shift toward inflation expectations. At 5%, this is a real-asset sleeve with macro support but not the same quality of tailwind as precious or industrial metals. Use this position as a hedge to commodity rotation rather than a core growth bet.
Emerging Markets — ILF
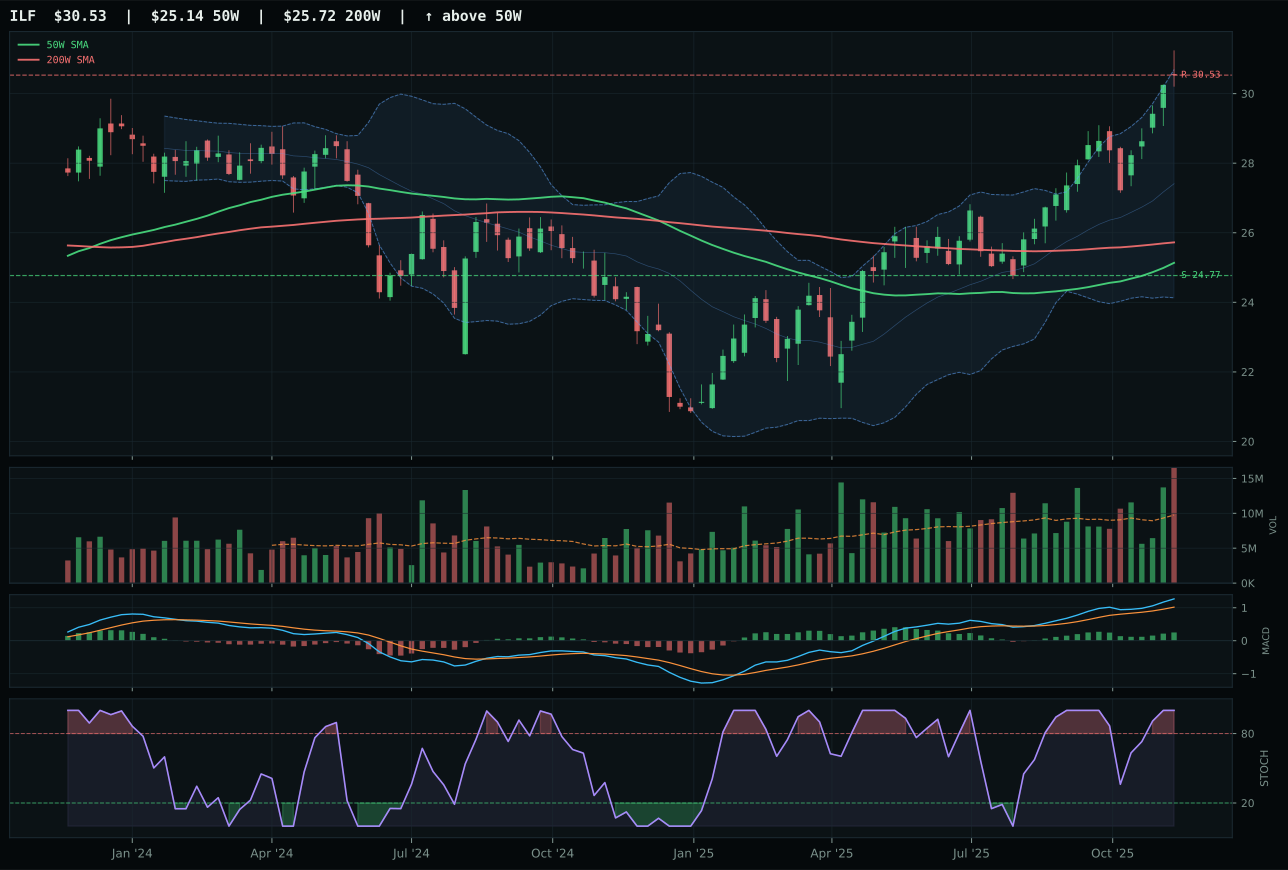
ILF has a vertical extension profile with 12.5% 13-week relative strength versus SPY.
A failed hold above support would weaken the setup.
Actionable but governed by invalidation levels.
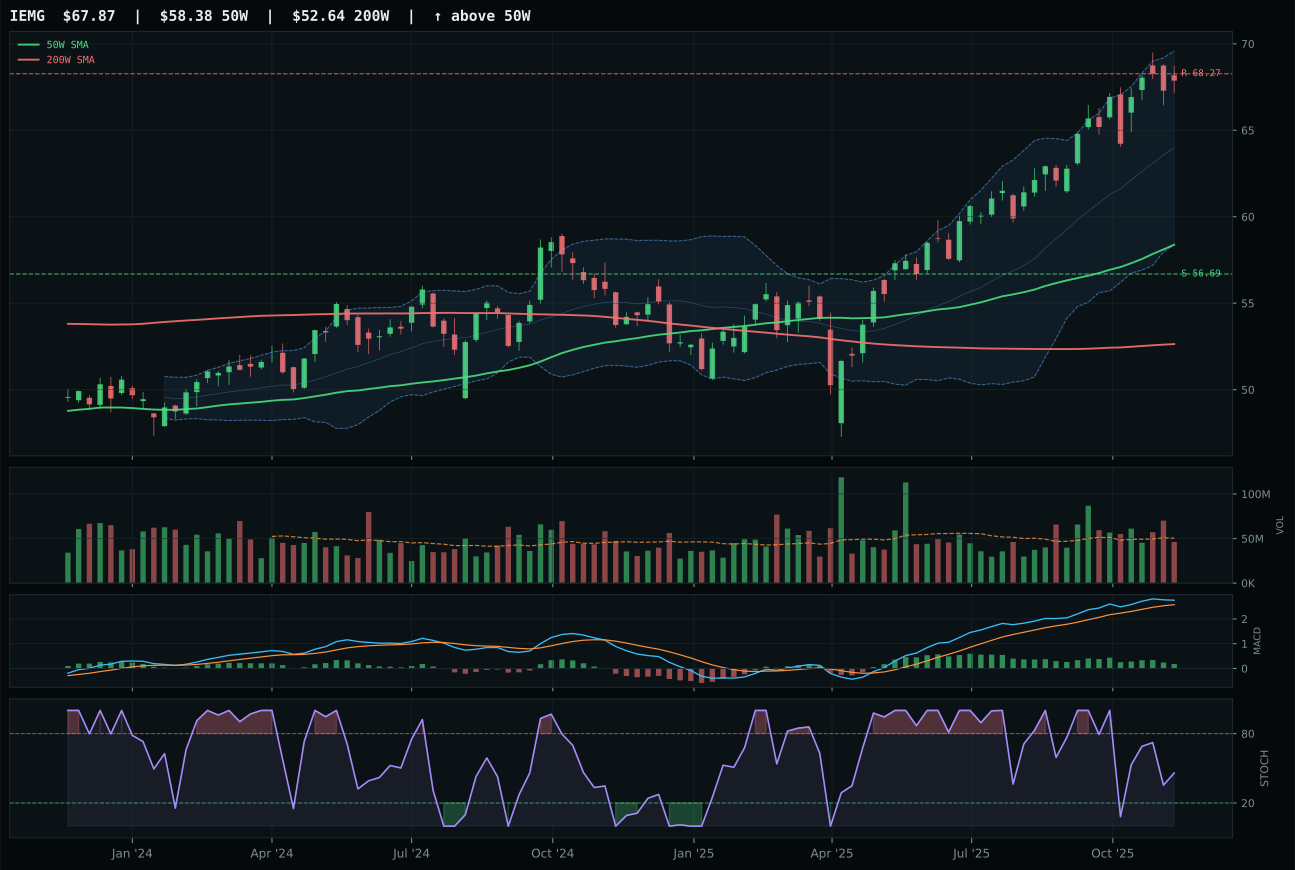
IEMG has a vertical extension profile with 4.8% 13-week relative strength versus SPY.
A failed hold above support would weaken the setup.
Actionable but governed by invalidation levels.
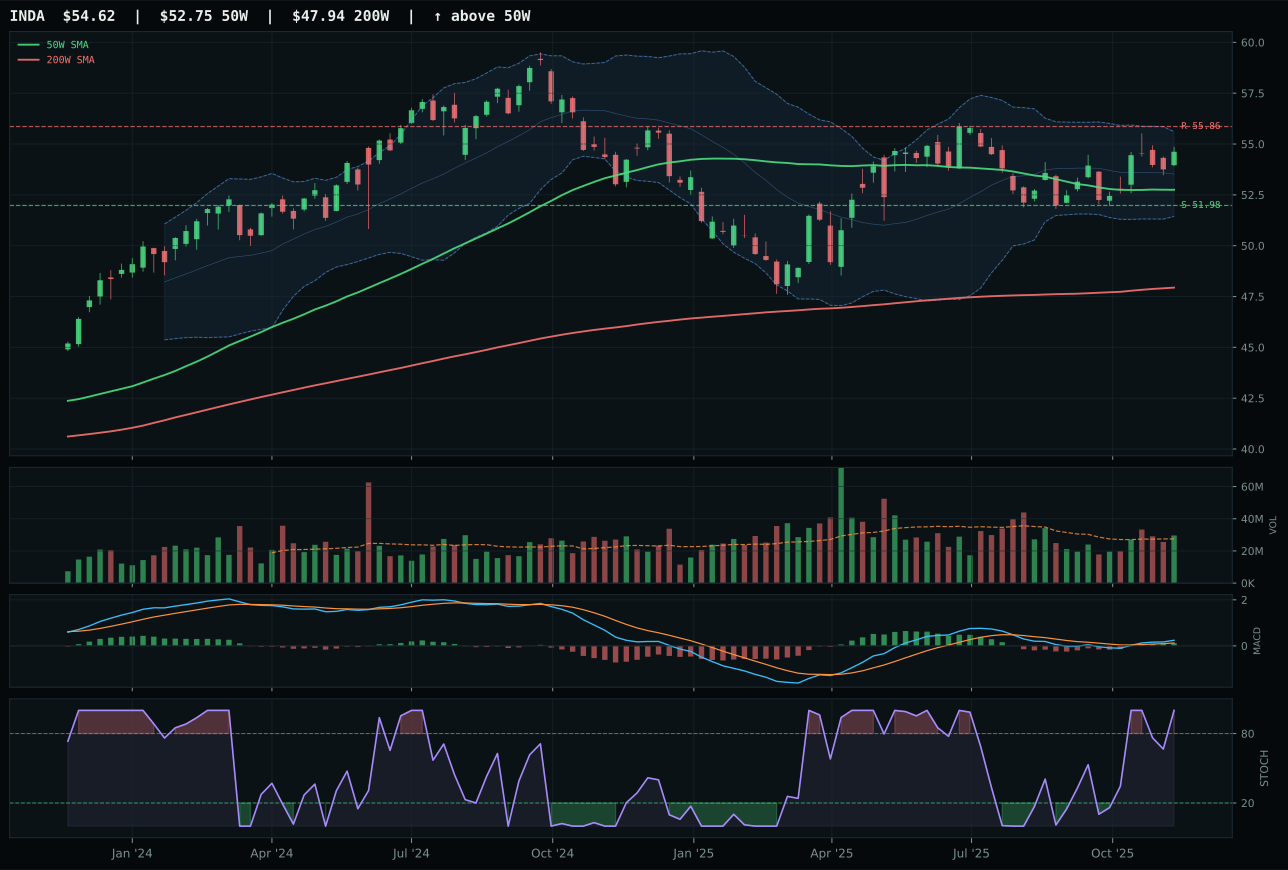
INDA has a neutral structure profile with -0.8% 13-week relative strength versus SPY.
A failed hold above support would weaken the setup.
Actionable but governed by invalidation levels.
ILF wins decisively because it delivers a perfect 100.0 momentum confirmation score powered by 16.9% thirteen-week returns, 12.5% SPY-relative strength, and 7.6% category-relative leadership combined with accumulation-level volume participation at 1.93x the twenty-week average—the highest volume participation in the entire portfolio. Structure is pristine at 88.7/100 with tight Fibonacci compression and clean price action, and MACD is bullish and improving (not flattening), signaling momentum persistence rather than deterioration. The setup is extended 21.5% above the fifty-week moving average, but the combination of positive MACD slope, accumulation volume, and perfect momentum confirmation overcomes timing risk. IEMG, the runner-up, carries a much weaker risk/reward (37.5 versus 48.2), bearish-but-flattening MACD, and neutral volume, suggesting that broad emerging-market exposure is being rotated away from in favor of the Latin America commodity and value concentration that ILF represents.
Emerging Markets ranks fifth with a 55.4 final score and earns 5% tier-2 allocation primarily on ILF's exceptional technical quality, not on macro strength. The category's macro/narrative fit is weak at 38.0/100 because risk-appetite support (+8) is offset by credit stress (−10) and liquidity stress (−10)—the same liquidity headwinds dragging down broader risk assets. ILF's 100.0/100 technical evidence is extraordinary and drives the allocation case single-handedly; without that technical firepower, Emerging Markets would rank below tier-2. The macro story here is that commodity breadth and metals scarcity are providing regional tailwinds to Latin America, but the global emerging-market category remains under pressure from carry-trade unwind and liquidity concerns. At 5%, this is a thematic hedge to U.S. tech leadership and a real-asset play, not a macro growth bet. To upgrade to top-2, either Emerging Markets would need to prove that EM central banks are tightening cycles behind the Fed (improving carry appeal), or accumulation volume would need to expand beyond ILF into the broader basket. Right now, it is a single-name technical trade wearing an EM label.
Utilities & Infrastructure — IGF
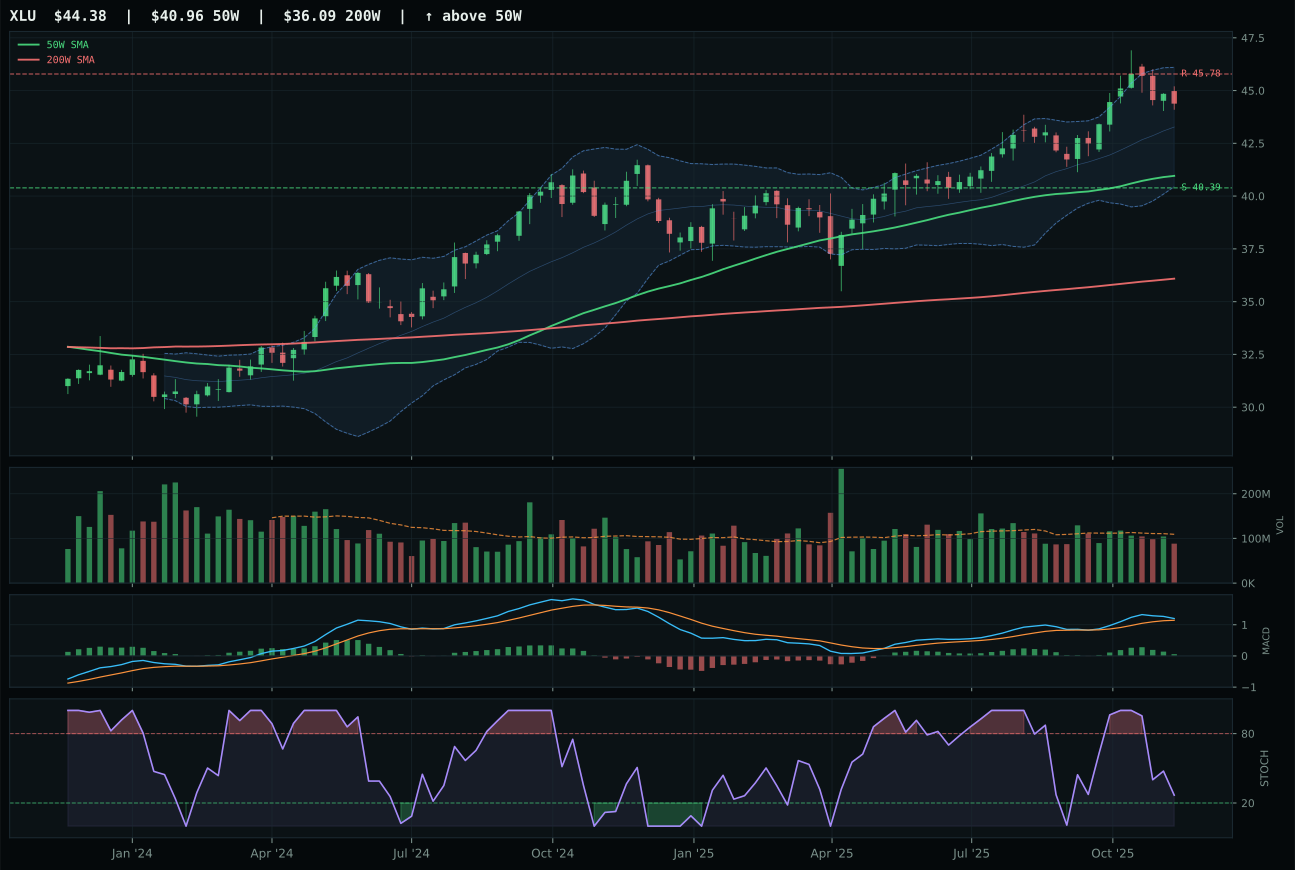
XLU has a neutral structure profile with -0.8% 13-week relative strength versus SPY.
A failed hold above support would weaken the setup.
Actionable but governed by invalidation levels.
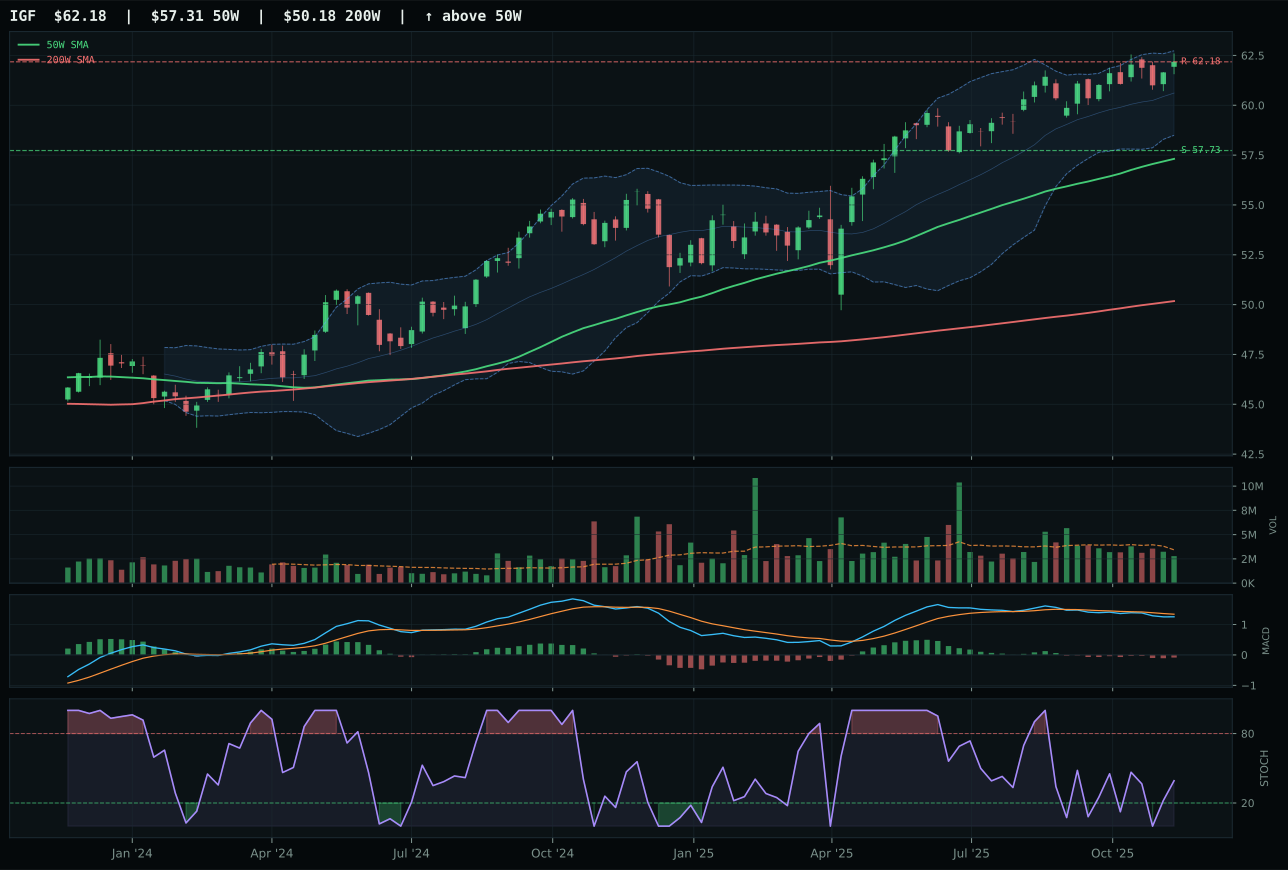
IGF has a neutral structure profile with -2.5% 13-week relative strength versus SPY.
A failed hold above support would weaken the setup.
Actionable but governed by invalidation levels.
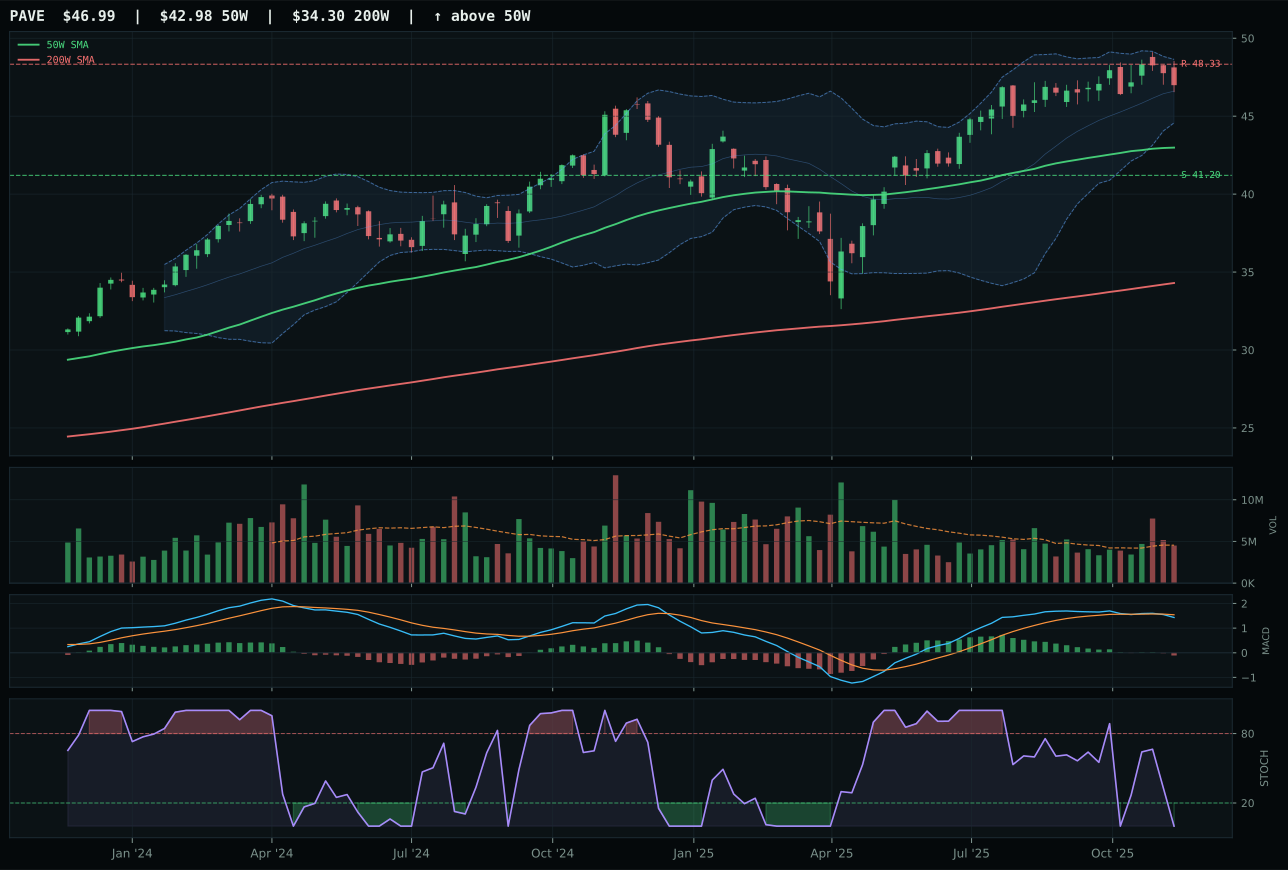
PAVE has a neutral structure profile with -2.3% 13-week relative strength versus SPY.
A failed hold above support would weaken the setup.
Actionable but governed by invalidation levels.
IGF wins a weak category because it offers the tightest timing entry at only 8.5% above the fifty-week moving average and delivers the best timing score at 78.0/100 despite being the structural loser in the basket. Price sits near the fifty-two-week high with neutral structure and neutral volume, so the win rests on IGF offering a defined technical level (support at 57.73) with the best risk/reward relative to its peers—55.7/100 versus 50.6/100 for XLU. The thirteen-week return of 1.9% and −2.5% SPY-relative strength reveal no accumulation breadth inside this category, and MACD is bearish/weakening throughout, signaling deteriorating momentum. XLU, the runner-up, has a stronger 95.0 trend score and 56 momentum confirmation, but carries looser timing (70.0 versus 78.0) and weaker risk/reward (50.6 versus 55.7), making it the less efficient entry point despite superior directional conviction. This is a category where all three ETFs are fighting headwinds, and IGF's superior entry discipline separates it marginally.
Utilities & Infrastructure earns 5% tier-2 allocation at a 49.9 final score because disinflation pressure (+6) and the broader disinflation regime (+7) provide genuine macro support for defensive, income-yielding assets—a macro tailwind that offsets the category's weak technical picture. However, the category's 62.0/100 macro/narrative fit is solid but not exceptional, and IGF's 42.8/100 technical evidence is genuinely poor. The allocation case rests on macro regime alignment: utilities and infrastructure assets deliver yield and inflation hedging in a disinflation environment, even if near-term technicals are deteriorating. The risk is that both IGF and XLU show negative momentum confirmation and MACD weakness, meaning that if disinflation expectations shift or rate-cut expectations reverse, both would suffer sharp drawdowns. At 5%, this is a defensive sleeve meant to provide income stability and duration protection, not capital appreciation. Monitor disinflation expectations and Fed rhetoric closely; any shift toward sustained higher-for-longer rates would trigger an immediate downgrade to 0%. This is the lowest-conviction tier-2 allocation.
Technology — XLK
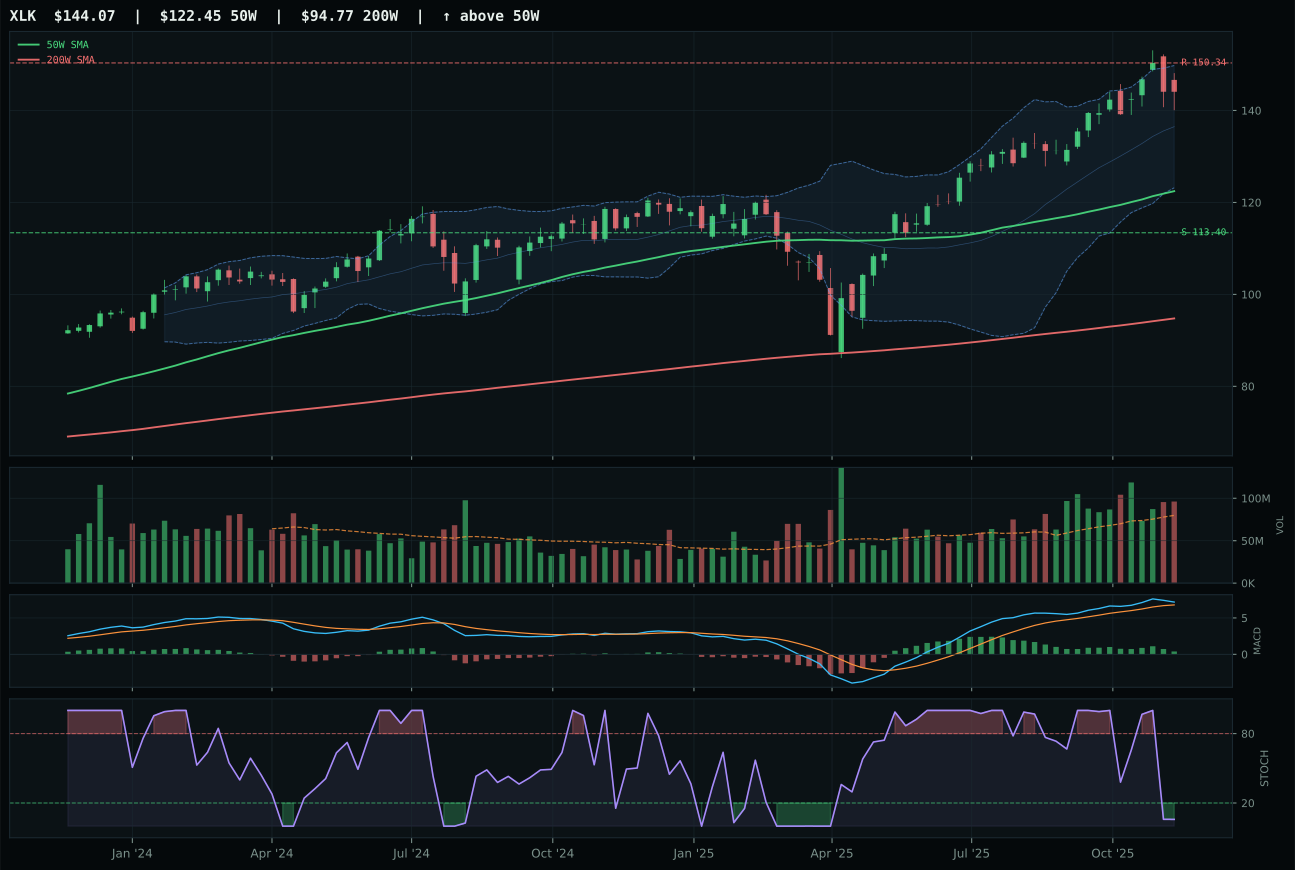
XLK has a vertical extension profile with 4.0% 13-week relative strength versus SPY.
A failed hold above support would weaken the setup.
Actionable but governed by invalidation levels.
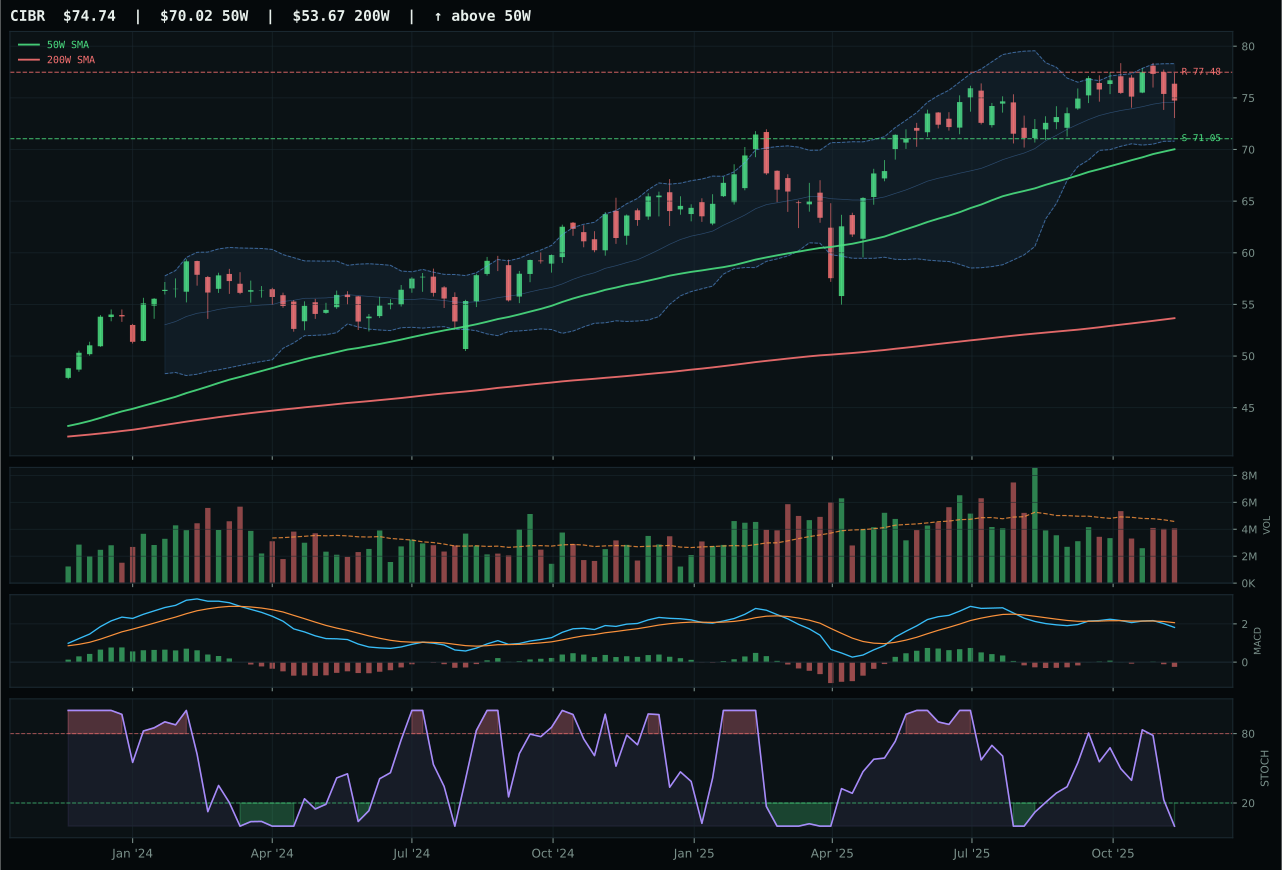
CIBR has a neutral structure profile with -0.6% 13-week relative strength versus SPY.
A failed hold above support would weaken the setup.
Actionable but governed by invalidation levels.
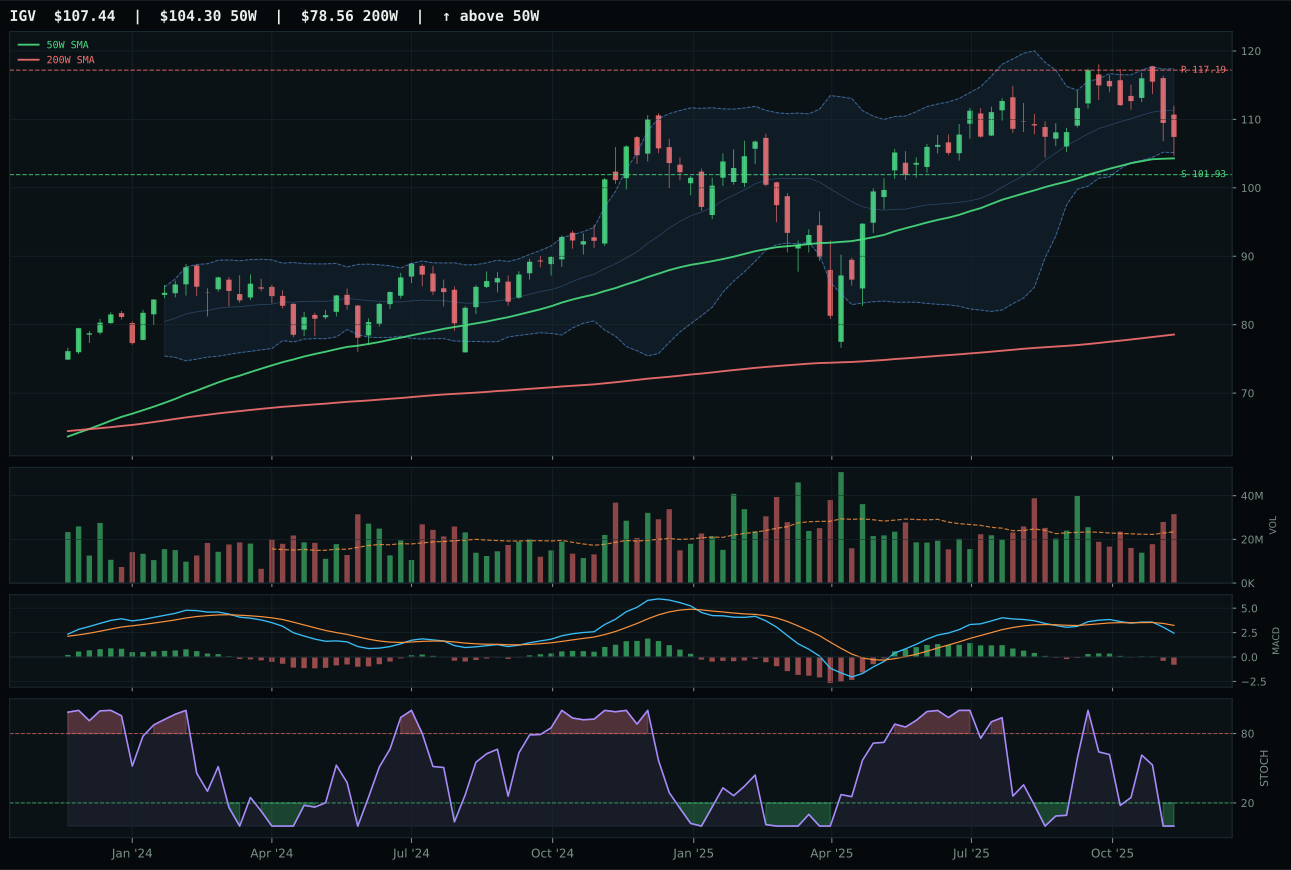
IGV has a neutral structure profile with -6.0% 13-week relative strength versus SPY.
A failed hold above support would weaken the setup.
Actionable but governed by invalidation levels.
XLK wins the category because it commands clear relative strength inside its three-ETF basket—a 4.6% edge over the median—while holding price above both the 50W and 200W with a stable 0.4% slope. The 8.4% thirteen-week return and 4.0% SPY-relative strength tell you that profitable technology leadership is being accumulated, not sold into strength; volume at 1.20x the twenty-week average confirms sponsorship. CIBR, the runner-up, stumbles on MACD weakness (bearish/weakening versus bullish but flattening), neutral volume participation, and a flat 0.0% category-relative strength that signals no accumulation breadth inside the cohort. XLK's vertical extension setup is penalized 17.7% above the 50W, but the combination of above-average volume, bullish momentum structure, and internal category leadership outweighs entry timing risk.
Technology earns its 5% tier-2 allocation despite a below-median category score of 48.0, ranked fifth among ten categories this week. The macro regime of disinflation and active risk-appetite sponsorship (+9 descriptor points) provide genuine tailwinds, yet liquidity stress (−10) and credit stress (−6) are dragging the category lower relative to commodity and precious-metal setups that benefit more directly from monetary-hedge dynamics. XLK's technical evidence is strong at 73.6/100, but macro/narrative fit only reaches 48.0/100—a structural problem given disinflation's mixed signal for discretionary software and services. For Technology to move into top-2 consideration, MACD confirmation would need to firm across the basket, volume participation would need to accelerate above 1.30x, and the category's SPY-relative strength would need to turn decisively positive. Right now it is a hold at 5% because technical quality is real but the macro tailwind is insufficient to justify a larger sleeve.
Nuclear Energy — URNM
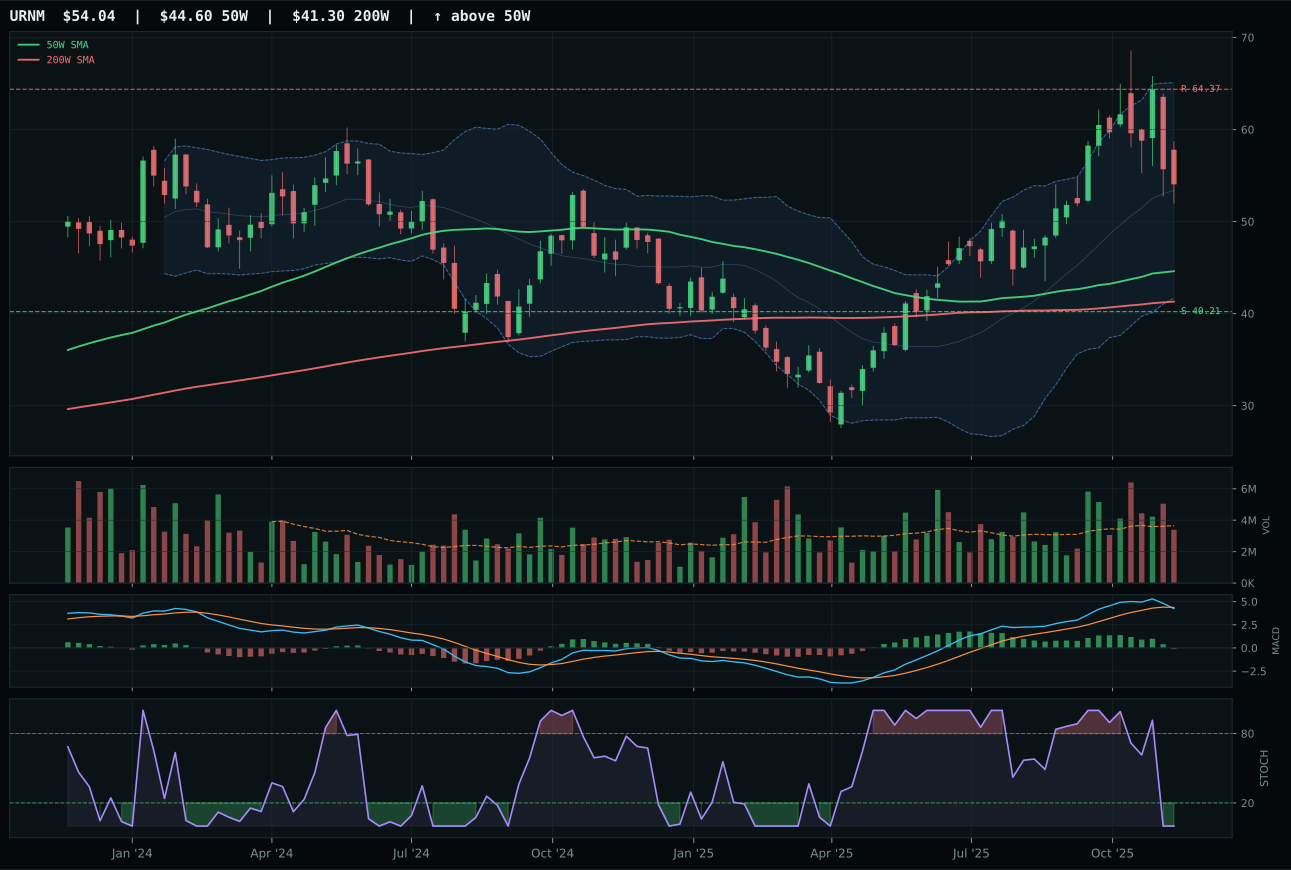
URNM has a vertical extension profile with 9.8% 13-week relative strength versus SPY.
A failed hold above support would weaken the setup.
Actionable but governed by invalidation levels.
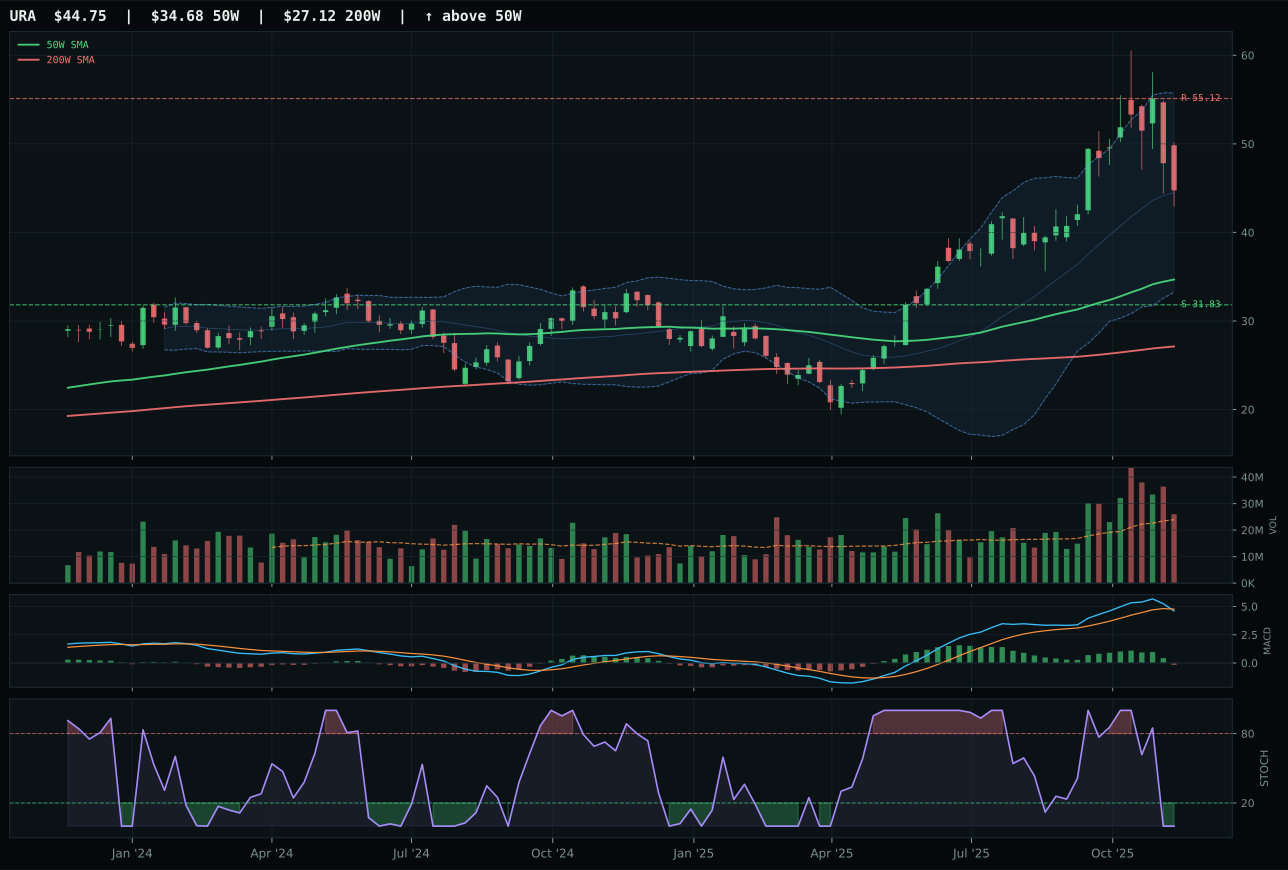
URA has a vertical extension profile with 10.3% 13-week relative strength versus SPY.
A failed hold above support would weaken the setup.
Actionable but governed by invalidation levels.
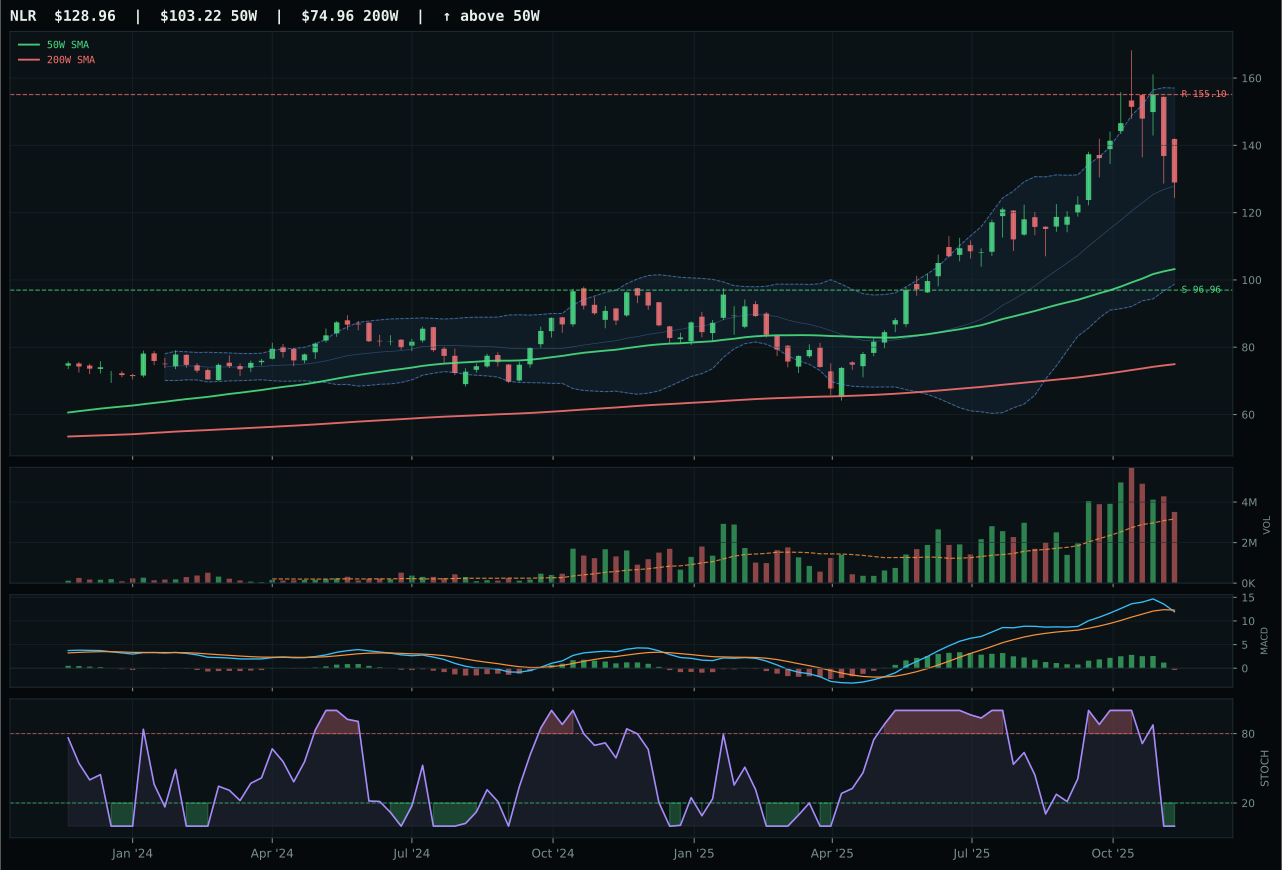
NLR has a vertical extension profile with 7.0% 13-week relative strength versus SPY.
A failed hold above support would weaken the setup.
Actionable but governed by invalidation levels.
URNM wins despite weak technical evidence because it commands the category-relative strength at 0.0% (tied with peers on pure category metrics) while delivering the best overall trend score at 92.0/100 and the highest composite momentum at 48.8/100. Price sits 21.2% above the fifty-week moving average with MACD bearish/weakening and stochastic RSI oversold at 0.00—classic late-stage extension risk—but the nine-point spread between URNM and URA in final reasoned ETF scores means URNM's trend durability is slightly superior. URA is more extended at 29.0% above the fifty-week, which immediately disqualifies it from the tighter-entry preference. The trade setup here is purely macro-driven: energy scarcity sponsorship and real-asset tailwinds are keeping the basket afloat despite deteriorating technical momentum. URNM wins only because it offers the least-extended entry point into a fundamentally challenged technical picture.
Nuclear Energy earns 5% tier-2 allocation despite weak technical evidence (29.4/100 for the winner) because energy scarcity (+8 descriptor points), real-asset sponsorship (+7), and risk-appetite support (+5) are active in the macro regime. However, the category's 59.0/100 macro/narrative fit is not as strong as precious or industrial metals, and the technical picture is genuinely stressed—MACD is bearish/weakening across the basket, stochastic RSI is oversold, and volume is neutral throughout. URNM's 13.2-point lead in reasoned ETF score over URA is narrow enough that a single adverse technical signal could reverse the leadership. At 5%, this is a speculative real-asset position, not a structural holding. The allocation rests entirely on the macro thesis that energy scarcity will drive uranium demand regardless of near-term technical deterioration. If MACD turns bullish or volume explodes above 1.20x, upgrade the conviction; if URNM closes below the 40.21 support level on heavy volume, downgrade to 0% immediately. This is the riskiest tier-2 allocation this week.
Defense & Aerospace — ITA
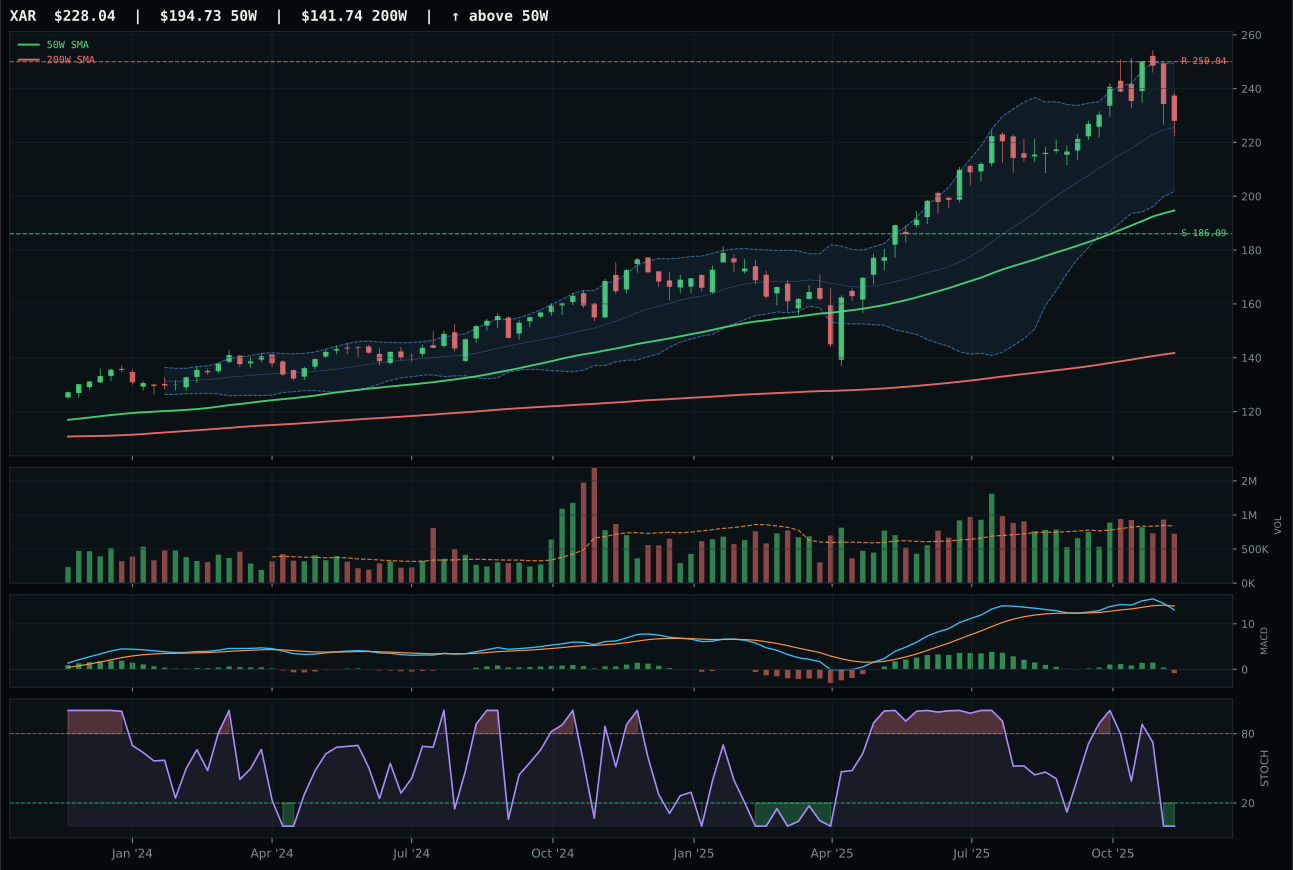
XAR has a vertical extension profile with 1.4% 13-week relative strength versus SPY.
A failed hold above support would weaken the setup.
Actionable but governed by invalidation levels.
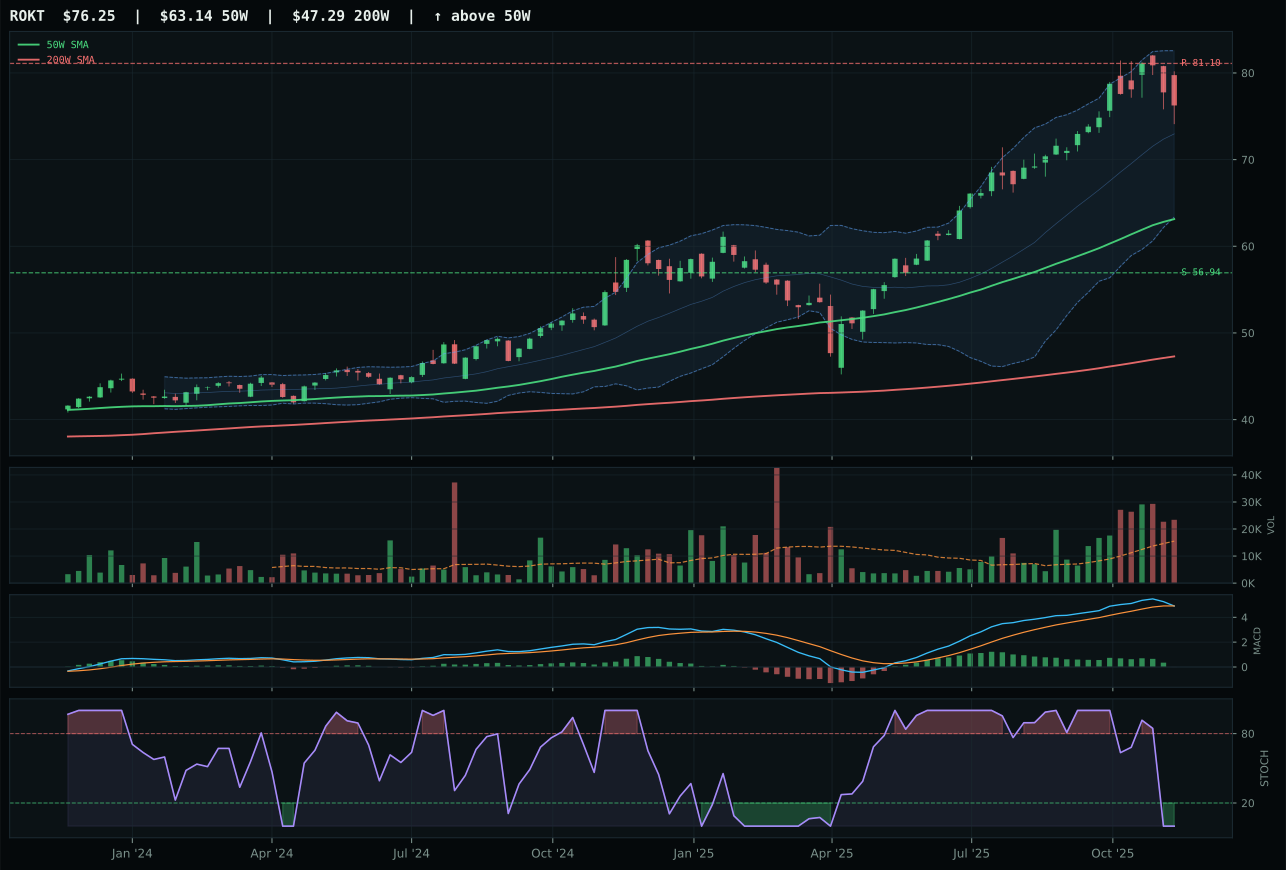
ROKT has a vertical extension profile with 5.7% 13-week relative strength versus SPY.
A failed hold above support would weaken the setup.
Tracked, but not top-2 eligible because: .
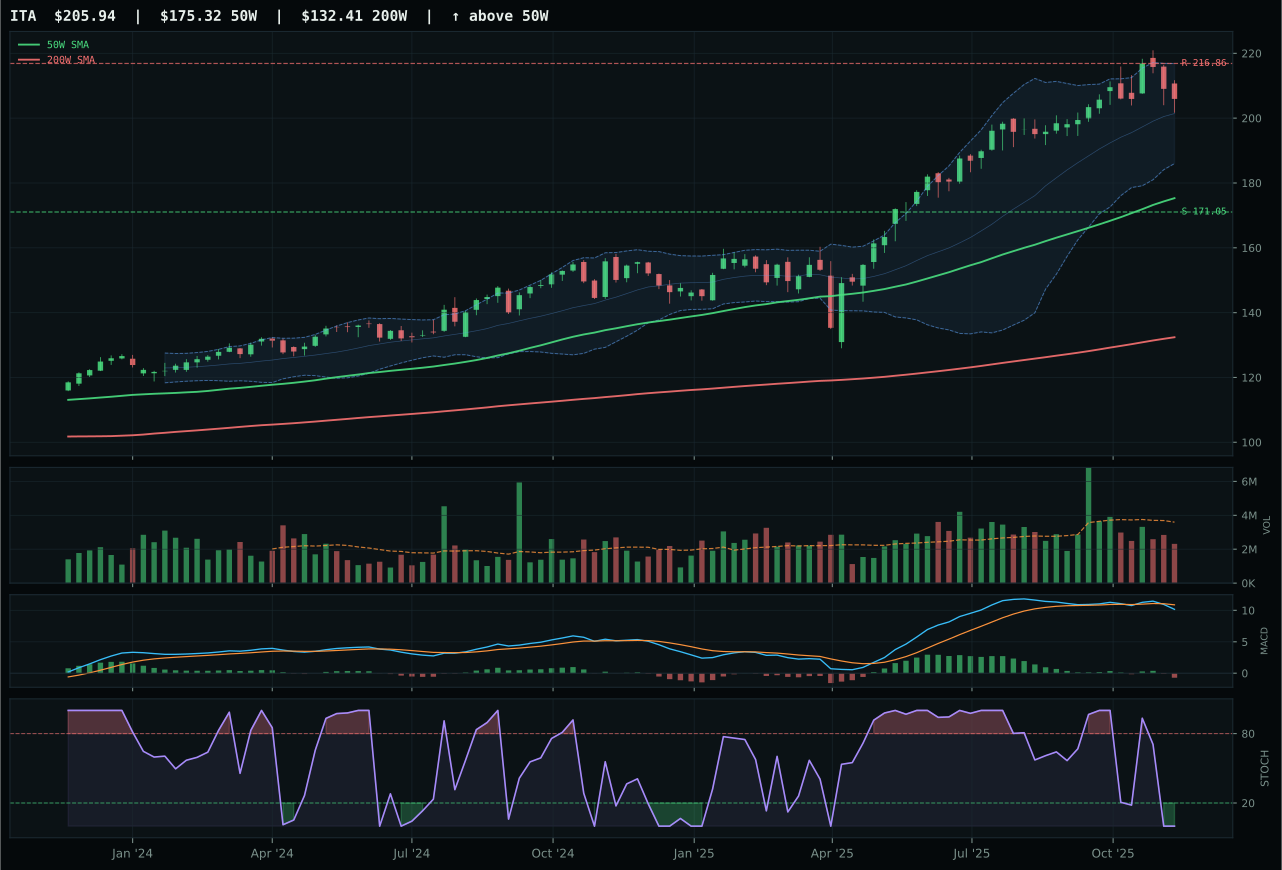
ITA has a vertical extension profile with 1.1% 13-week relative strength versus SPY.
A failed hold above support would weaken the setup.
Actionable but governed by invalidation levels.
ITA wins a weak category contest because it holds price above both the fifty and two-hundred week averages and captures a 1.1% SPY-relative edge, even though MACD is bearish/weakening and volume is thin at 0.64x the twenty-week average—a red flag. The thirteen-week return of 5.6% is modest, and category-relative strength sits at −0.2%, meaning ITA is neither leading nor being deserted inside its own basket. XAR, the nearest competitor, offers a similar technical profile with 1.4% SPY-relative strength and neutral volume, but ITA's total blend of trend, structure, and risk/reward edges it out by 0.6 points. Neither setup is clean: both feature vertical extension at roughly seventeen to eighteen percent above the fifty-week moving average with MACD deterioration and oversold stochastic RSI. This is a category where all three ETFs are fighting headwinds, and picking the winner is an exercise in choosing the least-damaged option.
Defense & Aerospace earned 0% allocation this week, ranked ninth or tenth, because its final score of 38.5 falls far below the tier-2 threshold and reflects a category under genuine stress. Liquidity stress (−4) and the absence of real-asset or disinflation-hedge sponsorship create a structural disadvantage in the current macro regime. The category-level technical evidence is weak at 28.9/100 for the winner, and macro fit is neutral-to-negative despite credit stress being slightly positive (+2). For this category to earn a 5% sleeve, ITA would need to break above 46.57 resistance cleanly with MACD confirmation, volume would need to expand to 1.20x or higher, and the broader defense narrative would need to find a sponsor in the current regime—either fiscal stimulus concerns, geopolitical escalation, or a shift away from AI-growth leadership. None of those conditions are present; instead, liquidity concerns are weighing on cyclical discretionary sectors. Exclude Defense & Aerospace until the technical setup improves materially or macro conditions shift.
Agriculture & Livestock — MOO
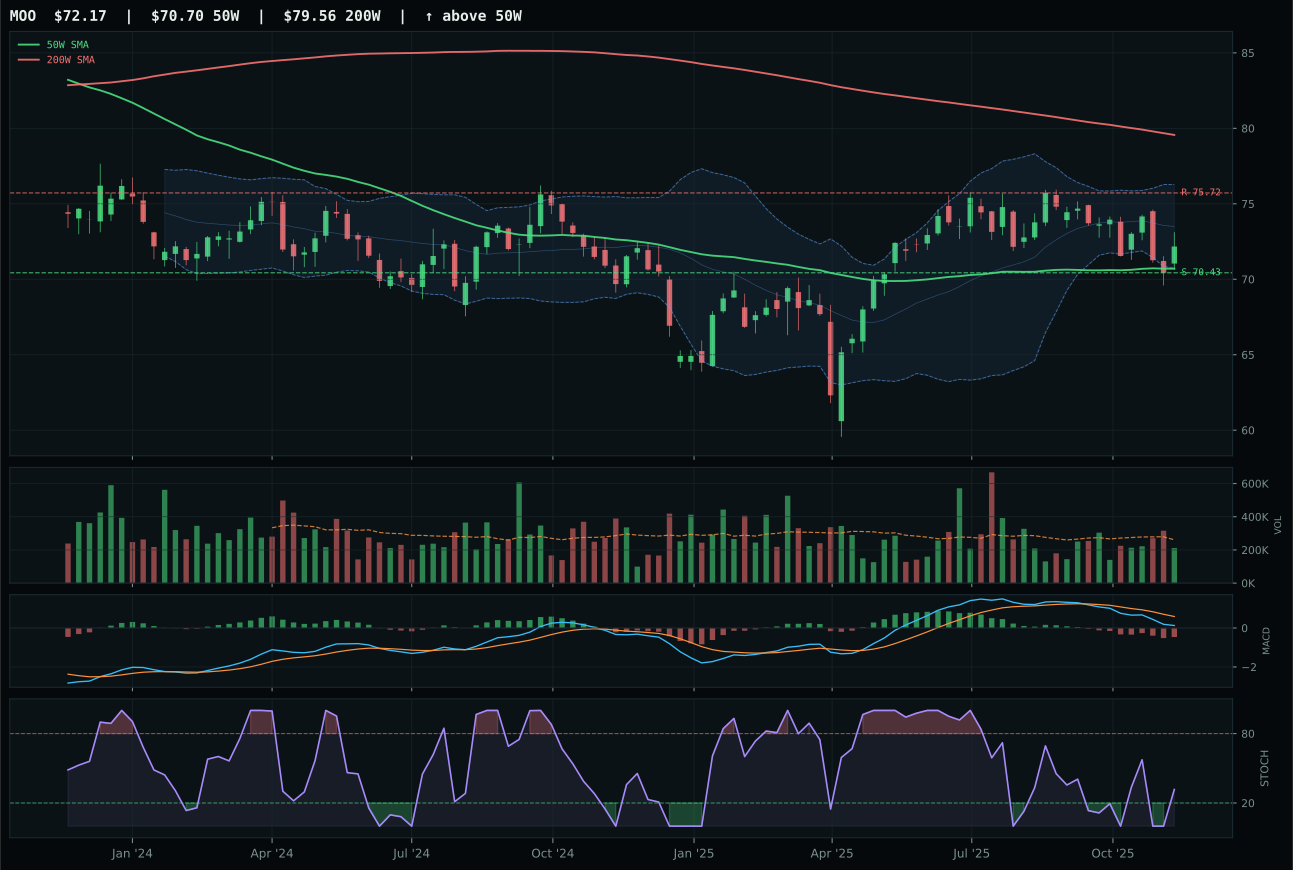
MOO has a pullback into support profile with -6.6% 13-week relative strength versus SPY.
A failed hold above support would weaken the setup.
Actionable but governed by invalidation levels.
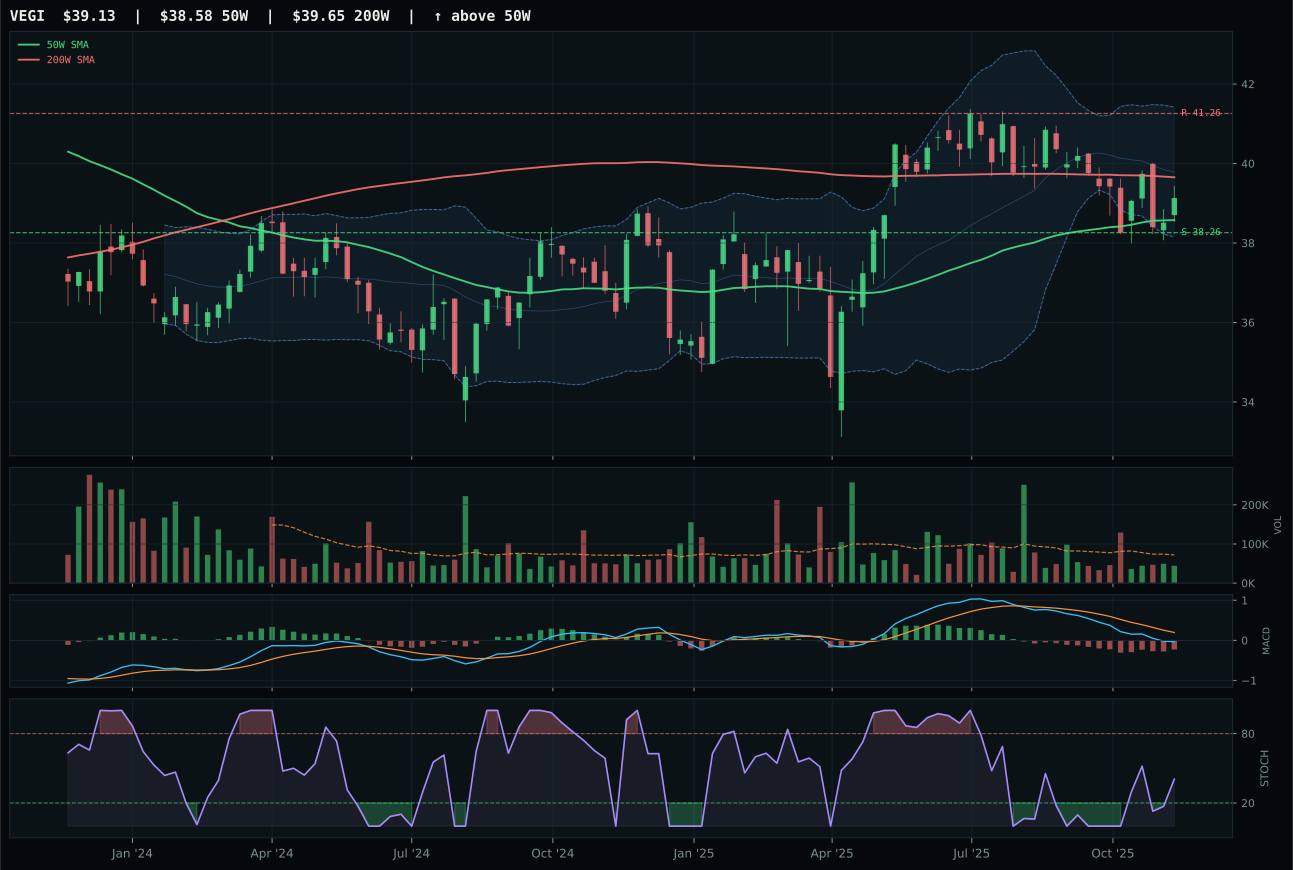
VEGI has a pullback into support profile with -6.4% 13-week relative strength versus SPY.
A failed hold above support would weaken the setup.
Tracked, but not top-2 eligible because: .
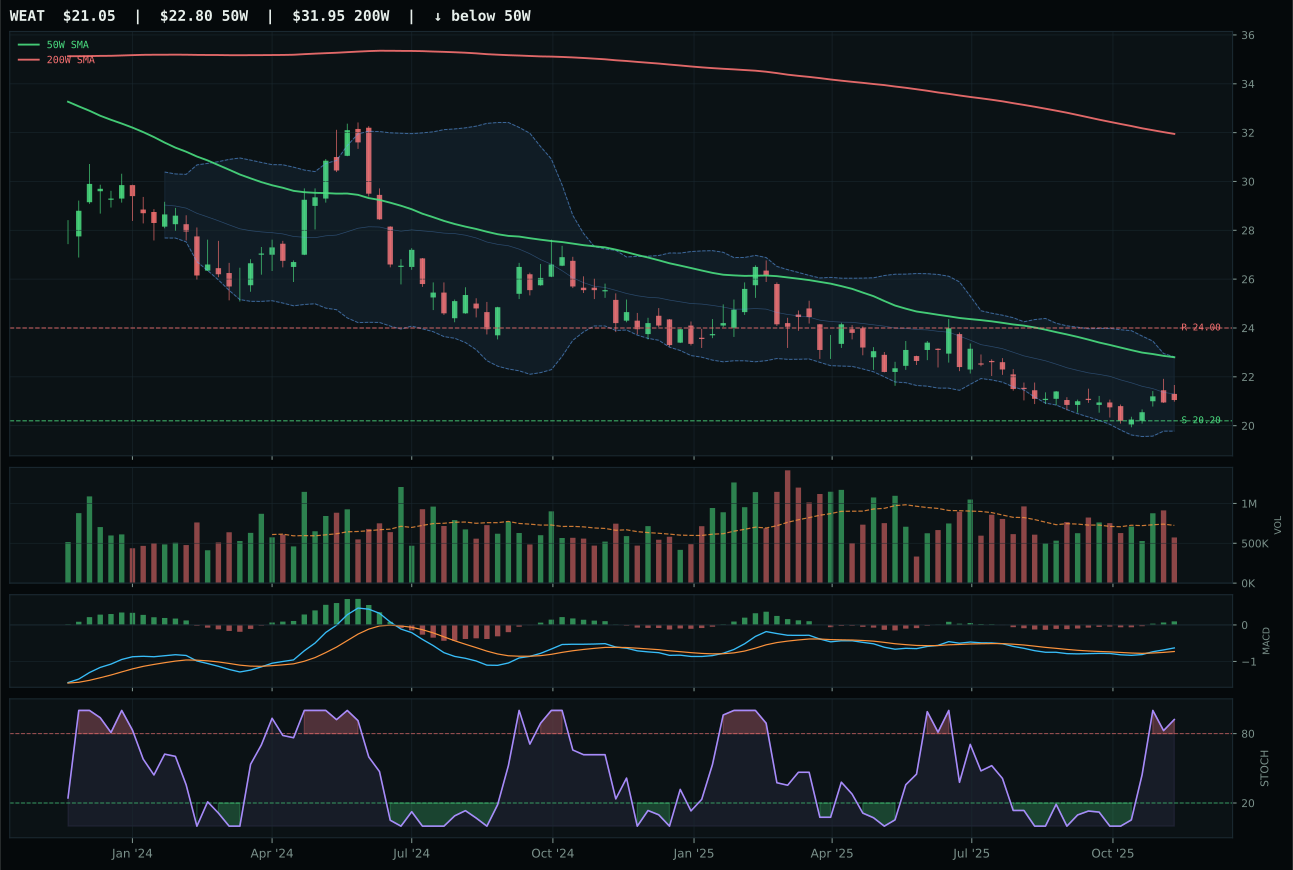
WEAT has a pullback into support profile with -4.7% 13-week relative strength versus SPY.
Extension and support failure are the main tactical risks.
Tracked, but not top-2 eligible because: structurally broken.
MOO wins a severely challenged category by holding a pullback into support near 70.43 with a remarkable 95.0 timing score—the tightest setup in its basket relative to moving-average distance and Fibonacci levels. The thirteen-week return of −2.2% and −6.6% SPY-relative strength tell you this is not a momentum trade; instead, MOO offers risk/reward at 79.2/100 with only 2.5% downside to support but minimal upside in a compressed range. MACD is bearish/weakening and stochastic RSI is falling into neutral, so the accumulation thesis depends entirely on support holding and a mean-reversion bounce. VEGI, the runner-up, carries better structure (69.0 versus 70.7) and shows MACD improving rather than weakening, but thin participation at 0.81x twenty-week volume and category-relative weakness (0.0%) suggest no internal breadth is supporting the setup. MOO wins only because its defined support level and neutral volume create a clearer invalidation area than VEGI's deteriorating technicals.
Agriculture & Livestock earned 0% allocation, ranked tenth or bottom-decile, with a final category score of 15.9 that reflects real macro headwinds. Disinflation pressure (−8 descriptor points) directly harms commodity rotation, and liquidity stress (−4) is crimping the real-asset narrative that MOO and peers depend on. The category's macro/narrative fit is only 45.0/100, dragged down by the fact that commodity breadth is active (+5) but overwhelmed by disinflation momentum (−8). MOO's technical edge is narrow and rests on a single factor: the pullback into support is clean. To earn a 5% position, Agriculture would need MACD to turn bullish across the basket, volume to jump into accumulation mode (above 1.15x), and the disinflation regime to reverse or stabilize. Alternatively, a fiscal-stimulus shock or crop-shortage news could trigger a re-entry, but current conditions do not support that. Keep Agriculture in a watchlist; it is not an allocation priority in the current macro state.