
2025-11-07
Informational purposes only. The content in this report, including allocations, analysis, and commentary, is provided solely for informational and educational purposes. It does not constitute financial advice, investment advice, trading advice, or any other type of advice. Past performance does not guarantee future results. Always conduct your own research and consult a qualified financial professional before making investment decisions.
Weekly Allocation
| Ticker | Category | Weight | Role |
|---|---|---|---|
| FBTC | 50% | Overlay | |
| GLD | Precious Metals | 10% | Top-2 (10%) |
| ILF | Emerging Markets | 10% | Top-2 (10%) |
| NLR | Nuclear Energy | 5% | Tier-2 (5%) |
| PAVE | Utilities & Infrastructure | 5% | Tier-2 (5%) |
| COPX | Industrial Metals | 5% | Tier-2 (5%) |
| SMH | AI | 5% | Tier-2 (5%) |
| XLK | Technology | 5% | Tier-2 (5%) |
| ITA | Defense & Aerospace | 5% | Tier-2 (5%) |
Trade Instructions — Monday Open
Sell the tranche from 2025-10-10 (completing its 4-week hold). Buy the new tranche. Instructions show net portfolio changes — same-asset positions cancel, weight changes show the delta.
| Action | Ticker | Instruction |
|---|---|---|
| SELL | SLV | Sell entire SLV position (2.50% of portfolio) |
| SELL | URA | Sell 67% of URA position (reduce 3.75% → 1.25%) |
| SELL | XLU | Sell 20% of XLU position (reduce 6.25% → 5.00%) |
| SELL | REMX | Sell 25% of REMX position (reduce 5.00% → 3.75%) |
| SELL | XAR | Sell 25% of XAR position (reduce 5.00% → 3.75%) |
| SELL | XLE | Sell 50% of XLE position (reduce 2.50% → 1.25%) |
| BUY | GLD | Buy GLD — 25.00% of freed cash (adds 2.50% to portfolio) |
| BUY | NLR | Buy NLR — 12.50% of freed cash (adds 1.25% to portfolio) |
| BUY | ILF | Buy ILF — 25.00% of freed cash (adds 2.50% to portfolio) |
| BUY | PAVE | Buy PAVE — 12.50% of freed cash (adds 1.25% to portfolio) |
| BUY | COPX | Buy COPX — 12.50% of freed cash (adds 1.25% to portfolio) |
| BUY | ITA | Buy ITA — 12.50% of freed cash (adds 1.25% to portfolio) |
Current Portfolio After Trade
Combined holdings across all 4 active tranches. Each tranche is 25% of the portfolio.
| Ticker | % of Portfolio | Weight Bar |
|---|---|---|
| FBTC | 50.00% | |
| GLD | 8.75% | |
| SMH | 6.25% | |
| XLU | 5.00% | |
| XLK | 5.00% | |
| REMX | 3.75% | |
| XAR | 3.75% | |
| NLR | 3.75% | |
| ILF | 3.75% | |
| PICK | 2.50% | |
| URA | 1.25% | |
| XLE | 1.25% | |
| IEMG | 1.25% | |
| PAVE | 1.25% | |
| COPX | 1.25% | |
| ITA | 1.25% |
Macro Regime — Transition / Mixed
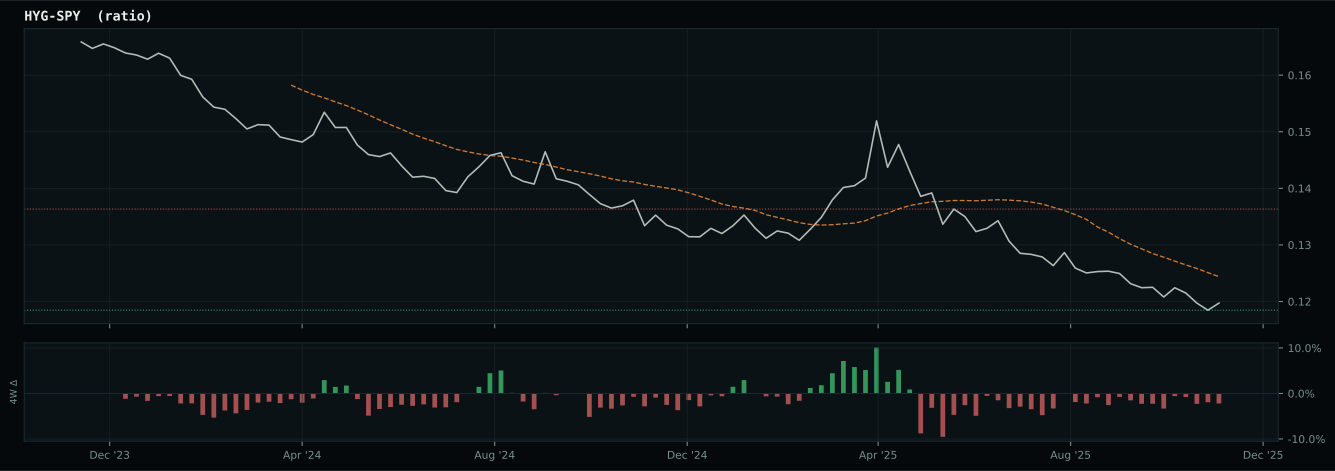
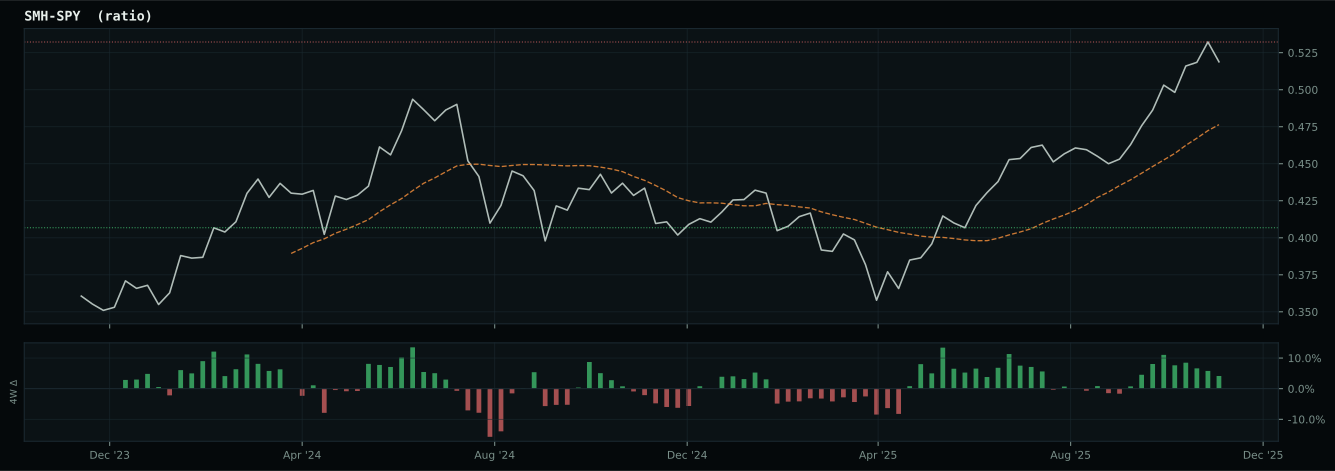
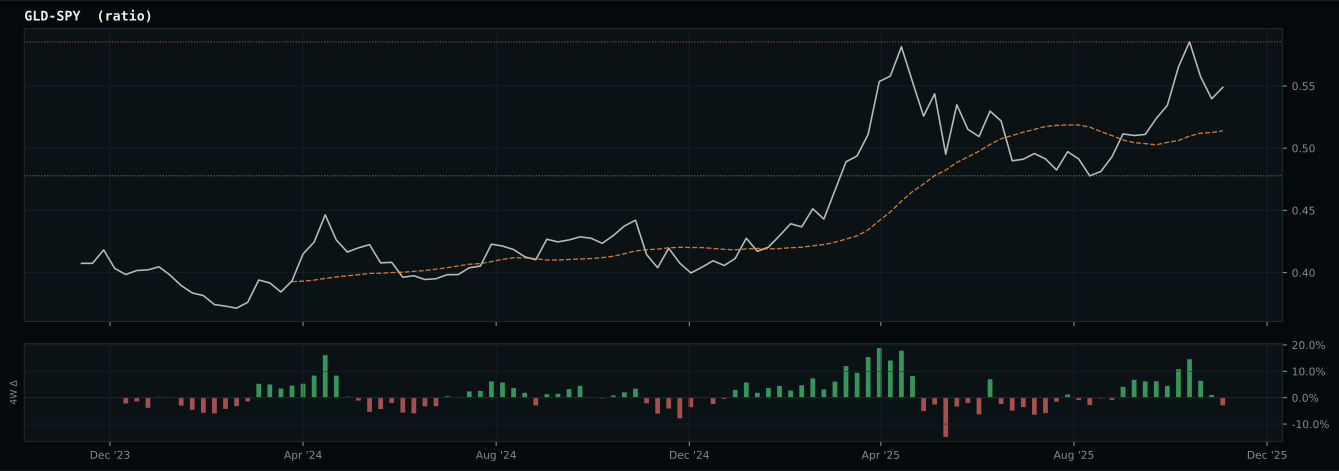
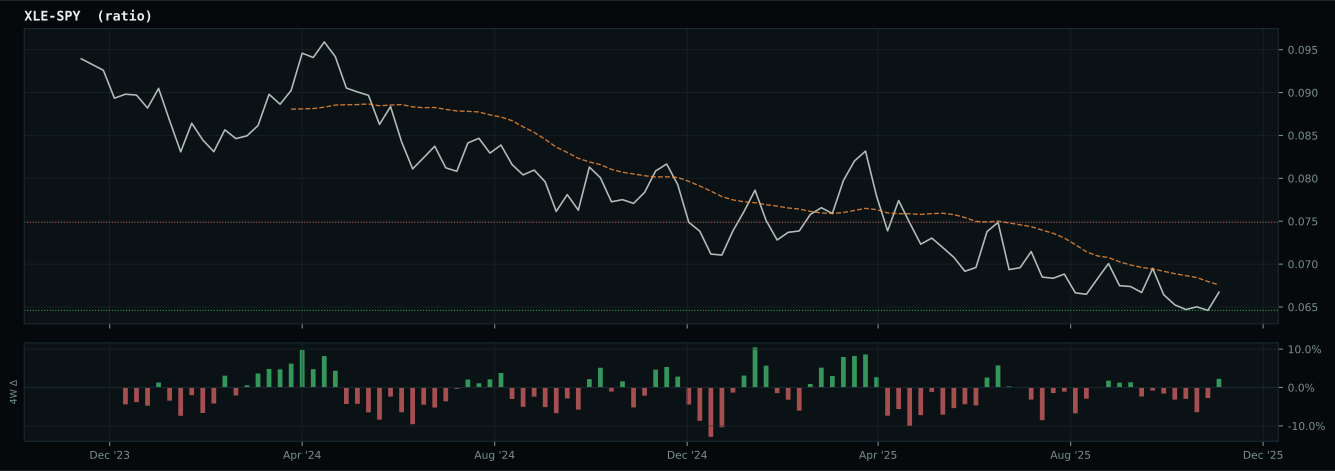
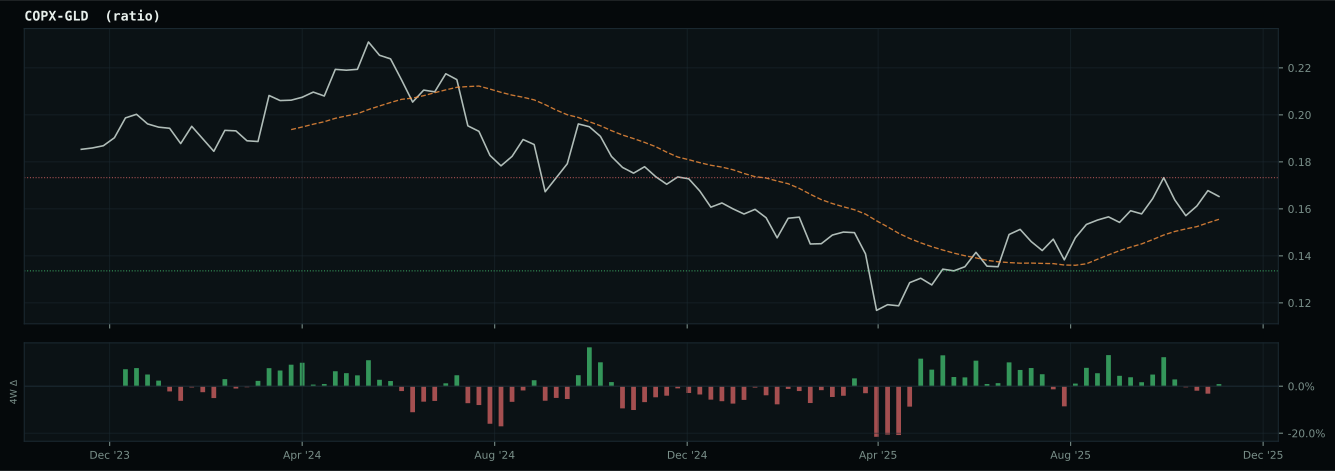
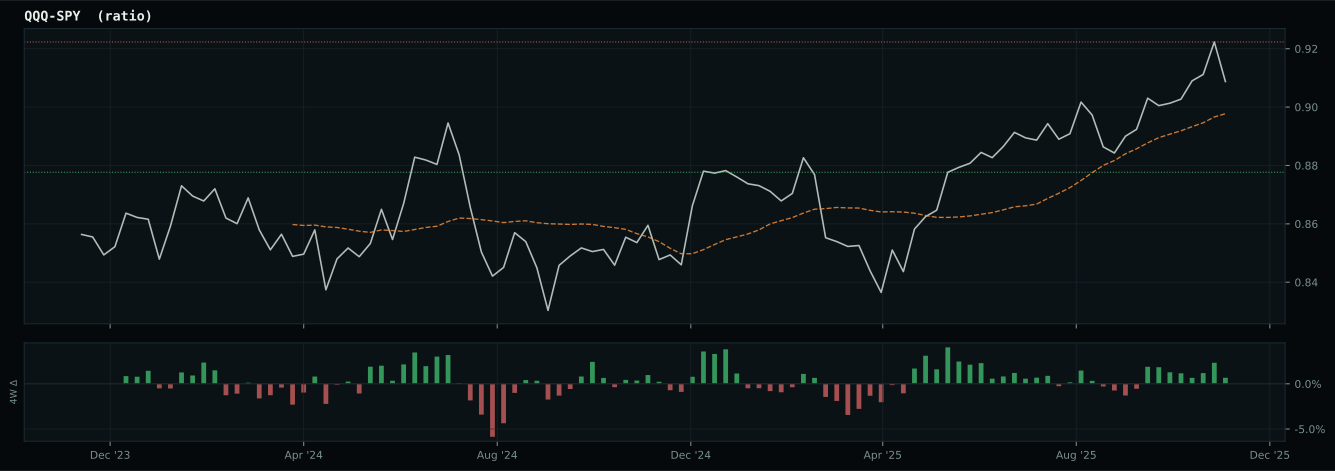
Macro Evidence Charts
Market-implied signals behind the macro regime scores. Each ratio compares two assets; the direction and slope of the ratio is what the macro engine reads.
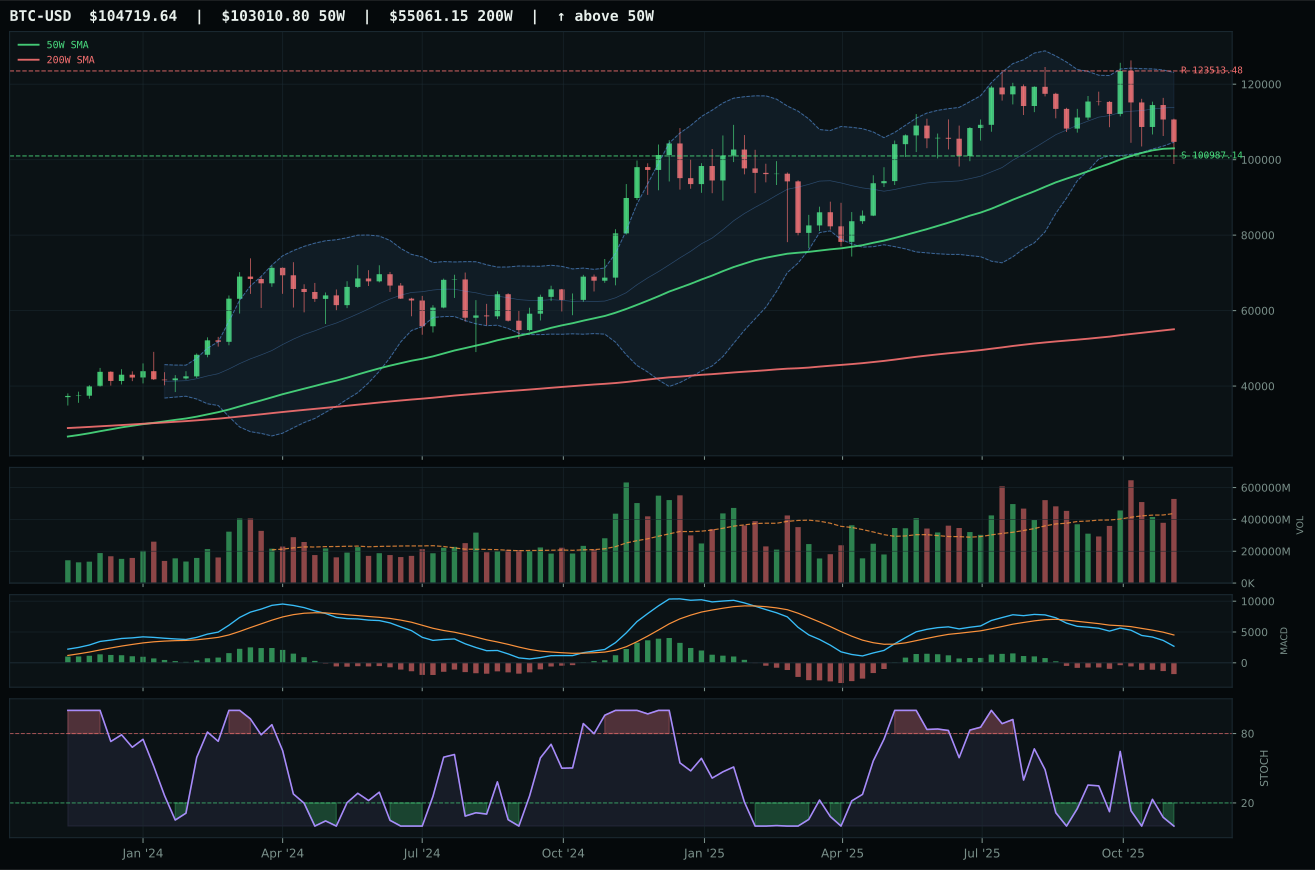
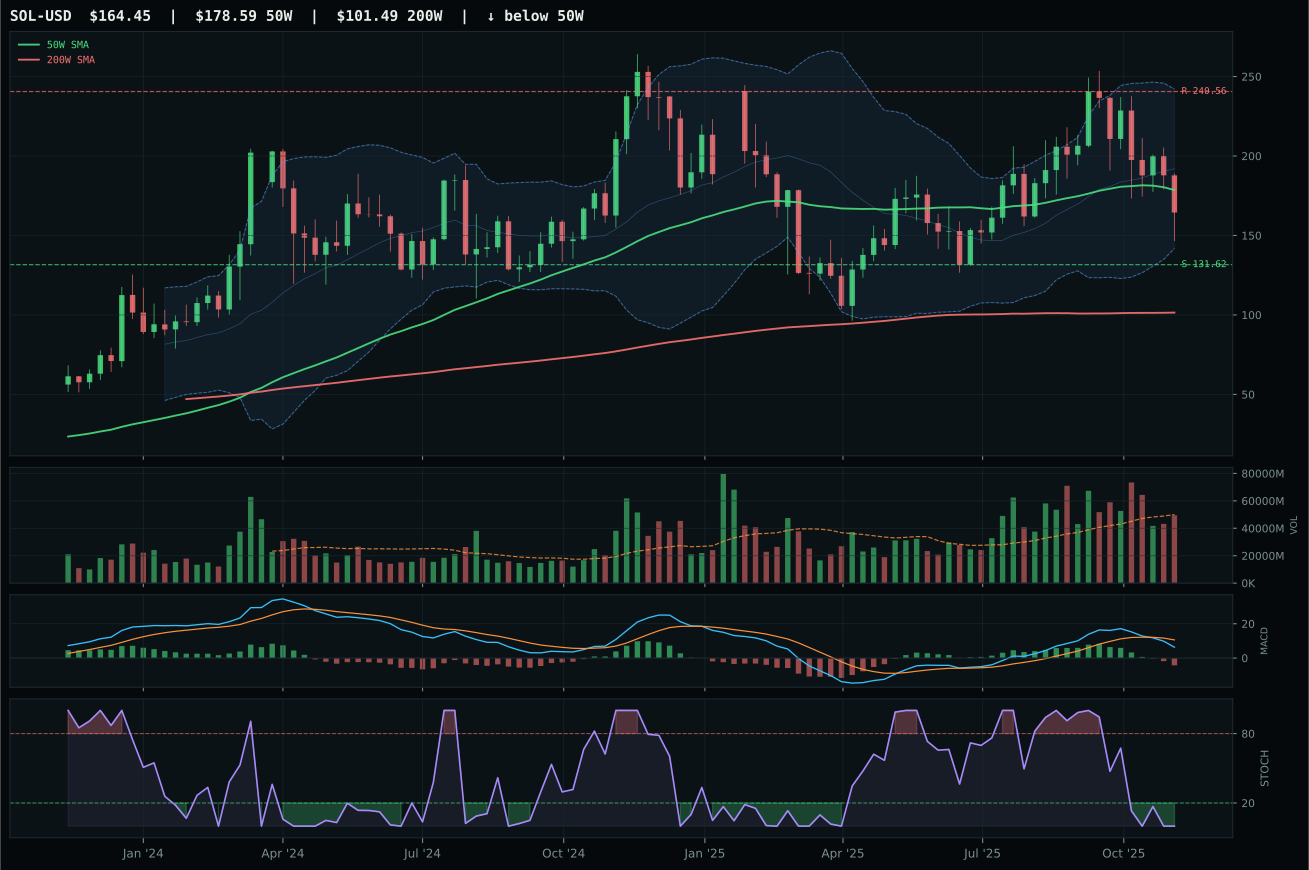
Crypto Regime — TrendBTC
ValueBTC not armed: BTC has not made the first post-breakdown touch of the 200W buy zone after losing the 50W
TrendBTC confirmed: 2 consecutive closes above rising/flat 50W SMA
one or more available conditions failed
Category Rankings
| Rank | Category | Winner | Score | Alloc | 4W Ret | Peers (4W) |
|---|---|---|---|---|---|---|
| 1 | Precious Metals | GLD | 64.0 | 20% | +2.95% | SLV +17.1% · GDX +7.7% |
| 2 | Emerging Markets | ILF | 58.3 | 20% | +1.44% | IEMG -0.9% · INDA -1.2% |
| 3 | Nuclear Energy | NLR | 51.6 | 10% | -4.00% | URNM +2.2% · URA -3.3% |
| 4 | Utilities & Infrastructure | PAVE | 50.5 | 10% | +1.31% | XLU -3.5% · IGF +0.4% |
| 5 | Industrial Metals | COPX | 50.2 | 10% | +9.33% | PICK +7.3% · REMX +8.1% |
| 6 | AI | SMH | 48.5 | 10% | +2.95% | AIQ -0.3% · BOTZ +0.8% |
| 7 | Technology | XLK | 47.9 | 10% | +0.53% | CIBR -1.4% · IGV -0.7% |
| 8 | Defense & Aerospace | ITA | 43.2 | 10% | -3.71% | XAR -2.2% · ROKT +0.5% |
| 9 | Traditional Energy | XLE | 33.5 | 0% | +1.73% | XOP +3.8% · FCG +7.5% |
| 10 | Agriculture & Livestock | WEAT | 17.5 | 0% | -2.58% | VEGI +0.9% · MOO +3.2% |
Precious Metals — GLD
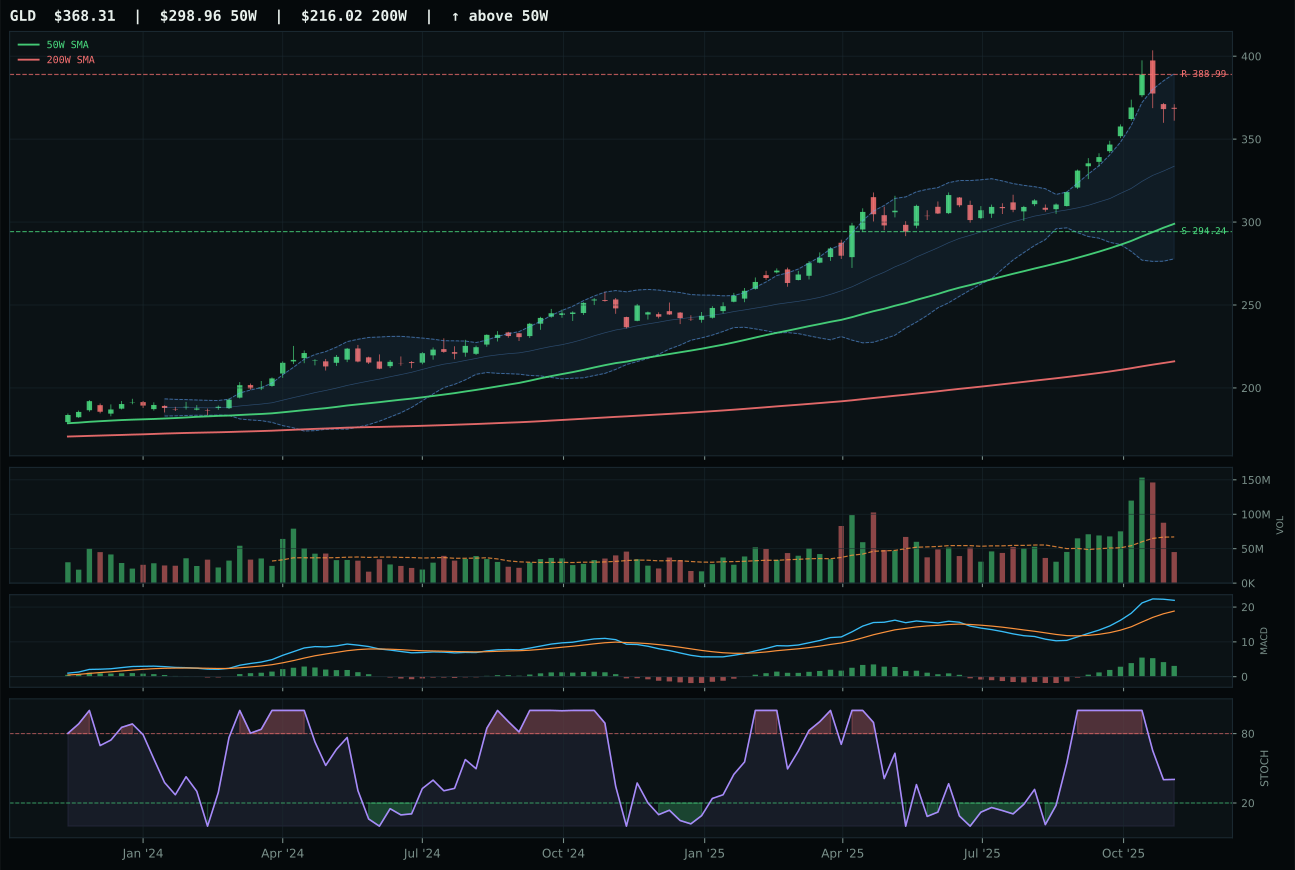
GLD has a vertical extension profile with 12.3% 13-week relative strength versus SPY.
A failed hold above support would weaken the setup.
Actionable but governed by invalidation levels.
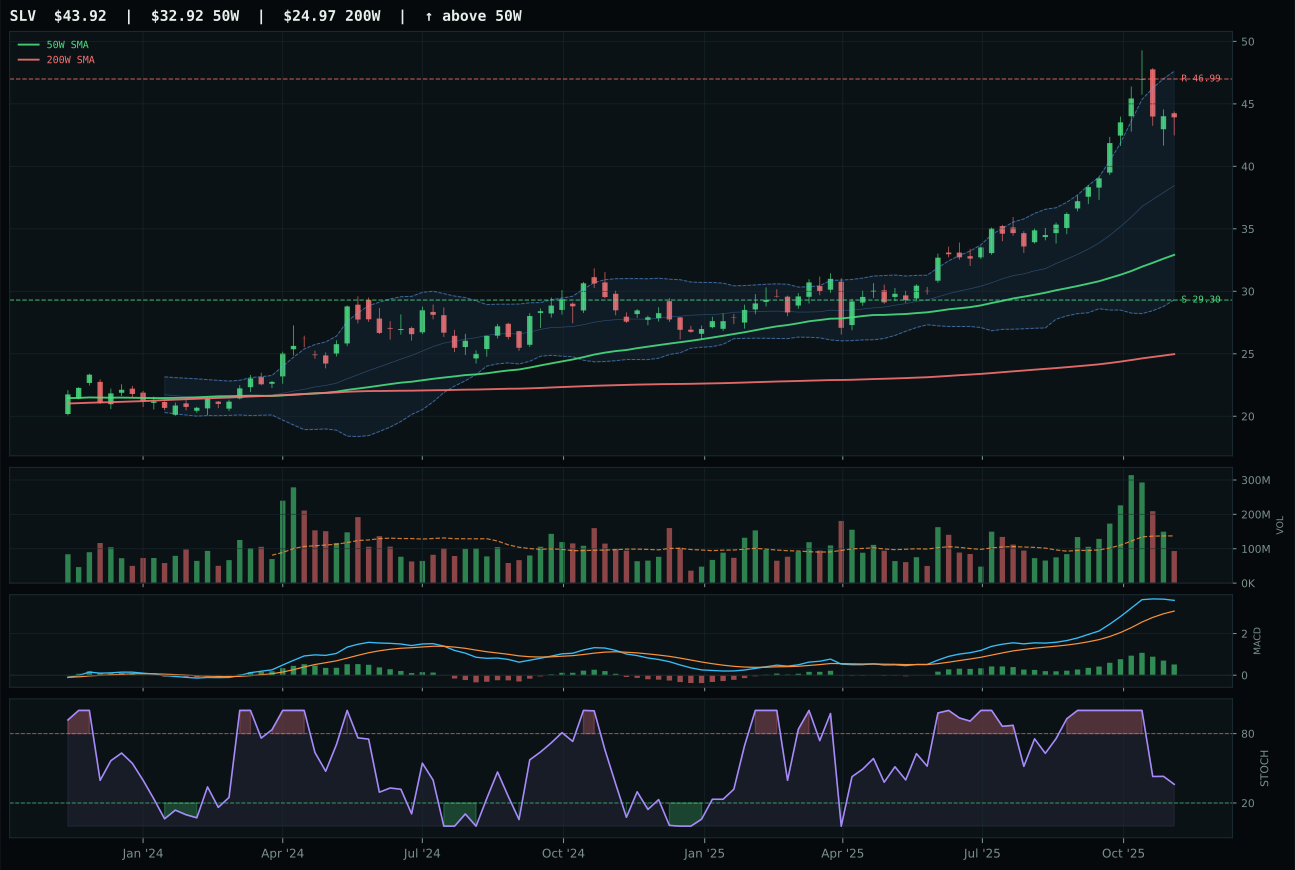
SLV has a vertical extension profile with 20.6% 13-week relative strength versus SPY.
A failed hold above support would weaken the setup.
Actionable but governed by invalidation levels.
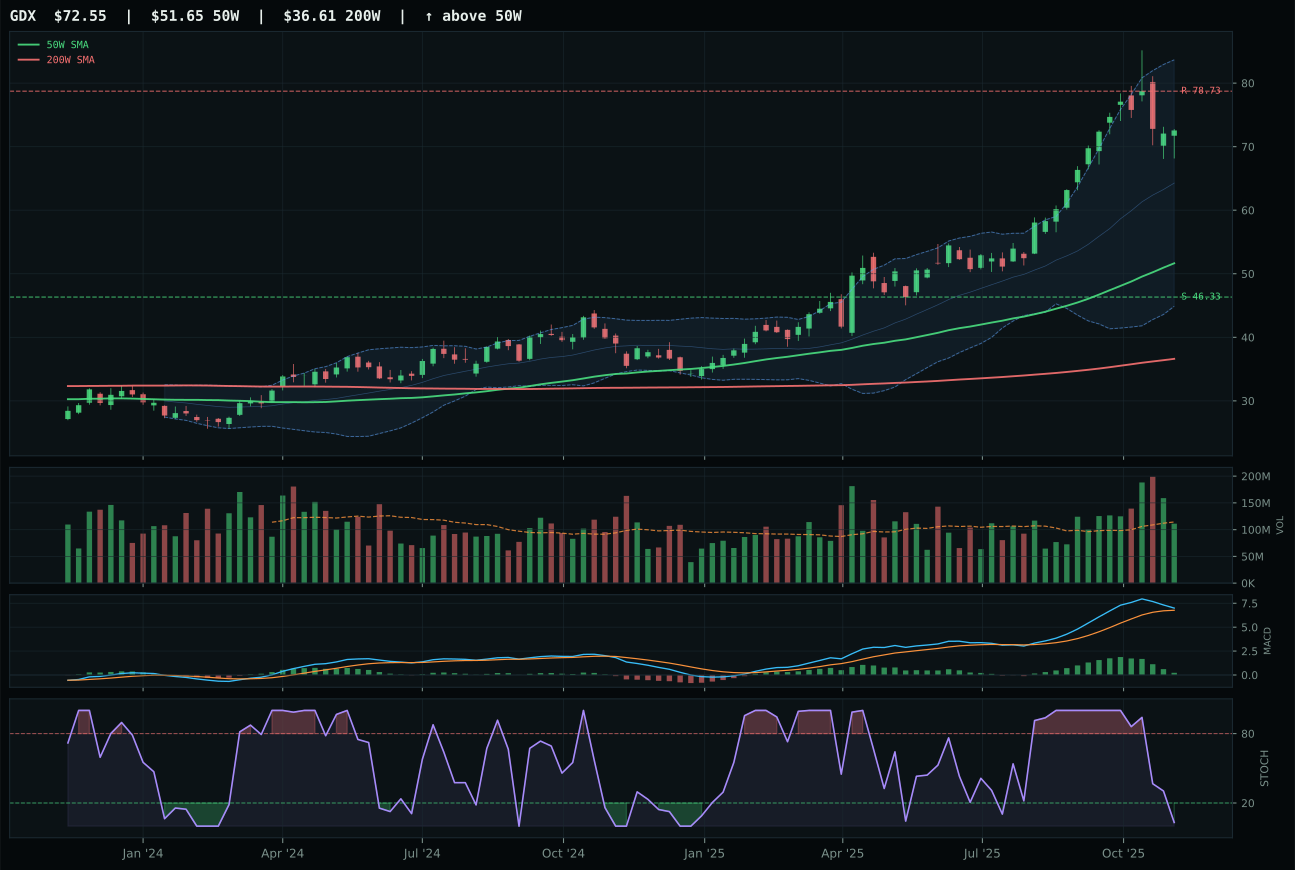
GDX has a vertical extension profile with 19.7% 13-week relative strength versus SPY.
A failed hold above support would weaken the setup.
Actionable but governed by invalidation levels.
GLD captures Precious Metals and earns a top-2 overweight by delivering the cleanest technical structure in a category where all three ETFs share similar macro tailwinds. The 100/100 trend score (price above both moving averages, 0.8% 50W slope, 12.3% RS vs SPY) is matched by 80.2 structure score, the highest in the basket, reflecting cleanliness of 83.3 and compression of 82.1. SLV posted higher absolute momentum (25.9% 13W, 20.6% RS vs SPY) but stretched itself 33.4% above the 50W, leaving it more vulnerable to mean reversion and earning a lower risk/reward score of 47.4 versus GLD's 48.8. GDX offered similar momentum but stochastic RSI oversold and distribution pressure in volume construction weakened its case. The gap between GLD and SLV is only 4.2 points in final scores, yet that small margin reflects GLD's superior setup quality — less stretched, cleaner compression, better volume signature.
Precious Metals earns 10% allocation as a tier-1 overweight, ranking among the two highest category scores at 64.0. The category's macro fit of 60.0 is the strongest driver: monetary hedge bid is active at +14, metals scarcity at +7 (pricing copper and uranium), and real asset sponsorship at +6, though risk appetite positive applies a -4 headwind because traditional growth plays and gold can diverge when confidence rises. In a Transition/Mixed regime with credit stress and liquidity stress as active concerns, metals serve as a tail-risk hedge and a real-asset diversifier away from equities. GLD's 59.2 technical evidence is solid without being spectacular — the thin participation (0.67x 20W volume) and flattening MACD suggest the move is not being accumulated on heavy volume, yet the 17.7% 13W return and held uptrend justify the allocation. The top-2 slot recognizes that when macro uncertainty is high and real assets are bid, GLD is the cleanest expression of that rotation.
Emerging Markets — ILF
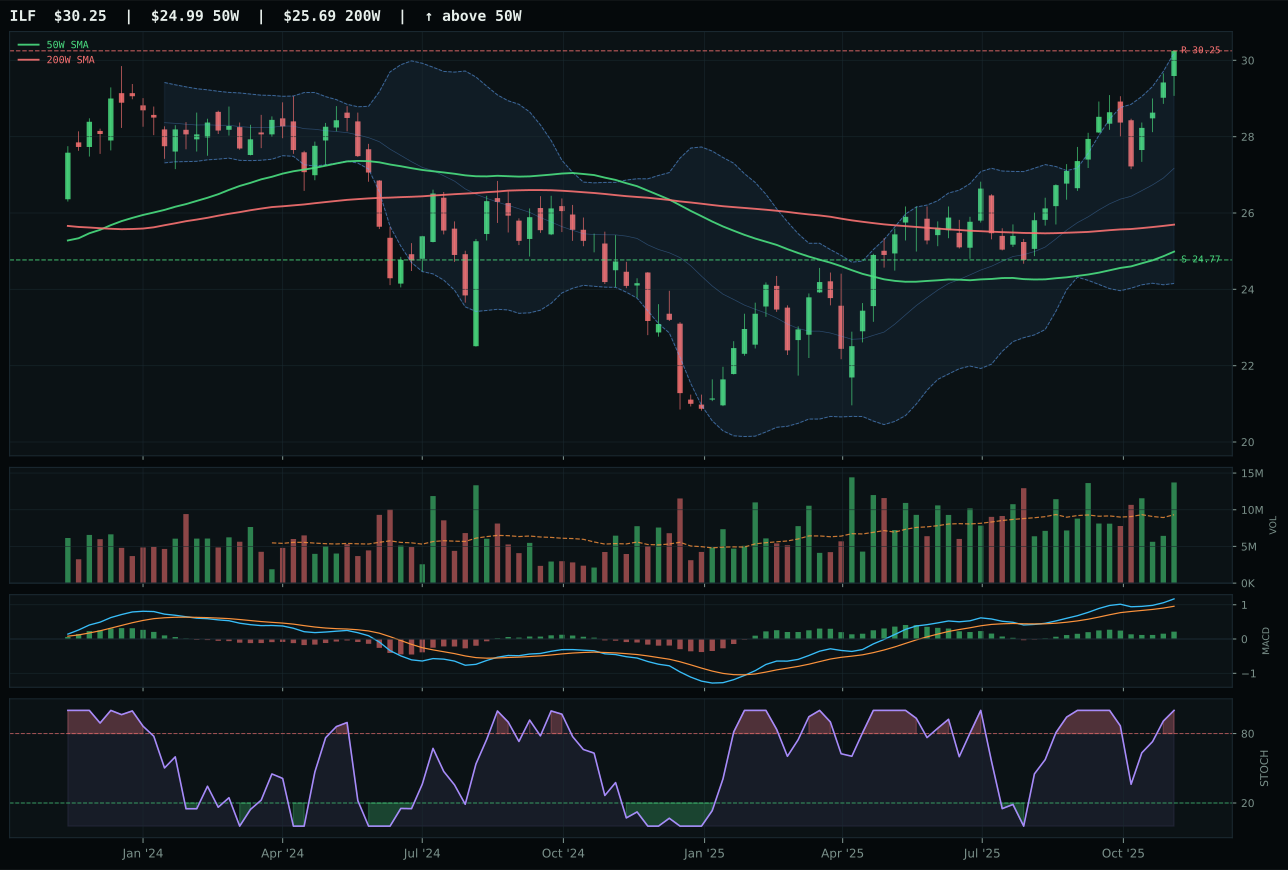
ILF has a vertical extension profile with 11.9% 13-week relative strength versus SPY.
A failed hold above support would weaken the setup.
Actionable but governed by invalidation levels.
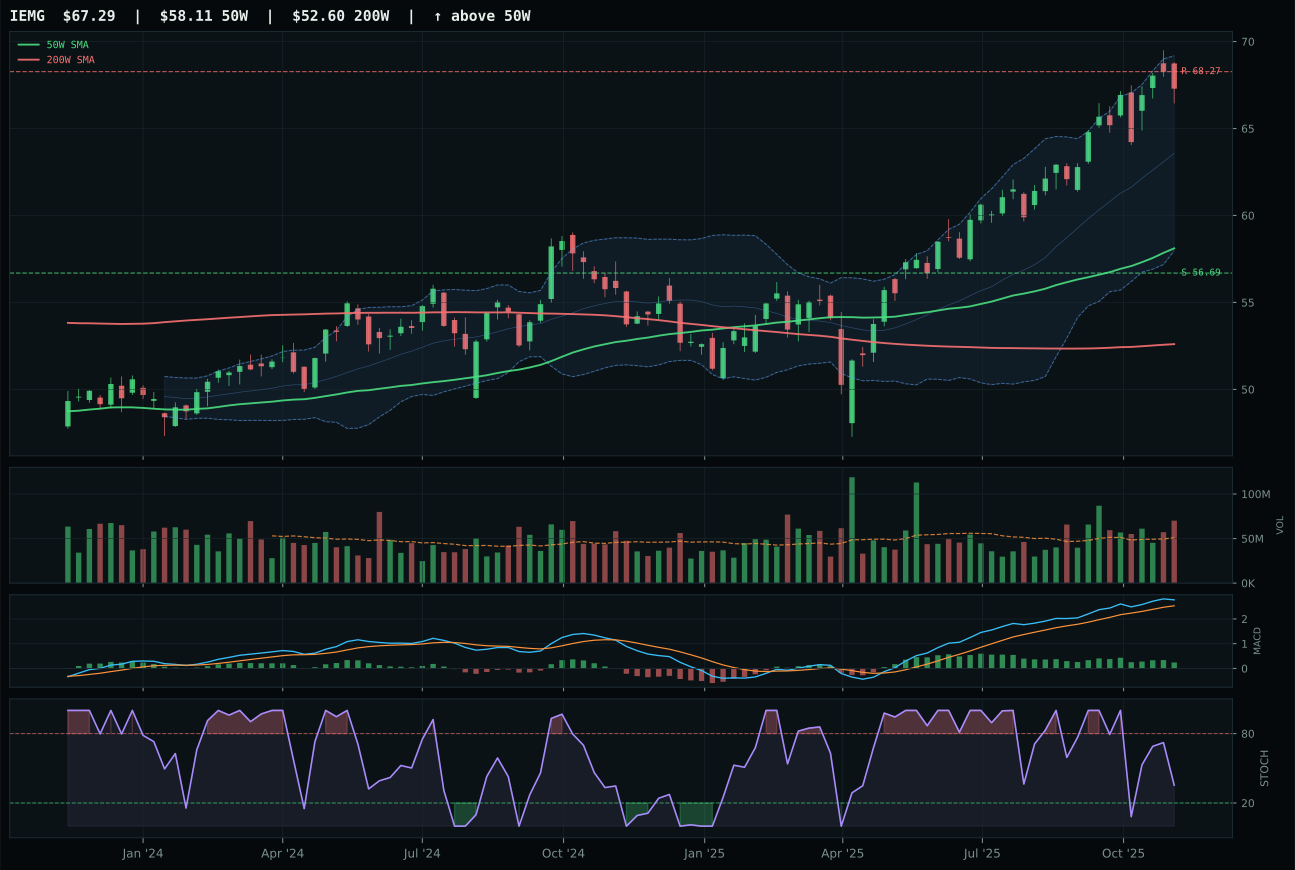
IEMG has a vertical extension profile with 4.3% 13-week relative strength versus SPY.
A failed hold above support would weaken the setup.
Actionable but governed by invalidation levels.
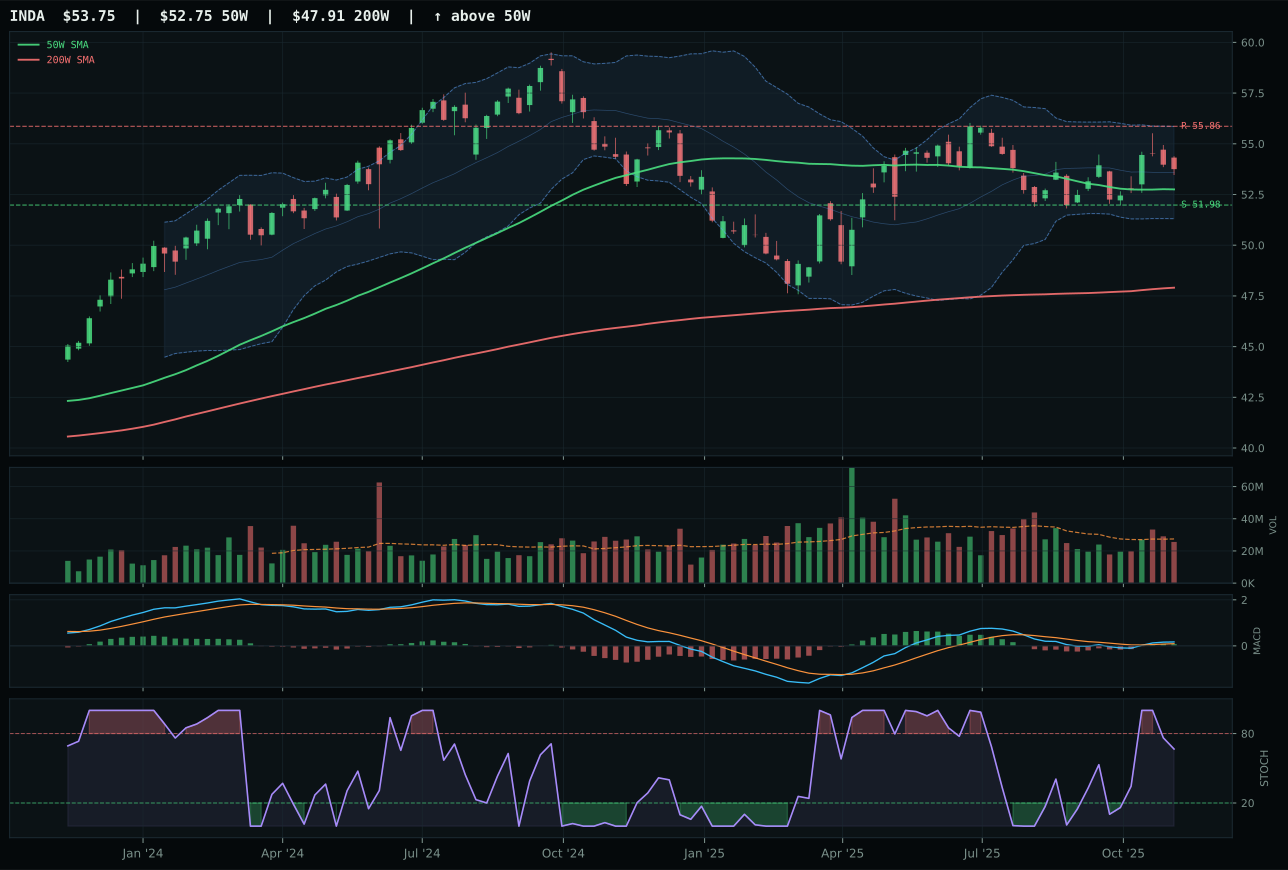
INDA has a pullback into support profile with -2.2% 13-week relative strength versus SPY.
A failed hold above support would weaken the setup.
Actionable but governed by invalidation levels.
ILF captures Emerging Markets and secures a top-2 tier-1 slot by delivering the highest technical evidence score (89.4) and cleanest structure (85.0) in a category where the macro narrative is mixed. The 17.2% 13W return and 11.9% RS versus SPY are robust, and the 100/100 momentum confirmation reflects both 11.1% 4W returns and bullish-and-improving MACD. The structure at 85.0 — vertical extension with 83.3 cleanliness and 83.1 compression — is superior to IEMG's 80.6 and INDA's structure, giving ILF the edge in setup quality. Crucially, ILF's 7.6% category-relative strength ensures it is winning inside the emerging-markets bucket; IEMG's 0.0% and INDA's laggard positioning confirm that Latin America commodity and value beta is the category winner. The Fibonacci location at near 52W high reflects extended price, but the volume participation (1.47x 20W) and MACD construction justify the stretch.
Emerging Markets earns 10% tier-1 allocation on a 58.3 final score, the second-ranked category behind Precious Metals at 64.0. The category's macro fit is paradoxically weak at 38.0 — risk appetite positive (+8) is swamped by credit stress (-10) and liquidity stress (-10) — yet ILF's technical evidence of 89.4 overrides the macro headwind. In a Transition/Mixed regime, ILF's combination of commodity breadth positive (+8), metals scarcity (+5), and real asset sponsorship (+6) positions Latin America as a beneficiary of global capex cycles and industrial demand. The tension is explicit: macro conditions are uncertain, yet the technicals are screaming outperformance. The top-2 allocation reflects the view that ILF's clean structure and momentum are genuine, and that the emerging-markets rotation is real enough to warrant a tier-1 seat despite credit stress concerns. If macro conditions deteriorate further — credit stress intensifies or liquidity stress widens — ILF would be vulnerable to sharp reversion; right now, the technical case is too clean to ignore.
Nuclear Energy — NLR
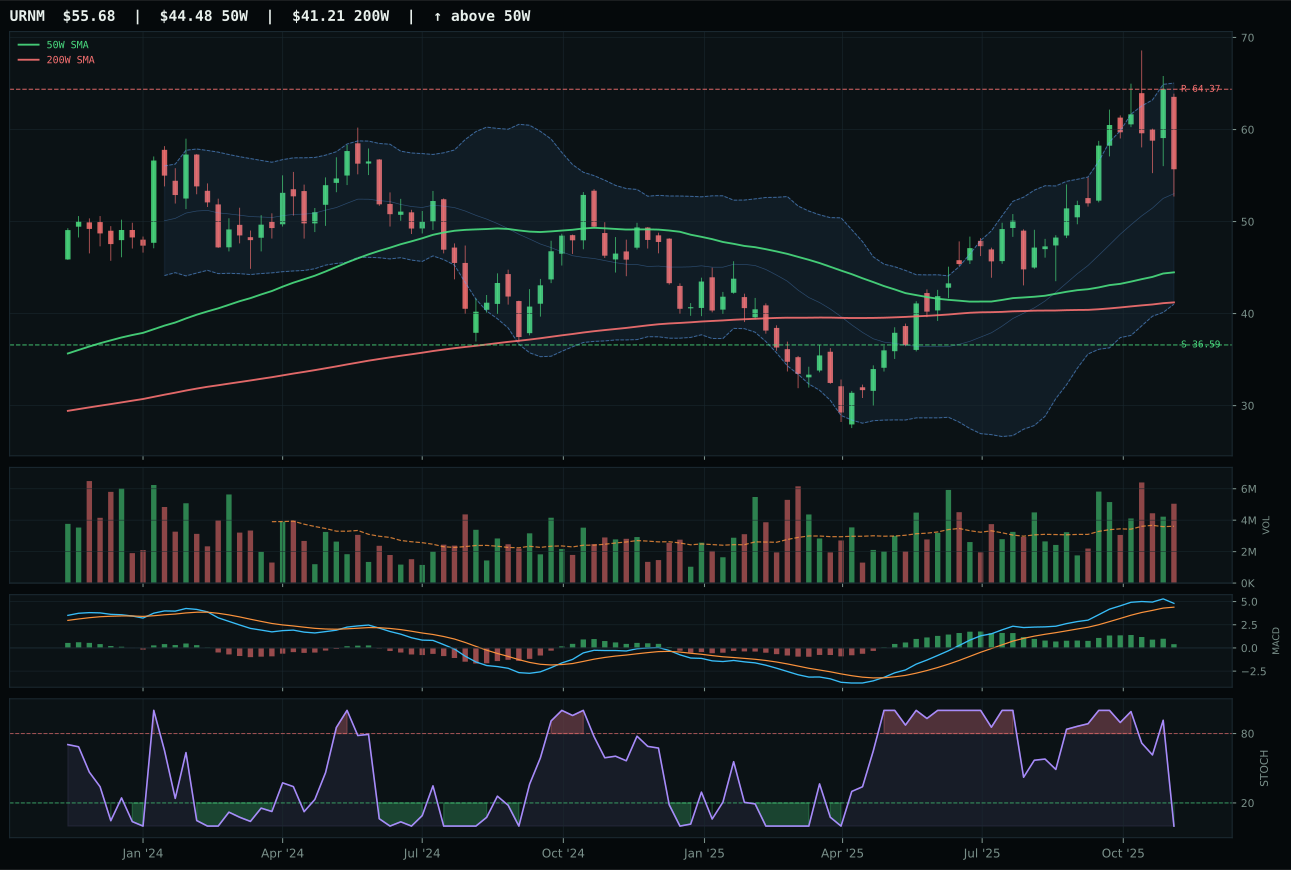
URNM has a vertical extension profile with 12.7% 13-week relative strength versus SPY.
A failed hold above support would weaken the setup.
Actionable but governed by invalidation levels.
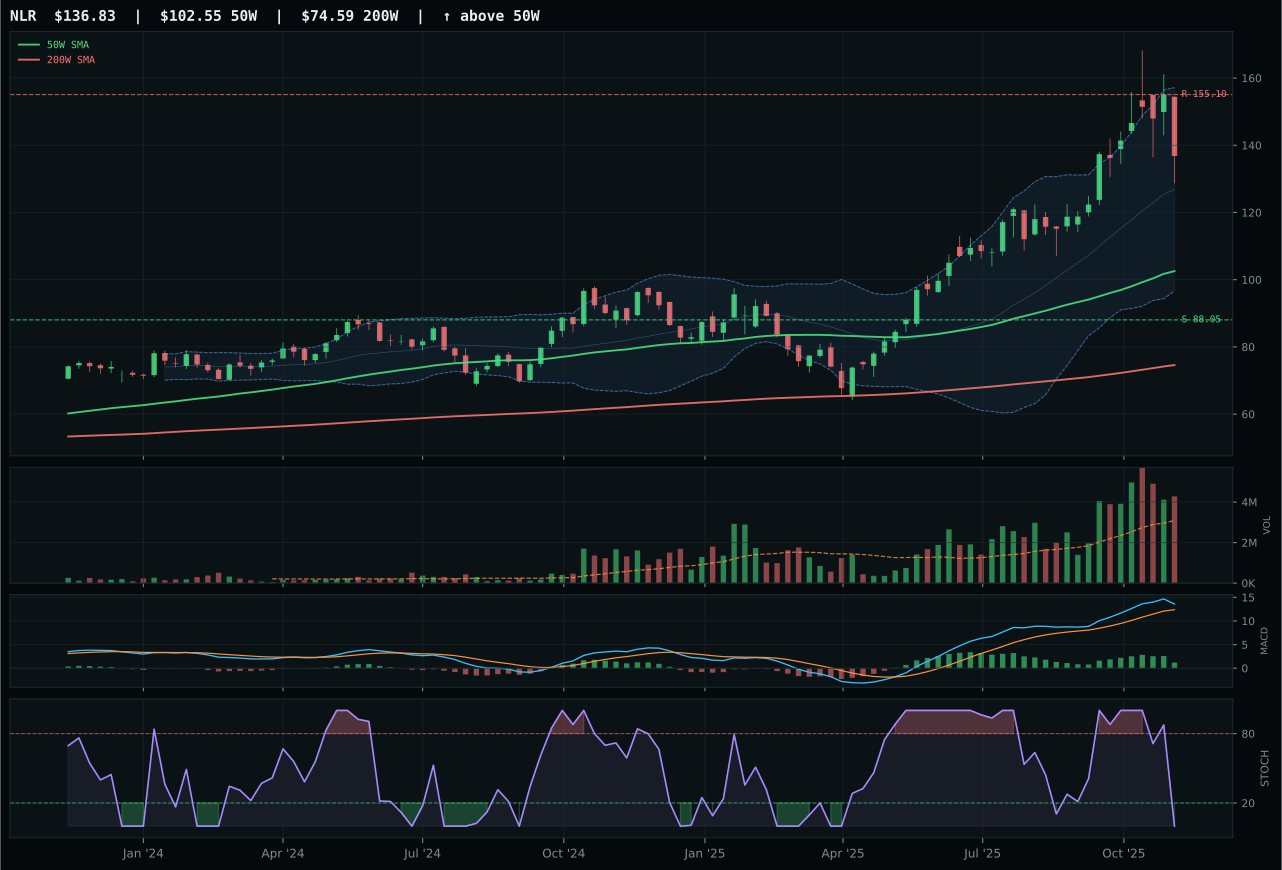
NLR has a vertical extension profile with 10.6% 13-week relative strength versus SPY.
A failed hold above support would weaken the setup.
Actionable but governed by invalidation levels.
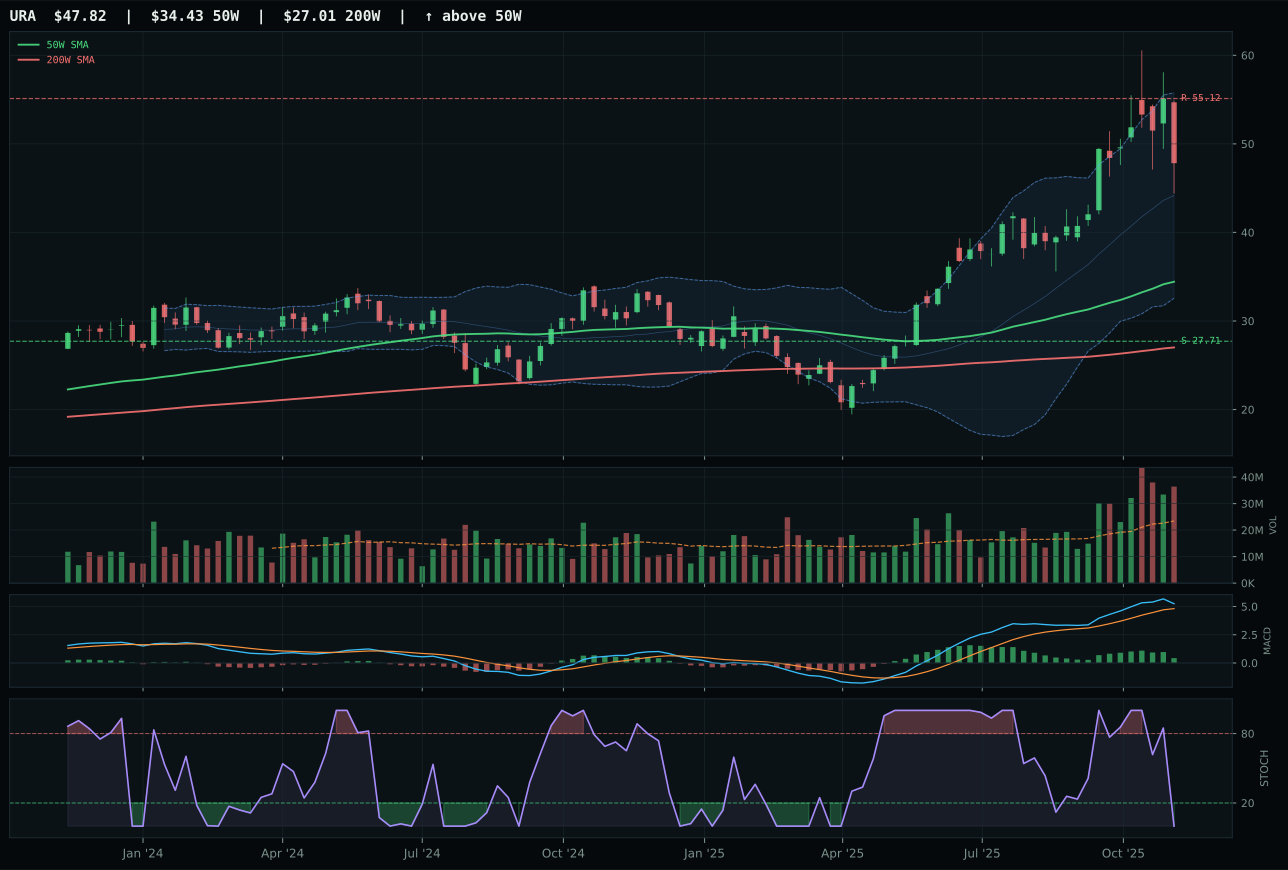
URA has a vertical extension profile with 14.4% 13-week relative strength versus SPY.
A failed hold above support would weaken the setup.
Actionable but governed by invalidation levels.
NLR captures Nuclear Energy in a tight race against URNM, decided by structure cleanliness (73.3 vs 72.7) in an otherwise near-identical technical setup. Both ETFs post 100/100 trend scores, both are extended 33+ percent from their respective 50W moving averages, both carry oversold stochastic RSI readings, and both show bullish-but-flattening MACD. The real difference lies in NLR's slightly tighter support/resistance band (88.05/155.10 versus 36.59/64.37) and fractionally better volume-price confirmation (58.7 vs similar). NLR is positioned as nuclear utilities and steadier energy security, while URNM is pure uranium-miner scarcity beta. In a category where both generate 51.6 and 51.1 scores respectively, the allocator is splitting hairs; NLR wins because it offers a marginally cleaner technical vehicle for the same thesis.
Nuclear Energy earns 5% tier-2 allocation at a 51.6 final score, just 0.2 points below the rank-8 floor but above the 0% exclusion threshold. The category's macro fit is neutral at 50.0, with real asset sponsorship (+7) and AI growth sponsorship (+5) balanced against liquidity stress (-7) and credit stress (-5). NLR is extended at 33.4% above the 50W, risking mean reversion if buying momentum slows, yet the above-average participation (1.39x 20W volume) and persistent 15.9% 13W return suggest conviction behind the move. The category earned allocation because Nuclear Energy bridges two portfolio themes: the energy transition (via grid stability and power demand) and the real-asset diversification (via uranium scarcity). To graduate to tier-1, NLR would need to consolidate and build a tighter base, or the macro regime would need to explicitly flag energy security as a dominant theme. Right now, it is a modest 5% convex bet on the intersection of AI capex and decarbonization.
Utilities & Infrastructure — PAVE
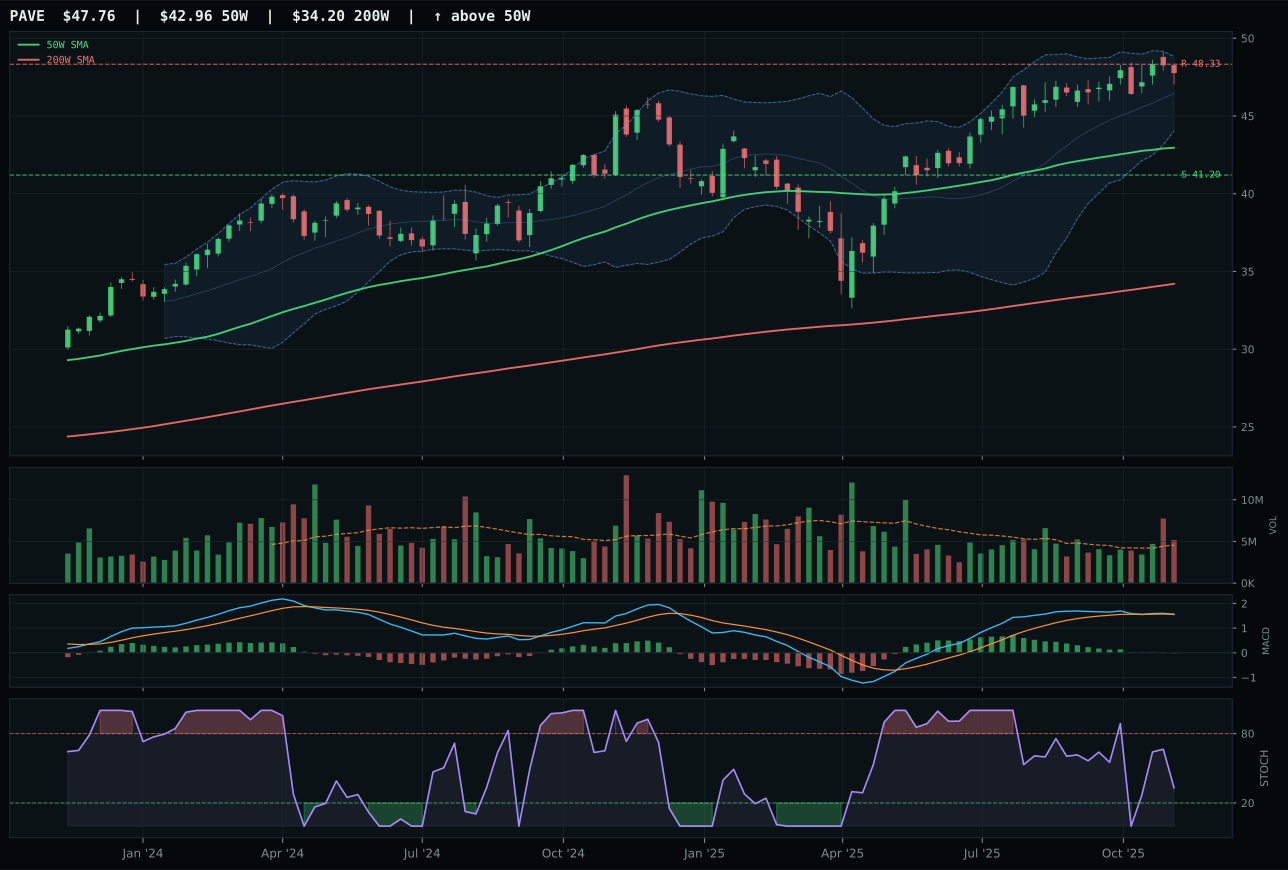
PAVE has a neutral structure profile with -0.9% 13-week relative strength versus SPY.
A failed hold above support would weaken the setup.
Actionable but governed by invalidation levels.
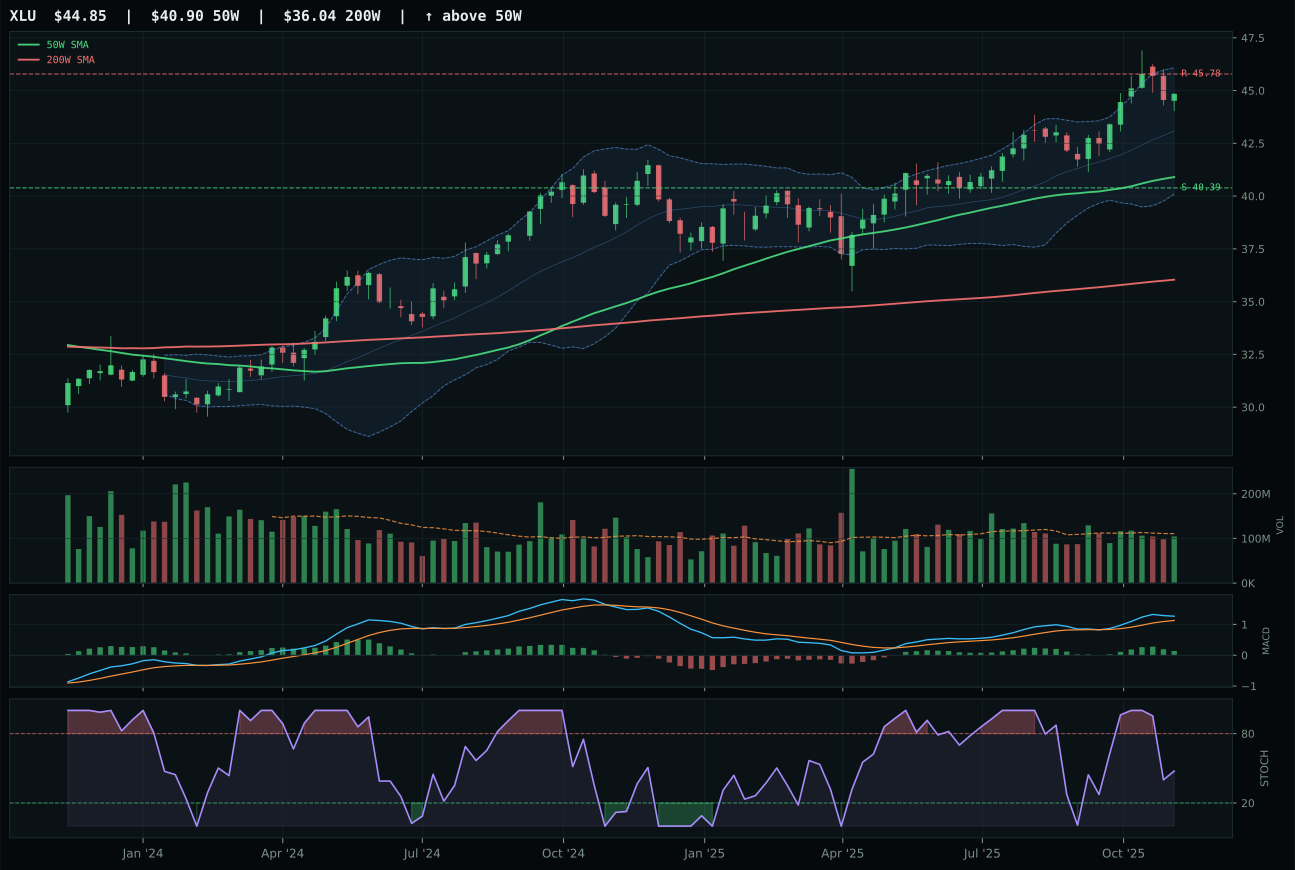
XLU has a neutral structure profile with -1.2% 13-week relative strength versus SPY.
A failed hold above support would weaken the setup.
Actionable but governed by invalidation levels.
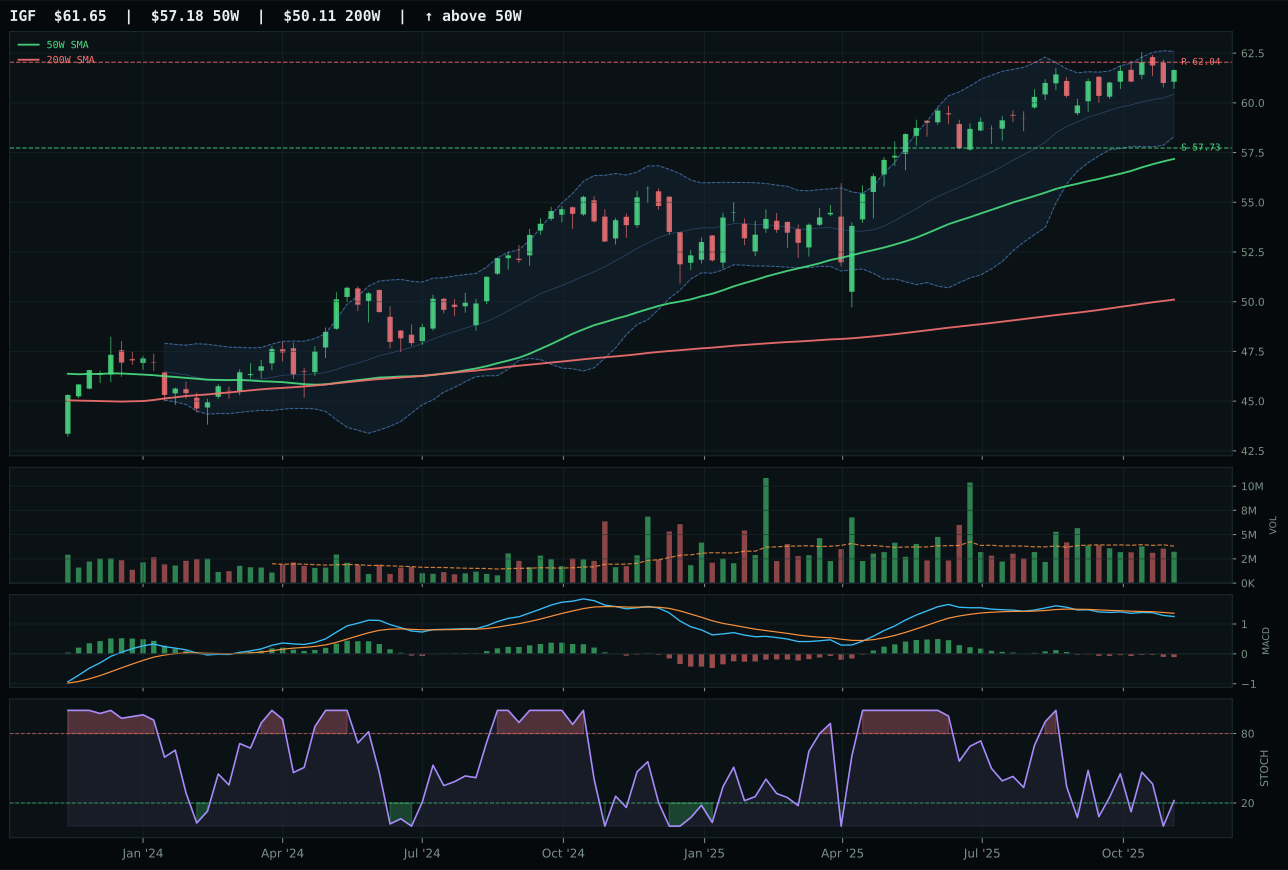
IGF has a neutral structure profile with -3.1% 13-week relative strength versus SPY.
A failed hold above support would weaken the setup.
Actionable but governed by invalidation levels.
PAVE edges out XLU in Utilities & Infrastructure despite having lower absolute trend and momentum scores, winning on the basis of timing alignment and volume participation. XLU posted 94 on trend and 58 on momentum versus PAVE's 81 and 48, suggesting utilities are stronger than infrastructure; however, PAVE's stochastic RSI is rising mid-zone at 0.33 versus XLU's falling/neutral, and PAVE carries above-average volume (1.13x 20W) versus XLU's neutral participation. In a category where both are neutral structure (not vertical extension), the allocator is asking which ETF is better positioned for the next leg: PAVE's rising stochastic and heavier volume suggest accumulation, while XLU's flattening stochastic and thin volume suggest exhaustion. The score gap is 6.8 points in XLU's favor (57.3 vs 50.5), yet PAVE's representative selection in the allocation proves that timing and volume matter as much as absolute momentum in a sideways category.
Utilities & Infrastructure receives 5% tier-2 allocation at a 50.5 final score, barely above the 5% tier threshold and well below top-2 qualification. The category's macro fit is neutral at 49.0; Transition/Mixed regime adds +4 (infrastructure is defensive in uncertainty), yet liquidity stress (-3) and risk appetite positive (-2) provide competing signals. PAVE is positioned as domestic infrastructure and capex beta, a play on the policy bid for American infrastructure spending, yet the 4.4% 13W return and -0.9% RS versus SPY reveal that infrastructure is not winning in the current risk environment. To justify even 5% allocation, the category needs Transition/Mixed to remain dominant and the capex cycle to provide steady if unspectacular returns. If risk appetite reverses sharply or credit stress accelerates, PAVE would deteriorate quickly given its thin momentum. The allocation acknowledges PAVE as a defensive diversifier in a mixed regime, not a conviction bet on capex recovery; any improvement in risk appetite would redirect that 5% to higher-conviction growth sleeves.
Industrial Metals — COPX
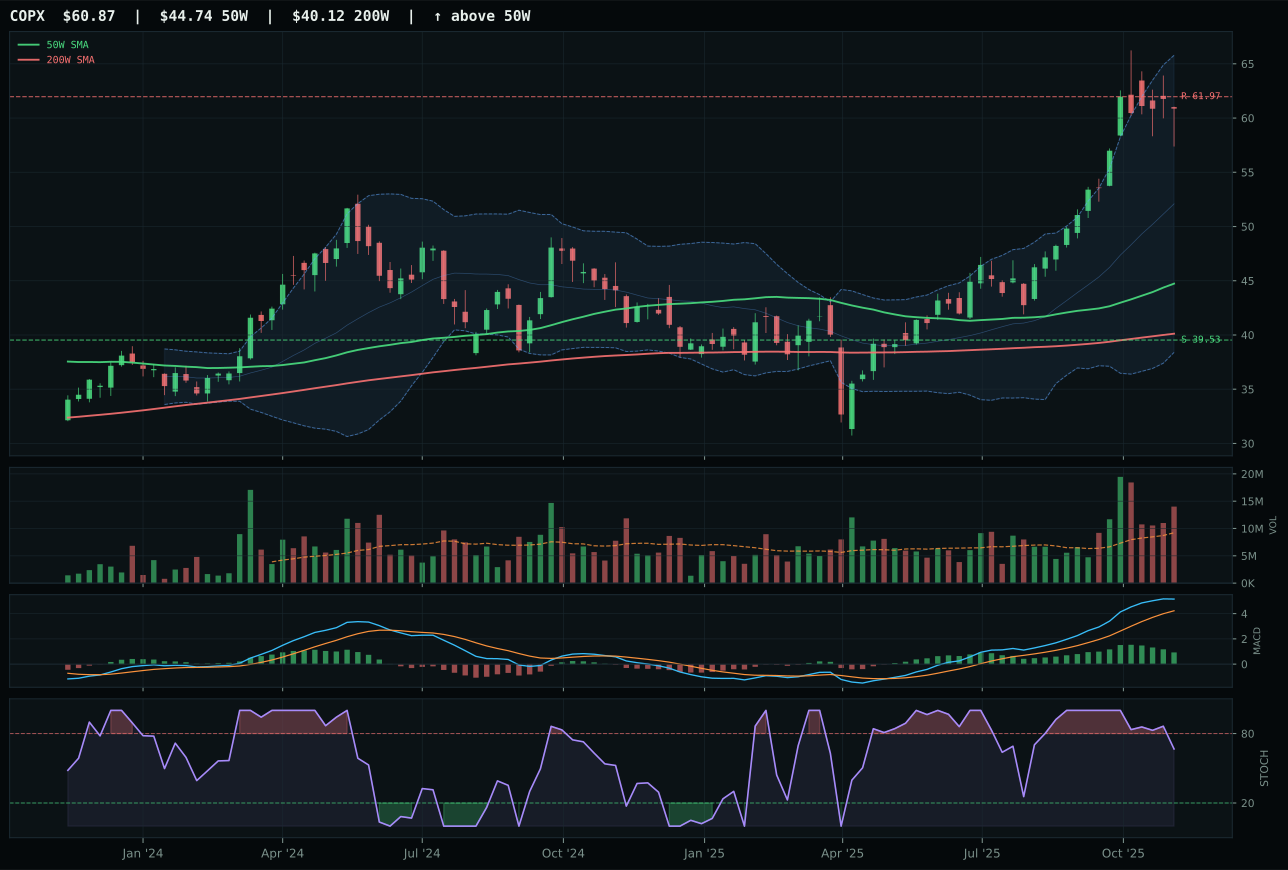
COPX has a vertical extension profile with 26.3% 13-week relative strength versus SPY.
A failed hold above support would weaken the setup.
Actionable but governed by invalidation levels.
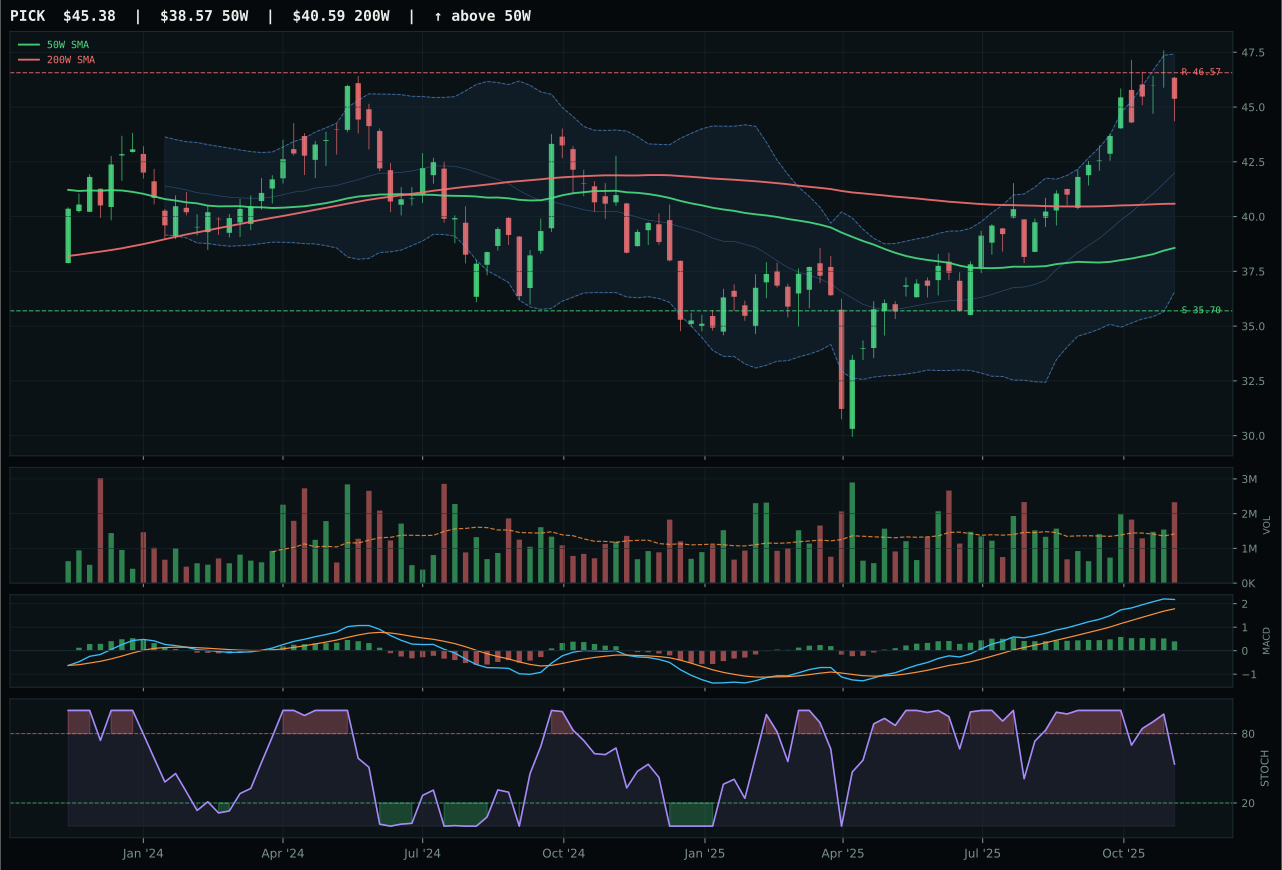
PICK has a vertical extension profile with 8.9% 13-week relative strength versus SPY.
A failed hold above support would weaken the setup.
Actionable but governed by invalidation levels.
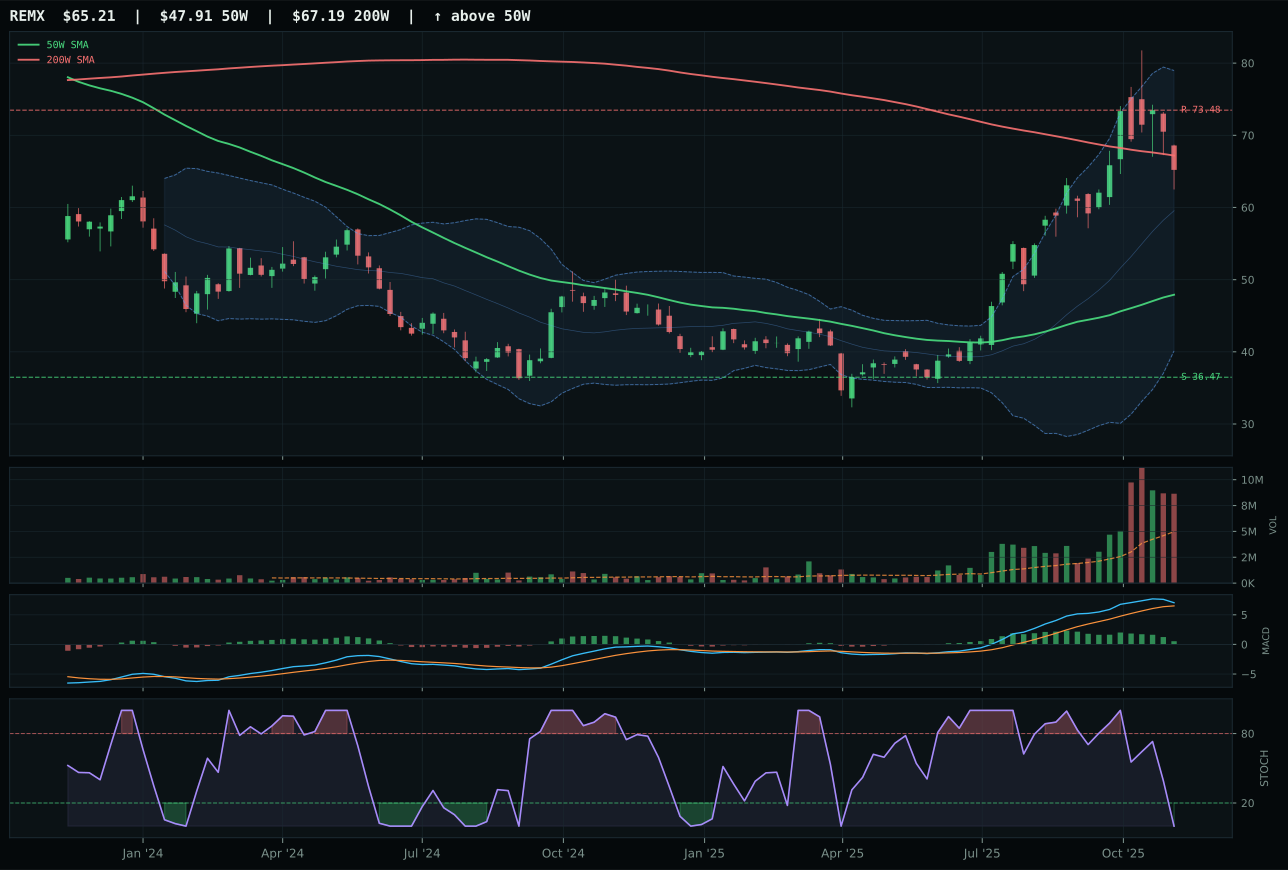
REMX has a vertical extension profile with 13.7% 13-week relative strength versus SPY.
A failed hold above support would weaken the setup.
Actionable but governed by invalidation levels.
COPX dominates Industrial Metals through sheer momentum and relative strength that dwarfs its peers. The 31.6% 13W return and 26.3% RS versus SPY reflect genuine copper scarcity sentiment and industrial demand positioning; that 12.6% category-relative strength ensures COPX is winning inside its own basket. PICK posted a competitive composite score of 67 but delivered only 8.9% RS vs SPY and -4.8% category RS, making it the supporting player. The risk/reward disparity is stark: COPX's upside to resistance is only -1.8% (price is already near the top), yet its downside to support is 54%, a lopsided risk profile that the timing score of 48 accurately penalizes. Volume at 1.52x 20W shows distribution pressure — big holders are selling into strength — but the 100/100 momentum confirmation and 78.3 persistence override that concern because the move is too strong to be faked. COPX is winning a momentum race, not building a stable base.
Industrial Metals earns 5% tier-2 allocation despite a 50.2 final score, well below the top-2 threshold, because the category's macro fit of 65.0 is exceptionally strong. Metals scarcity at +14, commodity breadth positive at +10, and real asset sponsorship at +6 create a powerful tailwind that lifts COPX's technical evidence (43.4) into a defensible allocation. The tension is real: COPX is extended, showing distribution pressure in volume, and offers minimal upside room (resistance at 61.97 vs current price at 59.84). Yet the category has earned a seat because in a Transition/Mixed regime where both credit stress and liquidity stress are active, the scarcity narrative for copper — driven by AI power-grid expansion and energy transition capex — is live. To move to tier-1, COPX would need to consolidate closer to the 50W to reset entry risk, or volume would need to shift from distribution to accumulation. Right now, it is a 5% position in a momentum trade, not a core holding.
AI — SMH
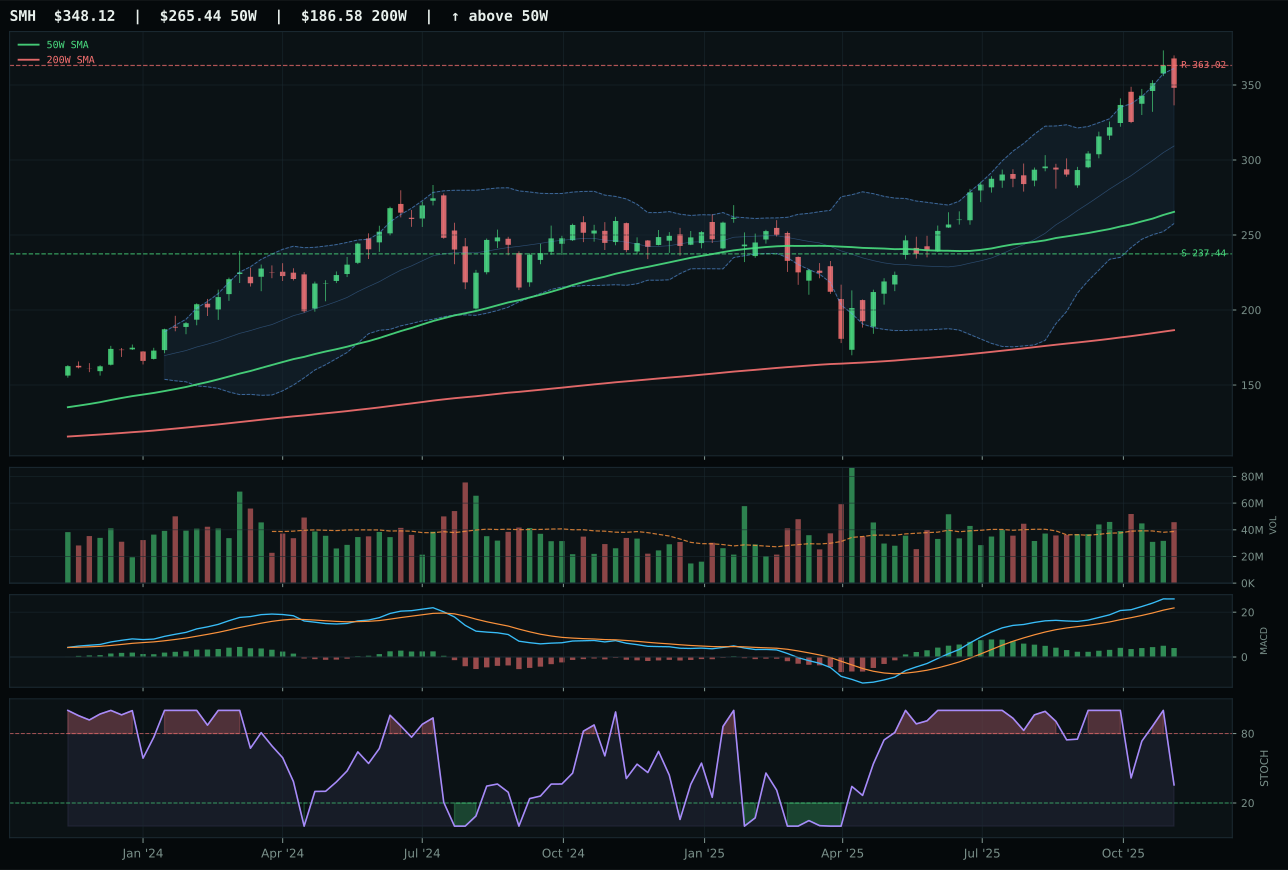
SMH has a vertical extension profile with 13.3% 13-week relative strength versus SPY.
A failed hold above support would weaken the setup.
Actionable but governed by invalidation levels.
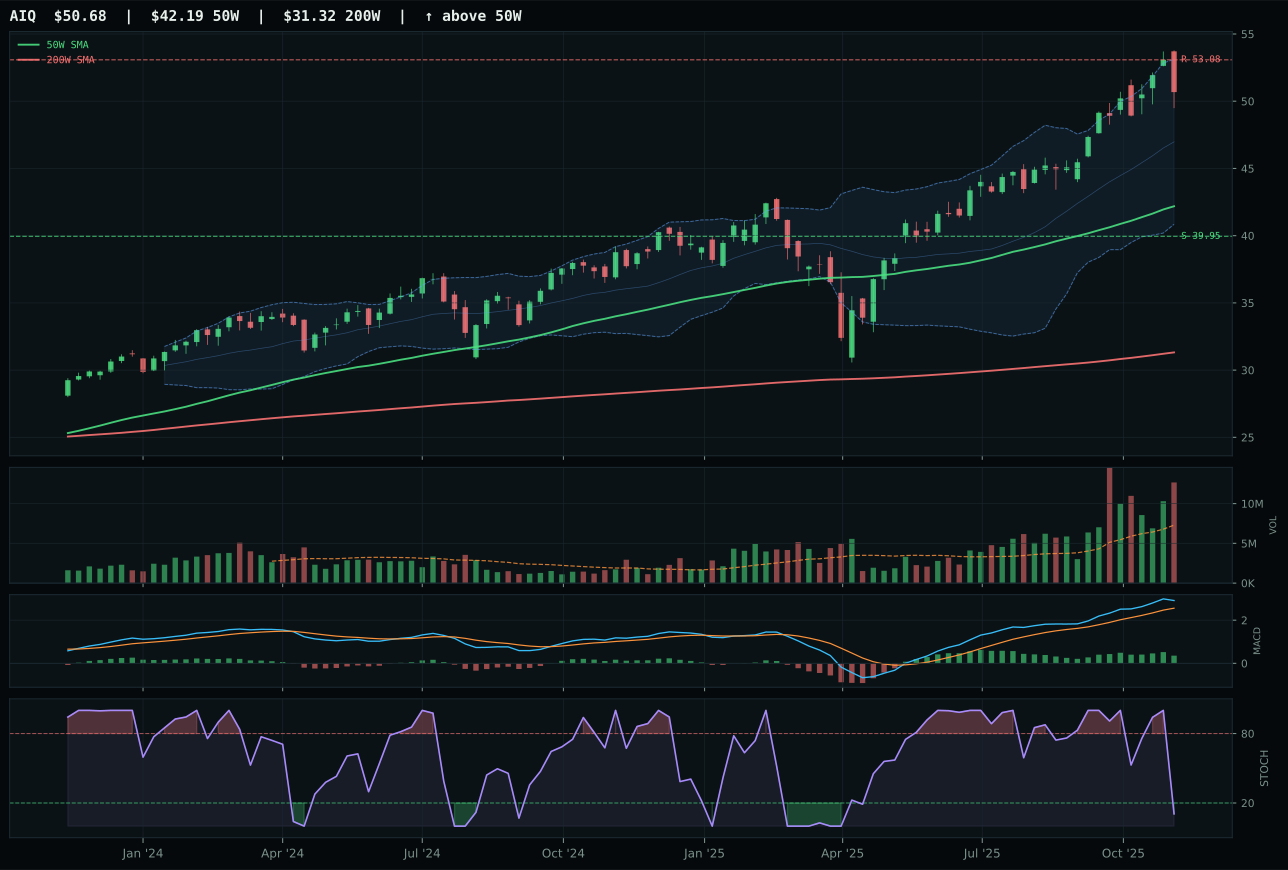
AIQ has a vertical extension profile with 7.5% 13-week relative strength versus SPY.
A failed hold above support would weaken the setup.
Actionable but governed by invalidation levels.
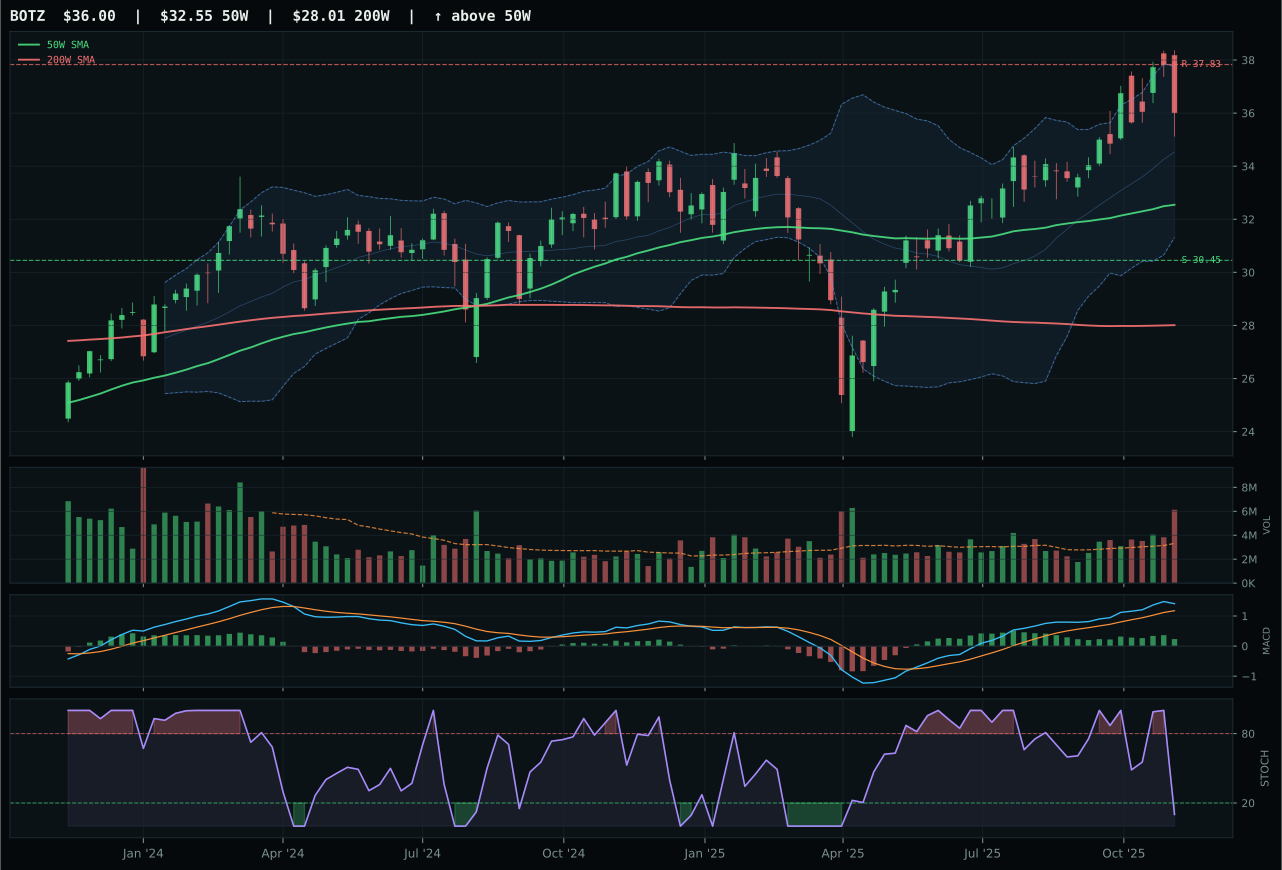
BOTZ has a neutral structure profile with 1.8% 13-week relative strength versus SPY.
A failed hold above support would weaken the setup.
Actionable but governed by invalidation levels.
SMH wins the AI category through a combination of accelerating momentum and disciplined volume confirmation that AIQ could not match. The 18.6% 13W return and 13.3% RS versus SPY reflect genuine buyer engagement at scale — that 1.18x 20W average volume and the bullish-and-improving MACD confirm accumulation rather than distribution. AIQ's technical evidence score sits 47.9 points lower (33.2 vs 81.1), a chasm driven by distribution pressure in volume, flattening MACD, and weaker category-relative strength at 0.0% versus SMH's 5.7%. Both are extended from the 50W and both occupy the upper Fibonacci zone, but SMH's structure is cleaner (78.2 vs 74.0) and its risk/reward is wider (46.6 vs 40.0), suggesting the move has more conviction behind it. The gap is tight in final scores (48.5 vs 48.1), but SMH's persistence and volume-price confirmation edge out AIQ's software breadth thesis.
AI earns 5% allocation as tier-2, despite a final score of 48.5 that sits only 0.9 points below ILF's 49.4. The category's macro fit is genuinely strong at 54.0, with AI growth sponsorship adding +14 and risk appetite positive adding +10, but those tailwinds clash with liquidity stress (-12) and credit stress (-8) in a transition regime where rate expectations remain uncertain. SMH's 81.1 technical evidence score and 100/100 momentum confirmation underscore why this category earned allocation, yet the vertical extension at 31.1% above the 50W and the MACD flattening suggest the move is mature. The category would deserve tier-1 weight if either the macro descriptors shifted more decisively positive or if SMH's timing score (now 53) could rise as price consolidates closer to the 50W. Right now, AI is a 5% commitment to real compute momentum, not a top-2 conviction bet.
Technology — XLK
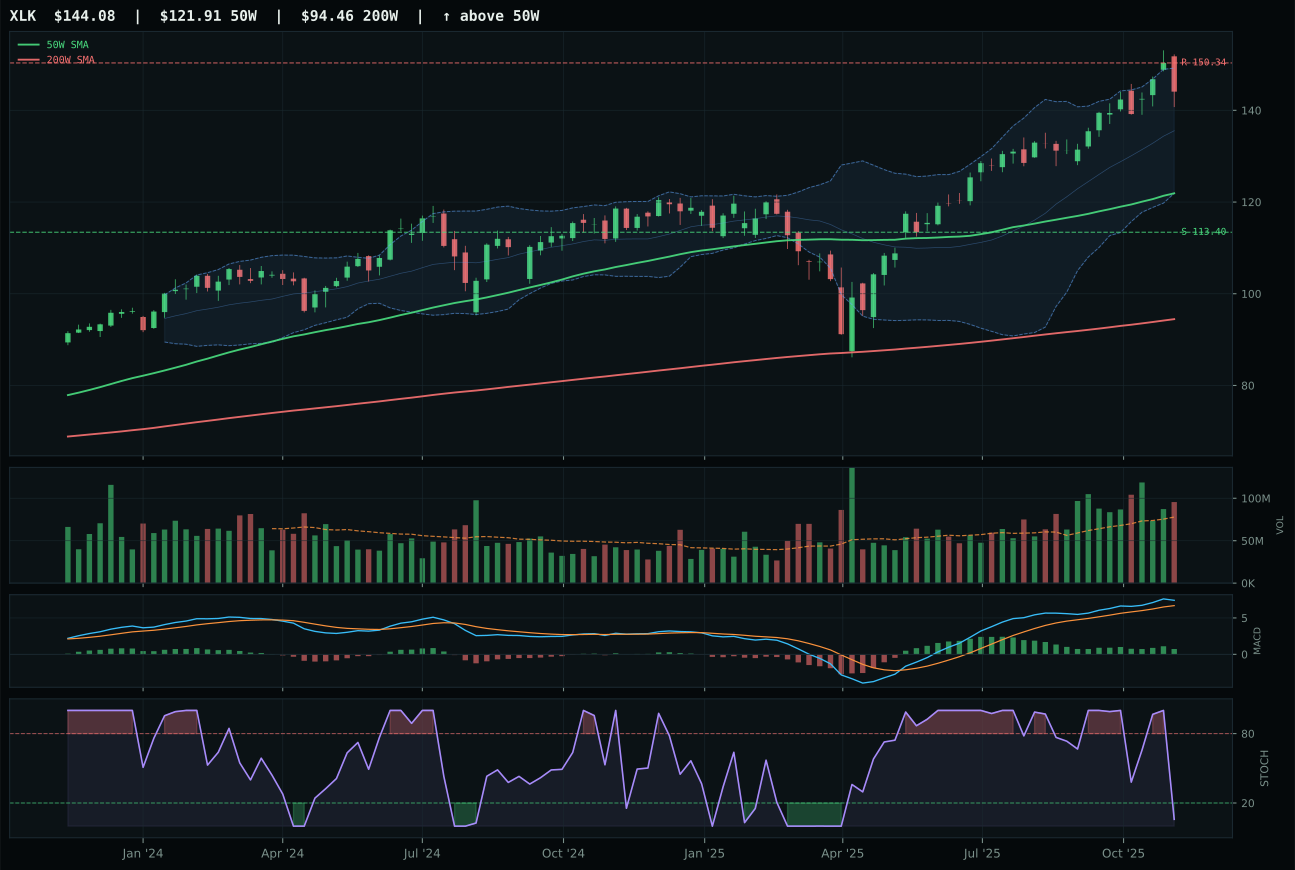
XLK has a vertical extension profile with 3.1% 13-week relative strength versus SPY.
A failed hold above support would weaken the setup.
Actionable but governed by invalidation levels.
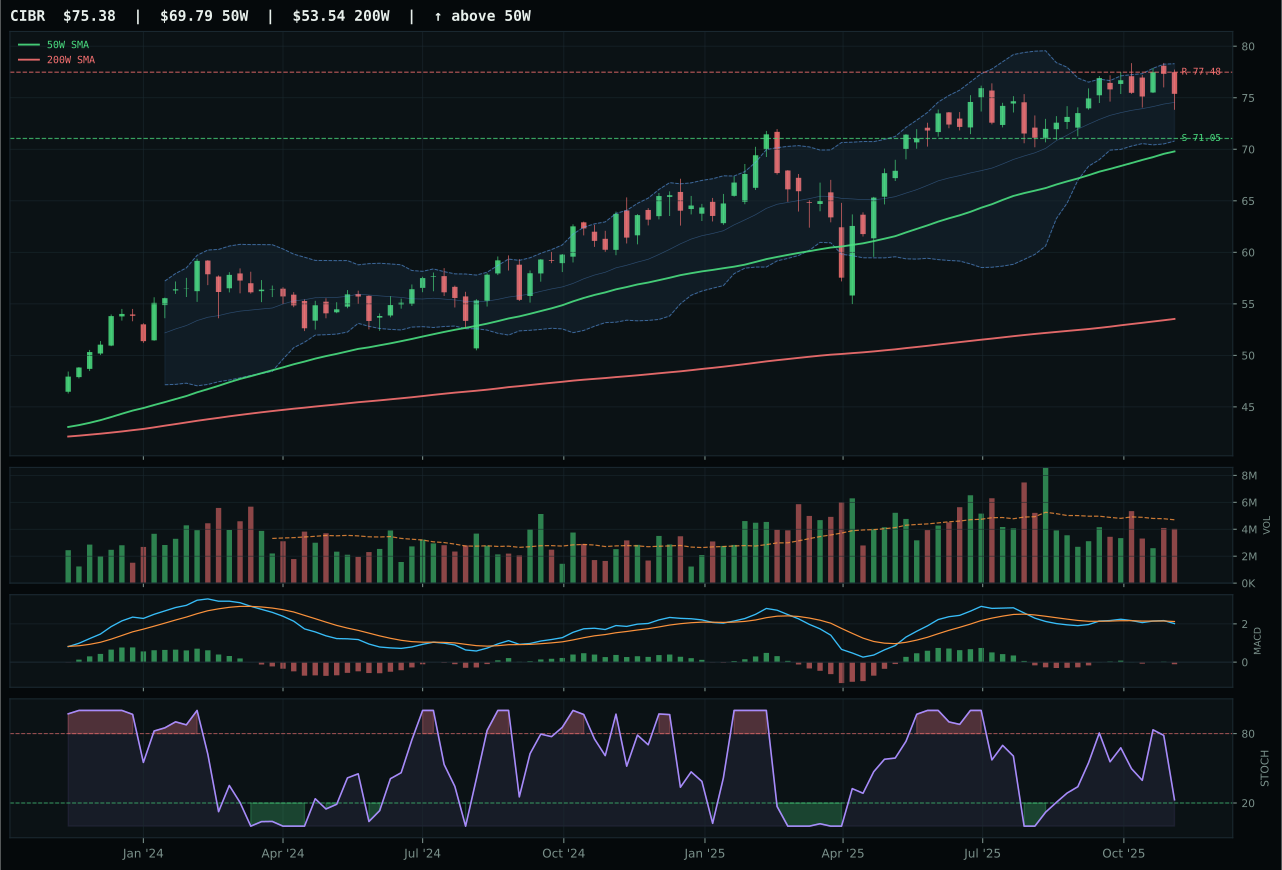
CIBR has a neutral structure profile with 0.7% 13-week relative strength versus SPY.
A failed hold above support would weaken the setup.
Actionable but governed by invalidation levels.
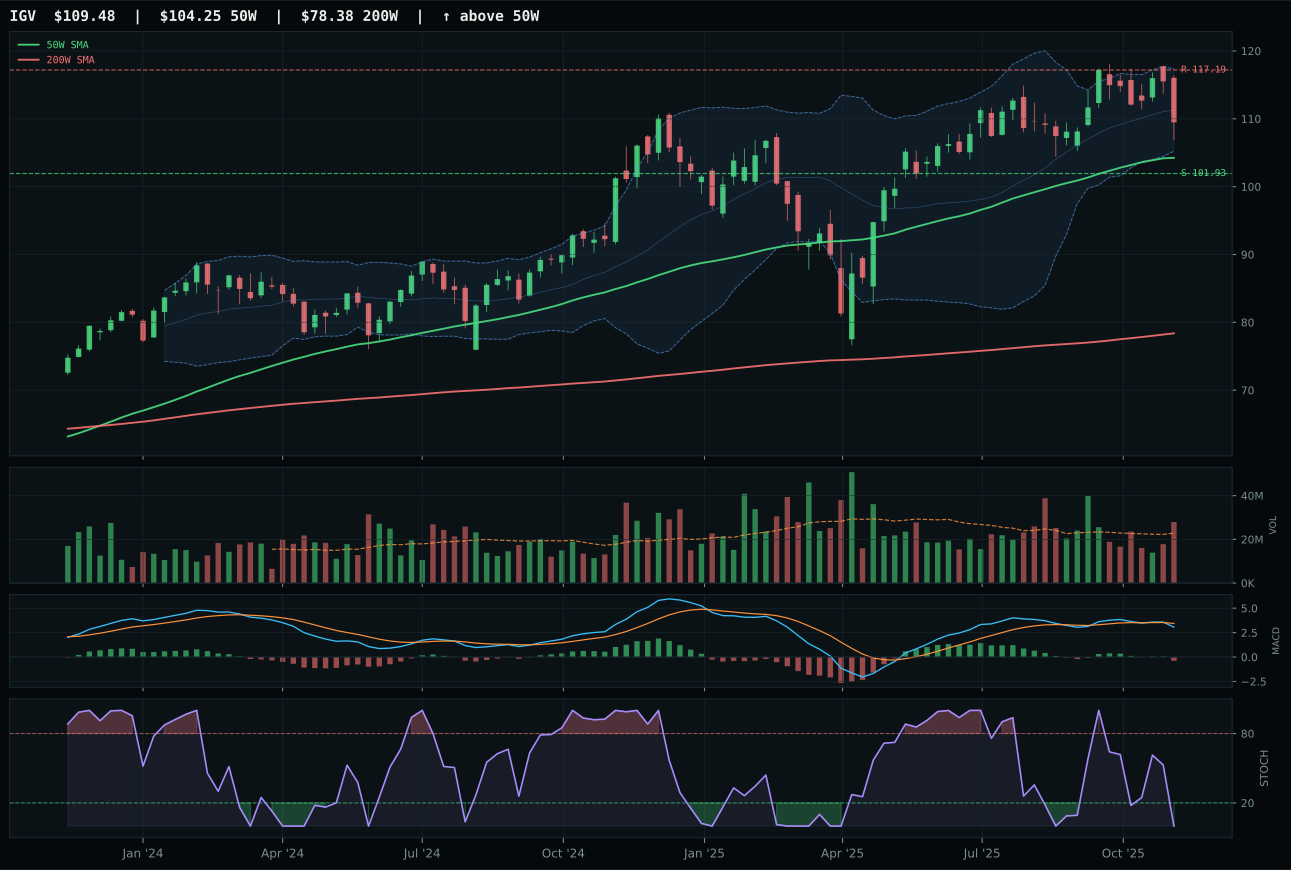
IGV has a neutral structure profile with -5.4% 13-week relative strength versus SPY.
A failed hold above support would weaken the setup.
Actionable but governed by invalidation levels.
XLK claimed the Technology category by maintaining price above both the 50W and 200W moving averages while posting a 50W slope of 0.4% — a non-deteriorating trend that anchors its win. The 3.1% relative strength versus SPY, paired with 2.4% category-relative strength, demonstrates that technology dollars are flowing toward XLK's profitable core holdings rather than spreading across the basket. CIBR, the runner-up, stumbled on MACD confirmation (bearish/weakening versus XLK's bullish but flattening) and failed to generate the same volume participation, leaving its 0.0% category RS a clear technical gap. The setup itself reads as vertical extension — 18.2% above the 50W — which trades upside room for the reality that every new buyer is entering late; that extension penalty is baked into the timing score of 48, explaining why this isn't a tier-1 opportunity despite clean trend structure.
Technology lands at 5% allocation, tier-2 positioning in a portfolio where GLD and ILF earn the dual 10% overweights. The category's 47.9 final score reflects a split decision: XLK's trend work is flawless (100/100), but timing and risk/reward both score in the 48 range because the chart is stretched and macro fit is mixed. The active macro descriptors cut both ways — AI growth sponsorship and risk appetite positive provide tailwind, yet liquidity stress and credit stress each apply a -9 to -10 headwind. In a Transition/Mixed regime, Technology remains a value-add sleeve for equity exposure, but the extended entry and uncertain macro crosscurrents prevent it from earning a top-2 seat. For XLK to move up, either the 50W needs to climb steeply enough to reduce extension risk or MACD needs to transition from flattening to improving — right now it is treading water.
Defense & Aerospace — ITA
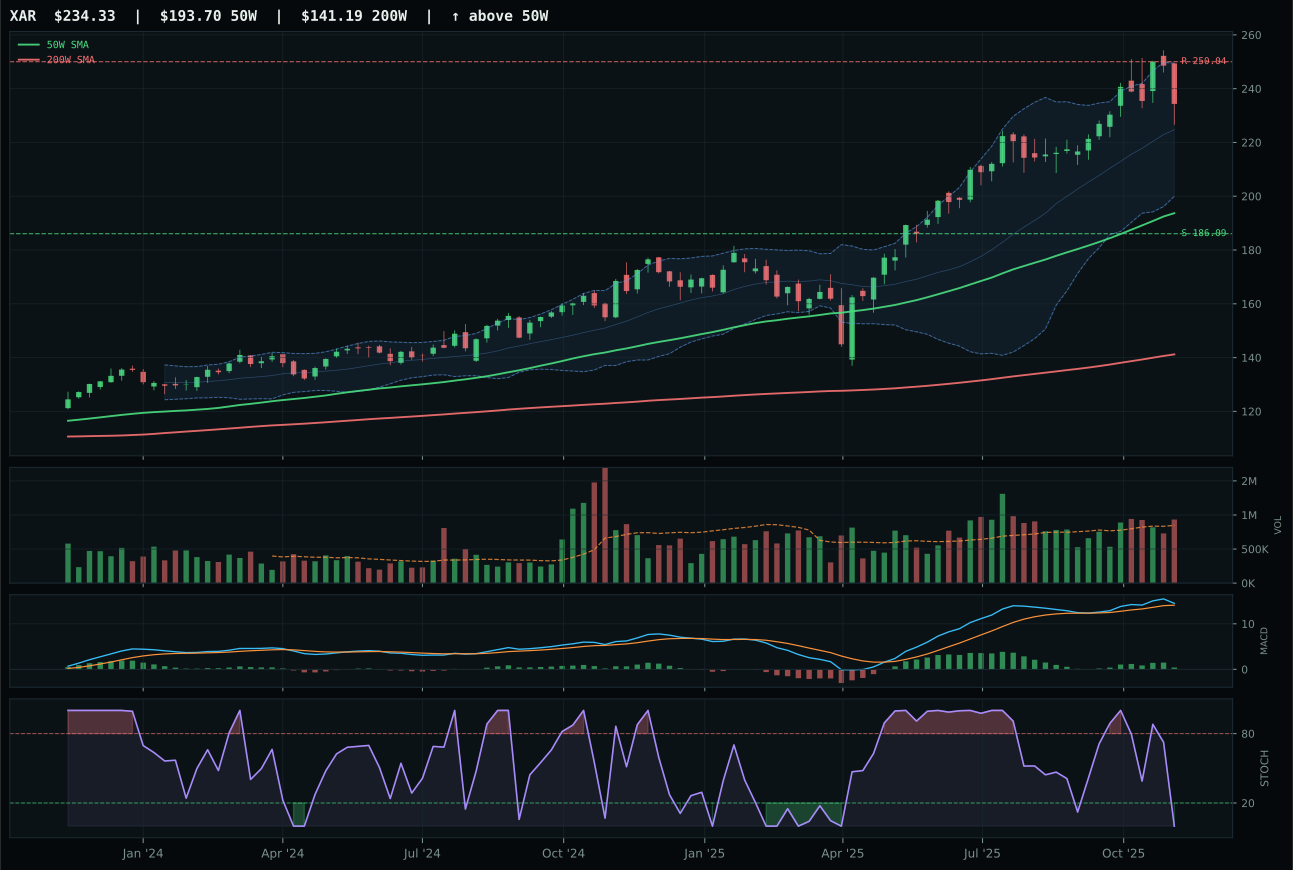
XAR has a vertical extension profile with 4.0% 13-week relative strength versus SPY.
A failed hold above support would weaken the setup.
Actionable but governed by invalidation levels.
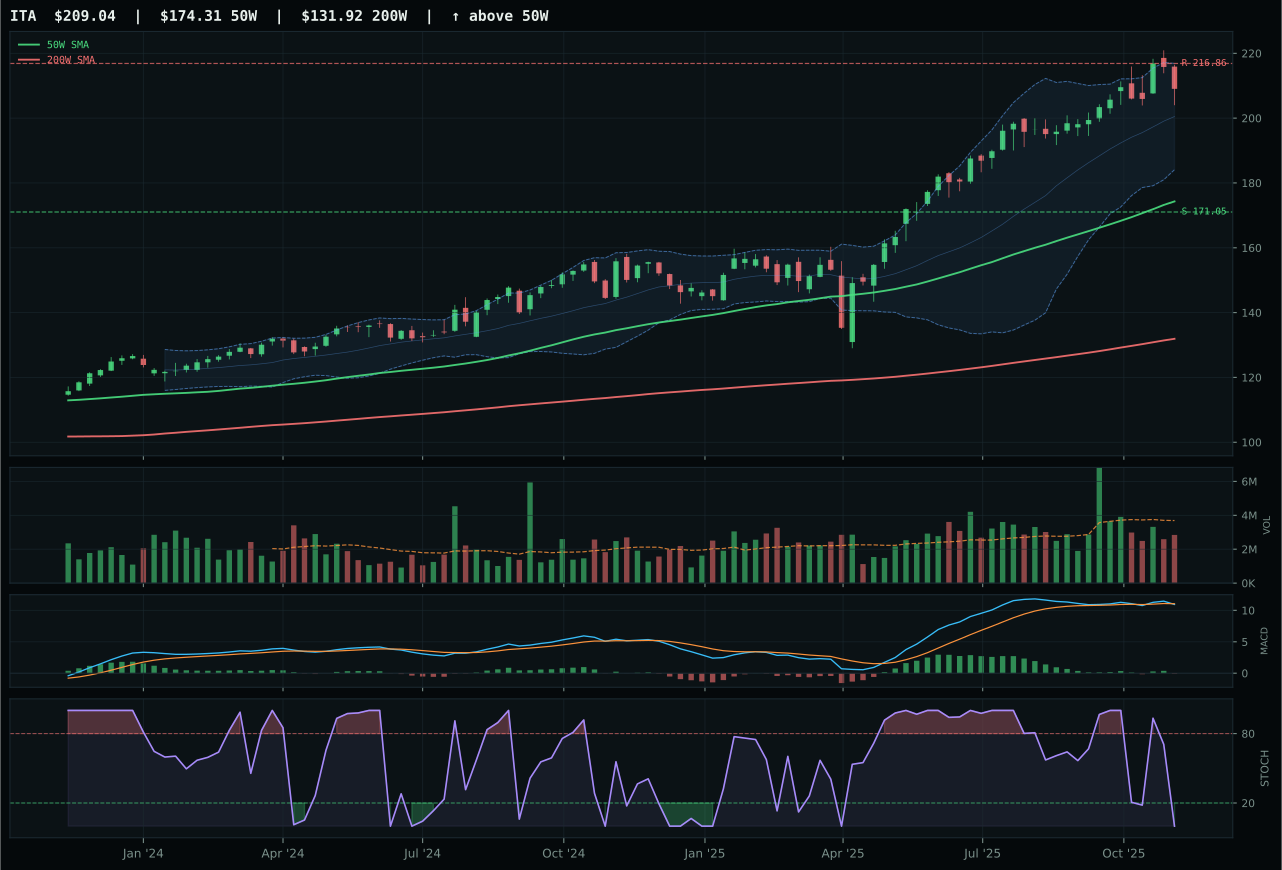
ITA has a vertical extension profile with 1.1% 13-week relative strength versus SPY.
A failed hold above support would weaken the setup.
Actionable but governed by invalidation levels.
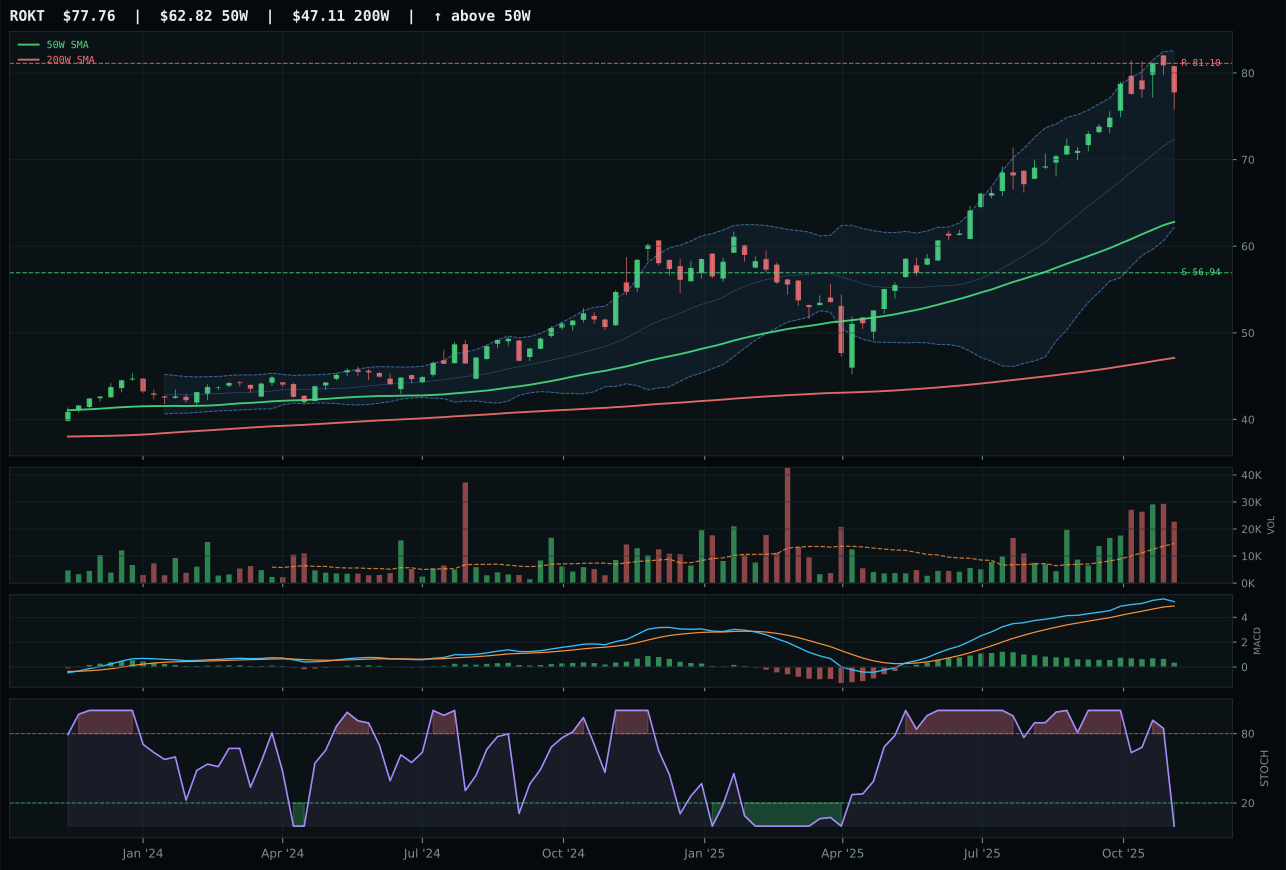
ROKT has a vertical extension profile with 7.3% 13-week relative strength versus SPY.
A failed hold above support would weaken the setup.
Tracked, but not top-2 eligible because: .
ITA wins Defense & Aerospace not because it is the strongest technician in the basket, but because XAR and ROKT's superiority in isolation does not overcome the category's structural fragility. ITA's 29.6 technical evidence score is honest about the weakness — bearish/weakening MACD, oversold stochastic RSI, and neutral volume are red flags. However, the 50W slope is positive at 0.6%, and price remains above both major moving averages, giving ITA the narrowest path to defend versus outright breakdown. XAR scored 67.0 on technical evidence and ROKT generated 38.4 but combined in the 3/2/1 weighted proof order, the basket still came in at just 49.7, then compressed to 43.2 after the category reasoner tested it against timing, risk/reward, and the macro state. This is a case where no ETF in the category is truly prepared for allocation; ITA simply loses less slowly than its alternatives.
Defense & Aerospace receives 5% tier-2 allocation despite a category score of only 43.2, ranking it 8th among the 10 sleeves. The technical evidence is weak across the board; ITA's momentum confirmation sits at 41.9, and even the runner-up XAR's 73 composite does not lift the category above its macro constraints. Liquidity stress (-4) and credit stress are moderate headwinds, while Transition/Mixed regime adds only +3. The category is not broken enough to earn 0% — each of the three ETFs can be defended on trend grounds — but it is weak enough that a 5% slot is the appropriate compromise between acknowledging Defense & Aerospace's historical role as a macro hedge and recognizing that this week's setup lacks the momentum or volume sponsorship to justify elevation. To earn tier-1 status, the category would need either XAR's bullish-and-improving MACD to propagate into rising category-relative strength, or volume participation to climb from neutral to above-average across the basket.
Traditional Energy — XLE
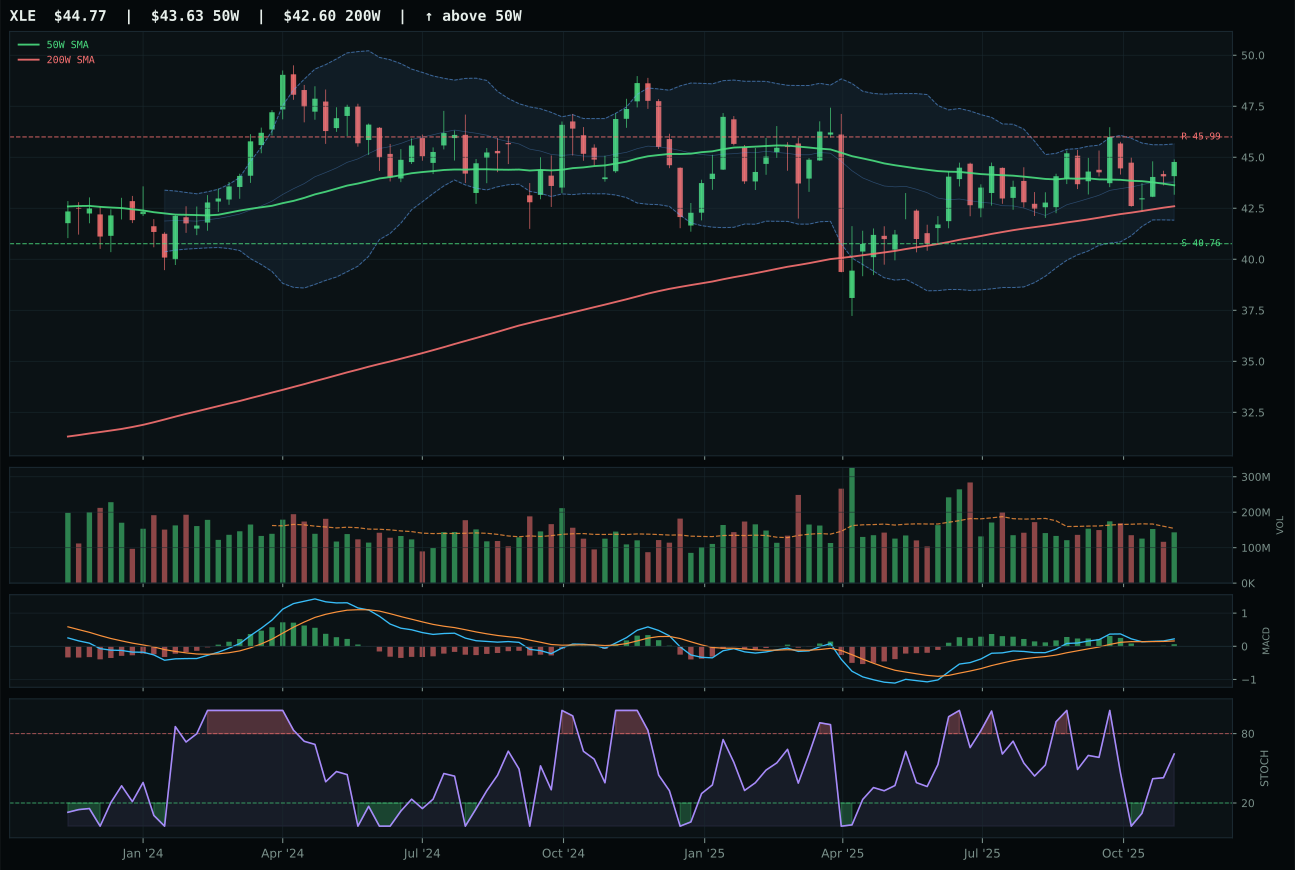
XLE has a compression near 50W profile with 0.1% 13-week relative strength versus SPY.
A failed hold above support would weaken the setup.
Actionable but governed by invalidation levels.
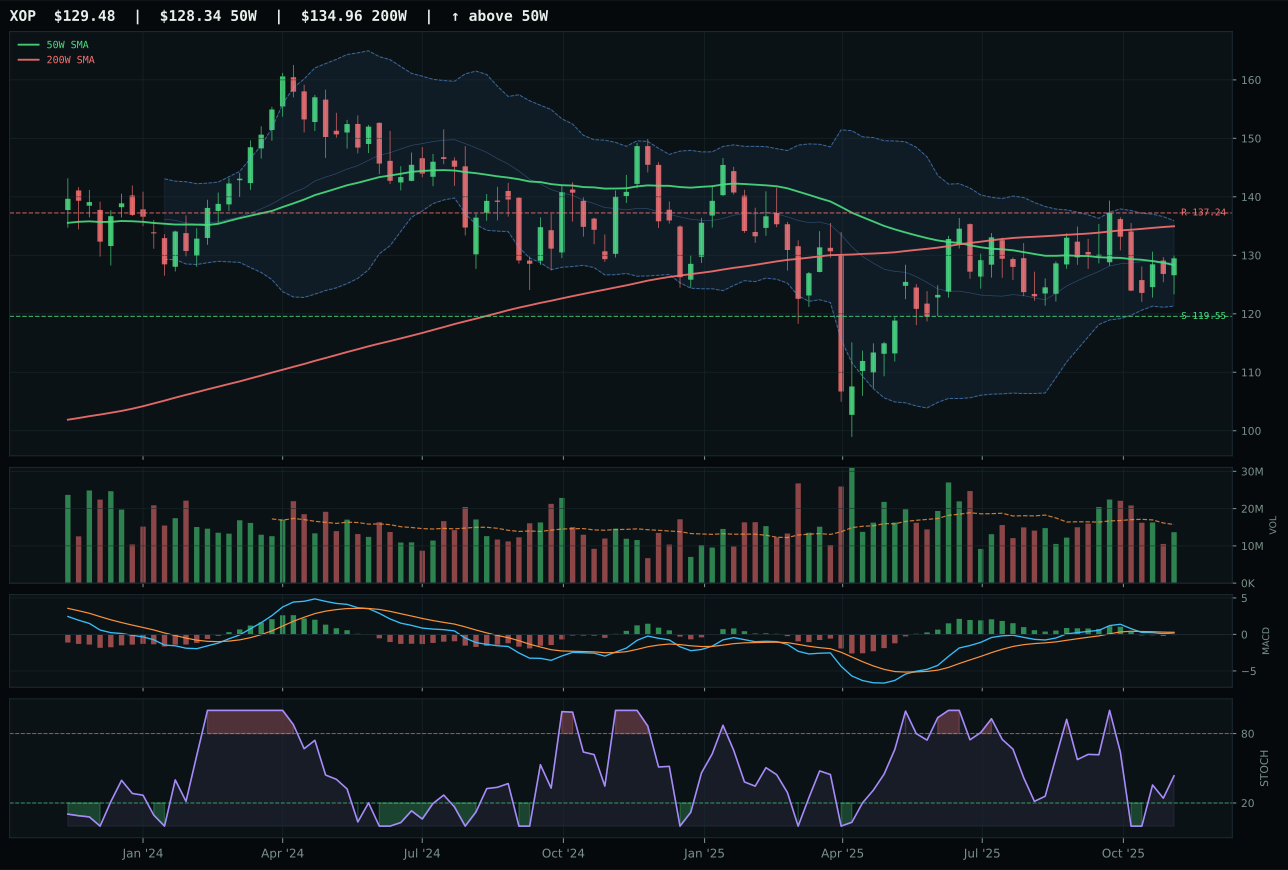
XOP has a compression near 50W profile with -0.0% 13-week relative strength versus SPY.
A failed hold above support would weaken the setup.
Actionable but governed by invalidation levels.
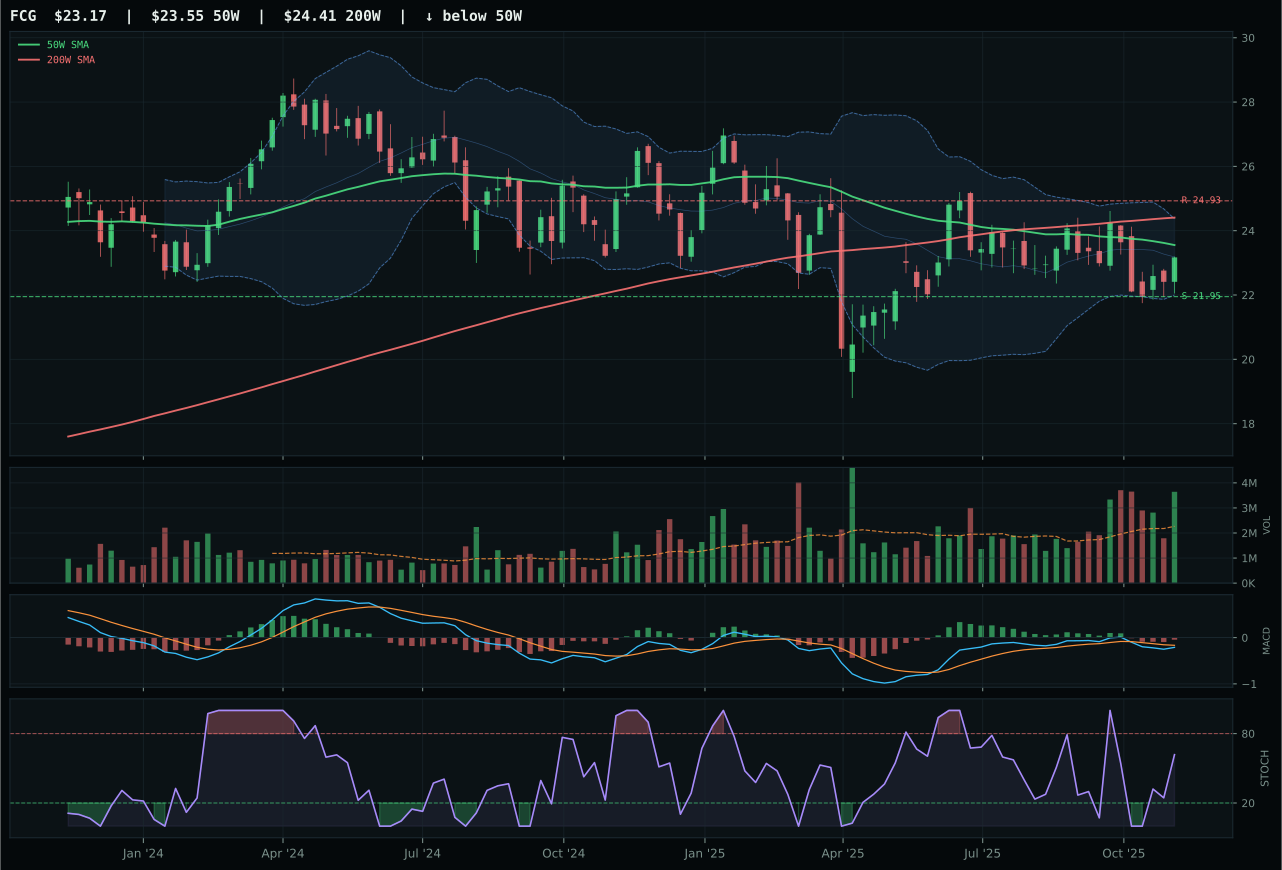
FCG has a compression near 50W profile with -3.8% 13-week relative strength versus SPY.
Extension and support failure are the main tactical risks.
Tracked, but not top-2 eligible because: structurally broken.
XLE wins Traditional Energy on the basis of setup positioning and volume participation, not momentum. The 100/100 timing score — price just 2.6% above the 50W, compressing near support — is the highest in the category and suggests XLE is neither extended nor broken. XOP's timing tied at 100 and its momentum score of 49 exceeded XLE's 71.5, yet XOP's bearish/weakening MACD (versus XLE's bullish but flattening) and neutral structure cost it the win. The real gap emerges in technical evidence: XLE scored 78.4 versus XOP's 46.8, driven by superior volume-price confirmation and persistence. XLE is evaluated as integrated energy cash-flow defense, positioning it as the safer beta than XOP's exploration upside. FCG, the third option, is structurally broken with only 31 trend score and 14 composite, making it a non-contender.
Traditional Energy receives 0% allocation this week, ranked 9th or 10th, despite XLE's respectable 82 composite score. The category-level score of 33.5 reflects a fundamental macro misfit in the Transition/Mixed regime: real asset sponsorship (+7) is outweighed by credit stress (-7) and liquidity stress (-7). Energy is not broken on technicals — XLE's uptrend is intact and timing is optimal — but the macro regime offers no structural support. In a portfolio where GLD and ILF claim the top-2 slots and COPX represents industrial metals scarcity, traditional energy is orphaned: it lacks the monetary hedge story of gold, the emerging-market commodity beta of Latin America, or the scarcity premium of copper. For XLE to earn a 5% slot, either the macro regime would need to shift toward risk appetite dominance or energy would need to show evidence of relative outperformance versus the commodity complex. Right now, that is not happening.
Agriculture & Livestock — WEAT
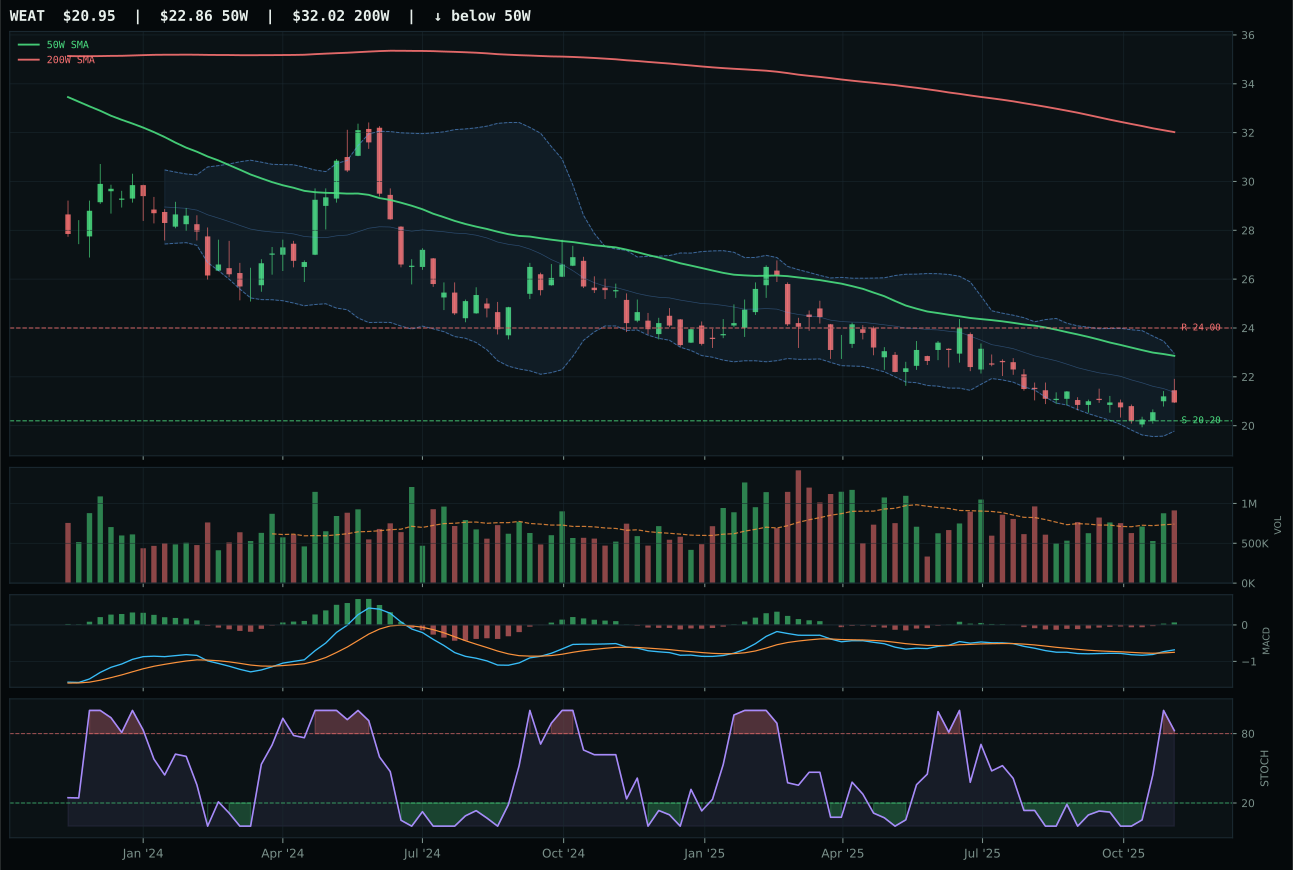
WEAT has a pullback into support profile with -7.9% 13-week relative strength versus SPY.
Extension and support failure are the main tactical risks.
Tracked, but not top-2 eligible because: structurally broken.
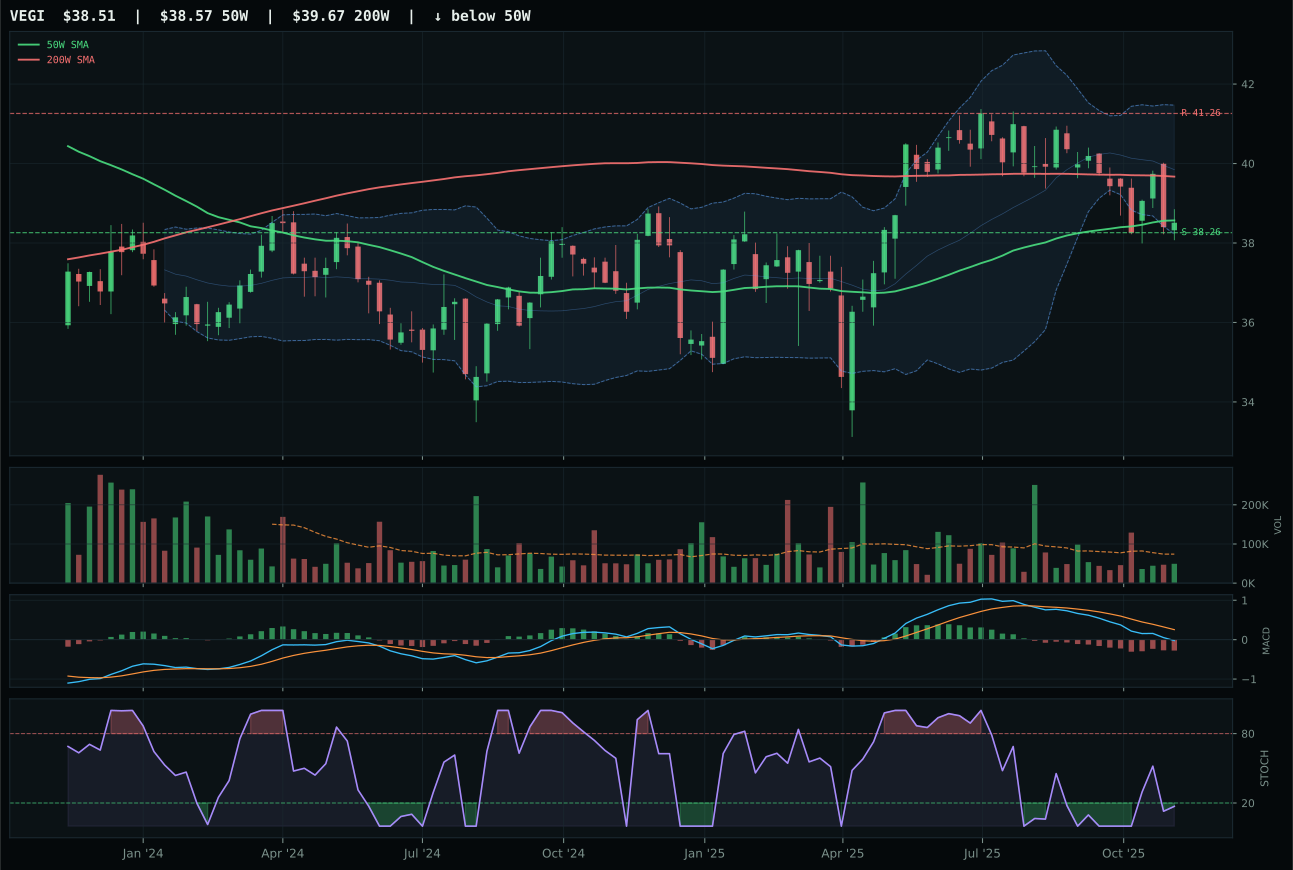
VEGI has a pullback into support profile with -8.9% 13-week relative strength versus SPY.
Extension and support failure are the main tactical risks.
Tracked, but not top-2 eligible because: structurally broken.
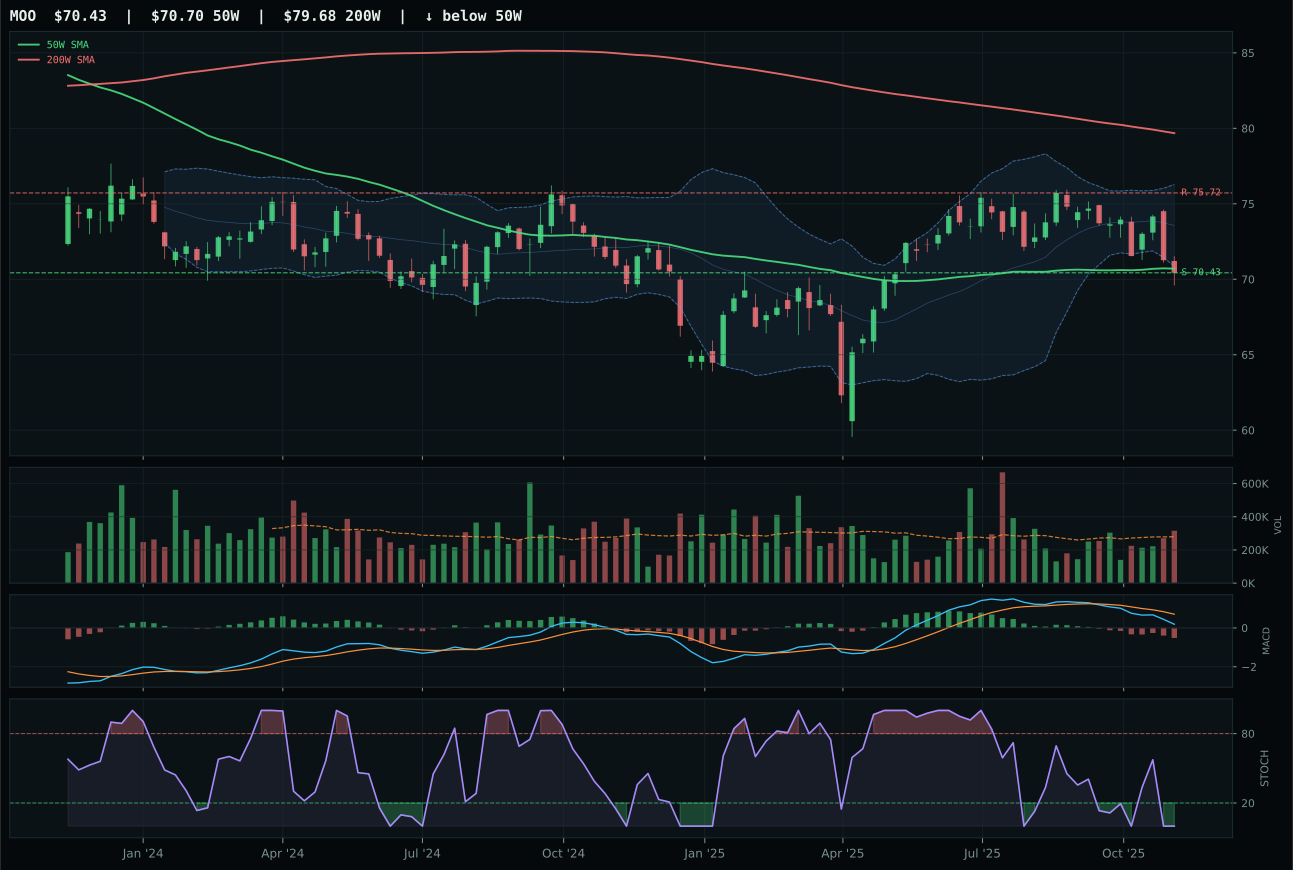
MOO has a pullback into support profile with -8.5% 13-week relative strength versus SPY.
Extension and support failure are the main tactical risks.
Tracked, but not top-2 eligible because: structurally broken.
WEAT wins Agriculture & Livestock by virtue of being the least broken candidate in an ineligible category. The setup is pullback into support at 20.20, with price -8.4% from the 50W, a negative trend that immediately disqualifies the category from tier-1 consideration. What keeps WEAT ahead of VEGI is the above-average participation (1.23x 20W volume) and bullish-and-improving MACD, which frame the pullback as a potential reversal rather than a continued slide. The 85/100 timing score reflects the fact that price is stretched from the 50W in the wrong direction, but MACD is showing early green, giving an asymmetric risk/reward of 90/100 — only 3.7% downside to support versus 12.7% upside to resistance. VEGI's bearish-but-improving MACD and thin participation cannot match that setup quality, and MOO is structurally broken across the board.
Agriculture & Livestock receives 0% allocation this week, ranked 9th or 10th in the category pecking order. The final score of 17.5 reflects an ineligible status — the category failed hard filters because all three ETFs are below their respective 50W moving averages, which in a Transition/Mixed regime with active liquidity stress and no offsetting commodity breadth tailwind is a disqualifying condition. Even though WEAT's timing score of 85 and risk/reward of 90 suggest a coiled reversal setup, the lack of confirmed uptrend bars the category from capital allocation. Macro fit at 59.0 is deceptively strong (real asset sponsorship +8, commodity breadth positive +5), but those positives cannot override structural trend failure. For Agriculture to earn even a 5% tier-3 slot, price would need to break above the 50W with volume confirmation, or liquidity stress would need to flip to liquidity abundance — right now neither condition holds.