
2025-10-31
Informational purposes only. The content in this report, including allocations, analysis, and commentary, is provided solely for informational and educational purposes. It does not constitute financial advice, investment advice, trading advice, or any other type of advice. Past performance does not guarantee future results. Always conduct your own research and consult a qualified financial professional before making investment decisions.
Weekly Allocation
| Ticker | Category | Weight | Role |
|---|---|---|---|
| FBTC | 50% | Overlay | |
| GLD | Precious Metals | 10% | Top-2 (10%) |
| PICK | Industrial Metals | 10% | Top-2 (10%) |
| SMH | AI | 5% | Tier-2 (5%) |
| URA | Nuclear Energy | 5% | Tier-2 (5%) |
| XLK | Technology | 5% | Tier-2 (5%) |
| ILF | Emerging Markets | 5% | Tier-2 (5%) |
| XAR | Defense & Aerospace | 5% | Tier-2 (5%) |
| XLU | Utilities & Infrastructure | 5% | Tier-2 (5%) |
Trade Instructions — Monday Open
Sell the tranche from 2025-10-03 (completing its 4-week hold). Buy the new tranche. Instructions show net portfolio changes — same-asset positions cancel, weight changes show the delta.
| Action | Ticker | Instruction |
|---|---|---|
| SELL | COPX | Sell entire COPX position (2.50% of portfolio) |
| SELL | SLV | Sell 50% of SLV position (reduce 5.00% → 2.50%) |
| SELL | XLE | Sell 33% of XLE position (reduce 3.75% → 2.50%) |
| BUY | GLD | Buy GLD — 40.00% of freed cash (adds 2.50% to portfolio) |
| BUY | PICK | Buy PICK — 40.00% of freed cash (adds 2.50% to portfolio) |
| BUY | ILF | Buy ILF — 20.00% of freed cash (adds 1.25% to portfolio) |
Current Portfolio After Trade
Combined holdings across all 4 active tranches. Each tranche is 25% of the portfolio.
| Ticker | % of Portfolio | Weight Bar |
|---|---|---|
| FBTC | 50.00% | |
| SMH | 6.25% | |
| XLU | 6.25% | |
| GLD | 6.25% | |
| XAR | 5.00% | |
| XLK | 5.00% | |
| REMX | 5.00% | |
| URA | 3.75% | |
| XLE | 2.50% | |
| SLV | 2.50% | |
| NLR | 2.50% | |
| PICK | 2.50% | |
| IEMG | 1.25% | |
| ILF | 1.25% |
Macro Regime — Transition / Mixed
Macro Evidence Charts
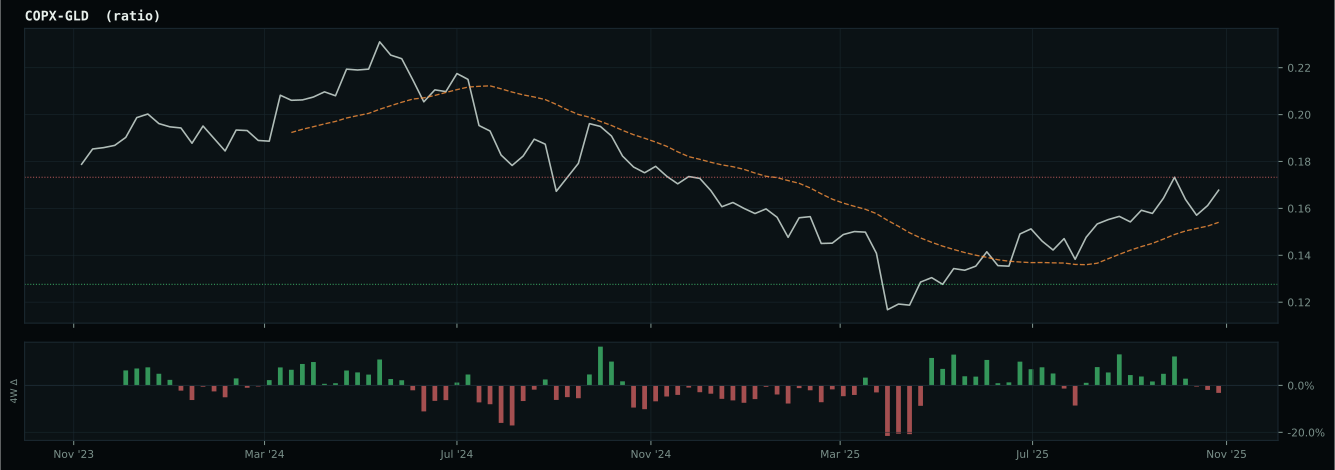
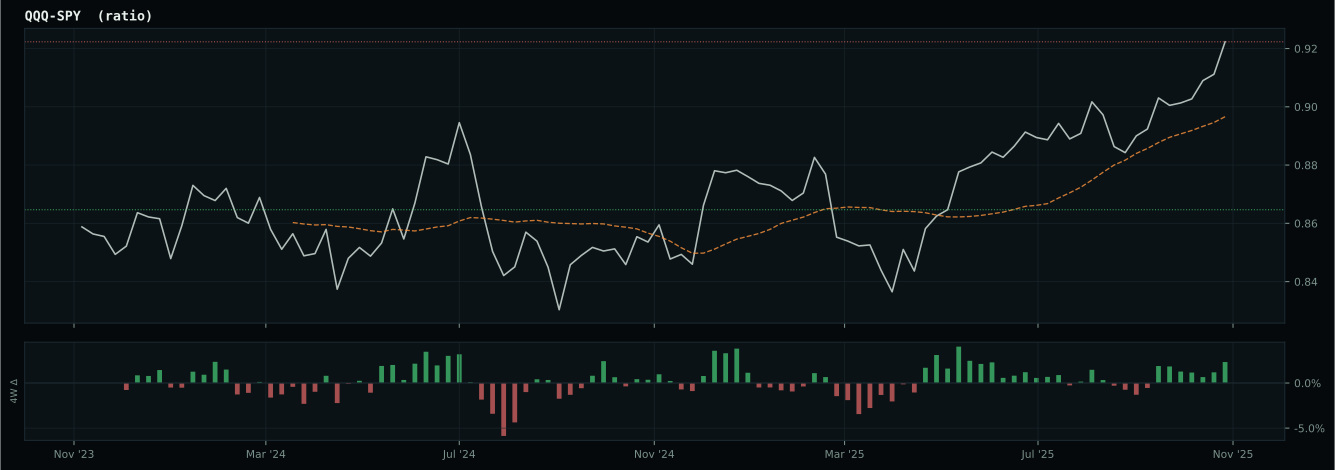
Market-implied signals behind the macro regime scores. Each ratio compares two assets; the direction and slope of the ratio is what the macro engine reads.
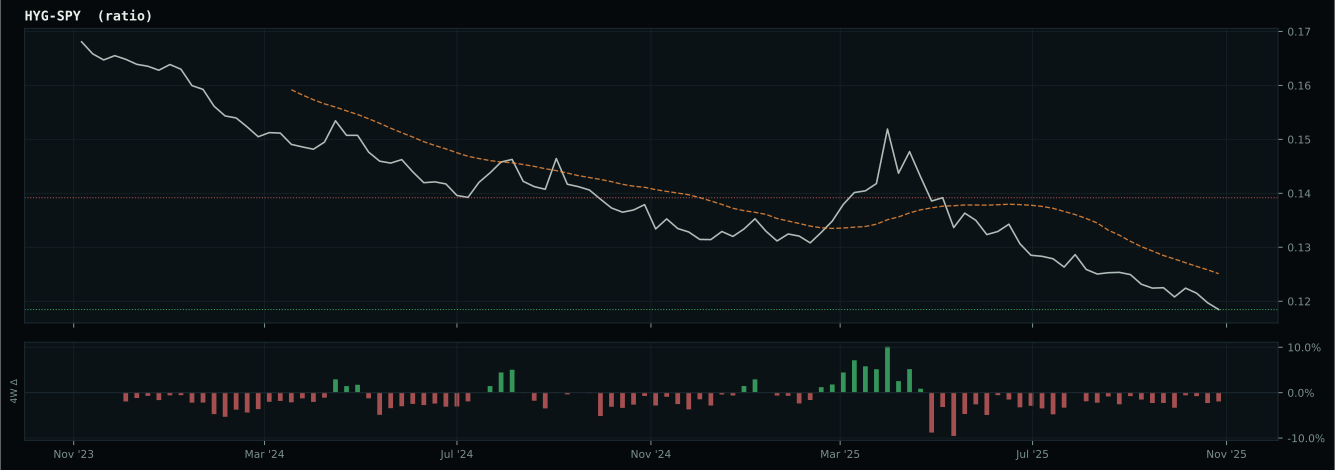
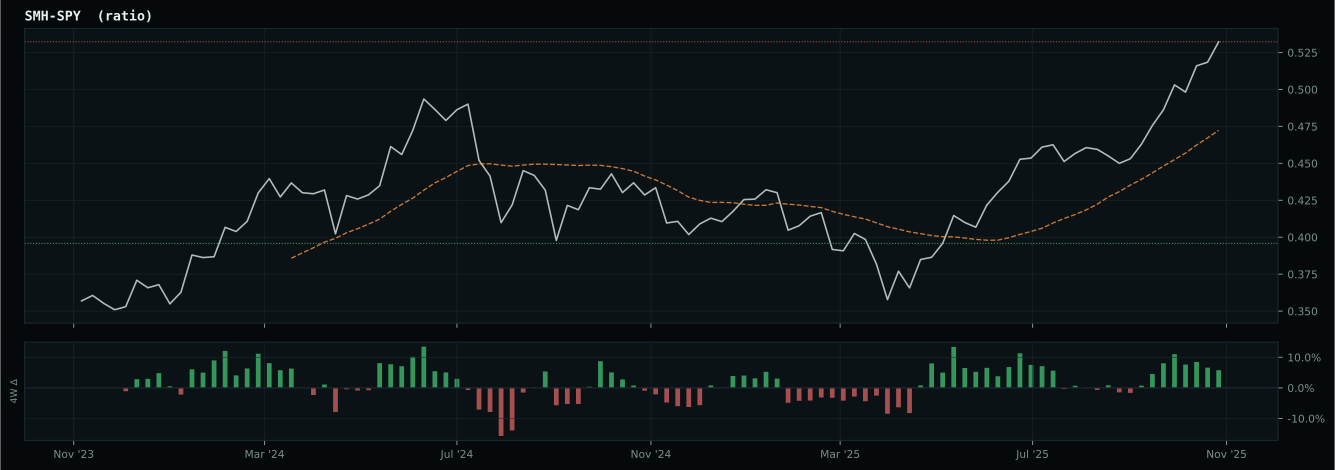
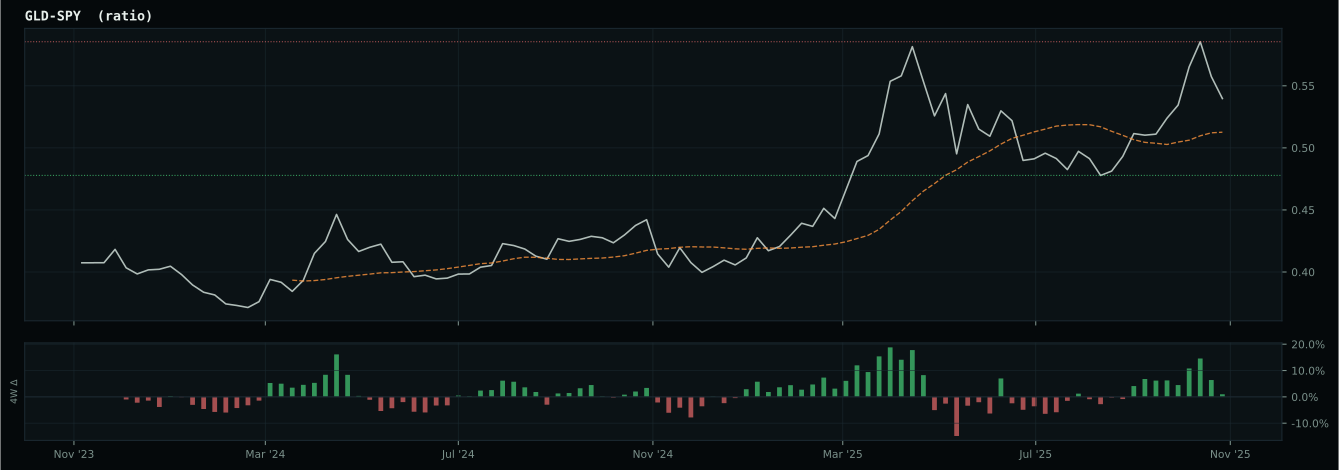
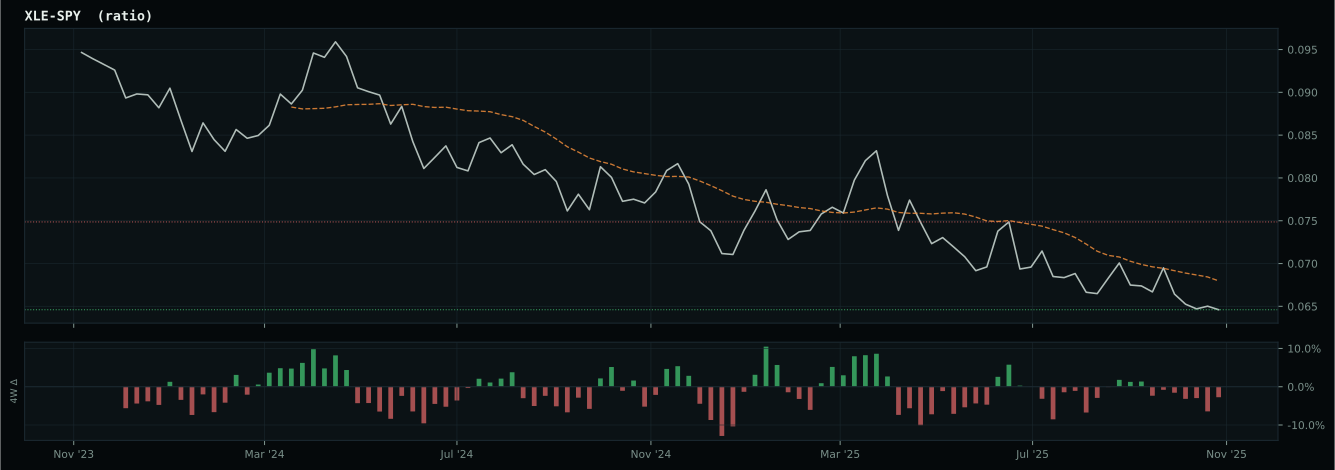
Crypto Regime — TrendBTC
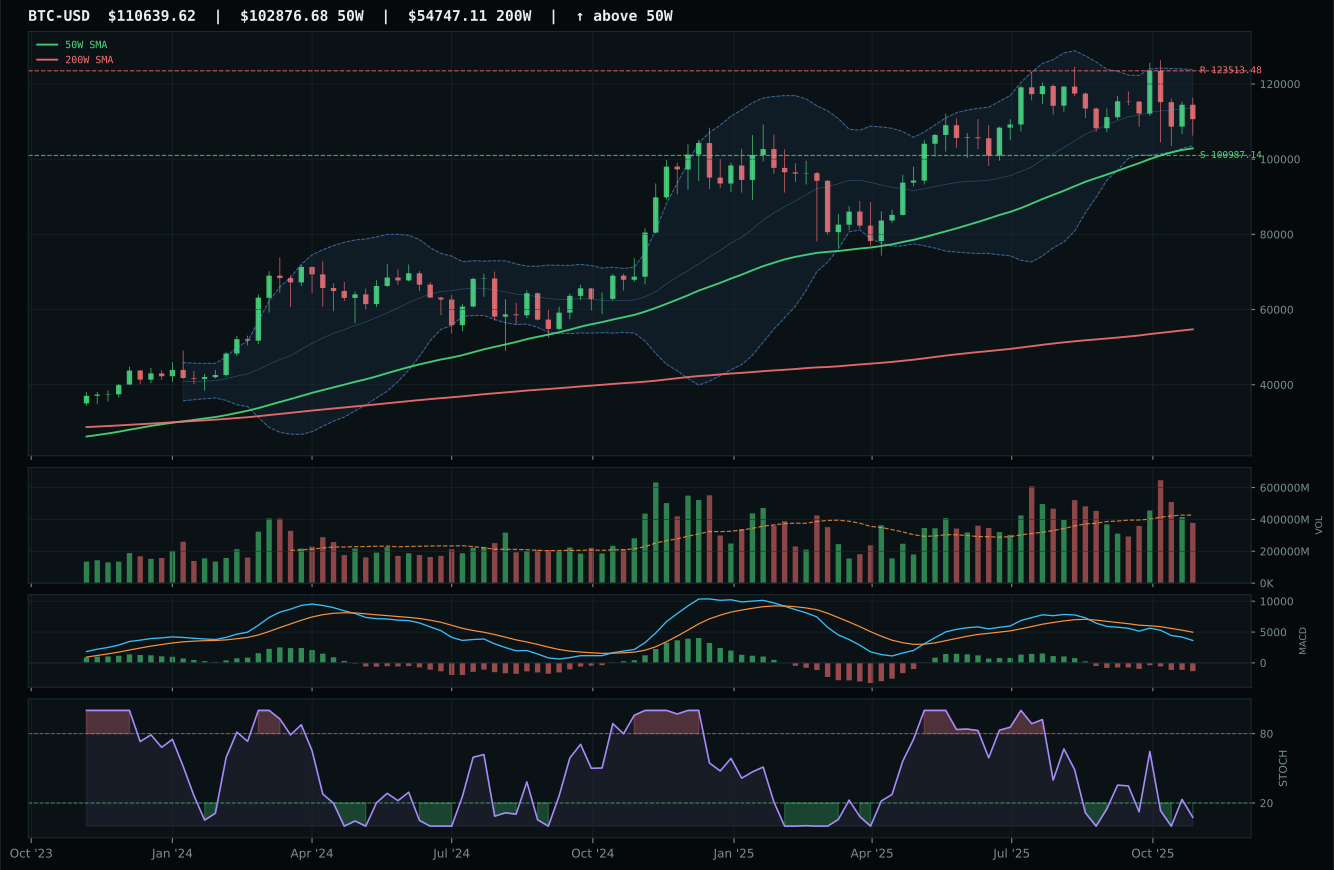
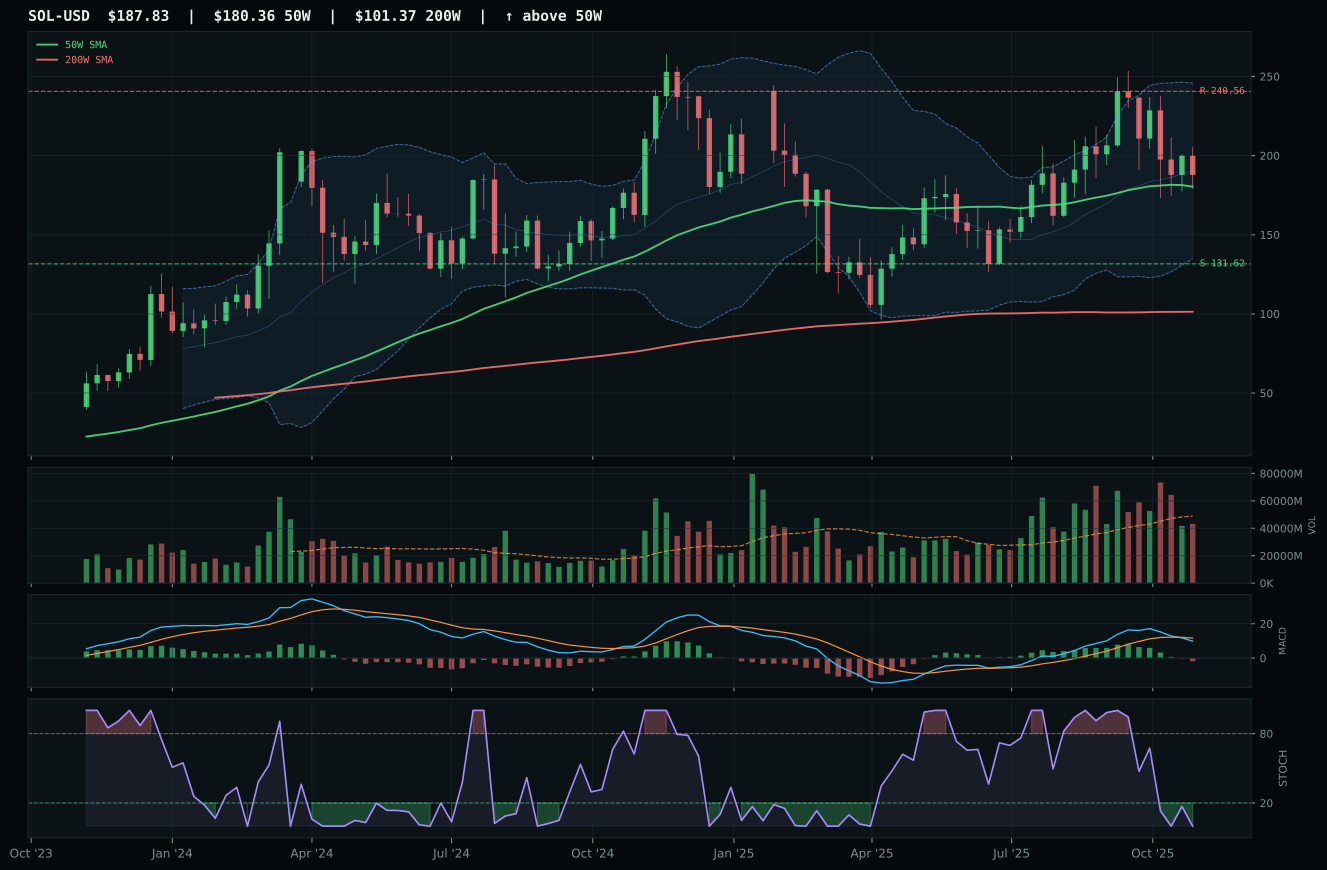
ValueBTC not armed: BTC has not made the first post-breakdown touch of the 200W buy zone after losing the 50W
TrendBTC confirmed: 2 consecutive closes above rising/flat 50W SMA
one or more available conditions failed
Category Rankings
| Rank | Category | Winner | Score | Alloc | 4W Ret | Peers (4W) |
|---|---|---|---|---|---|---|
| 1 | Precious Metals | GLD | 70.3 | 20% | +5.88% | GDX +17.1% · SLV +17.5% |
| 2 | Industrial Metals | PICK | 68.2 | 20% | +3.37% | COPX +7.4% · REMX +7.8% |
| 3 | AI | SMH | 66.6 | 10% | -5.12% | AIQ -7.6% · BOTZ -8.1% |
| 4 | Nuclear Energy | URA | 62.7 | 10% | -18.82% | URNM -13.2% · NLR -16.7% |
| 5 | Technology | XLK | 59.2 | 10% | -6.63% | CIBR -5.5% · IGV -11.2% |
| 6 | Emerging Markets | ILF | 55.3 | 10% | +4.83% | IEMG -2.7% · INDA +0.1% |
| 7 | Defense & Aerospace | XAR | 50.8 | 10% | -8.55% | ITA -5.8% · ROKT -5.2% |
| 8 | Utilities & Infrastructure | XLU | 47.2 | 10% | +1.22% | PAVE -0.3% · IGF +3.1% |
| 9 | Agriculture & Livestock | MOO | 18.8 | 0% | +2.60% | WEAT -3.5% · VEGI +1.4% |
| 10 | Traditional Energy | XLE | 11.0 | 0% | +2.76% | XOP +5.9% · FCG +9.7% |
Precious Metals — GLD
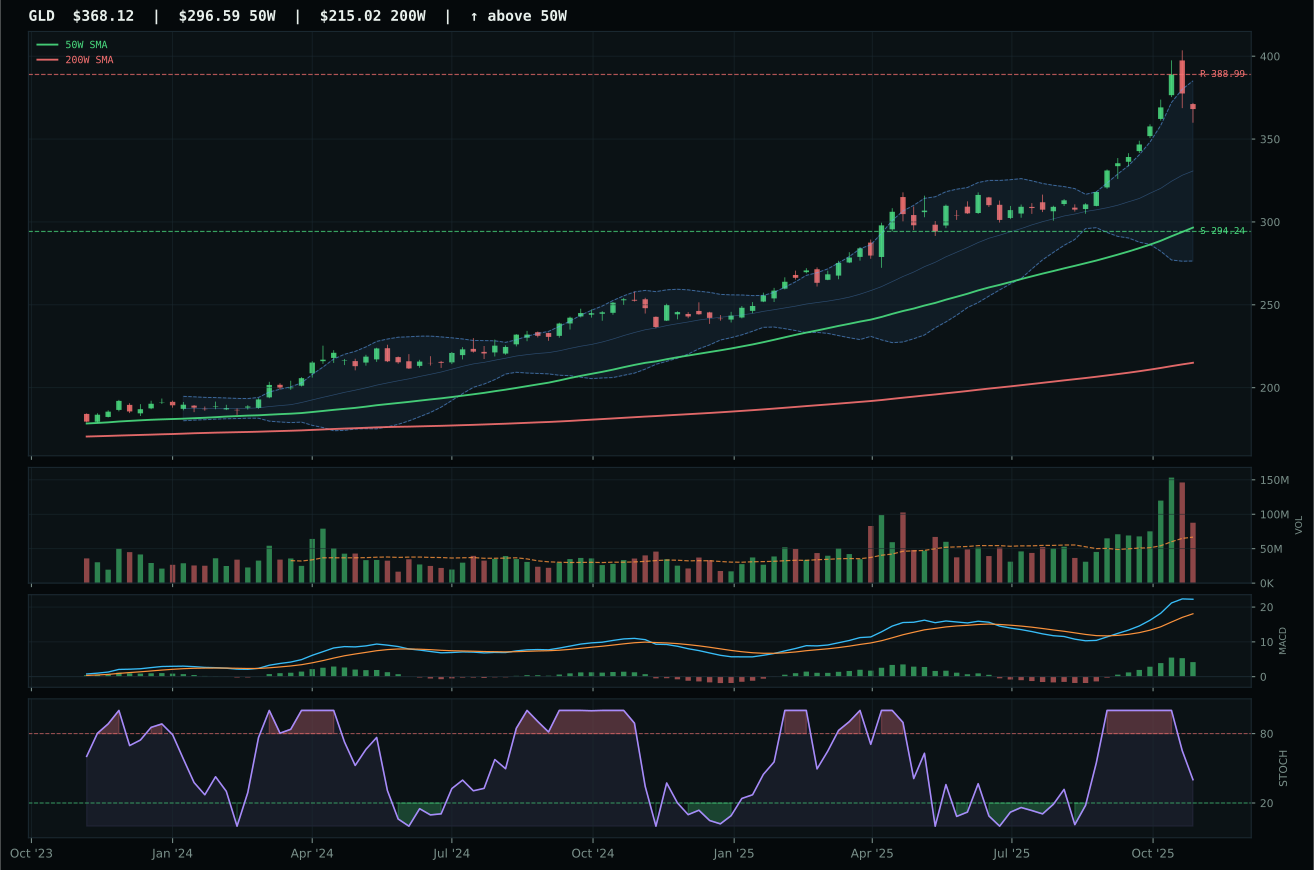
GLD has a vertical extension profile with 9.4% 13-week relative strength versus SPY.
A failed hold above support would weaken the setup.
Actionable but governed by invalidation levels.
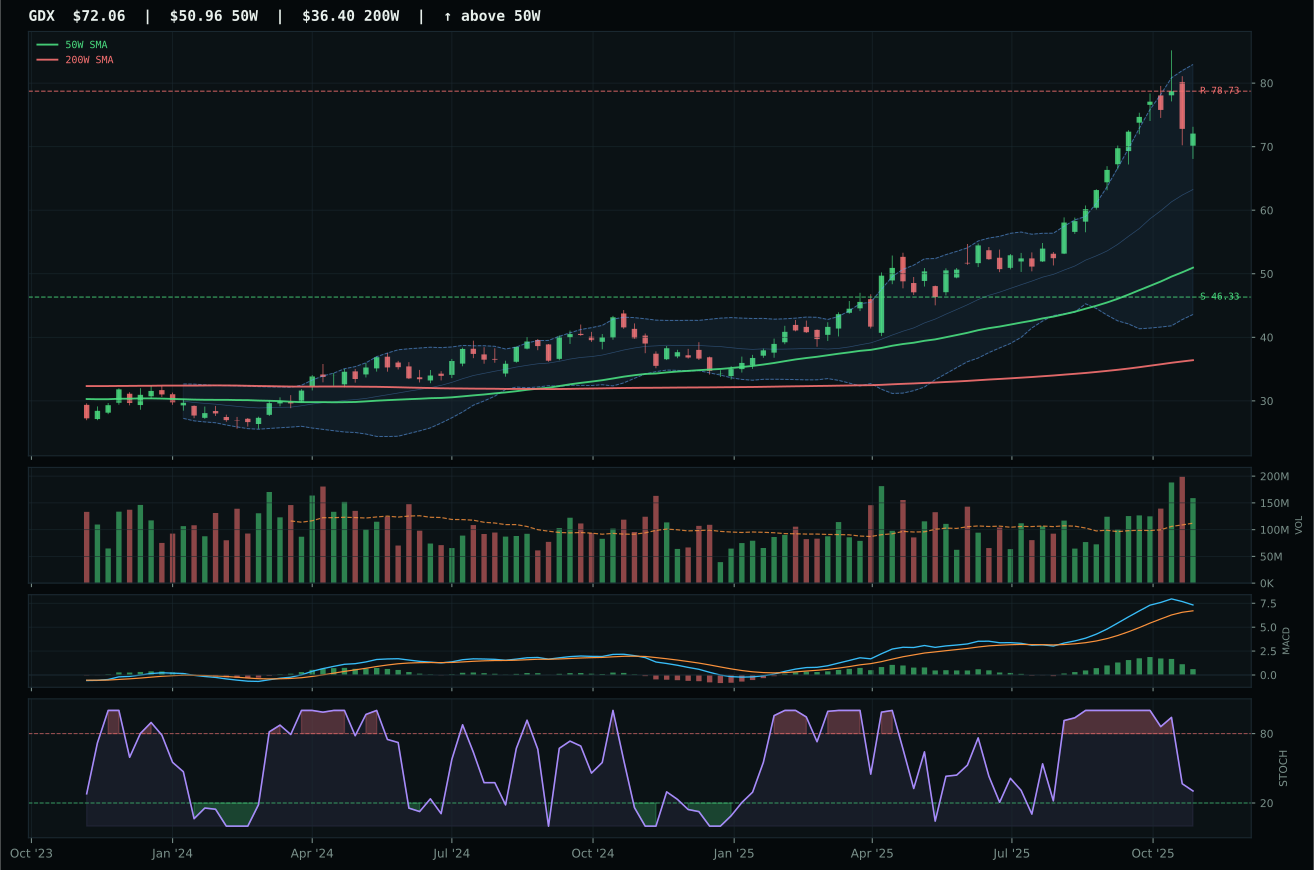
GDX has a vertical extension profile with 27.7% 13-week relative strength versus SPY.
A failed hold above support would weaken the setup.
Actionable but governed by invalidation levels.
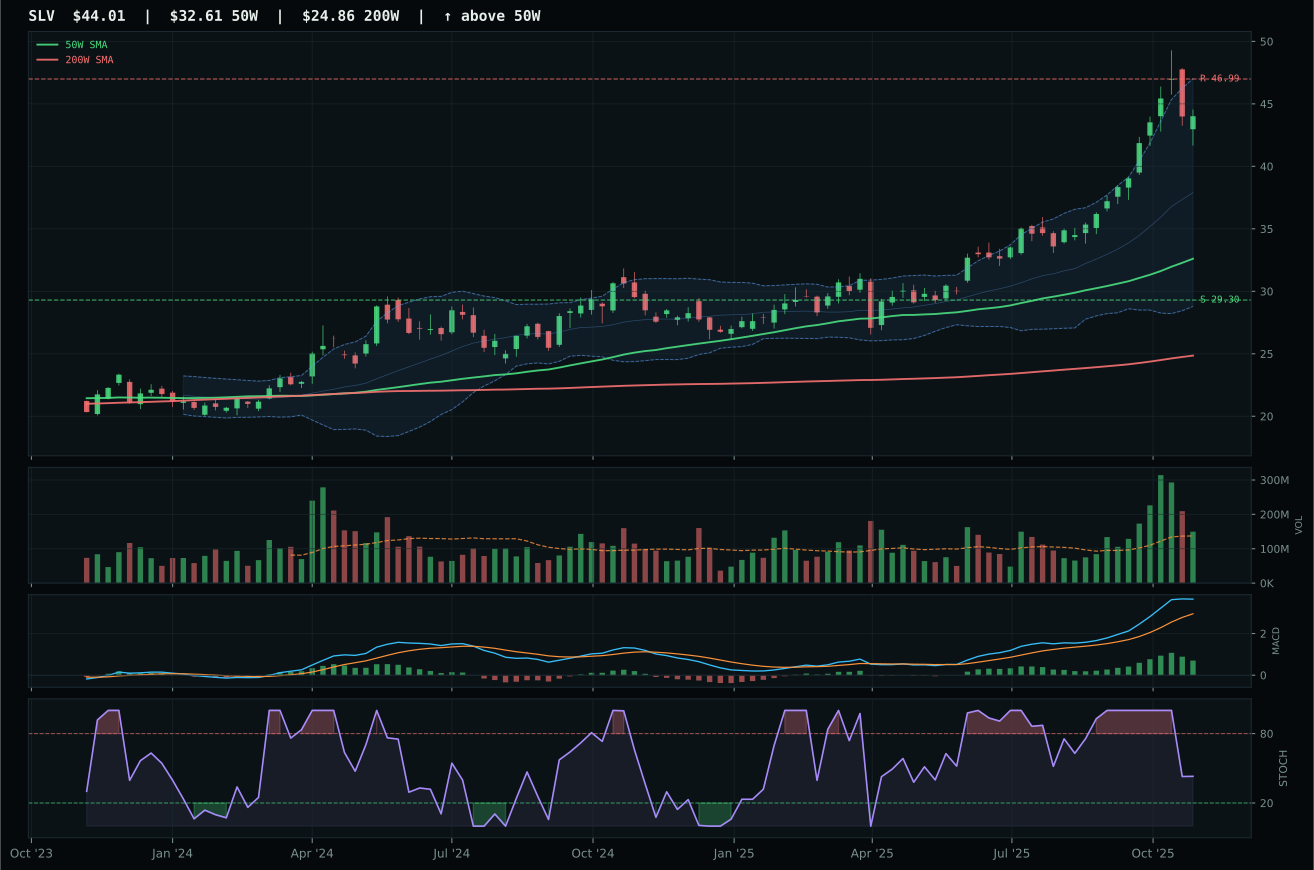
SLV has a vertical extension profile with 21.3% 13-week relative strength versus SPY.
A failed hold above support would weaken the setup.
Actionable but governed by invalidation levels.
GLD wins decisively over runner-up GDX on the quality of its extension and trend confirmation. Price sits 24.1% above the 50W with a 0.9% slope, MACD bullish and improving, and stochastic RSI falling/neutral at 0.40—this is a cleaner, less overbought posture than GDX's equivalent levels at 41.4% extension and flattening MACD. GLD's structure scores 82.3 versus GDX's 78.7, and the category-relative strength gap (-11.9% for GLD, +6.4% for GDX) reveals that GLD is rising because it is the cleaner monetary hedge, not because miners are outpacing spot. Critically, GLD's volume is above-average participation (1.31x) while maintaining MACD improvement, suggesting new money is entering the position rather than existing holders rotating. The 19.1% 13-week return trails GDX's 37.4%, but GLD's 48.9 risk-reward score bests GDX's 47.8, meaning GLD offers better risk symmetry for the trend quality delivered.
Precious Metals ranks top-2 and earns 10% allocation, with GLD as the category representative. The 70.3 category score reflects strong macro alignment: monetary hedge bid is active (+14), and although risk appetite is positive (-4 to the category), this headwind is outweighed by the liquidity-stress and credit-stress environment driving haven demand. Technical evidence supports this thesis at 79.4/100 for GLD, combining 100.0 trend score with 86.5 momentum confirmation and 65.8 volume-price sponsorship. GLD's timing score (53.0/100) is moderate because extension is 24.1%—not extreme, but enough to penalize entry risk—yet the volume participation above average signals institutional adoption rather than retail capitulation. The portfolio weights this at 10% (top-2 conviction) because the Transition/Mixed macro regime, combined with liquidity and credit stress, justifies sustained demand for gold as both portfolio insurance and yield-free safe harbor. Any break below support at 294.24 would test category conviction; until then, GLD's structure integrity and MACD improvement support maintaining allocation.
Industrial Metals — PICK
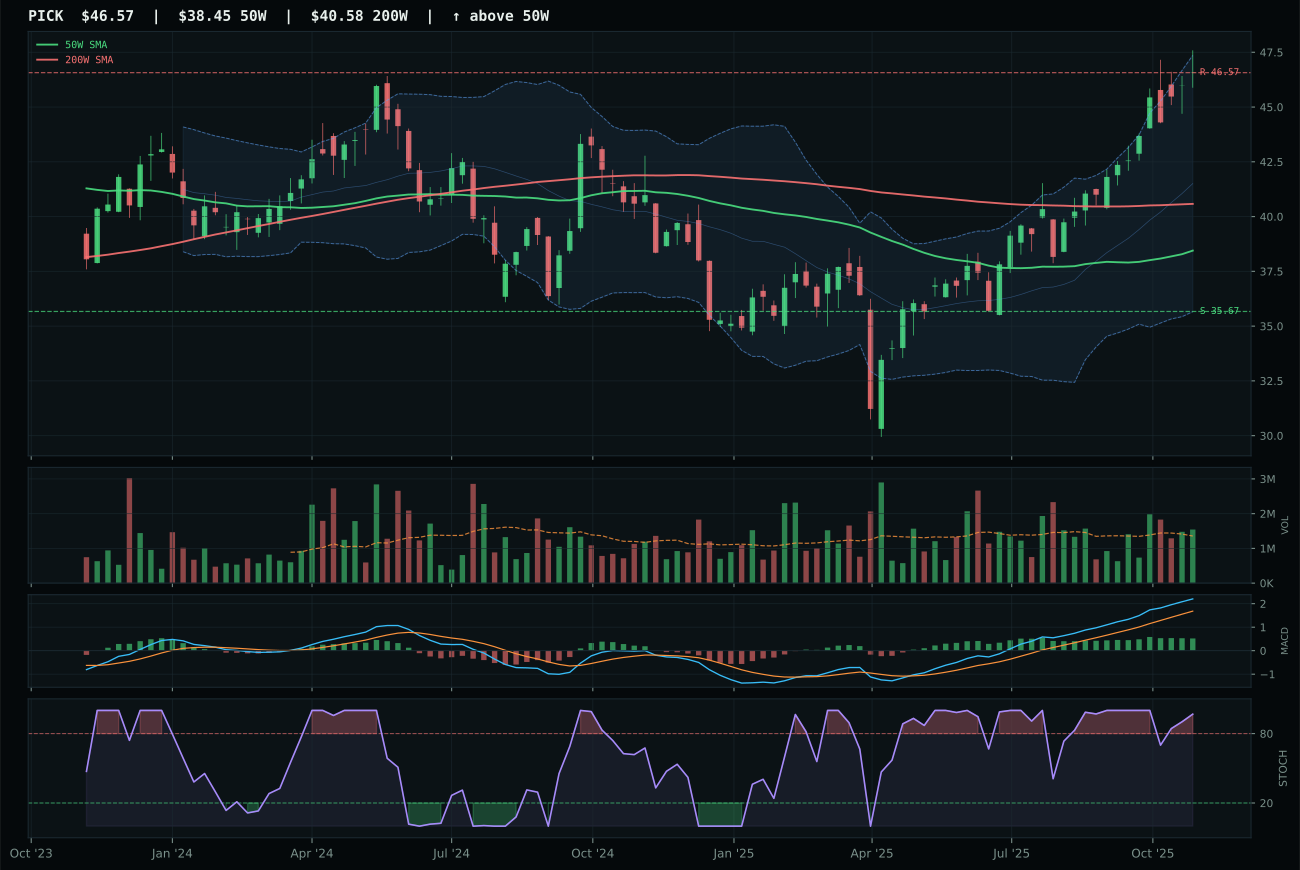
PICK has a vertical extension profile with 12.3% 13-week relative strength versus SPY.
A failed hold above support would weaken the setup.
Actionable but governed by invalidation levels.
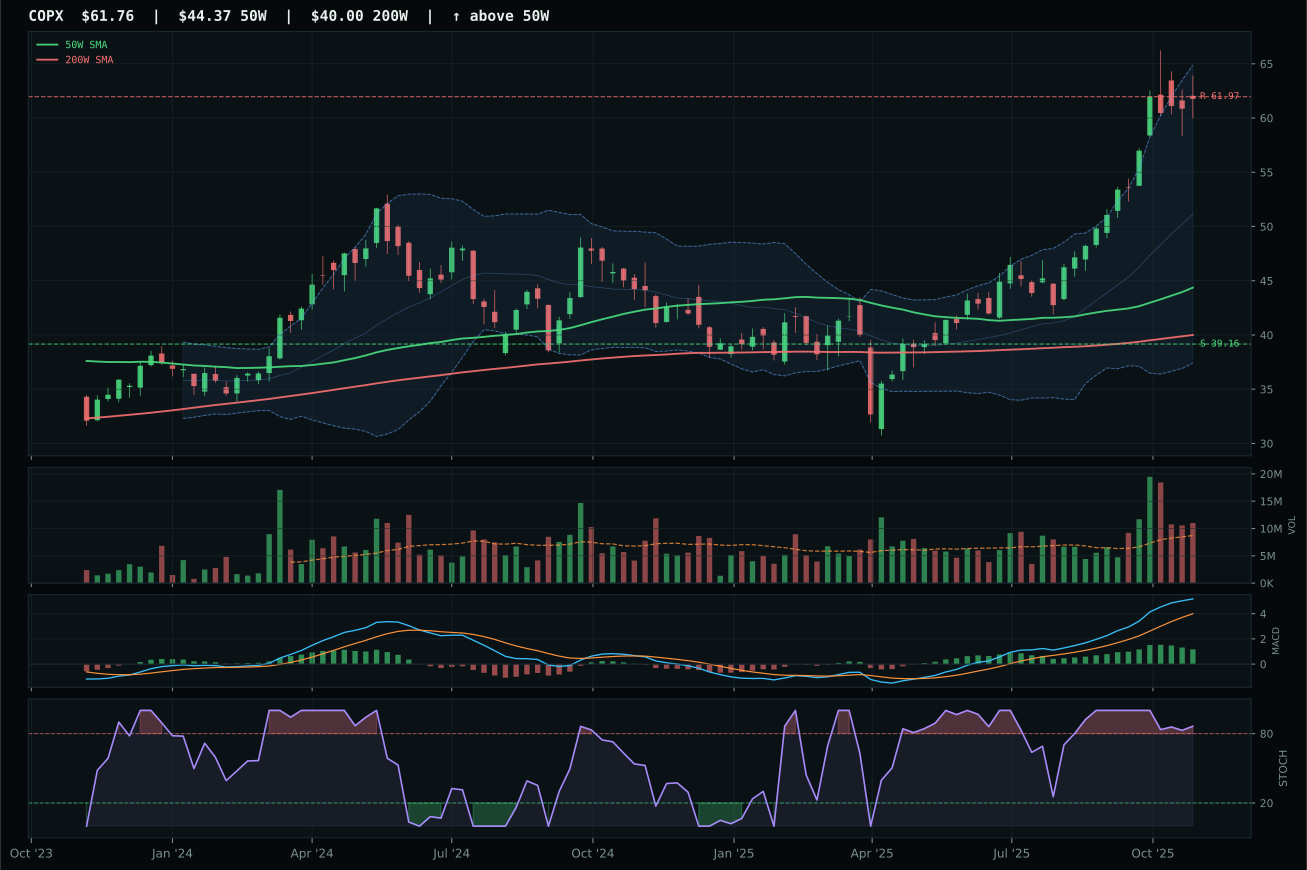
COPX has a vertical extension profile with 34.8% 13-week relative strength versus SPY.
A failed hold above support would weaken the setup.
Actionable but governed by invalidation levels.
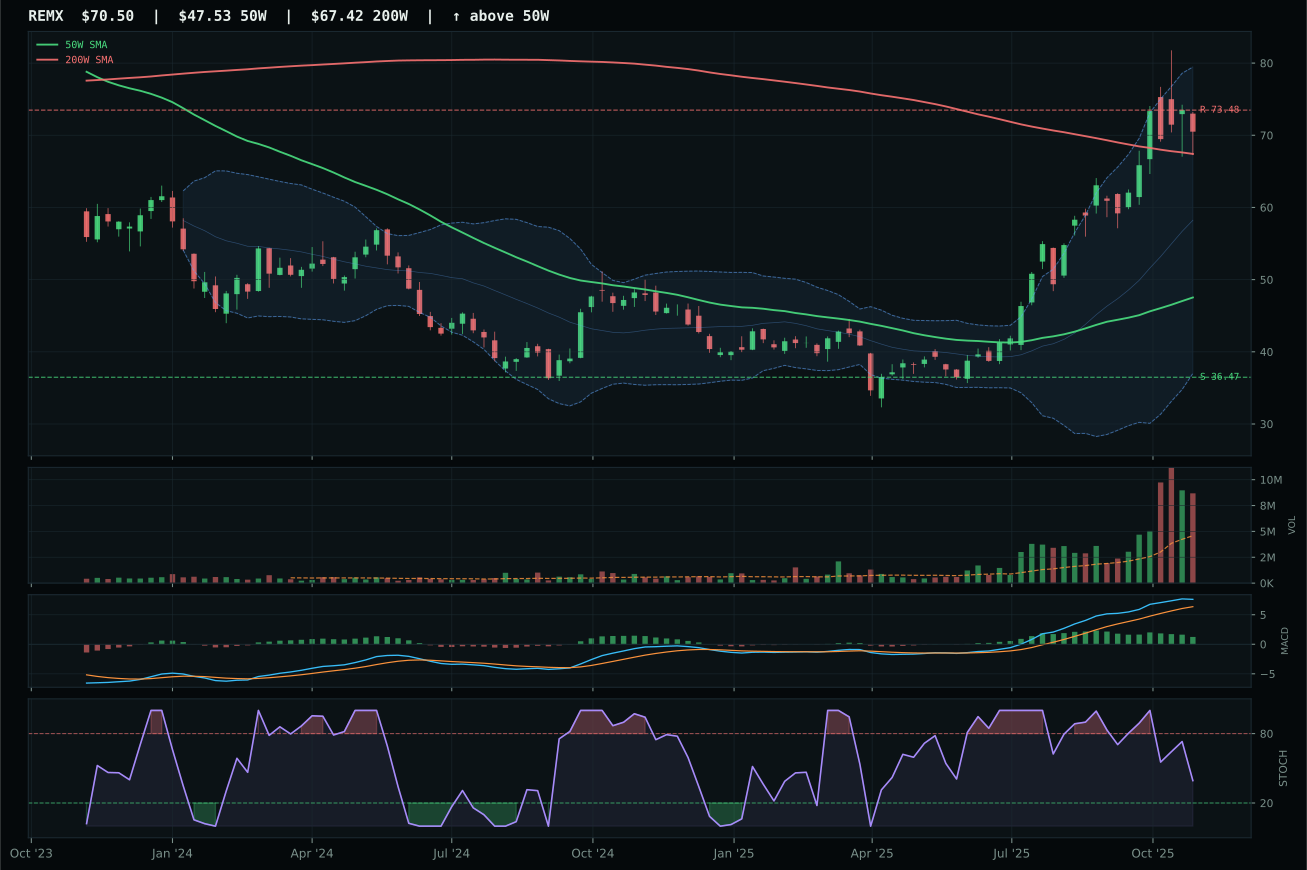
REMX has a vertical extension profile with 33.1% 13-week relative strength versus SPY.
A failed hold above support would weaken the setup.
Actionable but governed by invalidation levels.
PICK wins narrowly over runner-up COPX despite ranking lower in the reasoned ETF proof order, because the category representative selection process rewards structure quality and entry-risk balance over peak momentum. PICK's 84.7 structure score beats COPX's 82.6, driven by superior cleanliness (83.3 vs unspecified) and compression signatures. Price sits 21.1% above the 50W—meaningfully extended but more conservative than COPX's 39.2%—and while COPX's 34.8% SPY-relative strength dwarfs PICK's 12.3%, COPX's overbought setup and extreme extension mean COPX is winning on momentum, not on execution quality. PICK's MACD is bullish but flattening, stochastic RSI overbought at 0.97, and volume at 1.14x average—slightly elevated but not confirmation-level. The 22.0% 13-week return is solid, and the -20.8% category-relative strength reflects that PICK is holding leadership within mining diversity, not chasing copper spikes.
Industrial Metals ranks top-2 and earns 10% allocation alongside GLD. The 68.2 category score benefits from exceptionally strong macro support: metals scarcity is active (+14), commodity breadth positive is active (+10), and real-asset sponsorship is active (+6), offset only by liquidity stress (-8) and credit stress (-7). PICK's technical evidence (65.1/100) is adequate but not stellar; the 100.0 trend and 75.1 momentum confirmation carry the score, while timing (32.0) and risk-reward (41.7) reflect the extended position. Macro fit (59.0/100) is the category's engine—demand for industrial metals is structural (AI data-center buildout, EV supply-chain tightening, energy transition infrastructure), and the portfolio allocates at 10% because this demand is not cyclical bounce but secular repositioning. The Transition/Mixed regime supports holding through modest pullbacks; support at 35.67 is where conviction would require reassessment. PICK's structure integrity (84.7/100) and above-average volume (1.14x) signal that accumulation is genuine, justifying tier-1 conviction despite being the tighter setup versus COPX's more leveraged play.
AI — SMH
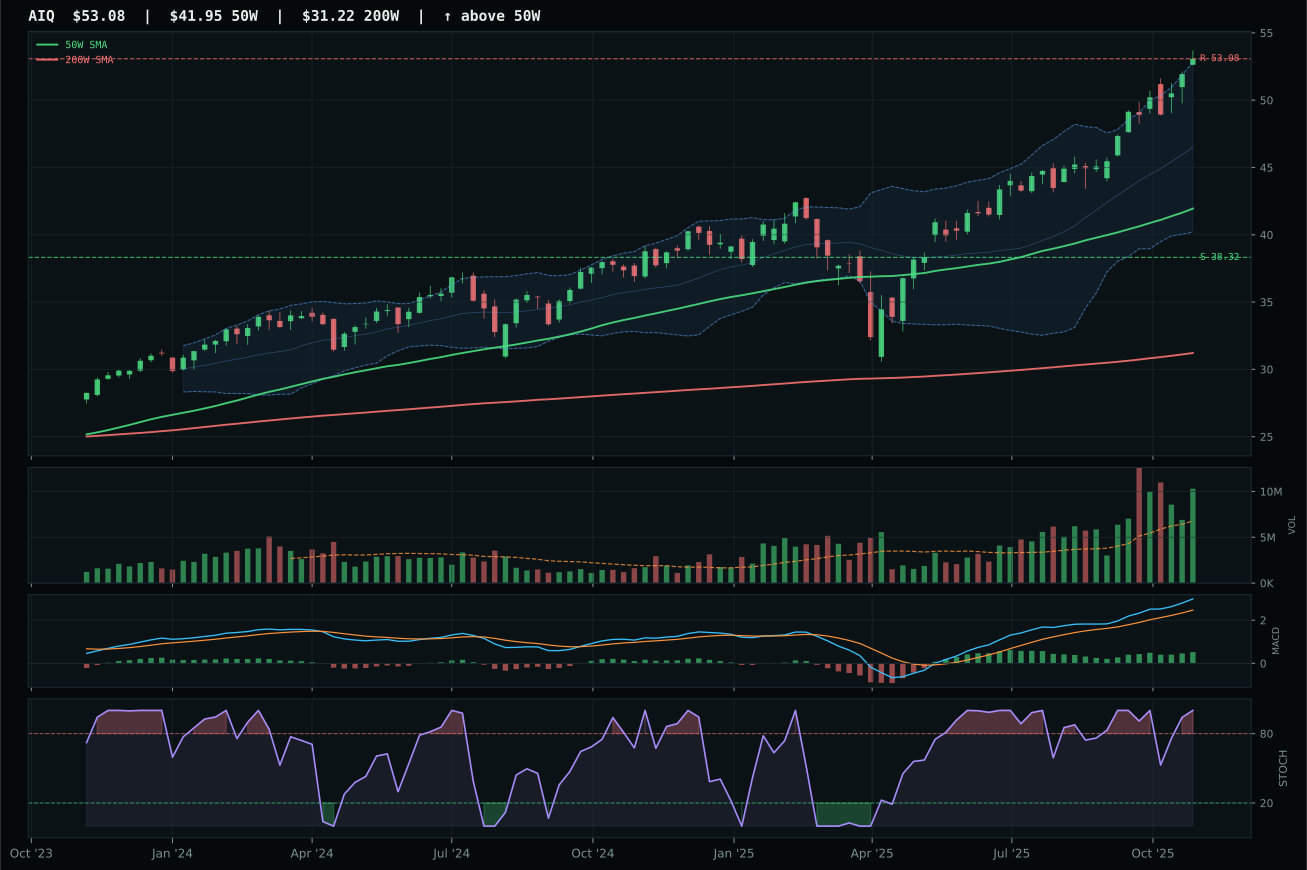
AIQ has a vertical extension profile with 12.4% 13-week relative strength versus SPY.
A failed hold above support would weaken the setup.
Actionable but governed by invalidation levels.
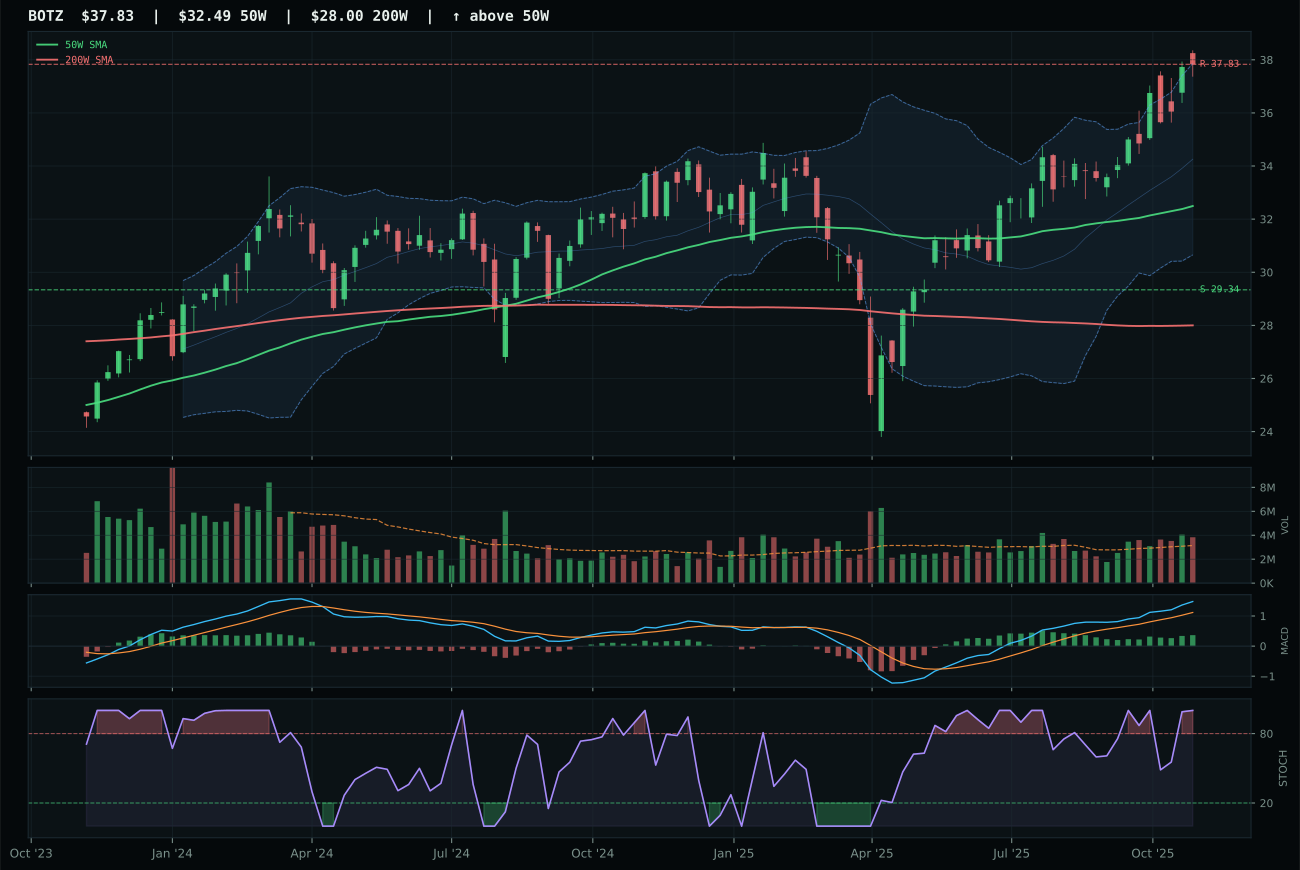
BOTZ has a vertical extension profile with 4.5% 13-week relative strength versus SPY.
A failed hold above support would weaken the setup.
Actionable but governed by invalidation levels.
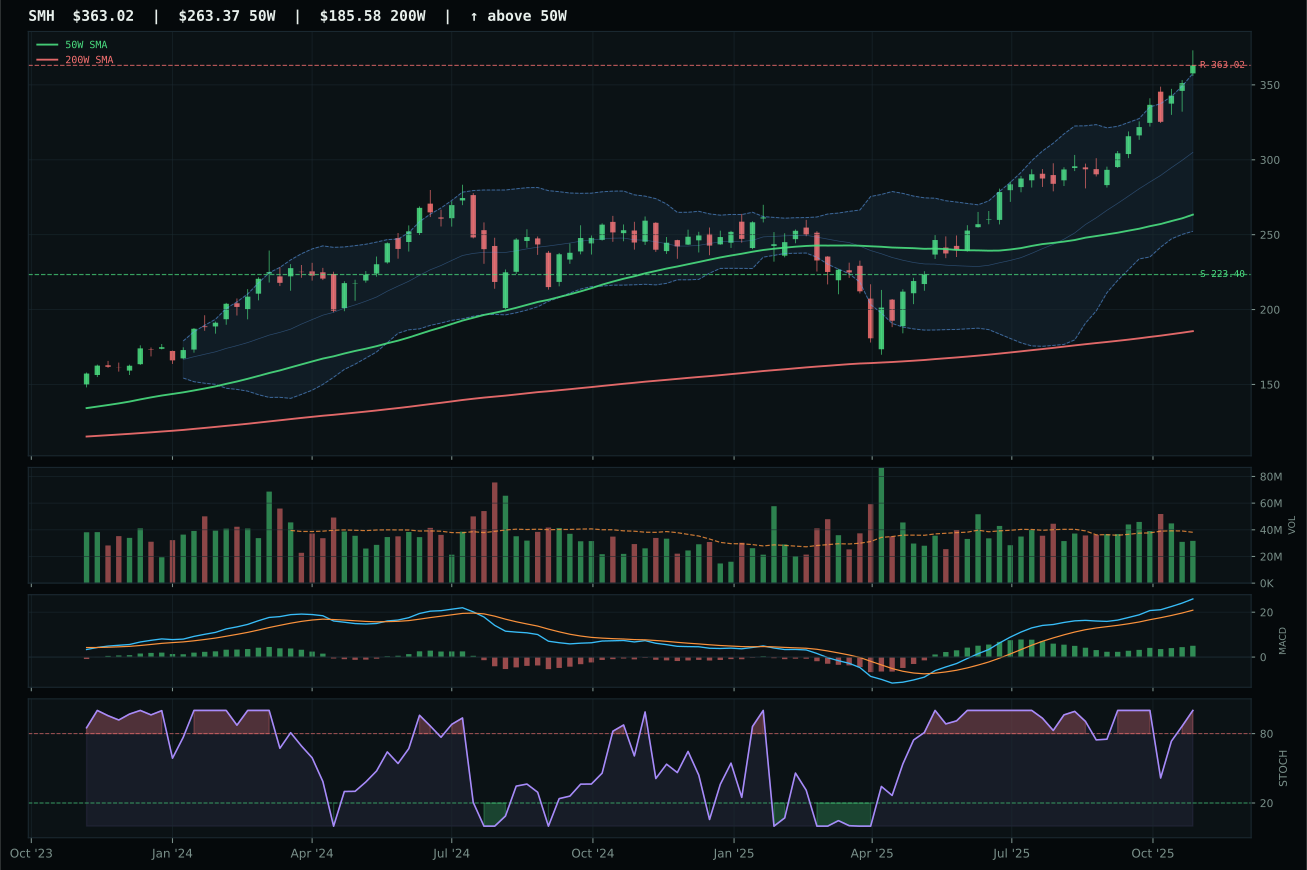
SMH has a vertical extension profile with 18.1% 13-week relative strength versus SPY.
A failed hold above support would weaken the setup.
Actionable but governed by invalidation levels.
SMH wins on the strength of 34.5% SPY-relative outperformance and 88.6% persistence score, signaling that upside momentum is genuine rather than ephemeral. Price sits 37.8% above the 50W with a 0.9% slope, MACD bullish and improving, and stochastic RSI overbought at 1.00—the setup is classic vertical extension in a leader. Against runner-up AIQ, SMH's 5.7% category-relative strength beats AIQ's 0.0%, and while AIQ shows superior technical evidence (86.1 vs 72.7), it loses on the direct basket comparison because SMH's volume confirmation and persistence outweigh AIQ's marginally cleaner MACD. The 27.8% 13-week return and neutral volume (0.83x average) suggest accumulation without panic buying, a quality edge over setups with forced volume spikes.
AI receives 5% as tier-2 despite a 66.6 score that trails only GLD and PICK. The category macro fit (54.0/100) benefits from active AI-growth sponsorship (+14) and risk-appetite positivity (+10), but liquidity stress (-12) and credit stress (-8) create headwind. SMH's extreme extension at 37.8% above the 50W and risk-reward score of only 39.3/100 reflect the timing trap: the trend is intact, the relative strength is irrefutable, but entry risk has climbed substantially. The portfolio allocates here because the macro narrative (AI compute demand, scarcity of leading-edge semiconductors) justifies staying with the leader despite overbought technicals, yet the tier-2 rank signals that price extension and timing risk prevent promotion to top-2 conviction. If SMH corrects 15-20% while maintaining above the 200W, category score would likely reset higher.
Nuclear Energy — URA
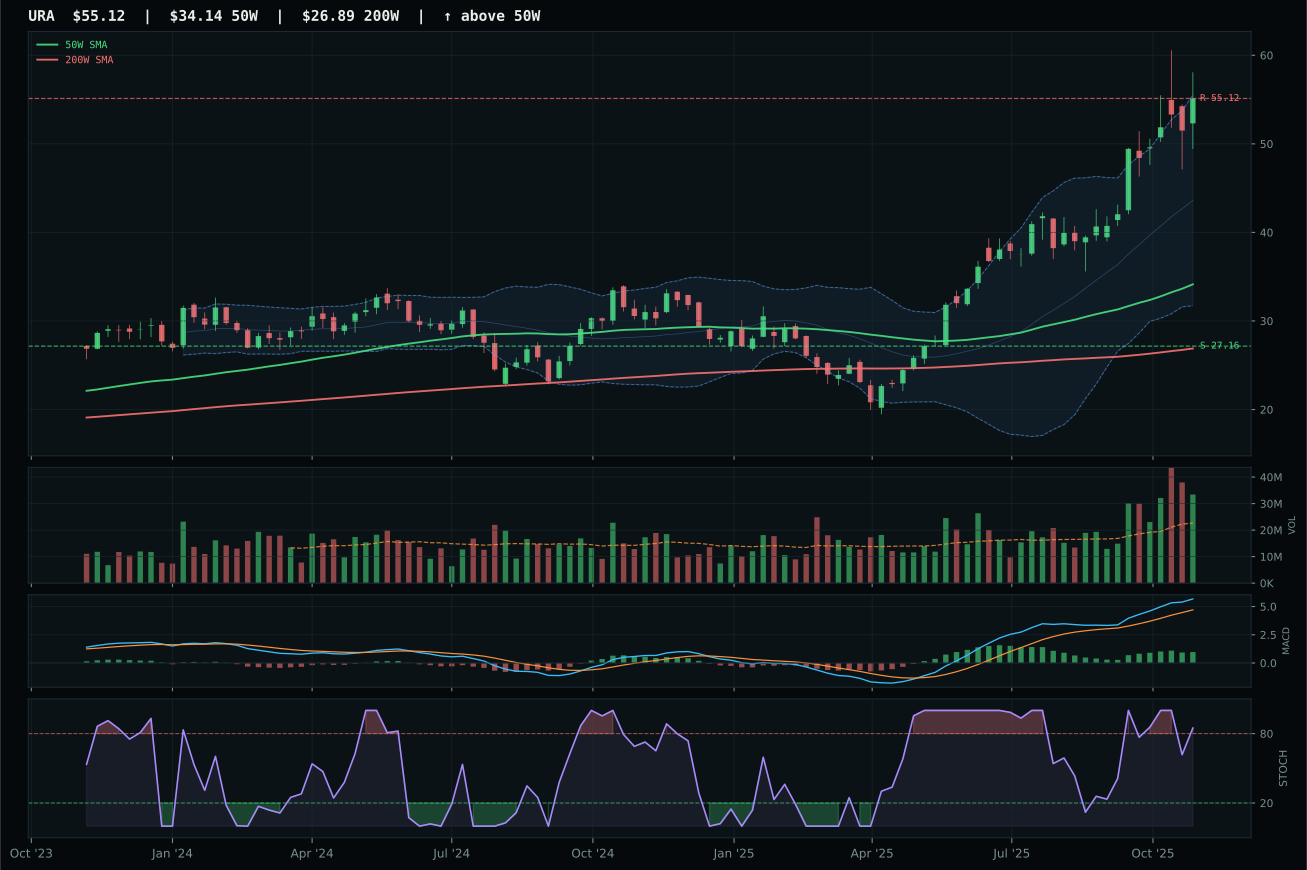
URA has a vertical extension profile with 34.5% 13-week relative strength versus SPY.
A failed hold above support would weaken the setup.
Actionable but governed by invalidation levels.
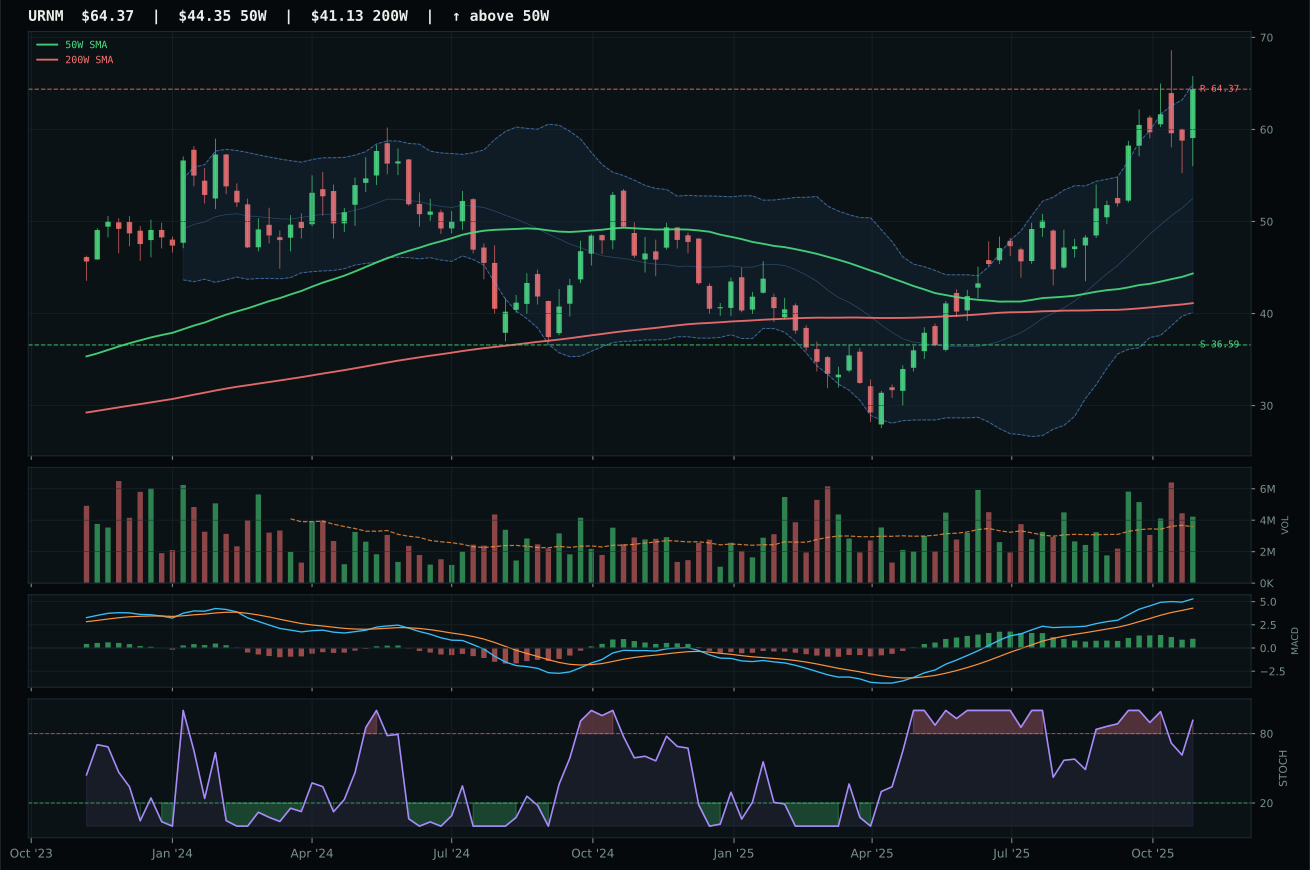
URNM has a vertical extension profile with 34.0% 13-week relative strength versus SPY.
A failed hold above support would weaken the setup.
Actionable but governed by invalidation levels.
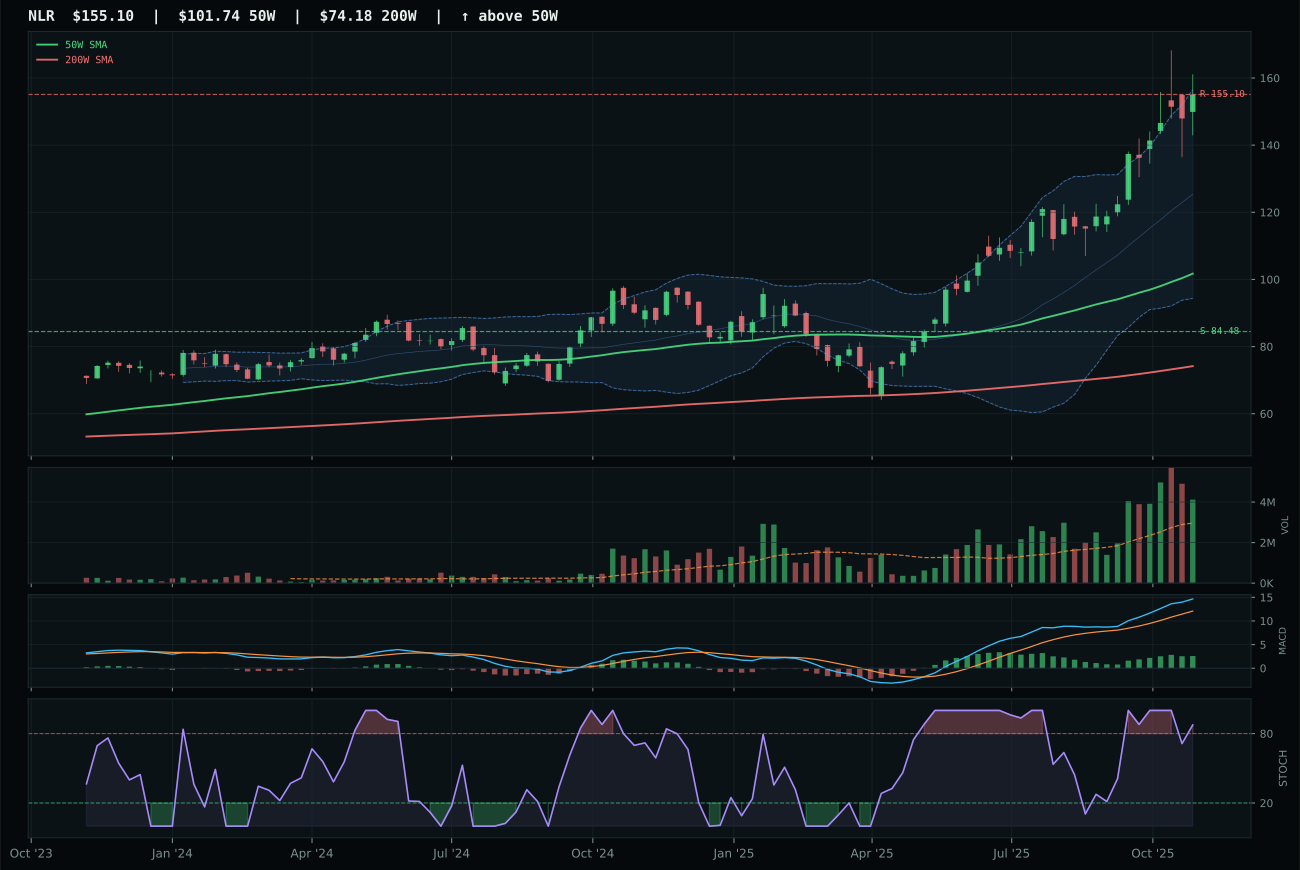
NLR has a vertical extension profile with 28.7% 13-week relative strength versus SPY.
A failed hold above support would weaken the setup.
Actionable but governed by invalidation levels.
URA wins over runner-up URNM on the strength of bullish-and-improving MACD versus URNM's bullish-but-flattening reading, a critical edge in an overbought market where momentum divergence signals leader differentiation. URA's timing score (35.0 vs 30.0) reflects URA's lower penalty for extreme extension (61.5% above 50W), which seems counterintuitive until you recognize that URA's stochastic RSI is rolling over (0.85) while URNM's is also rolling over—both are overbought, but URA is rolling faster, suggesting the surge is self-correcting rather than breaking momentum. Category-relative strength favors URA at 0.5% versus URNM's 0.0%, a whisper-thin margin that becomes decisive when combined with MACD quality. Both deliver 44%+ 13-week returns and 34%+ SPY-relative strength; URA's 100.0 persistence score (versus URNM's unspecified) indicates the advance has staying power, not just a spike.
Nuclear Energy holds 5% as tier-2, ranking below the metals but above defense and energy. The 62.7 category score reflects neutral macro support (50.0/100) with no uranium-specific descriptor profile available, leaving the allocation entirely technical in nature. URA's technical evidence (71.8/100) combines 100.0 trend, 100.0 momentum confirmation, and 71.3 volume-price confirmation, offset by a brutal 31.4/100 risk-reward score—downside to support is 102.9%, meaning if the trade breaks, the loss is severe. The 61.5% extension above the 50W is extreme even by uranium standards; every new buyer is dangerously late, and stochastic RSI rolling over signals that momentum exhaustion is already underway. The portfolio allocates 5% because the trend is intact, MACD is improving, and uranium scarcity is real, but tier-2 status (not tier-1) reflects the timing risk premium embedded in the setup. Support at 27.16 is where this trade either finds institutional demand or breaks sharply; any close below that level would trigger exit on the next weakness, as the risk-reward calculus becomes asymmetrically negative.
Technology — XLK
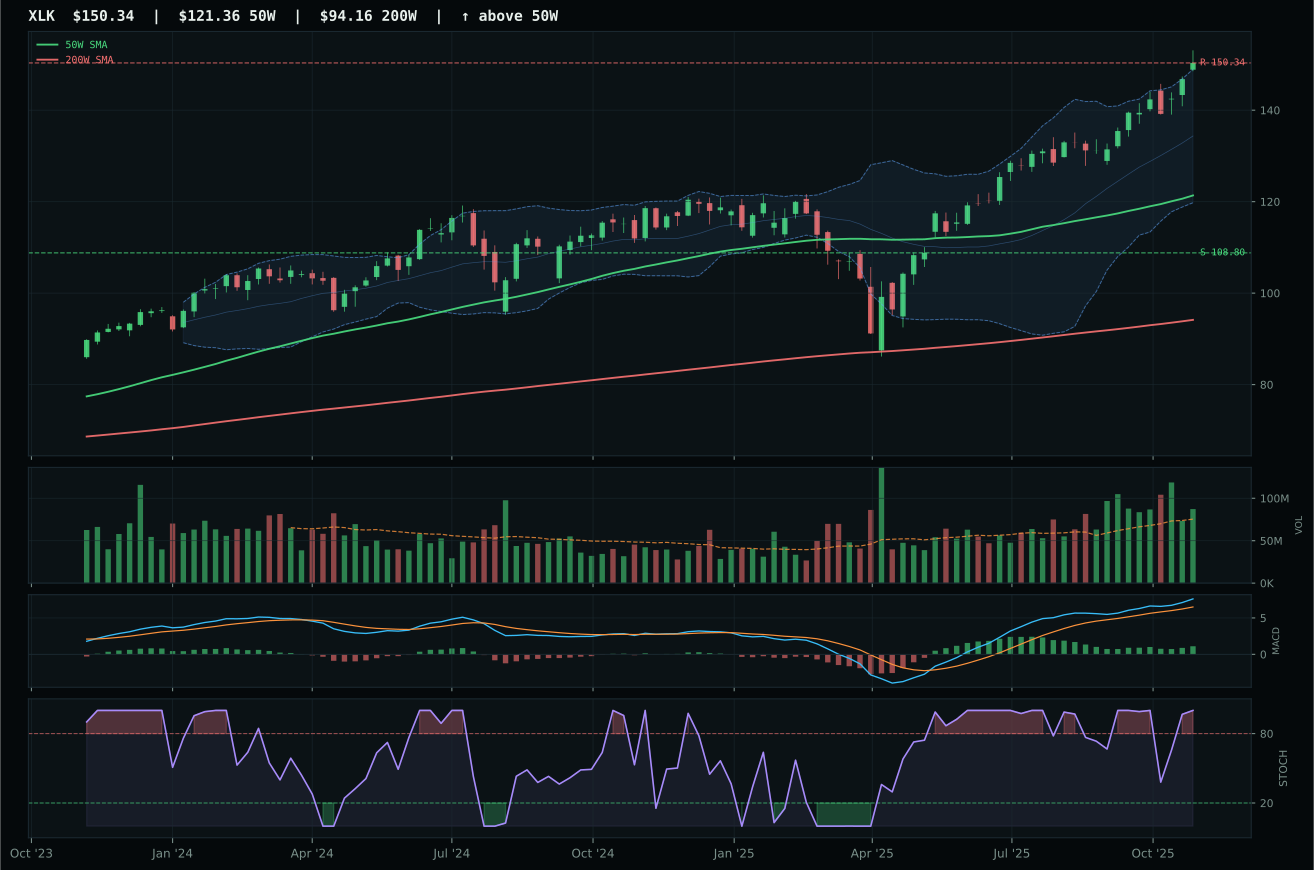
XLK has a vertical extension profile with 7.3% 13-week relative strength versus SPY.
A failed hold above support would weaken the setup.
Actionable but governed by invalidation levels.
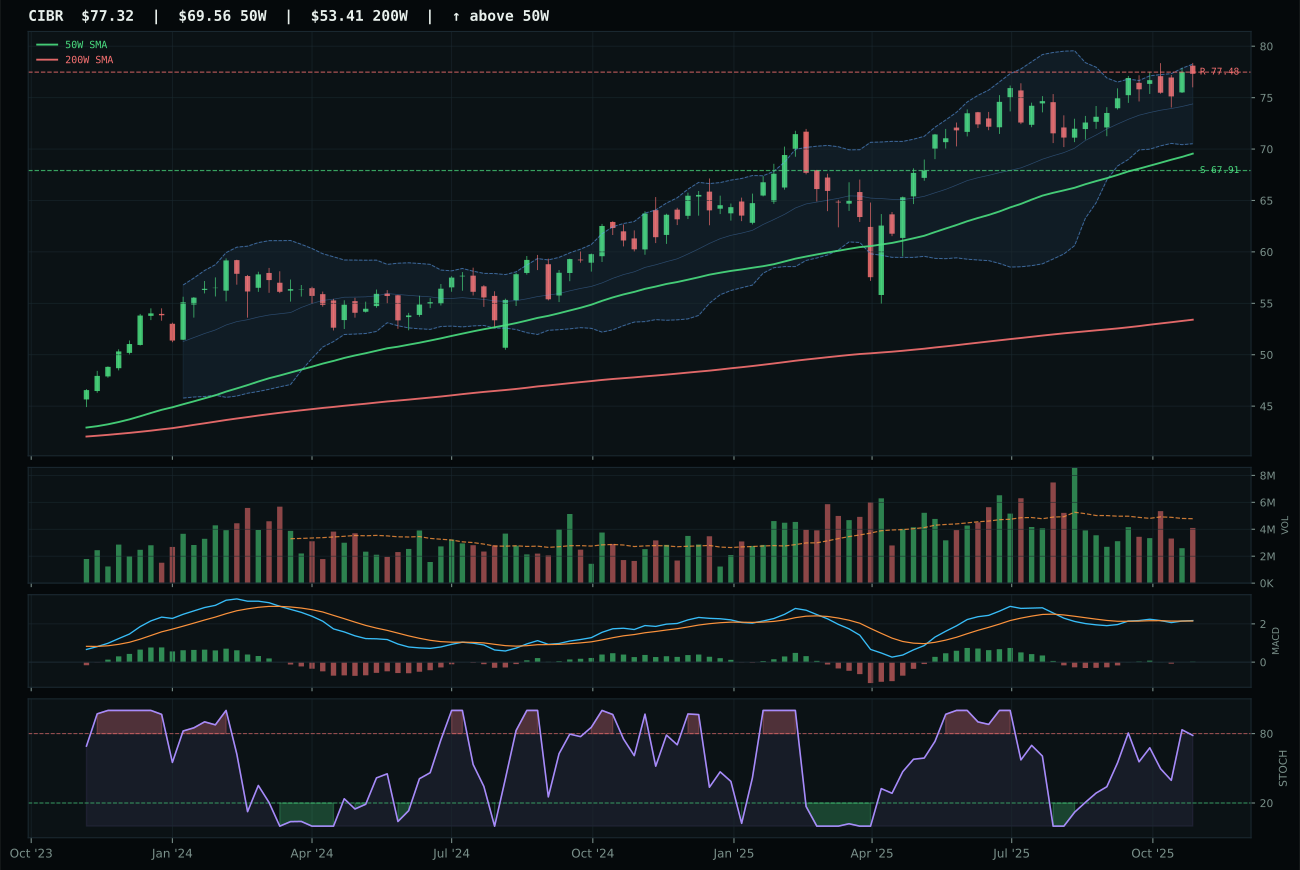
CIBR has a neutral structure profile with -1.6% 13-week relative strength versus SPY.
A failed hold above support would weaken the setup.
Actionable but governed by invalidation levels.
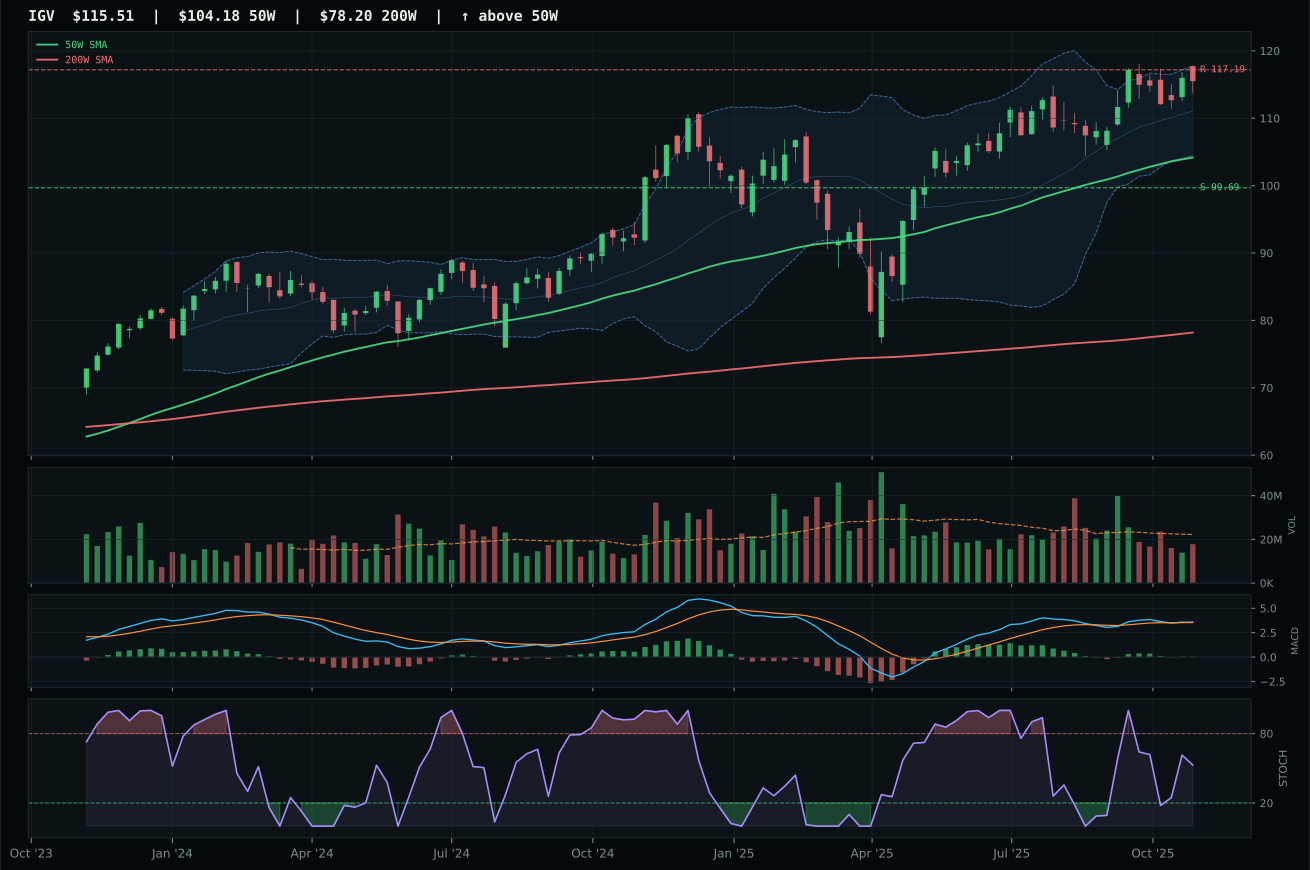
IGV has a neutral structure profile with -3.4% 13-week relative strength versus SPY.
A failed hold above support would weaken the setup.
Actionable but governed by invalidation levels.
XLK wins by combining clean uptrend confirmation with category-relative outperformance. Price sits 23.9% above the 50W with a 0.6% positive slope, MACD bullish and improving, and stochastic RSI overbought—the setup is vertical extension with full trend alignment. What separates XLK from runner-up CIBR is the 8.9% category-relative strength versus CIBR's flat 0.0%, paired with above-average volume participation at 1.16x the 20-week average against CIBR's neutral reading. CIBR's MACD is bullish but flattening and its risk-reward score sits 3.5 points lower, a structural weakness that matters when both charts are extended. XLK's 17.0% 13-week return and 7.3% SPY-relative strength confirm that buyers are accumulating, not just bouncing off support.
Technology earns 5% allocation as a tier-2 holding, reflecting legitimate strength but insufficient rank to claim a top-2 slot. The 59.2 final score weighted technical evidence at 62% and macro fit at 38%, with active risk-appetite and AI-growth sponsorship (+9 and +6 respectively) offset by liquidity stress (-10) and credit stress (-7). The Transition/Mixed regime offers neutral support, leaving this category dependent on pure technicals rather than macro tailwinds. XLK's setup is clean but overbought—every new buyer is late to the party at 23.9% extension, and that timing penalty (37.0/100) prevents the category from climbing higher despite XLK's momentum persistence. The portfolio holds this position for its trend quality and relative strength inside technology, but a breakdown below the 50W or deterioration in category breadth would trigger exit logic before tier-2 status became untenable.
Emerging Markets — ILF
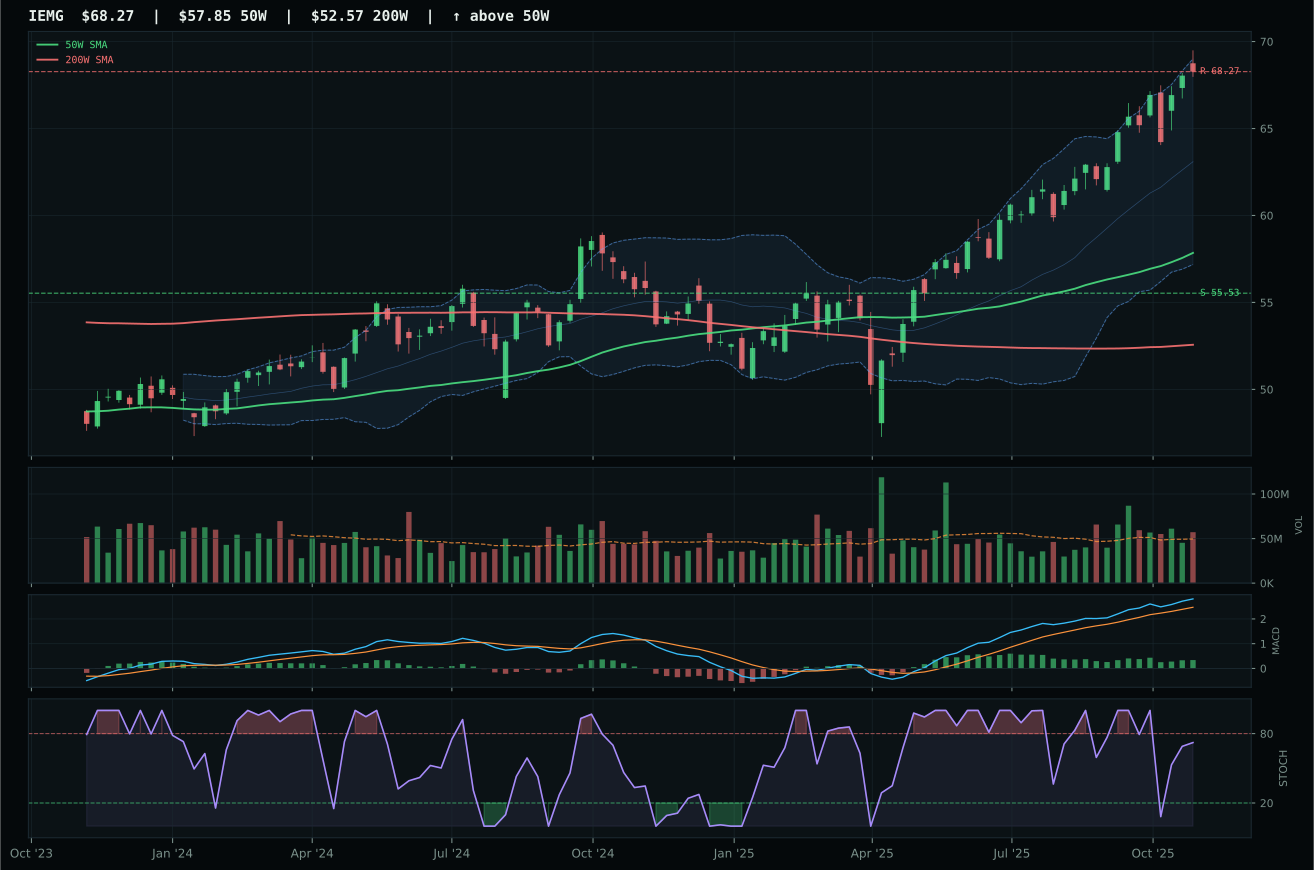
IEMG has a vertical extension profile with 4.3% 13-week relative strength versus SPY.
A failed hold above support would weaken the setup.
Actionable but governed by invalidation levels.
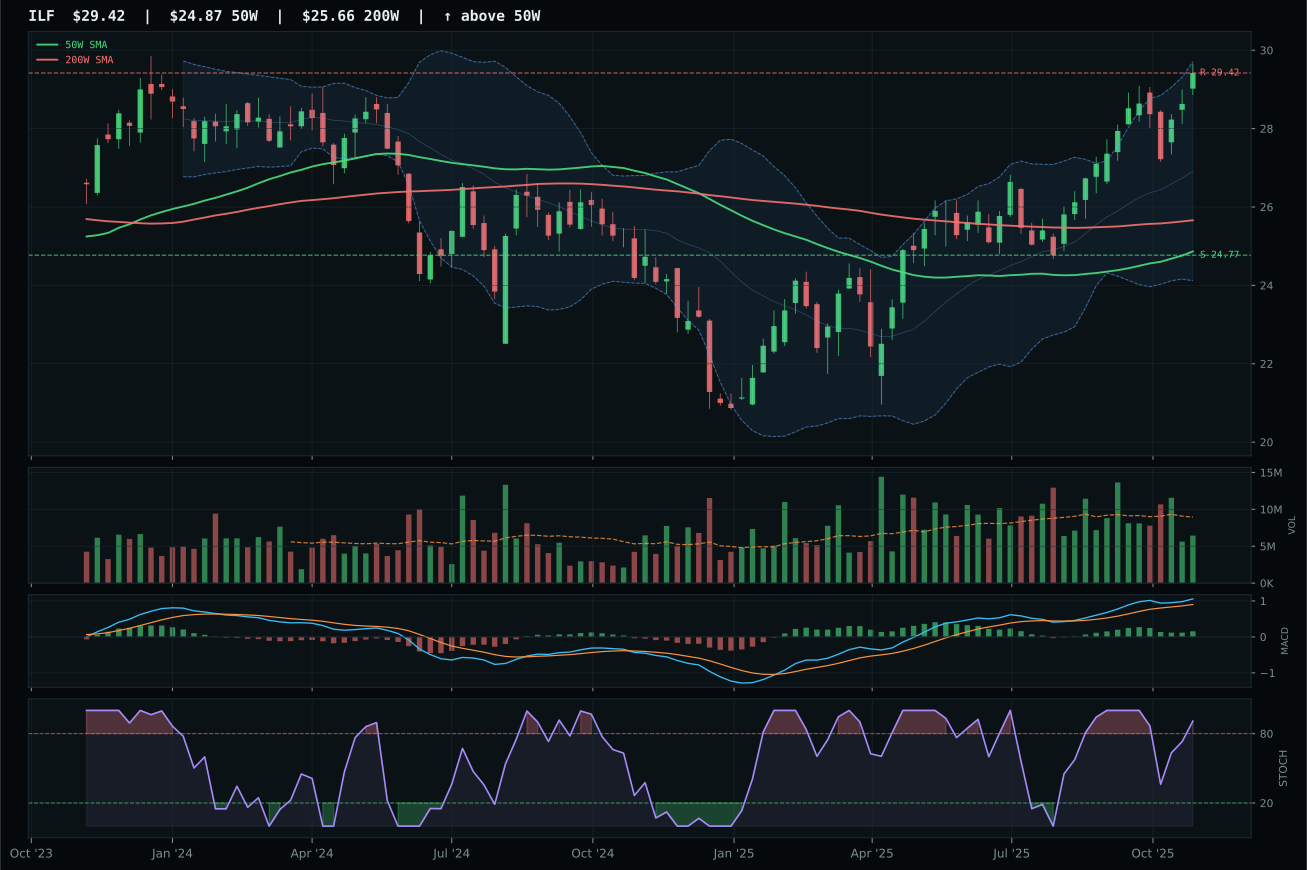
ILF has a vertical extension profile with 9.1% 13-week relative strength versus SPY.
A failed hold above support would weaken the setup.
Actionable but governed by invalidation levels.
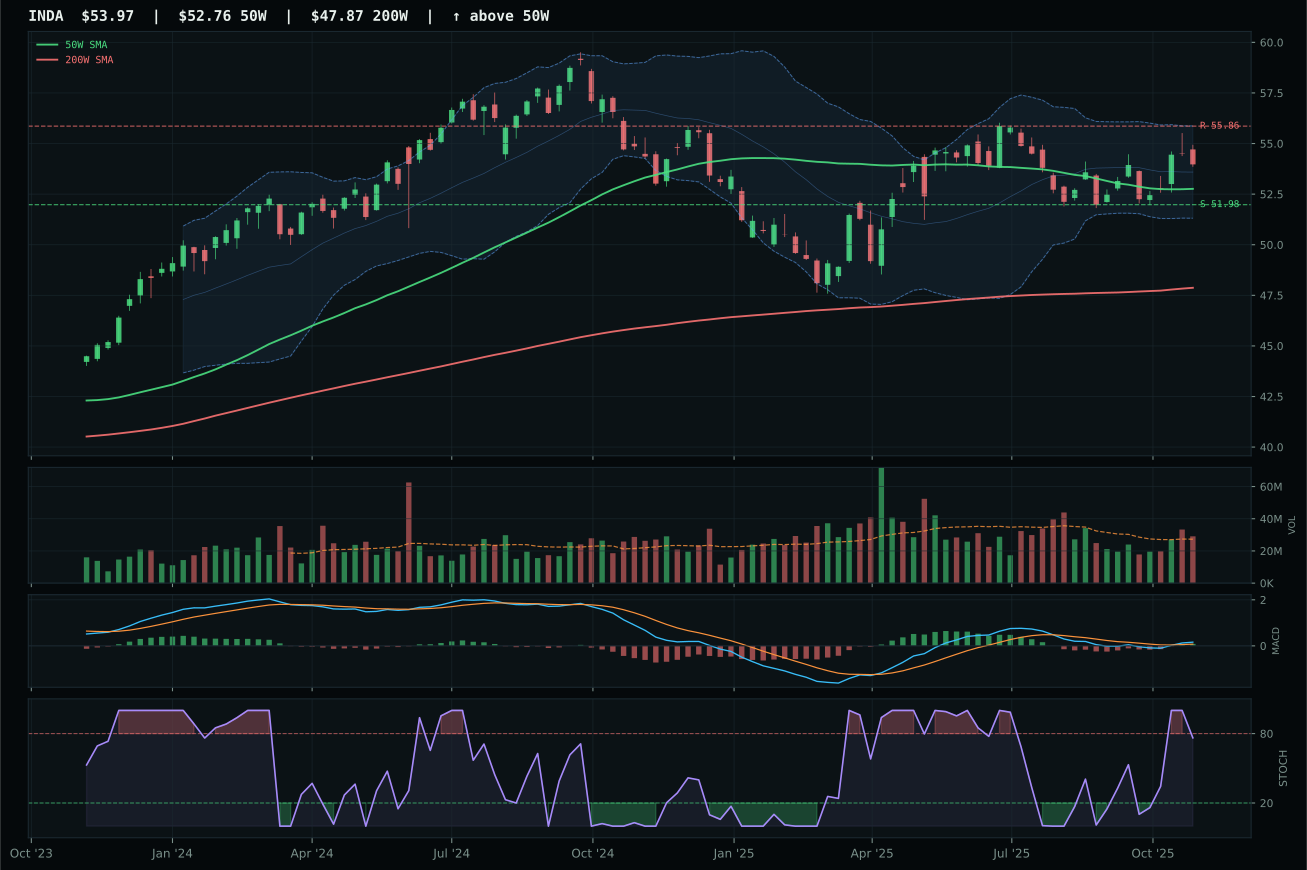
INDA has a pullback into support profile with -7.3% 13-week relative strength versus SPY.
A failed hold above support would weaken the setup.
Actionable but governed by invalidation levels.
ILF wins over runner-up IEMG by a single point (55.3 vs IEMG's implied 55.2) on category-relative strength (4.8% vs 0.0%), a nail-thin edge that highlights how weak this category is overall. ILF's 100.0 trend and 98.2 momentum confirmation are muscular, but the 32.0 timing score reveals extreme overbought extension (18.3% above 50W, stochastic RSI at 0.91). Against IEMG, which scores higher on technical evidence (80.0 vs 67.4), ILF wins because IEMG's macro fit is just 40.0/100 (credit stress -8, liquidity stress -8) versus ILF's 54.0/100 (benefiting from commodity-breadth positivity +8, metals scarcity +5, real-asset sponsorship +6). Critically, ILF's thin volume participation (0.72x average) versus IEMG's above-average (implied) means ILF is rising on fewer dollars, a quality signal that the advance is not forced buying but genuine accumulation among selective allocators.
Emerging Markets holds 5% as tier-2, a defensive allocation in a macro regime hostile to EM. The 55.3 category score reflects negative macro fit (38.0/100) driven by credit stress (-10) and liquidity stress (-10), only partially offset by risk-appetite positivity (+8). ILF's technical evidence (67.4/100) does not overcome the macro headwind; the allocation exists because Latin America has commodity leverage (copper, minerals) that serves the broader real-asset theme, not because EM has intrinsic momentum. The 18.3% extension and 44.7 risk-reward score mean ILF is extended relative to support at 24.77—an 18.8% downside loss would trigger stops. The portfolio treats this as a tactical satellite position rather than core EM exposure; IEMG's cleaner technical evidence (80.0 vs 67.4) and broad EM beta would be preferred if macro fit were better, but in a Transition/Mixed regime with active credit and liquidity stress, narrower commodity-linked EM (Latin America via ILF) outperforms undifferentiated EM breadth. Any deterioration in commodity-breadth descriptor status would flip this allocation to zero; until then, 5% is the ceiling.
Defense & Aerospace — XAR
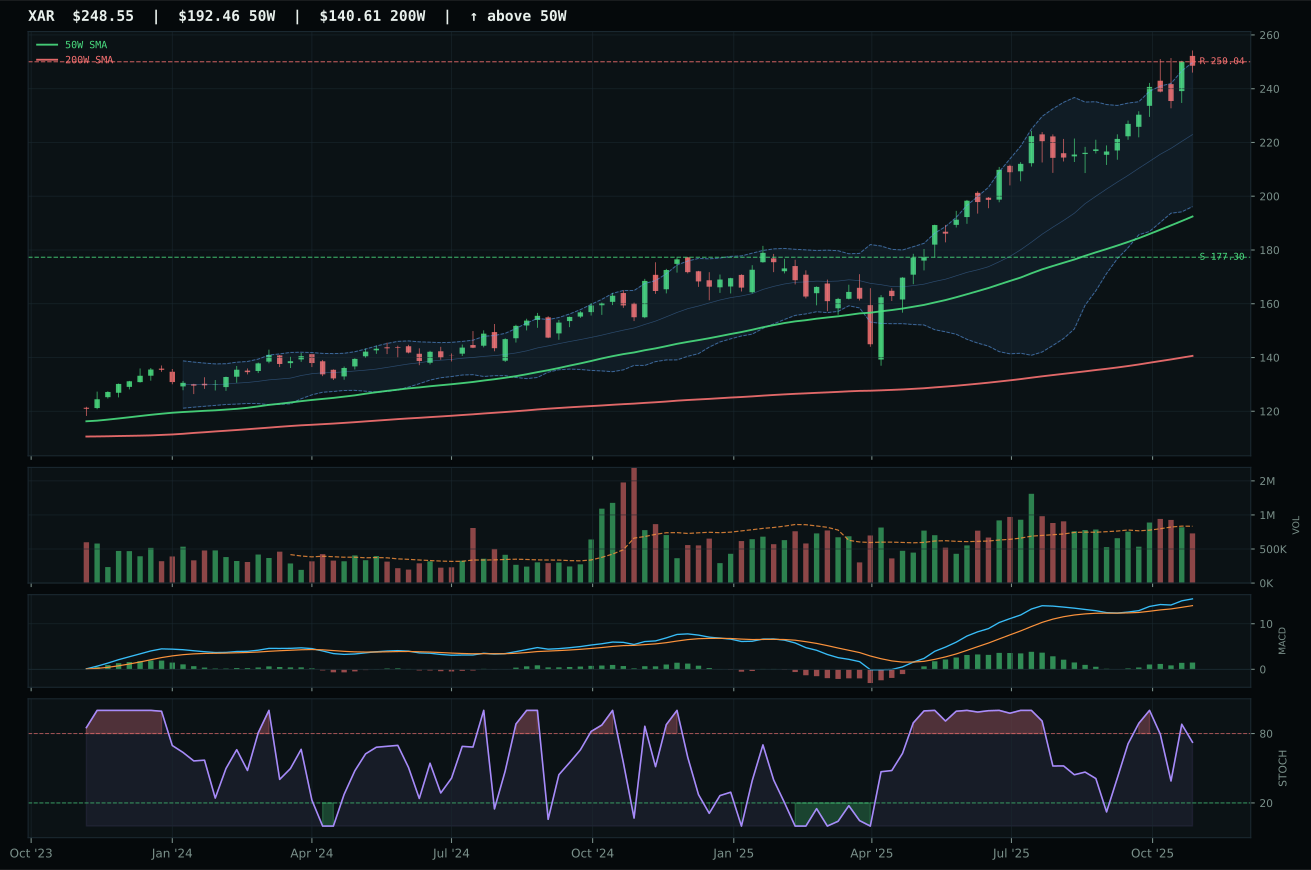
XAR has a vertical extension profile with 6.3% 13-week relative strength versus SPY.
A failed hold above support would weaken the setup.
Actionable but governed by invalidation levels.
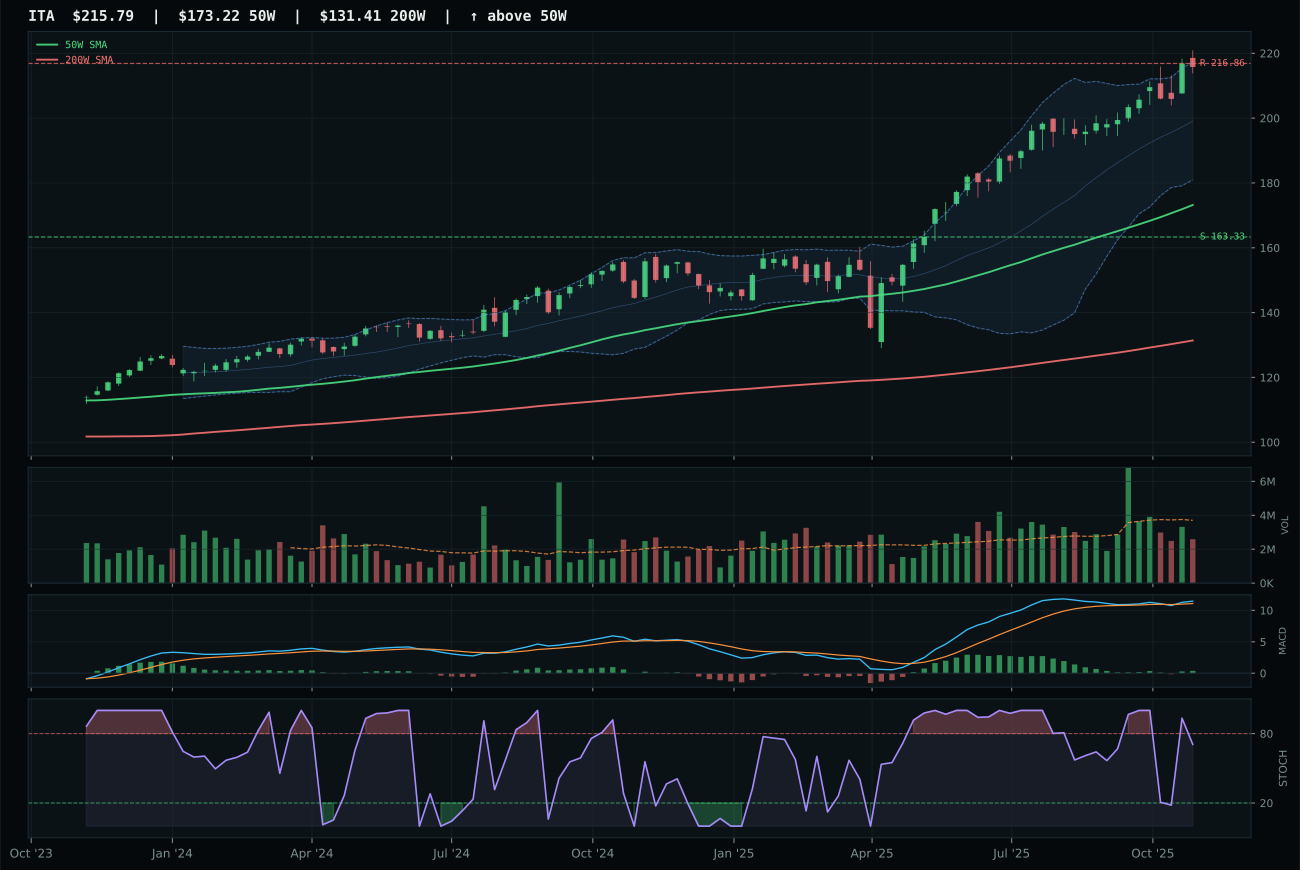
ITA has a vertical extension profile with 0.5% 13-week relative strength versus SPY.
A failed hold above support would weaken the setup.
Actionable but governed by invalidation levels.
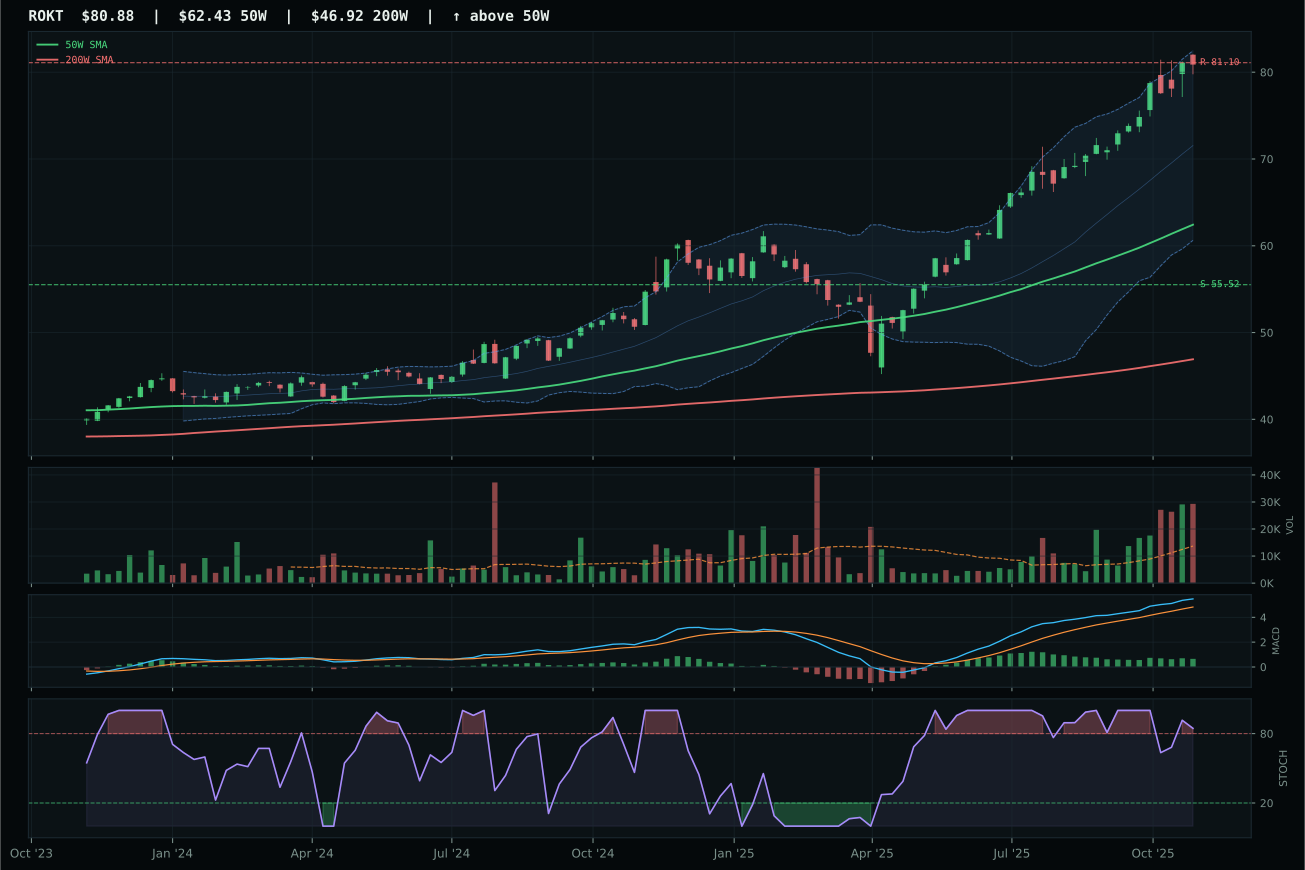
ROKT has a vertical extension profile with 10.7% 13-week relative strength versus SPY.
A failed hold above support would weaken the setup.
Tracked, but not top-2 eligible because: .
XAR wins a tight matchup by fielding the cleanest structure (76.5 vs ITA's 73.1) and maintaining category parity (0.0% relative strength) where ITA trails at -5.8%. Price sits 29.1% above the 50W with a 0.9% slope, MACD bullish and improving, stochastic RSI falling but still in neutral territory at 0.72—a healthier momentum posture than ITA's rising mid-zone reading. Volume participation is neutral at 0.87x average across both leaders, but XLU's score advantage (45.0 timing vs ITA's 53.0) is overshadowed by XAR's superior compression signature (79.4 vs 66.7) and cleanliness (66.7 vs unspecified), indicating XAR holders are consolidating gains rather than rotating. The 16.0% 13-week return trails ITA's 10.2% by a narrower margin than the risk-reward differential (37.3 vs 37.3), but XAR's improving MACD versus ITA's flattening line tips the decision.
Defense & Aerospace holds 5% as tier-2, ranked below the metals and commodity exposures. The 50.8 category score reflects weak macro fit (51.0/100) in a Transition/Mixed regime where geopolitical risk is priced but not dominant; active descriptors include a small credit-stress positive (+2) and liquidity-stress negative (-4), neither moving the needle substantially. XAR's technical evidence (64.7/100) is adequate but uninspiring—the trend is above both moving averages but RS versus SPY sits at only 6.3%, and the 93.0 momentum confirmation score masks a -0.6% upside to resistance, meaning the risk-reward asymmetry has flipped negative. The category merits portfolio inclusion because defense spending remains stable under political transition, but the tier-2 slot reflects that this is defensive positioning, not growth capture. Any break below support at 177.30 would signal category review, as that level is where the structure breaks from cleanly extended to merely elevated.
Utilities & Infrastructure — XLU
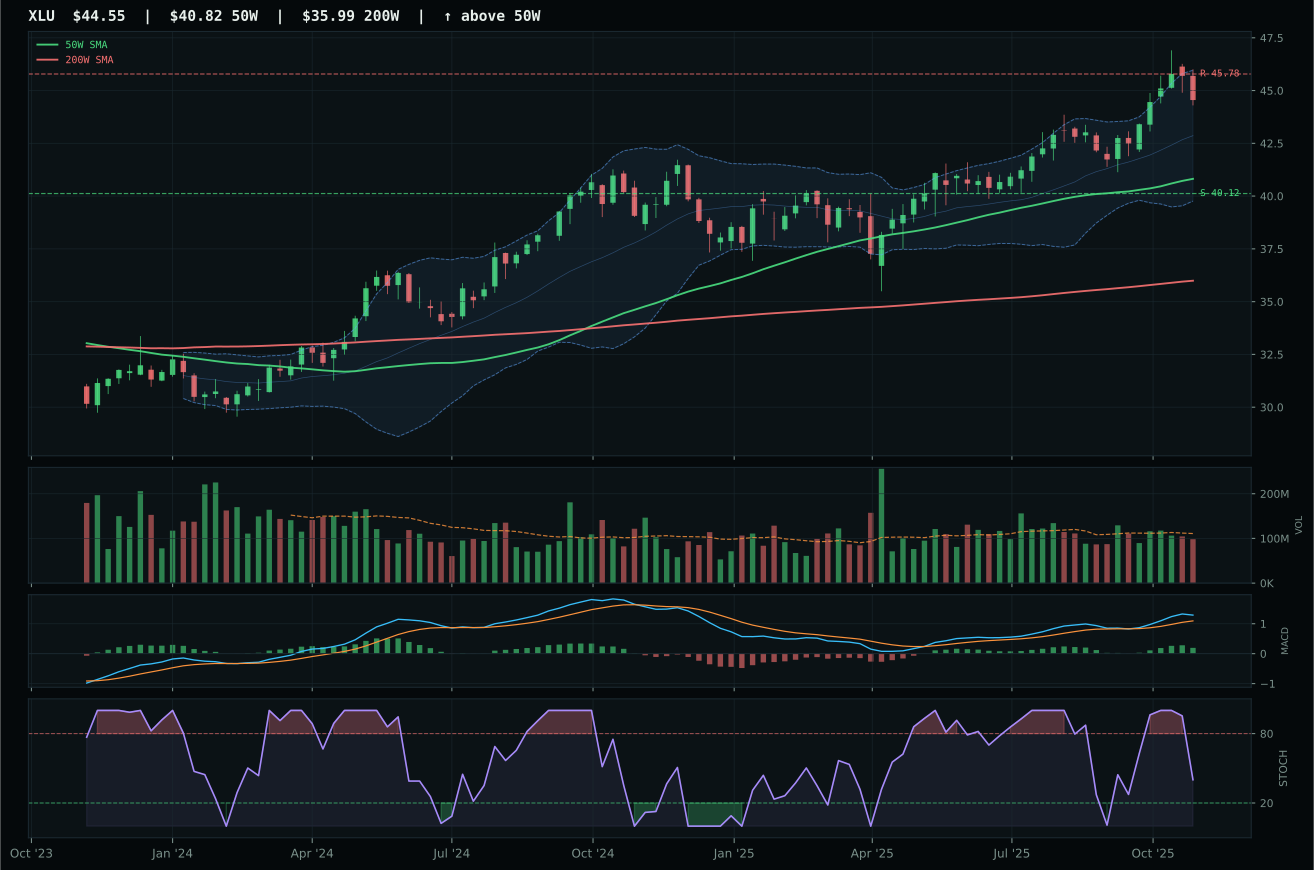
XLU has a neutral structure profile with -5.9% 13-week relative strength versus SPY.
A failed hold above support would weaken the setup.
Actionable but governed by invalidation levels.
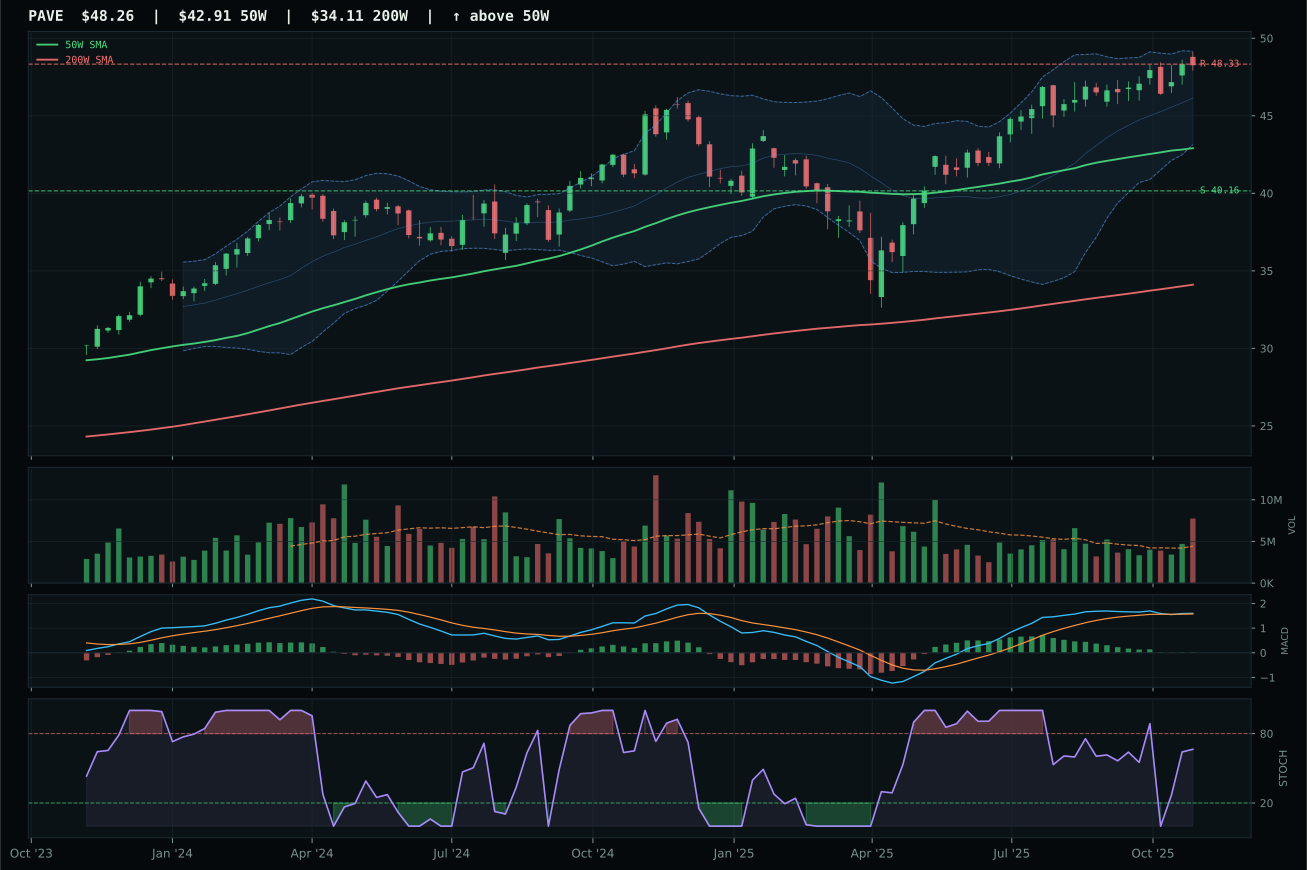
PAVE has a neutral structure profile with -2.5% 13-week relative strength versus SPY.
A failed hold above support would weaken the setup.
Actionable but governed by invalidation levels.
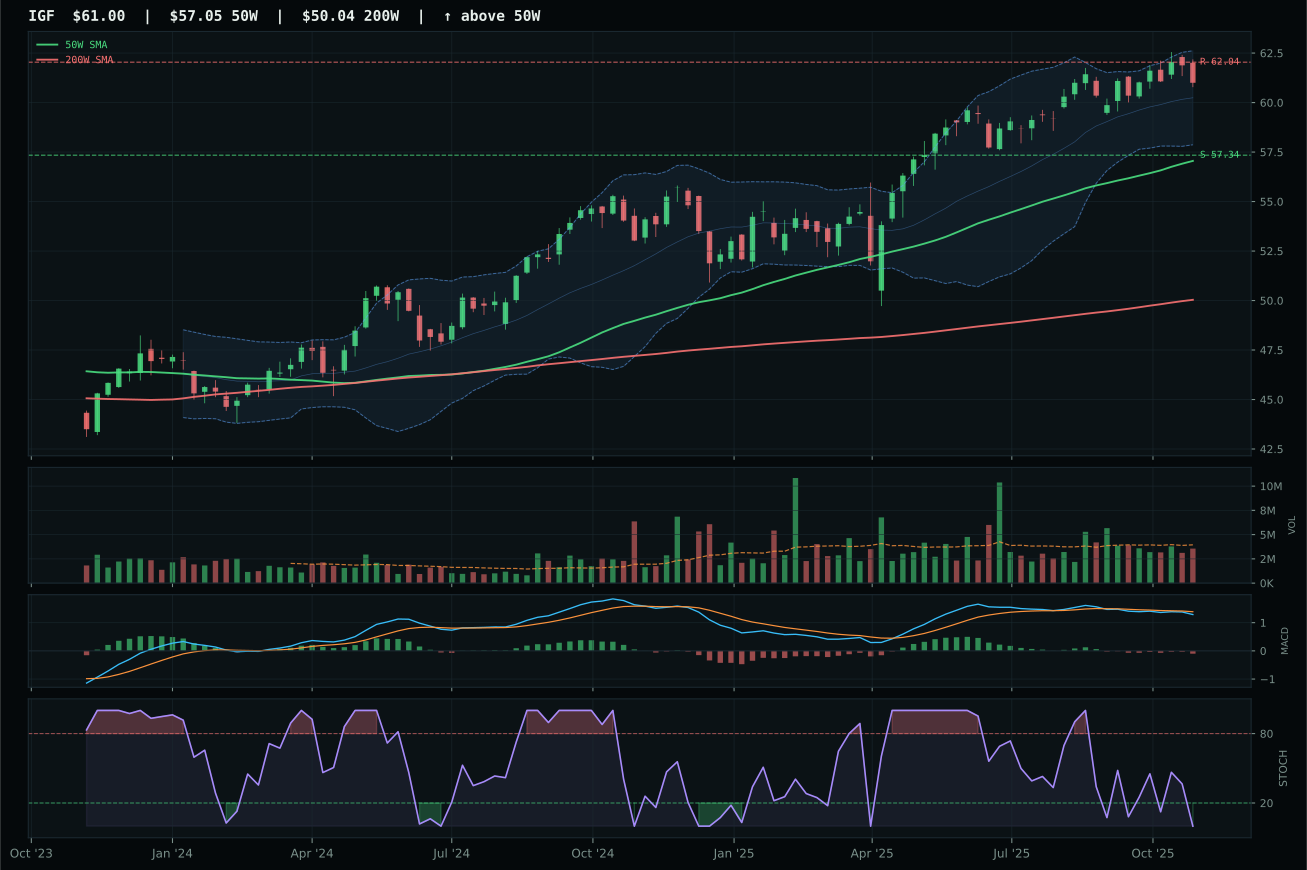
IGF has a neutral structure profile with -6.7% 13-week relative strength versus SPY.
A failed hold above support would weaken the setup.
Actionable but governed by invalidation levels.
XLU wins by delivering the best risk-adjusted entry despite a fundamentally weak category. Price sits 9.1% above the 50W with a 0.2% slope, MACD bullish and improving, stochastic RSI falling/neutral at 0.40—this is a restrained, low-beta posture that avoids the momentum traps of rising stochastic setups. Against runner-up PAVE, XLU's timing score (75.0 vs 70.0) reflects superior Fibonacci positioning in the upper retracement zone, while risk-reward (49.4 vs 29.1) shows XLU offers nearly double PAVE's reward-to-loss ratio. PAVE's stochastic RSI is rising mid-zone and volume is distribution pressure, suggesting XLU holders are accumulating while PAVE holders are beginning to exit. XLU's 91.2 trend score and 55.9 momentum confirmation are adequate but not inspiring; the win is not about strength, it is about execution quality and absence of trap signals.
Utilities & Infrastructure holds 5% as tier-2, a defensive/allocation sleeve in a portfolio increasingly weighted to real assets and energy transition. The 47.2 category score and 49.0/100 macro fit reflect a regime-neutral stance: Transition/Mixed is mild tailwind (+4), but risk-appetite positivity is a mild headwind (-2), leaving liquidity stress (-3) as the only material negative. XLU's technical evidence (71.1/100) is solid without being exceptional; the 91.2 trend and 75.0 timing are respectable, but momentum confirmation (55.9) and volume-price sponsorship (61.3) reveal that this is not an accumulation but rather a consolidation hold. The 3.8% 13-week return and -5.9% SPY-relative strength confirm that utilities are performing their historical function—steady yield generation in a mixed regime, not growth capture. The portfolio allocates 5% because infrastructure spending (PAVE alternative) and utility dividend stability (XLU core function) provide ballast in a portfolio otherwise tilted toward commodity volatility (metals, uranium, energy). Any break below support at 40.12 would warrant reallocation to higher-conviction tier-2 plays; until then, this slot performs its intended role as portfolio stabilizer.
Agriculture & Livestock — MOO
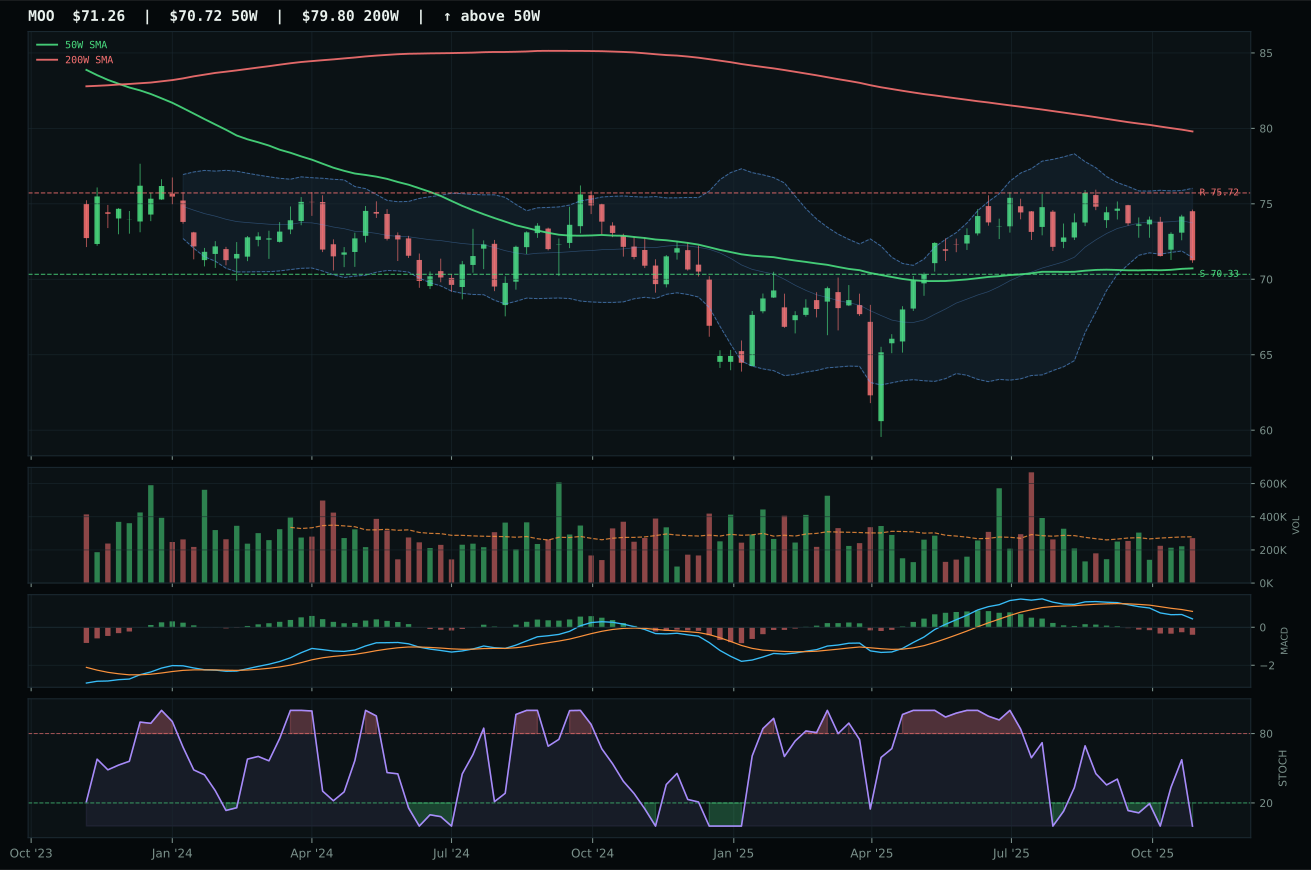
MOO has a pullback into support profile with -10.9% 13-week relative strength versus SPY.
A failed hold above support would weaken the setup.
Actionable but governed by invalidation levels.
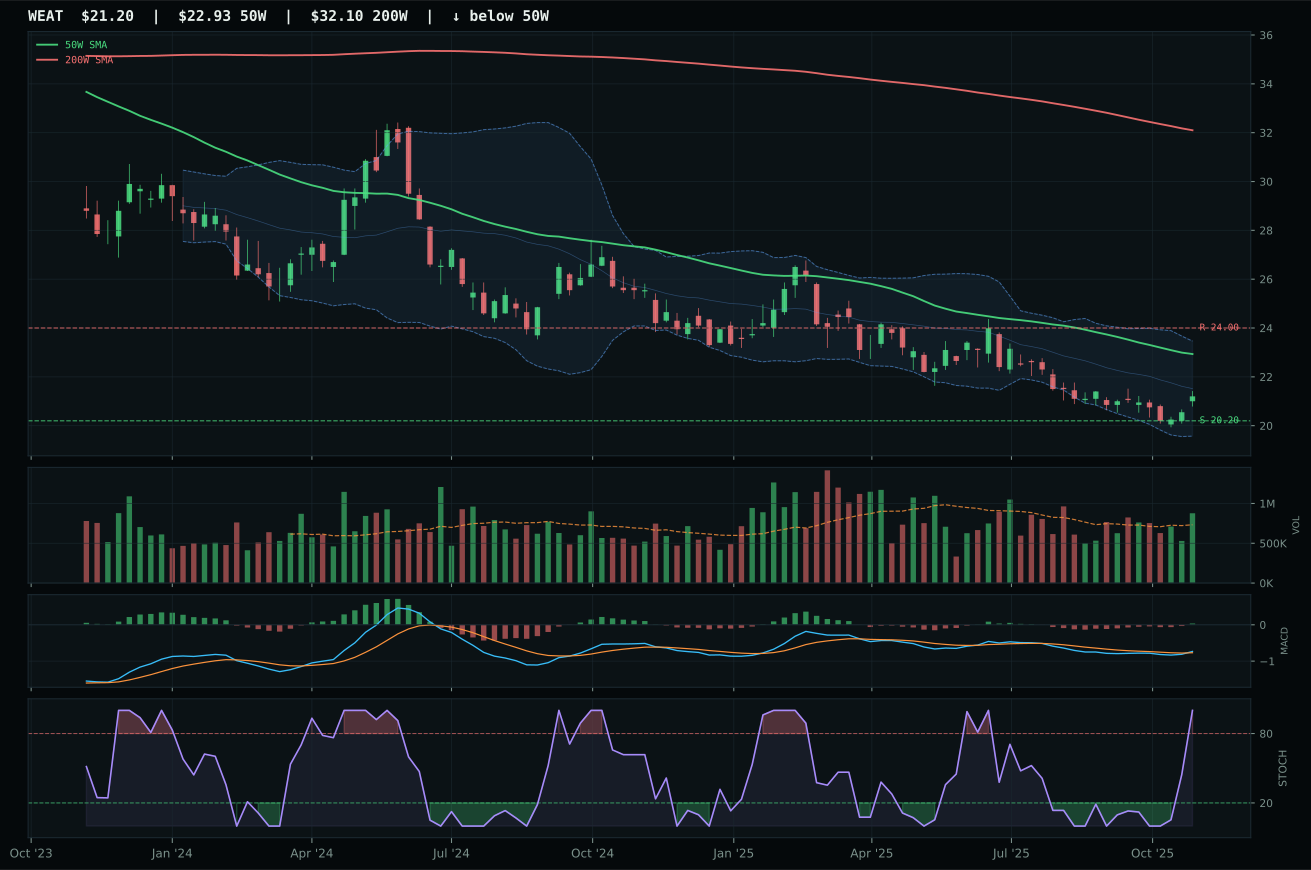
WEAT has a pullback into support profile with -11.1% 13-week relative strength versus SPY.
Extension and support failure are the main tactical risks.
Tracked, but not top-2 eligible because: structurally broken.
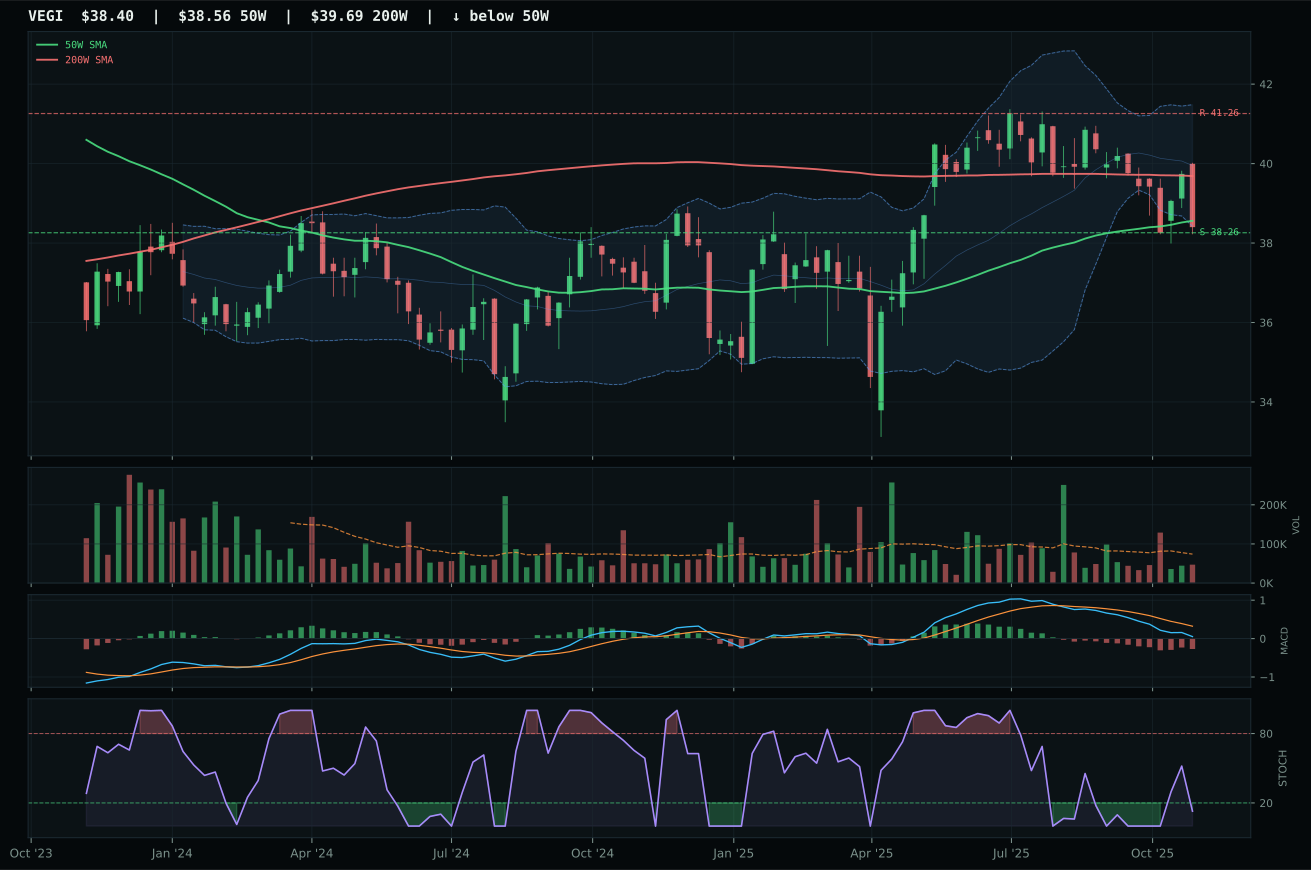
VEGI has a pullback into support profile with -13.2% 13-week relative strength versus SPY.
Extension and support failure are the main tactical risks.
Tracked, but not top-2 eligible because: structurally broken.
MOO wins by virtue of not being worse; both the category and MOO itself score poorly, but MOO edges WEAT on timing (95.0 vs 85.0) and structure cleanliness (73.2 vs 47.8). Price is pulling into support at 70.33 with only 0.8% distance to the 50W—this is not a bullish setup but rather a mean-reversion test where stochastic RSI sits at oversold (0.00) and MACD is bearish/weakening. The 90.0 risk-reward score looks misleading; it reflects tight stops (only 1.3% downside to support) paired with -5.9% upside to resistance, meaning this is a defined-loss bounce trade, not a conviction long. MOO's 0.2% category-relative strength beats WEAT's 0.0%, but this is noise at this score level. The -1.2% 13-week return confirms category rotation is out of favor.
Agriculture & Livestock is excluded from allocation entirely at 0%, ranked 9th or 10th with a 18.8 final score that reflects fundamental sector weakness. Macro fit stands at 59.0/100, buoyed only by real-asset sponsorship (+8) and commodity-breadth positivity (+5), but this is insufficient to overcome negative technical evidence (30.8/100). Liquidity stress active indicator (-4) and the absence of momentum tailwinds in a Transition/Mixed regime mean this category is a value trap masquerading as support-bounce. MOO's technical reading—37.0 trend, 10.0 momentum, 27.8 volume-price confirmation—tells the story: agricultural commodities are not being accumulated, they are being abandoned. The portfolio reserves zero allocation here and would require a clear reversal (price reclaiming the 200W, MACD moving bullish and improving, RS versus SPY turning positive) to re-enter. Until then, capital is better deployed in metals, uranium, or other real-asset proxies with actual demand traction.
Traditional Energy — XLE
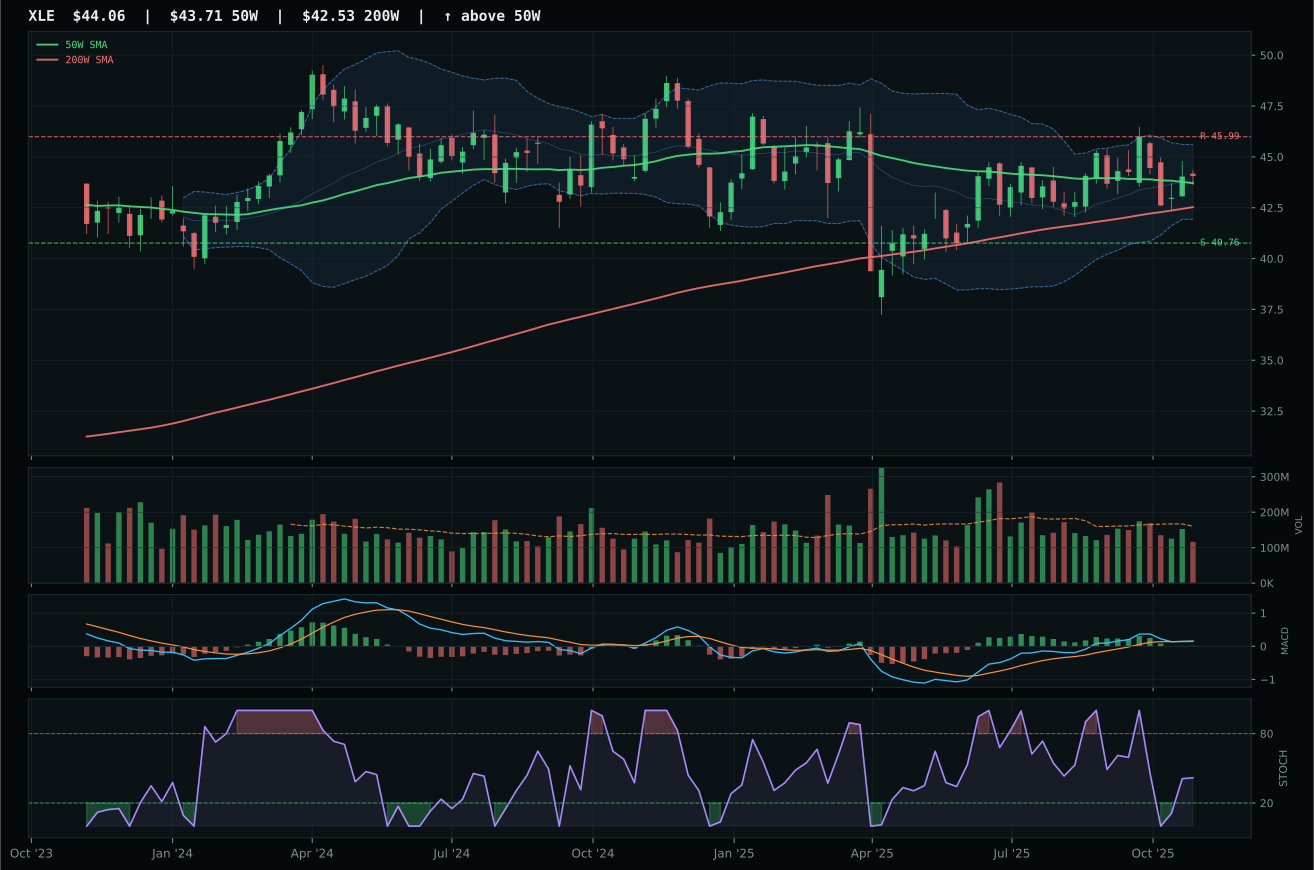
XLE has a compression near 50W profile with -6.7% 13-week relative strength versus SPY.
A failed hold above support would weaken the setup.
Actionable but governed by invalidation levels.
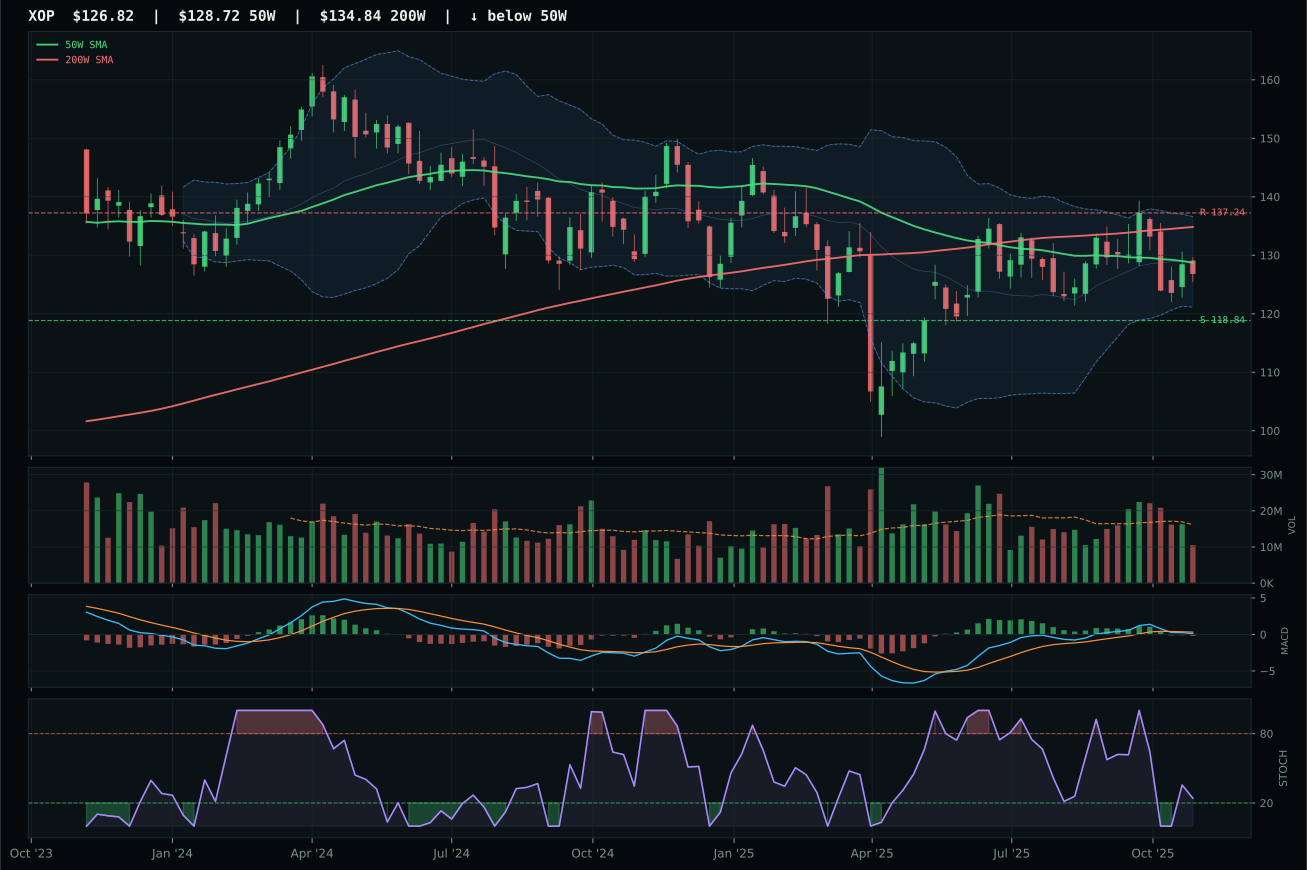
XOP has a compression near 50W profile with -7.2% 13-week relative strength versus SPY.
Extension and support failure are the main tactical risks.
Tracked, but not top-2 eligible because: structurally broken.
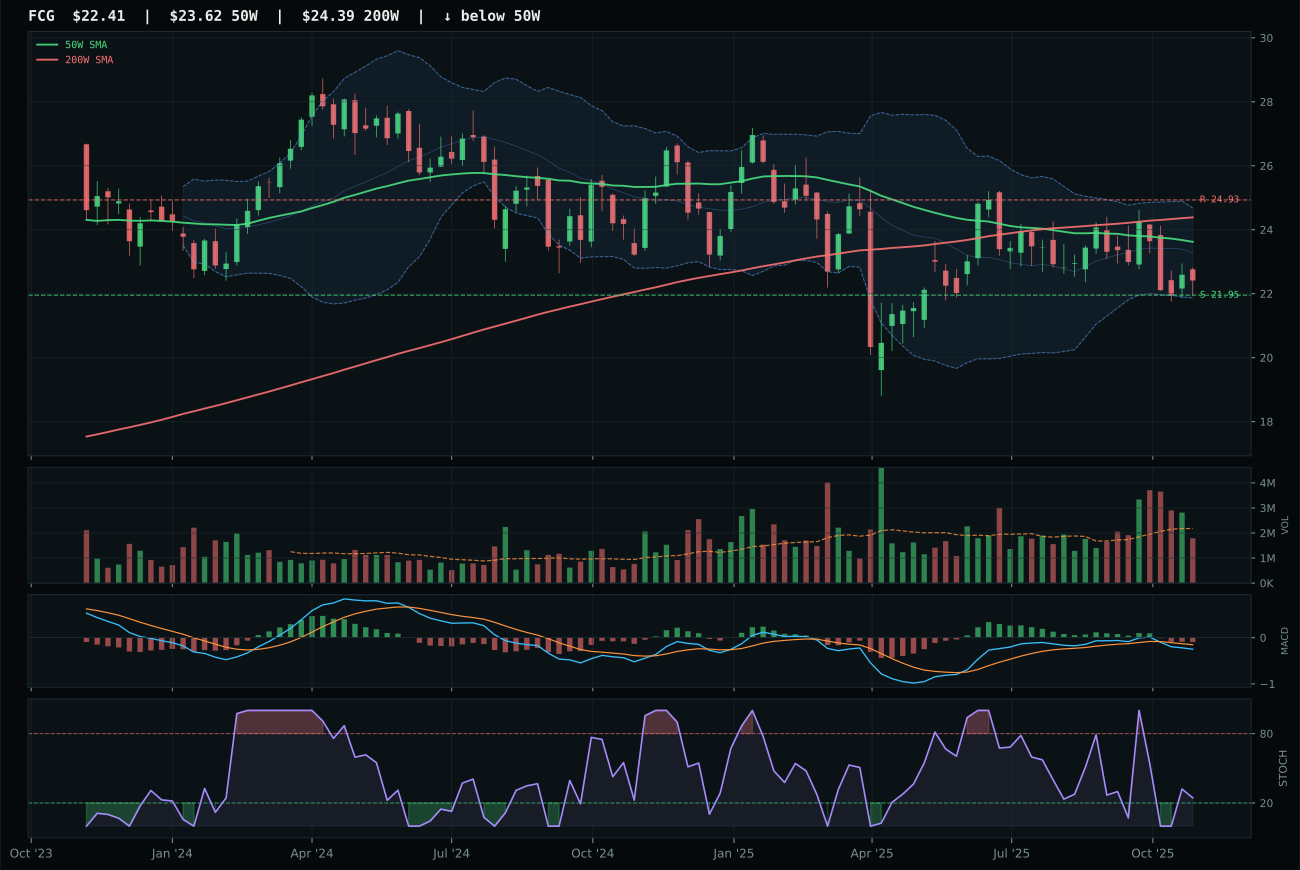
FCG has a pullback into support profile with -11.9% 13-week relative strength versus SPY.
Extension and support failure are the main tactical risks.
Tracked, but not top-2 eligible because: structurally broken.
XLE wins by default; the entire category is broken. XLE's 11.0 score is barely above zero, reflecting a setup compressed near the 50W (0.8% distance) with neutral volume (0.73x average) and flattening momentum (MACD bullish but flattening, stochastic RSI rising mid-zone at 0.42). The timing score is an outlier at 100.0/100—precisely because the setup offers maximum ambiguity, not conviction—while momentum confirmation lags at 42.3/100 and the 3.0% 13-week return whispers exhaustion. Runner-up XOP is structurally broken with bearish/weakening MACD and only 26 trend score; the gap between XLE (67.8 technical evidence) and XOP (29.9) is catastrophic. XLE's sole advantage is that it has not yet invalidated—price remains above both the 50W and 200W—but this is not confidence, it is the absence of a confirmed breakdown.
Traditional Energy is excluded entirely at 0% allocation, ranked 9th or 10th in the portfolio hierarchy. The 11.0 category score and 43.0/100 macro fit reflect a fundamental misalignment: real-asset sponsorship is active (+7), but this is crushed by credit stress (-7) and liquidity stress (-7), leaving neutral macro support in a regime where energy is neither rising nor falling with clear direction. Technical evidence for the category is 67.8/100, carried almost entirely by XLE's ability to stay above the 200W; underneath, the category lacks momentum confirmation, volume sponsorship, and relative strength. XLE's -6.7% SPY-relative performance confirms that energy is underperforming even as price holds structure—the market is not convinced. The portfolio reserves zero capital here and will not re-engage unless one of three conditions holds: (1) price breaks below the 50W and finds institutional support (invalidation cleanup), (2) XLE's MACD turns bullish and improving with volume confirmation, or (3) the macro regime shifts to risk-on and commodity-breadth becomes dominant. Until then, energy is a no-touch category; even value traps require confirmation before they become valid entry points.