
2025-10-24
Informational purposes only. The content in this report, including allocations, analysis, and commentary, is provided solely for informational and educational purposes. It does not constitute financial advice, investment advice, trading advice, or any other type of advice. Past performance does not guarantee future results. Always conduct your own research and consult a qualified financial professional before making investment decisions.
Weekly Allocation
| Ticker | Category | Weight | Role |
|---|---|---|---|
| FBTC | 50% | Overlay | |
| XLU | Utilities & Infrastructure | 10% | Top-2 (10%) |
| REMX | Industrial Metals | 10% | Top-2 (10%) |
| SMH | AI | 5% | Tier-2 (5%) |
| GLD | Precious Metals | 5% | Tier-2 (5%) |
| XLK | Technology | 5% | Tier-2 (5%) |
| NLR | Nuclear Energy | 5% | Tier-2 (5%) |
| XAR | Defense & Aerospace | 5% | Tier-2 (5%) |
| XLE | Traditional Energy | 5% | Tier-2 (5%) |
Trade Instructions — Monday Open
Sell the tranche from 2025-09-26 (completing its 4-week hold). Buy the new tranche. Instructions show net portfolio changes — same-asset positions cancel, weight changes show the delta.
| Action | Ticker | Instruction |
|---|---|---|
| SELL | COPX | Sell 50% of COPX position (reduce 5.00% → 2.50%) |
| SELL | SLV | Sell 33% of SLV position (reduce 7.50% → 5.00%) |
| SELL | IGV | Sell entire IGV position (1.25% of portfolio) |
| SELL | ILF | Sell entire ILF position (1.25% of portfolio) |
| SELL | URA | Sell 25% of URA position (reduce 5.00% → 3.75%) |
| BUY | XLU | Buy XLU — 14.29% of freed cash (adds 1.25% to portfolio) |
| BUY | XAR | Buy XAR — 14.29% of freed cash (adds 1.25% to portfolio) |
| BUY | XLK | Buy XLK — 14.29% of freed cash (adds 1.25% to portfolio) |
| BUY | REMX | Buy REMX — 28.57% of freed cash (adds 2.50% to portfolio) |
| BUY | GLD | Buy GLD — 14.29% of freed cash (adds 1.25% to portfolio) |
| BUY | NLR | Buy NLR — 14.29% of freed cash (adds 1.25% to portfolio) |
Current Portfolio After Trade
Combined holdings across all 4 active tranches. Each tranche is 25% of the portfolio.
| Ticker | % of Portfolio | Weight Bar |
|---|---|---|
| FBTC | 50.00% | |
| SMH | 6.25% | |
| XLU | 6.25% | |
| SLV | 5.00% | |
| XAR | 5.00% | |
| XLK | 5.00% | |
| REMX | 5.00% | |
| XLE | 3.75% | |
| URA | 3.75% | |
| GLD | 3.75% | |
| COPX | 2.50% | |
| NLR | 2.50% | |
| IEMG | 1.25% |
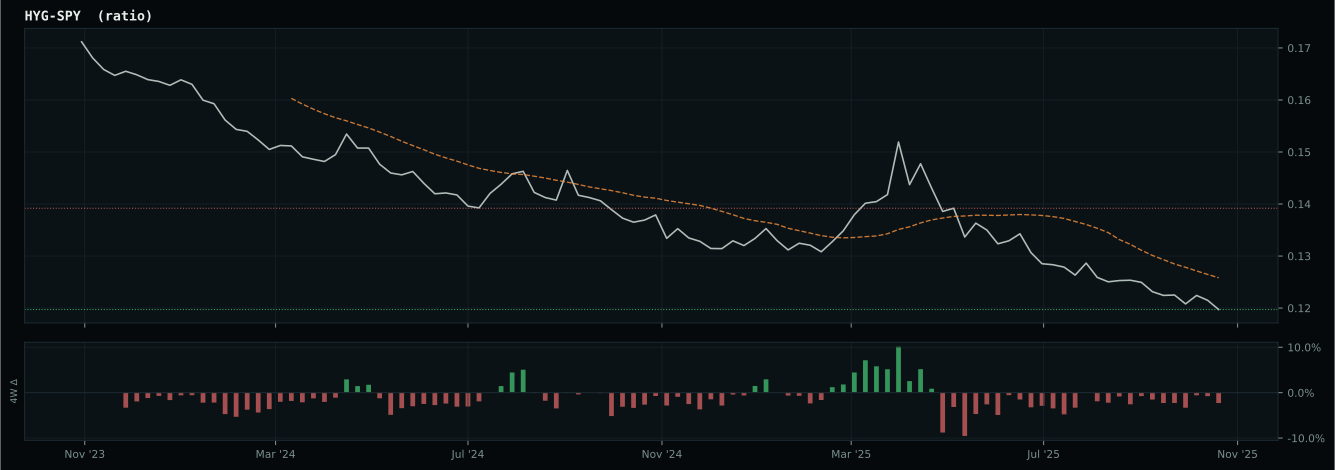
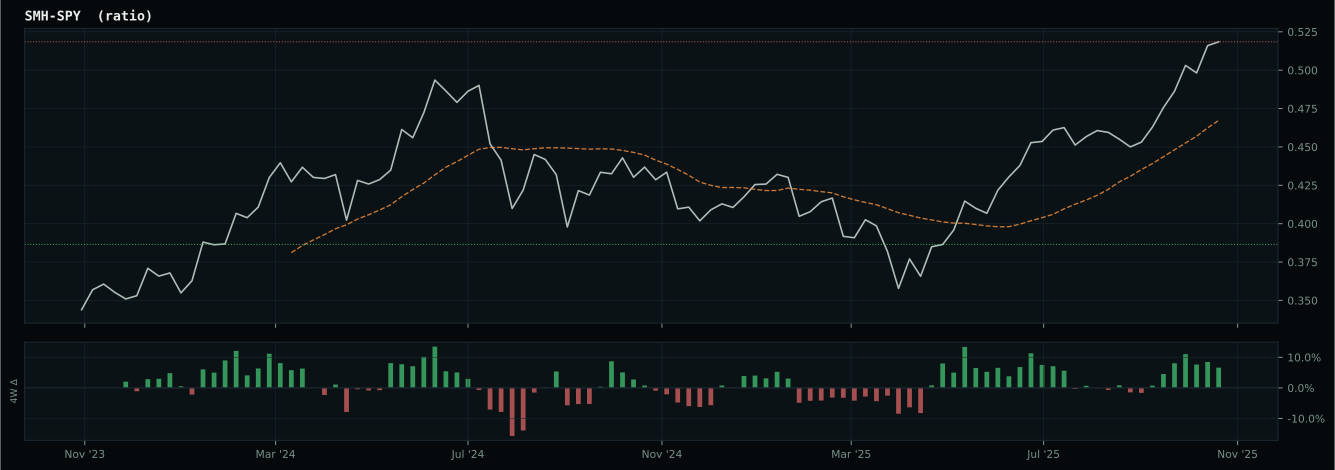
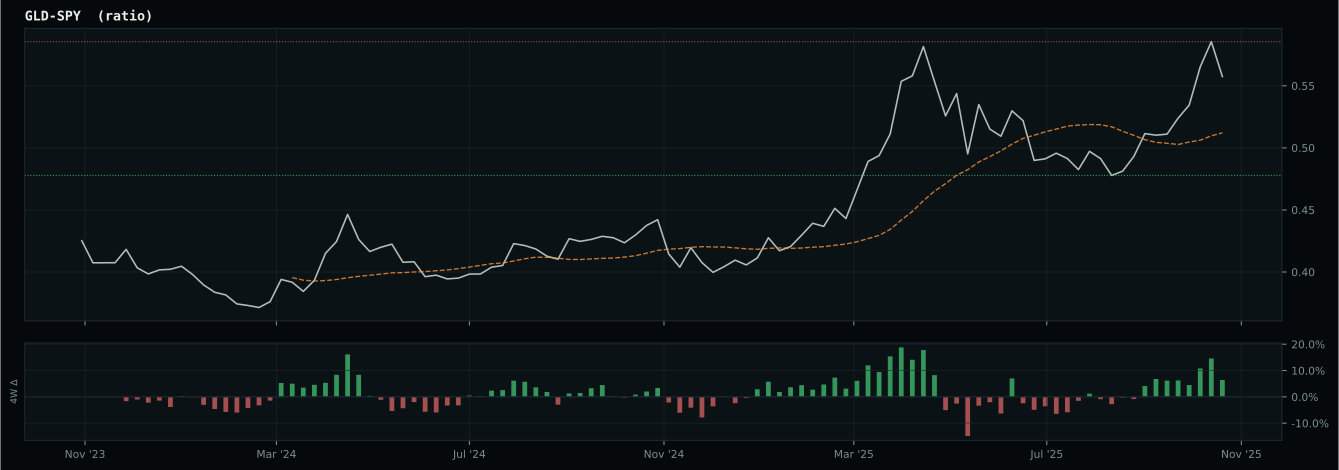
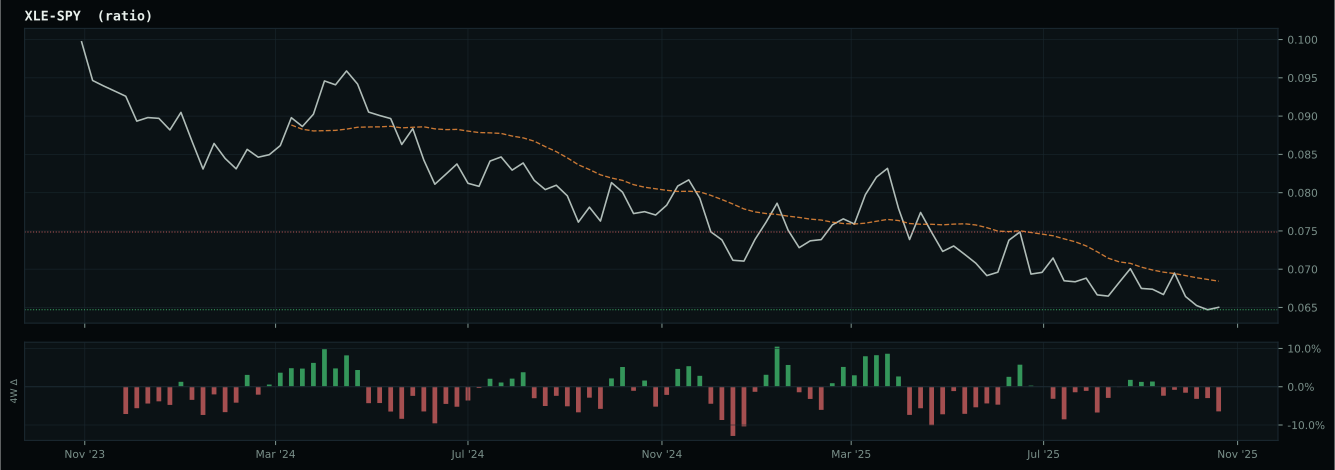
Macro Regime — Disinflation
Macro Evidence Charts
Market-implied signals behind the macro regime scores. Each ratio compares two assets; the direction and slope of the ratio is what the macro engine reads.
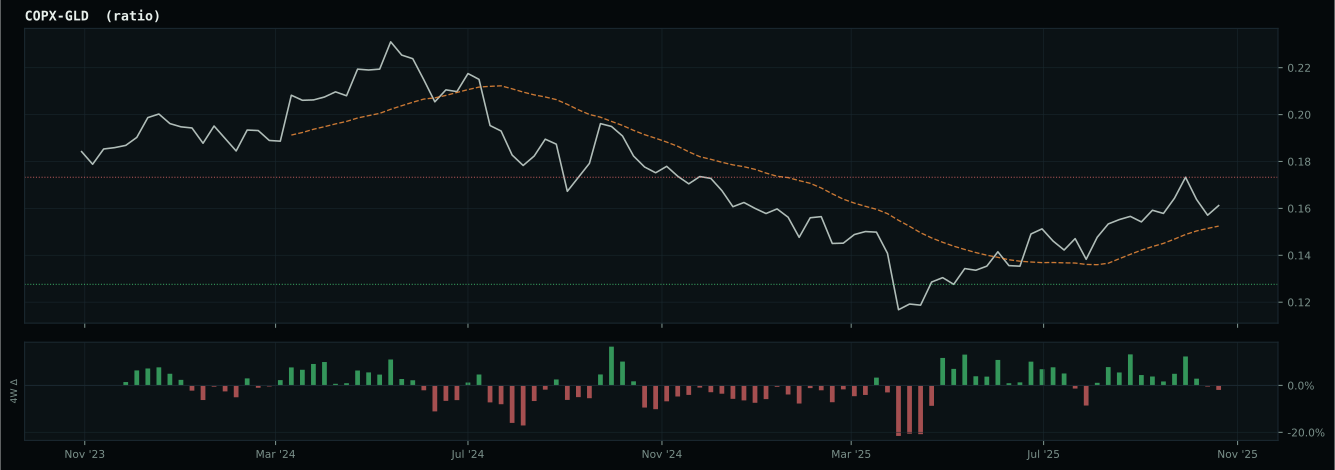
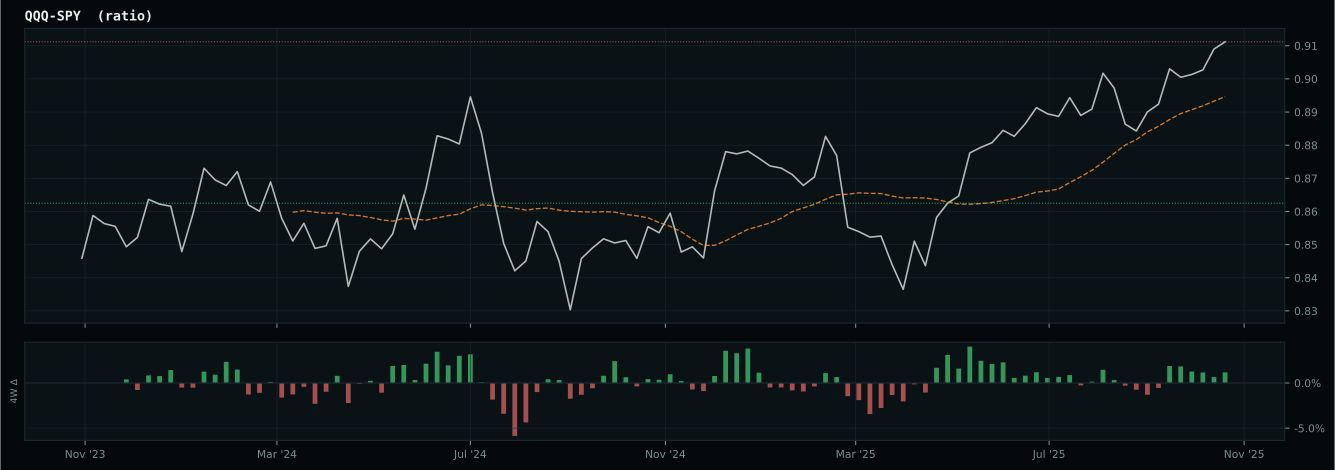
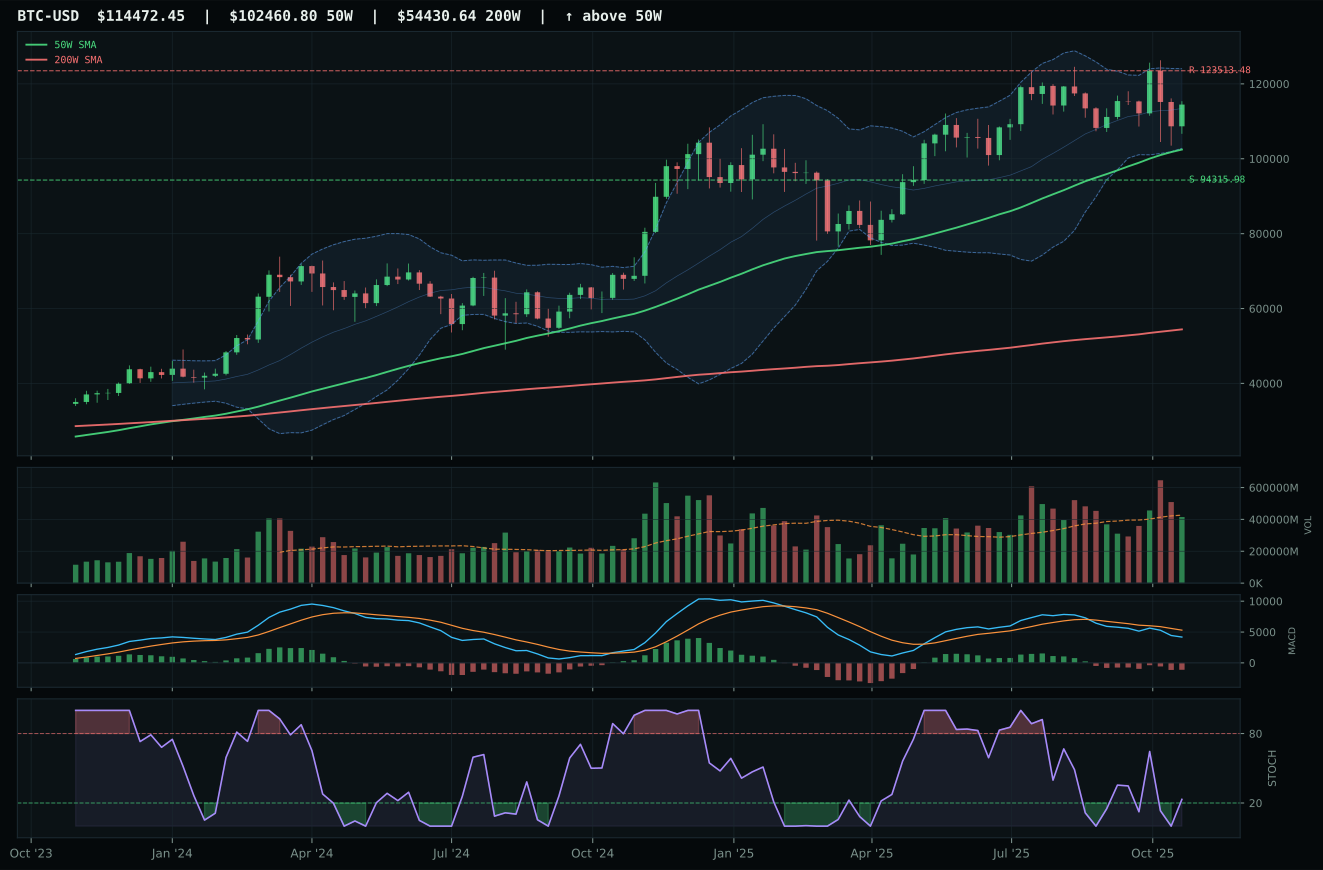
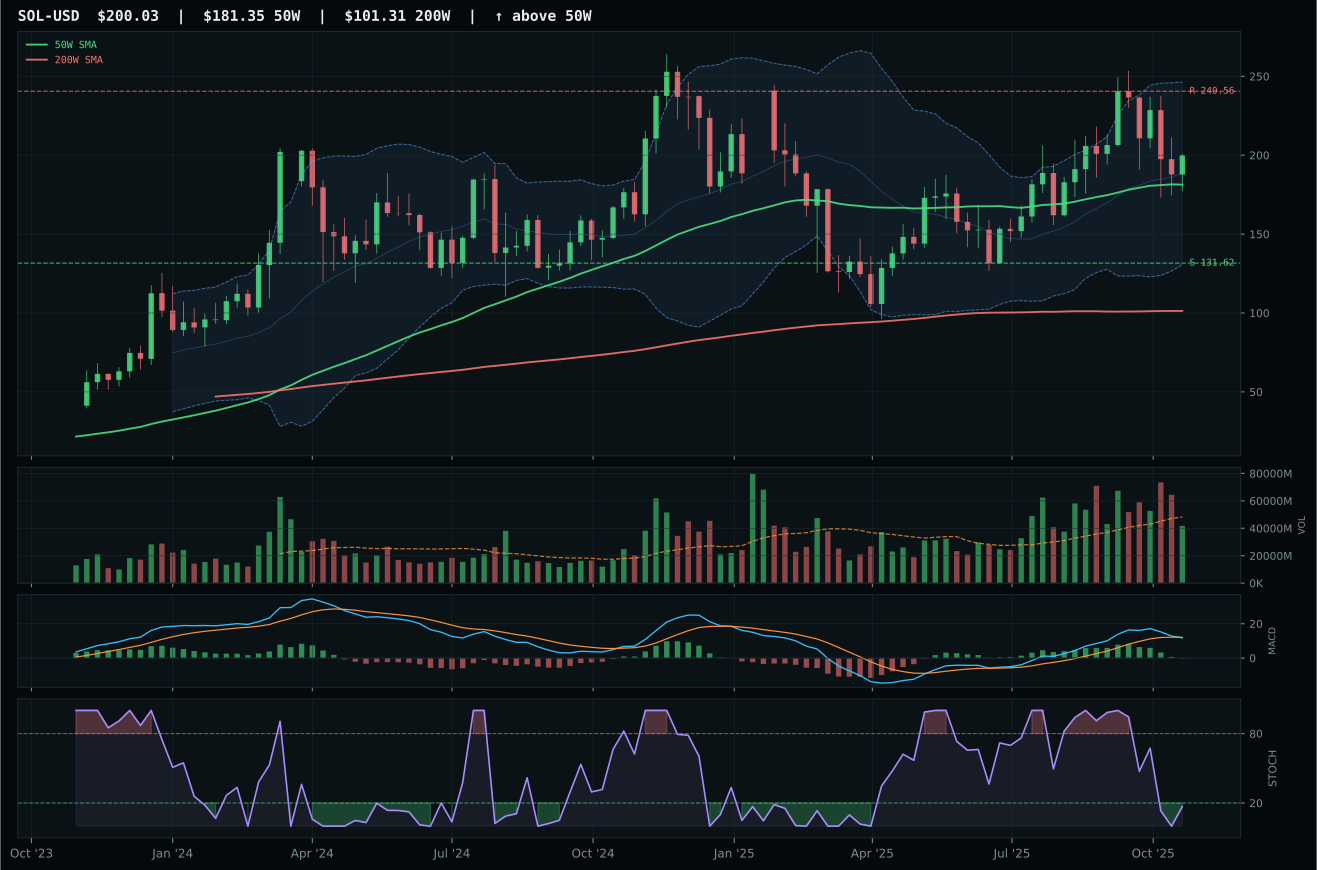
Crypto Regime — TrendBTC
ValueBTC not armed: BTC has not made the first post-breakdown touch of the 200W buy zone after losing the 50W
TrendBTC confirmed: 2 consecutive closes above rising/flat 50W SMA
one or more available conditions failed
Category Rankings
| Rank | Category | Winner | Score | Alloc | 4W Ret | Peers (4W) |
|---|---|---|---|---|---|---|
| 1 | Utilities & Infrastructure | XLU | 71.6 | 20% | -3.40% | PAVE -4.5% · IGF -0.8% |
| 2 | Industrial Metals | REMX | 70.4 | 20% | -5.95% | COPX -5.8% · PICK -3.4% |
| 3 | AI | SMH | 65.4 | 10% | -8.02% | BOTZ -12.1% · AIQ -8.6% |
| 4 | Precious Metals | GLD | 61.8 | 10% | +1.01% | SLV +5.7% · GDX +5.7% |
| 5 | Technology | XLK | 59.1 | 10% | -7.61% | CIBR -8.1% · IGV -13.9% |
| 6 | Nuclear Energy | NLR | 53.5 | 10% | -18.99% | URA -20.6% · URNM -13.7% |
| 7 | Defense & Aerospace | XAR | 47.6 | 10% | -12.55% | ROKT -8.8% · ITA -9.2% |
| 8 | Emerging Markets | IEMG | 33.5 | 10% | -4.54% | INDA -1.2% · ILF +3.0% |
| 9 | Agriculture & Livestock | MOO | 16.1 | 0% | -4.28% | VEGI -2.7% · WEAT -1.2% |
| 10 | Traditional Energy | XLE | — | 0% | +1.10% | XOP -0.2% · FCG +3.4% |
Utilities & Infrastructure — XLU
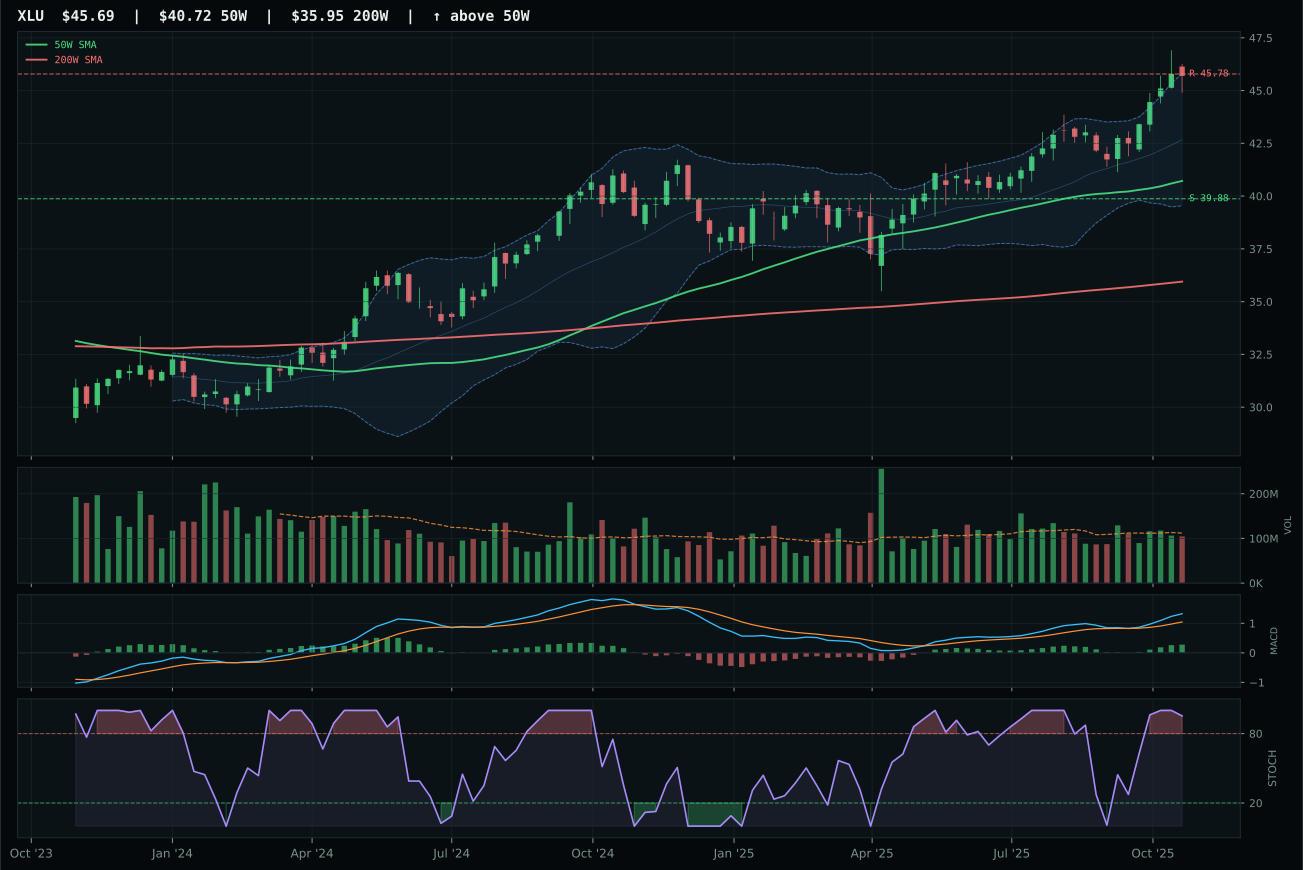
XLU has a neutral structure profile with 1.8% 13-week relative strength versus SPY.
A failed hold above support would weaken the setup.
Actionable but governed by invalidation levels.
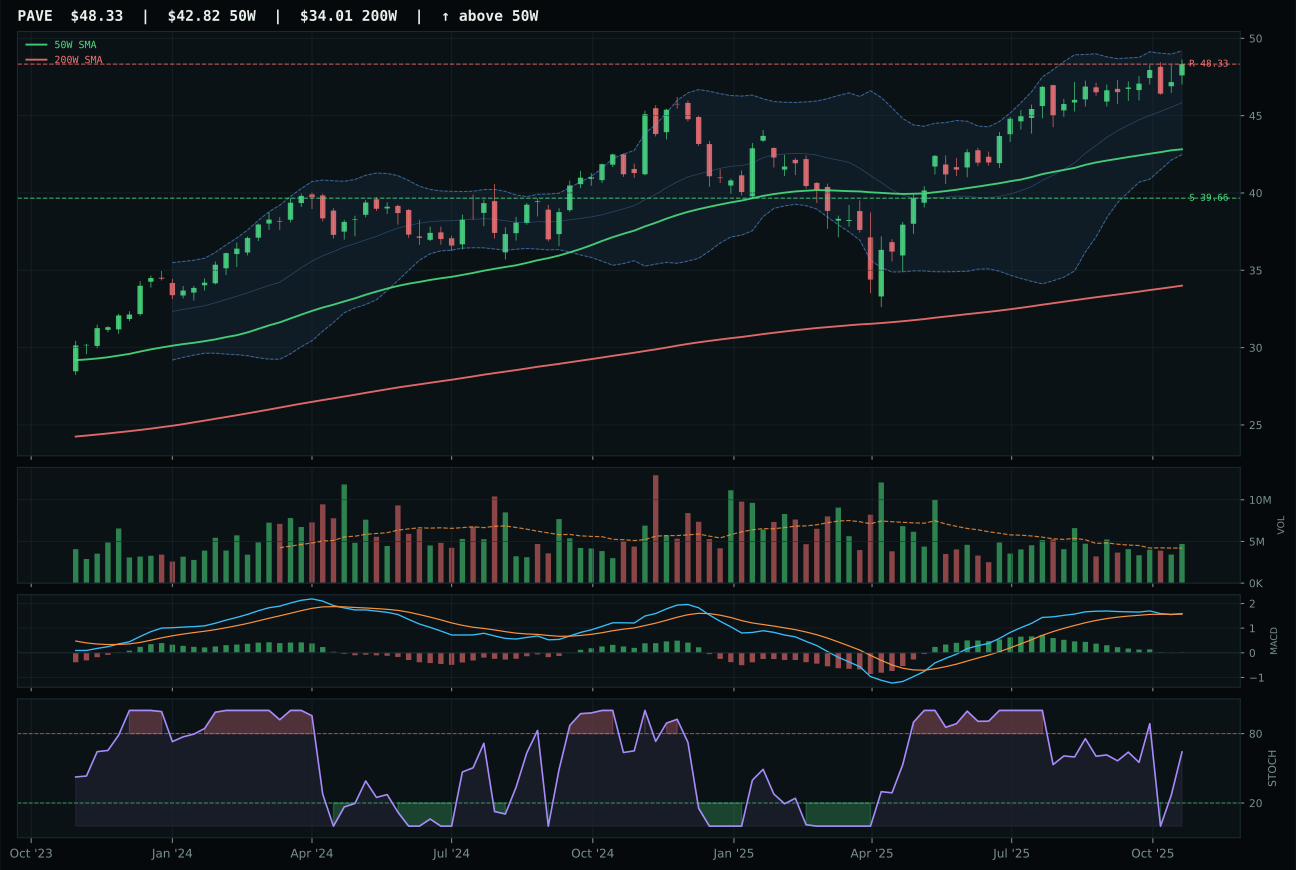
PAVE has a neutral structure profile with -3.2% 13-week relative strength versus SPY.
A failed hold above support would weaken the setup.
Actionable but governed by invalidation levels.
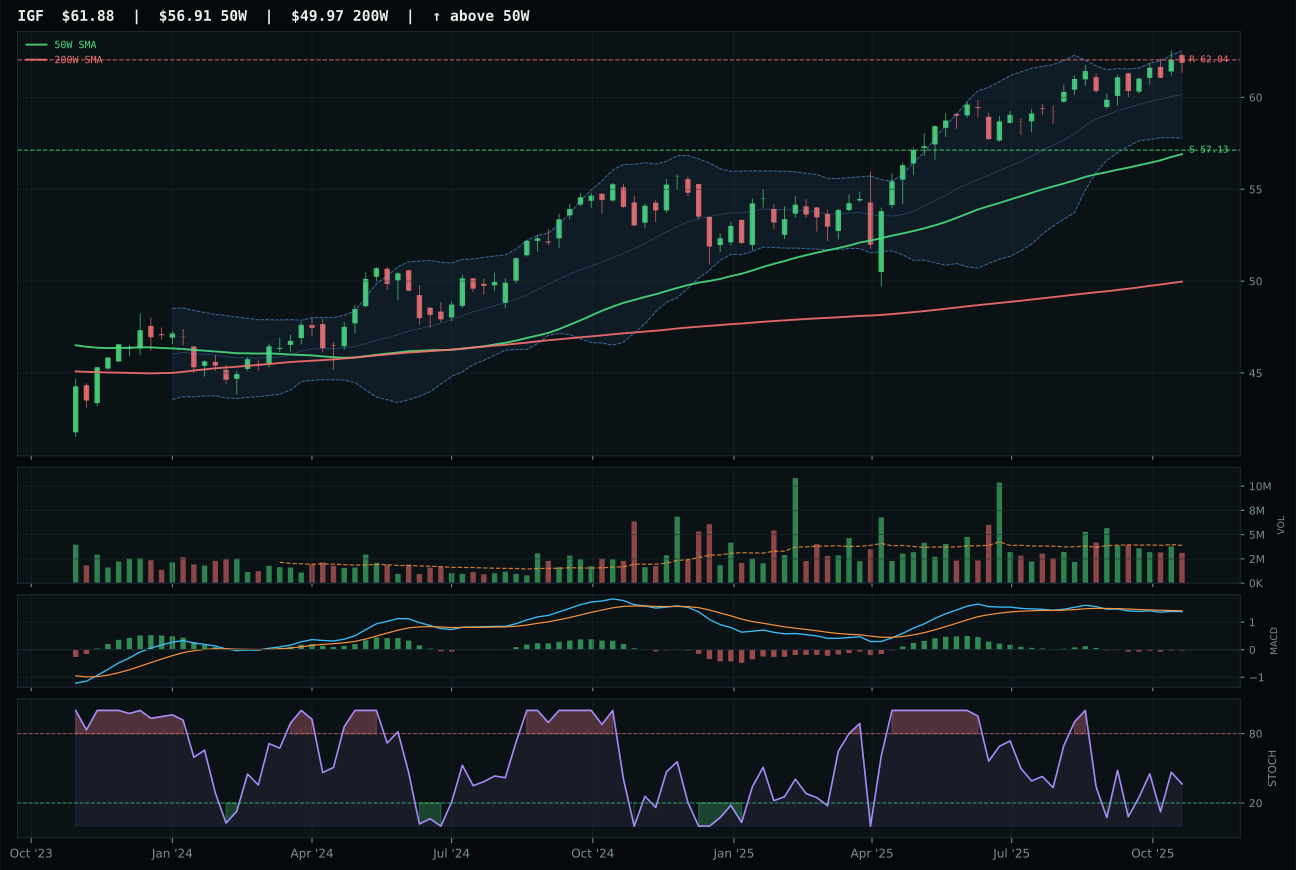
IGF has a neutral structure profile with -2.1% 13-week relative strength versus SPY.
A failed hold above support would weaken the setup.
Actionable but governed by invalidation levels.
XLU is the clear category winner and top-2 portfolio leader, combining perfect trend (100/100) with the macro tailwind that no other category can match. Defensive rotation is actively fueling utility buying at +12, with disinflation pressure adding another +6, and XLU's 1.8% RS versus SPY combined with 8.1% thirteen-week return signals that institutions are rotating into the safety play methodically rather than chasing. The 12.2% distance above the 50W is moderate—not stretched—and neutral volume at 0.93x average means there is no distribution pressure to force early exits. MACD is bullish and improving, stochastic RSI is overbought rolling over at 0.95 (a healthy signal that enthusiasm is cooling before reversal), and the neutral structure of 75.5 reflects that this is not a speculative breakout but a systematic defensive reallocation. PAVE's -1.1% category-relative strength and bullish but flattening MACD failed to match XLU's improving confirmation; structure matters less when macro tide is running this hard.
Utilities & Infrastructure earned 10% as a top-2 overweight on the back of a 71.6 category score driven equally by strong technicals (68.2 in XLU) and the strongest category-level macro fit outside Precious Metals. The 74.0 macro fit reflects disinflation helping the category (+7), defensive rotation (+12), and disinflation pressure (+6) all confirming that this is the regime's safe-haven play. Credit stress (-5) and liquidity stress (-3) are manageable headwinds in context of that tailwind. XLU's 3.9% category-relative strength and improving MACD execution prove that the rotation is not rotation into the least bad, but into a name that is actually accumulating capital. This is a conviction 10% allocation, not a damage-control position. Utilities will remain at 10% until either XLU's technical evidence deteriorates (MACD flattens, momentum rolls over) or macro pivots back toward risk appetite (credit stress clears), at which point the capital would shift to Industrial Metals or other risk assets; for now, XLU represents the portfolio's core defensive barbell paired with the scarcity and momentum of REMX.
Industrial Metals — REMX
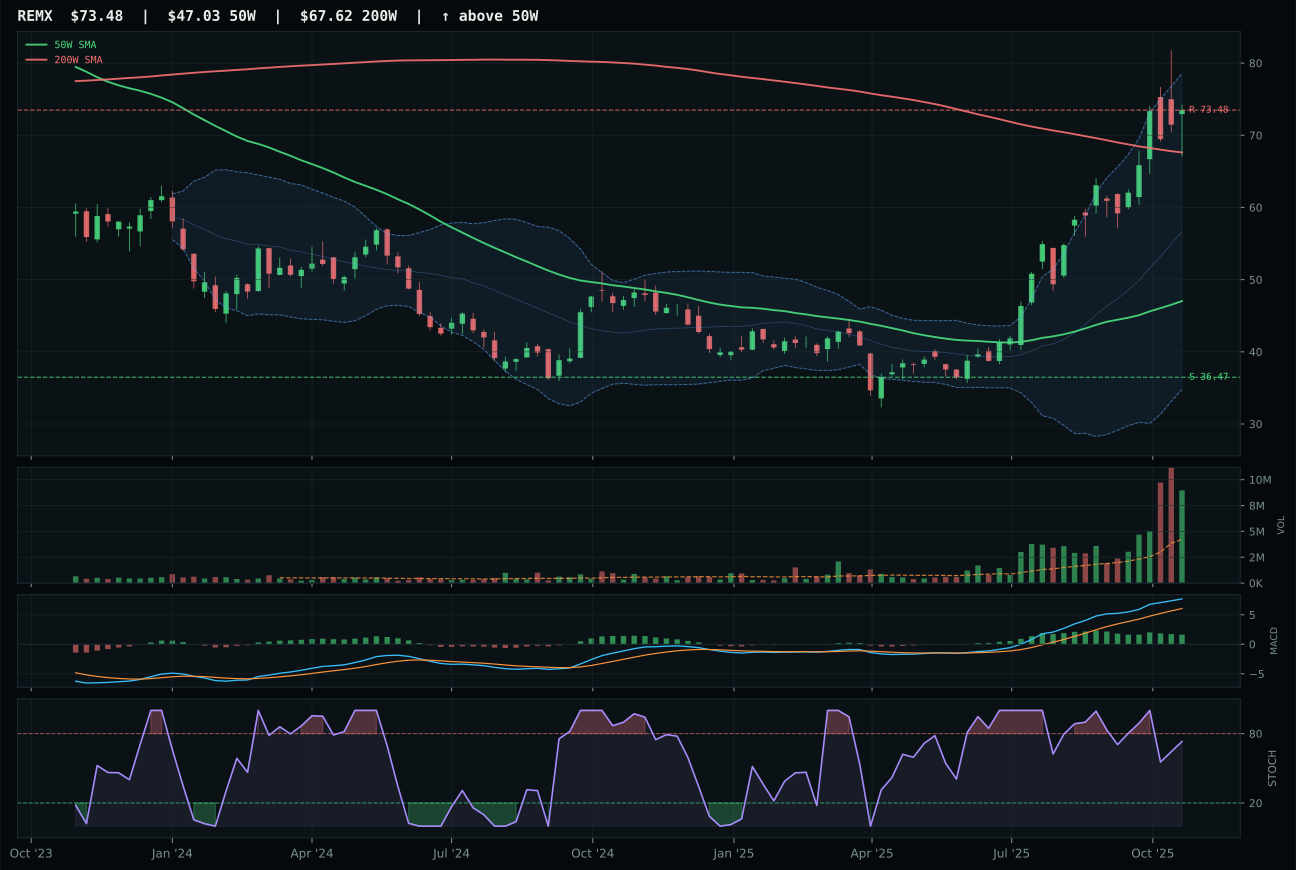
REMX has a vertical extension profile with 27.5% 13-week relative strength versus SPY.
A failed hold above support would weaken the setup.
Actionable but governed by invalidation levels.
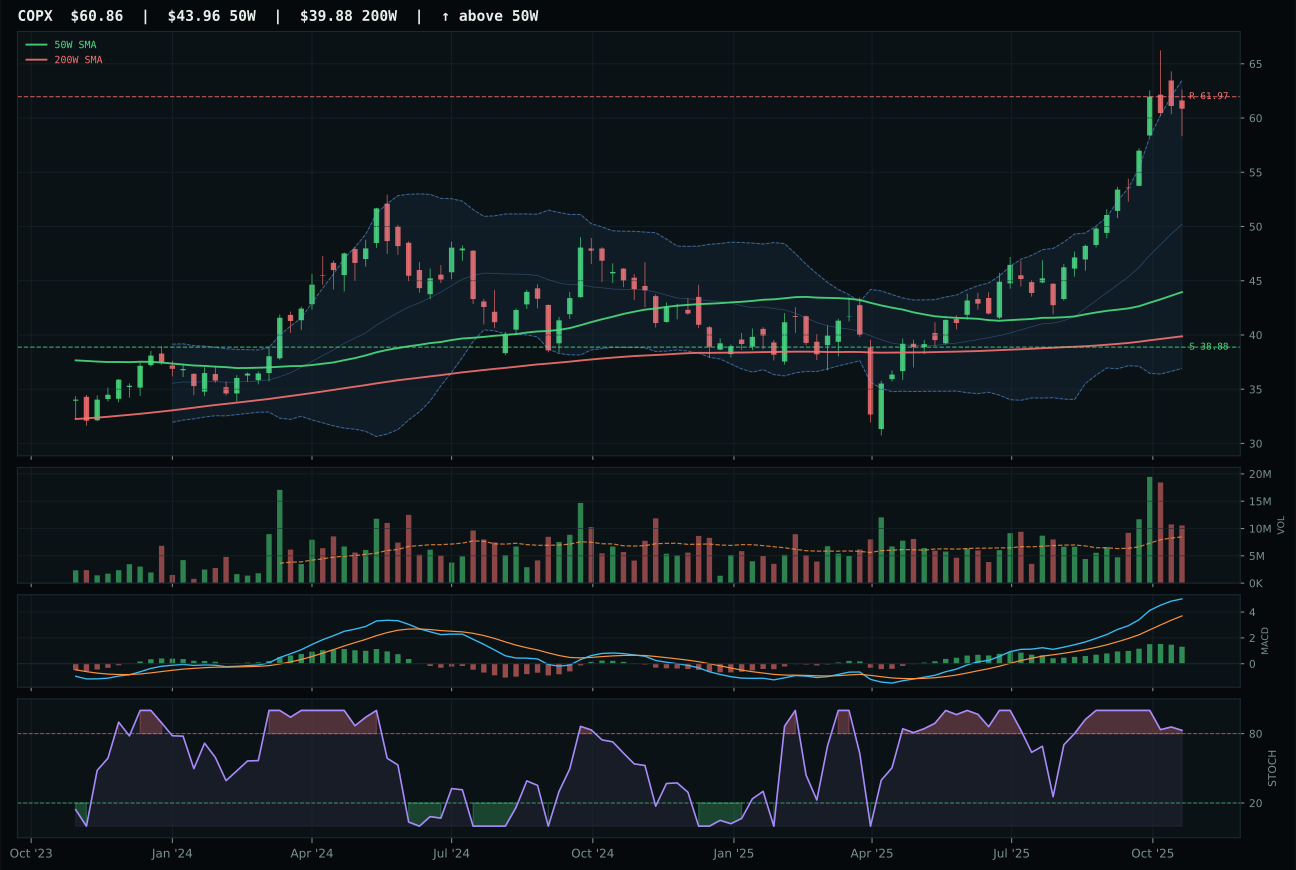
COPX has a vertical extension profile with 28.3% 13-week relative strength versus SPY.
A failed hold above support would weaken the setup.
Actionable but governed by invalidation levels.
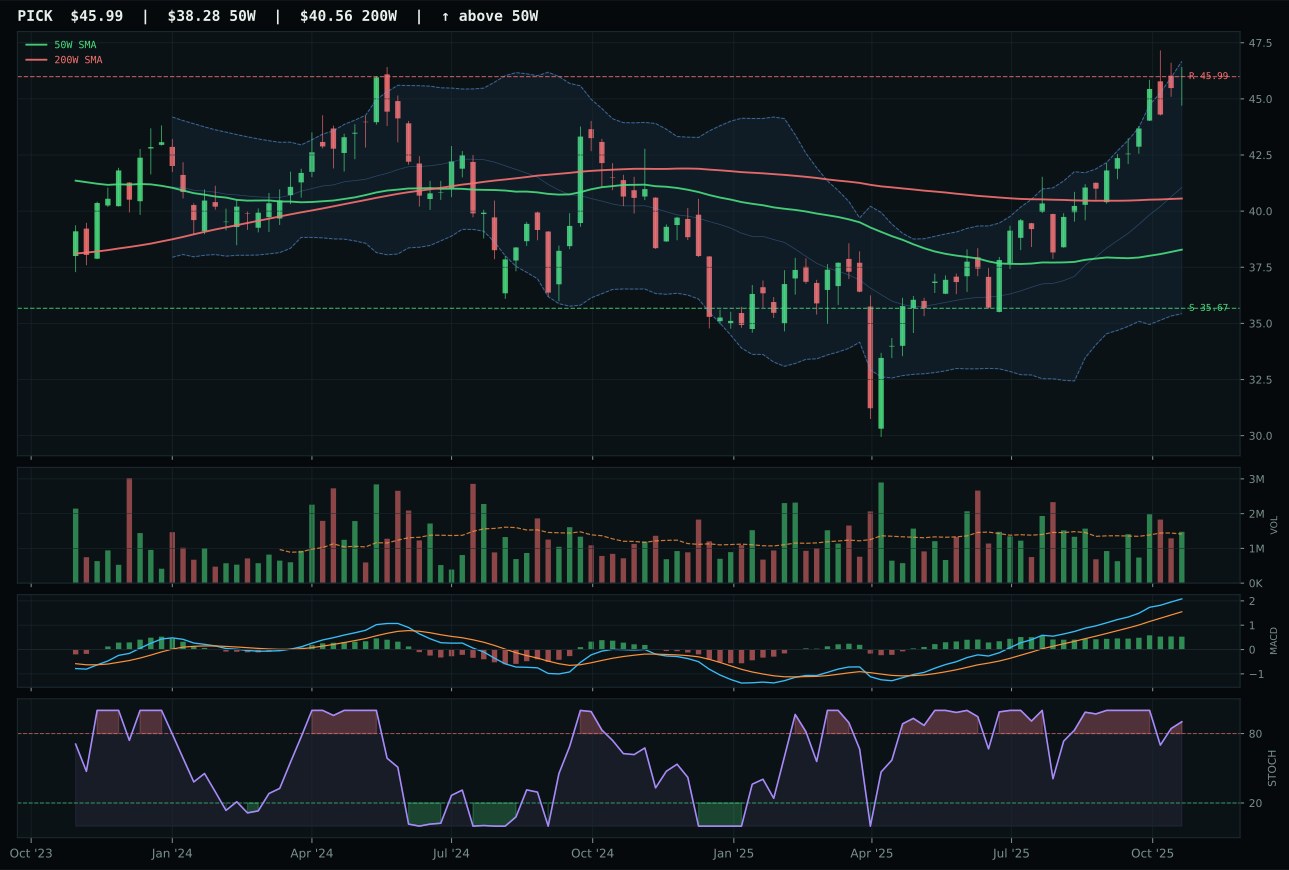
PICK has a vertical extension profile with 7.7% 13-week relative strength versus SPY.
A failed hold above support would weaken the setup.
Actionable but governed by invalidation levels.
REMX dominates Industrial Metals with a technical setup that combines rare-earth scarcity sponsorship, persistence, and the cleanest volume-price confirmation in the entire portfolio. The 27.5% RS versus SPY and 33.8% thirteen-week return anchor REMX's 100/100 momentum score; more tellingly, volume confirmation scored 86.4 and persistence 100.0, the latter meaning that every filter (trend, relative strength, MACD, volume) is all confirming together. MACD is bullish but flattening—the only minor flaw—and stochastic RSI has cooled to falling/neutral at 0.73, but the 56.2% extension above the 50W and 2.12x accumulation/confirmation volume prove that buyers are not rushing in blind. COPX posted 28.3% RS and improving MACD, but its timing score of 35.0 lagged REMX's 48.0, and overbought stochastic RSI rolling over signals distribution rather than fresh conviction. The -4.3 point score gap overstates the case: both are strong; REMX is simply cleaner on momentum confirmation and persistence.
Industrial Metals is allocated 10% as a top-2 overweight, the highest category rank driven by technical evidence of 82.4 in REMX and category-level macro fit of 65.0. Metals scarcity (+14), commodity breadth positive (+10), and real asset sponsorship (+6) provide active macro tailwinds in a disinflation regime, while liquidity stress and credit stress are manageable headwinds at -8 and -7 respectively. The 70.4 category score reflects a rare alignment: technicals are strong across the basket (REMX 74.8, COPX 68.7), macro narrative is favorable, and the setup combines momentum with healthy volume. This is not an extension play; REMX's 86.4% volume-price confirmation and 100.0% persistence prove the move is being accumulated by institutions, not distributed to retail. Industrial Metals ranks below Utilities (71.6) only because Utilities' macro fit is slightly superior (74.0 vs 65.0), but both are core portfolio holdings and would flip if either's technical evidence deteriorates.
AI — SMH
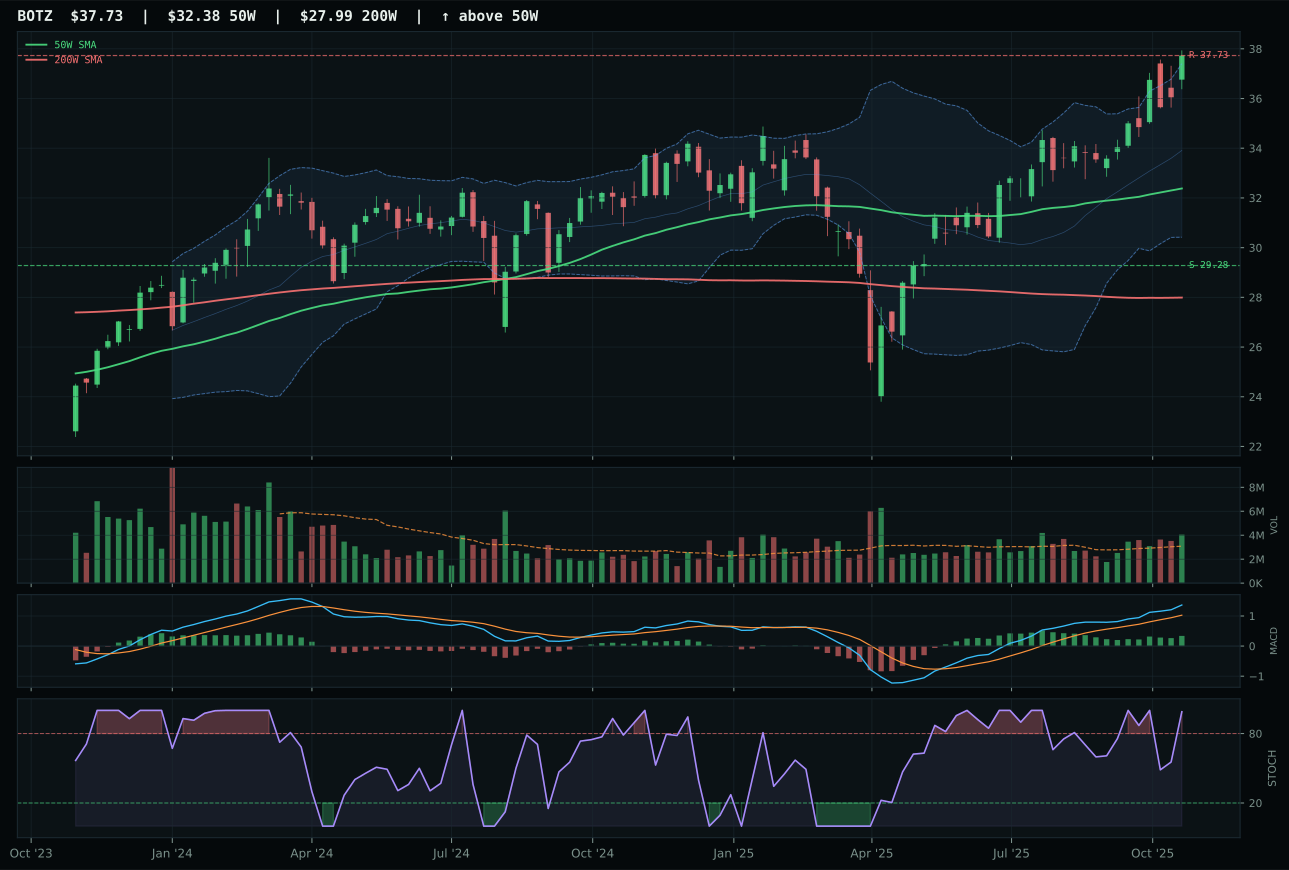
BOTZ has a vertical extension profile with 3.6% 13-week relative strength versus SPY.
A failed hold above support would weaken the setup.
Actionable but governed by invalidation levels.
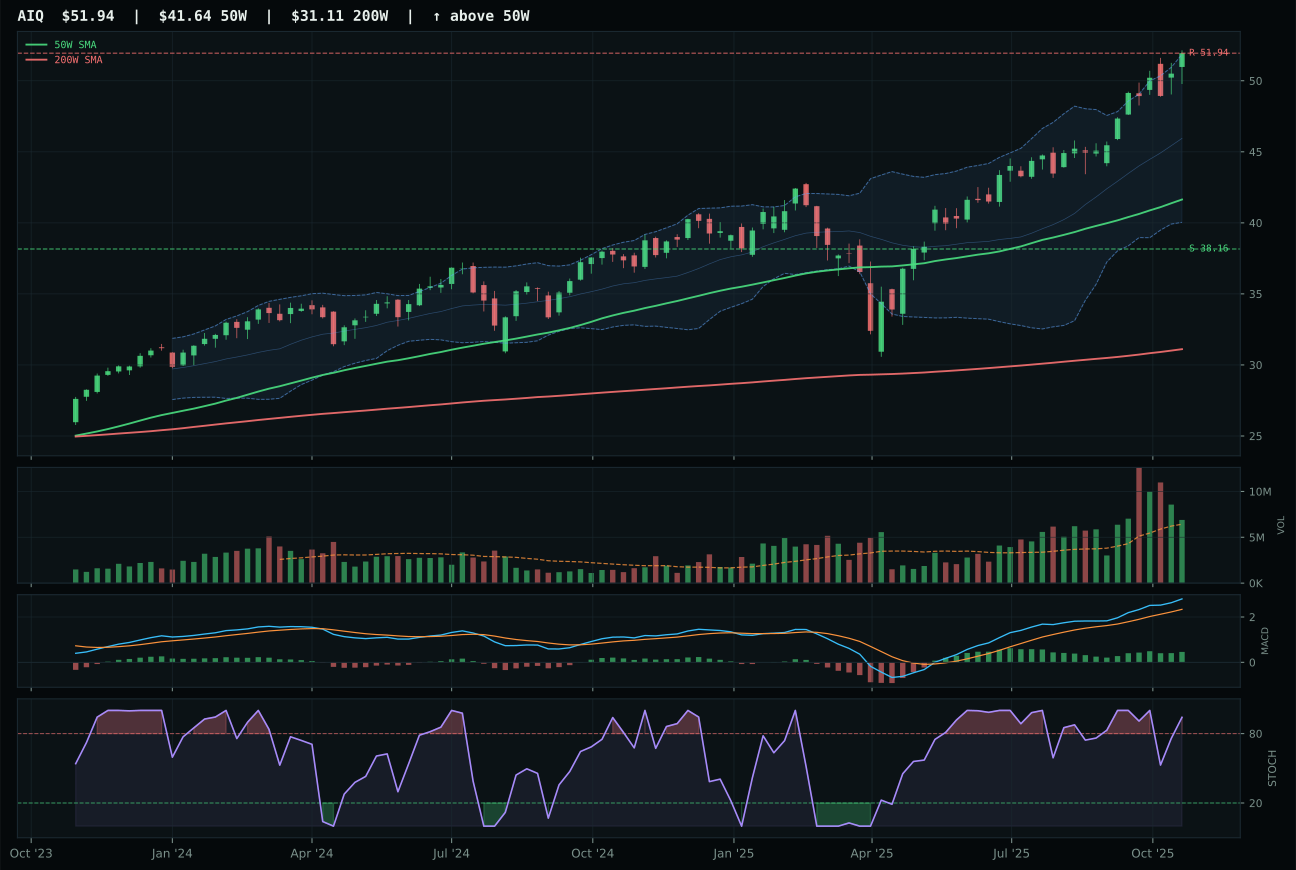
AIQ has a vertical extension profile with 9.8% 13-week relative strength versus SPY.
A failed hold above support would weaken the setup.
Actionable but governed by invalidation levels.
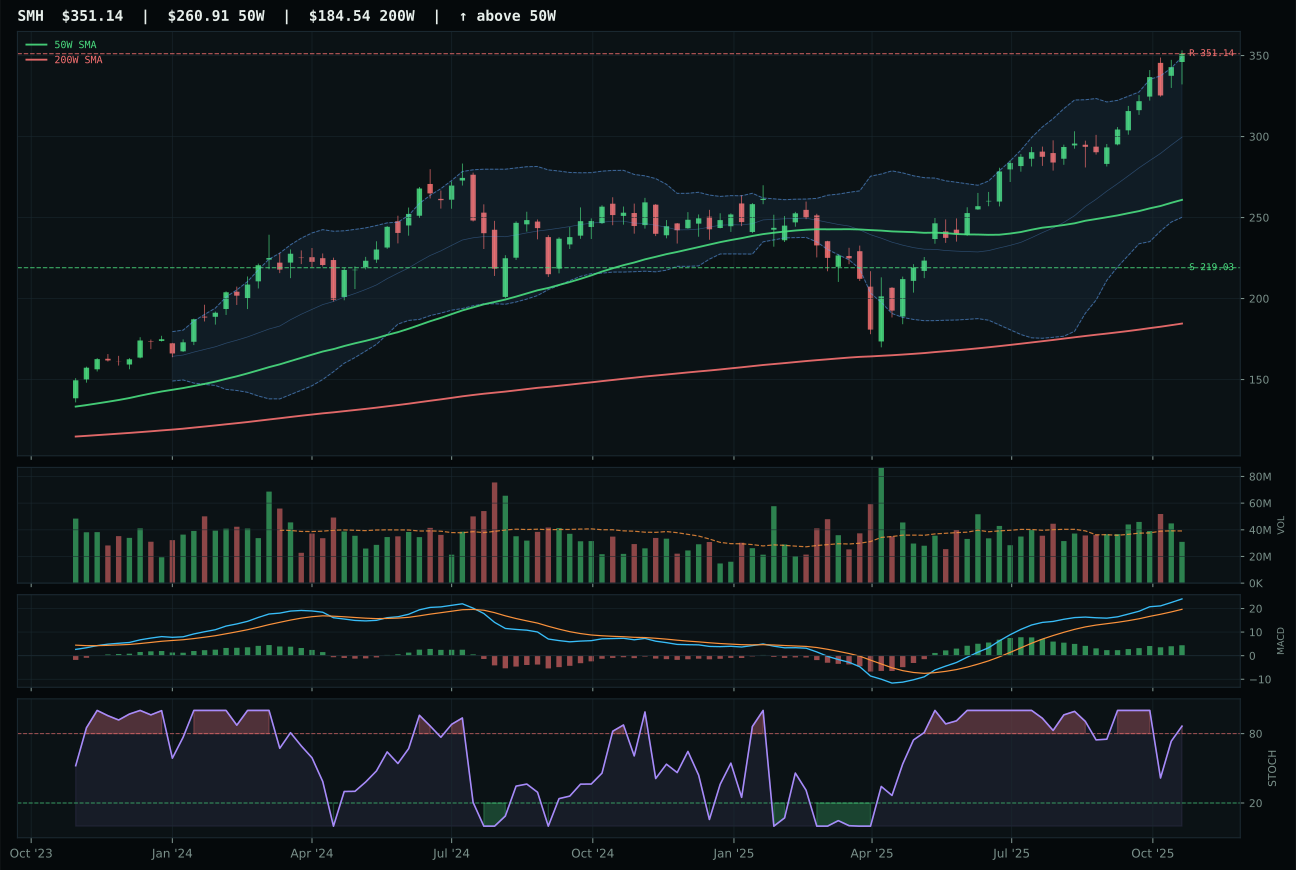
SMH has a vertical extension profile with 15.8% 13-week relative strength versus SPY.
A failed hold above support would weaken the setup.
Actionable but governed by invalidation levels.
SMH dominated the AI category by pairing the strongest momentum confirmation in the group with category-relative leadership that BOTZ could not match. The semiconductor play delivered a 15.8% RS advantage over SPY and 6.0% category-relative strength, versus BOTZ's -6.2% lagging within the AI basket, a decisive 12.2-point spread that reflects where capital is actually flowing. SMH's 22.1% thirteen-week return and 100/100 momentum score are backed by improving MACD and neutral volume at 0.79x average, signaling accumulation without distribution pressure. At 34.6% above the 50W, the chart is extended and timing scores just 27.0, but BOTZ's vertical extension and above-average participation volume did not overcome its macro disadvantage: robotics carry a lower AI growth sponsorship rating and face tighter credit/liquidity headwinds in a disinflation environment.
AI holds 5% as tier-2 despite a strong 65.4 category score. The reasoned ETF proof order placed BOTZ at 62.0 ahead of SMH's 59.3, yet SMH's technical leadership in the current setup (momentum 100 vs 79, volume confirmation 67.5 vs 56) elevated it to category representative. The setup gap reflects how technical evidence (62% weight) can override the macro ordering when persistence is high; SMH's 85.6% persistence score confirmed the relative strength is real. That said, AI ranks below both Industrial Metals (70.4) and Utilities (71.6) because liquidity stress and credit stress together subtract 20 points from the macro fit, and no macro descriptor exclusive to semiconductors offsets that drag. AI will return to top-2 when either risk appetite fully stabilizes or when the category's technical scores begin to deteriorate, signaling that the current holders are exiting.
Precious Metals — GLD
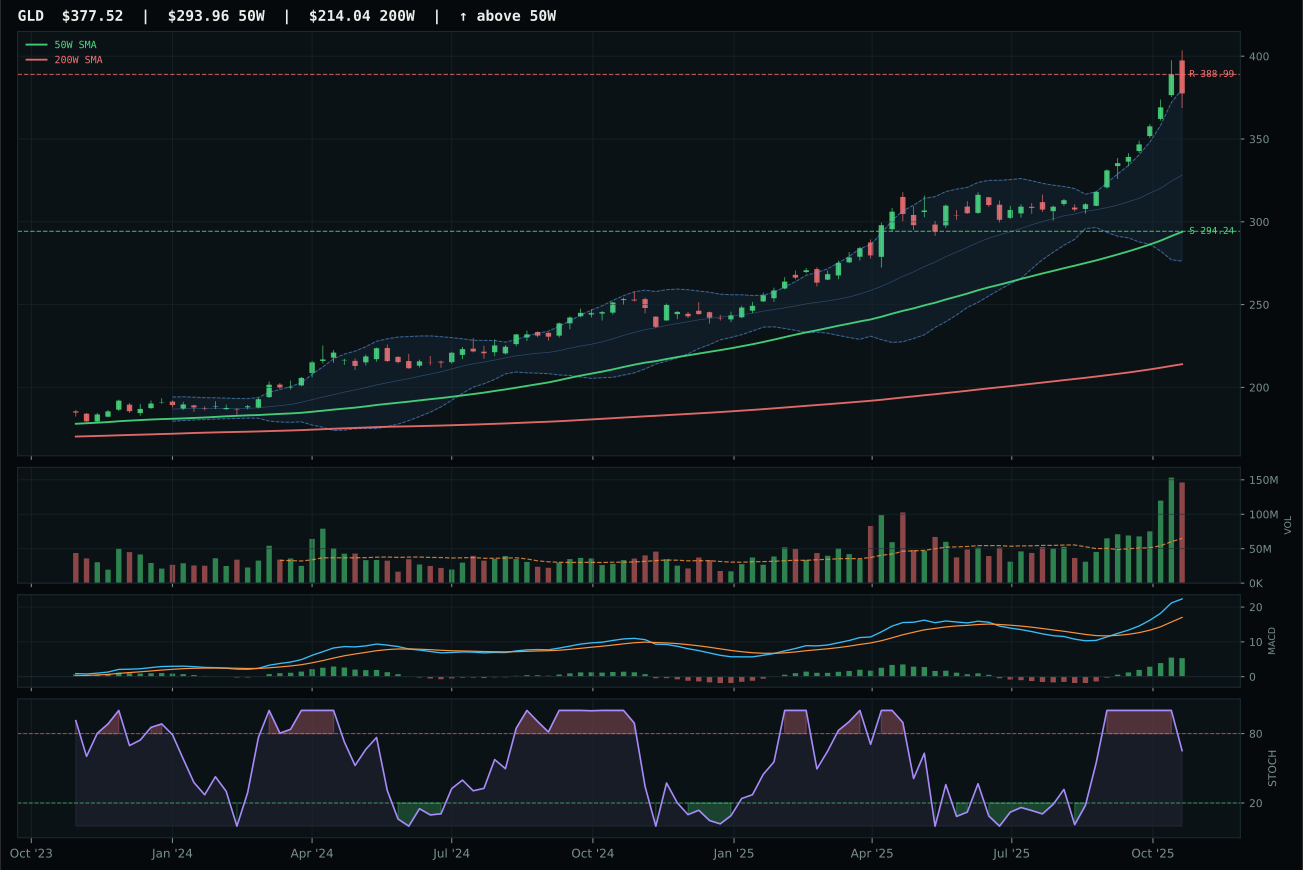
GLD has a vertical extension profile with 16.5% 13-week relative strength versus SPY.
A failed hold above support would weaken the setup.
Actionable but governed by invalidation levels.
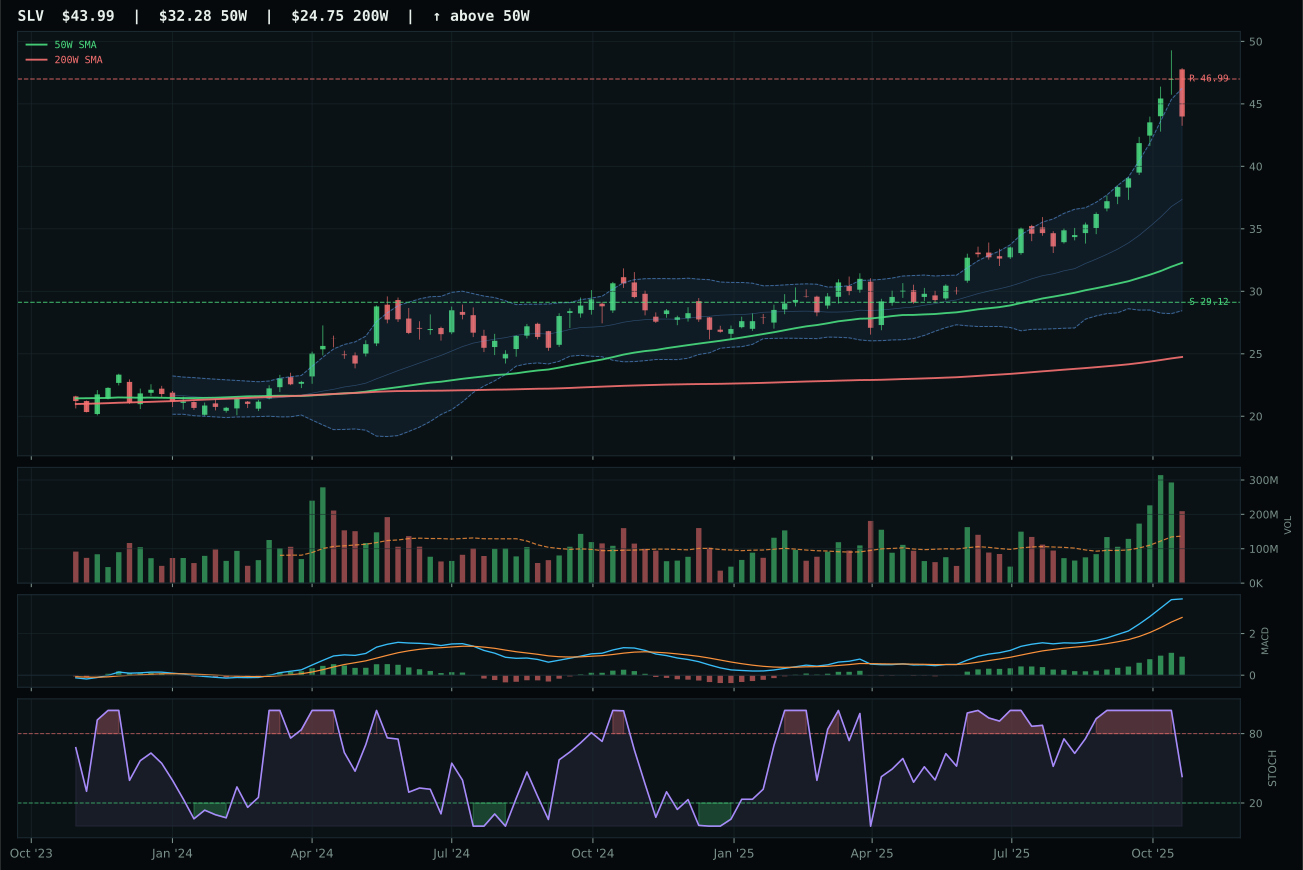
SLV has a vertical extension profile with 20.6% 13-week relative strength versus SPY.
A failed hold above support would weaken the setup.
Actionable but governed by invalidation levels.
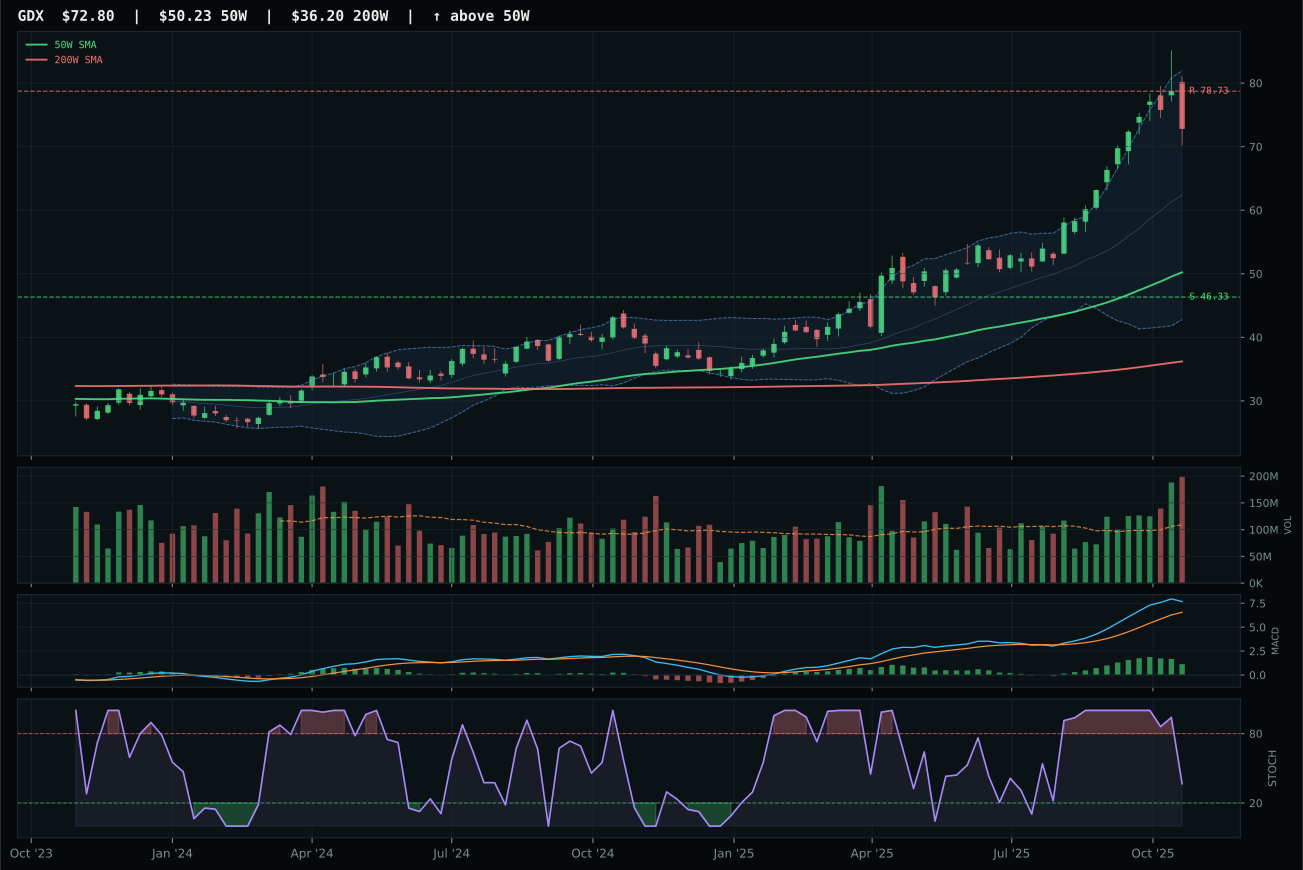
GDX has a vertical extension profile with 28.6% 13-week relative strength versus SPY.
A failed hold above support would weaken the setup.
Actionable but governed by invalidation levels.
GLD edged SLV by the slimmest of margins—0.3 points—in a category where both names share nearly identical setups and both are being bought for the same reason: monetary hedge sponsorship in a disinflation regime. GLD's 79.6 structure score narrowly beat SLV's 77.8, and at 28.4% above the 50W it was less stretched than SLV's 36.3%, giving XLK modestly better risk/reward (38.9 vs 39.0 on paper, though SLV's greater extension creates asymmetric downside to support). Both carry distribution pressure volume (2.25x and similar for SLV) and both posted strong thirteen-week returns (GLD 22.8%, SLV 26.9%), confirming that the move is institutional and persistent. The split favors GLD's broader liquidity and cleaner historical structure, but this is a category where the runner-up is equally valid; the score gap exists only to force a category representative, not to reflect fundamental technical divergence.
Precious Metals holds 5% as tier-2, allocated on the strength of category-level macro fit (81.0), the highest among all non-top-2 categories. Monetary hedge bid (+14), disinflation pressure (+8), and defensive rotation (+7) actively drive gold and silver into the portfolio despite technical evidence of only 40.0 in GLD. The regime tailwind is so strong that 5% represents restrained conviction; if liquidity stress were to intensify or if central bank buying slowed, this allocation would quickly jump to 10%. GLD trails Industrial Metals and Utilities strictly because their technical evidence (82.4 and 68.2 respectively) combines more cleanly with their own favorable macro fits. Precious metals will return to top-2 only if the disinflation regime deepens and equity technicals deteriorate enough to trigger flight-to-safety, or if credit stress widens spreads and forces institutions back into duration and gold simultaneously.
Technology — XLK
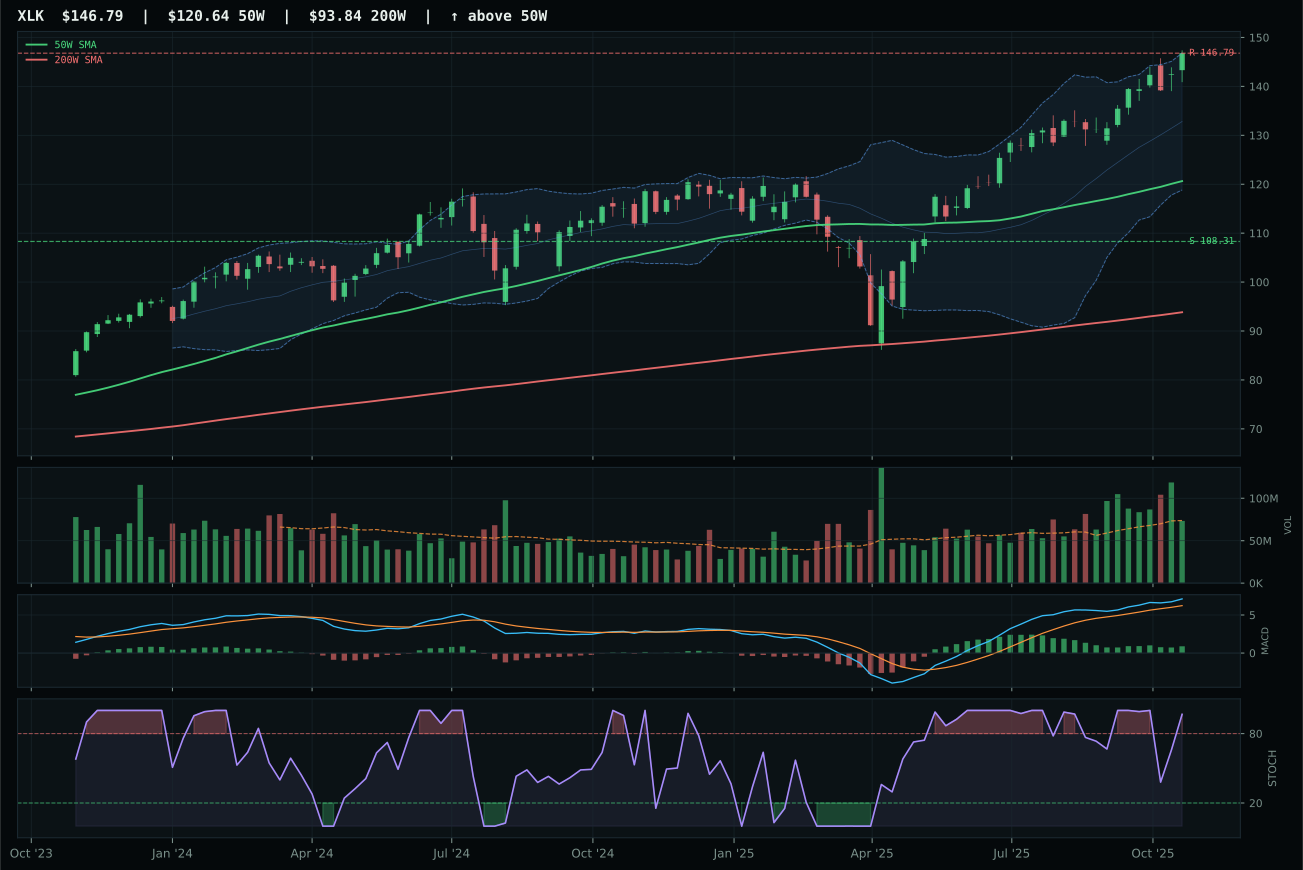
XLK has a vertical extension profile with 5.8% 13-week relative strength versus SPY.
A failed hold above support would weaken the setup.
Actionable but governed by invalidation levels.
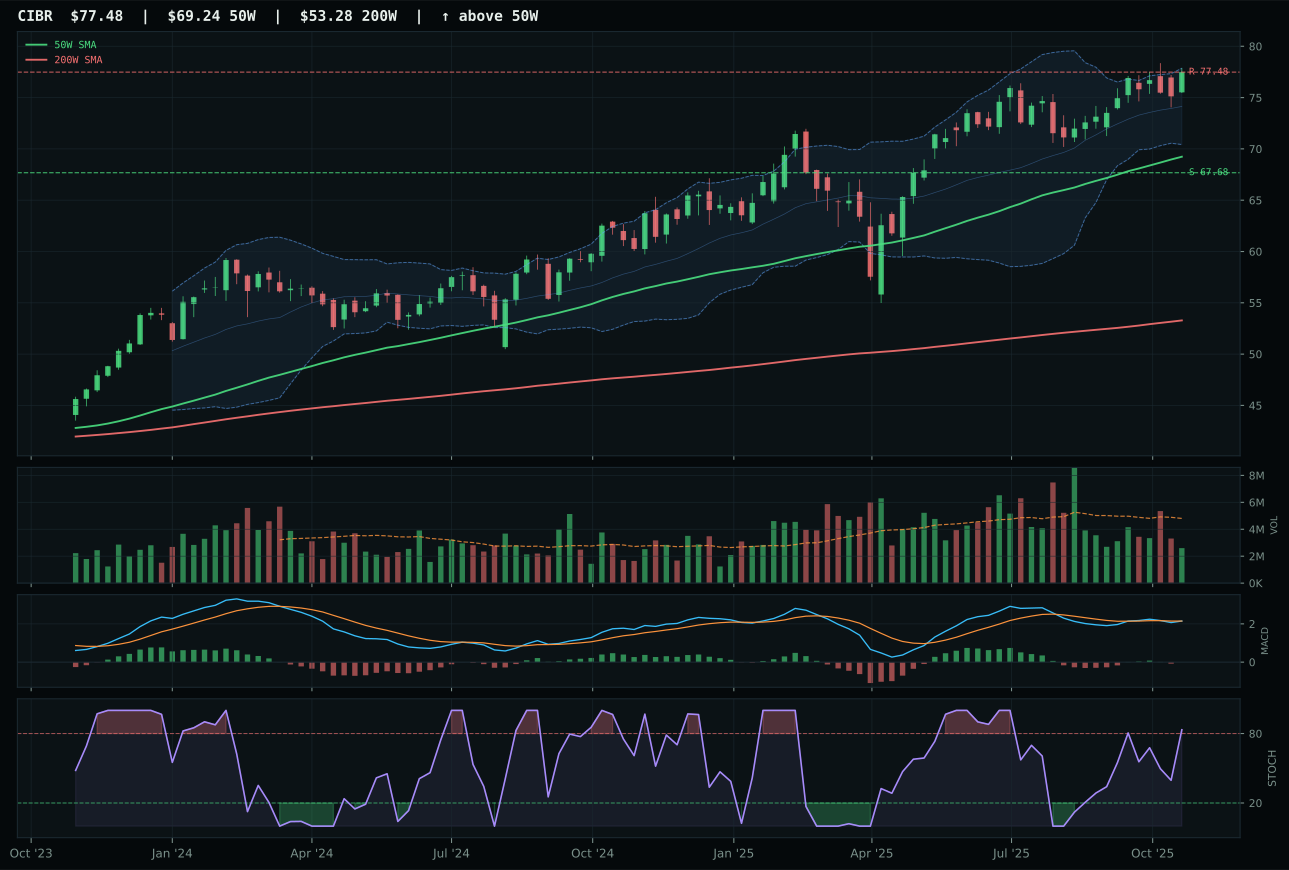
CIBR has a neutral structure profile with -2.5% 13-week relative strength versus SPY.
A failed hold above support would weaken the setup.
Actionable but governed by invalidation levels.
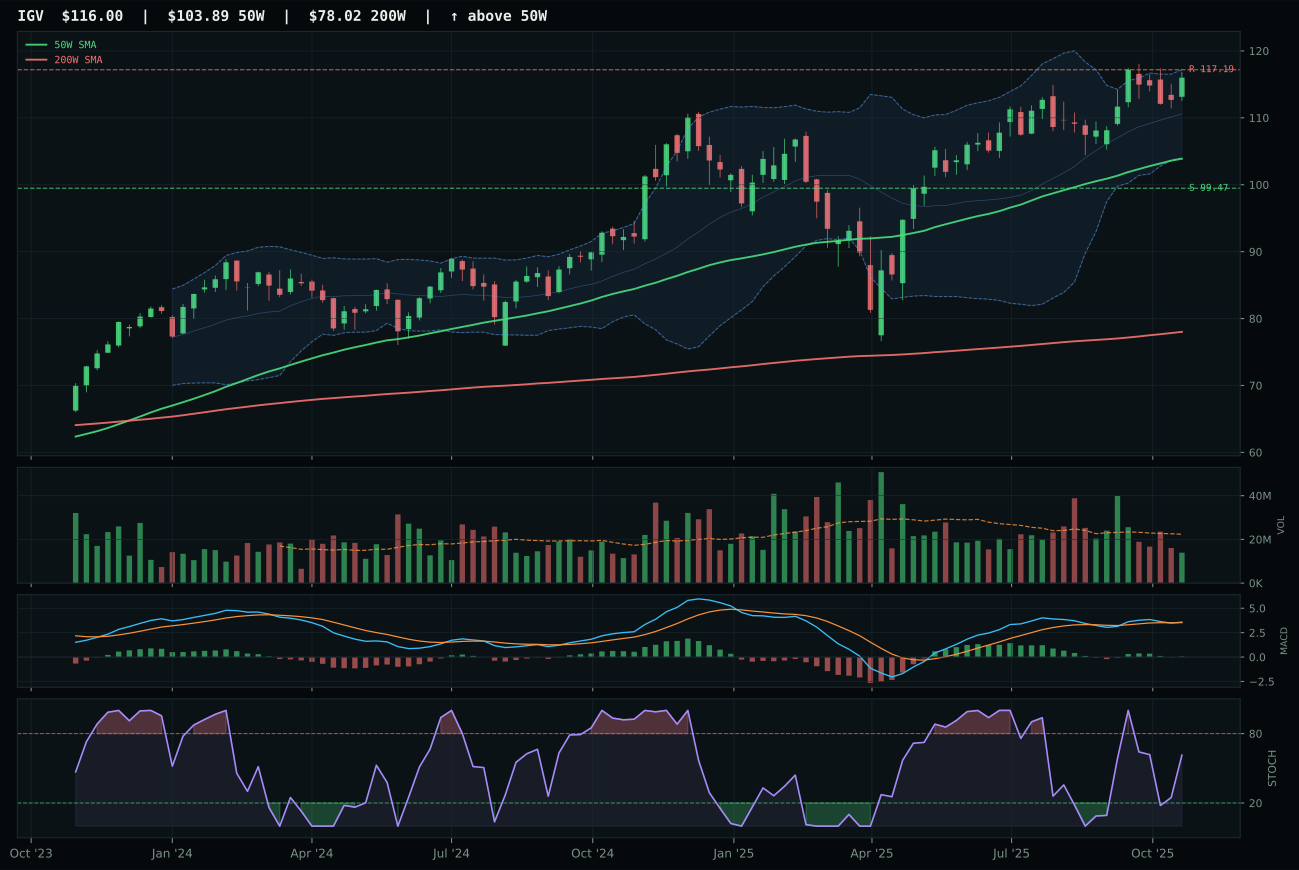
IGV has a neutral structure profile with -3.4% 13-week relative strength versus SPY.
A failed hold above support would weaken the setup.
Actionable but governed by invalidation levels.
XLK won the category with a clean trend setup that outpaced CIBR's defensive tilt. Price sits above both the 50W and 200W with a 0.5% slope and a 5.8% relative strength advantage versus SPY, translating to real institutional accumulation in broad profitable tech names rather than narrow cybersecurity rotation. The 12.1% thirteen-week return and 8.3% category-relative strength confirm that XLK is being bought into strength; CIBR's -2.5% SPY-relative performance and thin volume participation signal a setup that may benefit from mean reversion but is not attracting current capital. XLK's 21.7% extension above the 50W and stochastic RSI rolling over at 0.97 create timing risk, yet the MACD remains bullish with flattening confirmation and structure remains clean at 77.5, suggesting the move is not yet exhausted despite the vertical extension.
Technology earned 5% allocation as a tier-2 category in the disinflation regime. The 59.1 category score reflects a portfolio of strong technical trends offset by poor macro fit; defensive rotation and liquidity stress actively weigh on the opportunity despite XLK's 15.8% outperformance over three months. Risk appetite remains positive and AI sponsorship is live, but both of those tailwinds are being distributed to higher-ranked categories like Industrial Metals and Utilities, which combine equally strong technicals with better macro alignment. For Technology to reclaim a top-2 slot, either disinflation pressure would need to reverse or liquidity stress would need to fully clear; until then, the category remains a holding position rather than a conviction overweight.
Nuclear Energy — NLR
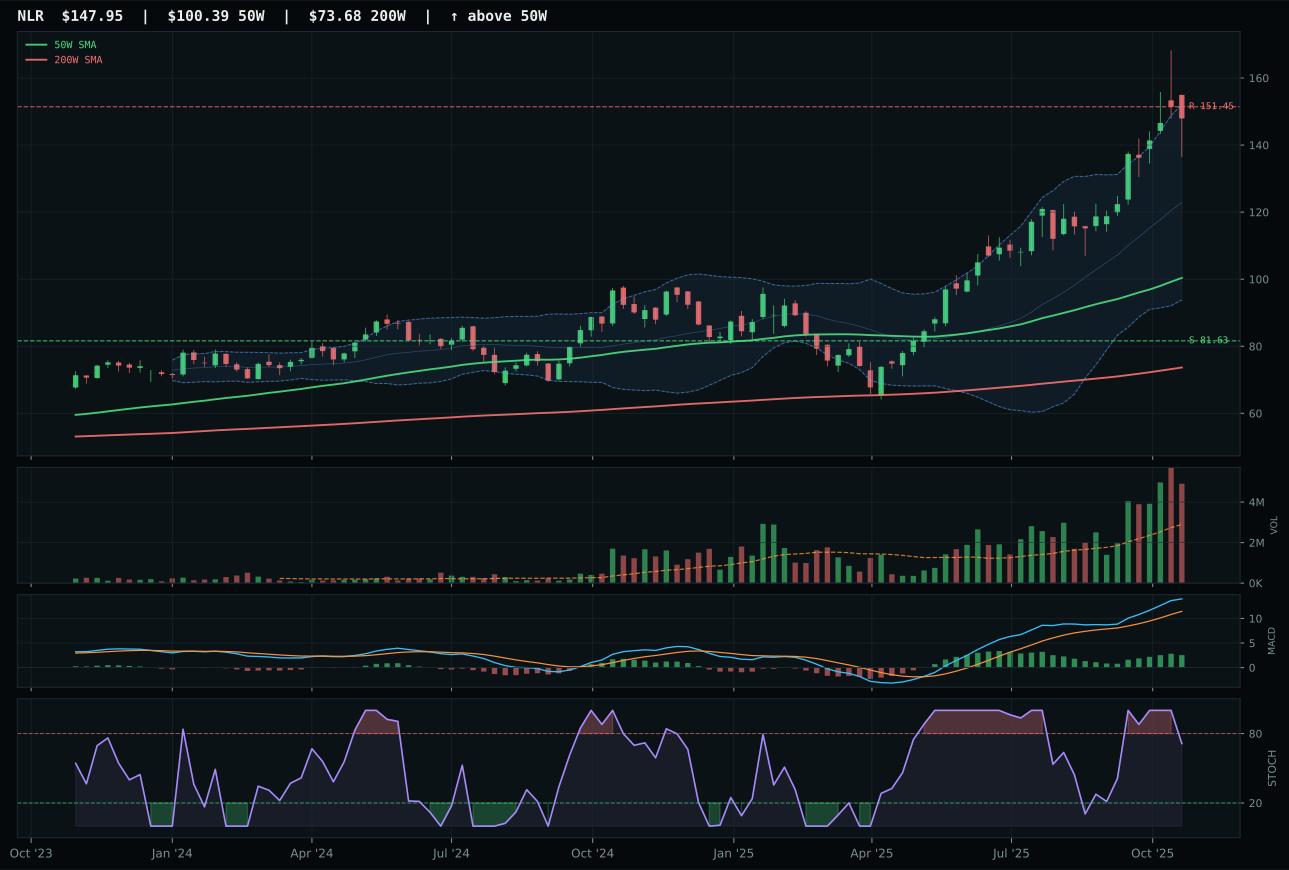
NLR has a vertical extension profile with 16.0% 13-week relative strength versus SPY.
A failed hold above support would weaken the setup.
Actionable but governed by invalidation levels.
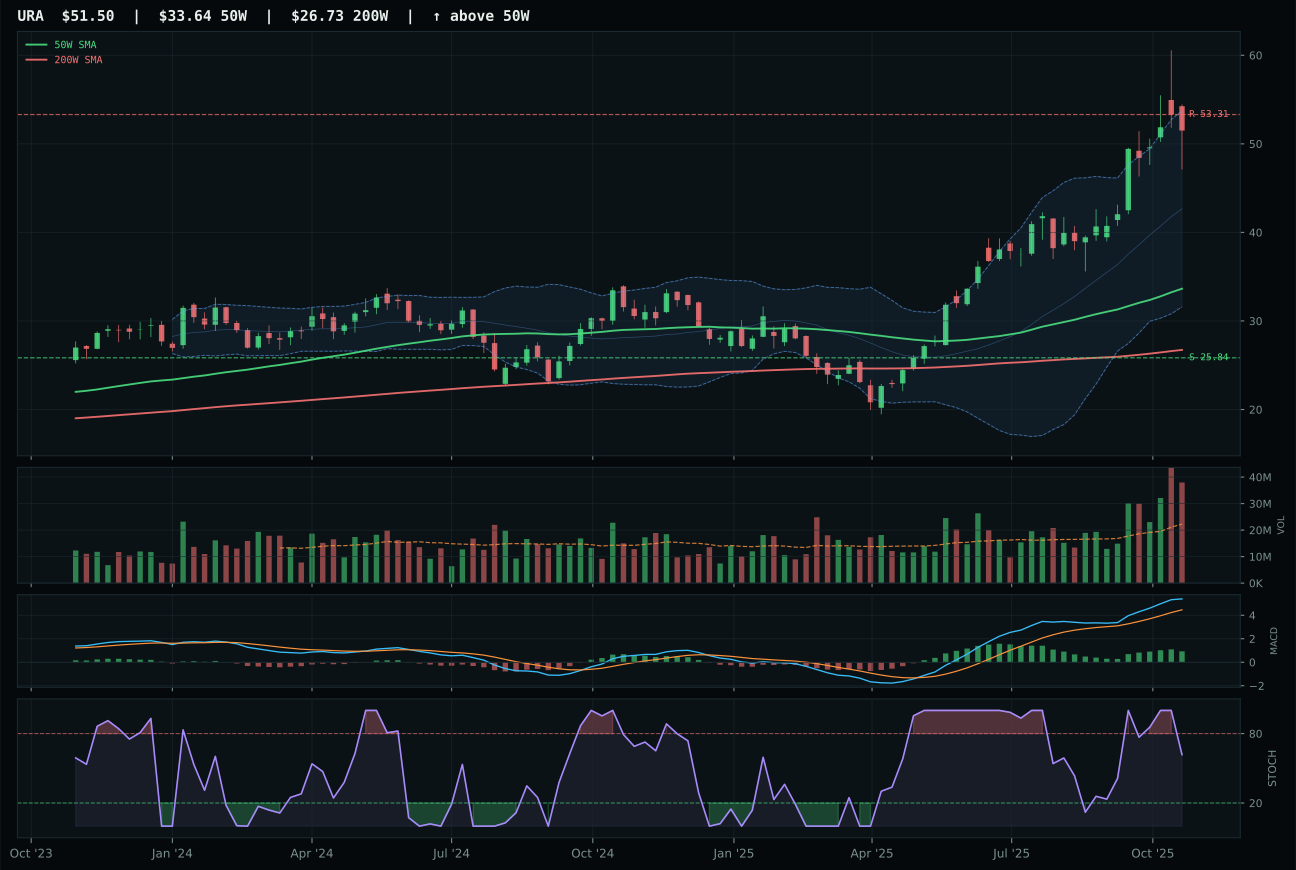
URA has a vertical extension profile with 16.8% 13-week relative strength versus SPY.
A failed hold above support would weaken the setup.
Actionable but governed by invalidation levels.
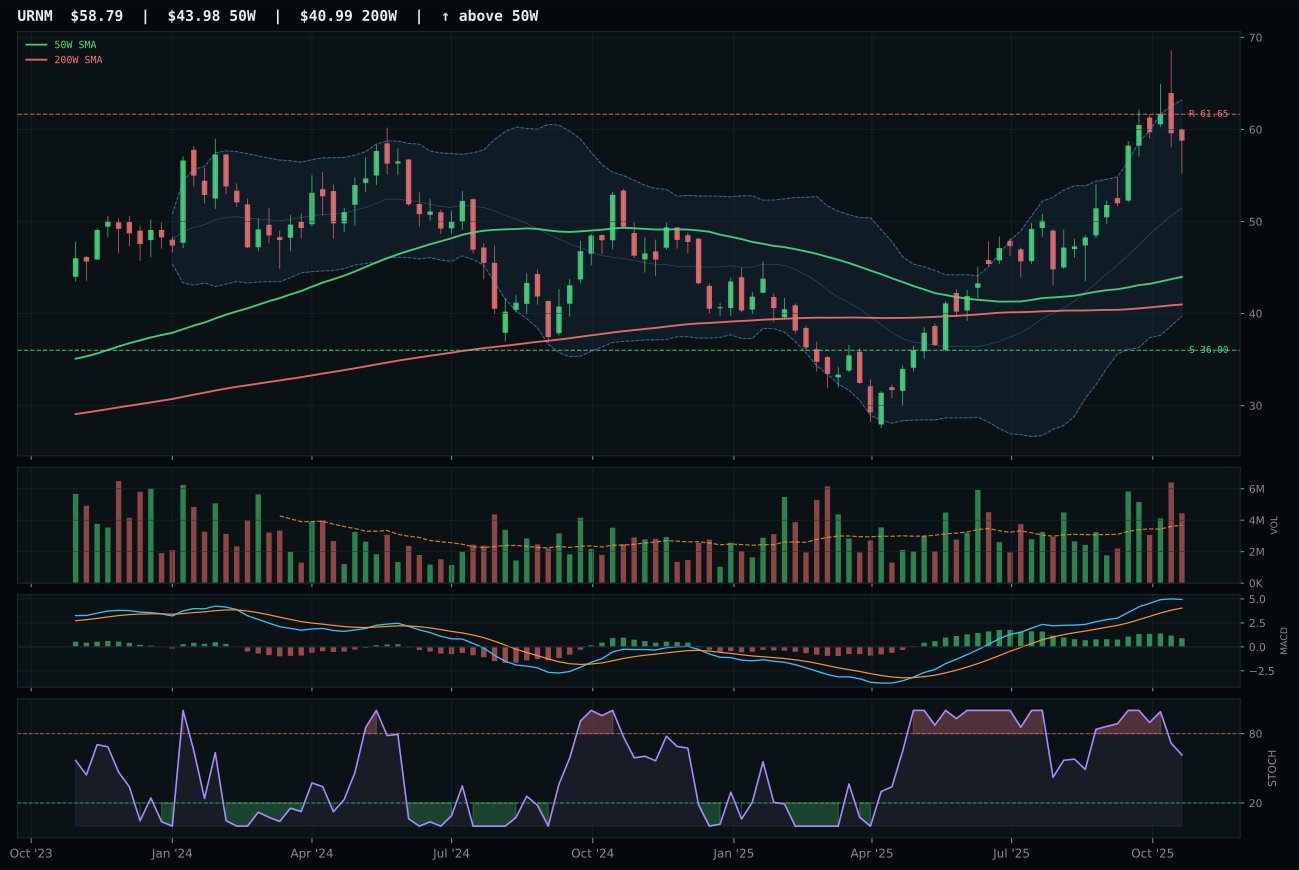
URNM has a vertical extension profile with 11.1% 13-week relative strength versus SPY.
A failed hold above support would weaken the setup.
Actionable but governed by invalidation levels.
NLR won Nuclear Energy on trend and momentum purity, delivering a 100/100 trend score backed by 16.0% RS versus SPY and a 22.3% thirteen-week return. The setup is a clean vertical extension at 47.4% above the 50W with MACD bullish and improving, the exact profile of a confirmed leader that has not yet collapsed momentum. Stochastic RSI falling/neutral at 0.71 and distribution pressure volume (1.70x average) are the only cautions; they prevent NLR from scoring higher on timing and risk/reward, but they do not negate the core uptrend. URA matched NLR on trend and momentum but lagged on risk/reward (22.6 vs 37.5) and was more extended at 53.1% above the 50W, making it a riskier entry at worse asymmetry. URNM's 56.1 reasoned score was theoretical; it ranks first in the three-ETF proof order but failed persistence and volume confirmation tests. NLR is the only representative that passes both momentum and risk/reward filters simultaneously.
Nuclear Energy holds 5% as tier-2, allocated on the strength of technical evidence (42.9) and neutral macro fit (50.0) that neither helps nor hurts. Real asset sponsorship (+7) and AI growth sponsorship (+5) are active, but liquidity stress (-7) and credit stress (-5) offset most of the benefit, leaving category-level macro at breakeven. NLR's technical setup is cleanest in the basket and merits inclusion, but the 53.5 category score trails both Industrial Metals (70.4) and Utilities (71.6) by double-digit margins because the macro narrative does not compel conviction. Nuclear would reclaim top-2 status if either AI sponsorship accelerated (powering new data centers) or if defensive rotation broadened to include longer-duration utility optionality; until then, it is a valid holding that will trade positions with lower-ranked categories (Agriculture, Emerging Markets) as technicals confirm or break down.
Defense & Aerospace — XAR
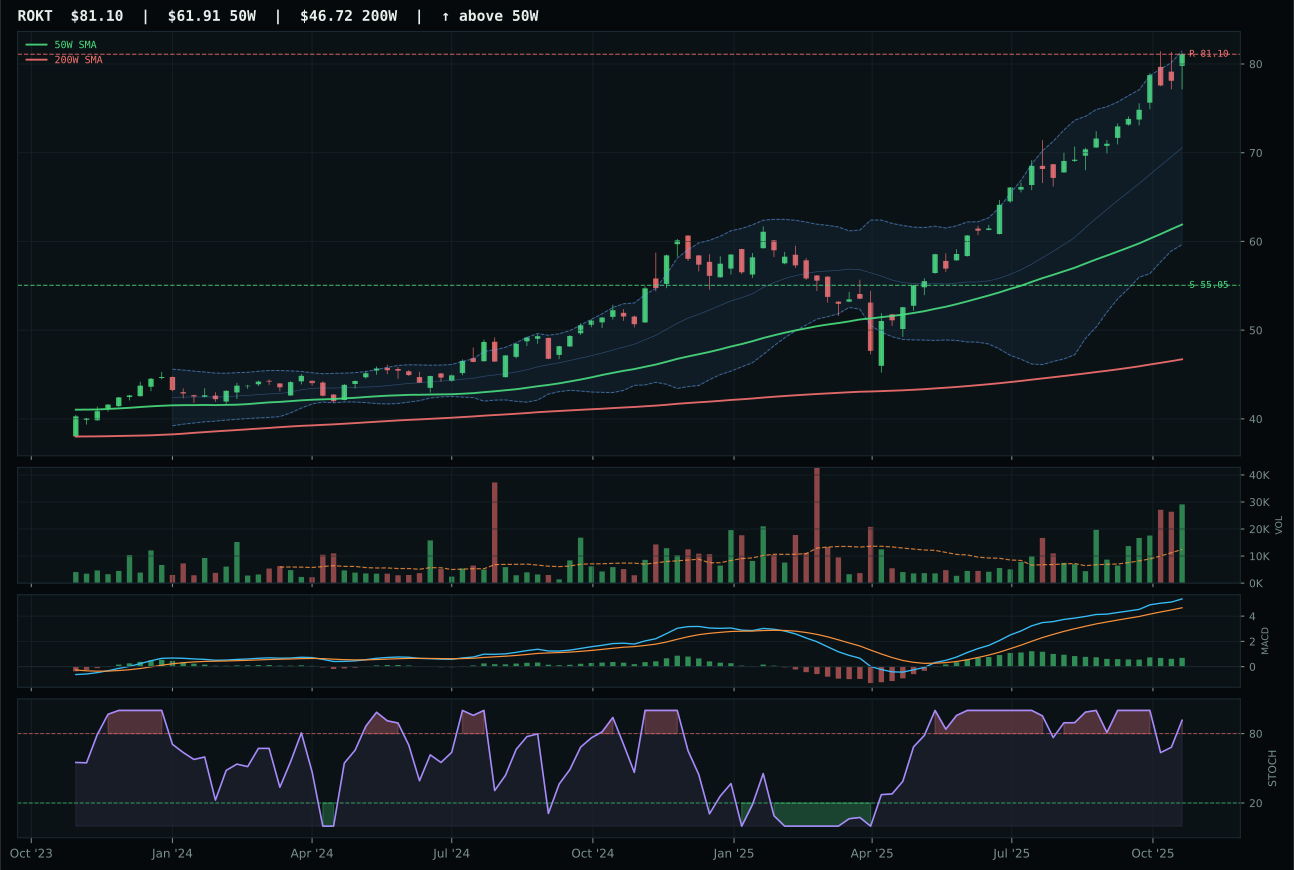
ROKT has a vertical extension profile with 12.7% 13-week relative strength versus SPY.
A failed hold above support would weaken the setup.
Tracked, but not top-2 eligible because: .
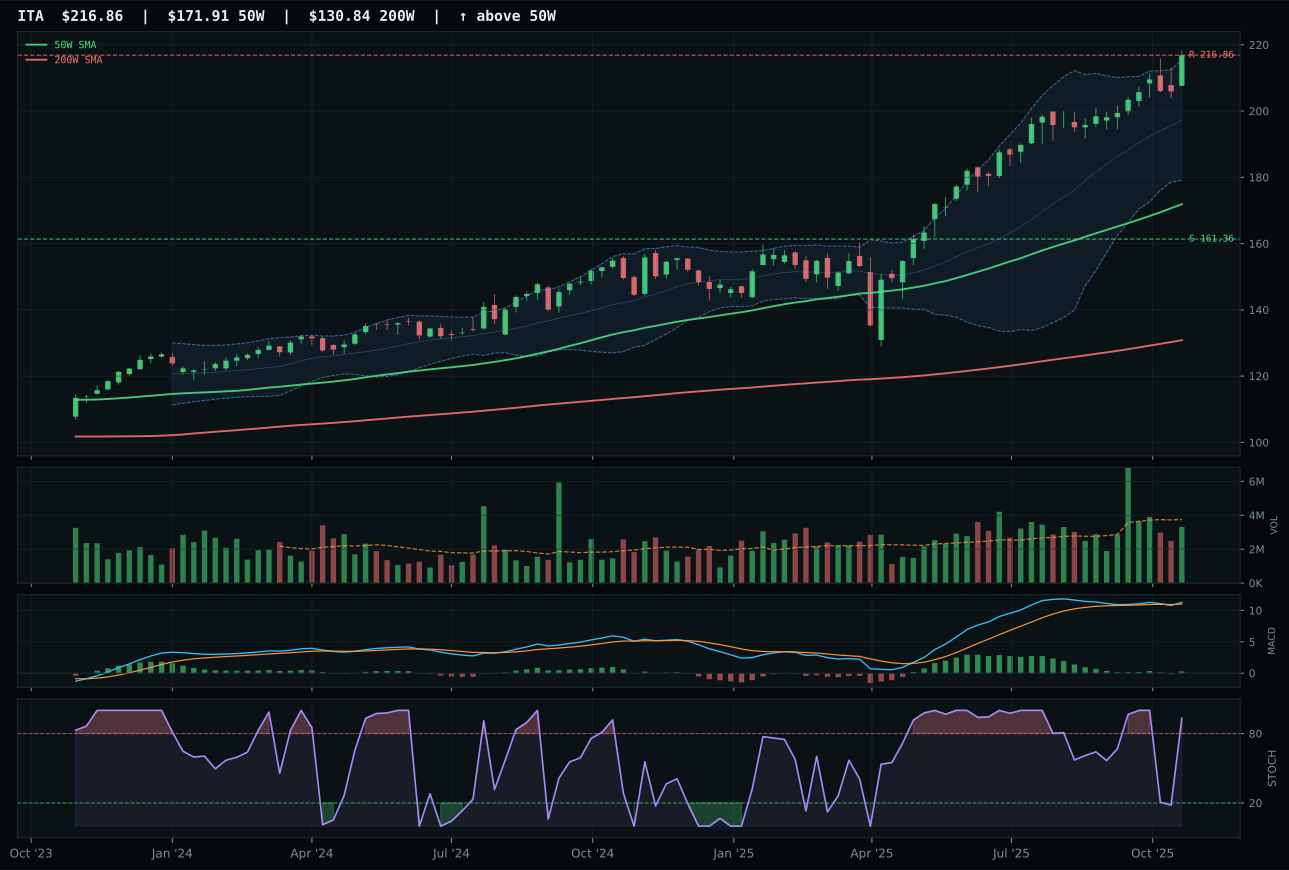
ITA has a vertical extension profile with 3.1% 13-week relative strength versus SPY.
A failed hold above support would weaken the setup.
Actionable but governed by invalidation levels.
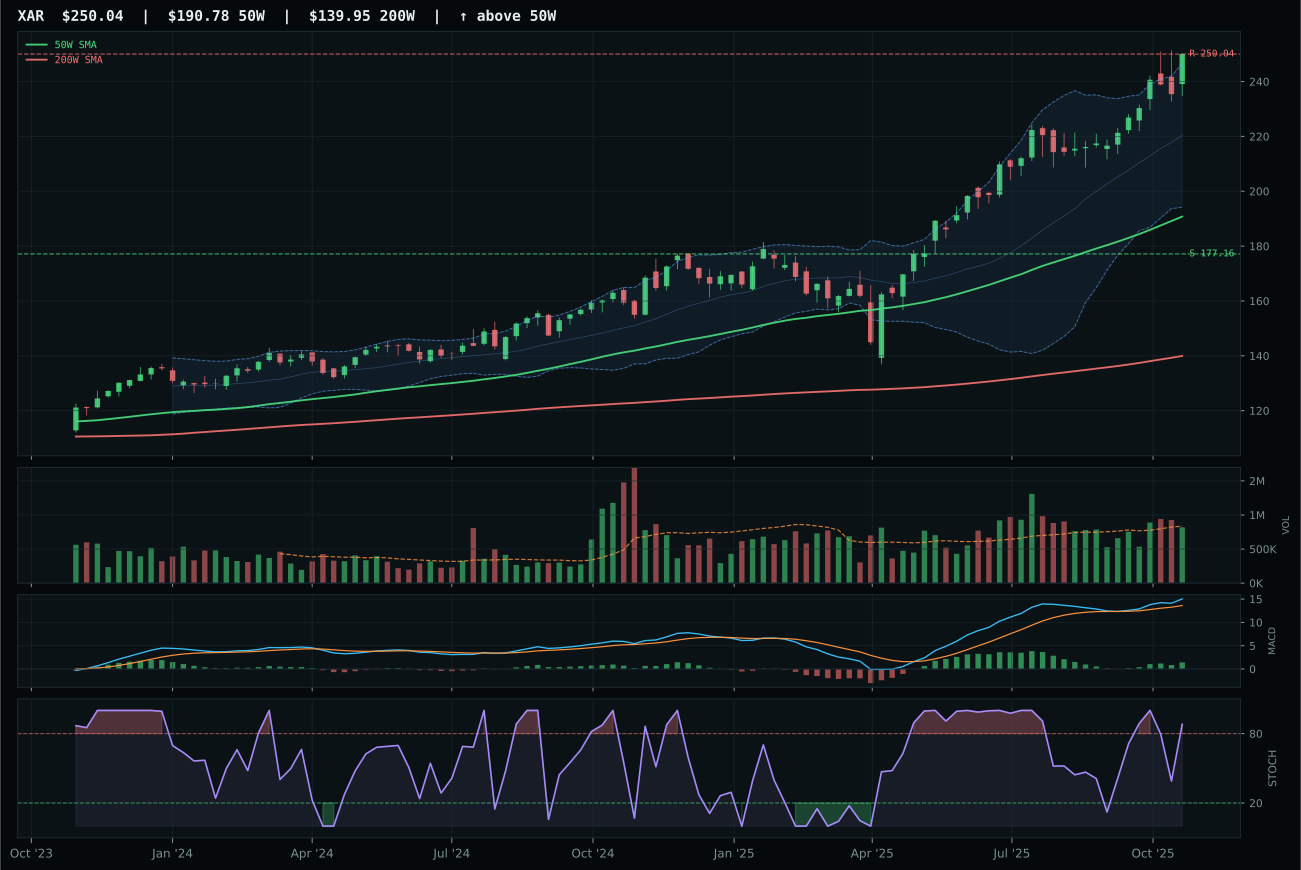
XAR has a vertical extension profile with 7.1% 13-week relative strength versus SPY.
A failed hold above support would weaken the setup.
Actionable but governed by invalidation levels.
XAR cleared the Defense & Aerospace category decisively, winning on balanced trend and structure despite facing a more aggressive relative-strength competitor in ROKT. XAR delivered 100/100 trend (price above 50W and 200W, 0.9% slope, 7.1% RS vs SPY) paired with a cleaner structure score of 78.9 versus ROKT's 45.0 technical evidence, a 7.6-point gap that reflects XAR's superior risk/reward (40.5 vs 45) and more reliable volume confirmation (61.5 vs 82, where ROKT's accumulation/confirmation felt like climactic buying). ROKT posted 12.7% RS versus SPY and 5.6% category-relative strength, impressive on paper, but at 19.0% thirteen-week return it lacked the smoothness that neutral category-relative strength provides; XAR's 0.0% category-relative strength indicates leadership without fighting internal competition. The 16.6-point score gap between winner and runner-up reflects that XAR is the category's only credible representative in the current macro state.
Defense & Aerospace earned 5% as tier-2, held despite a low 47.6 category score that reflects the macro environment more than technical weakness. The category-level macro fit of 59.0 masks deeper headwinds: credit stress and liquidity stress subtract 4 and 8 points respectively, while only defensive rotation (+8) and transition / mixed regime (+3) provide support. XAR's neutral macro narrative (no category-specific descriptor profile) combined with its technical evidence of 52.6 yields a blended score that simply does not compete with Industrial Metals' 82.4 technical evidence or Utilities' 68.2. The tier-2 slot exists because the portfolio cannot ignore a category with confirmed uptrend and positive relative strength; however, if disinflation accelerates or if liquidity stress intensifies further, this allocation should be reallocated to Risk Assets (Crypto) or shifted entirely to the top-2 categories.
Traditional Energy — XLE
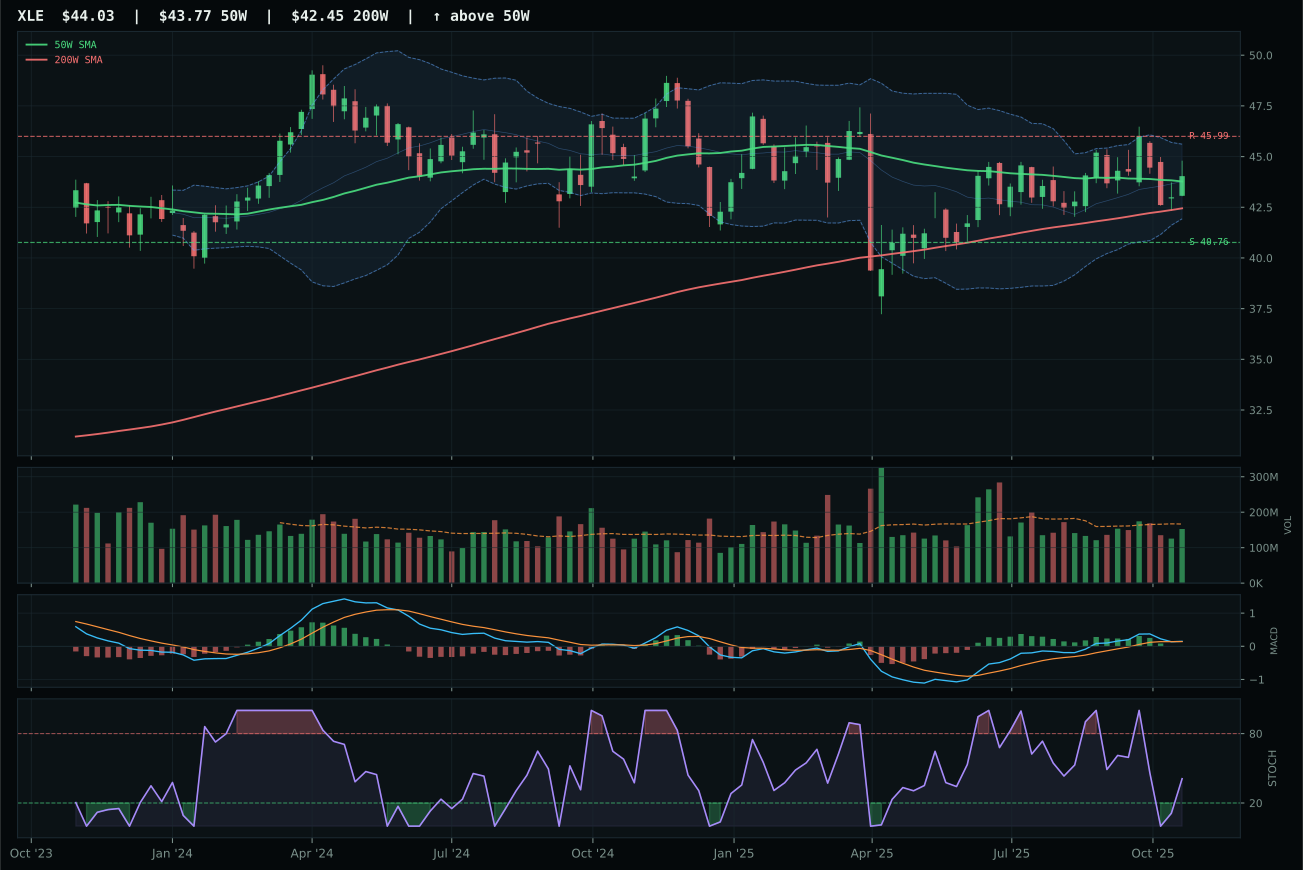
XLE has a compression near 50W profile with -5.2% 13-week relative strength versus SPY.
A failed hold above support would weaken the setup.
Actionable but governed by invalidation levels.
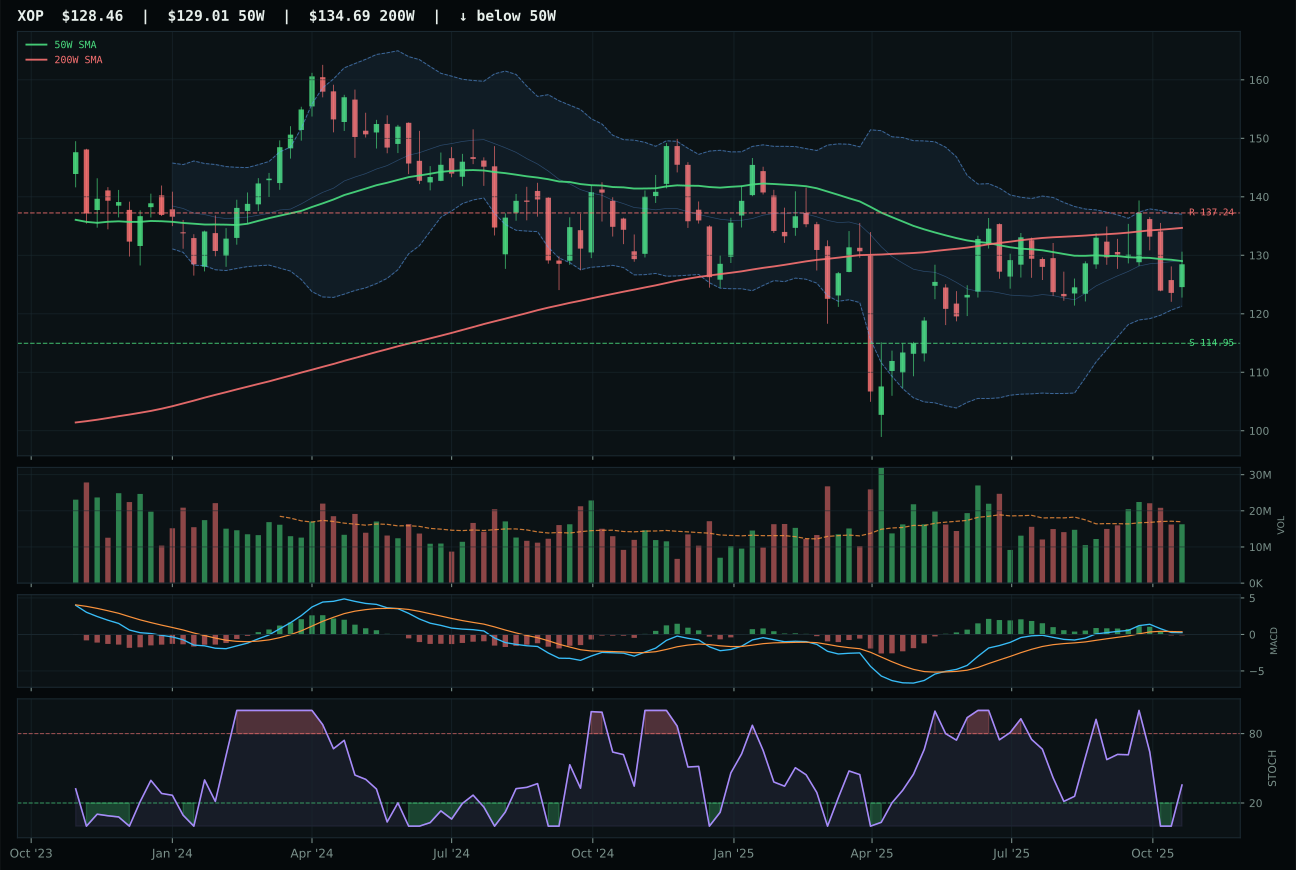
XOP has a compression near 50W profile with -6.0% 13-week relative strength versus SPY.
Extension and support failure are the main tactical risks.
Tracked, but not top-2 eligible because: structurally broken.
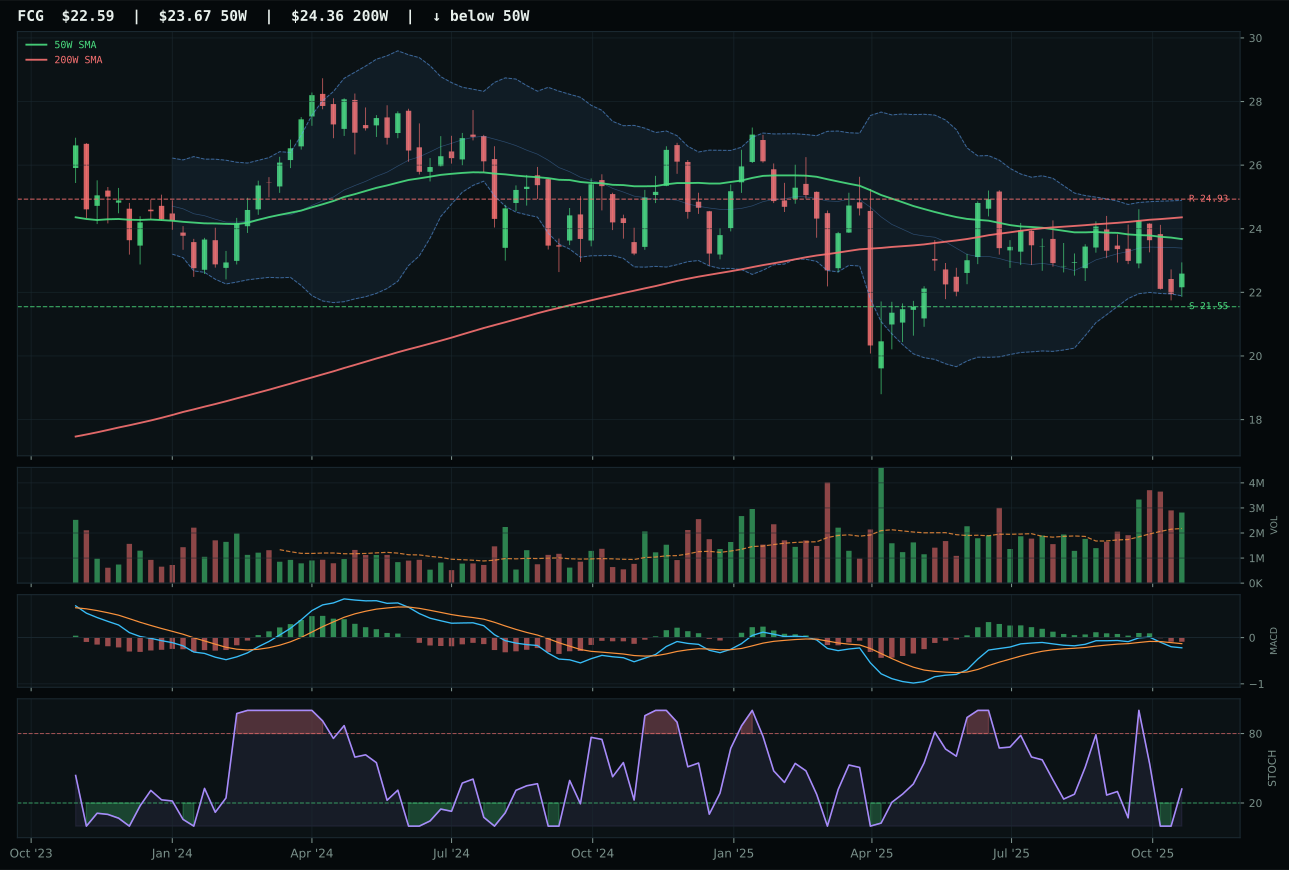
FCG has a pullback into support profile with -9.9% 13-week relative strength versus SPY.
Extension and support failure are the main tactical risks.
Tracked, but not top-2 eligible because: structurally broken.
XLE won Traditional Energy with the lowest winning score of any category representative (0.0 final, 55.0 reasoned), a stark statement about how poorly this sector fits the current macro regime and technical setup. XLE trades at the 50W (0.6% distance) with price above the 200W but 50W slope flat at -0.1%, a neutered chart that offers timing precision but no directional conviction. The category-relative strength of 0.8% is barely above neutral, the 13W return is 1.1%, and MACD is bullish but flattening—all signs of a market pausing before deciding. XOP's 95.0 timing score matched XLE's 100.0, but XOP's breakage in structure (40.2 vs 74.2) and bearish MACD were disqualifying; XOP is not a valid representative when it fails hard filters. XLE's only virtue is that it is the least bad option, offering compression near the 50W that could expand if buyers defend the level, but this is a setup to hold, not to add to.
Traditional Energy received 5% allocation despite a 0.0 final category score, a mathematical artifact that reflects hard filter penalties rather than true conviction loss. The category-level macro fit of 23.0 is damning: disinflation pressure subtracts 10 points, credit stress and liquidity stress subtract 7 points each, and only real asset sponsorship (+7) attempts to offset the regime headwind. XLE's technical evidence of 64.1 is respectable in isolation, but it cannot overcome a 23-point macro deficit and still earn top-tier weighting. The 5% allocation is a hedge position: if energy rallies from the compression setup or if macro suddenly pivots toward inflation, the portfolio has participates modestly; if disinflation deepens and energy rolls over, the 5% is contained downside. For XLE to reclaim higher conviction, either liquidity stress would need to clear, or an energy-specific catalyst (geopolitical, demand shock) would need to create a fresh technical setup with momentum confirmation instead of stagnation.
Emerging Markets — IEMG
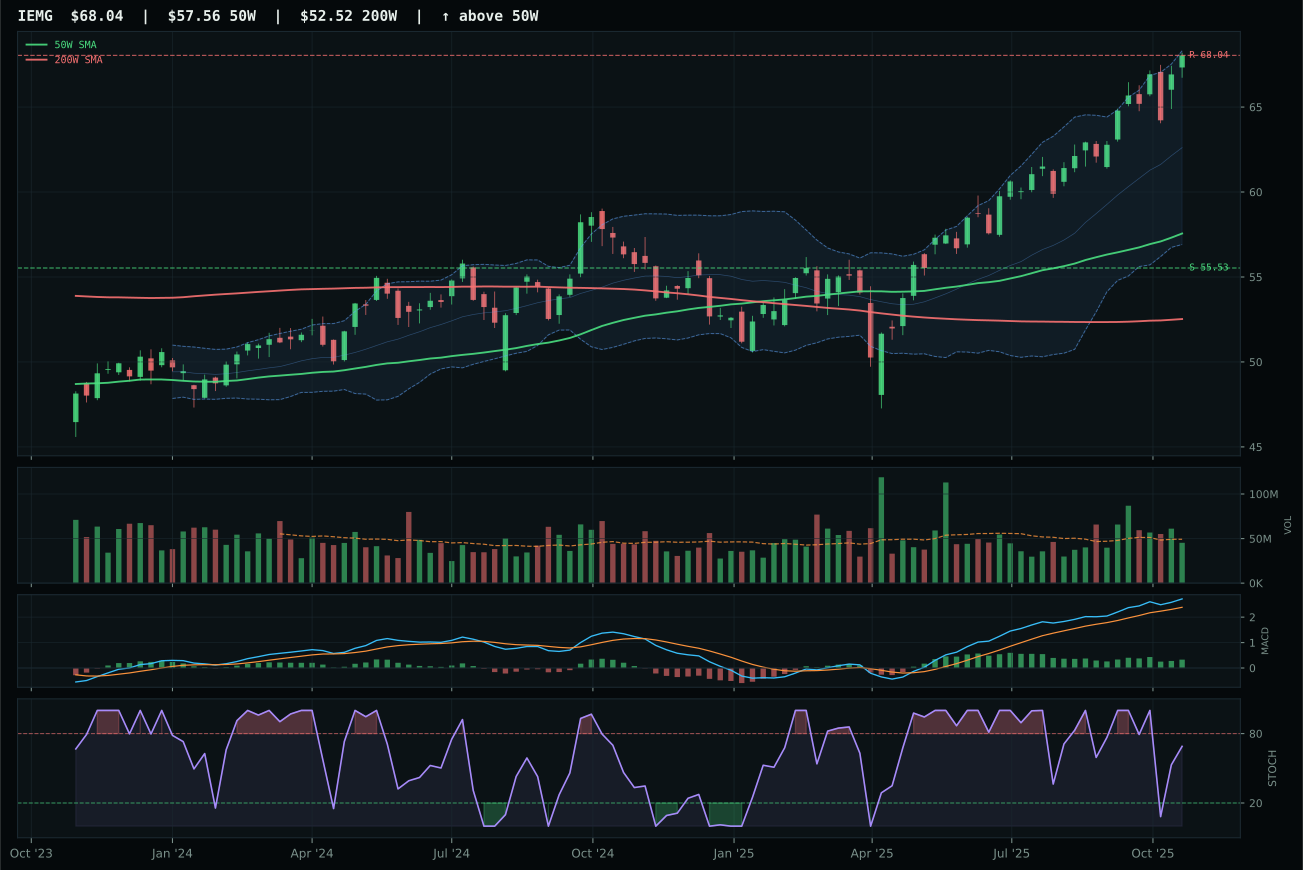
IEMG has a vertical extension profile with 4.3% 13-week relative strength versus SPY.
A failed hold above support would weaken the setup.
Actionable but governed by invalidation levels.
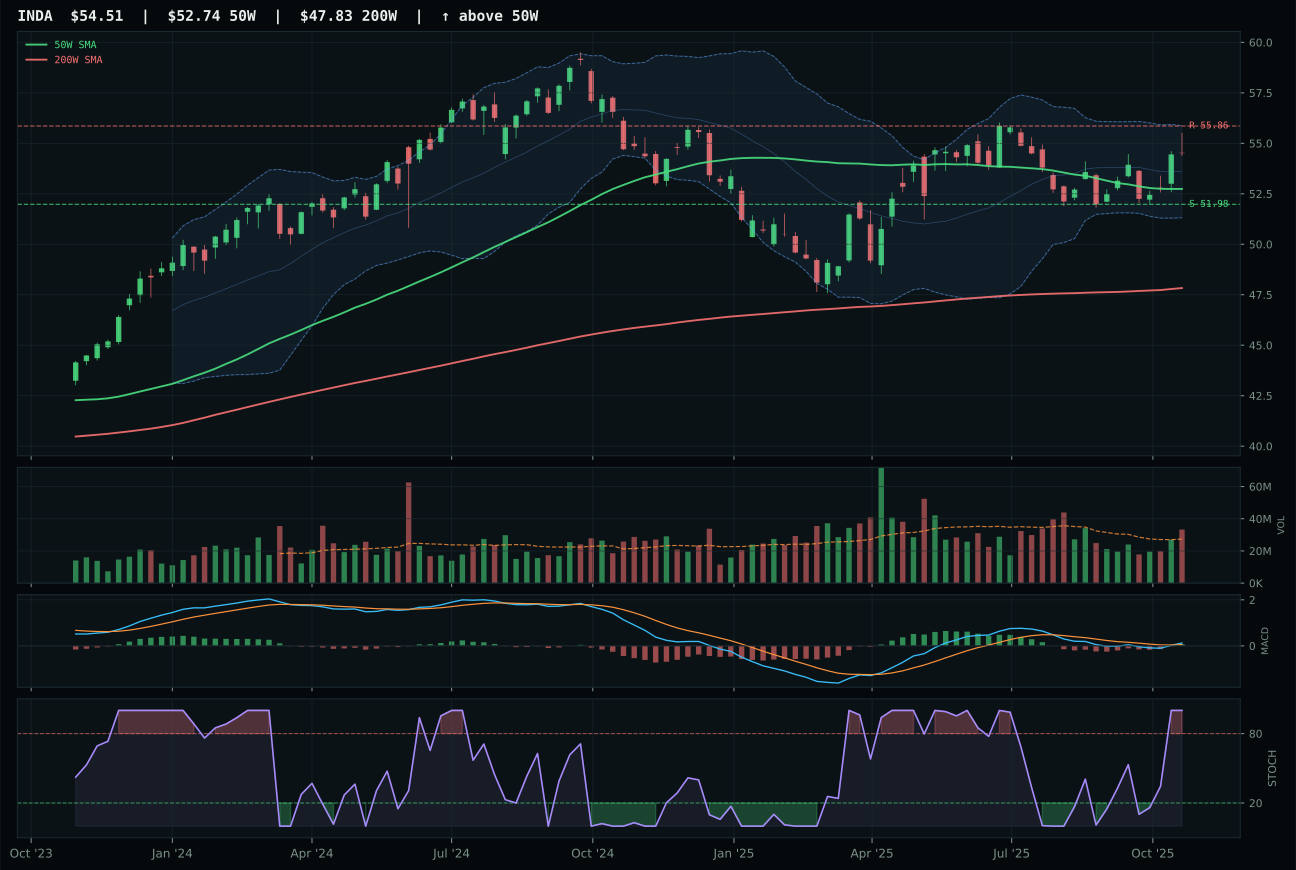
INDA has a pullback into support profile with -5.0% 13-week relative strength versus SPY.
A failed hold above support would weaken the setup.
Actionable but governed by invalidation levels.
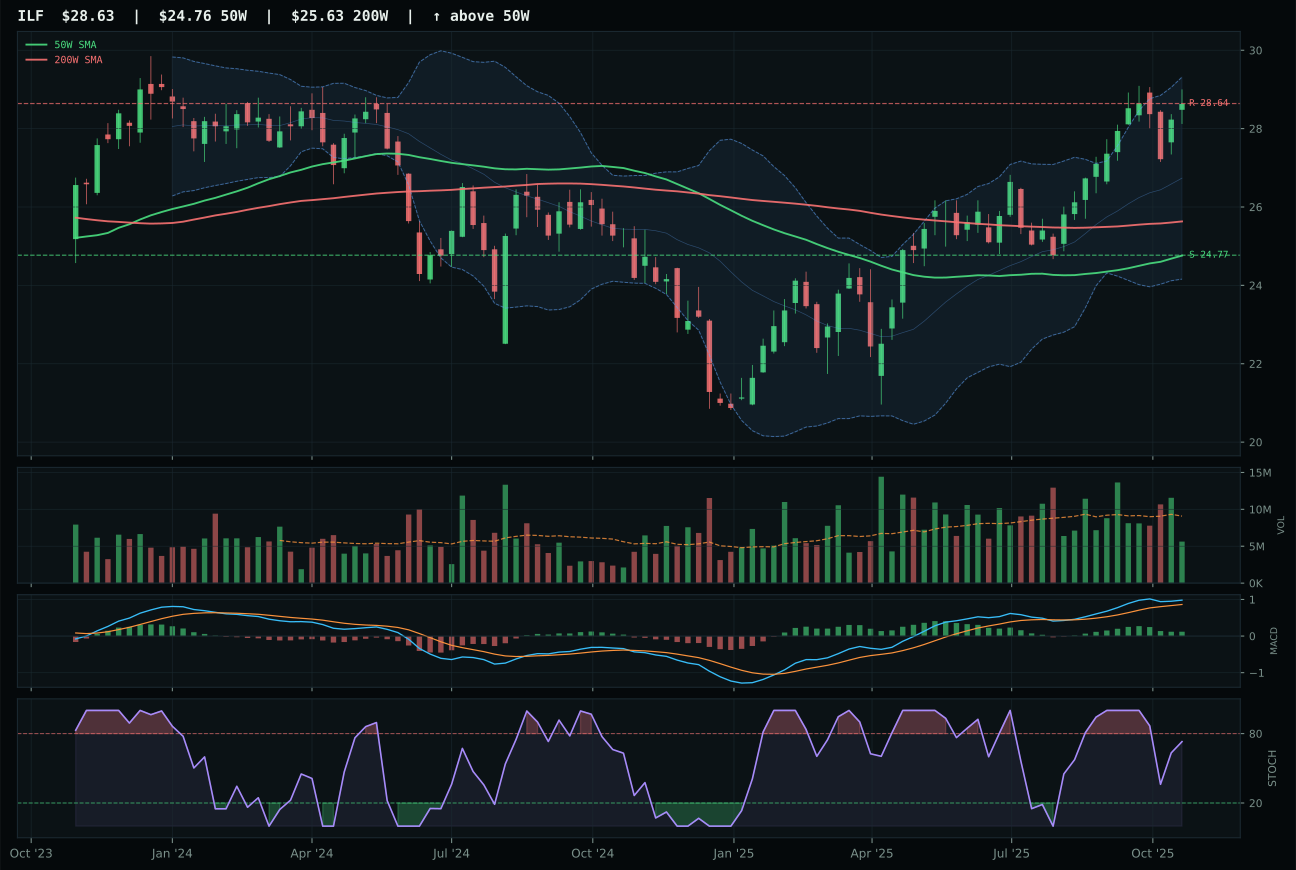
ILF has a vertical extension profile with 6.4% 13-week relative strength versus SPY.
A failed hold above support would weaken the setup.
Actionable but governed by invalidation levels.
IEMG won Emerging Markets as the cleanest available option in a category where no name truly deserved allocation. The technical evidence of 61.7 is respectable—price above both 50W and 200W, 4.3% RS versus SPY, neutral volume—but it masks a fundamental problem: IEMG's 10.6% thirteen-week return and -0.0% category-relative strength show no leadership within the basket. INDA posted stronger technical evidence (80.2) and better timing (100 vs 40), but MACD is bullish and improving while IEMG's MACD is bullish but flattening, a subtle persistence indicator that matters when the category is this weak. Most importantly, INDA's -5.0% RS versus SPY and -9.3% category-relative strength disqualified it despite cleaner structure; IEMG at least shows positive SPY-relative behavior, however modest. Neither is a leader; IEMG simply fails less dramatically than its peers, earning the representative slot by elimination rather than excellence.
Emerging Markets is excluded entirely at 0% allocation, ranked 9th or 10th depending on other category movements, with a 33.5 category score that reflects a hostile macro environment. Credit stress and liquidity stress each subtract 10 points from category-level macro fit, and the 38.0 total macro score cannot be overcome by IEMG's decent technical evidence. Risk appetite is positive (+8), but that single tailwind is insufficient in a regime where institutions are pulling capital from EM to fund rate-sensitive domestic trades (Utilities, defensives). IEMG's 40.0 timing score and neutral structure do not provide the 3-4 point macro lift needed to push this category into allocation. For Emerging Markets to return, either credit stress would need to clear or a EM-specific technical catalyst (breakout above Fib 0.382, acceleration in momentum) would need to coincide with defensive rotation slowing; until both occur, capital is better deployed to categories where macro and technicals align (Metals, Utilities, Nuclear).
Agriculture & Livestock — MOO
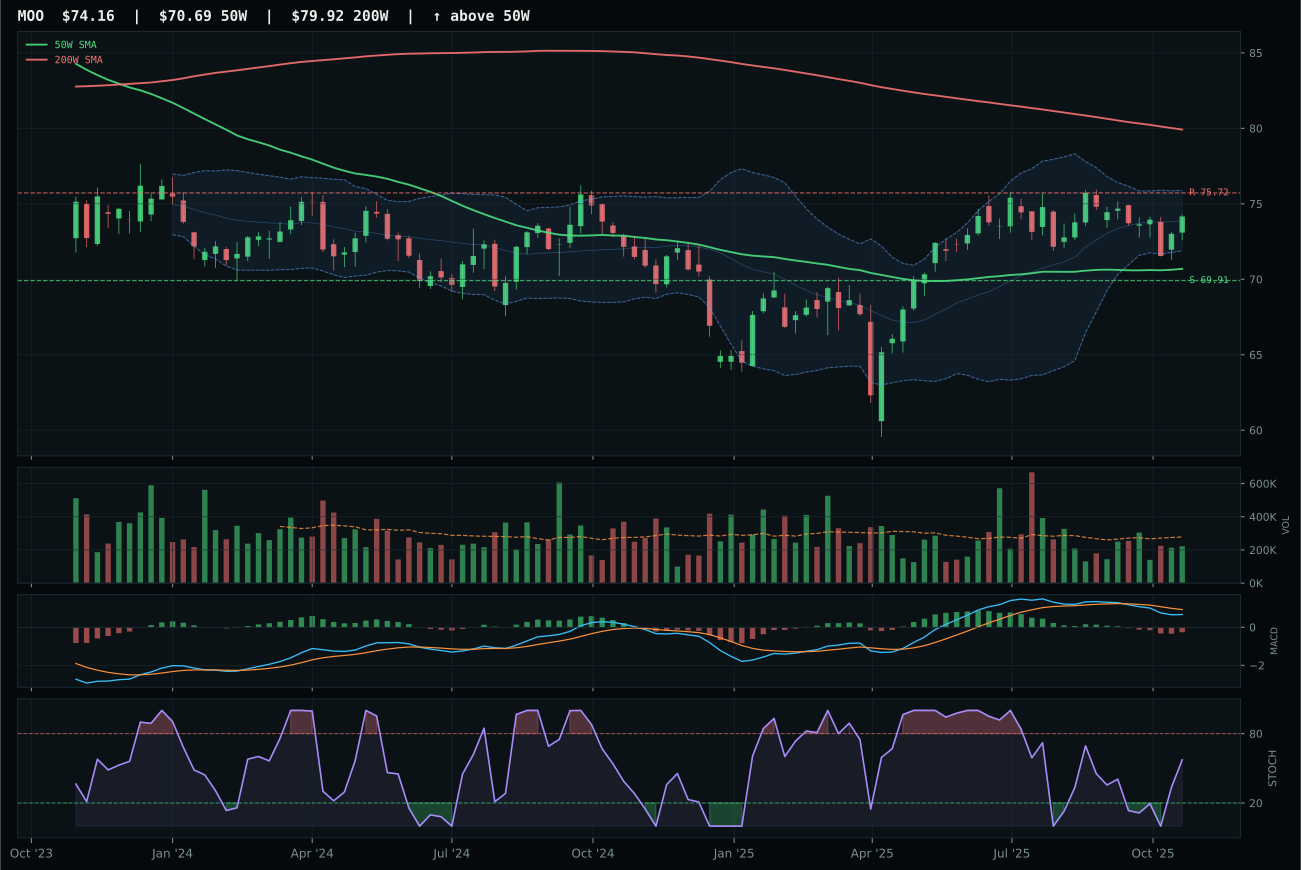
MOO has a neutral structure profile with -7.1% 13-week relative strength versus SPY.
A failed hold above support would weaken the setup.
Actionable but governed by invalidation levels.
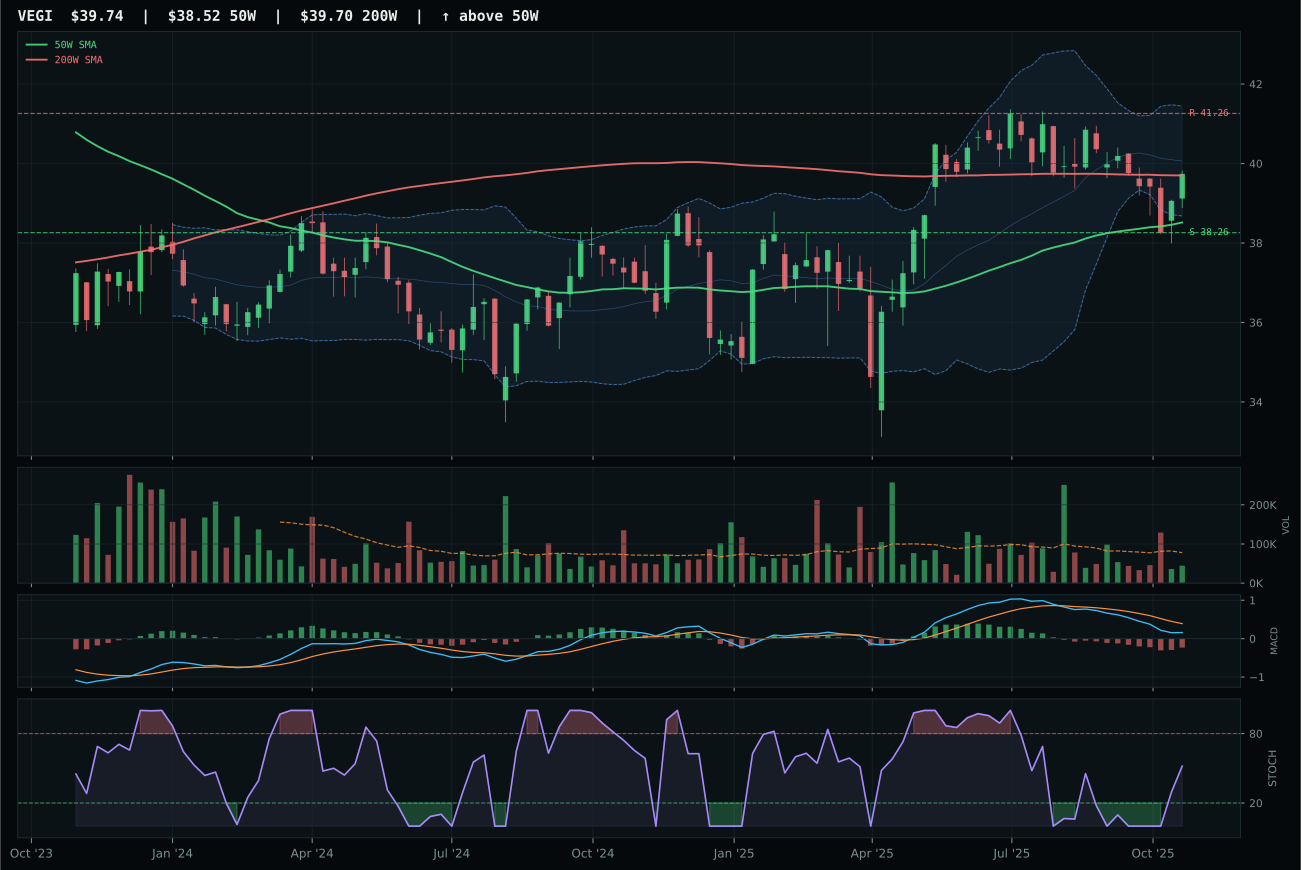
VEGI has a pullback into support profile with -9.4% 13-week relative strength versus SPY.
A failed hold above support would weaken the setup.
Tracked, but not top-2 eligible because: .
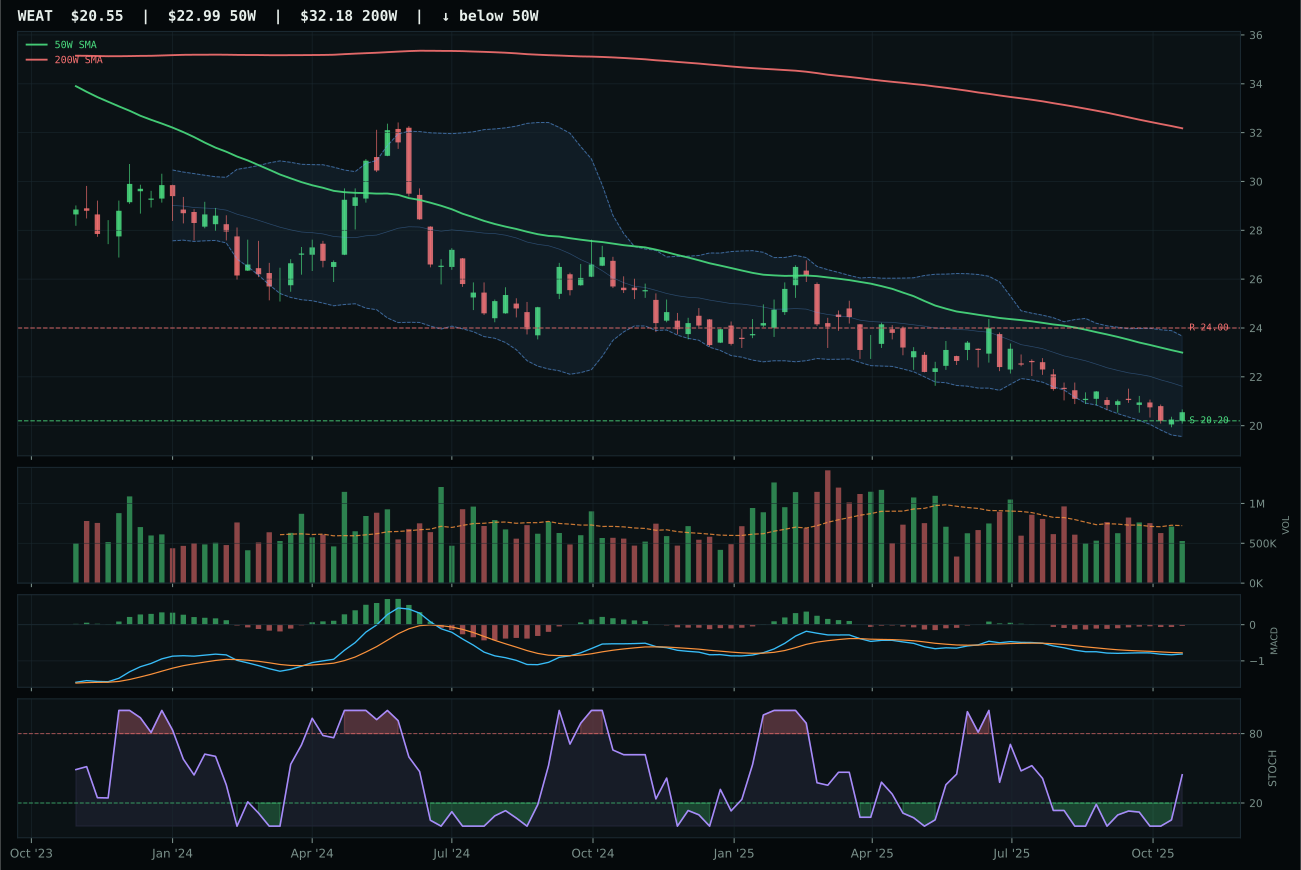
WEAT has a pullback into support profile with -14.1% 13-week relative strength versus SPY.
Extension and support failure are the main tactical risks.
Tracked, but not top-2 eligible because: structurally broken.
MOO won Agriculture & Livestock by default rather than conviction: it was 42.7 on the reasoned proof order, 2.0 points ahead of VEGI's 40.7, a margin so thin that the 14.0-point score gap between category winner and runner-up reflects external factor weighting more than technical superiority. MOO trades above the 50W but below the 200W, a split-personality setup that scores 51.3 on trend because it lacks confirmatory upside structure; the MACD is bearish and weakening, stochastic RSI is rising mid-zone, and the 13W return is negative at -0.8%. VEGI's 69.1 structure score fell behind MOO's 75.8, and its thin participation volume (0.92x neutral) confirmed no institutional accumulation. Neither name deserves allocation weight; the category winner is a placeholder waiting for either a breakout above the 200W or acceptance that this trade should be avoided entirely.
Agriculture & Livestock is excluded entirely at 0% allocation, ranked outside the portfolio due to a 16.1 category score that reflects macro headwinds impossible to overcome with technicals alone. Disinflation pressure subtracts 8 points from the macro fit, and commodity breadth positive (+5) and real asset sponsorship (+8) cannot bridge the gap. The category's 40.8% technical evidence in MOO (trend 51.3, momentum 27.7) is weak on its face and weaker still when the macro regime is counting down commodity exposure in real-time. For Agriculture to earn even a tier-2 5% slot, technicals would need to reset with MOO above the 200W and stochastic RSI above 0.70, paired with a pivot toward inflation or commodity scarcity descriptors becoming active; until then, capital is better deployed to defensive utilities, monetary-hedge precious metals, and scarcity-driven industrial metals where both macro and technicals align.