
2025-10-17
Informational purposes only. The content in this report, including allocations, analysis, and commentary, is provided solely for informational and educational purposes. It does not constitute financial advice, investment advice, trading advice, or any other type of advice. Past performance does not guarantee future results. Always conduct your own research and consult a qualified financial professional before making investment decisions.
Weekly Allocation
| Ticker | Category | Weight | Role |
|---|---|---|---|
| FBTC | 50% | Overlay | |
| GLD | Precious Metals | 10% | Top-2 (10%) |
| SMH | AI | 10% | Top-2 (10%) |
| REMX | Industrial Metals | 5% | Tier-2 (5%) |
| XLU | Utilities & Infrastructure | 5% | Tier-2 (5%) |
| NLR | Nuclear Energy | 5% | Tier-2 (5%) |
| IEMG | Emerging Markets | 5% | Tier-2 (5%) |
| XAR | Defense & Aerospace | 5% | Tier-2 (5%) |
| XLK | Technology | 5% | Tier-2 (5%) |
Trade Instructions — Monday Open
Sell the tranche from 2025-09-19 (completing its 4-week hold). Buy the new tranche. Instructions show net portfolio changes — same-asset positions cancel, weight changes show the delta.
| Action | Ticker | Instruction |
|---|---|---|
| SELL | COPX | Sell 33% of COPX position (reduce 7.50% → 5.00%) |
| SELL | AIQ | Sell entire AIQ position (2.50% of portfolio) |
| SELL | URA | Sell 20% of URA position (reduce 6.25% → 5.00%) |
| SELL | IGV | Sell 50% of IGV position (reduce 2.50% → 1.25%) |
| SELL | ILF | Sell 50% of ILF position (reduce 2.50% → 1.25%) |
| SELL | PAVE | Sell entire PAVE position (1.25% of portfolio) |
| BUY | GLD | Buy GLD — 12.50% of freed cash (adds 1.25% to portfolio) |
| BUY | SMH | Buy SMH — 25.00% of freed cash (adds 2.50% to portfolio) |
| BUY | XLU | Buy XLU — 12.50% of freed cash (adds 1.25% to portfolio) |
| BUY | XLK | Buy XLK — 12.50% of freed cash (adds 1.25% to portfolio) |
| BUY | REMX | Buy REMX — 12.50% of freed cash (adds 1.25% to portfolio) |
| BUY | NLR | Buy NLR — 12.50% of freed cash (adds 1.25% to portfolio) |
| BUY | IEMG | Buy IEMG — 12.50% of freed cash (adds 1.25% to portfolio) |
Current Portfolio After Trade
Combined holdings across all 4 active tranches. Each tranche is 25% of the portfolio.
| Ticker | % of Portfolio | Weight Bar |
|---|---|---|
| FBTC | 50.00% | |
| SLV | 7.50% | |
| SMH | 6.25% | |
| COPX | 5.00% | |
| URA | 5.00% | |
| XLU | 5.00% | |
| XAR | 3.75% | |
| XLE | 3.75% | |
| XLK | 3.75% | |
| REMX | 2.50% | |
| GLD | 2.50% | |
| IGV | 1.25% | |
| ILF | 1.25% | |
| NLR | 1.25% | |
| IEMG | 1.25% |
Macro Regime — Disinflation
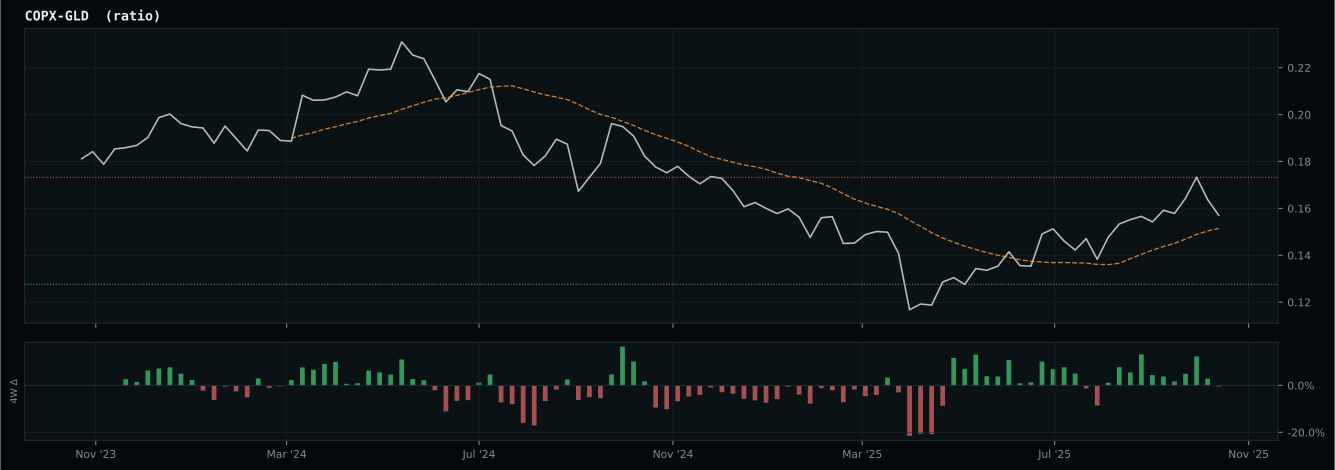
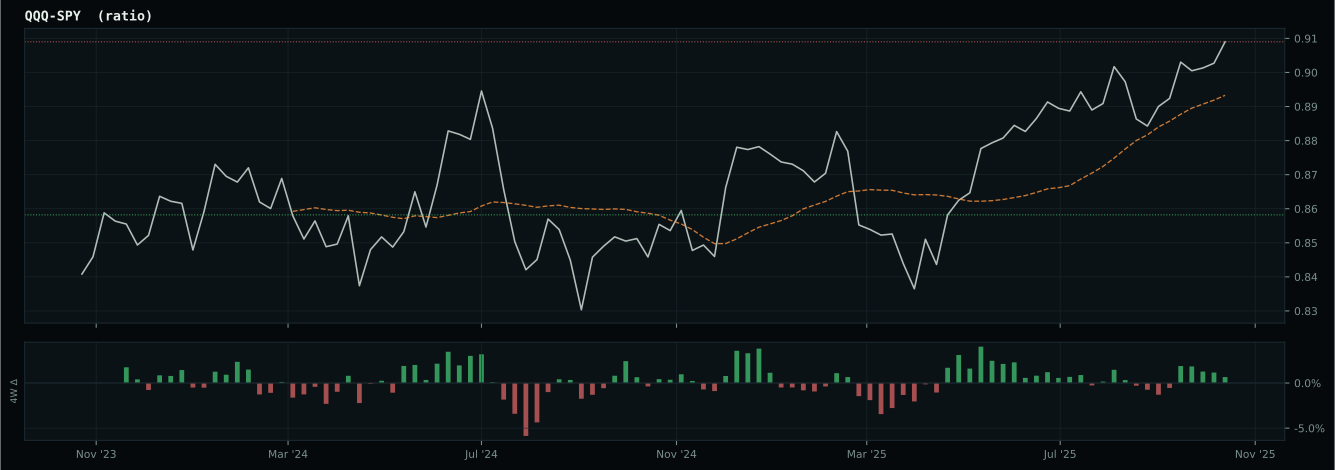
Macro Evidence Charts
Market-implied signals behind the macro regime scores. Each ratio compares two assets; the direction and slope of the ratio is what the macro engine reads.
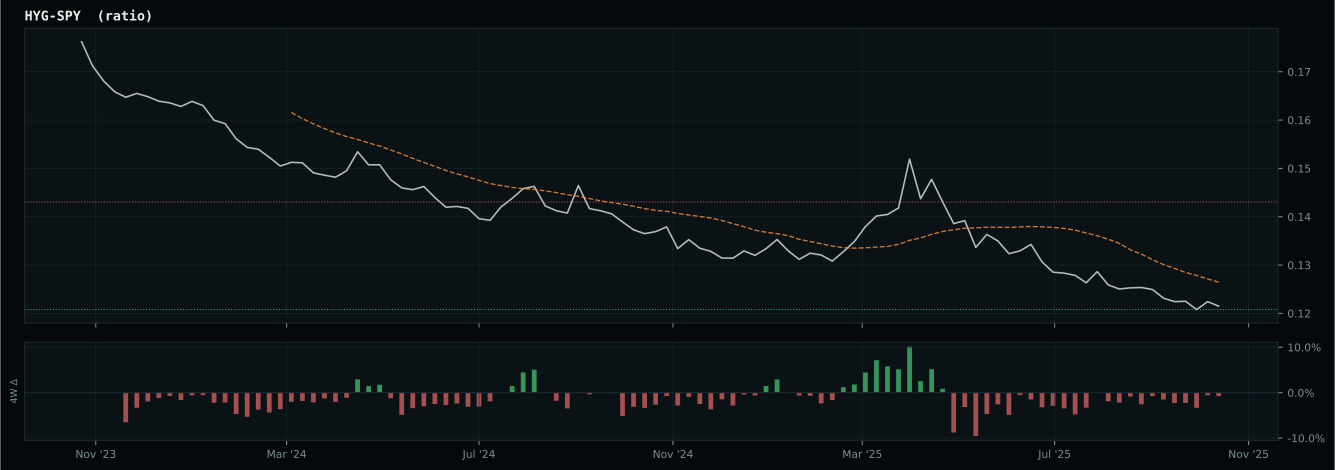
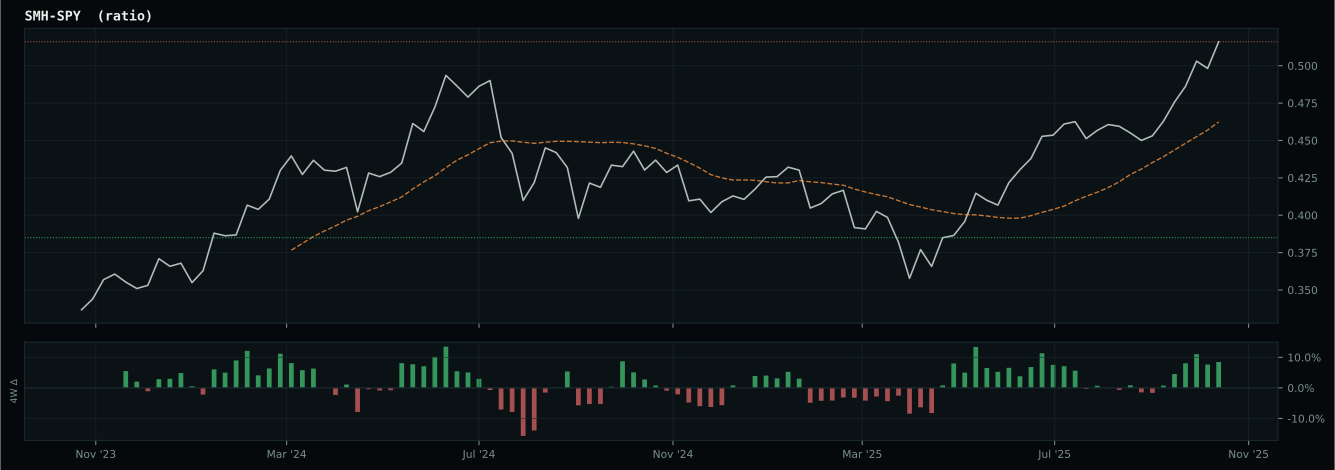
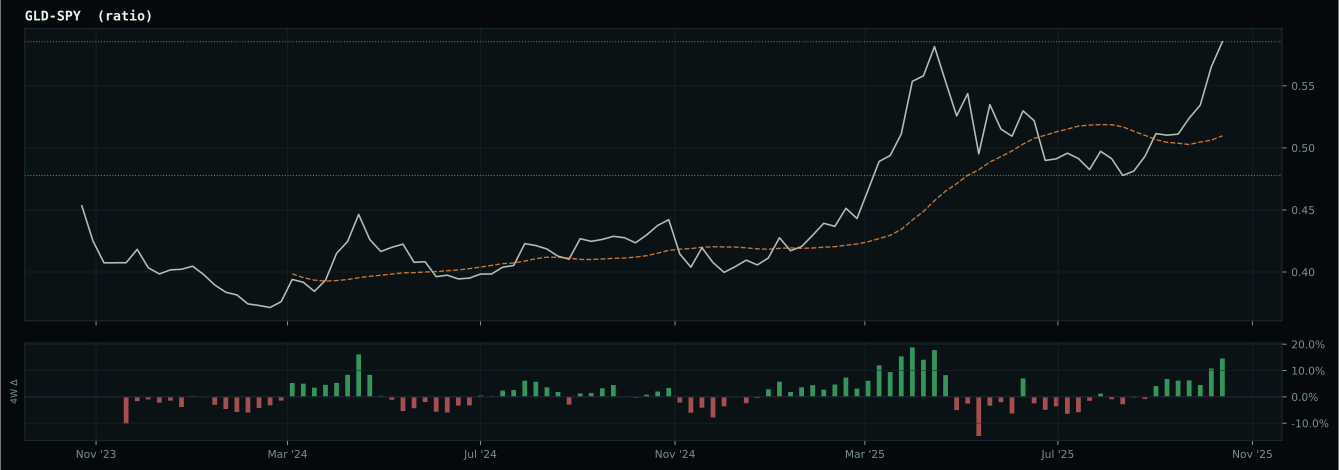
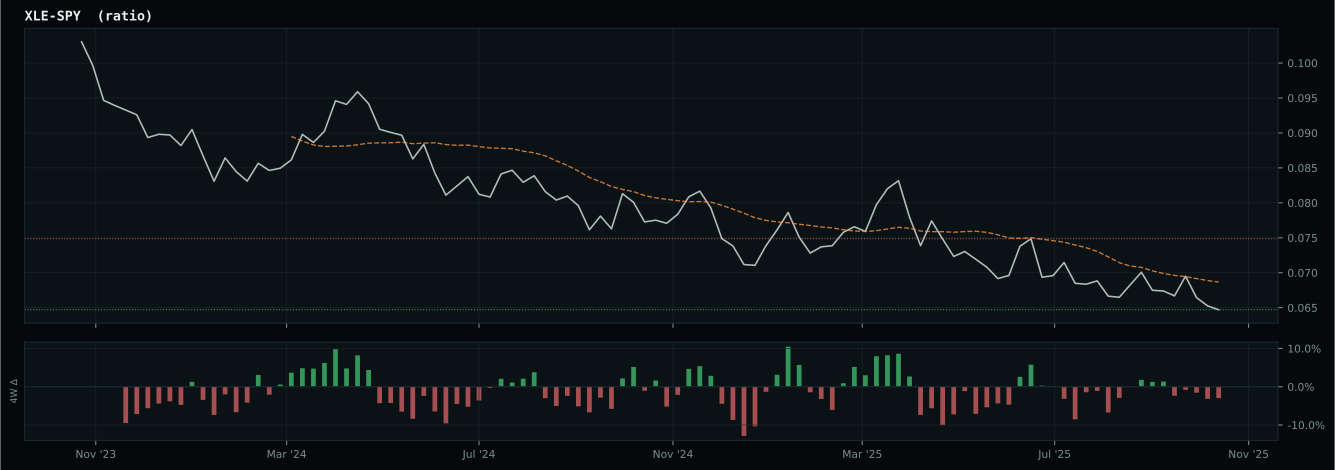
Crypto Regime — TrendBTC
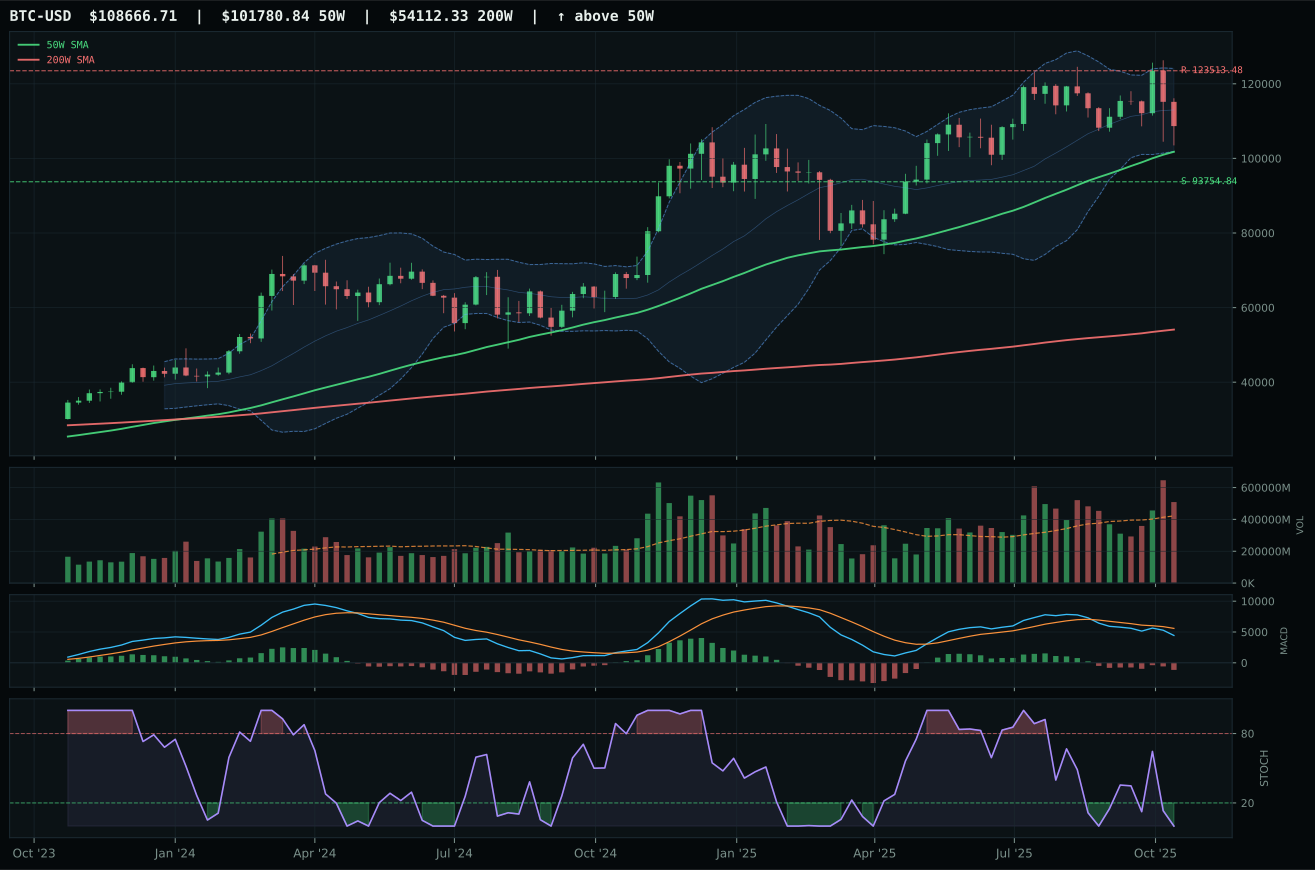
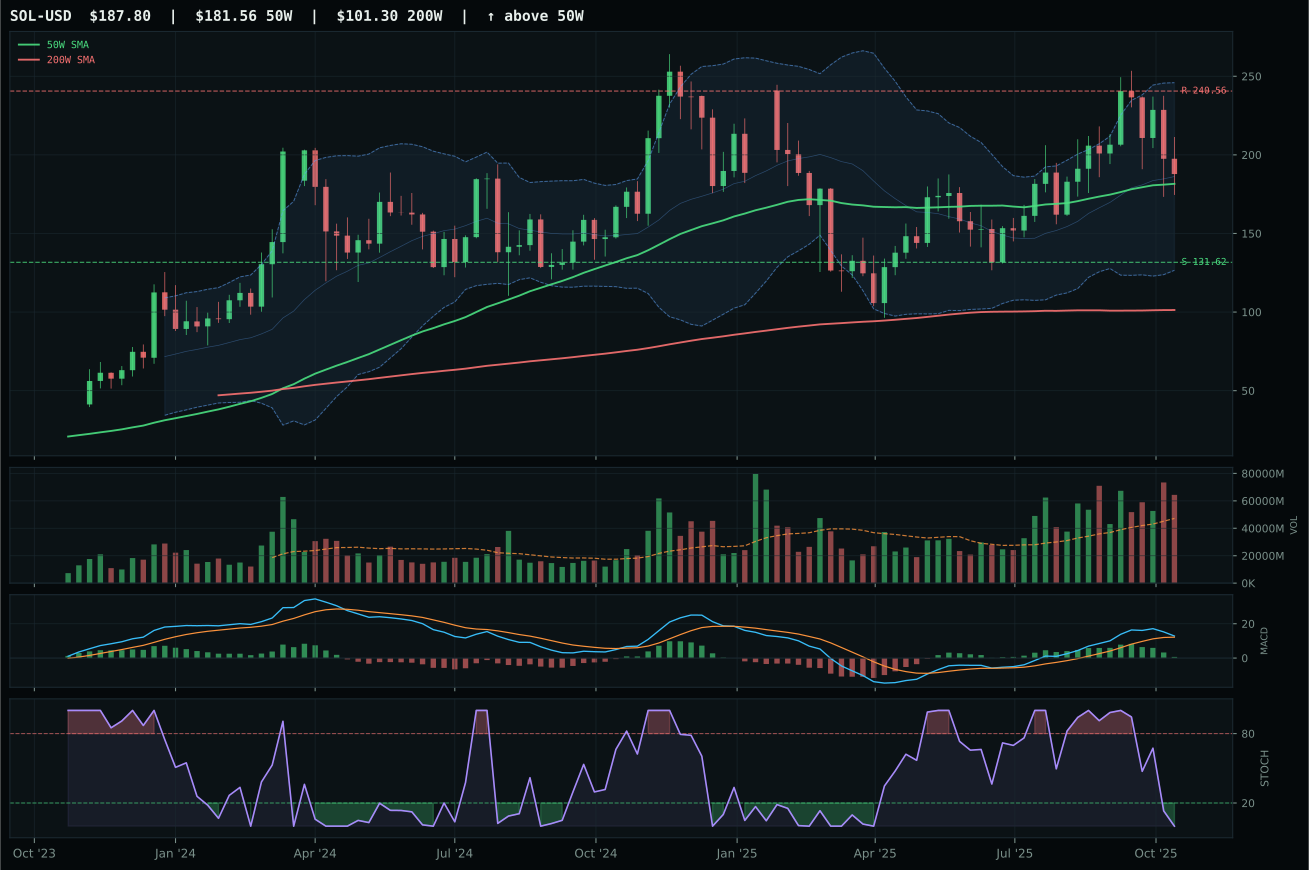
ValueBTC not armed: BTC has not made the first post-breakdown touch of the 200W buy zone after losing the 50W
TrendBTC confirmed: 2 consecutive closes above rising/flat 50W SMA
one or more available conditions failed
Category Rankings
| Rank | Category | Winner | Score | Alloc | 4W Ret | Peers (4W) |
|---|---|---|---|---|---|---|
| 1 | Precious Metals | GLD | 87.8 | 20% | -5.89% | SLV -4.1% · GDX -5.6% |
| 2 | AI | SMH | 72.3 | 20% | -1.17% | BOTZ -5.5% · AIQ -2.1% |
| 3 | Industrial Metals | REMX | 72.0 | 10% | -0.80% | COPX -1.8% · PICK -0.4% |
| 4 | Utilities & Infrastructure | XLU | 67.3 | 10% | -3.62% | IGF -0.5% · PAVE -1.3% |
| 5 | Nuclear Energy | NLR | 64.7 | 10% | -17.34% | URA -18.9% · URNM -11.5% |
| 6 | Emerging Markets | IEMG | 52.0 | 10% | +0.07% | ILF +7.2% · INDA +0.4% |
| 7 | Defense & Aerospace | XAR | 43.7 | 10% | -4.75% | ROKT -3.1% · ITA -0.9% |
| 8 | Technology | XLK | 42.7 | 10% | -0.42% | CIBR -1.1% · IGV -5.6% |
| 9 | Agriculture & Livestock | MOO | 15.0 | 0% | -1.76% | VEGI -0.3% · WEAT +5.2% |
| 10 | Traditional Energy | XLE | — | 0% | +6.71% | FCG +8.8% · XOP +7.3% |
Precious Metals — GLD
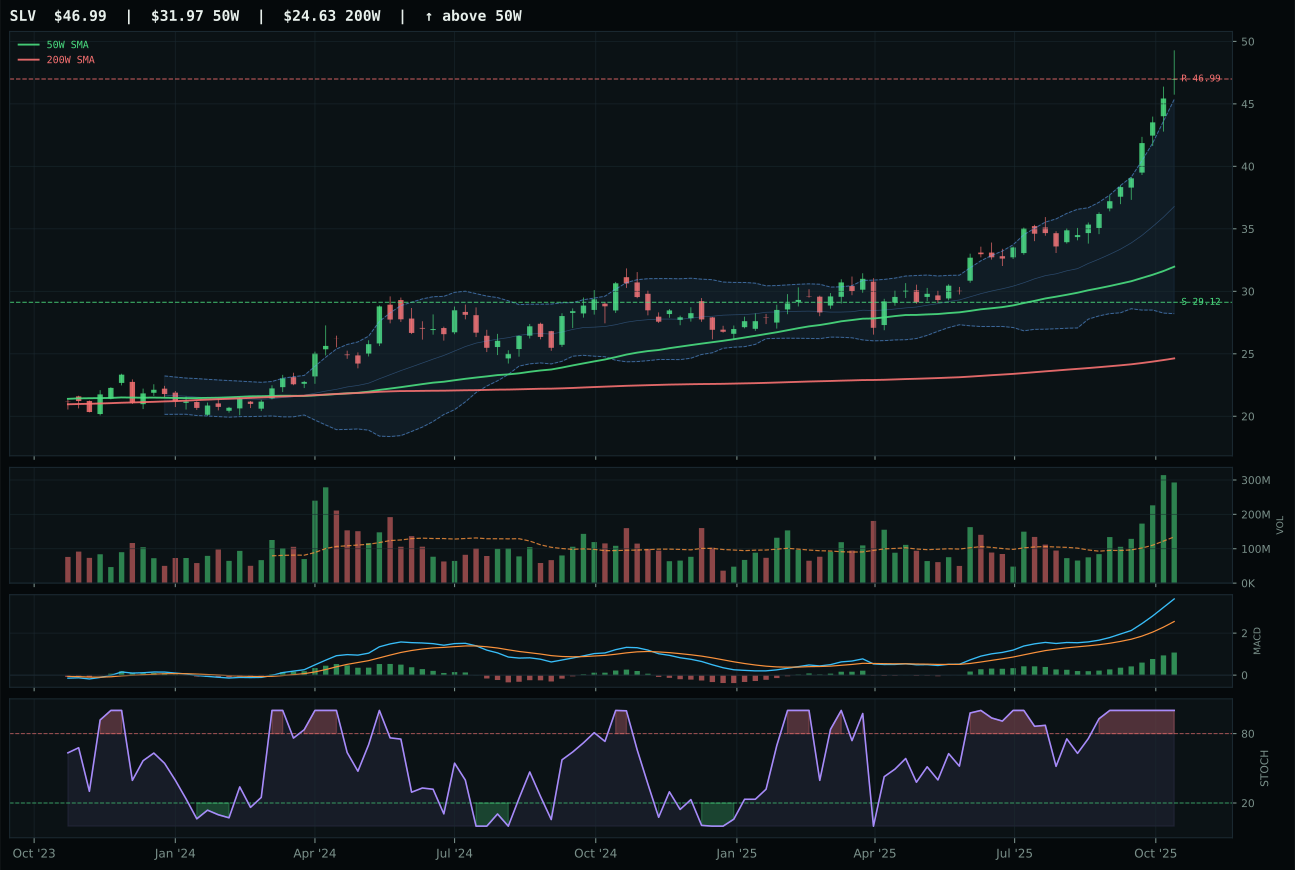
SLV has a vertical extension profile with 29.9% 13-week relative strength versus SPY.
A failed hold above support would weaken the setup.
Actionable but governed by invalidation levels.
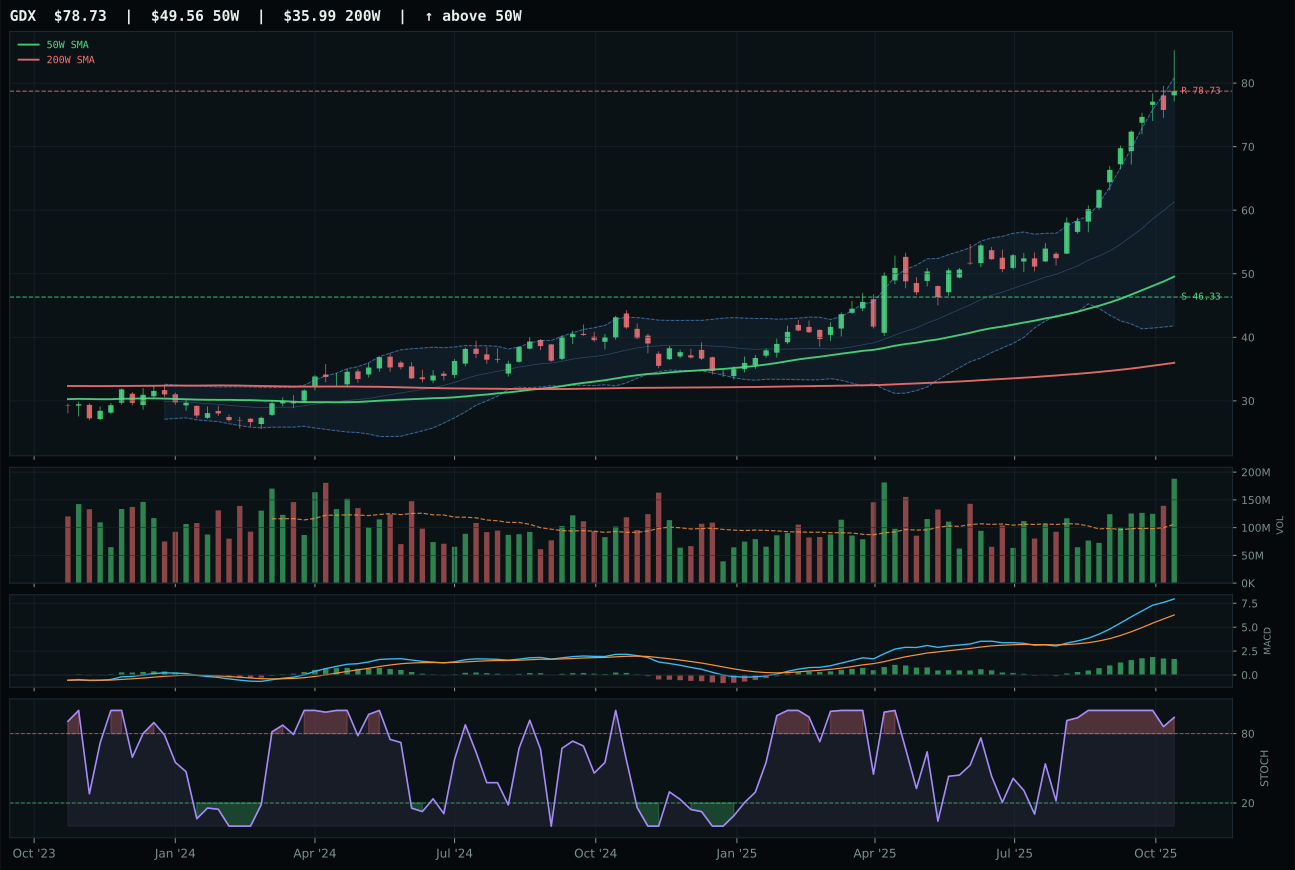
GDX has a vertical extension profile with 48.1% 13-week relative strength versus SPY.
A failed hold above support would weaken the setup.
Actionable but governed by invalidation levels.
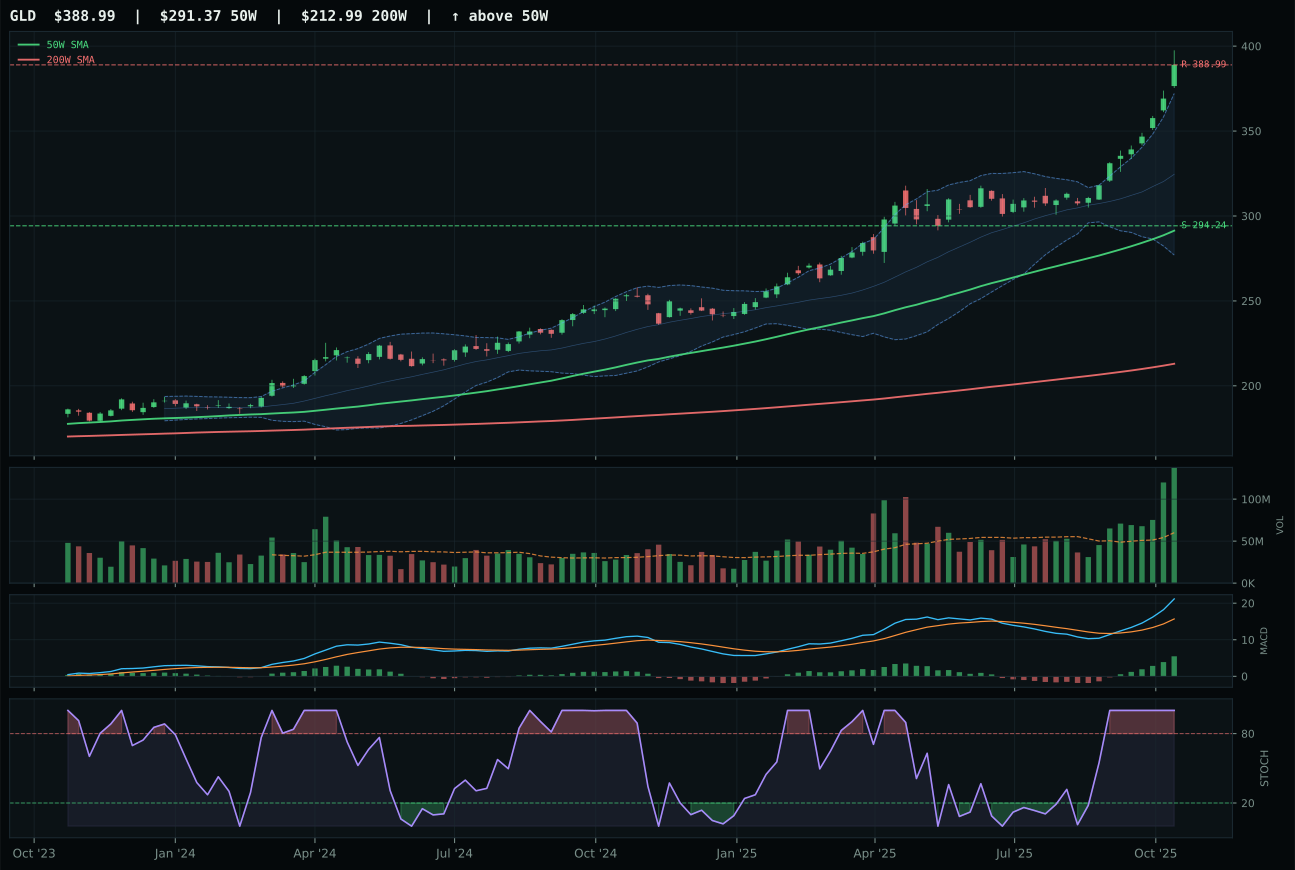
GLD has a vertical extension profile with 20.3% 13-week relative strength versus SPY.
A failed hold above support would weaken the setup.
Actionable but governed by invalidation levels.
GLD wins the category and earns top-2 allocation because it posts 68/100 on the composite while delivering the strongest macro fit and superior positioning to SLV. Both trade in vertical extension with bullish, improving MACD and overbought stochastic RSI at 1.00, but GLD's 33.5% extension above the 50W is less stretched than SLV's aggressive 47.0%, providing a 37-point timing advantage (37.0 vs. similar stochastic levels). Structure is cleaner on GLD at 91.8/100 versus SLV's 87.7/100, and risk/reward reflects this: GLD's 46.5/100 versus SLV's 44.4/100 shows the gold pure-play offers marginally safer positioning. The 13-week return differential is meaningful: GLD at 26.1% versus SLV at 35.8% looks like SLV is winning, but RS versus SPY is 20.3% for GLD versus 29.9% for SLV, indicating GLD's outperformance is more broad-based and less dependent on silver's hybrid industrial/monetary beta. Volume is accumulation/confirmation at 2.55x on GLD versus SLV's similar participation, so both are being bought; GLD wins on setup cleanliness and macro alignment.
Precious Metals earned top-2 allocation at 10% because it ranks second in the portfolio with a category score of 87.8, reflecting exceptional alignment between technical evidence at 83.8 and macro fit at 74.0. The category benefits from four active tailwinds—monetary hedge bid at plus-fourteen, disinflation pressure at plus-eight, defensive rotation at plus-seven, and category-level macro fit of 81.0—that create structural support independent of near-term momentum. GLD's volume-price confirmation at 83.8 and persistence at 82.2 confirm the trend is being accumulated rather than distributed, a critical distinction when allocating to extended assets. The 10% weight reflects the category's rank as second-most compelling among the ten; only semiconductors exceeded it due to higher momentum confirmation and positive risk appetite tailwinds. Any deterioration in volume participation, MACD confirmation rolling over, or stochastic RSI dropping from overbought would immediately threaten this allocation.
AI — SMH
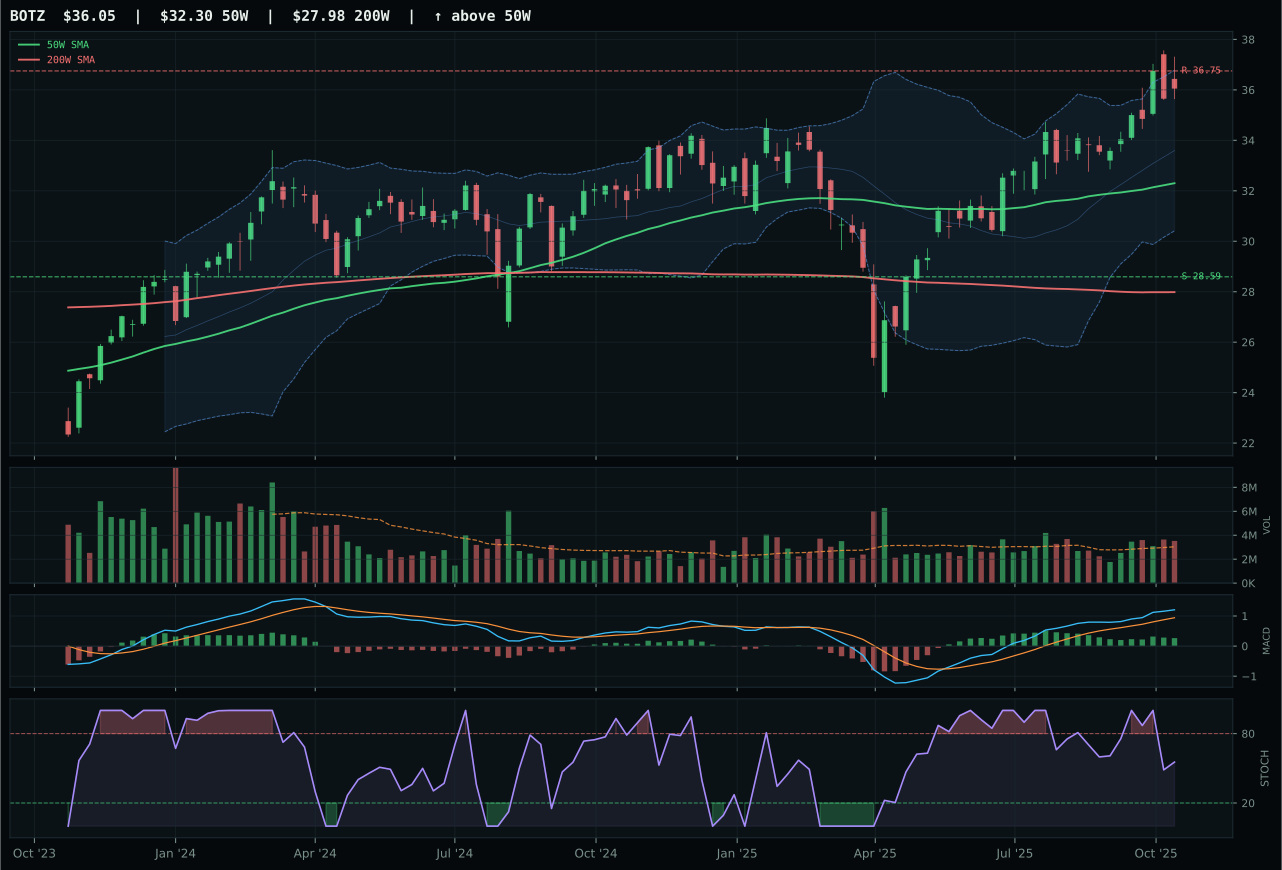
BOTZ has a neutral structure profile with 2.8% 13-week relative strength versus SPY.
A failed hold above support would weaken the setup.
Actionable but governed by invalidation levels.
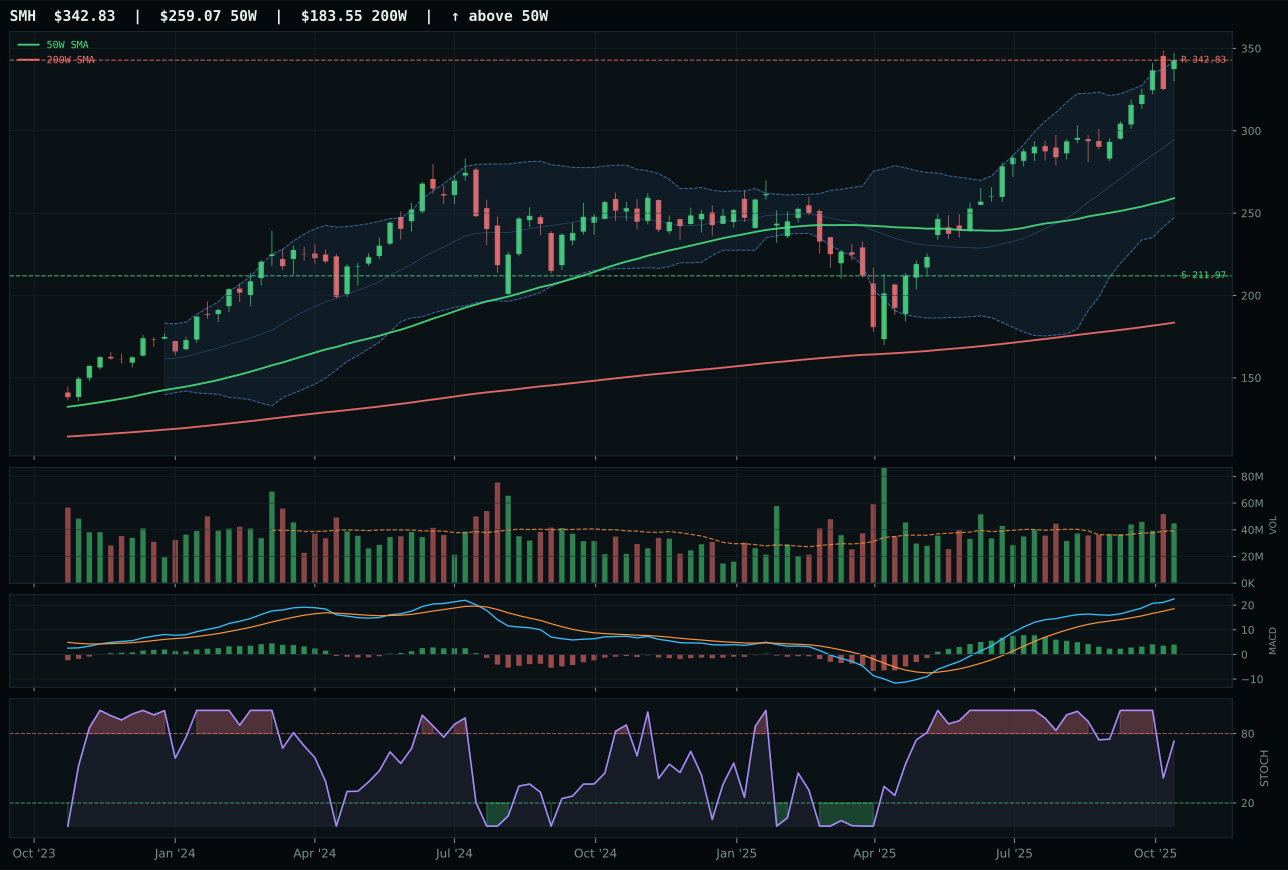
SMH has a vertical extension profile with 12.2% 13-week relative strength versus SPY.
A failed hold above support would weaken the setup.
Actionable but governed by invalidation levels.
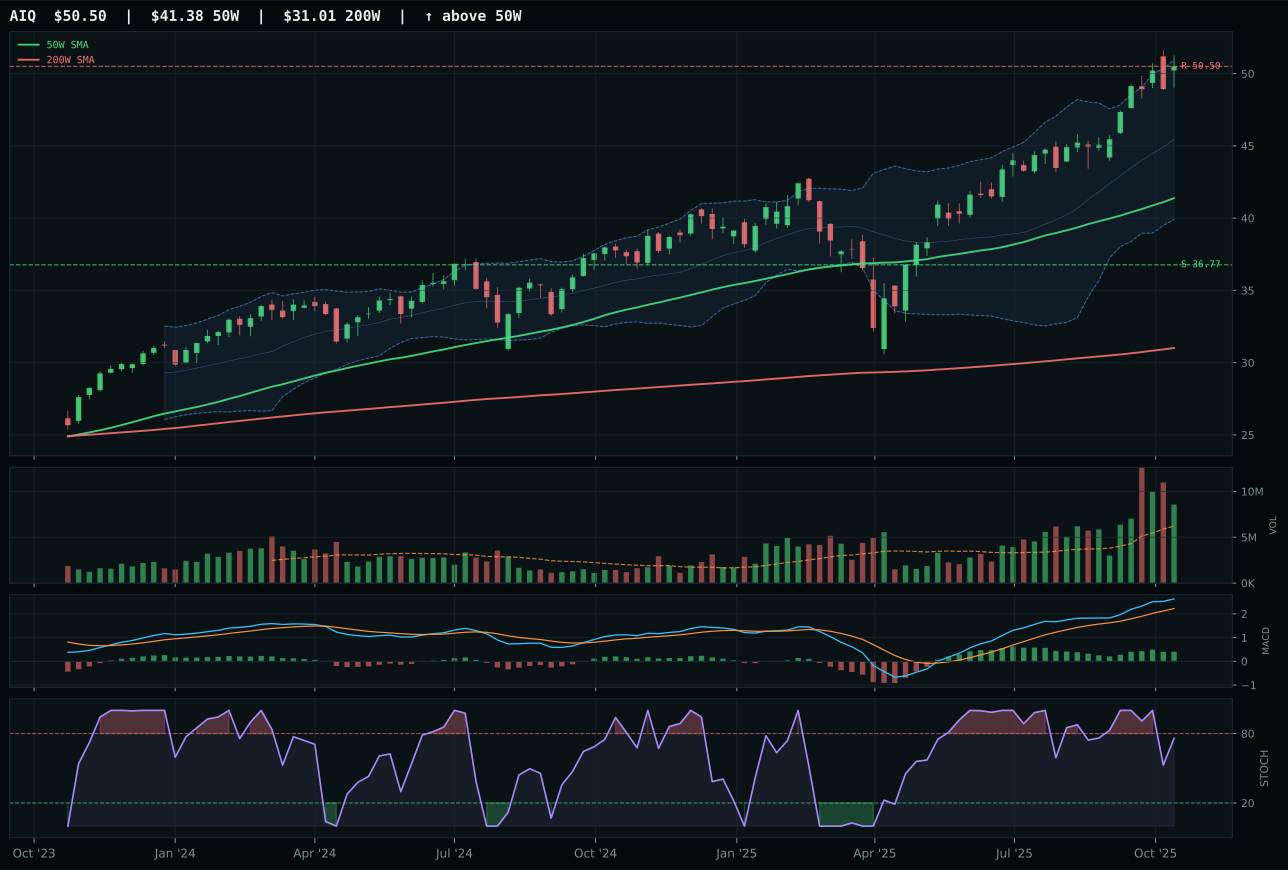
AIQ has a vertical extension profile with 8.0% 13-week relative strength versus SPY.
A failed hold above support would weaken the setup.
Actionable but governed by invalidation levels.
SMH wins despite scoring 66/100 on the composite versus BOTZ's 80/100 because the reasoned ETF proof order places it above peers: the category algorithm weights the strongest uptrend and broadest relative strength, and SMH delivers exactly that. Price sits 32.3% above the 50-week moving average with a 0.8% positive slope, RS versus SPY is 12.2% (the highest in the basket), and 13-week return of 18.1% towers over BOTZ's 8.7%. Momentum confirmation scores a perfect 100/100 driven by those returns plus 4.2% category-relative strength, MACD bullish and improving, and above-average volume participation at 1.14x. BOTZ's higher composite score masks a structural vulnerability: it scores 76.9/100 on structure versus SMH's 78.9/100, but more critically, BOTZ suffers -5.1% category-relative strength while SMH is +4.2%, a 9.3-point swing that tilts leadership decisively. The stochastic RSI is falling/neutral on both, so timing is tight, but the volume confirmation and relative strength momentum make SMH the cleaner near-term vehicle.
AI ranked second among the ten categories at 72.3 and earned a top-2 allocation slot at 10% because semiconductor momentum and positive risk appetite are the clearest structural features of the current macro regime. The category benefits from AI growth sponsorship at plus-fourteen and risk appetite positive at plus-ten, which offset minus-twelve liquidity stress and minus-eight credit stress; those active descriptors are real tailwinds, not theoretical labels. SMH's 100.0 momentum confirmation and 85.5 persistence score mean the upside is being accumulated rather than distributed, a crucial detail when deciding between growth and value rotations. Precious Metals edged into top-2 territory at 87.8 based on monetary hedge bid and disinflation factors, so AI's 10% allocation reflects its rank as the second-most compelling risk-adjusted opportunity; losing SMH volume or seeing MACD confirmation deteriorate would push the category to 5% or eliminate it entirely.
Industrial Metals — REMX
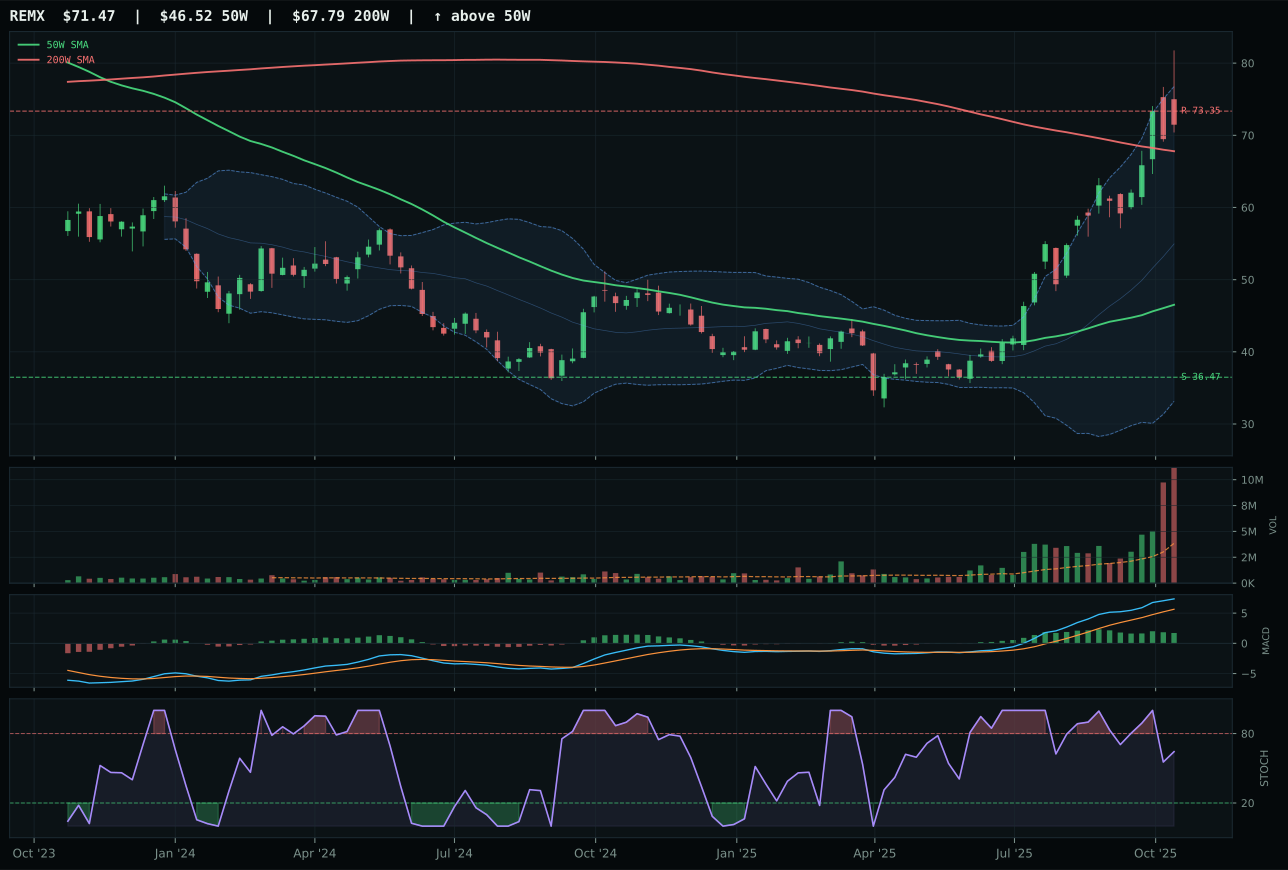
REMX has a vertical extension profile with 34.8% 13-week relative strength versus SPY.
A failed hold above support would weaken the setup.
Actionable but governed by invalidation levels.
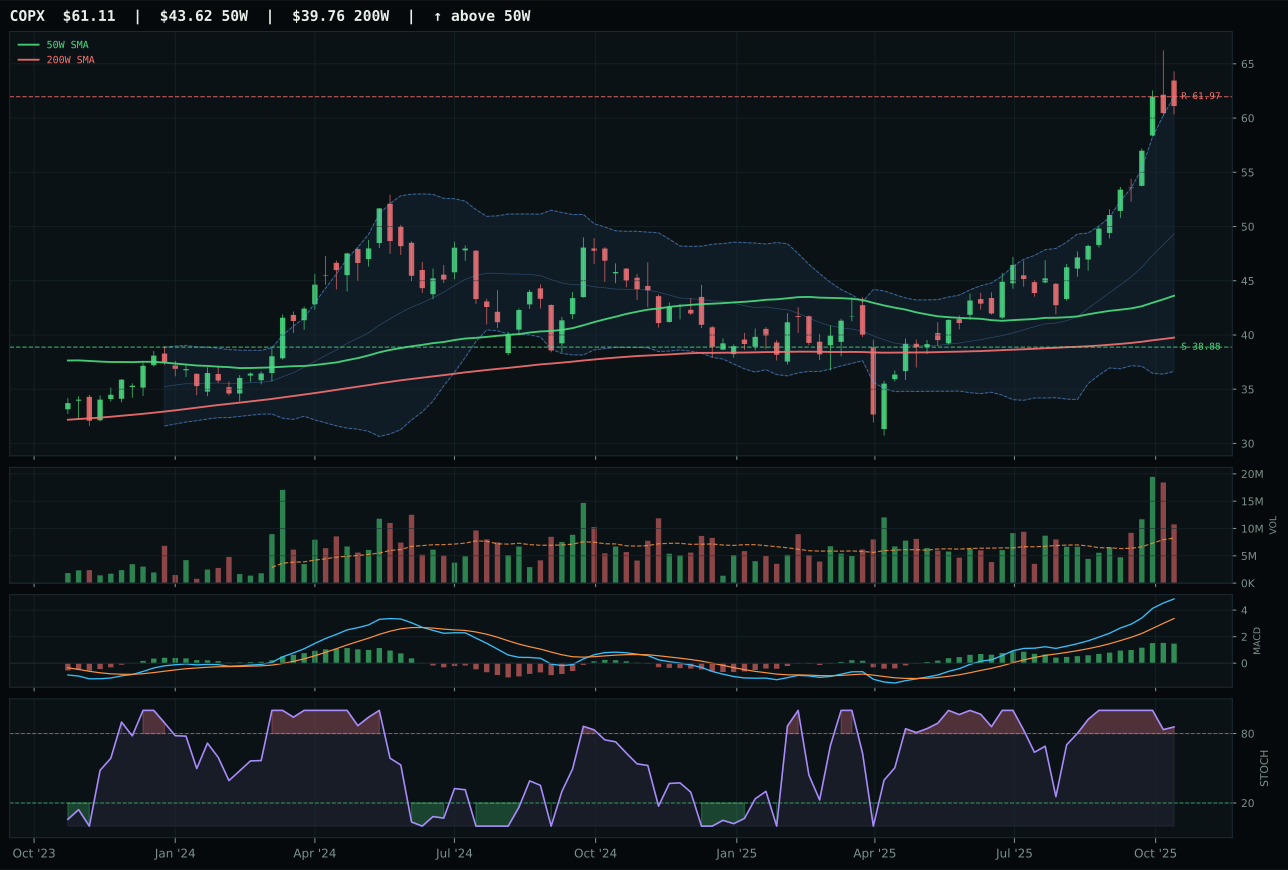
COPX has a vertical extension profile with 33.4% 13-week relative strength versus SPY.
A failed hold above support would weaken the setup.
Actionable but governed by invalidation levels.
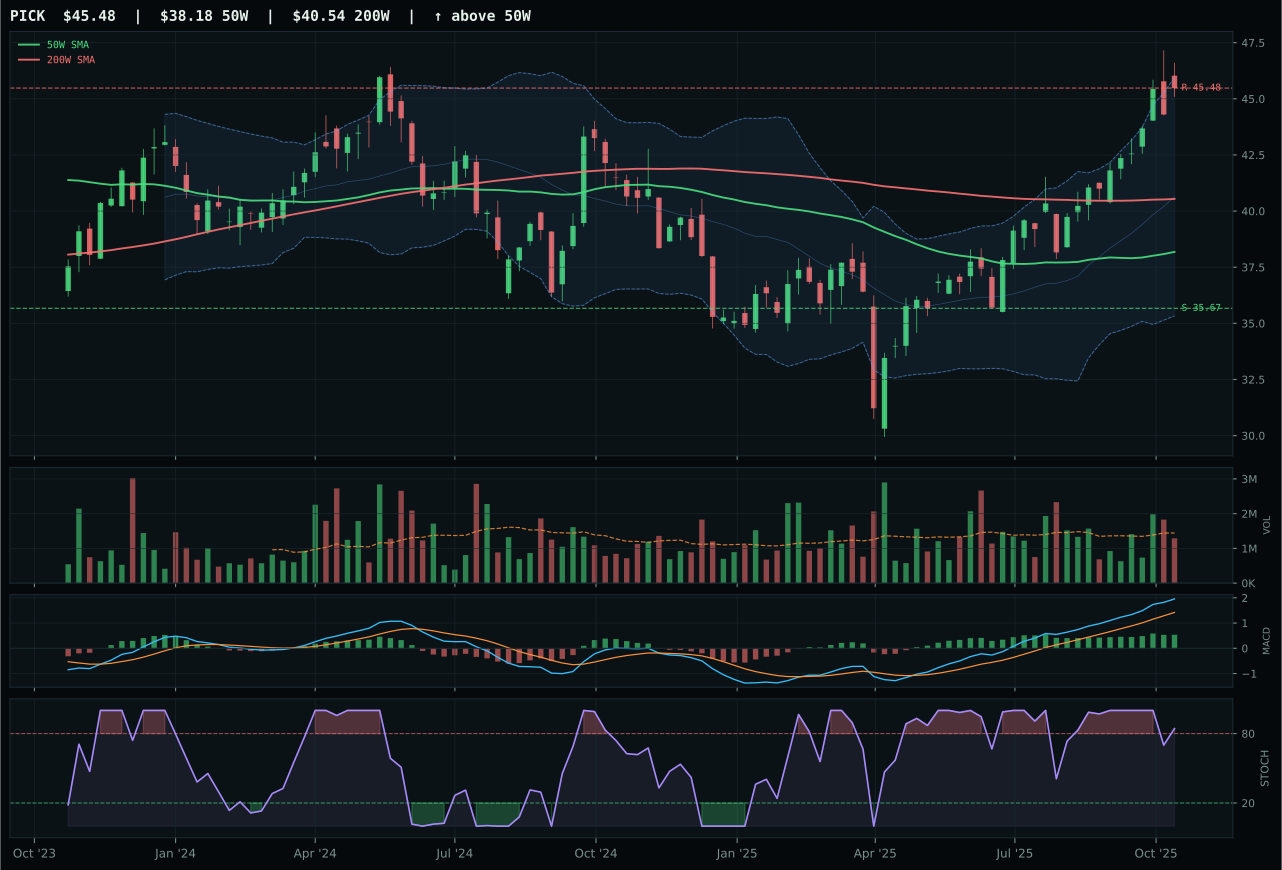
PICK has a vertical extension profile with 10.2% 13-week relative strength versus SPY.
A failed hold above support would weaken the setup.
Actionable but governed by invalidation levels.
REMX dominates category selection with a 63/100 composite and 95.2/100 technical evidence, crushing its peers through explosive momentum and persistence despite extreme valuation stretch. Price sits 53.6% above the 50-week moving average, volume is at a stunning 4.49x the 20-week average with persistence at a perfect 100.0/100—this is acute accumulation, not ordinary buying. The 13-week return of 40.7% and 4-week return of 15.2% combined with MACD bullish and improving create a momentum profile that overshadows COPX's 39.3% 13-week return. REMX's 1.4% category-relative strength beats COPX's 0.0%, and critically, REMX's timing score of 53.0/100 exceeds COPX's 35.0/100 because REMX's extension sits in the upper retracement/momentum Fibonacci zone while COPX is overbought with stochastic RSI rolling over. The risk/reward is poor at 35.5/100 (96.0% downside to support), but the 100.0/100 momentum confirmation and 89.0/100 volume-price confirmation indicate that rare earth supply-chain scarcity is driving institutional accumulation regardless of downside risk.
Industrial Metals earned 5% allocation as a tertiary position because the category scored 72.0, ranking fourth among the ten and below the top two reserved for Precious Metals and AI. REMX's technical evidence is world-class at 95.2, but macro fit at 47.0 is weaker than precious metals because rare-earth supply constraints lack the broad monetary-hedge bid; metals scarcity is active at plus-fourteen in the category and plus-nine in the representative, but credit stress at minus-seven and liquidity stress at minus-nine create headwinds. The 5% allocation captures exposure to the AI-driven industrial-metals demand thesis without overcommitting to extension risk; REMX at fifty-three percent above the fifty-week moving average leaves minimal room for new buyers. To upgrade Industrial Metals to top-2, the category would need either precious metals to deteriorate technically or macro descriptors to shift toward commodity breadth affirmation and away from liquidity constraints.
Utilities & Infrastructure — XLU
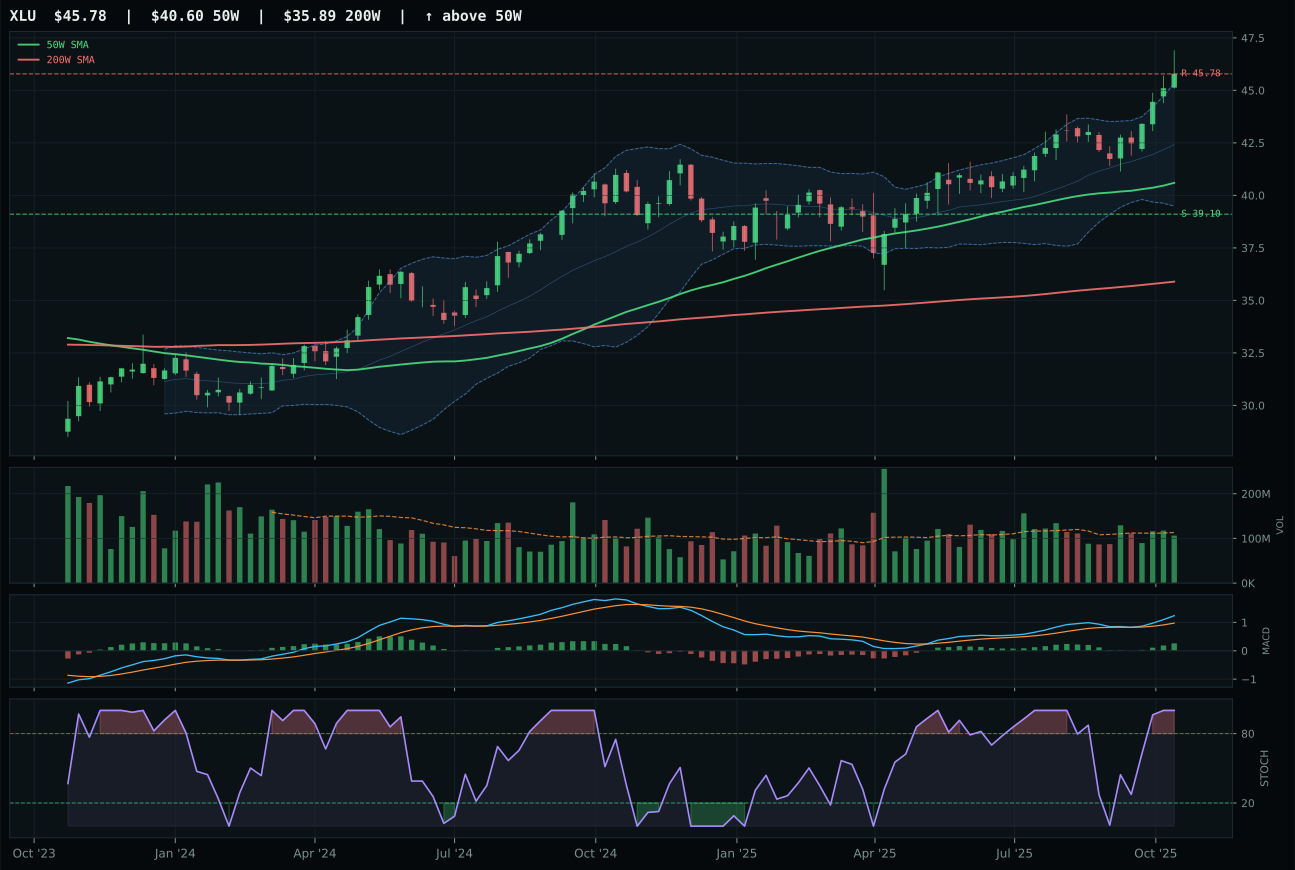
XLU has a neutral structure profile with 3.5% 13-week relative strength versus SPY.
A failed hold above support would weaken the setup.
Actionable but governed by invalidation levels.
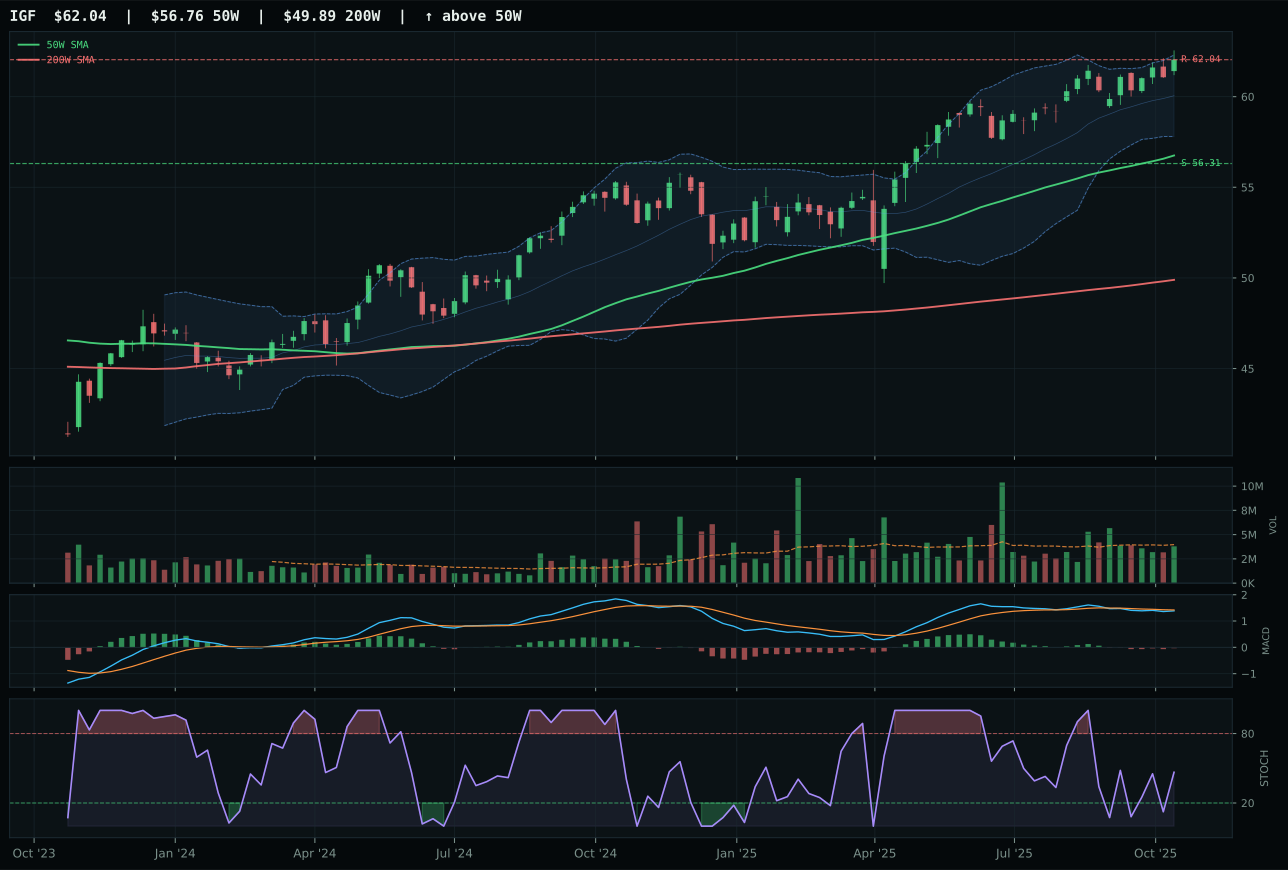
IGF has a neutral structure profile with -0.9% 13-week relative strength versus SPY.
A failed hold above support would weaken the setup.
Actionable but governed by invalidation levels.
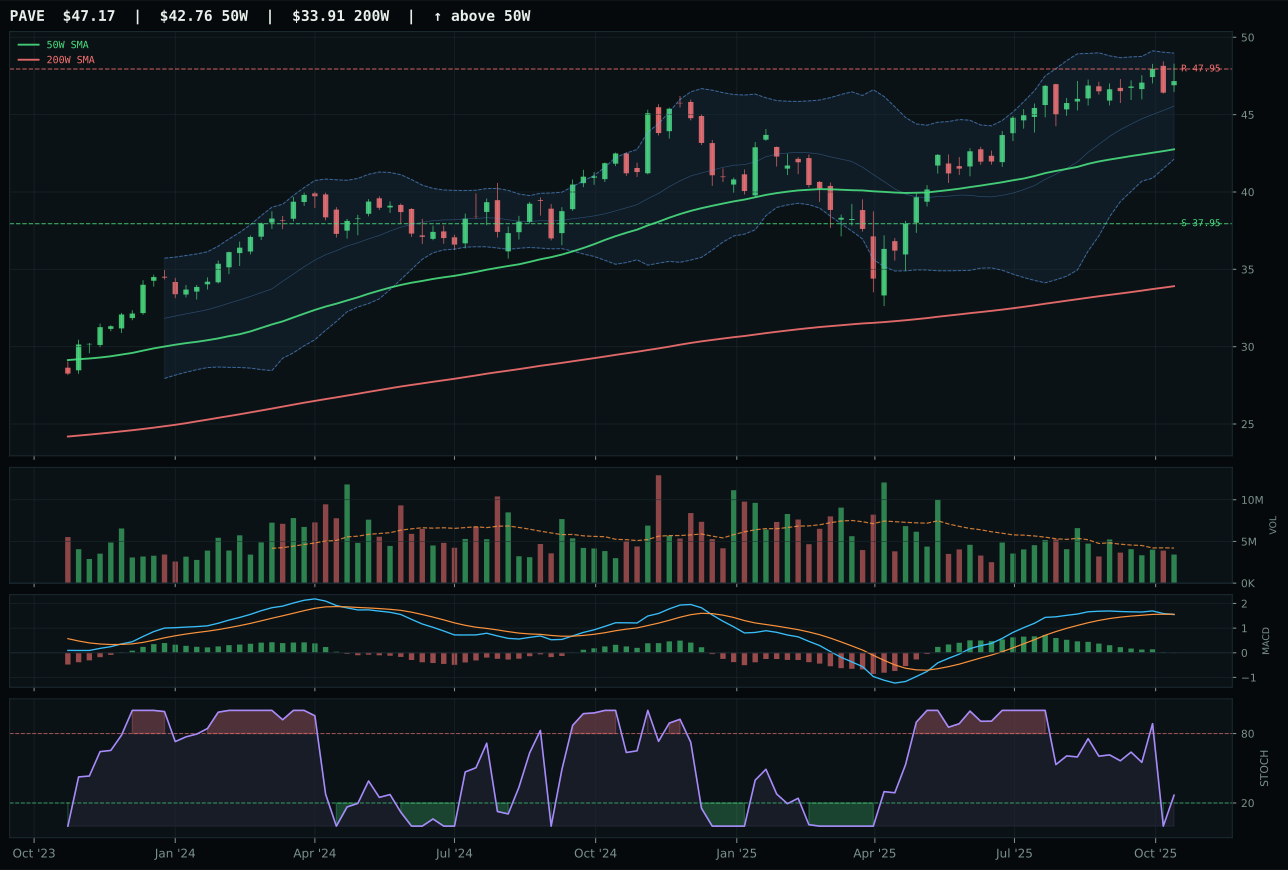
PAVE has a neutral structure profile with -2.0% 13-week relative strength versus SPY.
A failed hold above support would weaken the setup.
Actionable but governed by invalidation levels.
XLU wins the category decisively with an 81/100 composite and 83.8/100 technical evidence, combining authentic trend strength with category-relative leadership that edges out IGF's respectable but second-place setup. XLU trades 12.8% above the 50-week moving average with a clean 0.3% positive slope, MACD bullish and improving, and volume neutral at 0.94x but supporting the uptrend with 78.8/100 volume-price confirmation. The momentum score is exceptional at 96.9/100, driven by 7.8% 4-week return, 9.3% 13-week return, and 4.4% category-relative strength—that last metric is critical, as it shows XLU is outpacing its peer set during the rally. IGF scores higher on trend at 92/100 but falls behind on timing (83 vs. XLU's 59) and momentum (60 vs. 97), a seemingly contradictory pair until you realize IGF is further extended on the move while XLU is better-positioned on relative strength within the category. Structure favors XLU at 78.0/100 versus IGF's 76.5/100, and MACD is actively bullish and improving on XLU versus IGF's bearish but improving.
Utilities & Infrastructure earned 5% allocation as a defensive-secondary position because the category scored 67.3, ranking third overall behind Precious Metals and AI yet losing the top-2 slot due to lower absolute momentum and weaker macro tailwinds. The category benefits from defensive rotation at plus-twelve and disinflation pressure at plus-six, both active tailwinds, yet macro fit at 65.0 trails precious metals' 81.0 because utilities lack scarcity premiums and monetary-hedge dynamics. XLU's 100.0 trend and 59.0 timing produce rock-solid technical structure, but risk-reward at 45.4 is weaker than offensive positions because utilities by definition trade upside for downside protection. The 5% weight reflects a conviction that defensive positioning matters in a credit-stress and liquidity-constraint regime without concentrating portfolio capital on growth-lagging sectors. To earn top-2 status at 10%, Utilities would need either risk sentiment to deteriorate sharply or XLU to demonstrate persistent institutional accumulation above 45.78 resistance, shifting the narrative from mean-reversion support play to genuine uptrend extension.
Nuclear Energy — NLR
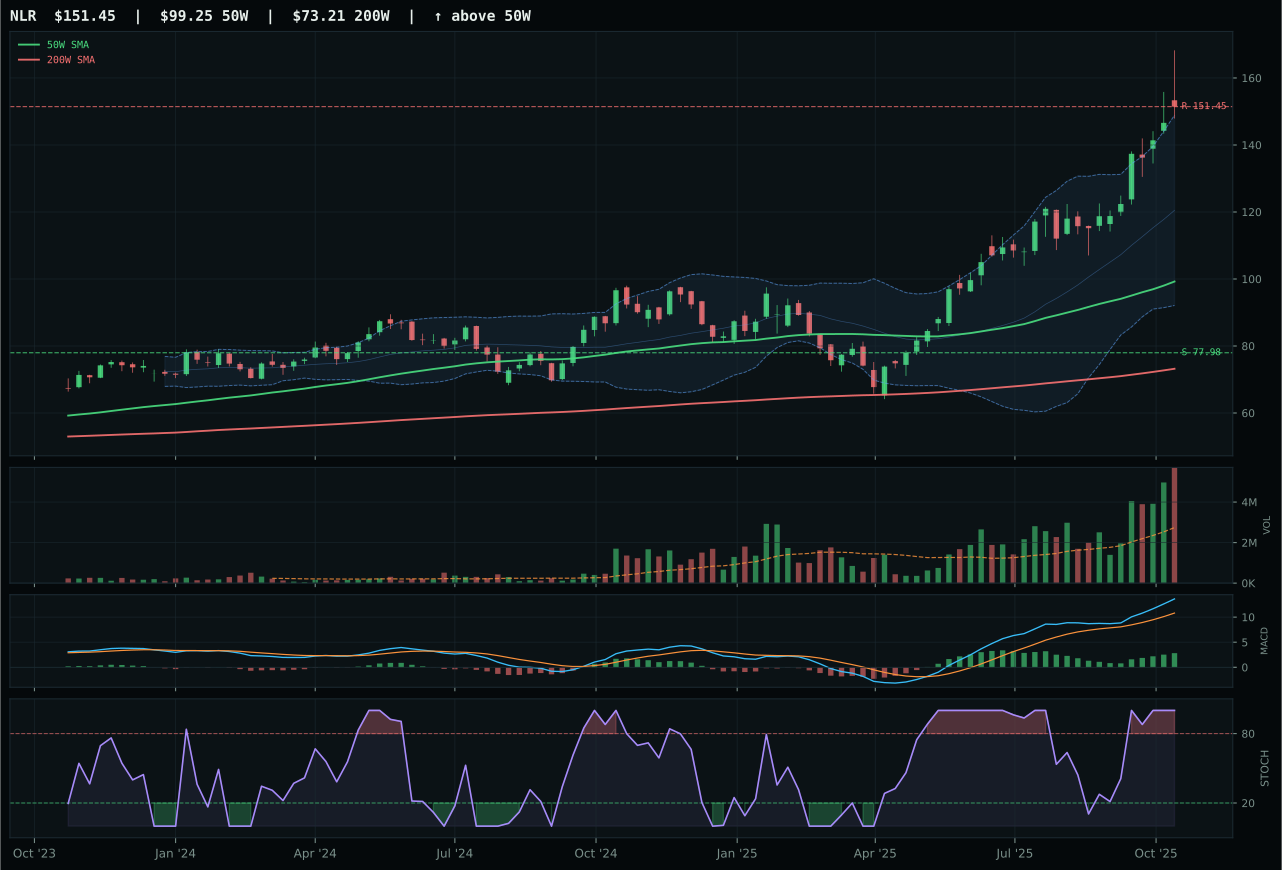
NLR has a vertical extension profile with 23.4% 13-week relative strength versus SPY.
A failed hold above support would weaken the setup.
Actionable but governed by invalidation levels.
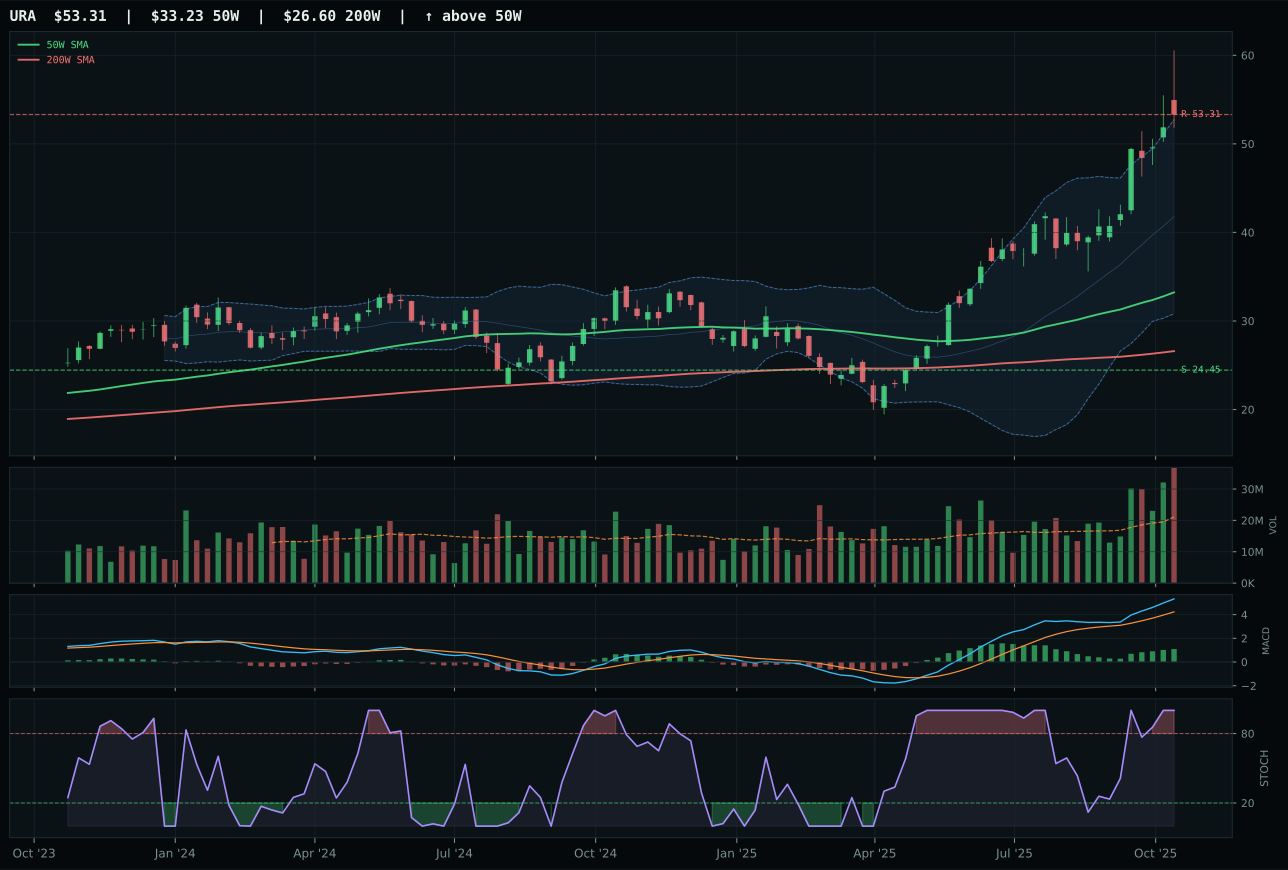
URA has a vertical extension profile with 24.4% 13-week relative strength versus SPY.
A failed hold above support would weaken the setup.
Actionable but governed by invalidation levels.
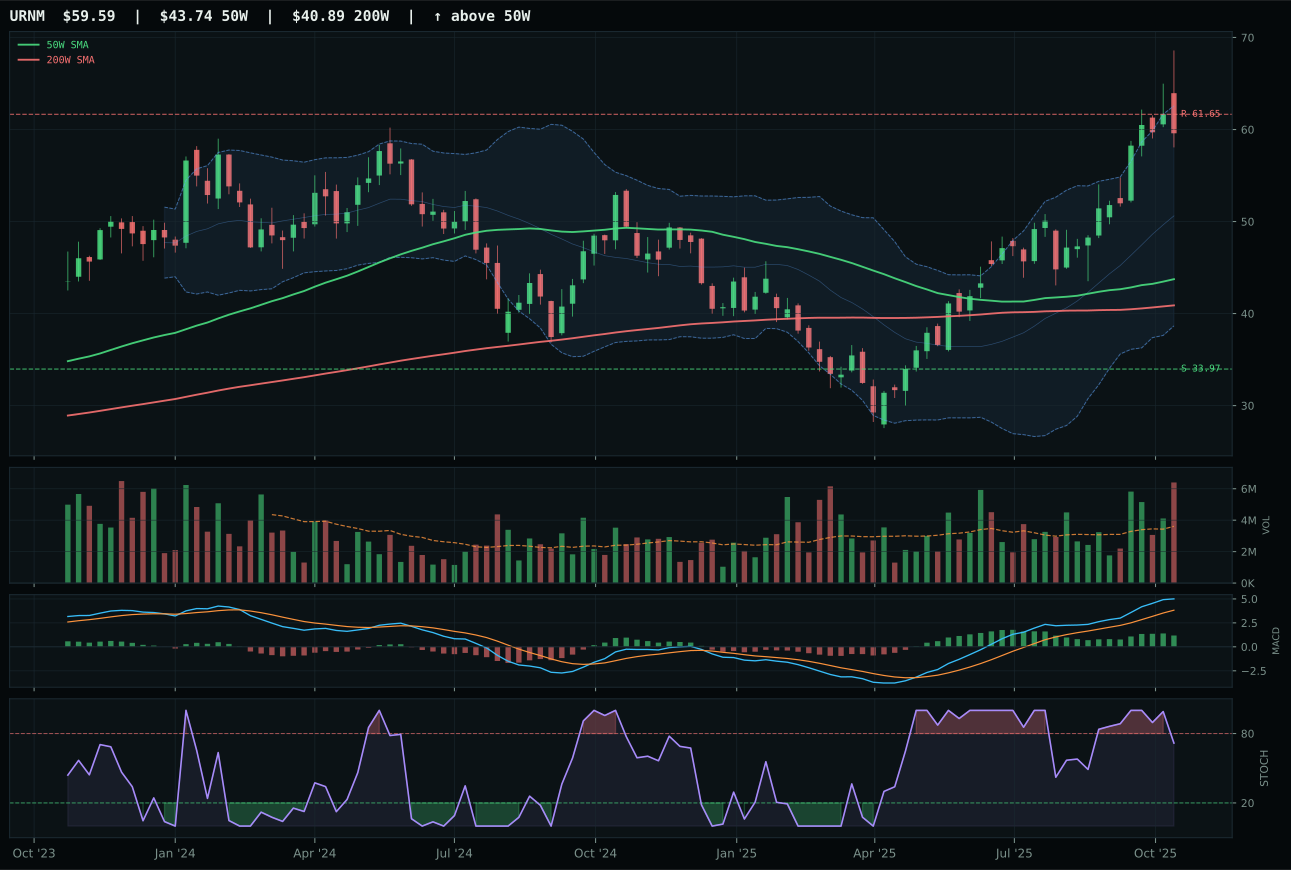
URNM has a vertical extension profile with 15.3% 13-week relative strength versus SPY.
A failed hold above support would weaken the setup.
Actionable but governed by invalidation levels.
NLR wins the category with a 68/100 composite and 90.7/100 technical evidence by combining sustained uptrend with superior timing geometry versus URA, the closest runner-up. Price sits 52.6% above the 50-week moving average with a robust 1.3% positive slope, MACD bullish and improving, and volume at 2.15x the 20-week average shows accumulation is persistent. The 29.3% 13-week return and perfect 100.0/100 momentum confirmation score reflect real sponsorship, but the decisive edge over URA (which posts 30.2% 13-week) is the 45.0/100 timing score versus URA's also-45.0/100, compensated by NLR's superior 51.5/100 risk/reward versus URA's 36.2/100. URA is more stretched at 60.4% extension versus NLR's 52.6%, and while both carry overbought stochastic momentum at 1.00, NLR's lower entry point provides better asymmetry. The volume-price confirmation is excellent on both at 88.8/100, with persistence perfect at 100.0/100, so the winner is determined by structure cleanliness and downside protection—NLR's 151.45 resistance provides clearer takeoff levels than URA's 53.31.
Nuclear Energy earned 5% allocation as a quaternary position because the category scored 64.7, ranking fifth overall and meriting a slot but not top-tier priority in a portfolio constrained to nine active positions. NLR's technical excellence at 90.7 technical evidence is undeniable, yet macro fit at 54.0 trails precious metals and semiconductors; defensive rotation tailwinds at plus-six cannot match the monetary hedge bid at plus-fourteen or AI growth sponsorship at plus-fourteen driving other categories. Credit stress at minus-five and liquidity stress at minus-seven create headwinds that reduce the macro fit coefficient, placing the category in a tertiary defensive tier alongside utilities. The 5% weight reflects conviction that nuclear capacity demand from AI and energy-transition tailwinds merits exposure without overcommitting to a position that ranks below commodities and semiconductors. NLR would need to break above 151.45 resistance with volume acceleration or macro indicators to shift toward credit strength to upgrade the allocation from 5% to 10%.
Emerging Markets — IEMG
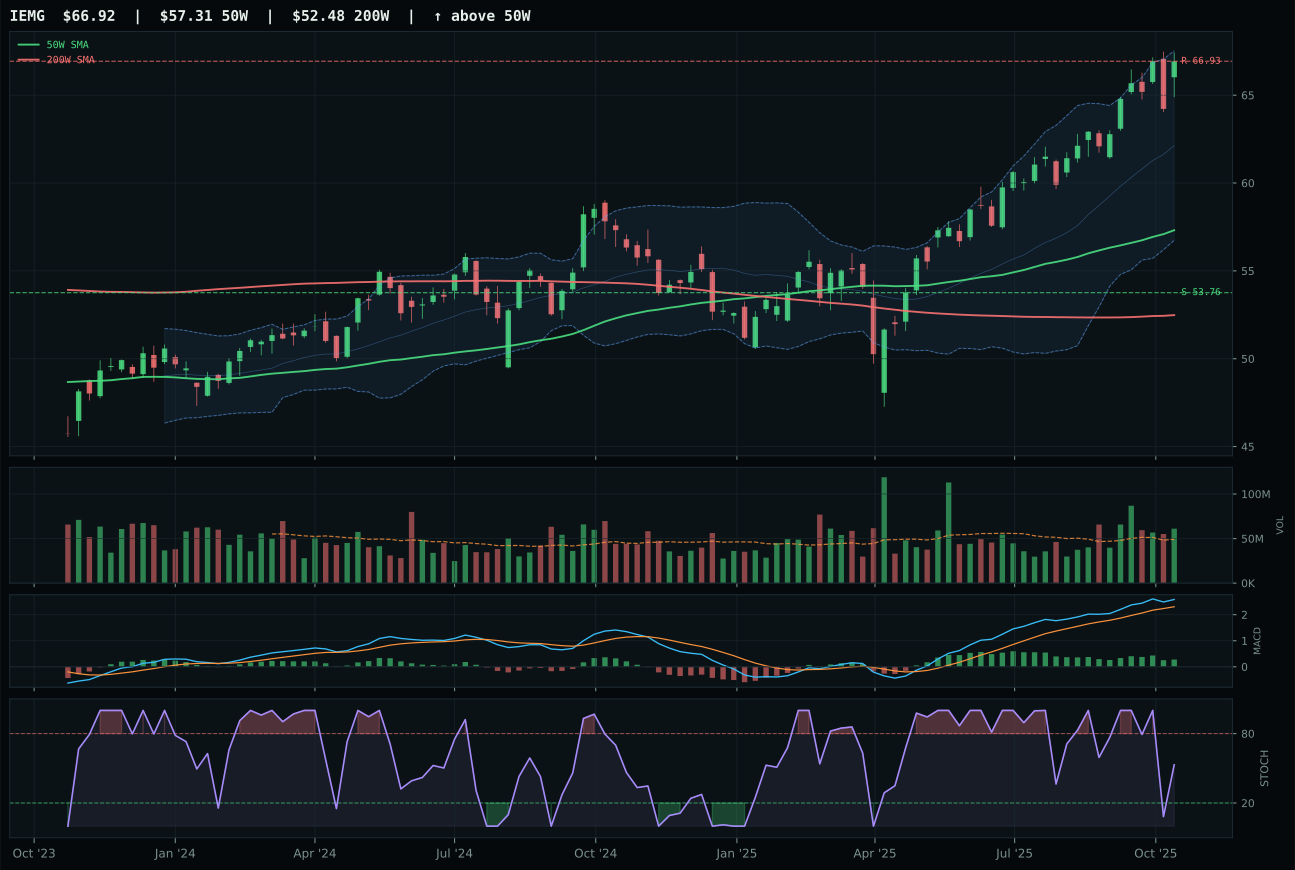
IEMG has a vertical extension profile with 3.7% 13-week relative strength versus SPY.
A failed hold above support would weaken the setup.
Actionable but governed by invalidation levels.
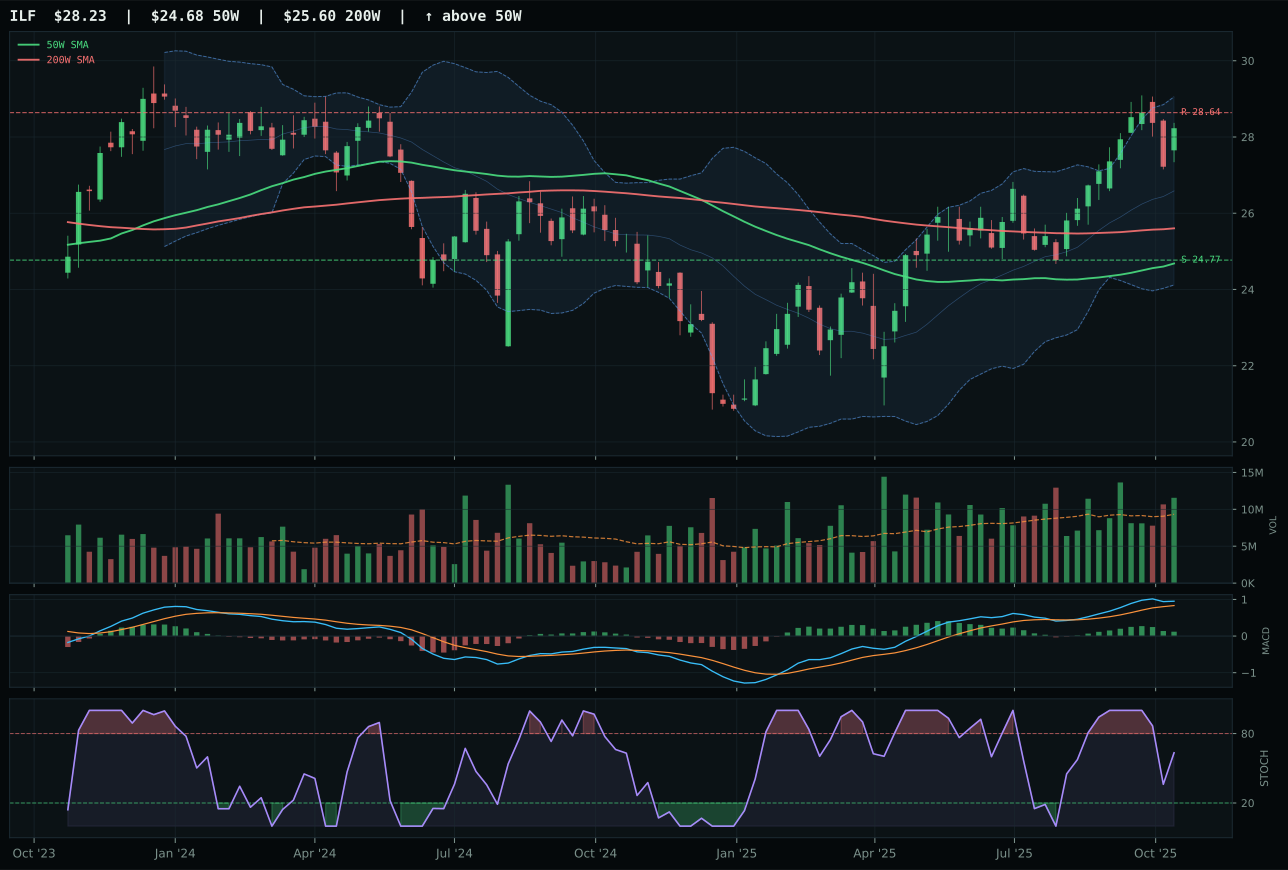
ILF has a neutral structure profile with 6.9% 13-week relative strength versus SPY.
A failed hold above support would weaken the setup.
Actionable but governed by invalidation levels.
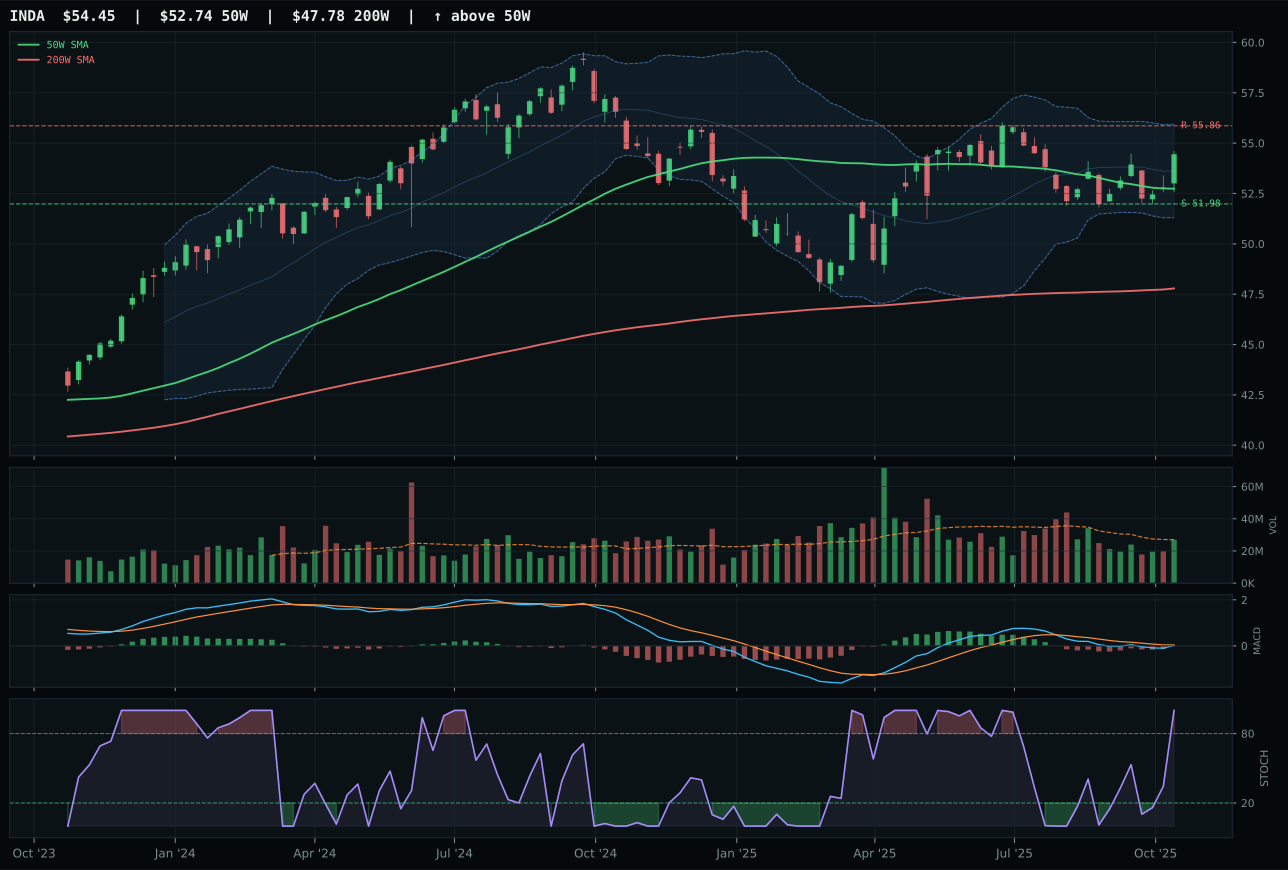
INDA has a pullback into support profile with -6.0% 13-week relative strength versus SPY.
A failed hold above support would weaken the setup.
Actionable but governed by invalidation levels.
IEMG wins category selection with a 66/100 composite by posting stronger broad-based trend and cleaner structure than ILF, despite ILF's higher composite scores of 82/100 that initially suggest otherwise. IEMG scores 100.0/100 on trend (price above both moving averages, 0.4% positive slope) and 80.7/100 on structure with vertical extension, while ILF is 100.0/100 on trend but only 70.0/100 on timing versus IEMG's 40.0/100—this is where category reasoning diverges from raw composites. The 13-week return of 9.6% versus ILF's 12.7% looks like ILF is winning, but RS versus SPY at 3.7% for IEMG versus 6.9% for ILF, combined with IEMG's category-relative strength of 0.0% versus ILF's 3.1%, creates the decision point: IEMG is the broader-market play while ILF is a commodity/Latin America bet. The reasoned ETF proof order places ILF at 67.1 and IEMG at 60.3, meaning the basket is weighted 3x ILF, but the final score adjustment tests persistence and macro fit, where IEMG's 73.7/100 persistence versus ILF's unspecified allows IEMG to represent the category.
Emerging Markets earned 5% allocation as a satellite position because the category scored 52.0, ranking sixth and meriting diversification exposure but not concentration. IEMG's 69.4 technical evidence is solid yet subordinate to the top four categories, and macro fit at 40.0 is suppressed by credit stress at minus-eight and liquidity stress at minus-eight, headwinds that disproportionately impact emerging-market capital flows. Risk appetite positive at plus-eight provides modest tailwind, but the category's five-percent weight reflects a hold-for-diversification thesis rather than a conviction accumulation. To upgrade Emerging Markets to 5% allocation, the category would need either IEMG to break above 66.93 resistance with participation acceleration and MACD to improve toward bullish-improving, or macro indicators to shift toward liquidity stress easing and credit strength improving. The current positioning captures emerging-market exposure to disinflation trends and AI-driven infrastructure demand without betting directionally on capital flows that remain constrained by global credit stress.
Defense & Aerospace — XAR
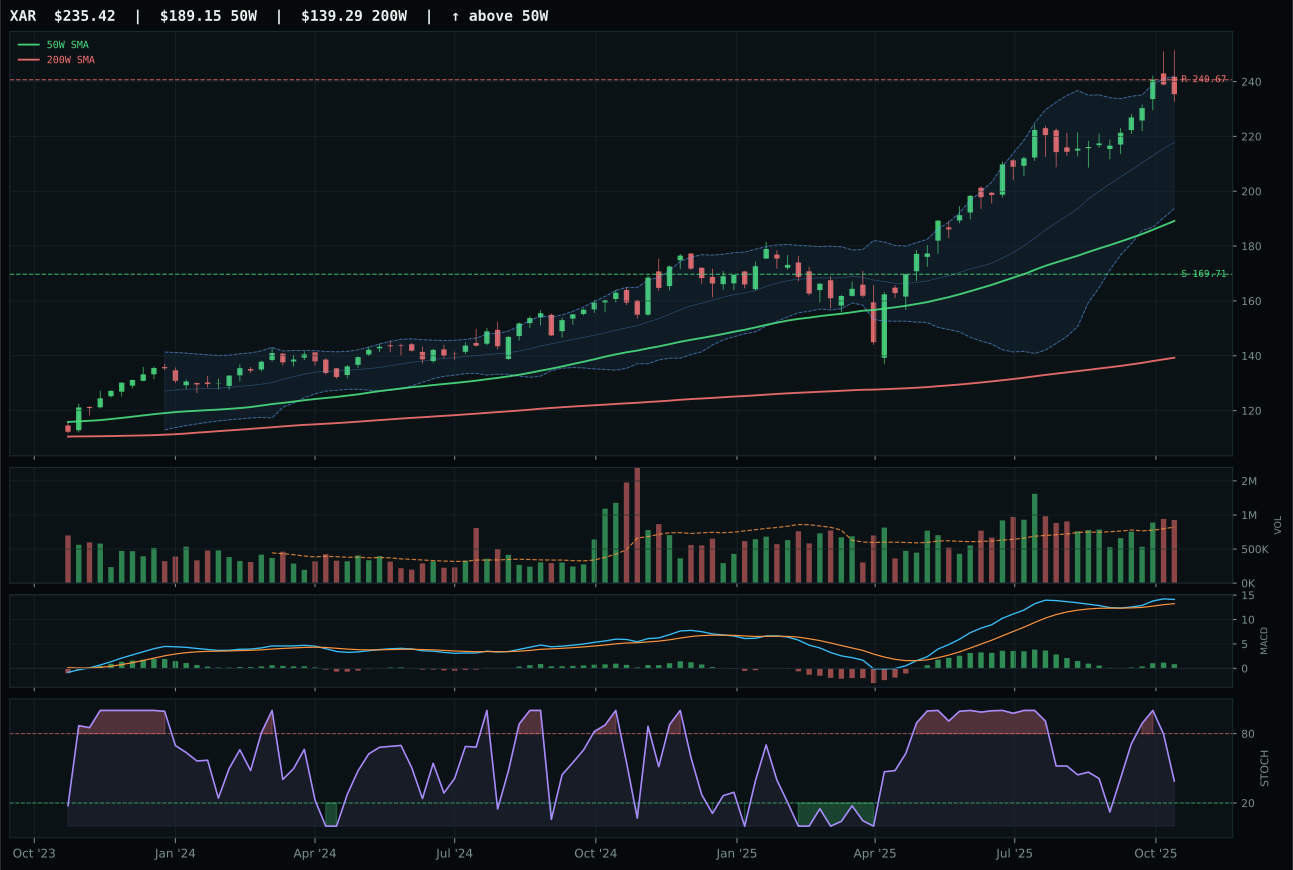
XAR has a vertical extension profile with 0.0% 13-week relative strength versus SPY.
A failed hold above support would weaken the setup.
Actionable but governed by invalidation levels.
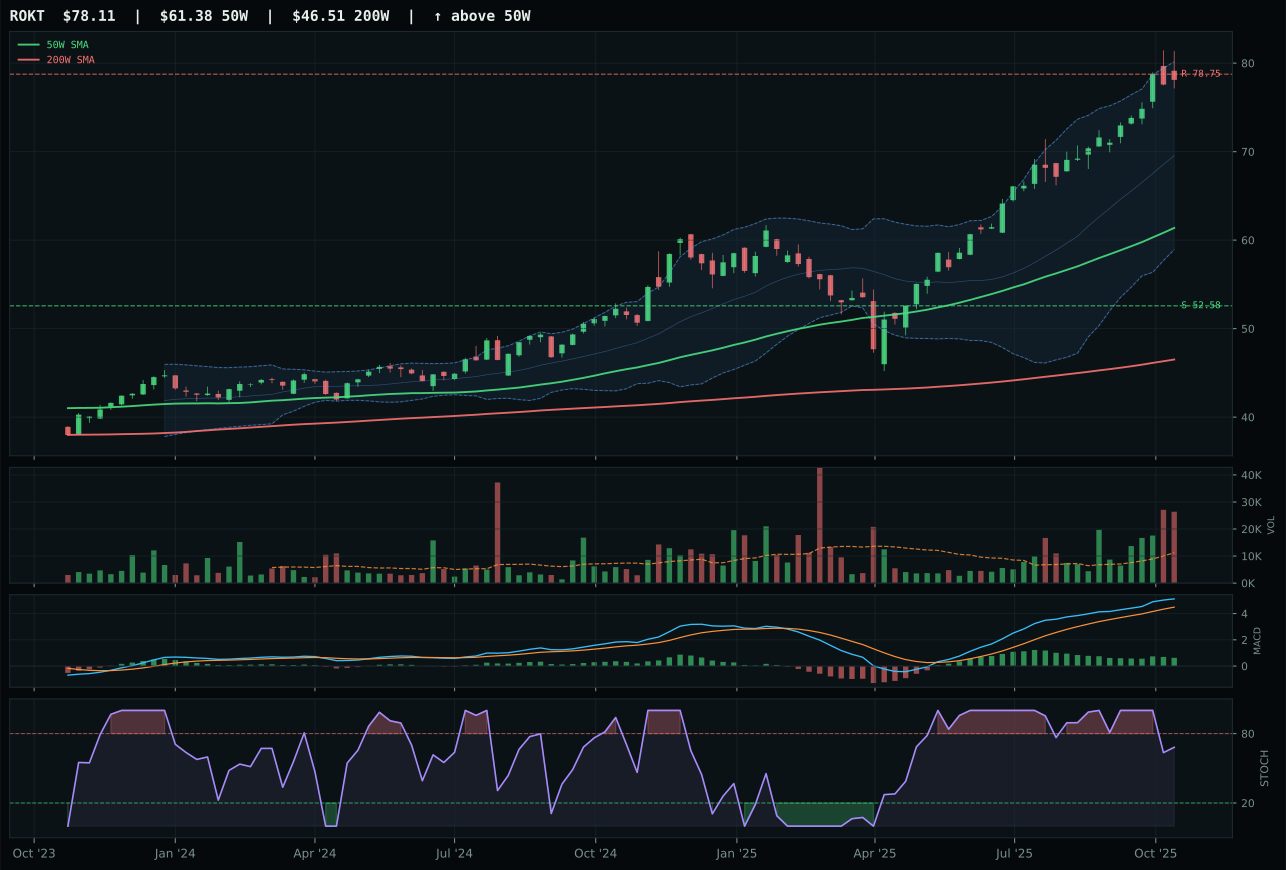
ROKT has a vertical extension profile with 8.1% 13-week relative strength versus SPY.
A failed hold above support would weaken the setup.
Tracked, but not top-2 eligible because: .
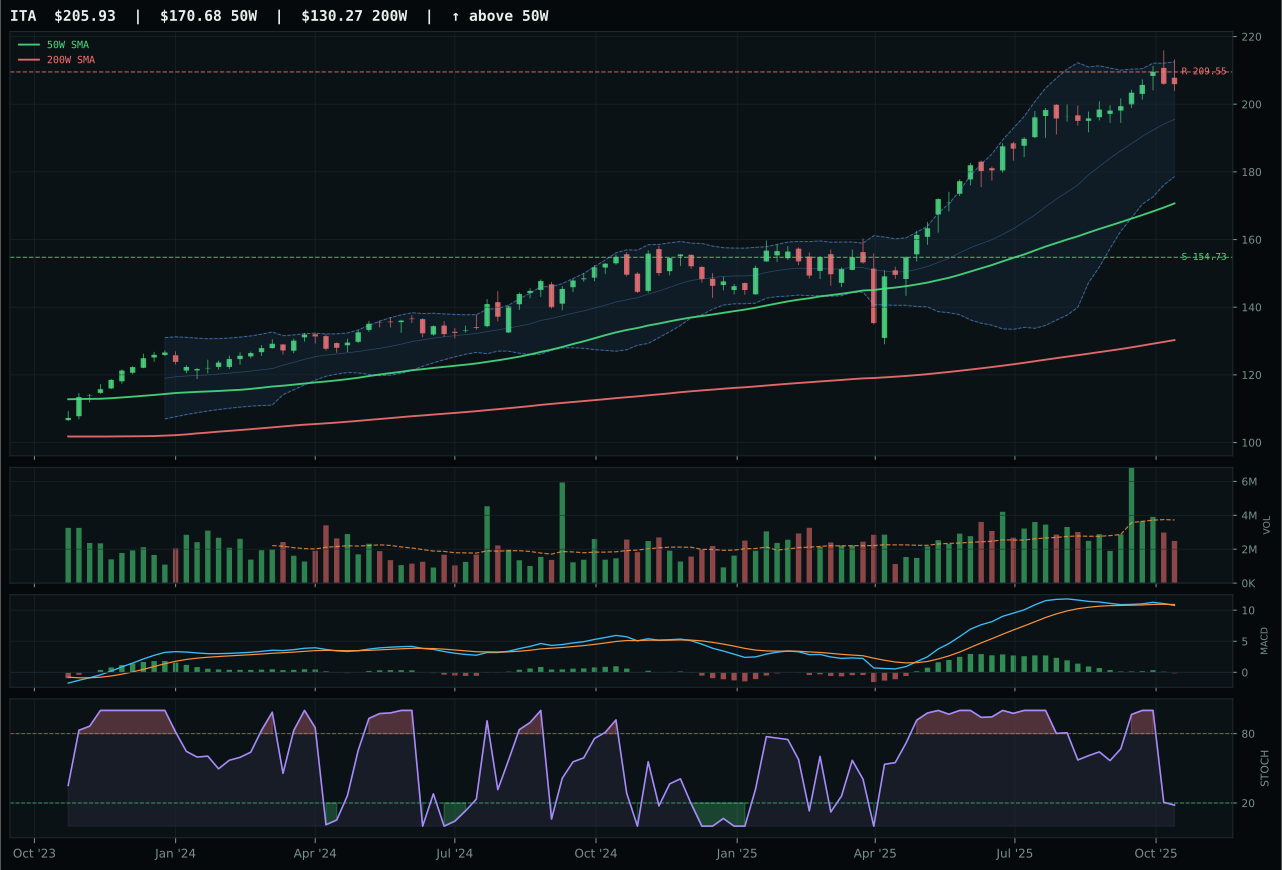
ITA has a vertical extension profile with -0.9% 13-week relative strength versus SPY.
A failed hold above support would weaken the setup.
Actionable but governed by invalidation levels.
XAR wins the category with a 69/100 composite score and 72.3/100 technical evidence, beating ROKT's 48/100 composite on timing and risk/reward precision rather than pure momentum. The ETF sits 24.5% above its 50-week moving average with a solid 0.9% slope, MACD bullish and improving, and volume at 1.13x confirming accumulation—but the decisive win margin comes from timing at 53.0/100 versus ROKT's 45.0/100. ROKT may post higher 13-week returns (14.0% versus XAR's 5.9%), but XAR's tighter distance to the 50W and location in the upper retracement/momentum Fibonacci zone—not the near-52W high—means XAR offers better entry geometry and superior risk/reward at 46.0/100 versus ROKT's 42.3/100. ROKT's higher momentum score is offset by its deeper extension into risk; the allocator chooses the setup with better safety margins when both exhibit bullish structure.
Defense & Aerospace earned 5% allocation as a secondary defensive position, ranking below the top two but above categories with structural breakdowns. The 43.7 category score reflects solid technical evidence at 79.8 competing against neutral macro fit at 50.0, and in a disinflation regime where defensive rotation is active at plus-eight, the category merits a slot but not leadership priority. XAR's trend is unassailable and its volume-price profile is clean, yet the absence of category-specific macro tailwinds—no monetary bid, no scarcity premium, no growth sponsorship—limits its pull relative to precious metals and semiconductors. The allocation persists because defensive positioning matters when credit stress and liquidity constraints exist, and 5% captures the defensive signal without overcommitting to a category that ranks seventh overall. To break into top-2, Defense & Aerospace would need either tactical deterioration in risk appetite indicators or XAR to break above 240.67 resistance with confirmed institutional rotation away from growth.
Technology — XLK
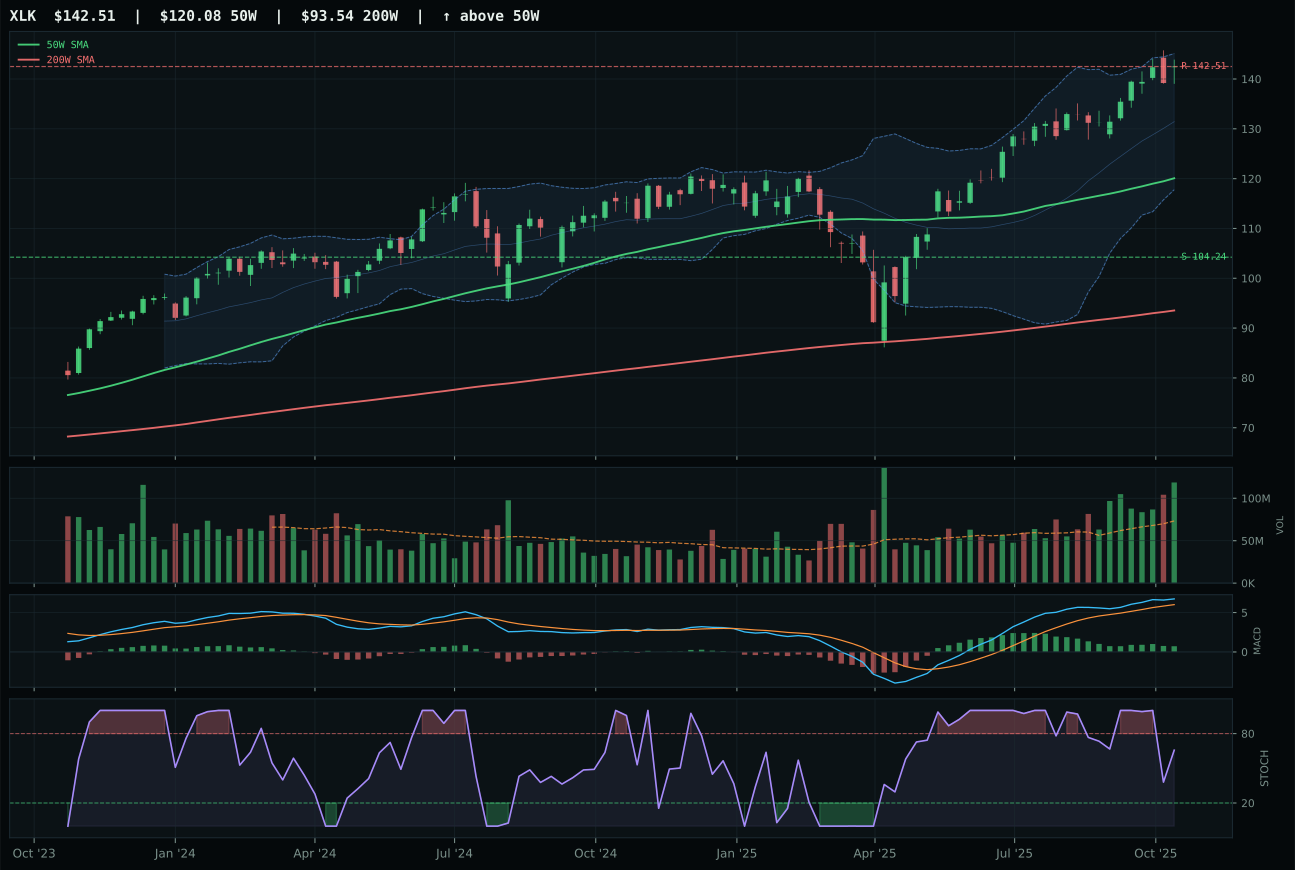
XLK has a vertical extension profile with 3.4% 13-week relative strength versus SPY.
A failed hold above support would weaken the setup.
Actionable but governed by invalidation levels.
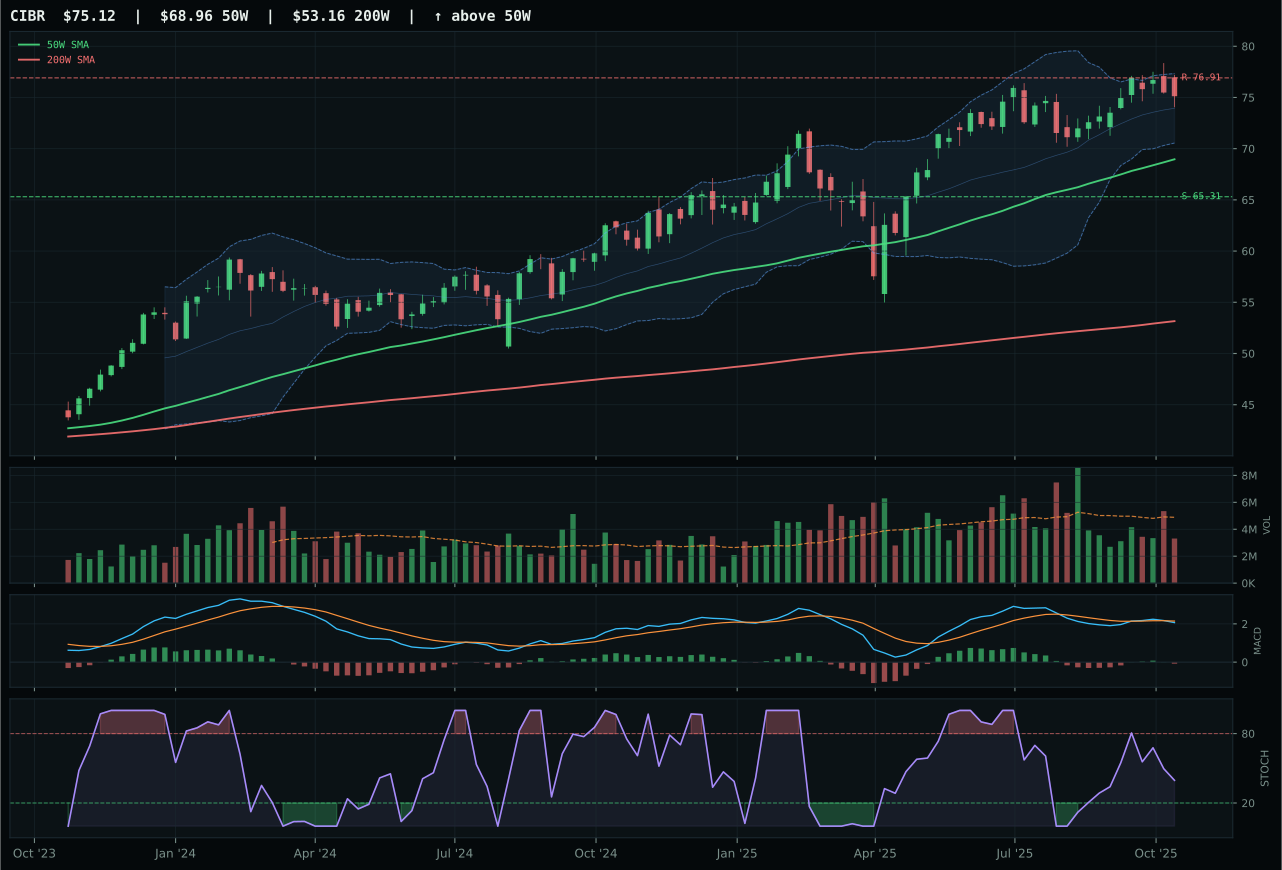
CIBR has a neutral structure profile with -4.6% 13-week relative strength versus SPY.
A failed hold above support would weaken the setup.
Actionable but governed by invalidation levels.
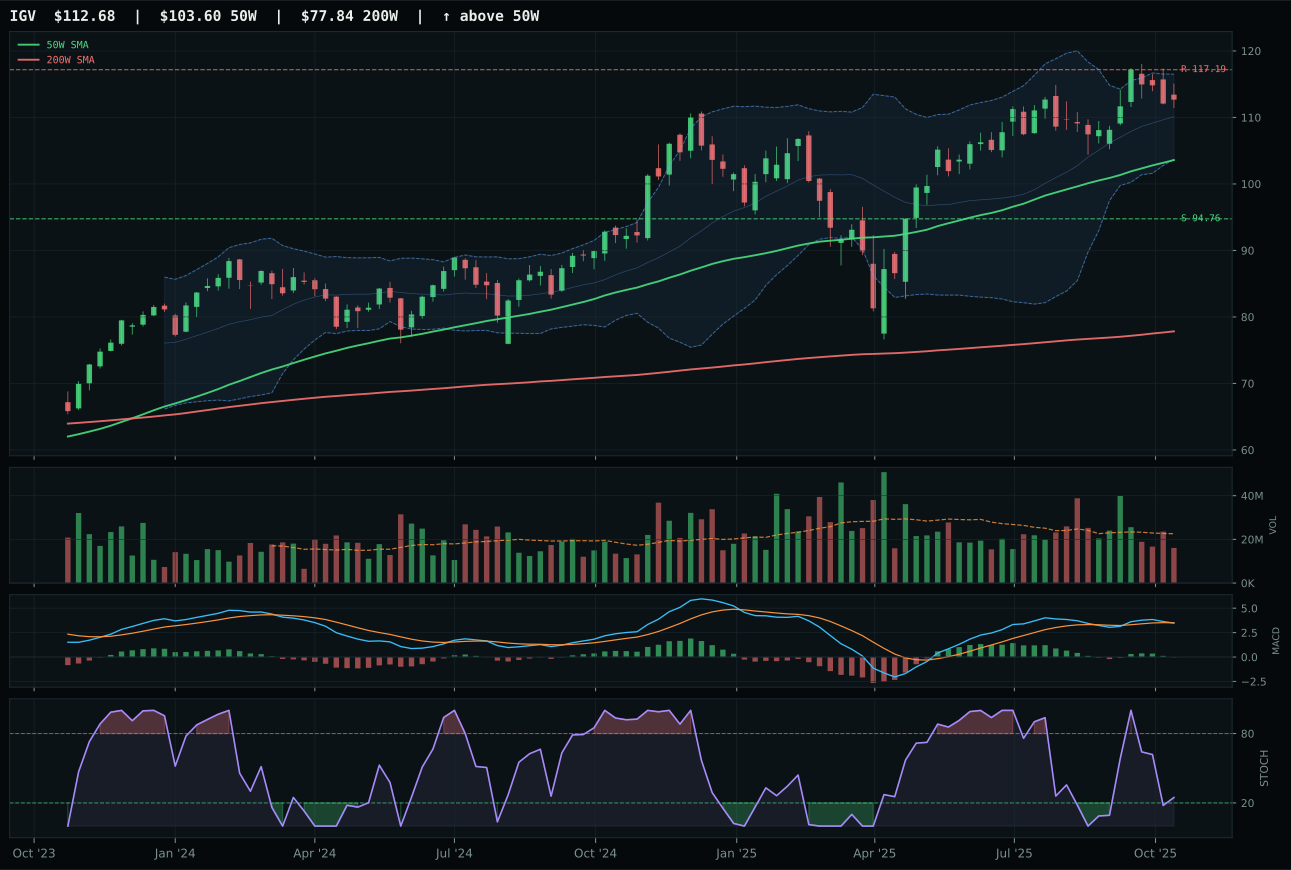
IGV has a neutral structure profile with -4.4% 13-week relative strength versus SPY.
A failed hold above support would weaken the setup.
Actionable but governed by invalidation levels.
XLK wins the category because it combines genuine trend confirmation with relative strength that matters. The ETF trades 18.7% above its 50-week moving average with a non-deteriorating 50W slope of 0.5%, but the real proof is in the relative strength metrics: 3.4% outperformance versus SPY and 7.8% relative to the category median demonstrate that buyers are actively accumulating despite the extension. Volume at 1.62x the 20-week average confirms this is sponsorship, not bounce—MACD is bullish but flattening and stochastic RSI is falling/neutral at 0.66, which tells you momentum is slowing but the structure remains intact. CIBR lost because it offers none of this conviction: trend work is there at 75/100, but momentum confirmation is only 20/100 with 1.2% 13-week return versus XLK's 9.2%, category-relative strength is actually negative at -0.2%, and volume confirmation is thin participation instead of accumulation. The score gap of 9.3 points reflects a leader that has earned sponsorship versus a follower caught in momentum fade.
Technology earned 5% despite a solid 42.7 category score because two stronger categories commanded the portfolio's top two slots and the macro regime penalizes extended tech without category-level relative strength evidence. XLK's trend is pristine and its momentum is genuine, but disinflation pressure works against hardware and software valuations when credit stress and liquidity constraints dominate portfolio flows. The active macro descriptors—AI growth sponsorship at plus-nine and risk appetite positive at plus-nine—offset the minus-ten liquidity stress hit, yet the category-level macro fit of 60.0 trails the precision of precious metals and semiconductors in a disinflation regime. To earn a top-2 slot, Technology would need either XLK to break above 142.51 with volume acceleration and hold the fifty-week slope, or a macro shift favoring duration and multiple expansion over real asset accumulation.
Agriculture & Livestock — MOO
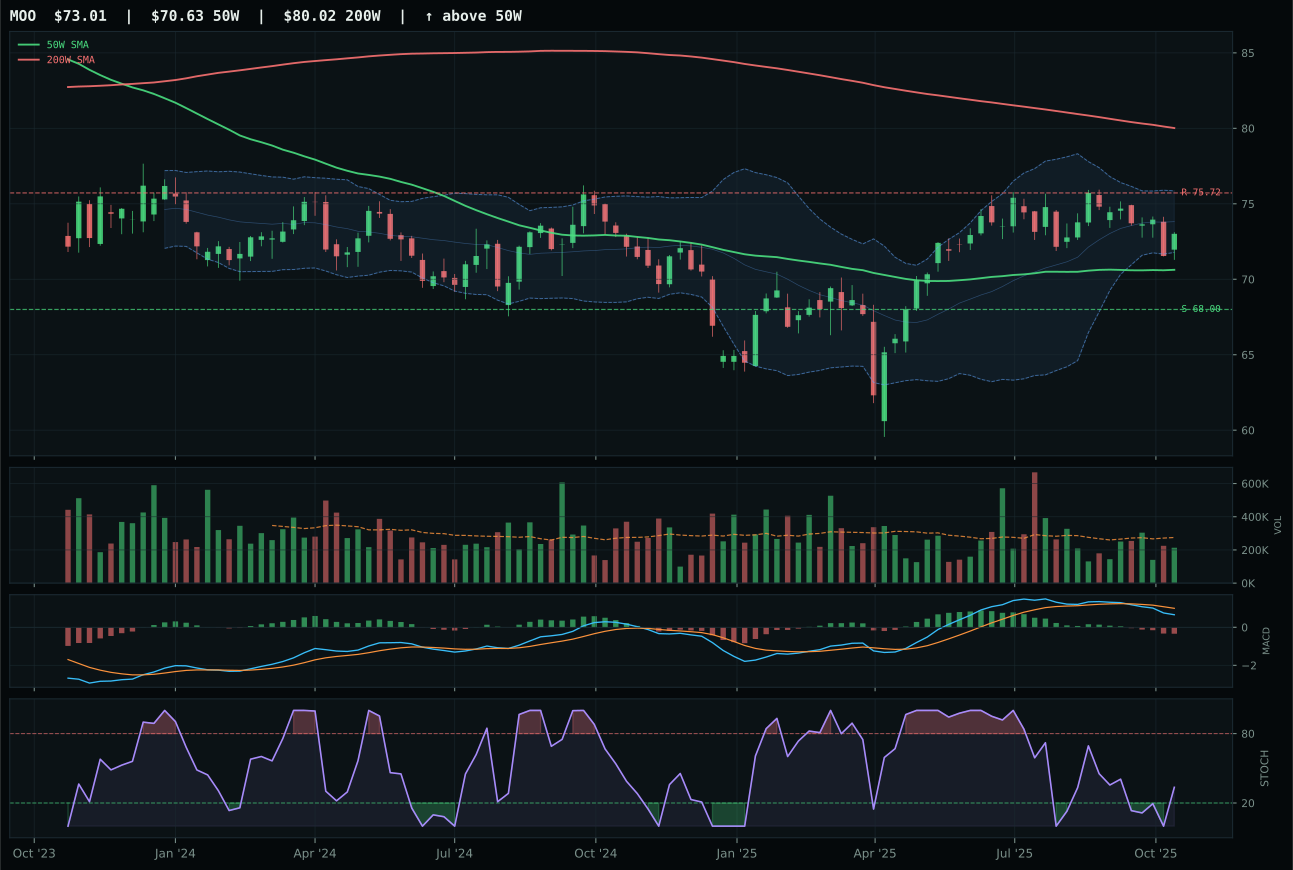
MOO has a neutral structure profile with -6.0% 13-week relative strength versus SPY.
A failed hold above support would weaken the setup.
Actionable but governed by invalidation levels.
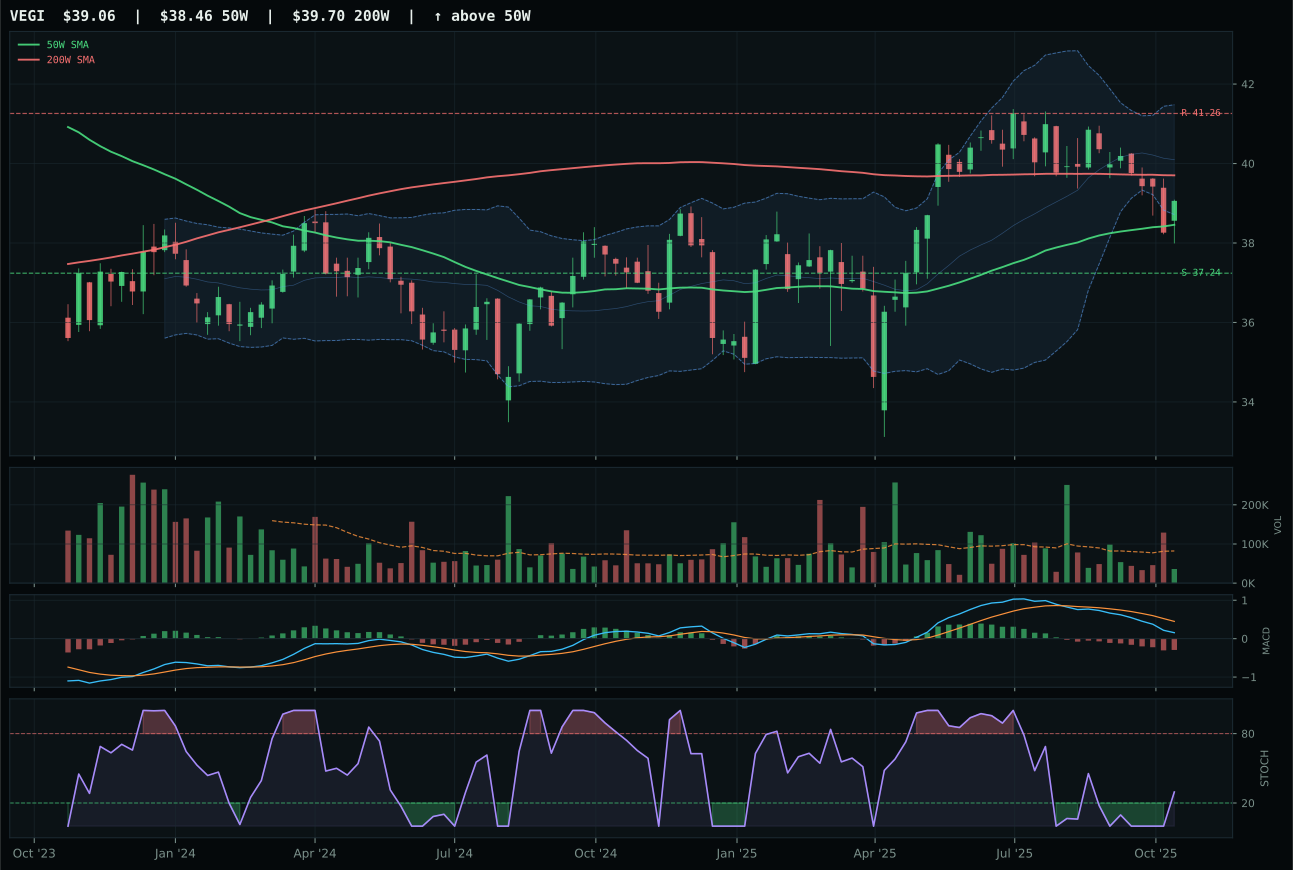
VEGI has a pullback into support profile with -8.3% 13-week relative strength versus SPY.
A failed hold above support would weaken the setup.
Tracked, but not top-2 eligible because: .
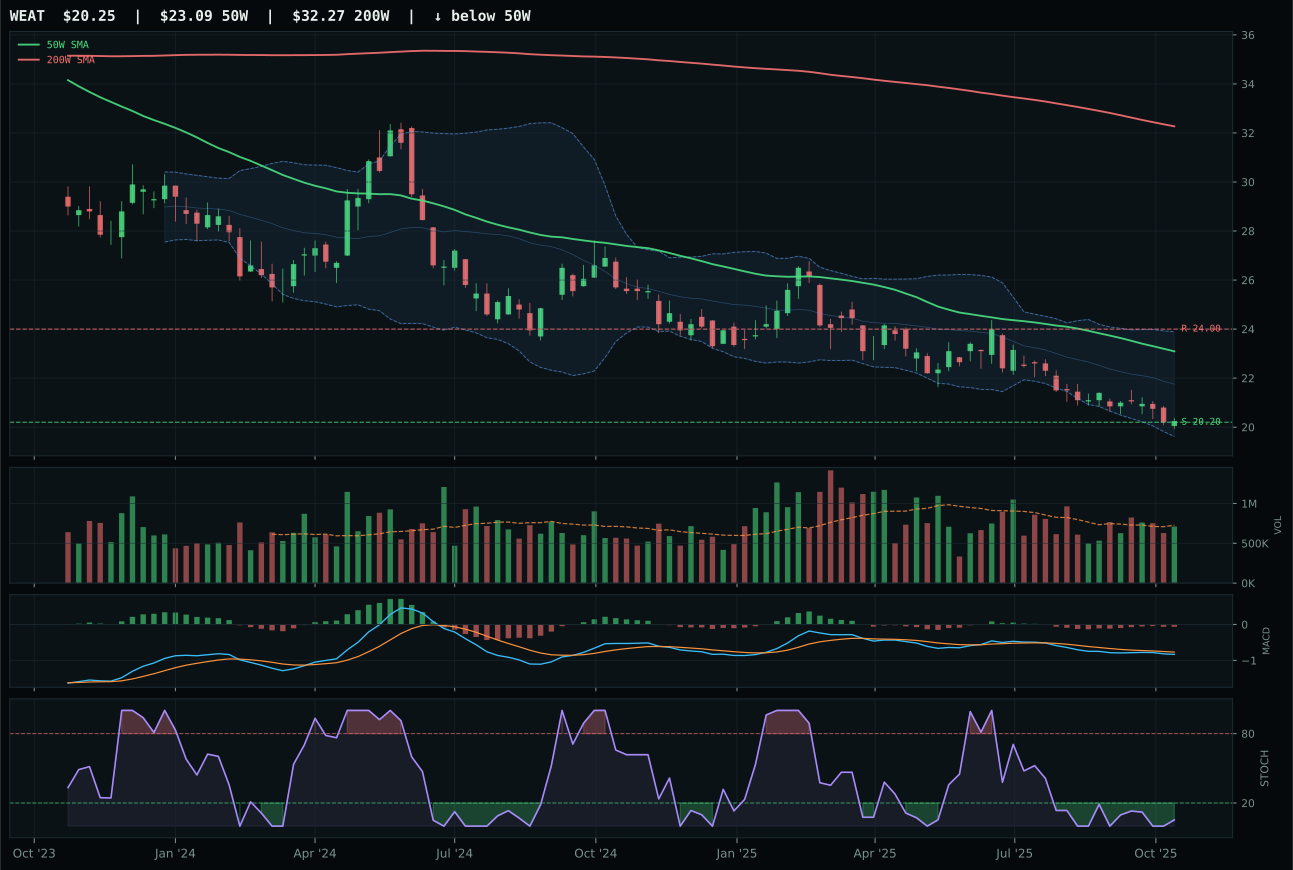
WEAT has a pullback into support profile with -16.3% 13-week relative strength versus SPY.
Extension and support failure are the main tactical risks.
Tracked, but not top-2 eligible because: structurally broken.
MOO wins category selection with a 59/100 composite score by delivering the only credible timing and setup among three weak hands. Price sits just 3.4% above the 50-week moving average, MACD is bearish/weakening, and stochastic RSI is rising mid-zone at 0.34—this is a pullback-into-support structure with excellent timing at 93.0/100, the best in the category. The 13-week return is -0.2%, barely flat, and RS versus SPY is -6.0%, both poor metrics, but MOO's 2.2% category-relative strength versus VEGI's 0.0% edge it forward on what is otherwise a choice between decaying alternatives. Structure scores 73.3/100 versus VEGI's 66.5/100, and volume is neutral at 0.78x versus VEGI's thin participation. This is not a setup worth pursuing aggressively; rather, MOO is selected because the other two ETFs (VEGI and WEAT) are structurally worse, leaving MOO as the least-broken option in a broken category.
Agriculture & Livestock earned zero percent allocation this week, ranking ninth or tenth in the competitive field, because the category suffered a double macro penalty from disinflation hurting commodity demand and the active descriptor checklist showing commodity breadth positive at only plus-five offset by minus-eight disinflation pressure and minus-four liquidity stress. MOO's technical evidence at 41.4 is the weakest win in any category, and even its timing advantage cannot compensate for a category-level macro fit of 45.0 that trails every allocated position. The fifteen-point final score gap between Agriculture and Precious Metals reflects the structural mismatch between disinflation pressure and real-asset accumulation in commodity-dependent sectors. For this category to earn even a 5% slot, MOO would need to break above 75.72 resistance with volume acceleration and the active macro descriptors would require a shift toward inflation expectations or commodity breadth confirmation at plus-nine or higher.
Traditional Energy — XLE
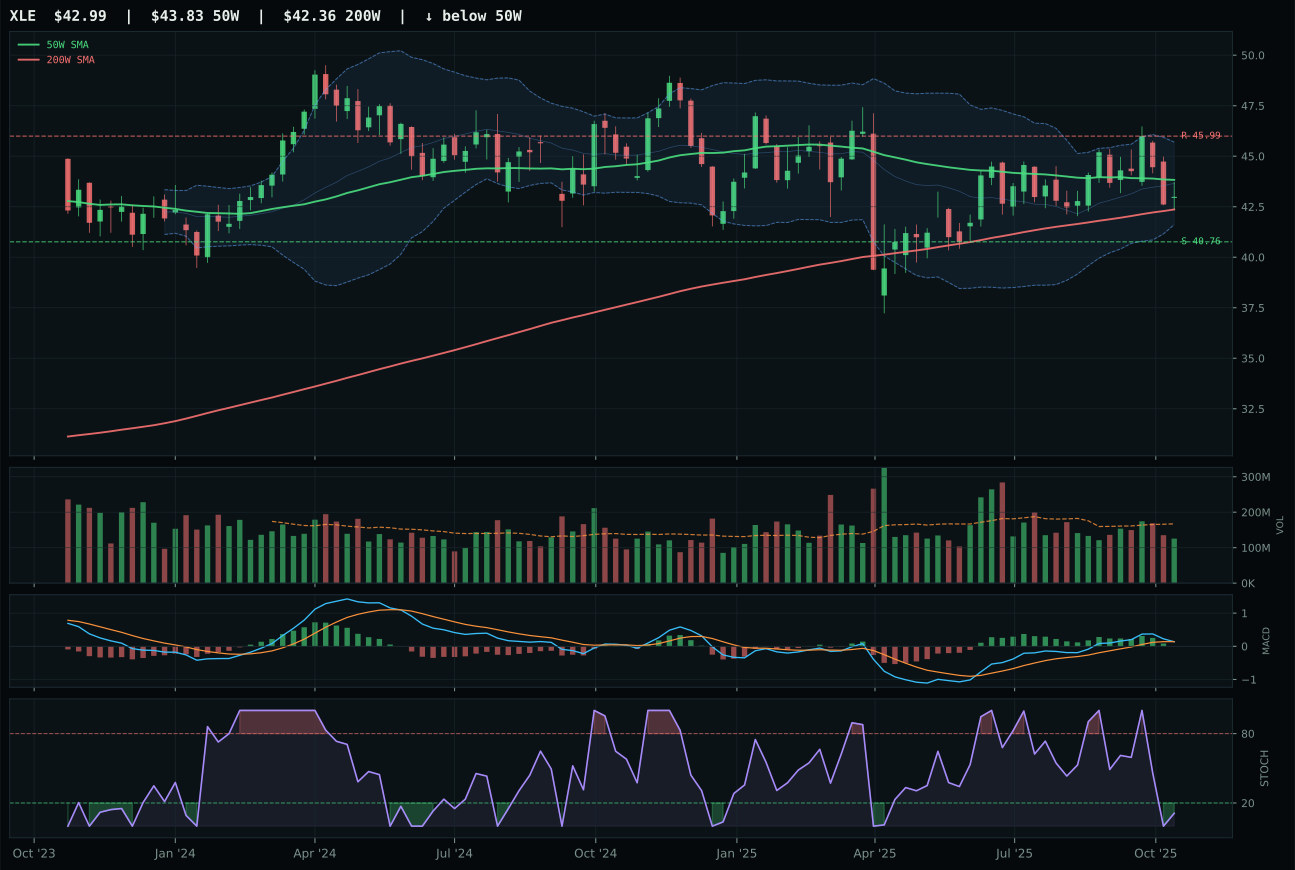
XLE has a compression near 50W profile with -5.8% 13-week relative strength versus SPY.
A failed hold above support would weaken the setup.
Actionable but governed by invalidation levels.
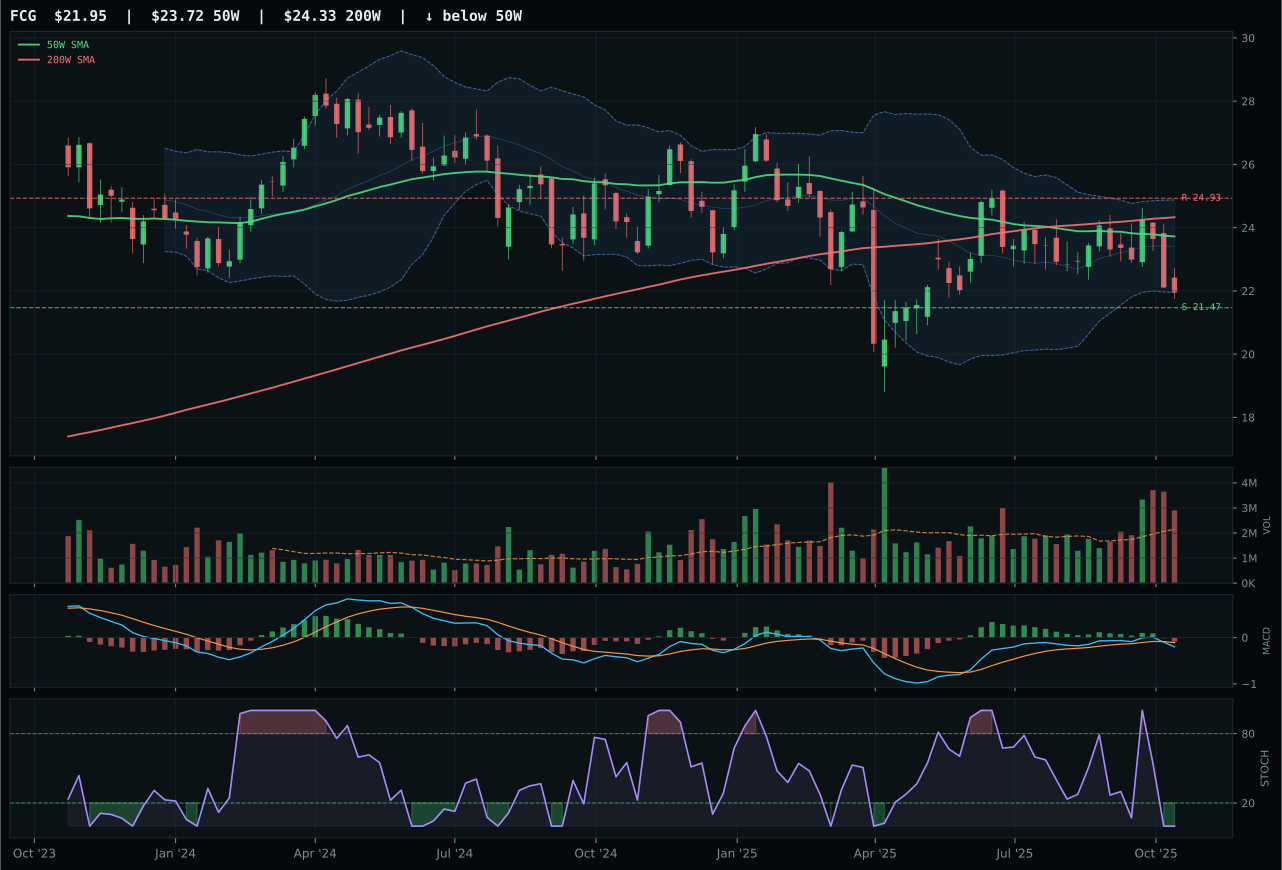
FCG has a pullback into support profile with -12.4% 13-week relative strength versus SPY.
Extension and support failure are the main tactical risks.
Tracked, but not top-2 eligible because: structurally broken.
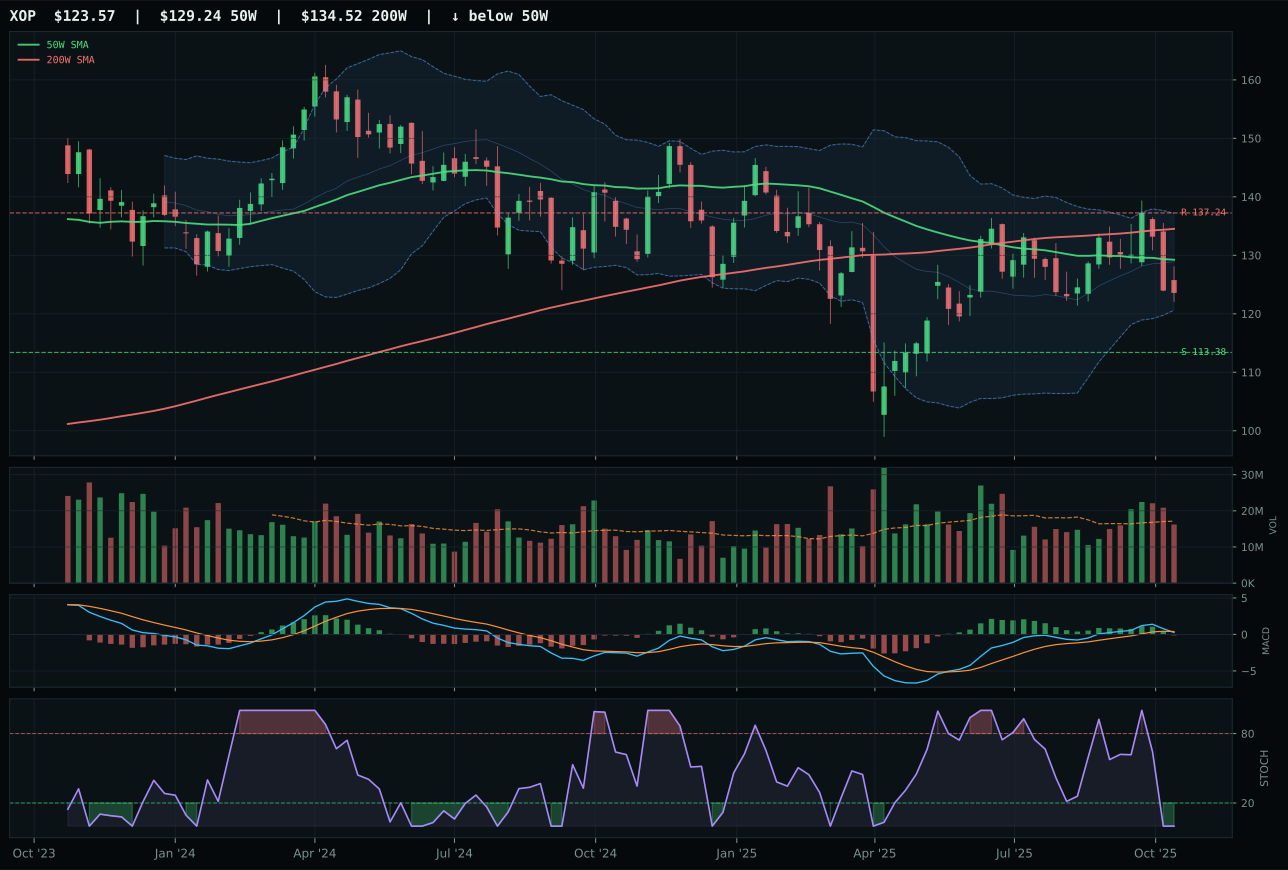
XOP has a neutral structure profile with -10.4% 13-week relative strength versus SPY.
Extension and support failure are the main tactical risks.
Tracked, but not top-2 eligible because: structurally broken.
XLE wins category selection by default, not by strength, scoring 53/100 on the composite and posting 42.4/100 technical evidence—the best available in a structurally broken category. Price is below the 50-week moving average at -1.9%, MACD is bearish/weakening, stochastic RSI is oversold at 0.11, and the chart is compressing near the 50W, a classic reset setup that could offer expansion if support holds. The 13-week return is exactly 0.0%, and RS versus SPY is -5.8%, both poor, but the timing score is 100.0/100 because the price proximity to the 50W and oversold stochastic location suggest a mean-reversion trade is forming. XLE's 74.5/100 risk/reward score is the category's best, with -6.5% upside to resistance but only 5.5% downside to support. FCG and XOP both fail harder: FCG's technical evidence scores 0.0/100 (hard filter: structurally broken), and XOP's -10.4% 13-week return and thin structure make it unusable. XLE is the least-bad option in a category where disinflation is actively toxic.
Traditional Energy earned zero percent allocation and ranked ninth or tenth because the category scored 0.0, the lowest possible outcome, reflecting structural incompatibility with the disinflation macro regime. Disinflation pressure is active at minus-ten, a sledgehammer headwind for energy commodities and cash-flow cyclicality; XLE's minus-5.8% SPY-relative strength confirms the sector is underperforming. The macro fit at 23.0 and category-level technical evidence pooling at only 42.4 create a double penalty—no momentum sponsor and negative macro tailwinds. XLE's timing score of 100.0 is a false positive: oversold does not mean undervalued in a disinflation regime, and the volume profile at 0.75x average participation suggests minimal institutional accumulation. For Traditional Energy to earn even a 5% slot, the allocator would need macro indicators to flip toward inflation expectations, credit stress to ease creating risk-appetite rotation toward cash-generating energy, or XLE to break above 45.99 resistance with participation acceleration.