
2025-10-10
Informational purposes only. The content in this report, including allocations, analysis, and commentary, is provided solely for informational and educational purposes. It does not constitute financial advice, investment advice, trading advice, or any other type of advice. Past performance does not guarantee future results. Always conduct your own research and consult a qualified financial professional before making investment decisions.
Weekly Allocation
| Ticker | Category | Weight | Role |
|---|---|---|---|
| FBTC | 50% | Overlay | |
| SLV | Precious Metals | 10% | Top-2 (10%) |
| URA | Nuclear Energy | 10% | Top-2 (10%) |
| XLU | Utilities & Infrastructure | 5% | Tier-2 (5%) |
| XLK | Technology | 5% | Tier-2 (5%) |
| SMH | AI | 5% | Tier-2 (5%) |
| REMX | Industrial Metals | 5% | Tier-2 (5%) |
| XAR | Defense & Aerospace | 5% | Tier-2 (5%) |
| XLE | Traditional Energy | 5% | Tier-2 (5%) |
Trade Instructions — Monday Open
Sell the tranche from 2025-09-12 (completing its 4-week hold). Buy the new tranche. Instructions show net portfolio changes — same-asset positions cancel, weight changes show the delta.
| Action | Ticker | Instruction |
|---|---|---|
| SELL | COPX | Sell 25% of COPX position (reduce 10.00% → 7.50%) |
| SELL | AIQ | Sell 50% of AIQ position (reduce 5.00% → 2.50%) |
| SELL | GLD | Sell 50% of GLD position (reduce 2.50% → 1.25%) |
| SELL | URNM | Sell entire URNM position (1.25% of portfolio) |
| SELL | CIBR | Sell entire CIBR position (1.25% of portfolio) |
| SELL | PAVE | Sell 50% of PAVE position (reduce 2.50% → 1.25%) |
| SELL | ILF | Sell 33% of ILF position (reduce 3.75% → 2.50%) |
| BUY | URA | Buy URA — 22.22% of freed cash (adds 2.50% to portfolio) |
| BUY | SLV | Buy SLV — 22.22% of freed cash (adds 2.50% to portfolio) |
| BUY | SMH | Buy SMH — 11.11% of freed cash (adds 1.25% to portfolio) |
| BUY | XLE | Buy XLE — 11.11% of freed cash (adds 1.25% to portfolio) |
| BUY | XLU | Buy XLU — 11.11% of freed cash (adds 1.25% to portfolio) |
| BUY | XLK | Buy XLK — 11.11% of freed cash (adds 1.25% to portfolio) |
| BUY | REMX | Buy REMX — 11.11% of freed cash (adds 1.25% to portfolio) |
Current Portfolio After Trade
Combined holdings across all 4 active tranches. Each tranche is 25% of the portfolio.
| Ticker | % of Portfolio | Weight Bar |
|---|---|---|
| FBTC | 50.00% | |
| COPX | 7.50% | |
| SLV | 7.50% | |
| URA | 6.25% | |
| XAR | 3.75% | |
| SMH | 3.75% | |
| XLE | 3.75% | |
| XLU | 3.75% | |
| ILF | 2.50% | |
| AIQ | 2.50% | |
| IGV | 2.50% | |
| XLK | 2.50% | |
| GLD | 1.25% | |
| PAVE | 1.25% | |
| REMX | 1.25% |
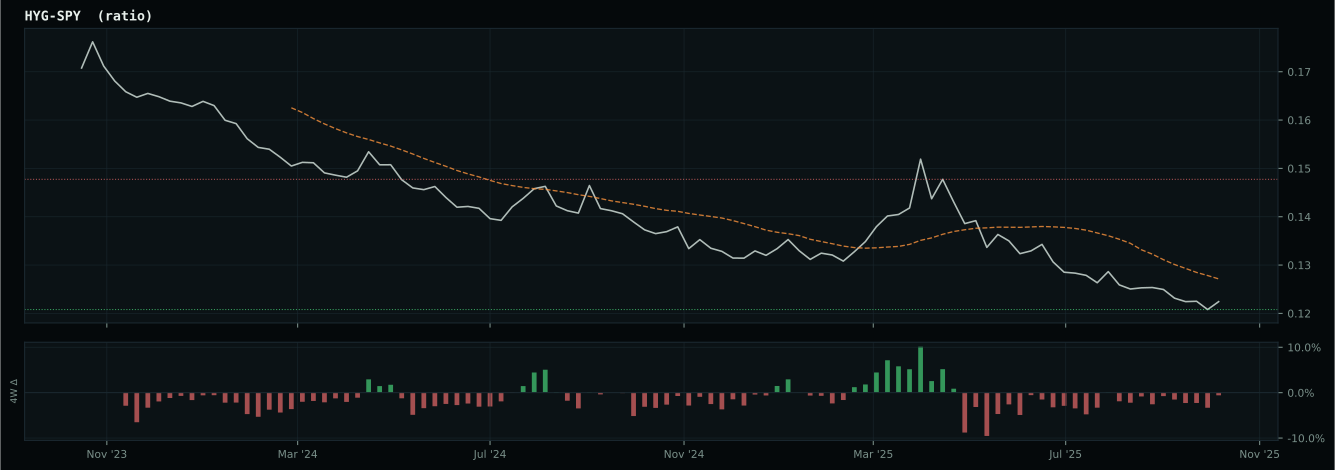
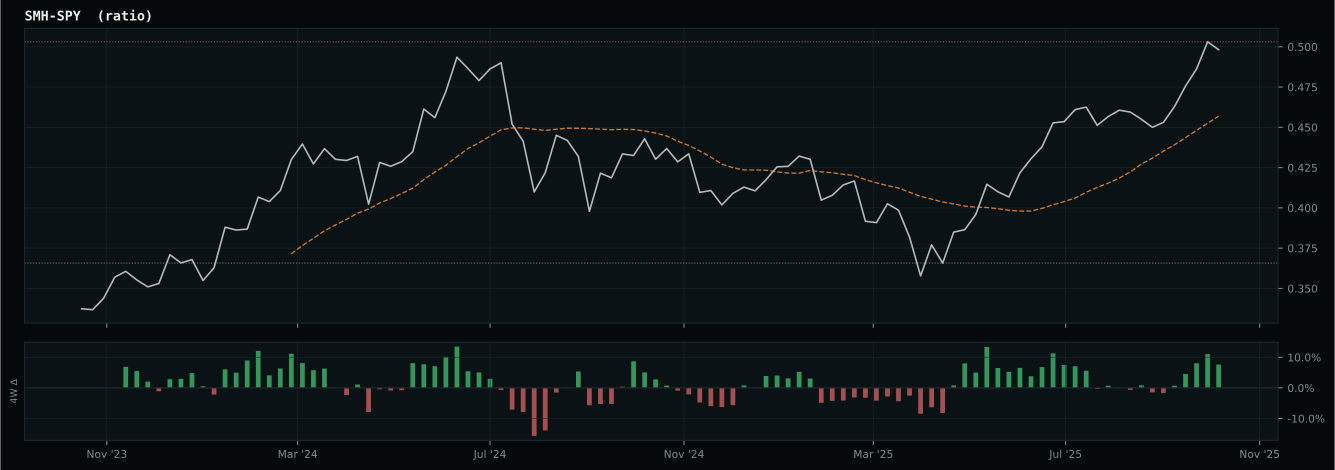
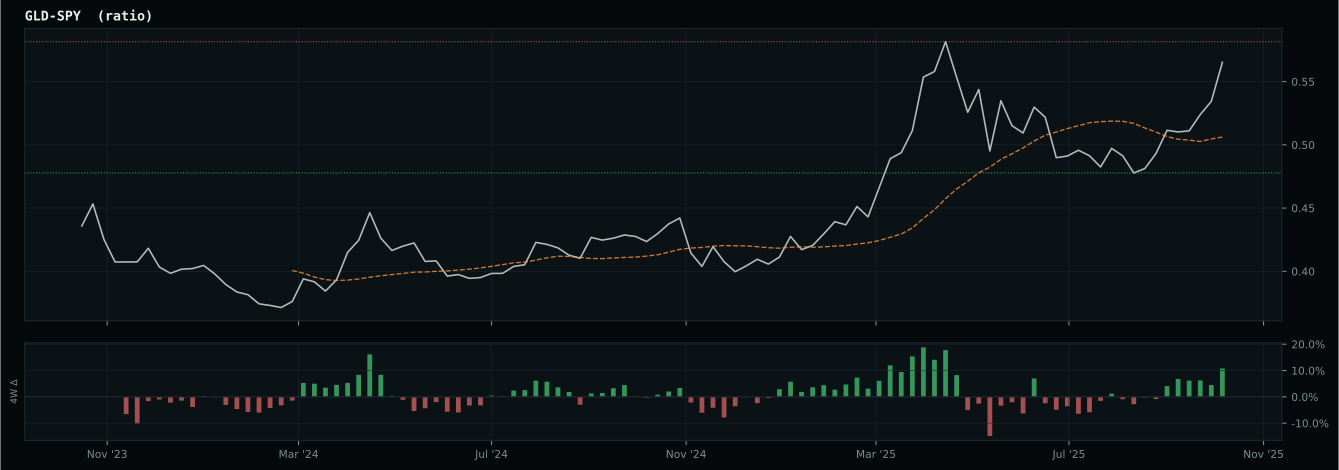
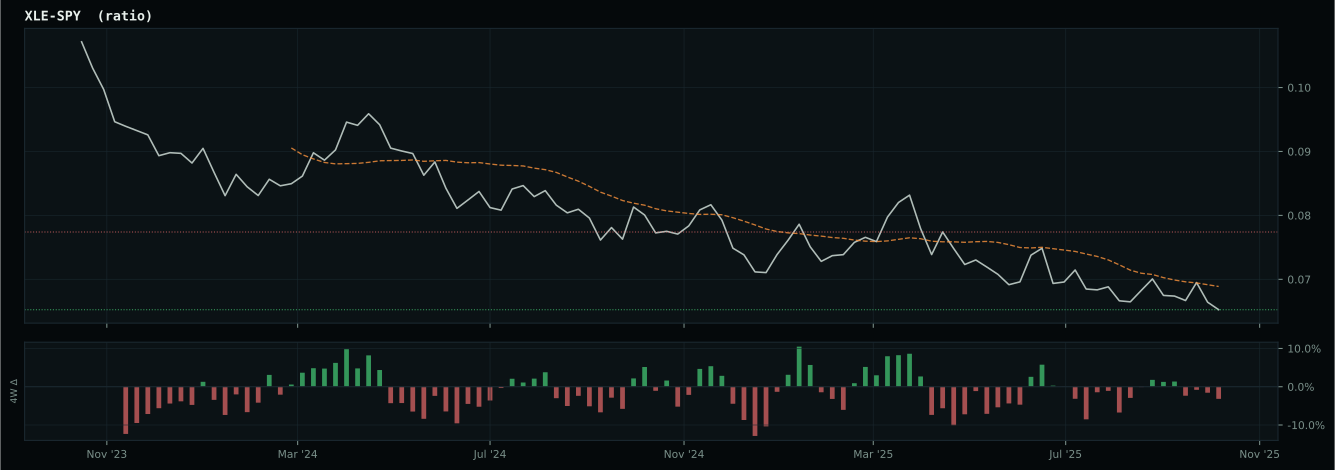
Macro Regime — Disinflation
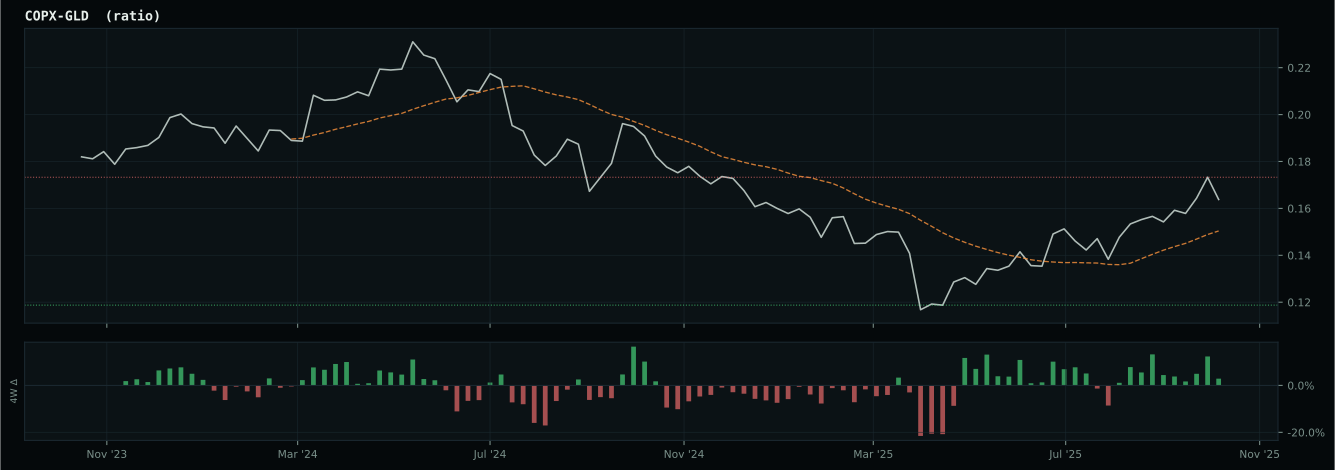
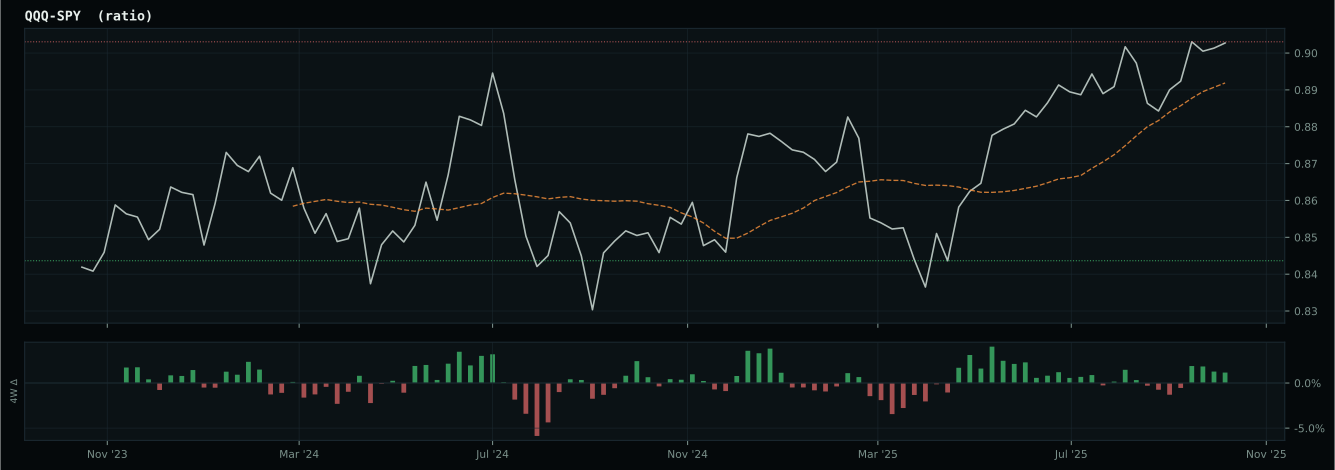
Macro Evidence Charts
Market-implied signals behind the macro regime scores. Each ratio compares two assets; the direction and slope of the ratio is what the macro engine reads.
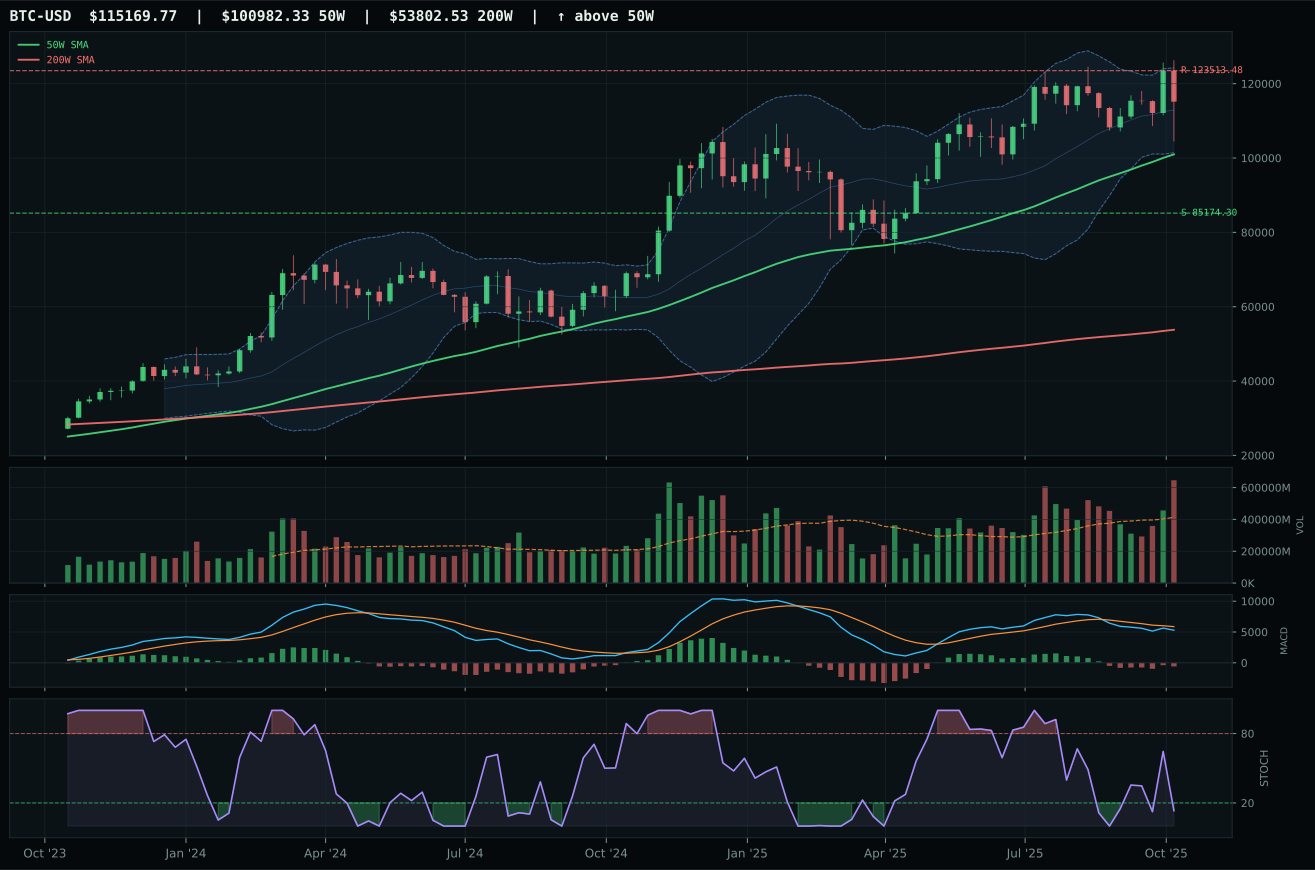
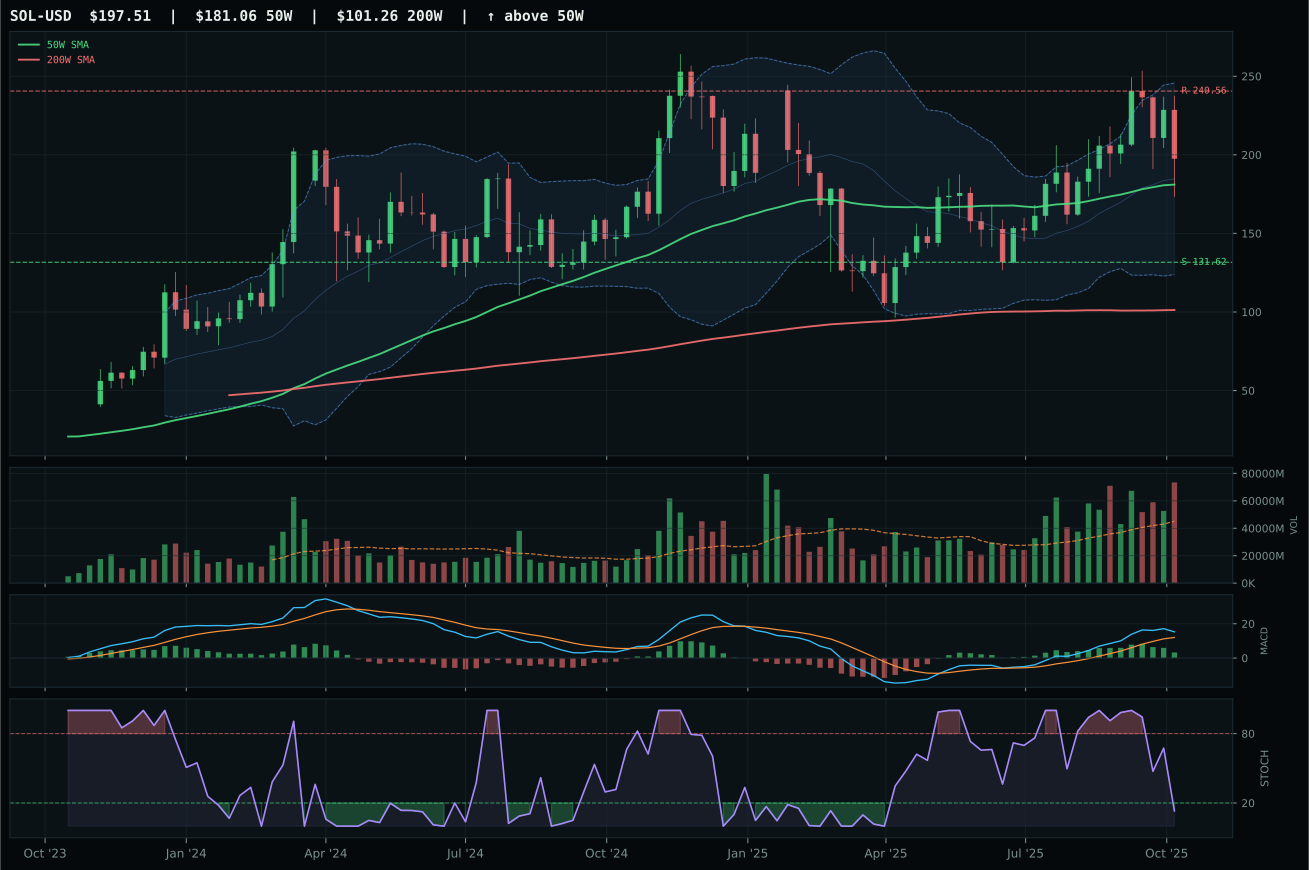
Crypto Regime — TrendBTC
ValueBTC not armed: BTC has not made the first post-breakdown touch of the 200W buy zone after losing the 50W
TrendBTC confirmed: 2 consecutive closes above rising/flat 50W SMA
one or more available conditions failed
Category Rankings
| Rank | Category | Winner | Score | Alloc | 4W Ret | Peers (4W) |
|---|---|---|---|---|---|---|
| 1 | Precious Metals | SLV | 87.1 | 20% | -3.77% | GDX -3.6% · GLD -0.2% |
| 2 | Nuclear Energy | URA | 69.3 | 20% | -9.30% | NLR -7.5% · URNM -9.6% |
| 3 | Utilities & Infrastructure | XLU | 68.2 | 10% | -0.34% | IGF +0.8% · PAVE +2.6% |
| 4 | Technology | XLK | 62.0 | 10% | +3.01% | CIBR -0.8% · IGV -2.4% |
| 5 | AI | SMH | 59.6 | 10% | +5.95% | BOTZ +0.5% · AIQ +3.2% |
| 6 | Industrial Metals | REMX | 57.5 | 10% | -9.41% | PICK -0.3% · COPX -1.8% |
| 7 | Defense & Aerospace | XAR | 50.9 | 10% | -1.77% | ITA +1.4% · ROKT +0.8% |
| 8 | Emerging Markets | IEMG | 38.0 | 10% | +3.27% | ILF +10.5% · INDA +1.8% |
| 9 | Agriculture & Livestock | MOO | 9.2 | 0% | -1.28% | WEAT +6.2% · VEGI +0.4% |
| 10 | Traditional Energy | XLE | — | 0% | +4.54% | XOP +3.8% · FCG +4.1% |
Precious Metals — SLV
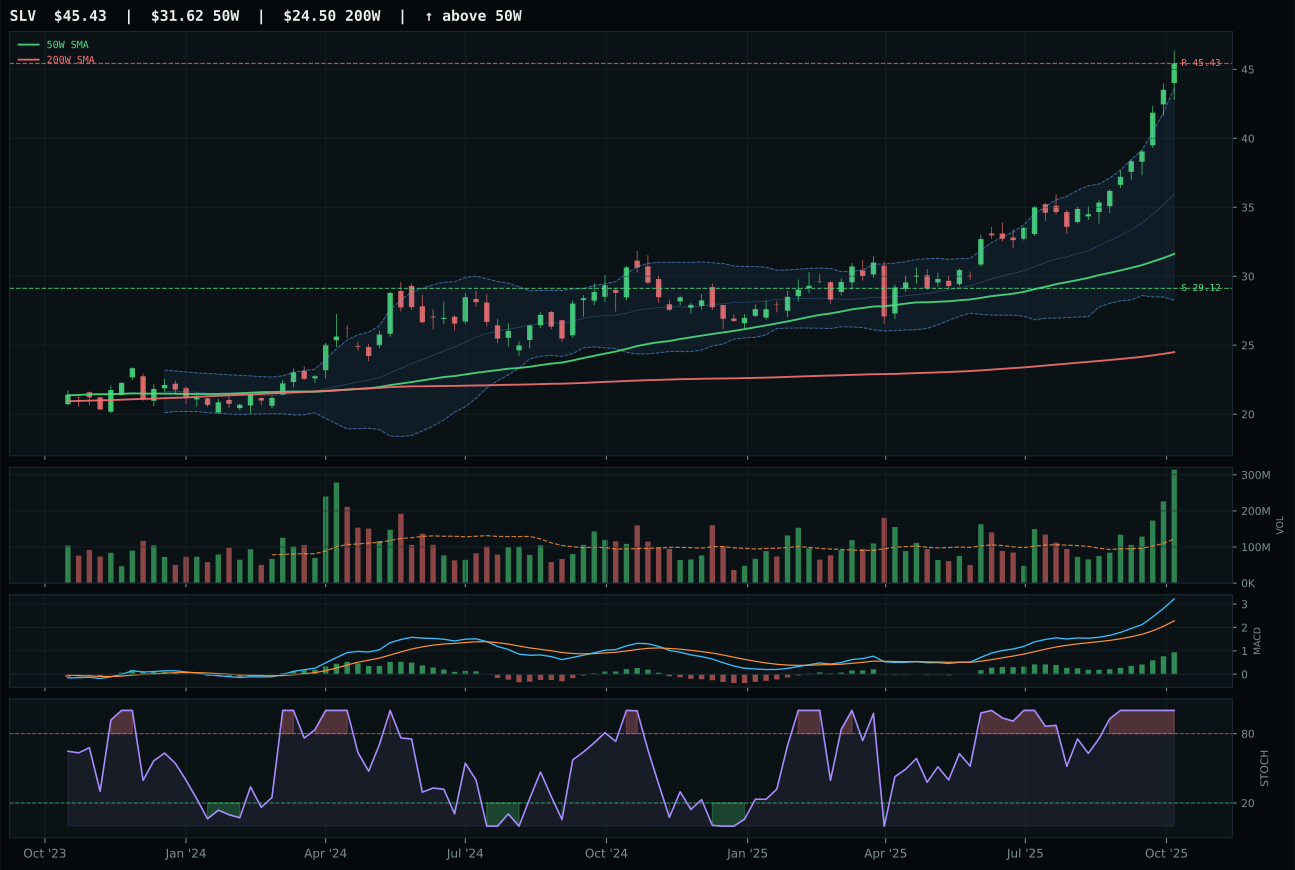
SLV has a vertical extension profile with 25.0% 13-week relative strength versus SPY.
A failed hold above support would weaken the setup.
Actionable but governed by invalidation levels.
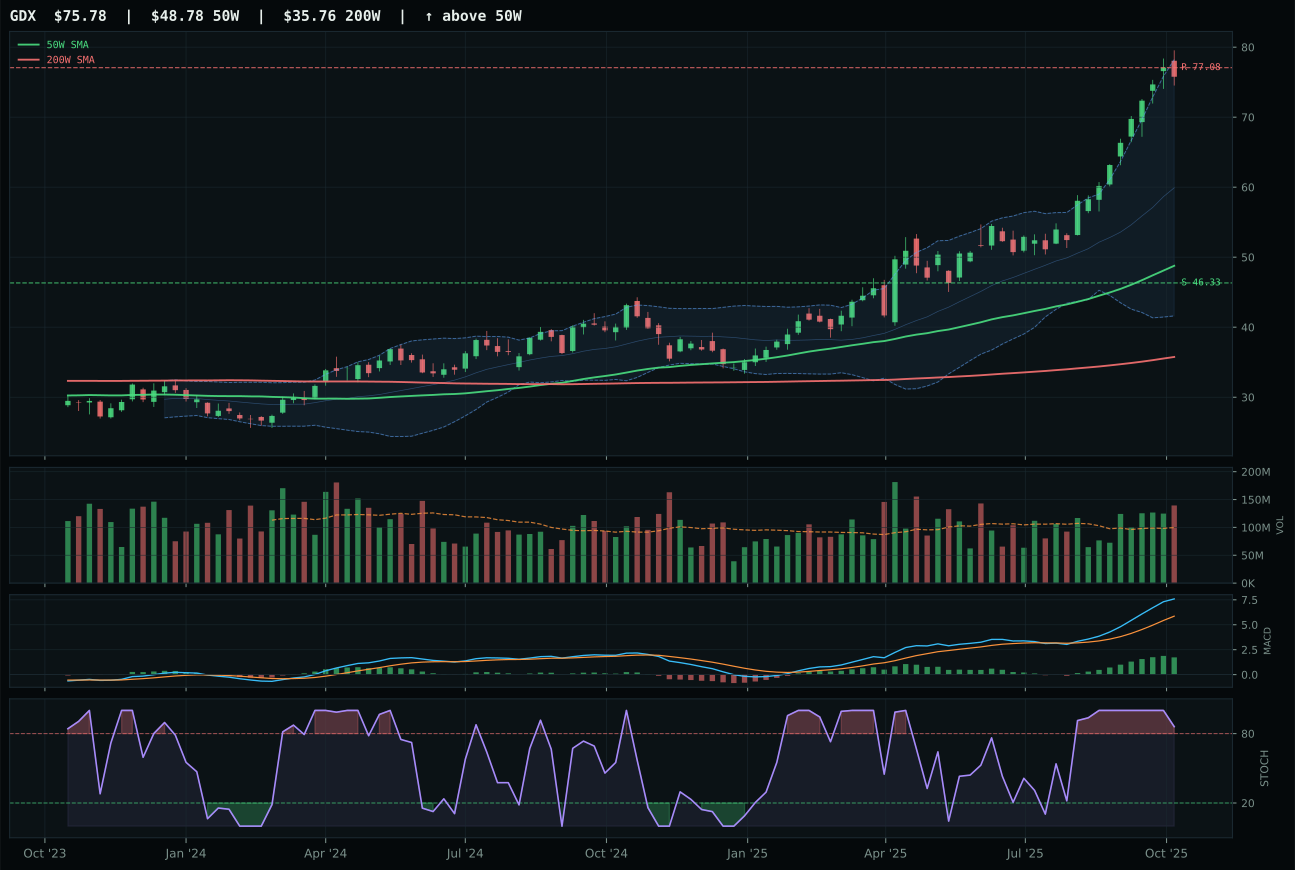
GDX has a vertical extension profile with 39.8% 13-week relative strength versus SPY.
A failed hold above support would weaken the setup.
Actionable but governed by invalidation levels.
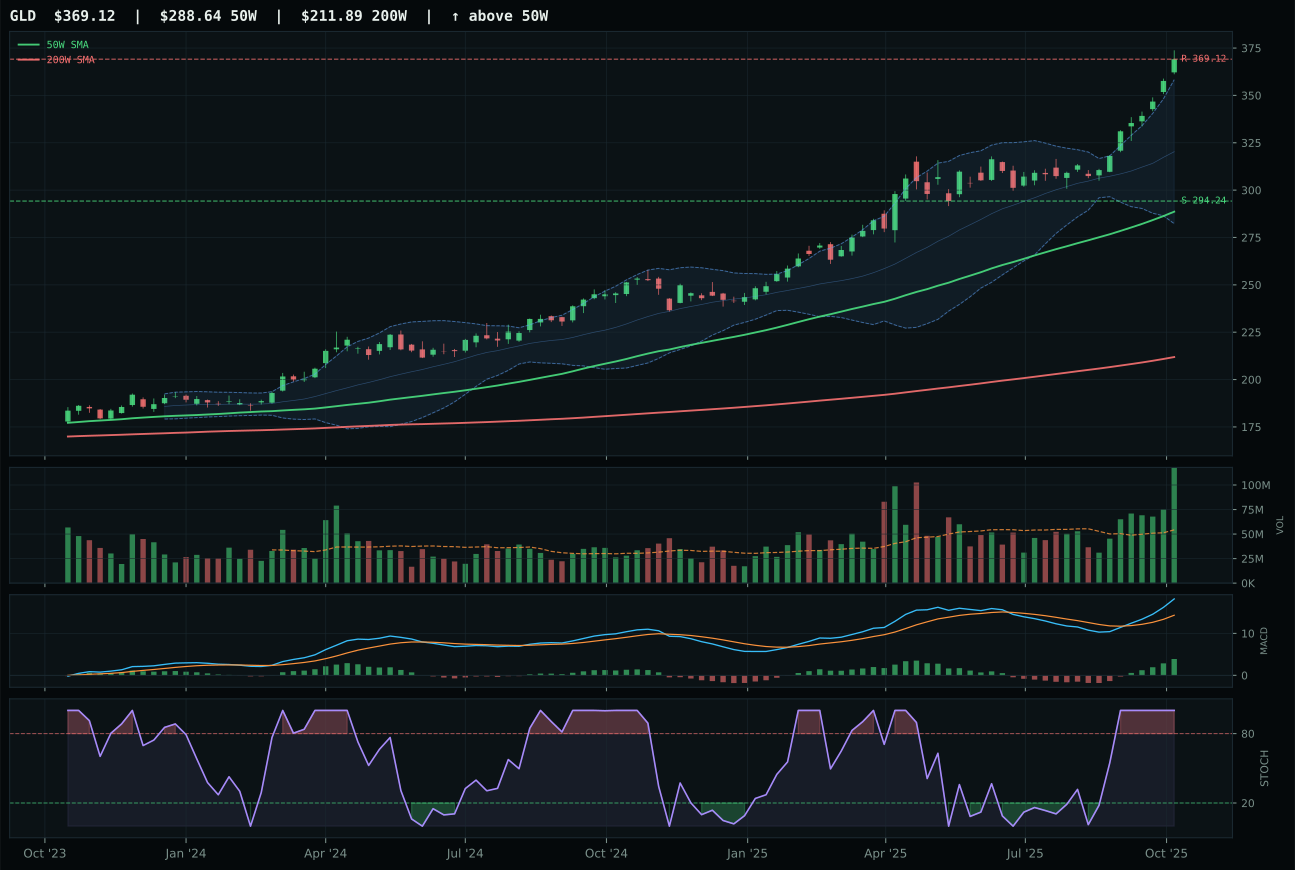
GLD has a vertical extension profile with 14.7% 13-week relative strength versus SPY.
A failed hold above support would weaken the setup.
Actionable but governed by invalidation levels.
SLV dominates the precious metals category with a trend score of 100.0/100 anchored to price 43.7% above the 50W, supported by RS versus SPY of 25.0%—one of the highest relative strengths in the entire portfolio—and category-relative strength of exactly 0.0%, meaning SLV is the peer median. The thirteen-week return of 29.7% and 2.57x volume at accumulation/confirmation levels indicate institutional capital is entering at higher prices, not distributing. Most critically, persistence and volume-price confirmation scores of 97.2 and 88.8 respectively signal that the move is not a bounce but a sustained accumulation. GDX lost to SLV because it is more extended (55.4% vs 43.7% from the 50W), has weaker timing (27.0 vs 37.0), worse risk/reward (37.5 vs 44.6), and stochastic RSI is overbought and rolling over rather than at overbought momentum. SLV's setup is structurally cleaner and the volume confirmation is stronger—the mechanical signature of a move that has legs.
Precious Metals earned a top-2 overweight of 10% with a category score of 87.1, the second-highest in the entire portfolio. Category-level macro fit is exceptional at 85.0/100, driven by active monetary hedge bid (+14), defensive rotation (+7), and disinflation itself (+8). SLV's technical evidence is outstanding at 90.0/100, and although macro narrative fit is moderate at 59.0/100, the portfolio regime is perfectly aligned: liquidity stress and credit stress drive bid for real assets, while disinflation destroys nominal growth narratives and forces capital into monetary hedges. The 10% allocation reflects the portfolio's conviction that precious metals represent the highest-probability risk-adjusted opportunity in this macro window. SLV sits at resistance with zero upside to the 45.43 level, which means entry risk is real, but the combination of overbought momentum, accumulation-level volume, and top-tier macro sponsorship justifies a top-2 position.
Nuclear Energy — URA
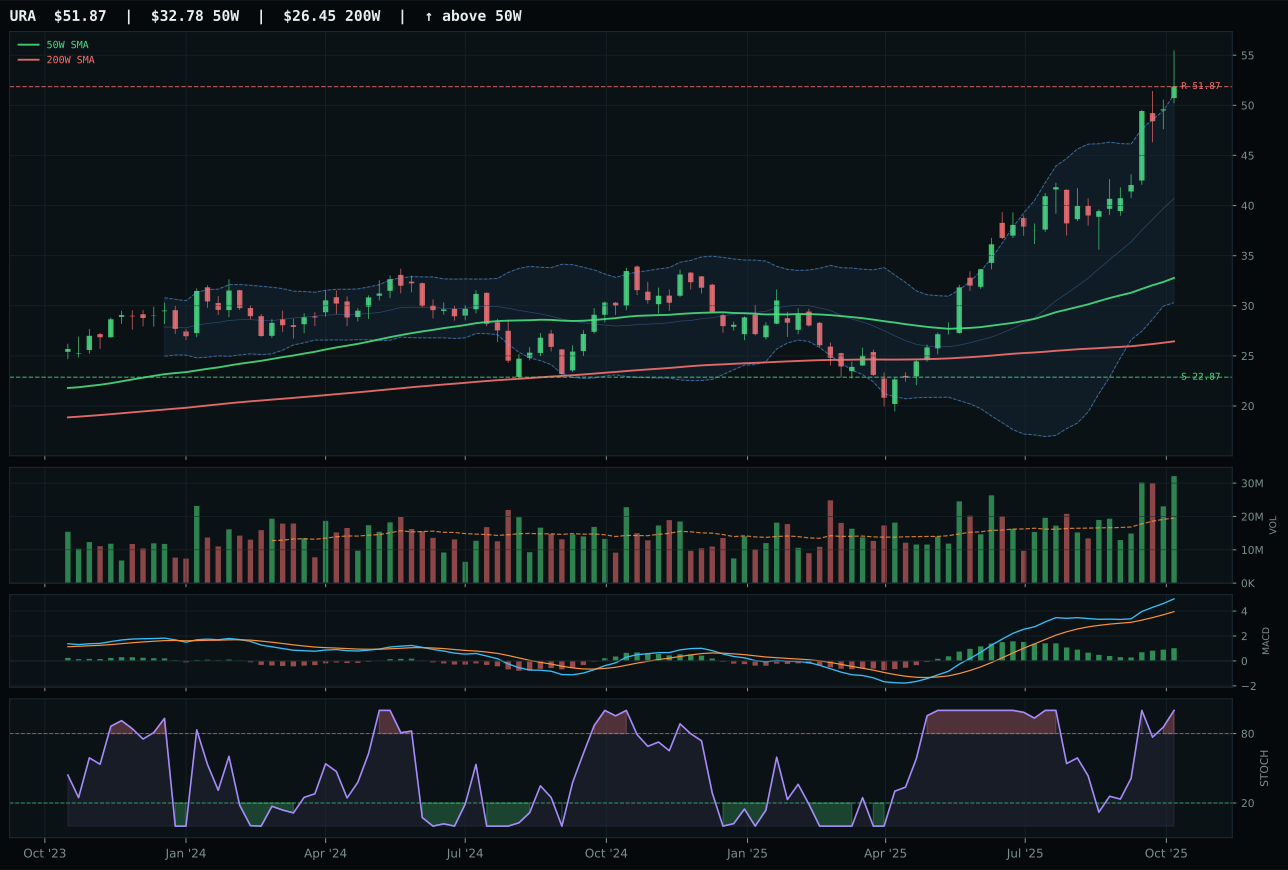
URA has a vertical extension profile with 33.6% 13-week relative strength versus SPY.
A failed hold above support would weaken the setup.
Actionable but governed by invalidation levels.
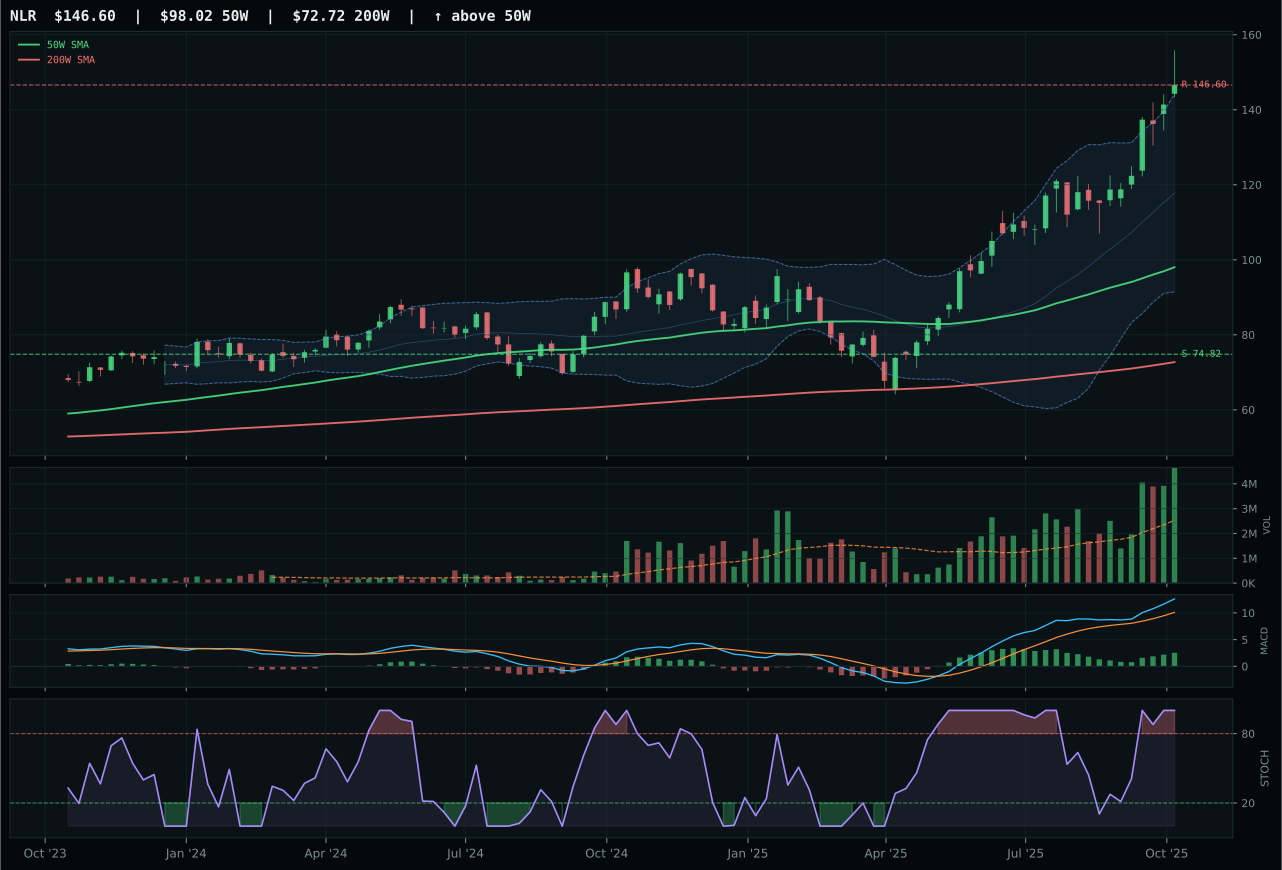
NLR has a vertical extension profile with 30.8% 13-week relative strength versus SPY.
A failed hold above support would weaken the setup.
Actionable but governed by invalidation levels.
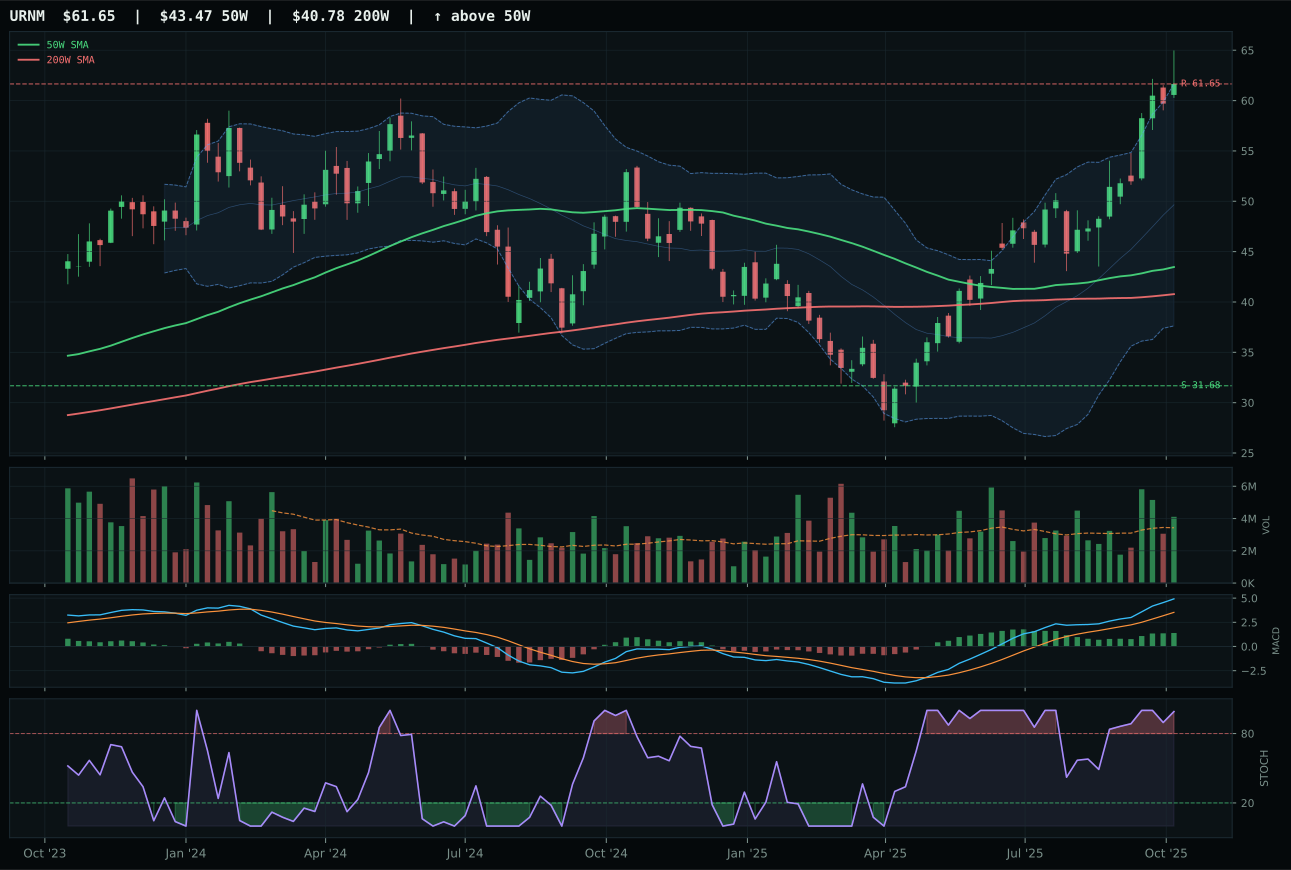
URNM has a vertical extension profile with 30.3% 13-week relative strength versus SPY.
A failed hold above support would weaken the setup.
Actionable but governed by invalidation levels.
URA won a tightly contested category with a technical evidence score of 95.4/100 that is among the highest in the entire portfolio, driven by price 58.2% above the 50W, RS versus SPY of 33.6%, and a thirteen-week return of 38.3% that anchors momentum confirmation at a perfect 100.0/100. The stochastic RSI is overbought momentum at 1.00, which normally raises entry risk, but volume is accumulation/confirmation at 1.64x the 20W average, meaning institutional capital is still entering despite extended technicals. The persistence score of 100.0/100 is a green light that the move has institutional staying power. NLR lost by the narrowest margin—only 0.2 points—because its structure is slightly less clean (80.2 vs 81.7) and category-relative strength is zero versus URA's 2.8%. Both have identical timing (37.0), identical momentum (100), and identical volume framework (accumulation/confirmation), so the win came down to micro-level structure cleanliness and peer leadership. This is a category where both representatives are technically exceptional.
Nuclear Energy earned a top-2 overweight of 10% with a category score of 69.2, the second-highest in the portfolio alongside Precious Metals. Technical evidence is dominant at 95.4/100, but macro fit is neutral at 50.0/100 because no category-specific descriptor profile is active (real asset sponsorship +7 and AI growth +5 are general, not nuclear-specific). The 10% allocation reflects pure technical conviction: URA's chart is among the cleanest in the entire portfolio, with accumulation-level volume, perfect momentum confirmation, and persistence scores that signal institutional commitment. The regime does not offer specific macro tailwinds for nuclear, but it does not provide headwinds either; the category earns its top-2 weight on technical setup alone. At 58.2% above the 50W, URA is deeply extended and entry risk is material, yet the quality of accumulation (1.64x volume at perfect momentum) justifies the allocation for investors positioned ahead of the move.
Utilities & Infrastructure — XLU
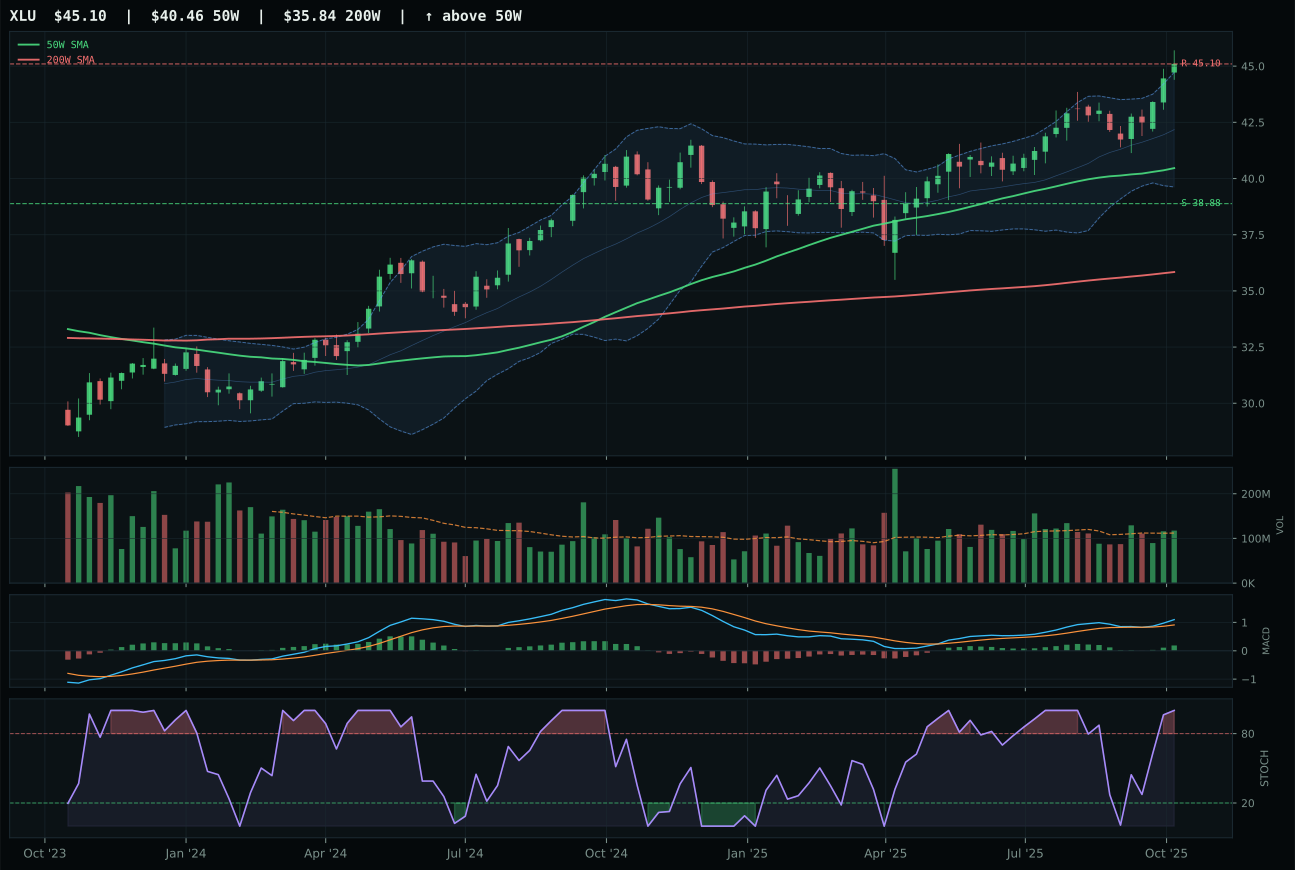
XLU has a neutral structure profile with 4.7% 13-week relative strength versus SPY.
A failed hold above support would weaken the setup.
Actionable but governed by invalidation levels.
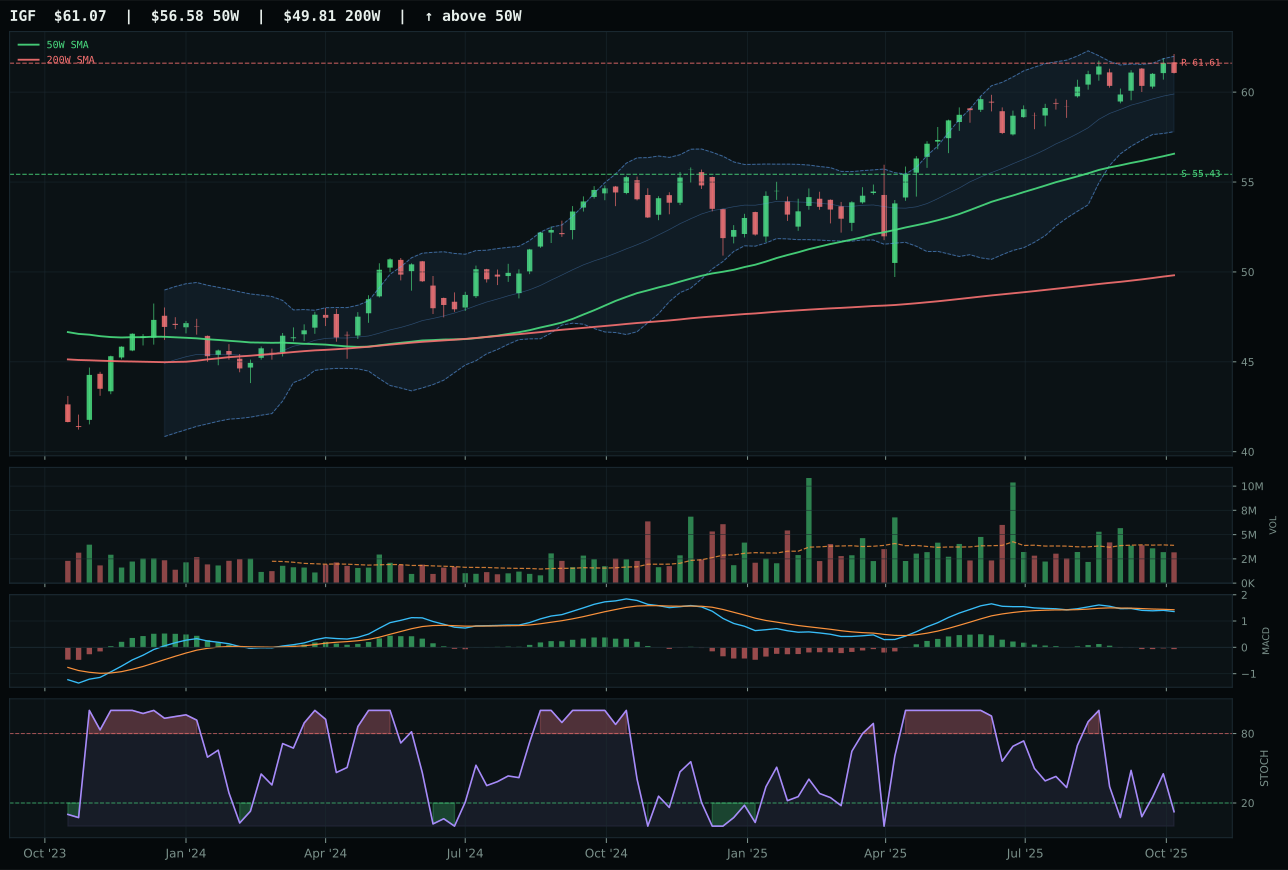
IGF has a neutral structure profile with -0.7% 13-week relative strength versus SPY.
A failed hold above support would weaken the setup.
Actionable but governed by invalidation levels.
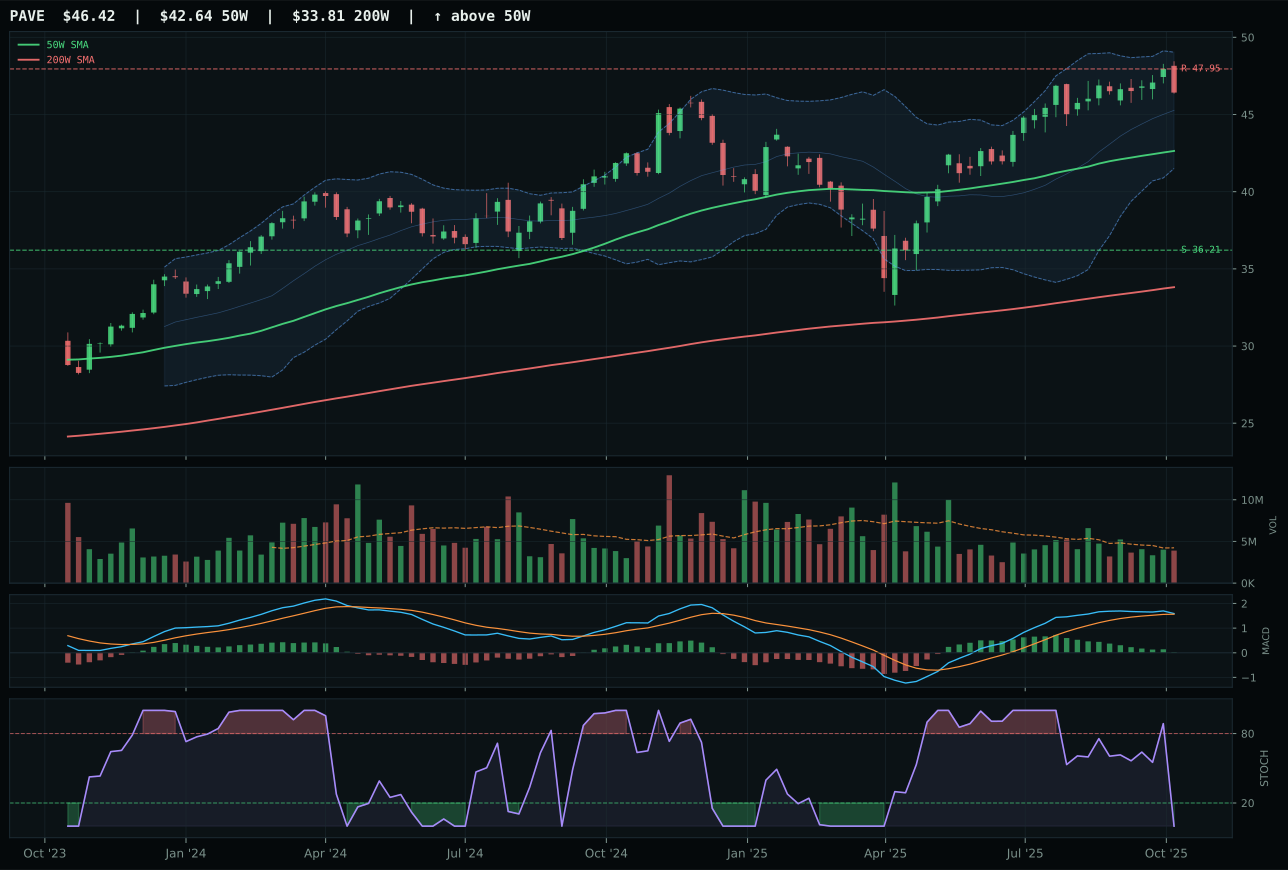
PAVE has a neutral structure profile with -1.5% 13-week relative strength versus SPY.
A failed hold above support would weaken the setup.
Actionable but governed by invalidation levels.
XLU claimed the category with a perfect 100.0/100 trend score from price above the 50W and 200W plus RS versus SPY of 4.7%, supported by category-relative strength of 5.3%—a commanding peer margin in a defensive category where breadth matters. The thirteen-week return of 9.4% and momentum confirmation of 96.3/100 anchor the technical narrative. Timing is moderate at 59.0 because XLU sits 11.5% above the 50W and stochastic RSI is already overbought momentum at 1.00, signaling that the move is extended and entry is late. However, volume at 1.05x the 20W average is neutral, not distribution pressure, which means there is no active selling competing with the bid. IGF loses to XLU because its MACD is bearish/weakening versus bullish and improving, stochastic RSI is only oversold turn-up rather than overbought momentum, risk/reward is weaker (38.5 vs 46.0), and category-relative strength is zero. XLU's neutral structure setup with perfect trend is the defensive leader; IGF is in repair mode.
Utilities & Infrastructure earned a tier-2 allocation of 5% with a category score of 68.2, ranked fourth overall. Category-level macro fit is very strong at 76.0/100, driven by active defensive rotation (+12), disinflation benefit (+7), and disinflation pressure itself (+6), with only minimal headwind from liquidity stress (-3). XLU's technical evidence is exceptional at 84.6/100, and macro narrative fit is a solid 68.0/100, which means the category has both chart quality and regime support. The 5% allocation reflects a deliberate choice to hold utilities as defensive income in a disinflation environment, but not at top-2 weight because Precious Metals (87.1) and Nuclear Energy (69.2) offer higher category scores and more compelling technical setups. XLU is extended 11.5% above the 50W with overbought momentum, which means entry risk is material despite the bullish trend. The position is held for macro defensiveness and relative strength within utilities, not for technical breakout potential.
Technology — XLK
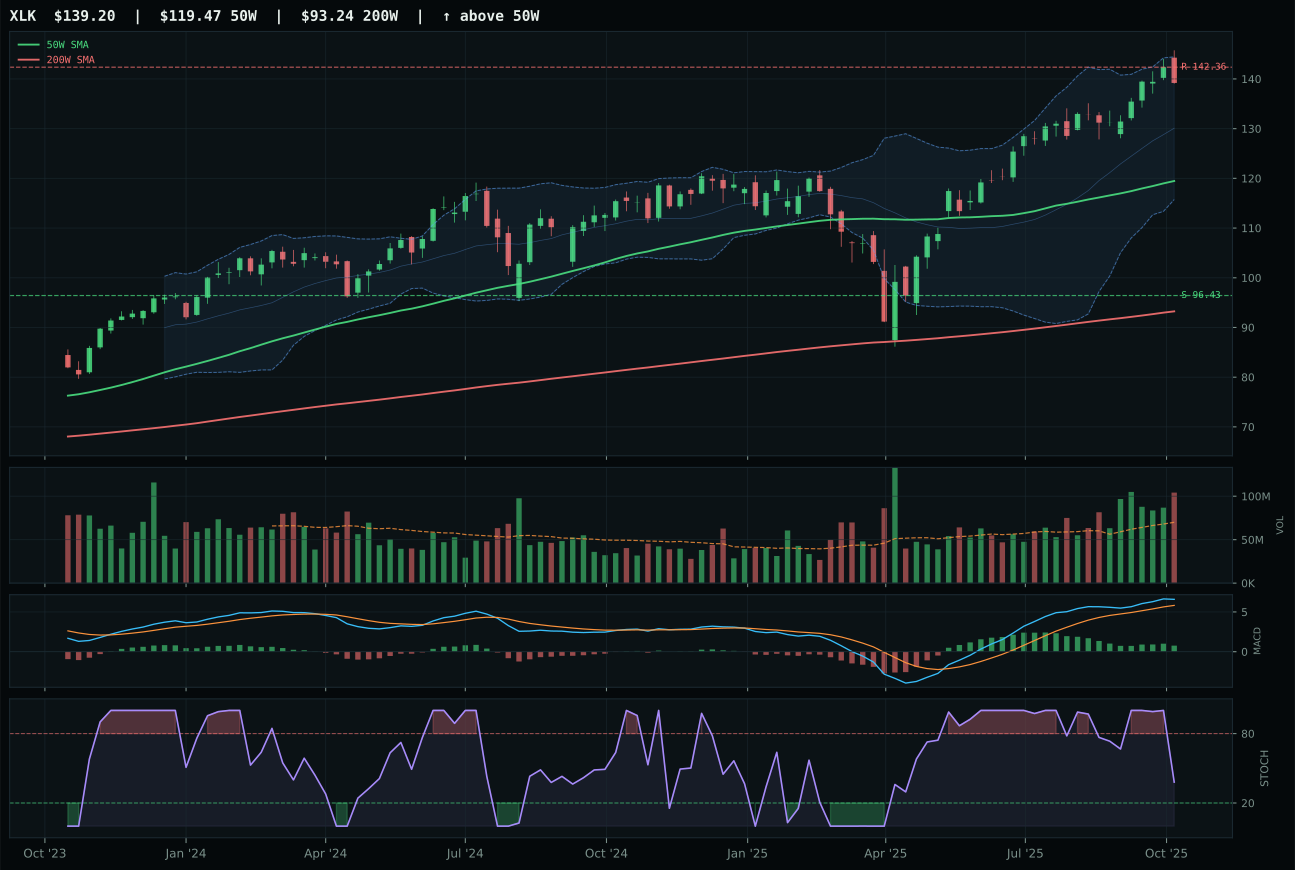
XLK has a vertical extension profile with 4.1% 13-week relative strength versus SPY.
A failed hold above support would weaken the setup.
Actionable but governed by invalidation levels.
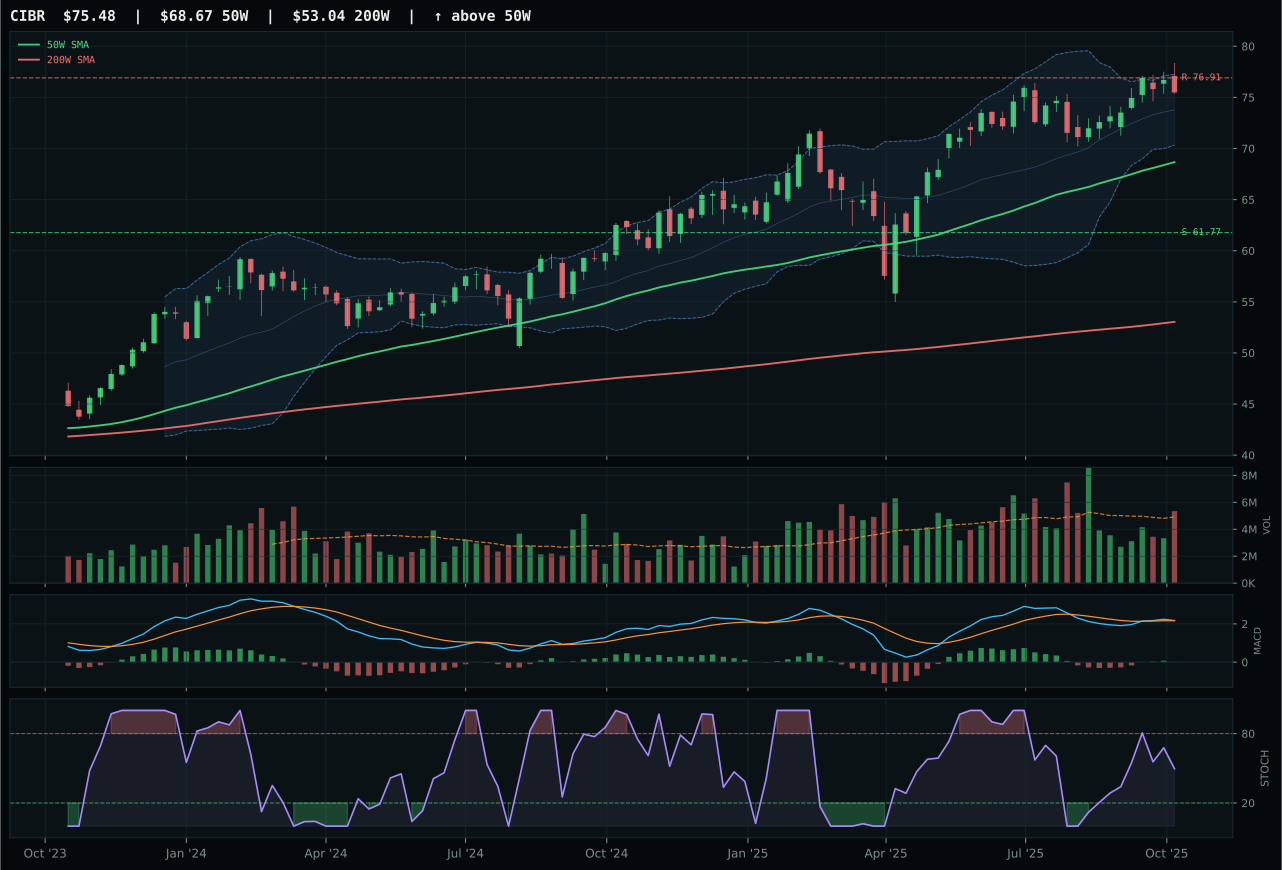
CIBR has a neutral structure profile with -0.7% 13-week relative strength versus SPY.
A failed hold above support would weaken the setup.
Actionable but governed by invalidation levels.
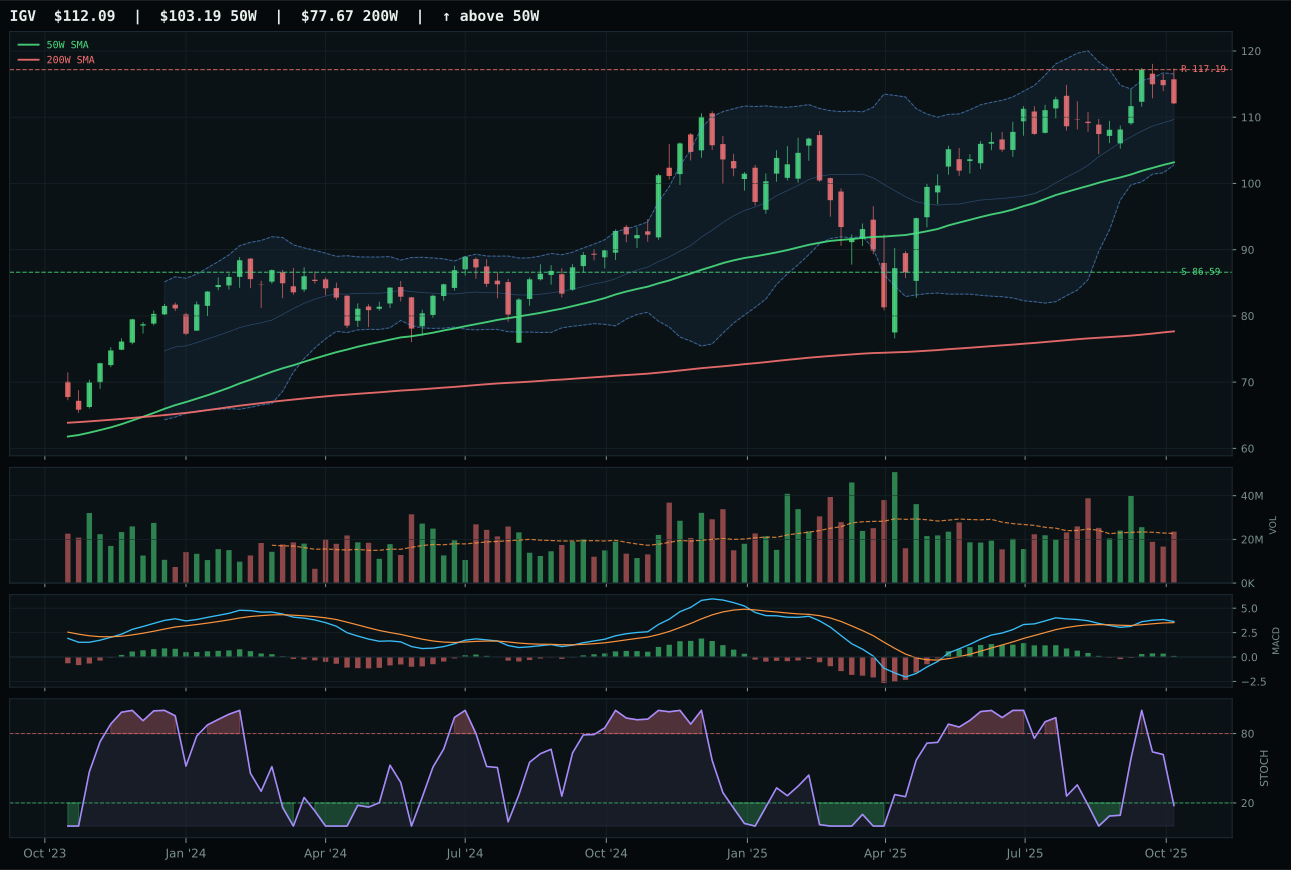
IGV has a neutral structure profile with -0.4% 13-week relative strength versus SPY.
A failed hold above support would weaken the setup.
Actionable but governed by invalidation levels.
XLK claimed the category with price firmly established above both the 50-week and 200-week moving averages, supported by a non-deteriorating 50W slope of 0.4% and relative strength versus SPY of 4.1%—the kind of persistent relative leadership that separates winners from noise. The 16.5% extension above the 50W puts new buyers at entry risk, but the 8.8% thirteen-week return and 4.5% category-relative strength confirm that accumulation is ongoing despite the vertical setup. CIBR lost to XLK on three technical grounds: weaker category-relative strength at -0.3% versus 4.5%, neutral volume confirmation versus above-average participation, and a lower structure cleanliness score (77.1 vs 77.7). XLK's setup is a clean vertical extension with bullish and improving MACD paired to above-average volume participation at 1.49x the twenty-week average—the mechanical signature of institutional sponsorship following a known leader.
Technology earned a tier-2 allocation of 5% after scoring 62.0, which places it outside the top two category overweights but inside the active sleeve. The category's macro fit sits at 51.0/100, held back by active liquidity stress (-10) and credit stress (-7) headwinds that offset the +7 boost from disinflation and +6 from AI growth sponsorship. XLK's technical evidence (86.9/100) carries the load, but macro narrative fit at 39.0/100 reflects a portfolio regime in which growth capital rotates into real assets and defensive income. The tension is real: XLK has momentum and clean technical confirmation, yet the broader regime penalizes extended technology beta when liquidity stress is active. That tension keeps the category in the 5% allocation rather than pushing it to top-2 weight.
AI — SMH
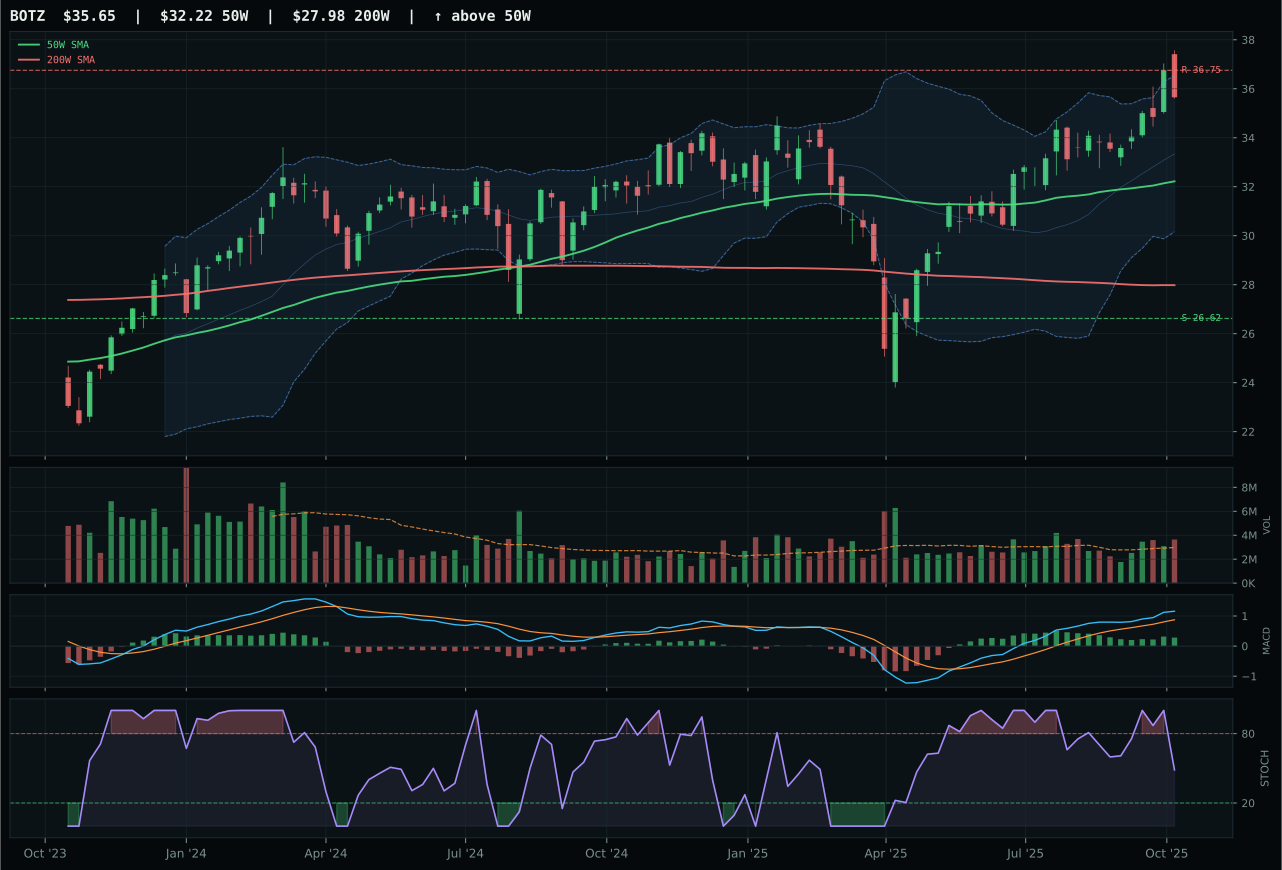
BOTZ has a neutral structure profile with 5.8% 13-week relative strength versus SPY.
A failed hold above support would weaken the setup.
Actionable but governed by invalidation levels.
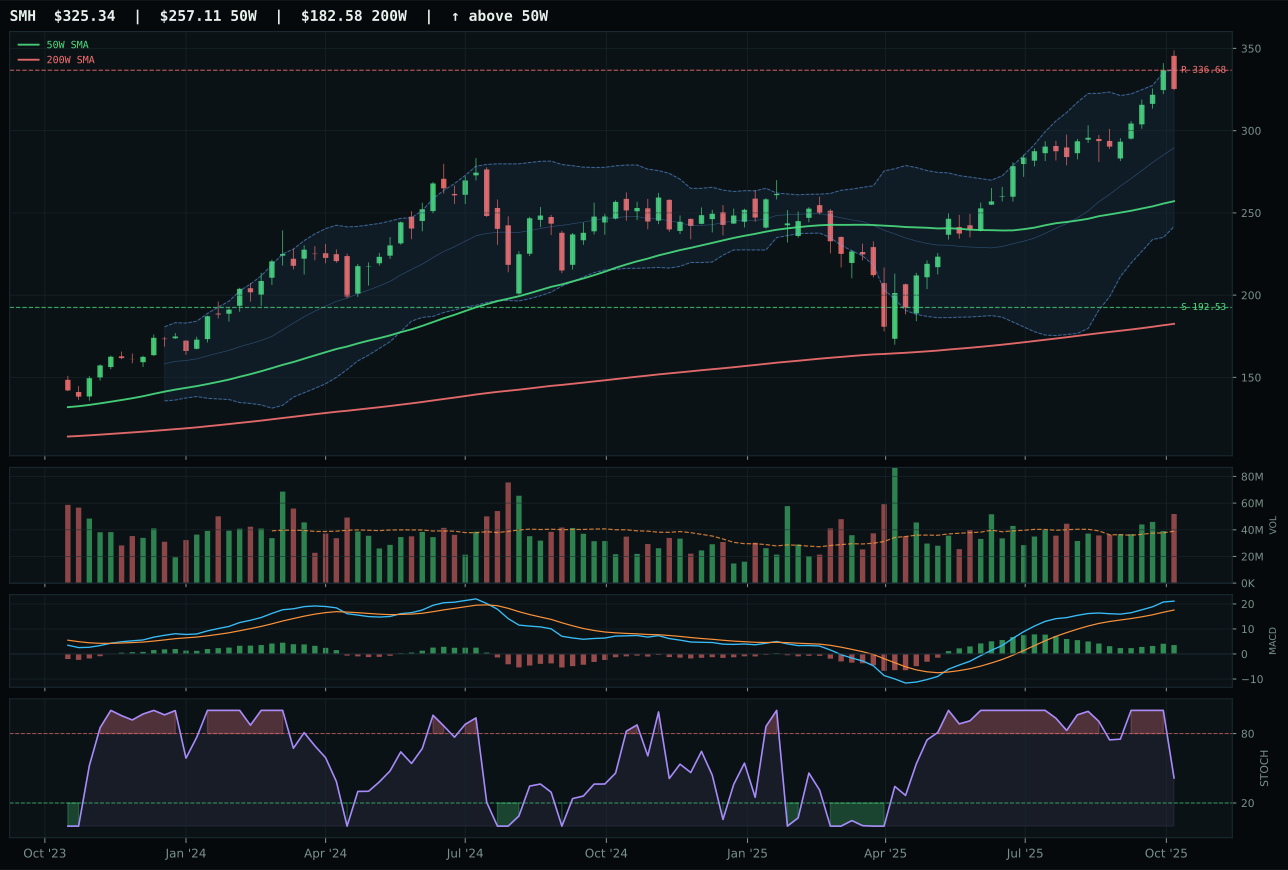
SMH has a vertical extension profile with 8.5% 13-week relative strength versus SPY.
A failed hold above support would weaken the setup.
Actionable but governed by invalidation levels.
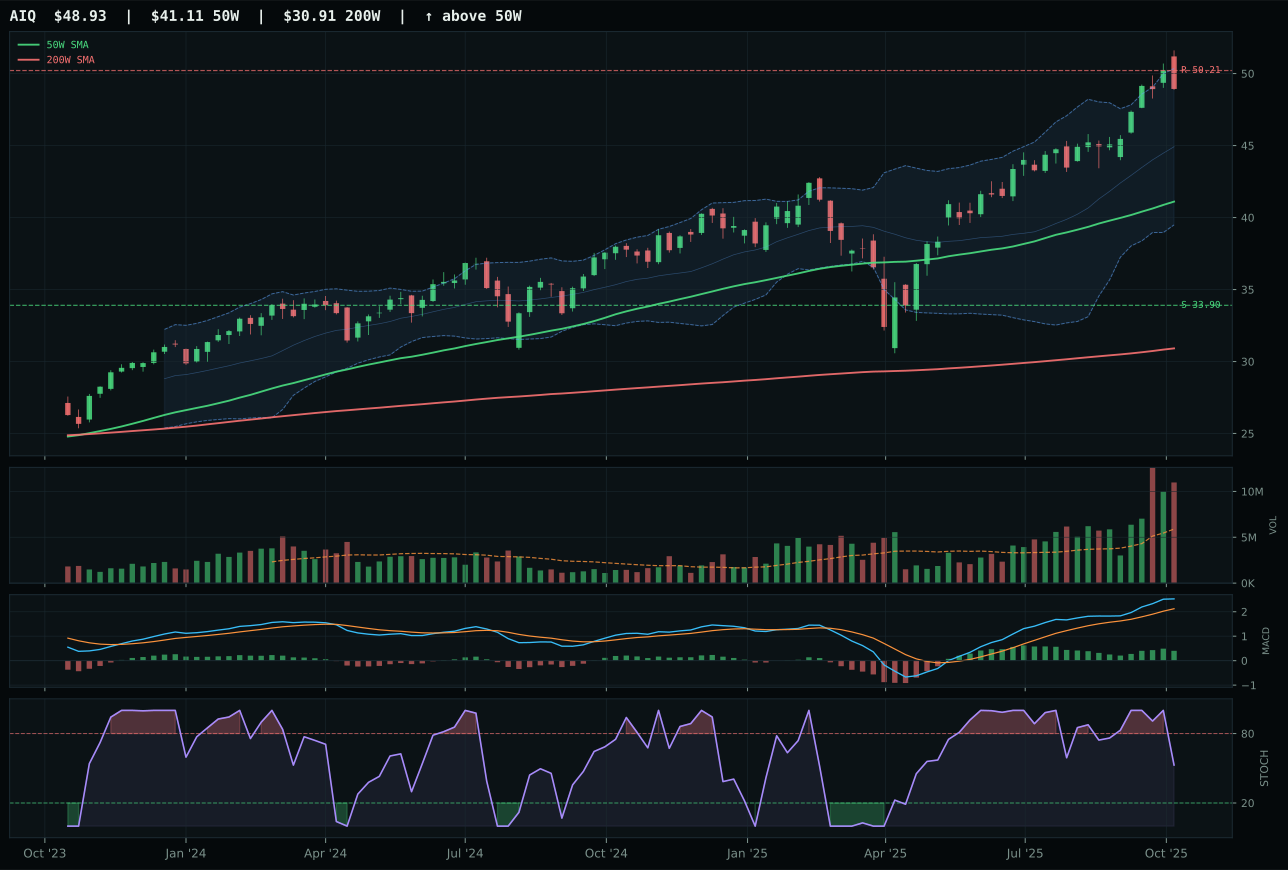
AIQ has a vertical extension profile with 8.3% 13-week relative strength versus SPY.
A failed hold above support would weaken the setup.
Actionable but governed by invalidation levels.
SMH won the AI category despite a lower composite technical score (68 vs BOTZ's 80) because it captured the highest momentum confirmation at 100.0/100 and posted a 13.2% thirteen-week return paired to 8.5% relative strength versus SPY—exactly the kind of breadth-relative performance that separates conviction bets from crowded trades. The 26.5% extension above the 50W is penalized for entry risk (timing score 53.0), but the vertical extension setup with above-average volume participation (1.33x the 20W average) and bullish improving MACD provides mechanical confirmation that capital is entering at higher prices, not distributing. BOTZ fell victim to a -2.6% category-relative strength disadvantage (its -2.6% vs SMH's 0.1%), which signals that peer momentum is flowing toward semiconductor compute rather than robotics application layers. In a TrendBTC regime where AI growth sponsorship is +14 and liquidity stress is -12, the ETF closest to the epicenter of capital flow wins the selection.
AI earned a tier-2 allocation of 5% despite a composite category score of 59.6 that ranks it eighth overall. The category-level macro fit of 49.0/100 reveals a regime conflict: AI growth sponsorship is strongly active (+14), but that boost is sliced in half by liquidity stress (-12) and credit stress (-8), which compress net macro support. SMH's technical evidence of 77.0/100 carries the position, but macro narrative fit at only 48.0/100 means the category trades on price momentum and relative strength rather than fundamental macro alignment. The 5% slot reflects a portfolio choice to hold AI exposure because its technical setup is clean and the growth theme is still viable, even though the macro regime (disinflation with liquidity stress) is not optimally favorable for extended technology beta. Two stronger categories ranked higher in the 5% allocation band, leaving AI in a holding pattern.
Industrial Metals — REMX
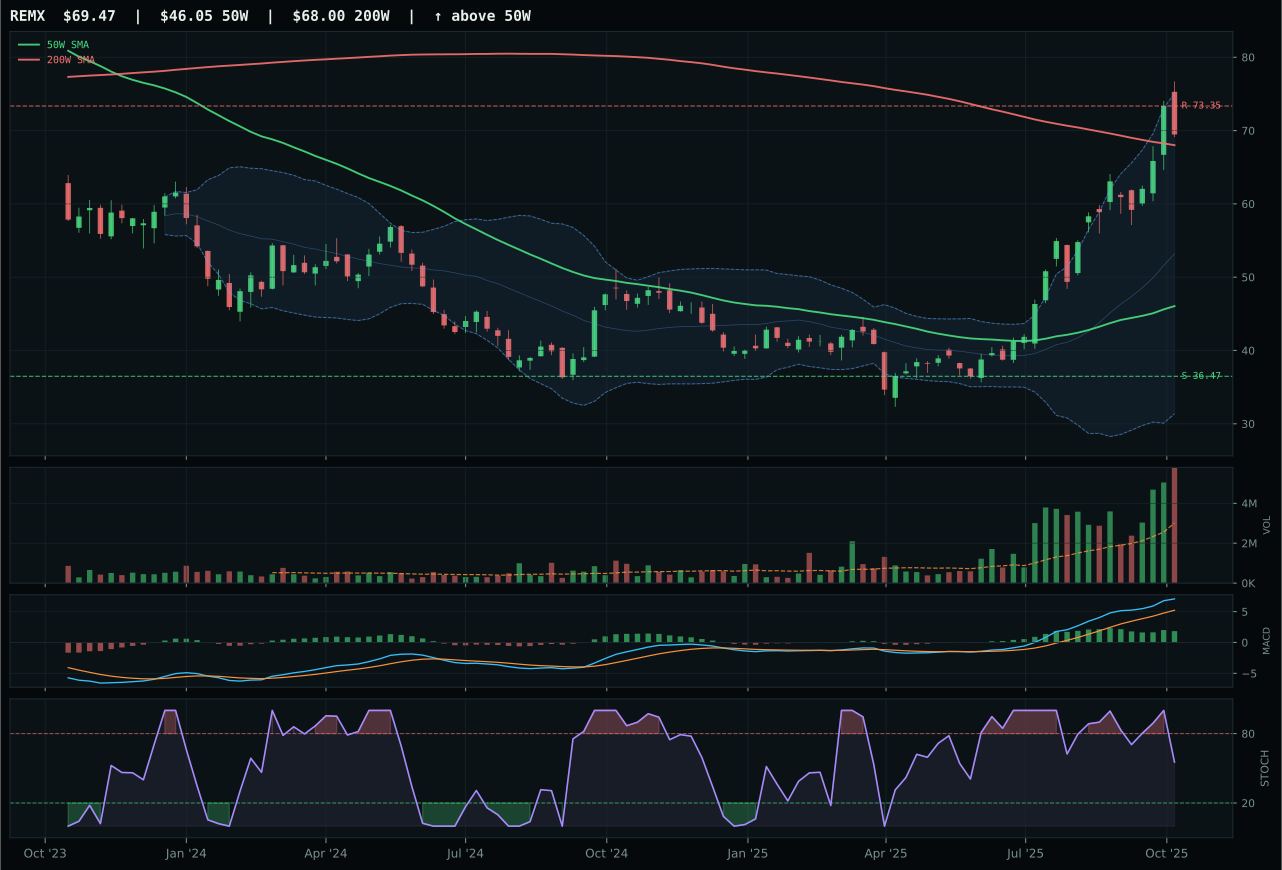
REMX has a vertical extension profile with 45.2% 13-week relative strength versus SPY.
A failed hold above support would weaken the setup.
Actionable but governed by invalidation levels.
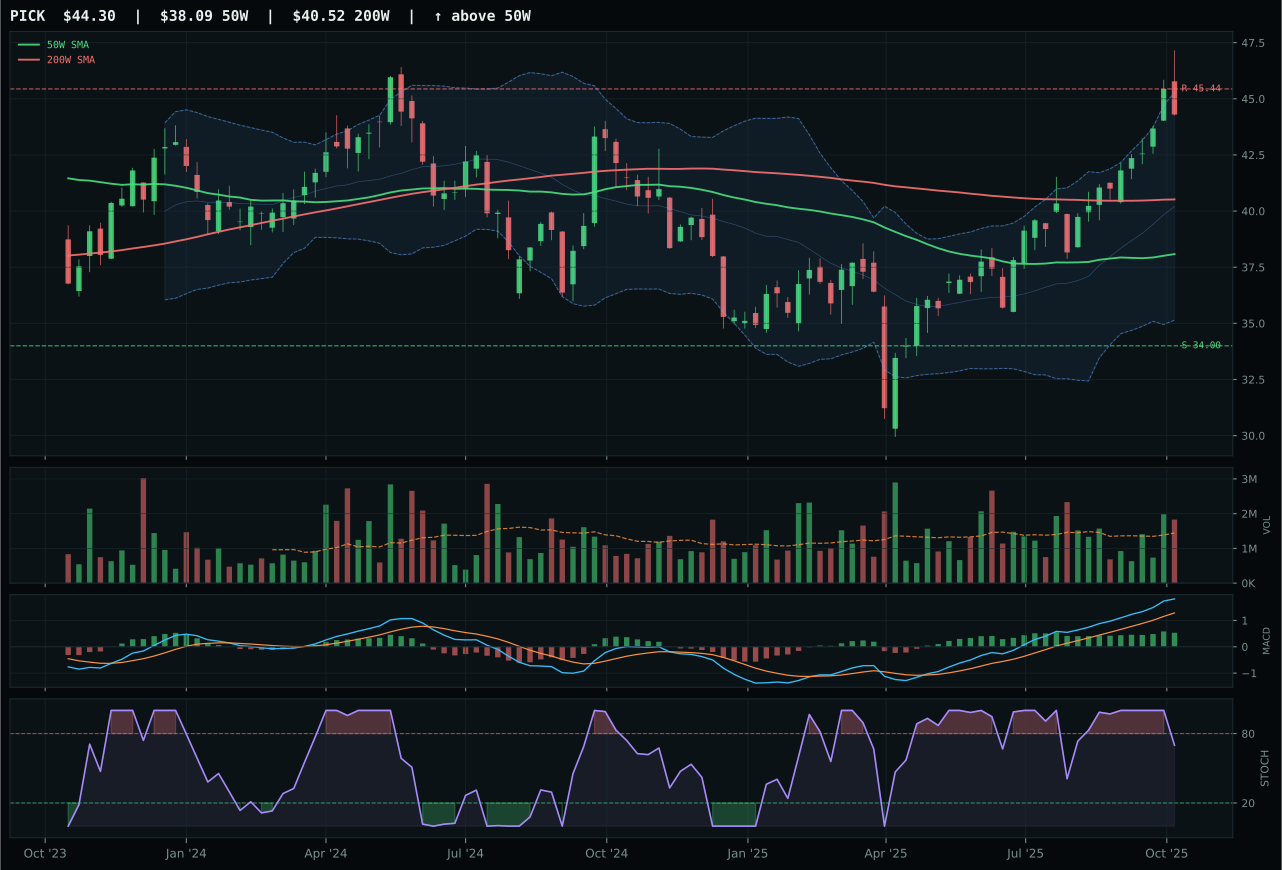
PICK has a vertical extension profile with 7.2% 13-week relative strength versus SPY.
A failed hold above support would weaken the setup.
Actionable but governed by invalidation levels.
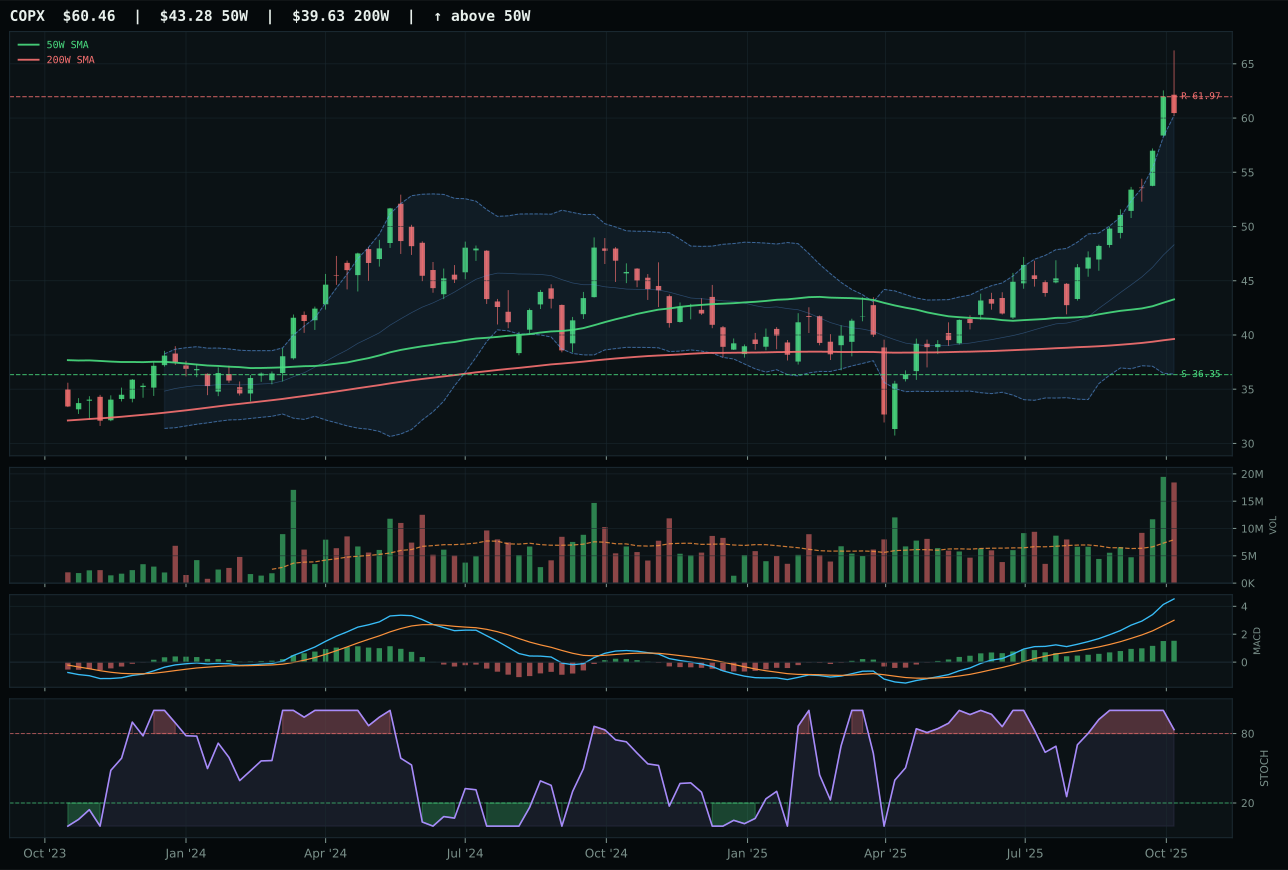
COPX has a vertical extension profile with 29.2% 13-week relative strength versus SPY.
A failed hold above support would weaken the setup.
Actionable but governed by invalidation levels.
REMX captured the category despite posting the most extreme extension in the portfolio: 50.9% above the 50W with a stochastic RSI that is only falling/neutral at 0.55, signaling momentum fatigue. However, the thirteen-week return of 49.9% and RS versus SPY of 45.2% are extraordinary, and category-relative strength of 16.0% reveals that REMX is the dominant performer within the peer set. The volume signature is distribution pressure at 3.23x the 20W average, which is a warning flag on entry, but the persistence score of 100.0/100 proves the move has sustained institutional commitment despite stretched technicals. PICK loses to REMX on one statistic: category-relative strength of -22.0% versus REMX's +16.0%. PICK is technically cleaner (composite 70 vs 62) and has better risk/reward (46 vs 38), but it is being left behind by the rare earth scarcity narrative that has taken over the category. In a TrendBTC regime where metals scarcity is active (+14), the peer with the highest relative strength wins.
Industrial Metals earned a tier-2 allocation of 5% with a category score of 57.5, ranked fifth overall. Category-level macro fit is strong at 65.0/100, powered by metals scarcity (+14), commodity breadth positive (+10), and real asset sponsorship (+6), though liquidity stress (-8) and credit stress (-7) provide headwind. REMX's technical evidence is only 58.4/100—weaker than PICK's 71.1—which means the category win is driven entirely by peer momentum and category-relative outperformance rather than chart quality. The 5% allocation reflects a portfolio decision to hold industrial metals exposure for its macro sponsorship (scarcity narrative, real asset bid) even though REMX's setup is stretched and entry risk is high from accumulation-pressure volume. The category lacks the macro purity and technical confirmation of Precious Metals (top-2 at 10%), so it sits one tier lower despite a favorable scarcity regime.
Defense & Aerospace — XAR
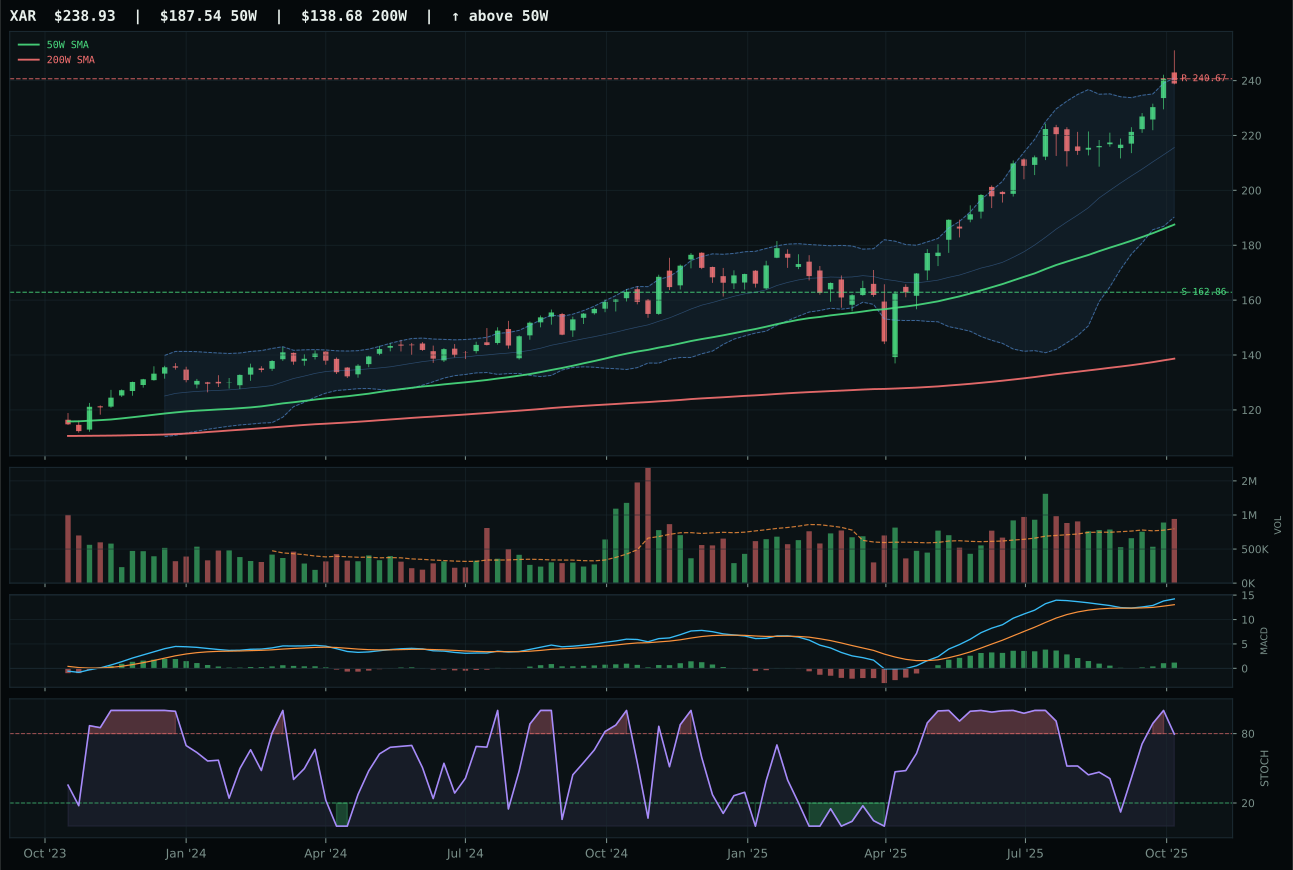
XAR has a vertical extension profile with 8.0% 13-week relative strength versus SPY.
A failed hold above support would weaken the setup.
Actionable but governed by invalidation levels.
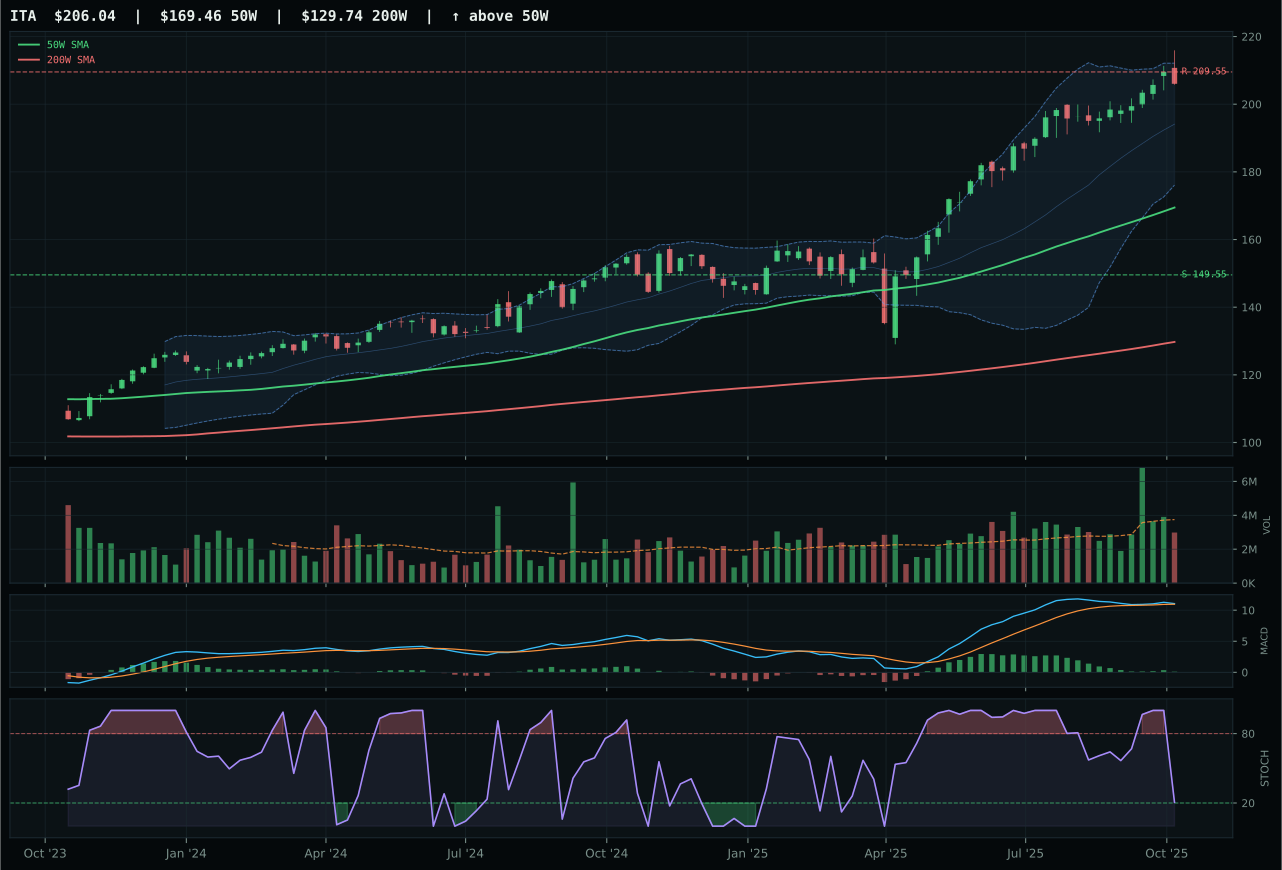
ITA has a vertical extension profile with 3.9% 13-week relative strength versus SPY.
A failed hold above support would weaken the setup.
Actionable but governed by invalidation levels.
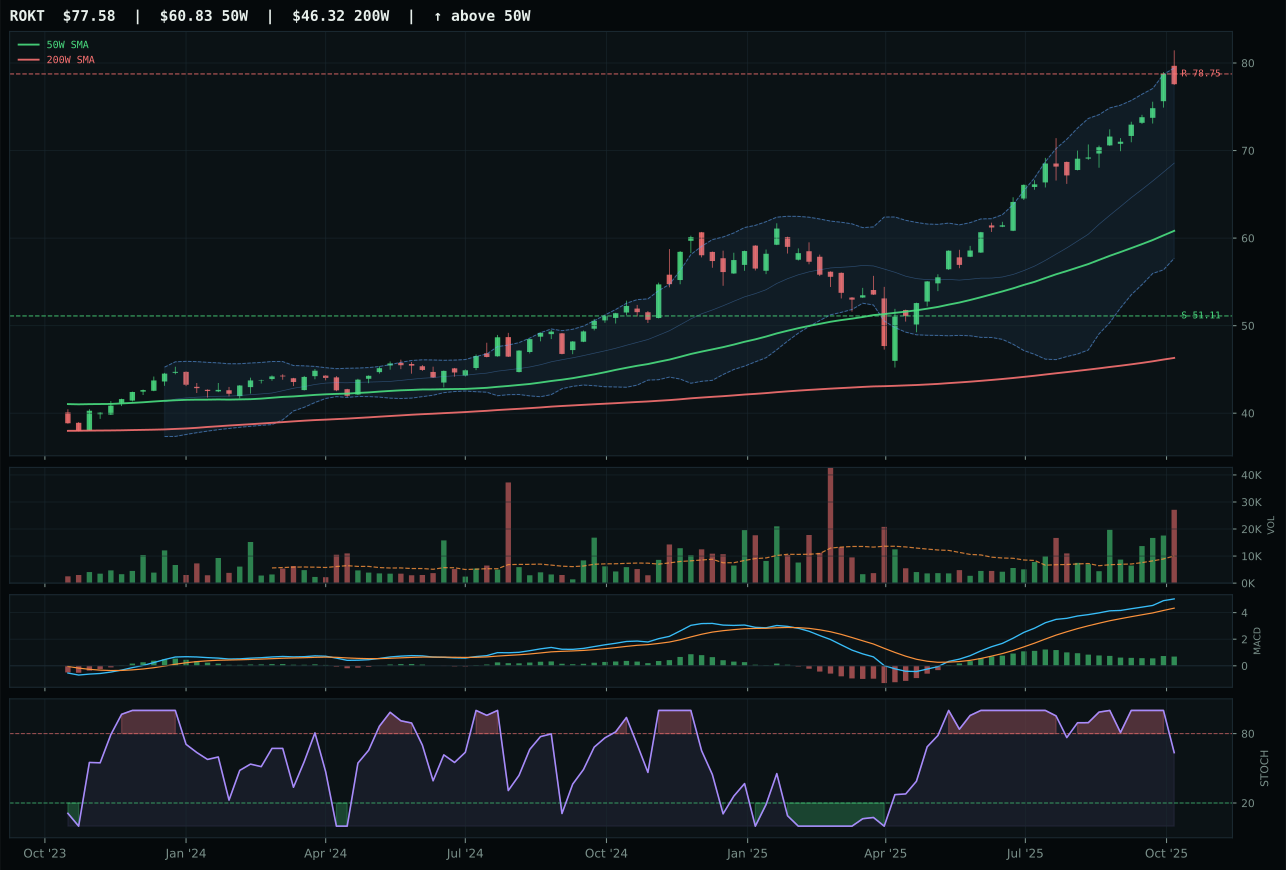
ROKT has a vertical extension profile with 12.6% 13-week relative strength versus SPY.
A failed hold above support would weaken the setup.
Tracked, but not top-2 eligible because: .
XAR secured the category win with a 100.0/100 trend score driven by price above the 50W and 200W plus an RS versus SPY of 8.0%, giving the setup both directional conviction and peer-relative outperformance that justifies capital commitment. The 27.4% extension above the 50W lands the timing score at 61.0—higher than runner-up ITA's 48.0—because stochastic RSI is rising mid-zone rather than falling/neutral, meaning momentum is still intact despite the vertical setup. XAR's structure is cleaner (79.3 vs ITA's 77.5), volume confirmation is above-average participation rather than neutral, and MACD is bullish and improving rather than bullish but flattening. ITA's category-relative strength of -4.1% reveals weakness against the peer set; XAR's neutral 0.0% indicates it is holding its own. The score gap of 2.2 points is decisive but not massive, reflecting a close race between two technically sound defense leaders.
Defense & Aerospace earned a tier-2 allocation of 5% with a final category score of 50.9, placing it sixth among the ten categories. Category-level macro fit is 59.0/100, supported by active defensive rotation (+8) that partially offsets liquidity stress (-4); credit stress is minimally negative (+2). XAR's technical evidence is strong at 81.1/100, but macro narrative fit is neutral at 50.0/100 because no category-specific descriptor profile was available to amplify the thesis. The 5% allocation reflects a portfolio decision to hold defense exposure because its chart is strong and defensive rotation is genuinely active in a disinflation environment, yet the category lacks the macro sponsorship or extreme technical leverage that would elevate it to top-2 weight. The regime permits the position but does not compel it.
Traditional Energy — XLE
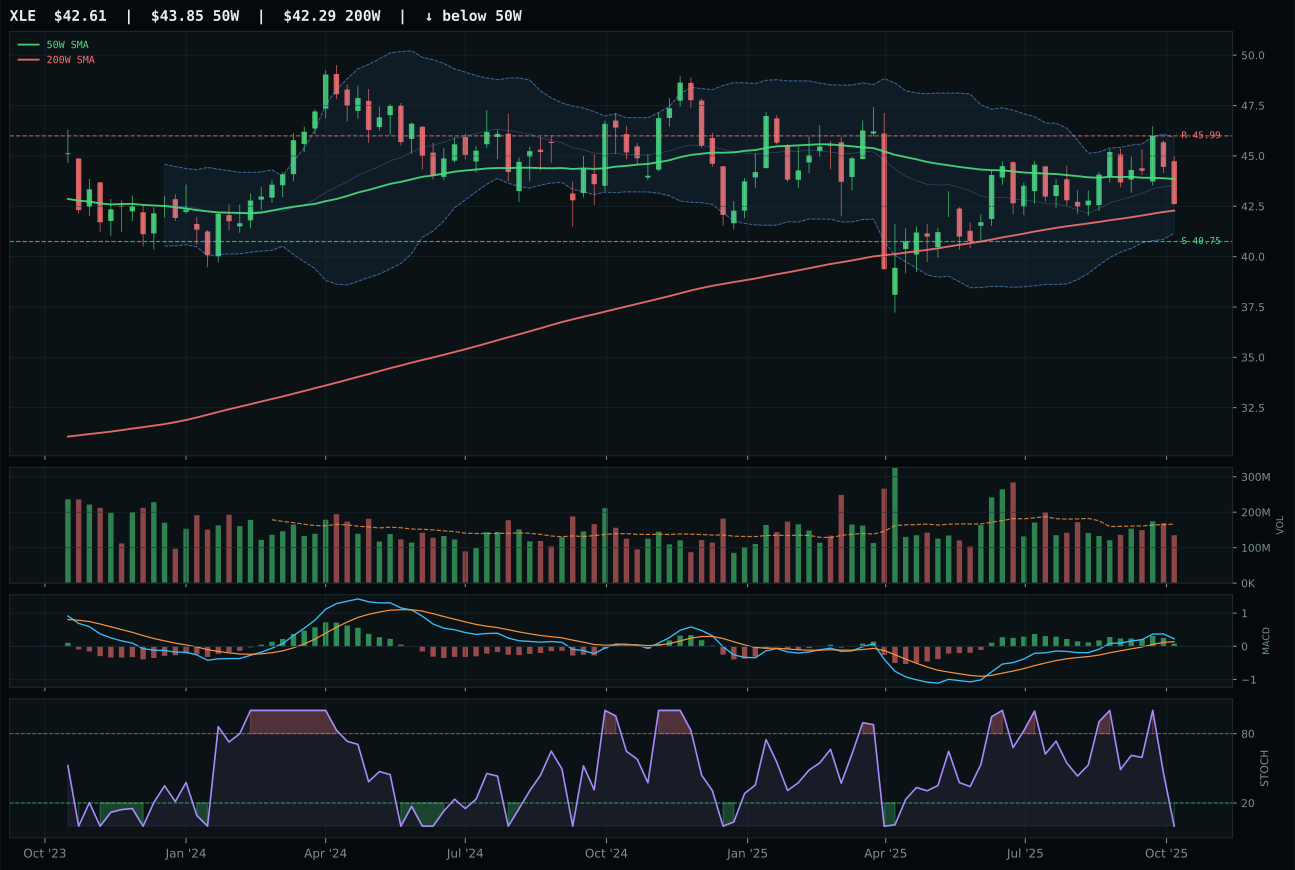
XLE has a pullback into support profile with -9.1% 13-week relative strength versus SPY.
A failed hold above support would weaken the setup.
Actionable but governed by invalidation levels.
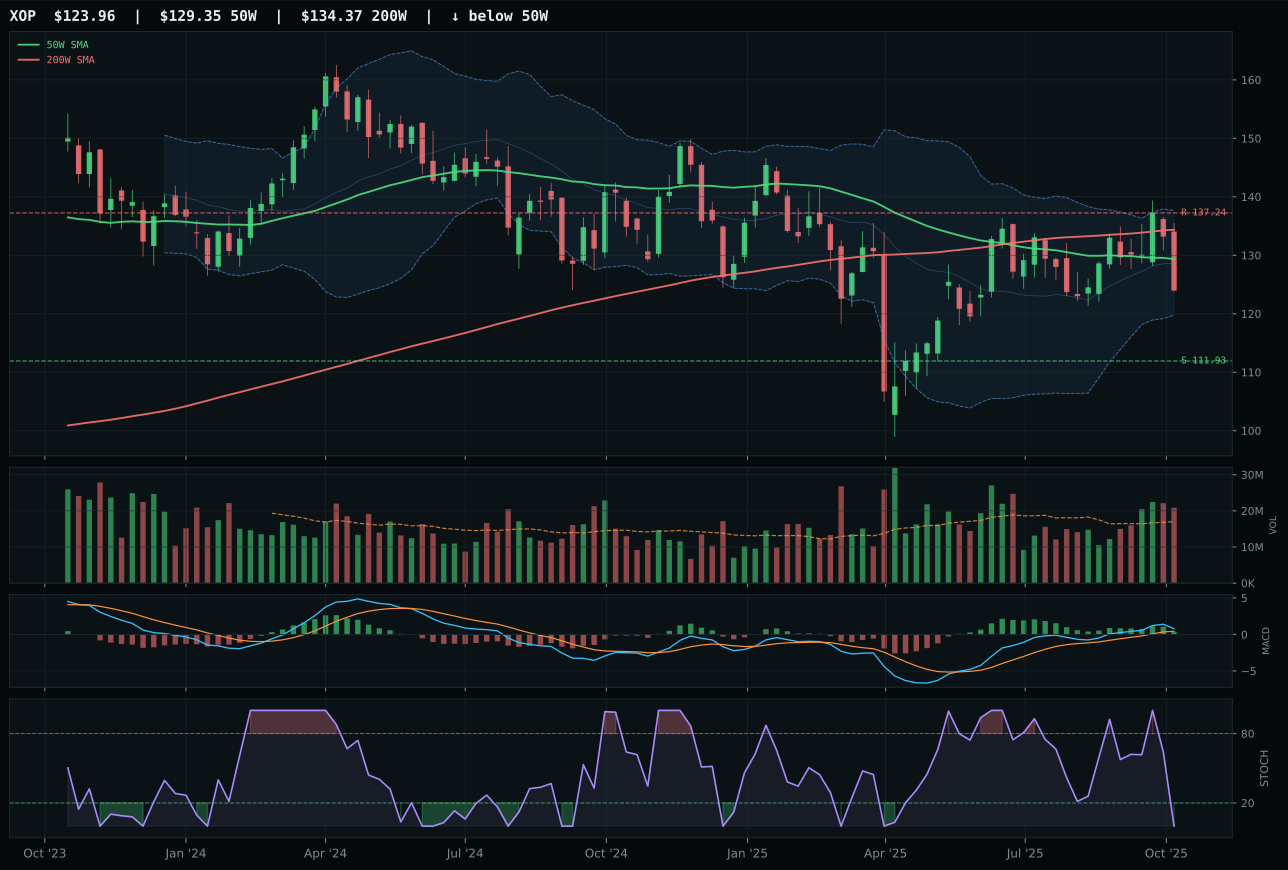
XOP has a neutral structure profile with -11.6% 13-week relative strength versus SPY.
Extension and support failure are the main tactical risks.
Tracked, but not top-2 eligible because: structurally broken.
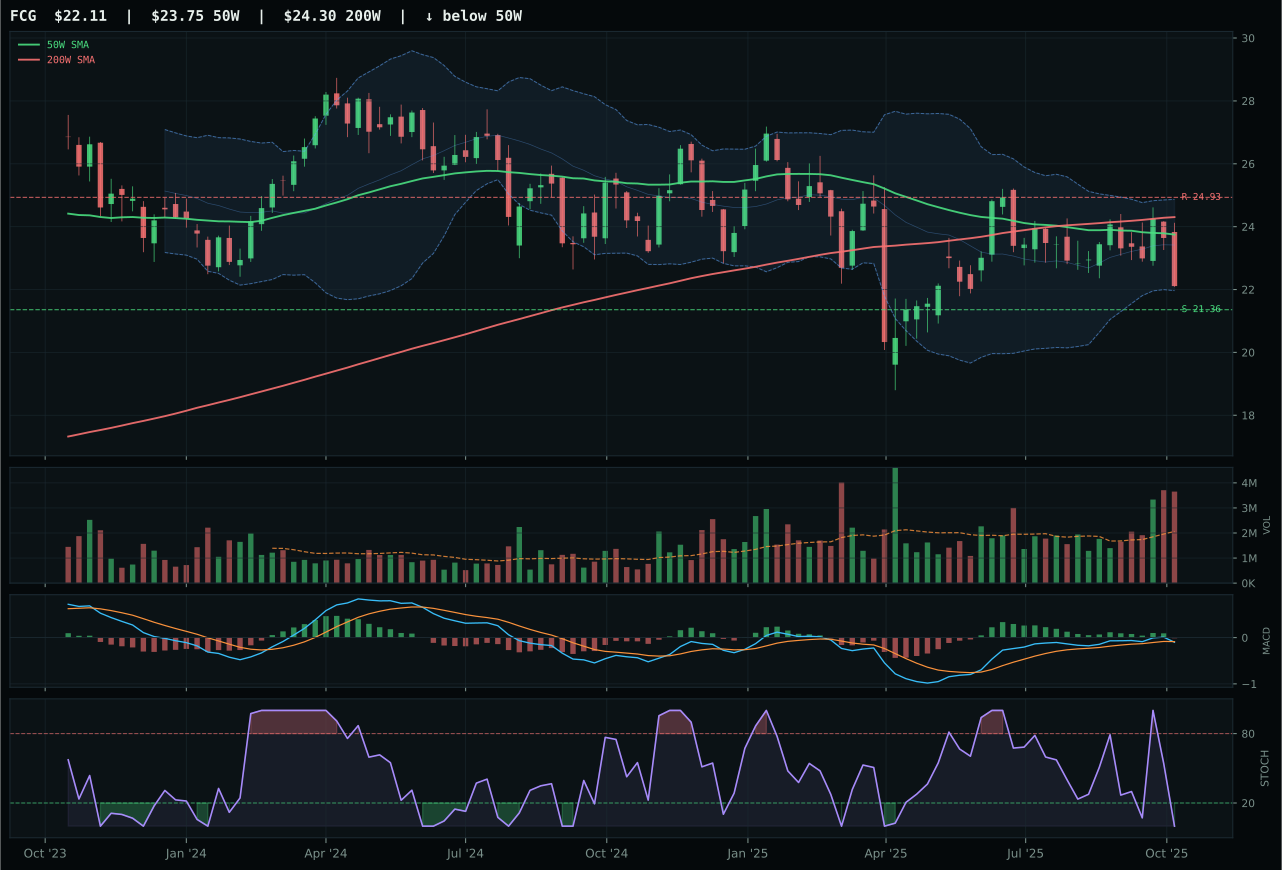
FCG has a pullback into support profile with -12.4% 13-week relative strength versus SPY.
Extension and support failure are the main tactical risks.
Tracked, but not top-2 eligible because: structurally broken.
XLE won a poisoned category by being the least poisoned: price is below the 50W at -2.8%, which is weakness, but it remains above the 200W and the 13W return of -4.4% is better than the peers' deeper red. The timing score of 100.0/100 is extraordinary—distance to the 50W is near zero, MACD is bullish but flattening, and stochastic RSI is completely oversold at 0.00, which means support is defined at 40.75. The risk/reward score of 82.0/100 is the highest in the category because downside to support is only 4.6% while upside to resistance is -7.4%; buyers have a favorable asymmetry at current levels. XOP loses to XLE because its structure is completely neutral (rather than pullback into support), timing is weaker (85.0 vs 100.0), risk/reward is worse (69.2 vs 82.0), and category-relative strength is zero versus XLE's 2.5%. XLE's setup is pullback into defined support, not a broken structure, which is the only quality edge available.
Traditional Energy earned a tier-2 allocation of 5% despite a final category score of 0.0—technically the lowest possible score that still retained eligibility. Category-level macro fit is severely negative at 23.0/100 because disinflation pressure (-10) directly destroys energy demand and valuation logic, while liquidity stress (-7) and credit stress (-7) compound the headwind. XLE's technical evidence of 54.0/100 is just above the floor, and macro narrative fit at 47.0/100 provides no lift. The 5% allocation is defensive: the portfolio holds energy exposure because XLE's timing and risk/reward setup is favorable at support levels, and some real asset sponsorship (+5) remains active. However, the category is essentially in the penalty box. It will require either crude oil prices to rally materially or the macro regime to shift away from disinflation for energy to earn higher allocation. Currently it is held on pure technical mean-reversion mechanics despite a regime that is structurally negative.
Emerging Markets — IEMG
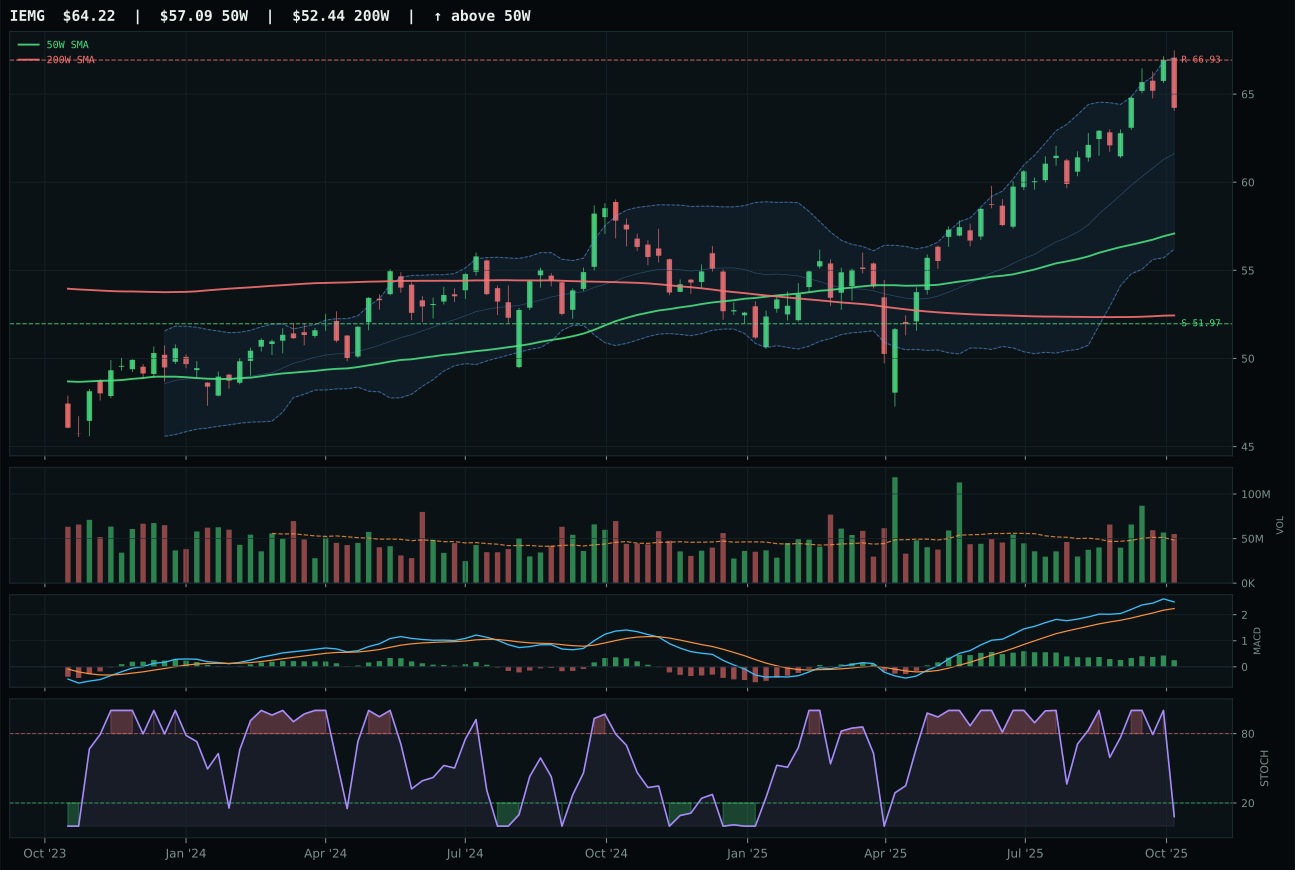
IEMG has a neutral structure profile with 2.2% 13-week relative strength versus SPY.
A failed hold above support would weaken the setup.
Actionable but governed by invalidation levels.
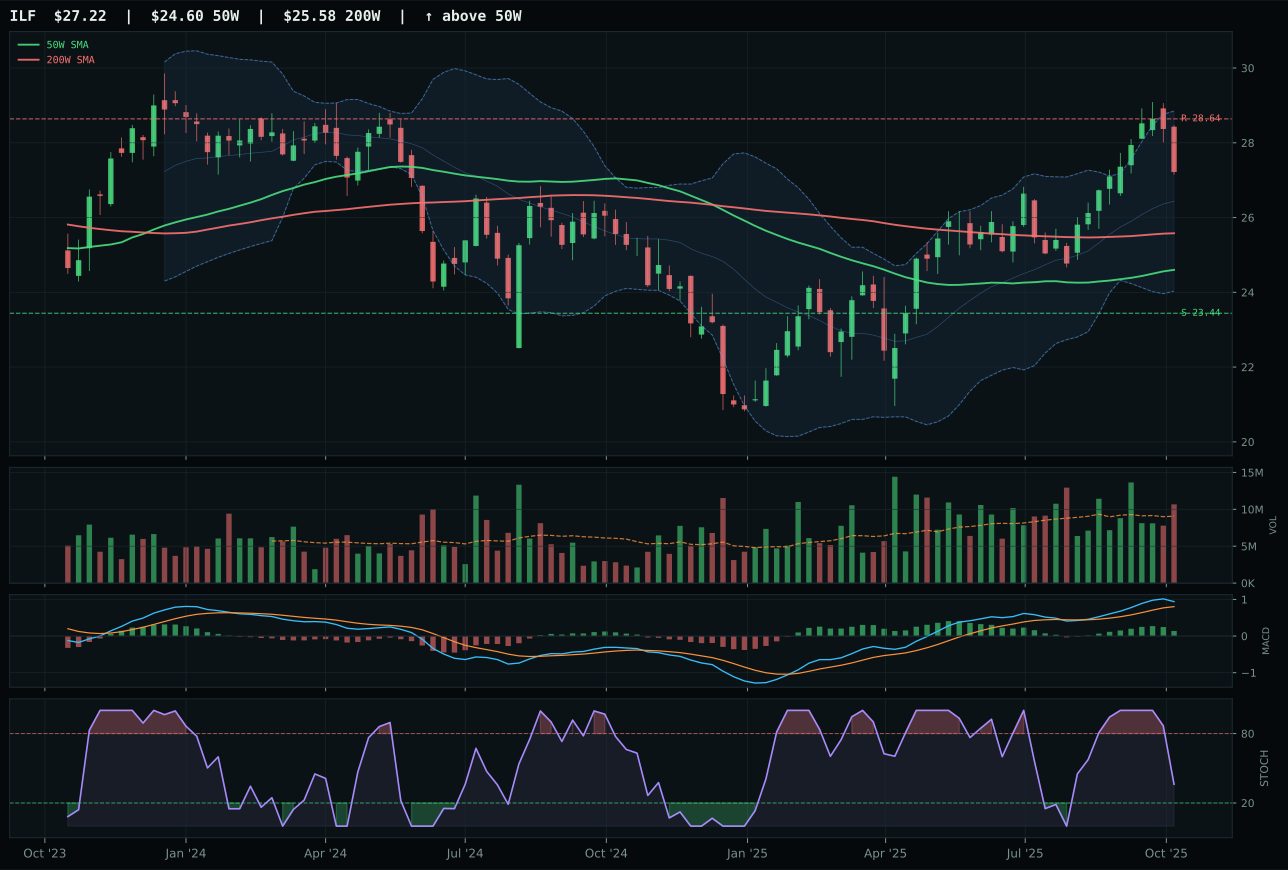
ILF has a neutral structure profile with 2.2% 13-week relative strength versus SPY.
A failed hold above support would weaken the setup.
Actionable but governed by invalidation levels.
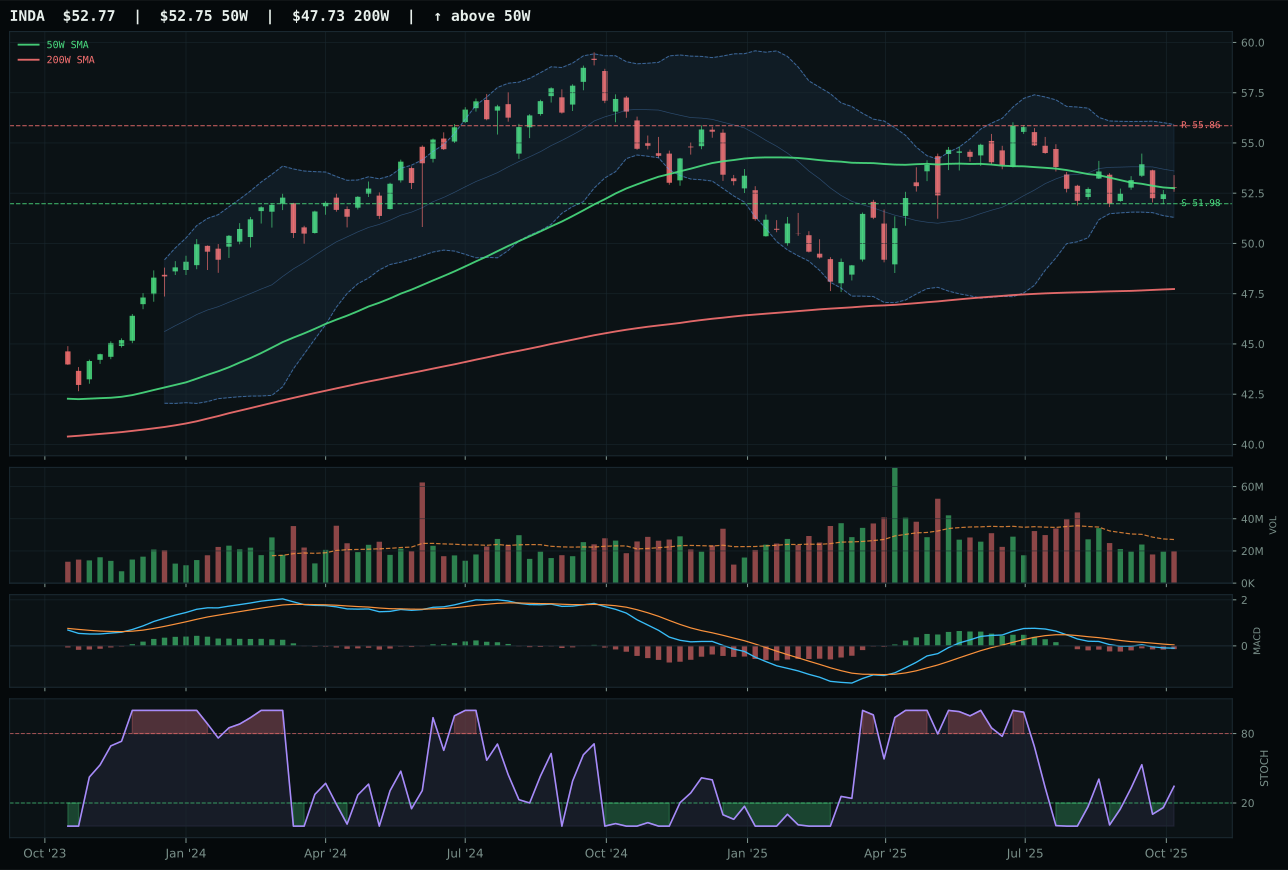
INDA has a pullback into support profile with -8.6% 13-week relative strength versus SPY.
A failed hold above support would weaken the setup.
Actionable but governed by invalidation levels.
IEMG edged ILF in a category where both technical profiles are nearly identical (77 vs 77 composite scores), both showing neutral structures with bullish but flattening MACD and 13W returns of 6.9%. The margin of victory is razor-thin: category-relative strength of 0.1% versus ILF's 0.0%, which tells you that IEMG is holding its peer weight by the slimmest margin. Both ETFs have identical RS versus SPY (2.2%), identical thirteen-week returns, and nearly identical support/resistance bands, so this is a hair-trigger decision. IEMG's stochastic RSI is oversold at 0.08, while ILF's is falling/neutral, which gives IEMG a fractionally better setup for oversold recovery. However, the category-level technical evidence of roughly 70/100 across the peer set reflects a market that is holding emerging markets but without conviction; macro headwinds from credit stress (-8) and liquidity stress (-8) have suffocated the category.
Emerging Markets earned 0% allocation this week, ranked 9th or 10th, after a final category score of 38.0 that places it in the lowest tier despite respectable technical mechanics. Category-level macro fit is weak at 30.0/100, severely damaged by credit stress (-10) and liquidity stress (-10), which are portfolio-wide headwinds that hit developing markets first and hardest. IEMG's technical evidence of 70.1/100 is reasonable, but macro narrative fit is only 34.0/100, which caps the category score regardless of chart quality. The regime is hostile to emerging markets: credit stress and liquidity stress are active descriptors, and the disinflation environment provides no commodity bid to support commodity-linked EM exposure. IEMG would need either a sharp improvement in credit conditions, a stability signal on US dollar strength, or a commodity rally to earn even a tier-2 allocation. For now the category is entirely outside the portfolio because macro headwinds overwhelm decent chart mechanics.
Agriculture & Livestock — MOO
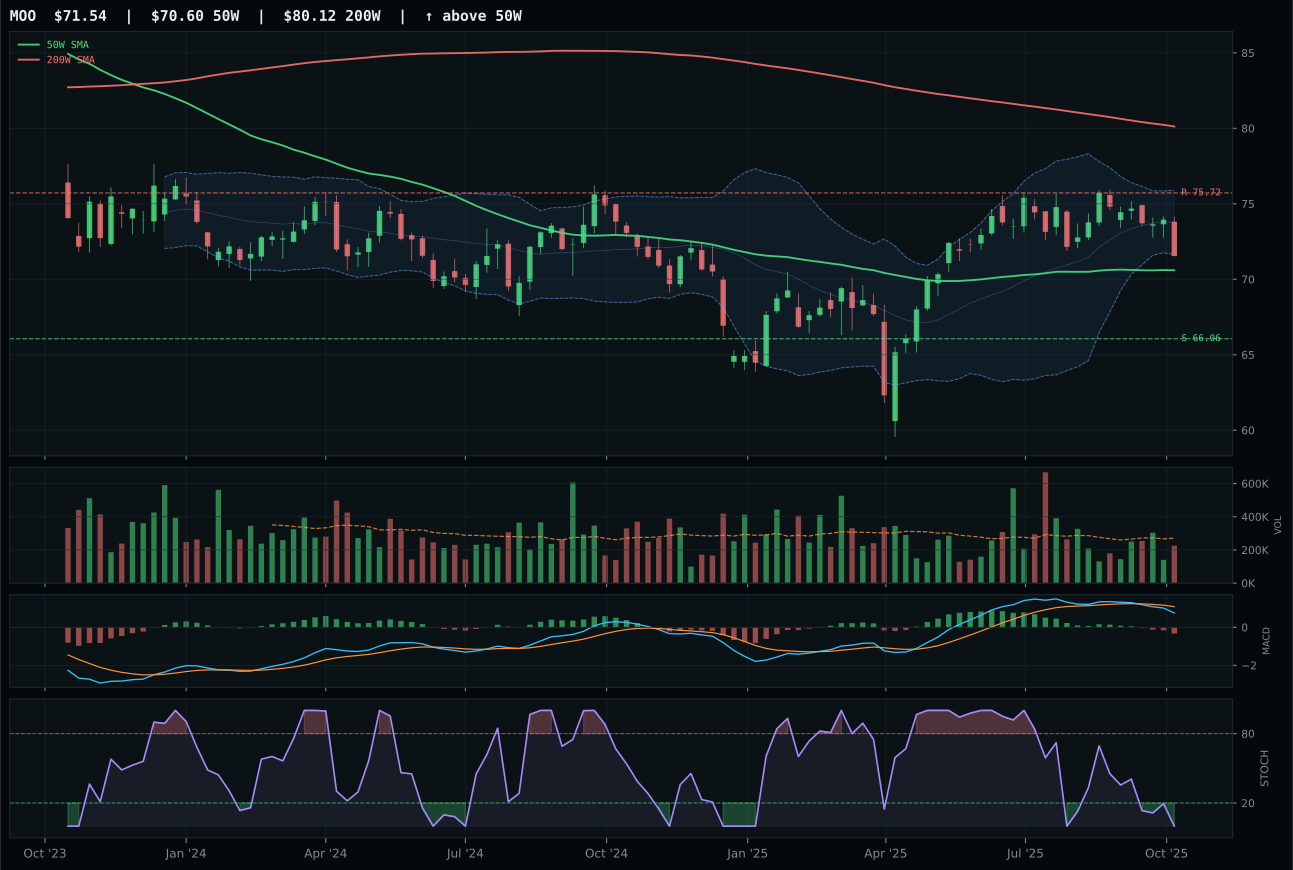
MOO has a compression near 50W profile with -8.6% 13-week relative strength versus SPY.
A failed hold above support would weaken the setup.
Actionable but governed by invalidation levels.
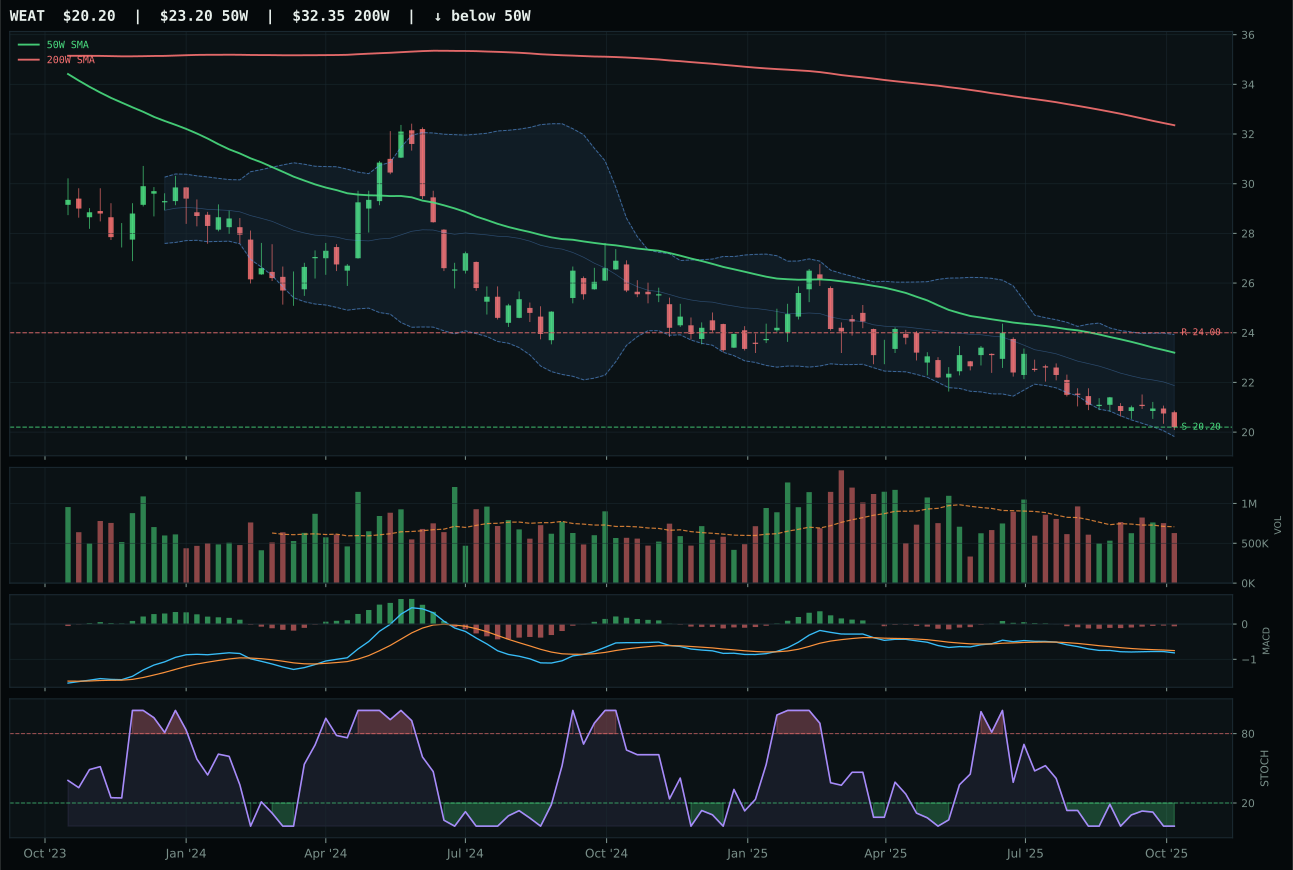
WEAT has a pullback into support profile with -14.9% 13-week relative strength versus SPY.
Extension and support failure are the main tactical risks.
Tracked, but not top-2 eligible because: structurally broken.
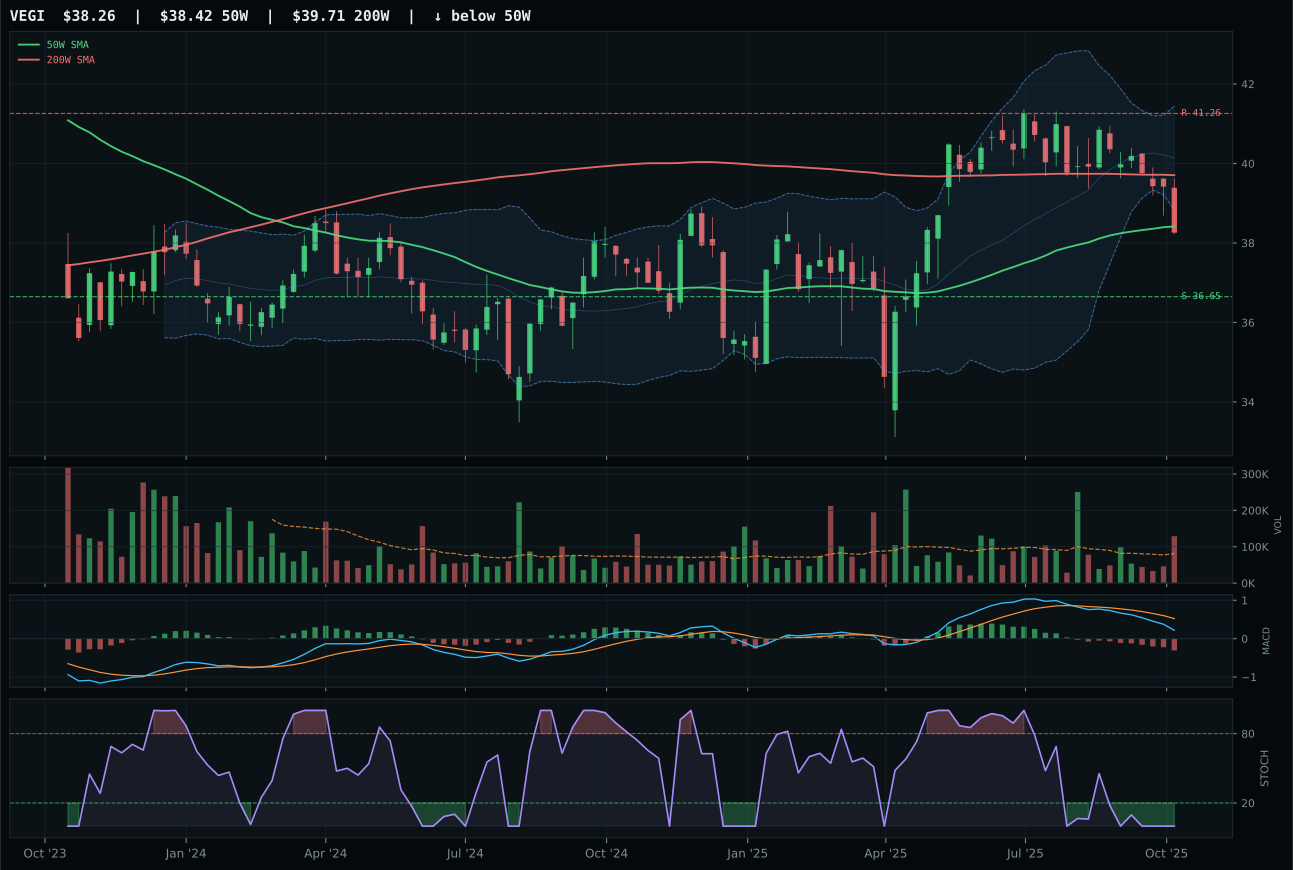
VEGI has a pullback into support profile with -10.8% 13-week relative strength versus SPY.
Extension and support failure are the main tactical risks.
Tracked, but not top-2 eligible because: structurally broken.
MOO wins a severely compromised category by avoiding the worst technical damage: its trend score of 29.1/100 is weak, but its timing score of 95.0/100 reveals that price sits just 1.3% below the 50W with MACD bearish/weakening and stochastic RSI completely oversold at 0.00. The setup is compression near support, not structural breakdown—the kind of setup that can explode if buyers defend the level. WEAT lost to MOO despite a marginally closer 13W return (-10.2% vs MOO's -3.9%) because its structure is broken (39.9 vs 73.3), timing score is lower (65.0 vs 95.0), and category-relative strength is worse (-4.2% vs 2.2%). MOO's volume is neutral and momentum is weak, but the chart has defined invalidation support at 66.06, which makes it a higher-quality setup than WEAT's pullback-into-support pattern. In a category where all three ETFs are technically broken, the one with the best timing filter and cleanest support structure wins by default.
Agriculture & Livestock earned 0% allocation this week, ranked 9th or 10th, after a final category score of 9.2 that reflects comprehensive technical and macro failure. Category-level macro fit is 45.0/100, hit by disinflation pressure (-8), which directly hurts real asset demand, and liquidity stress (-4). MOO's technical evidence is only 33.4/100—the lowest in its peer set—and although macro fit at 50.0/100 provides minimal support from real asset sponsorship (+5) and commodity breadth (+5), the 38% weighting of macro in the final score cannot salvage a category with sub-40 technical evidence across all three representatives. Disinflation is the regime enemy for agriculture; this category will require either a pivot toward inflation expectations or a sustained breakout above the 50W and 200W to earn any allocation slot. Right now it is outside the portfolio entirely because the chart and macro work against it in tandem.