
2025-10-03
Informational purposes only. The content in this report, including allocations, analysis, and commentary, is provided solely for informational and educational purposes. It does not constitute financial advice, investment advice, trading advice, or any other type of advice. Past performance does not guarantee future results. Always conduct your own research and consult a qualified financial professional before making investment decisions.
Weekly Allocation
| Ticker | Category | Weight | Role |
|---|---|---|---|
| FBTC | 50% | Overlay | |
| COPX | Industrial Metals | 10% | Top-2 (10%) |
| SLV | Precious Metals | 10% | Top-2 (10%) |
| SMH | AI | 5% | Tier-2 (5%) |
| URA | Nuclear Energy | 5% | Tier-2 (5%) |
| XAR | Defense & Aerospace | 5% | Tier-2 (5%) |
| XLU | Utilities & Infrastructure | 5% | Tier-2 (5%) |
| XLK | Technology | 5% | Tier-2 (5%) |
| XLE | Traditional Energy | 5% | Tier-2 (5%) |
Trade Instructions — Monday Open
Sell the tranche from 2025-09-05 (completing its 4-week hold). Buy the new tranche. Instructions show net portfolio changes — same-asset positions cancel, weight changes show the delta.
| Action | Ticker | Instruction |
|---|---|---|
| SELL | GLD | Sell 50% of GLD position (reduce 5.00% → 2.50%) |
| SELL | URNM | Sell 50% of URNM position (reduce 2.50% → 1.25%) |
| SELL | AIQ | Sell 20% of AIQ position (reduce 6.25% → 5.00%) |
| SELL | PAVE | Sell 33% of PAVE position (reduce 3.75% → 2.50%) |
| SELL | CIBR | Sell 50% of CIBR position (reduce 2.50% → 1.25%) |
| SELL | ILF | Sell 25% of ILF position (reduce 5.00% → 3.75%) |
| BUY | URA | Buy URA — 14.29% of freed cash (adds 1.25% to portfolio) |
| BUY | SLV | Buy SLV — 28.57% of freed cash (adds 2.50% to portfolio) |
| BUY | SMH | Buy SMH — 14.29% of freed cash (adds 1.25% to portfolio) |
| BUY | XLE | Buy XLE — 14.29% of freed cash (adds 1.25% to portfolio) |
| BUY | XLU | Buy XLU — 14.29% of freed cash (adds 1.25% to portfolio) |
| BUY | XLK | Buy XLK — 14.29% of freed cash (adds 1.25% to portfolio) |
Current Portfolio After Trade
Combined holdings across all 4 active tranches. Each tranche is 25% of the portfolio.
| Ticker | % of Portfolio | Weight Bar |
|---|---|---|
| FBTC | 50.00% | |
| COPX | 10.00% | |
| AIQ | 5.00% | |
| SLV | 5.00% | |
| XAR | 3.75% | |
| ILF | 3.75% | |
| URA | 3.75% | |
| PAVE | 2.50% | |
| GLD | 2.50% | |
| IGV | 2.50% | |
| SMH | 2.50% | |
| XLE | 2.50% | |
| XLU | 2.50% | |
| URNM | 1.25% | |
| CIBR | 1.25% | |
| XLK | 1.25% |
Macro Regime — Transition / Mixed
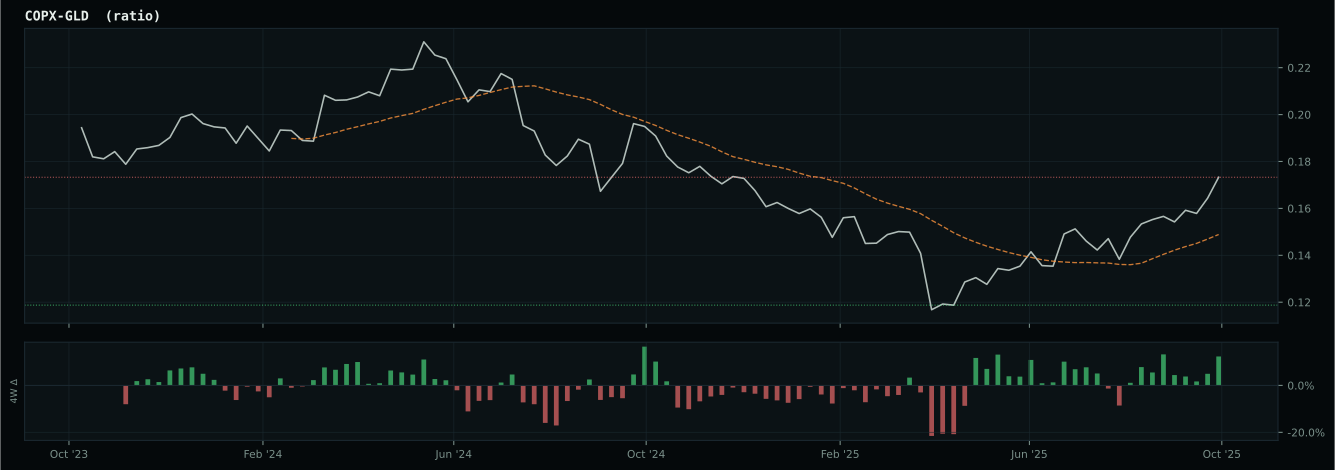
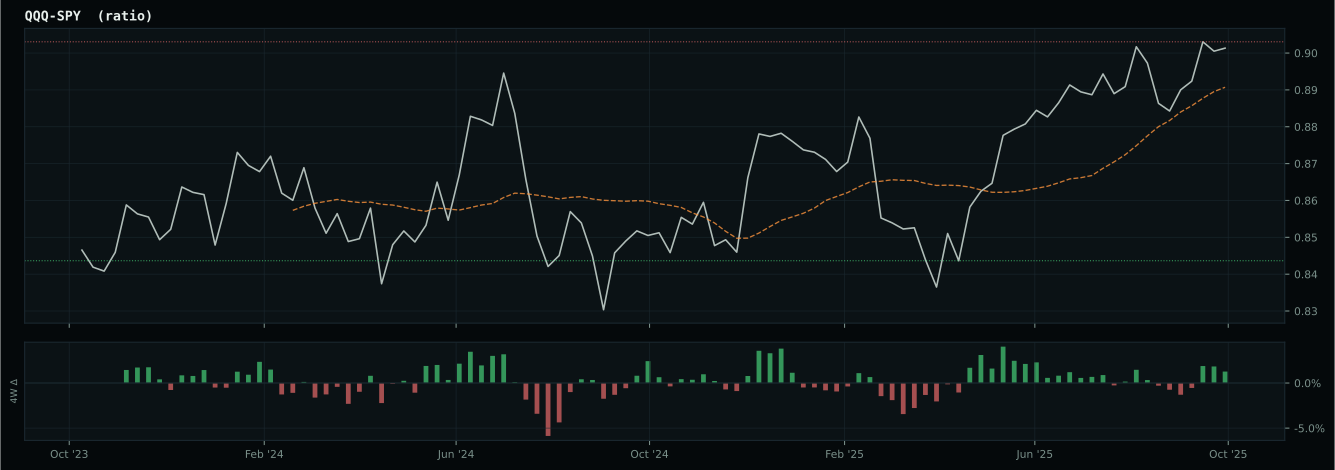
Macro Evidence Charts
Market-implied signals behind the macro regime scores. Each ratio compares two assets; the direction and slope of the ratio is what the macro engine reads.
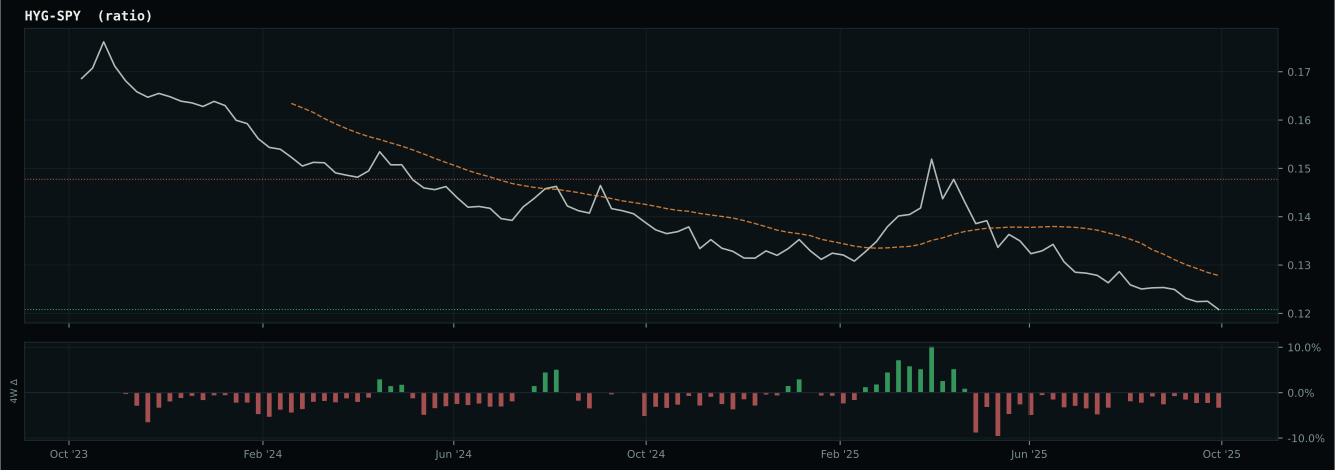
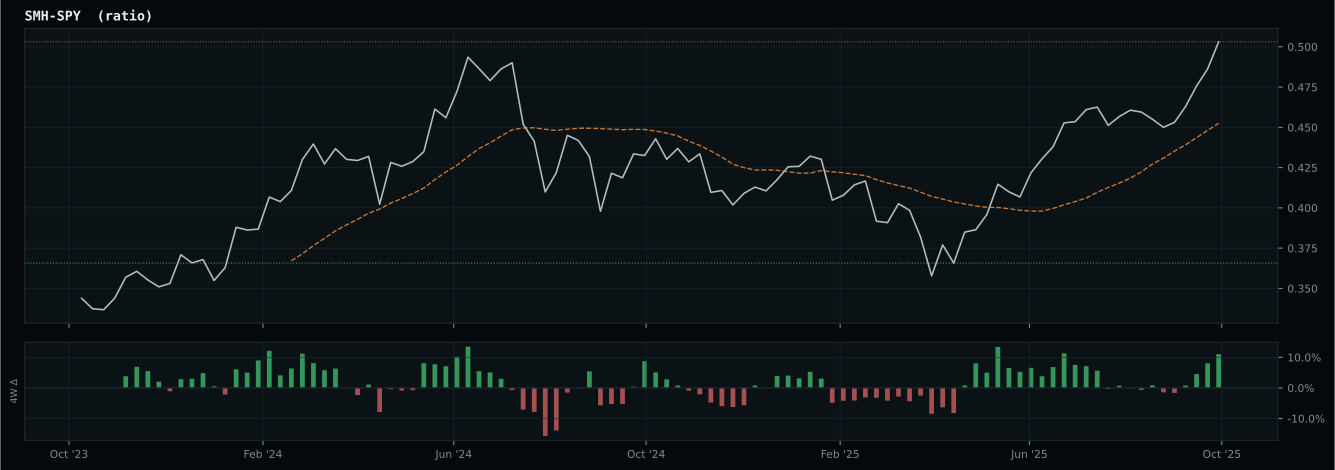
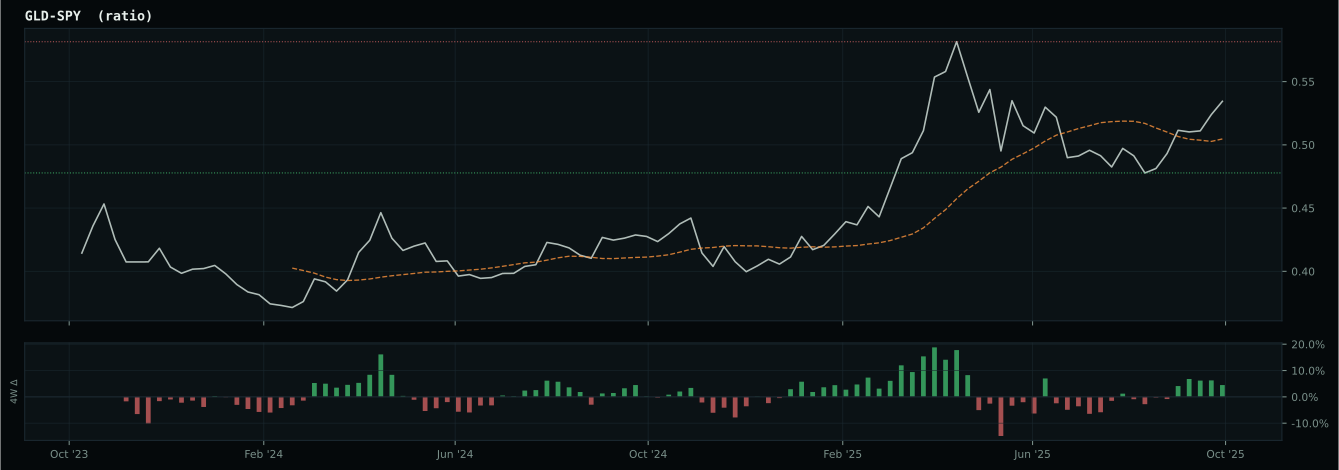
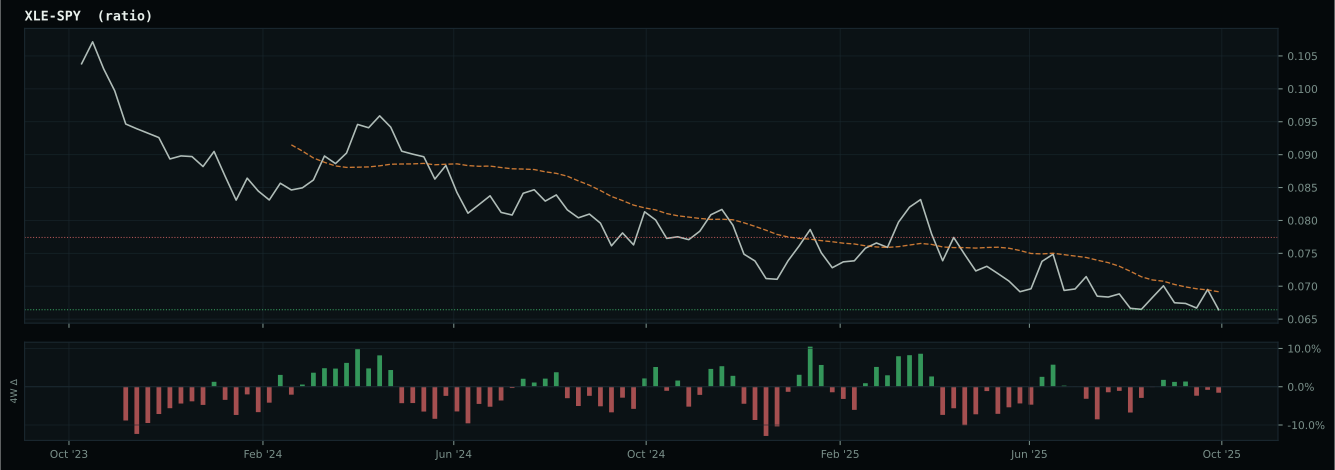
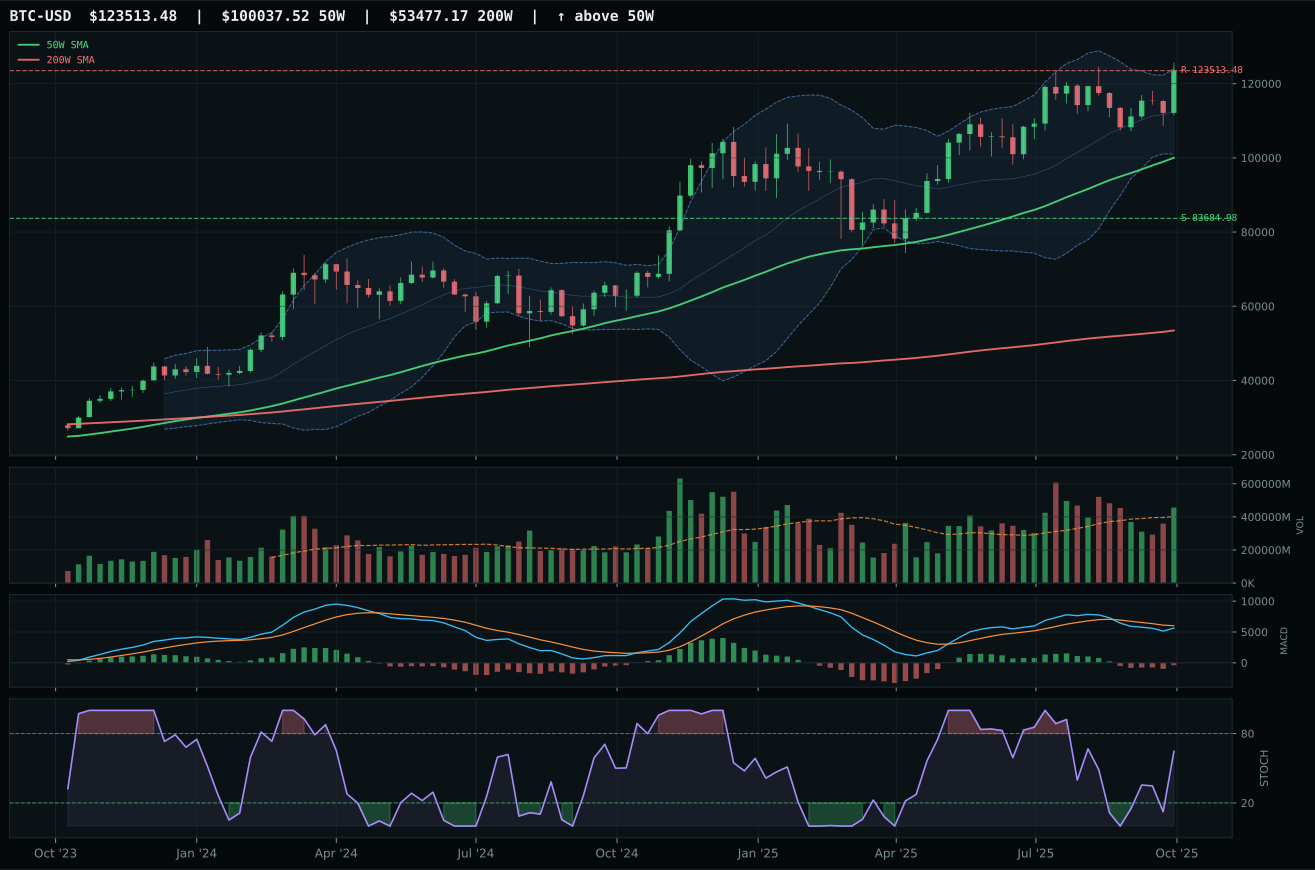
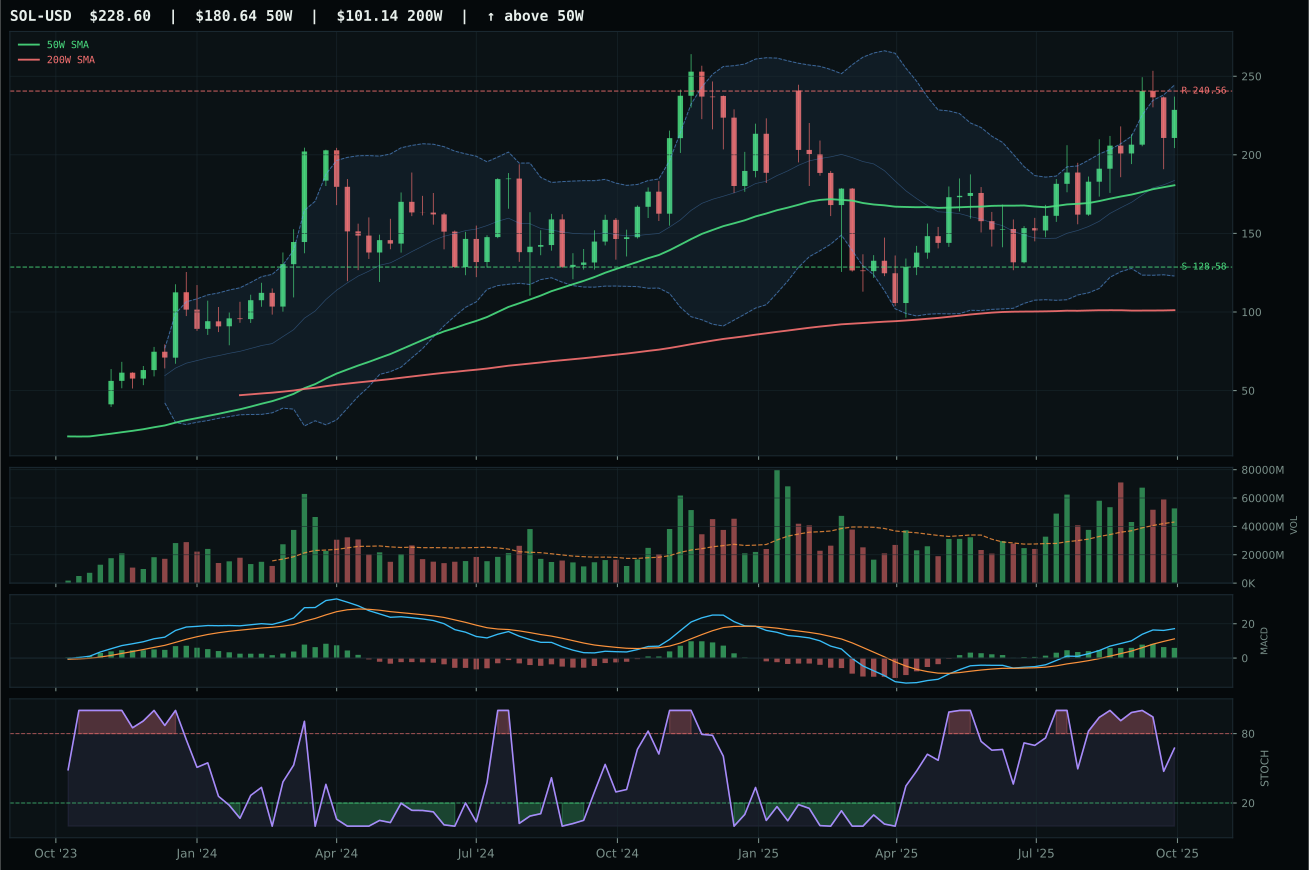
Crypto Regime — TrendBTC
ValueBTC not armed: BTC has not made the first post-breakdown touch of the 200W buy zone after losing the 50W
TrendBTC confirmed: 2 consecutive closes above rising/flat 50W SMA
one or more available conditions failed
Category Rankings
| Rank | Category | Winner | Score | Alloc | 4W Ret | Peers (4W) |
|---|---|---|---|---|---|---|
| 1 | Industrial Metals | COPX | 79.5 | 20% | -1.83% | REMX -8.9% · PICK +1.2% |
| 2 | Precious Metals | SLV | 79.3 | 20% | +0.55% | GDX -8.1% · GLD +1.9% |
| 3 | AI | SMH | 67.2 | 10% | +6.43% | BOTZ +2.1% · AIQ +4.9% |
| 4 | Nuclear Energy | URA | 66.9 | 10% | +7.81% | NLR +7.1% · URNM +4.9% |
| 5 | Defense & Aerospace | XAR | 61.2 | 10% | +2.64% | ITA +2.4% · ROKT +1.4% |
| 6 | Utilities & Infrastructure | XLU | 60.6 | 10% | -0.45% | PAVE +0.2% · IGF -1.0% |
| 7 | Technology | XLK | 58.1 | 10% | +5.20% | IGV +0.3% · CIBR +0.5% |
| 8 | Traditional Energy | XLE | 38.2 | 10% | -1.48% | XOP -5.6% · FCG -6.0% |
| 9 | Emerging Markets | IEMG | 25.2 | 0% | +2.49% | ILF +4.1% · INDA +2.9% |
| 10 | Agriculture & Livestock | MOO | 22.7 | 0% | -3.52% | VEGI -2.7% · WEAT +3.1% |
Industrial Metals — COPX
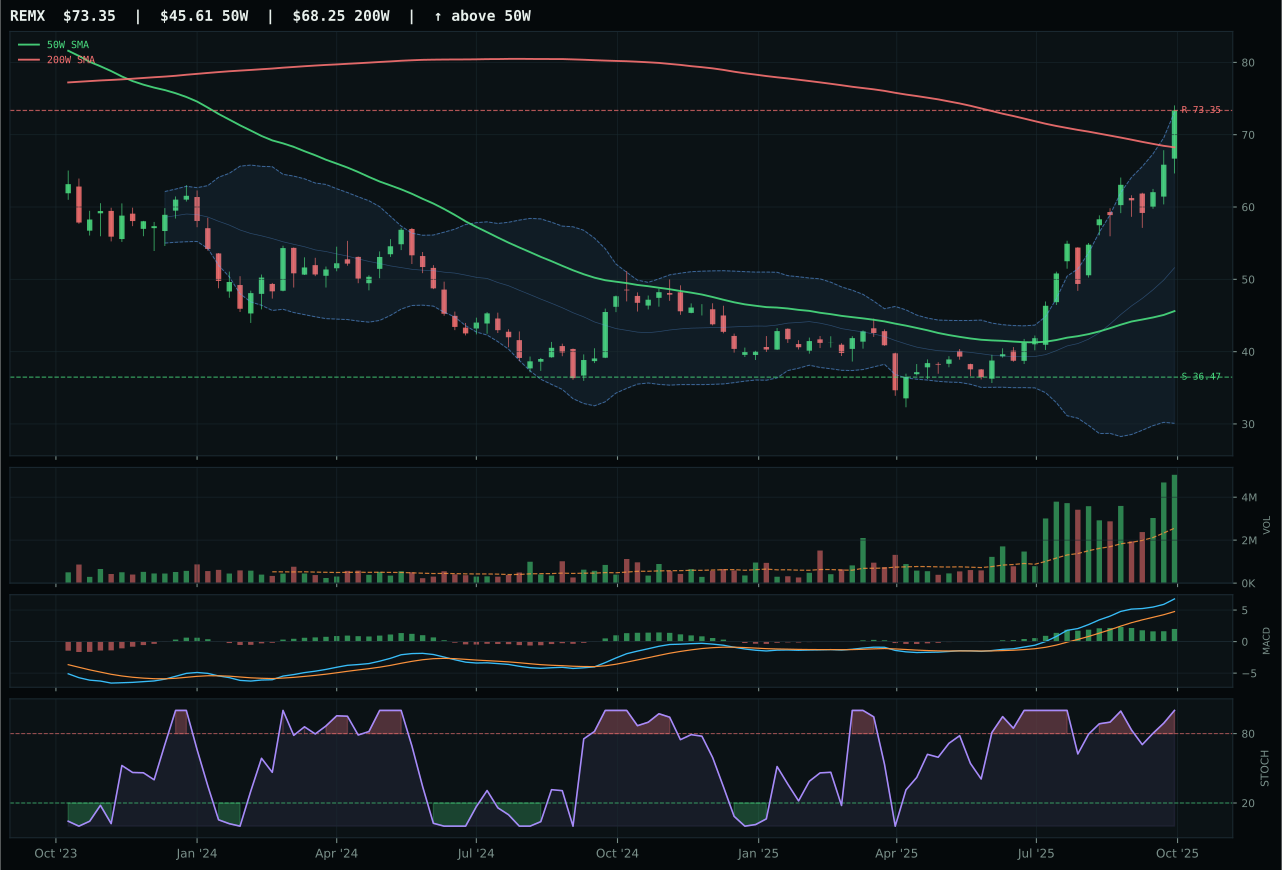
REMX has a vertical extension profile with 68.2% 13-week relative strength versus SPY.
A failed hold above support would weaken the setup.
Actionable but governed by invalidation levels.
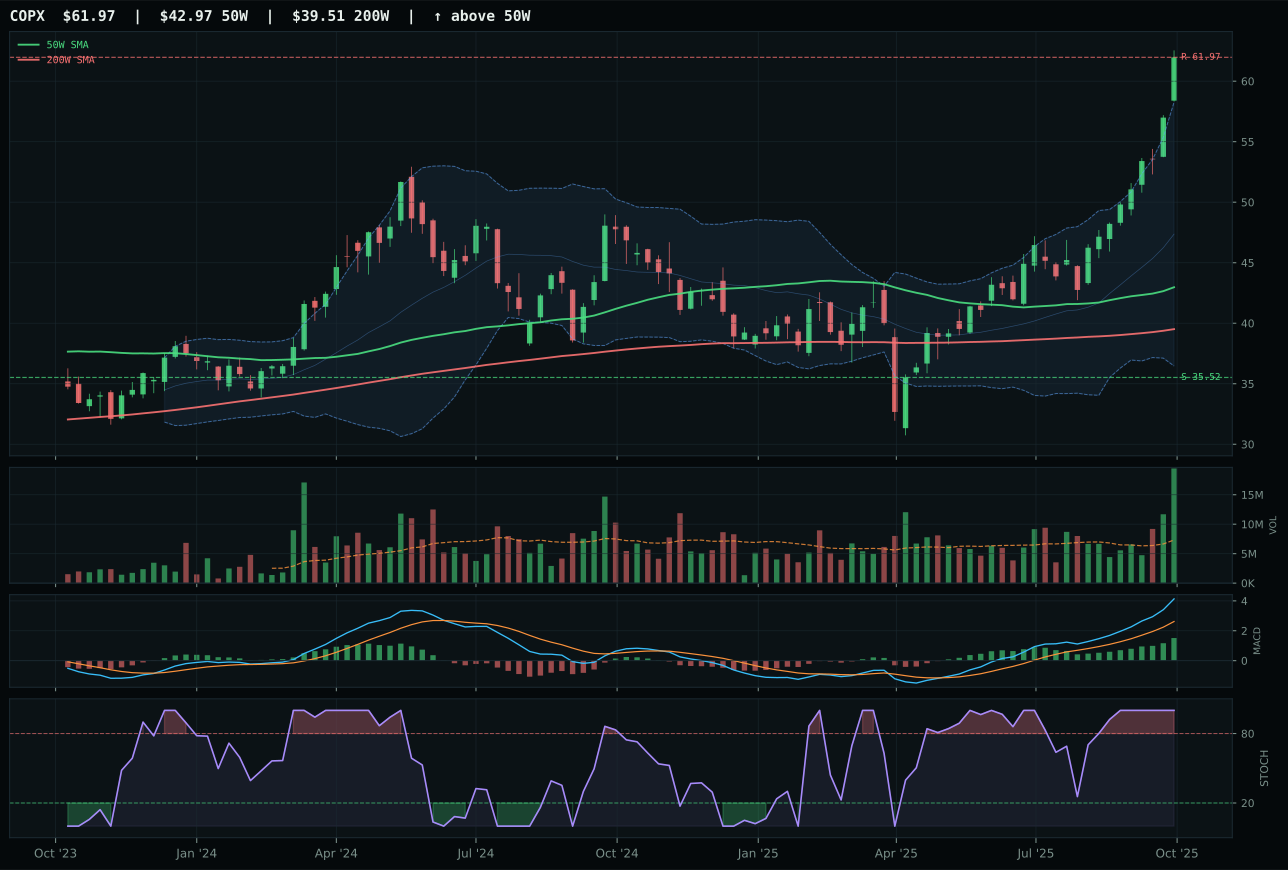
COPX has a vertical extension profile with 26.4% 13-week relative strength versus SPY.
A failed hold above support would weaken the setup.
Actionable but governed by invalidation levels.
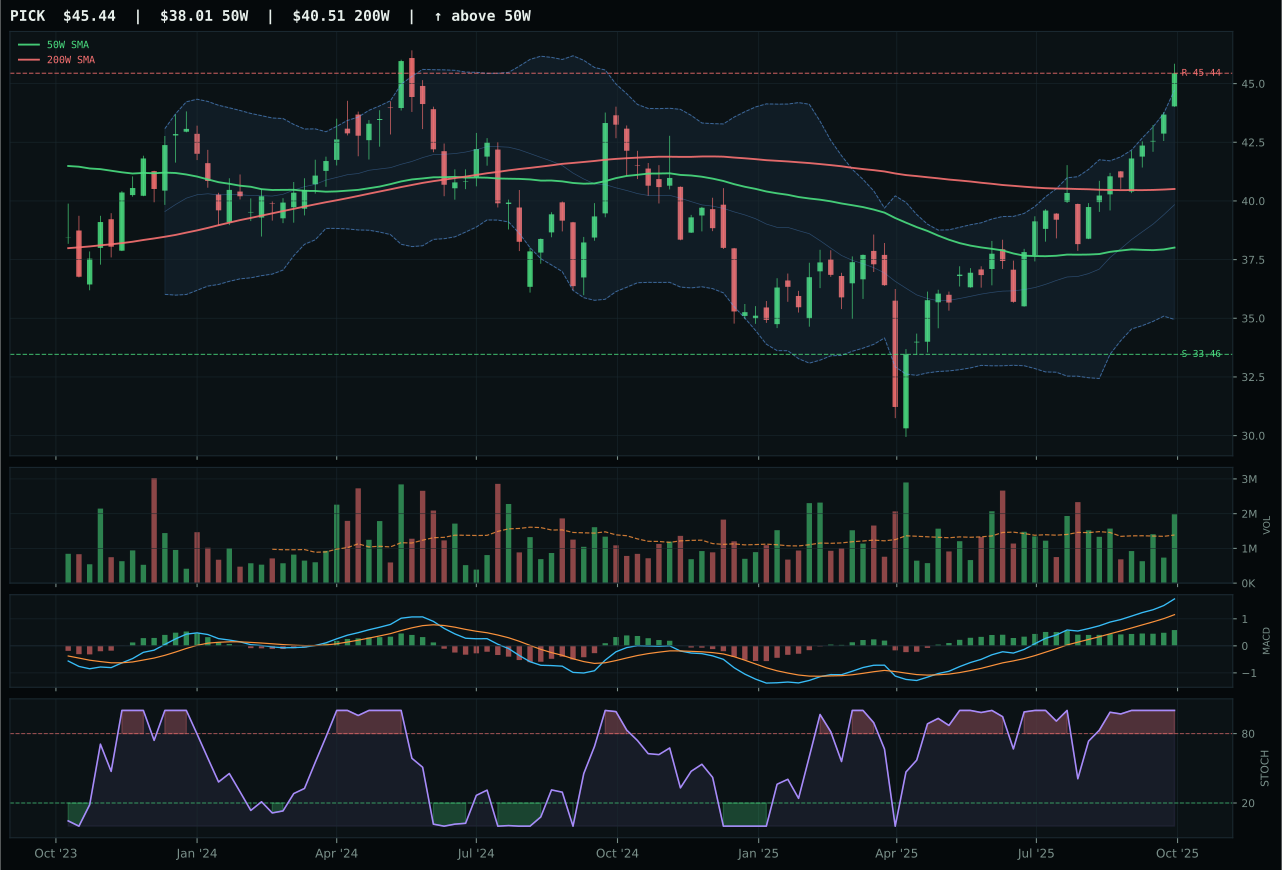
PICK has a vertical extension profile with 9.1% 13-week relative strength versus SPY.
A failed hold above support would weaken the setup.
Actionable but governed by invalidation levels.
COPX wins Industrial Metals at 79.5, earning a top-2 slot, with a 6.2-point margin over REMX despite REMX's superior technical evidence (100.0 vs 90.7 trend) because COPX owns decisive timing and structure advantages that matter more in extended markets. COPX sits 44.2% above the 50-week with cleaner vertical extension (87.2 structure vs 82.1), bullish-and-improving MACD versus REMX's bullish-but-flattening momentum, and 100.0/100 persistence score that indicates the move is being sustained by accumulation. REMX's 75.2% 13-week return and 68.2% SPY-relative strength are extraordinary but create a 60.8% extension above the 50-week that leaves minimal reward for new entrants. The volume confirmation (89.4 for COPX vs 100.0 for REMX) appears to favor REMX until one reads the composition: REMX's maximum volume reflects compression and break, while COPX's rising volume reflects organic institutional buying into a cleaner setup. Copper's industrial scarcity narrative (+12 in macro) outweighs rare earth's supply-chain urgency when timing symmetry favors copper's entry points.
Industrial Metals earns 10% allocation as a top-2 overweight with a 79.5 category score, making it the highest-ranked category overall alongside Precious Metals and ahead of all other exposures. The macro fit of 65.0/100 is driven by metals scarcity (+14), commodity breadth positive (+10), and real asset sponsorship (+6), creating a narrative tailwind that both precious and industrial metals ride together. However, Industrial Metals distinguishes itself through sheer momentum breadth: COPX's 33.4% 13-week return, REMX's 75.2%, and PICK's 16.1% create a three-way leadership structure that justifies tier-1 capital allocation over all other categories. The 44.2% extension in COPX above the 50-week is steep, yet the 2.66x accumulation volume and 100.0/100 persistence score indicate that professional capital continues to defend these levels aggressively. This represents the market's highest-conviction positioning: inflation protection via commodity scarcity in a regime where liquidity stress is tightening supply and demand-side AI growth (copper for data center buildout) remains intact. The 10% allocation reflects both technical leadership and macro synchronization that peers cannot match.
Precious Metals — SLV
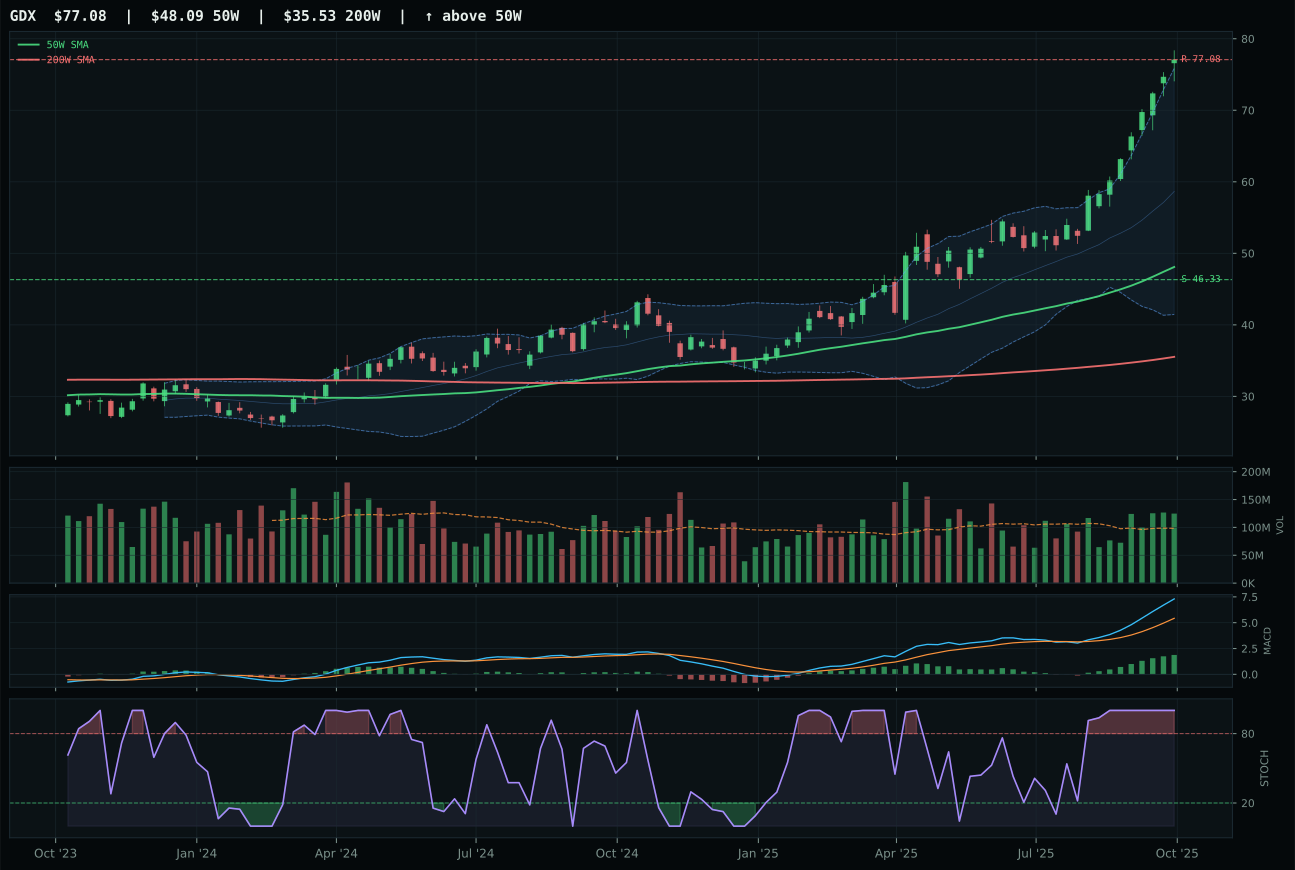
GDX has a vertical extension profile with 38.7% 13-week relative strength versus SPY.
A failed hold above support would weaken the setup.
Actionable but governed by invalidation levels.
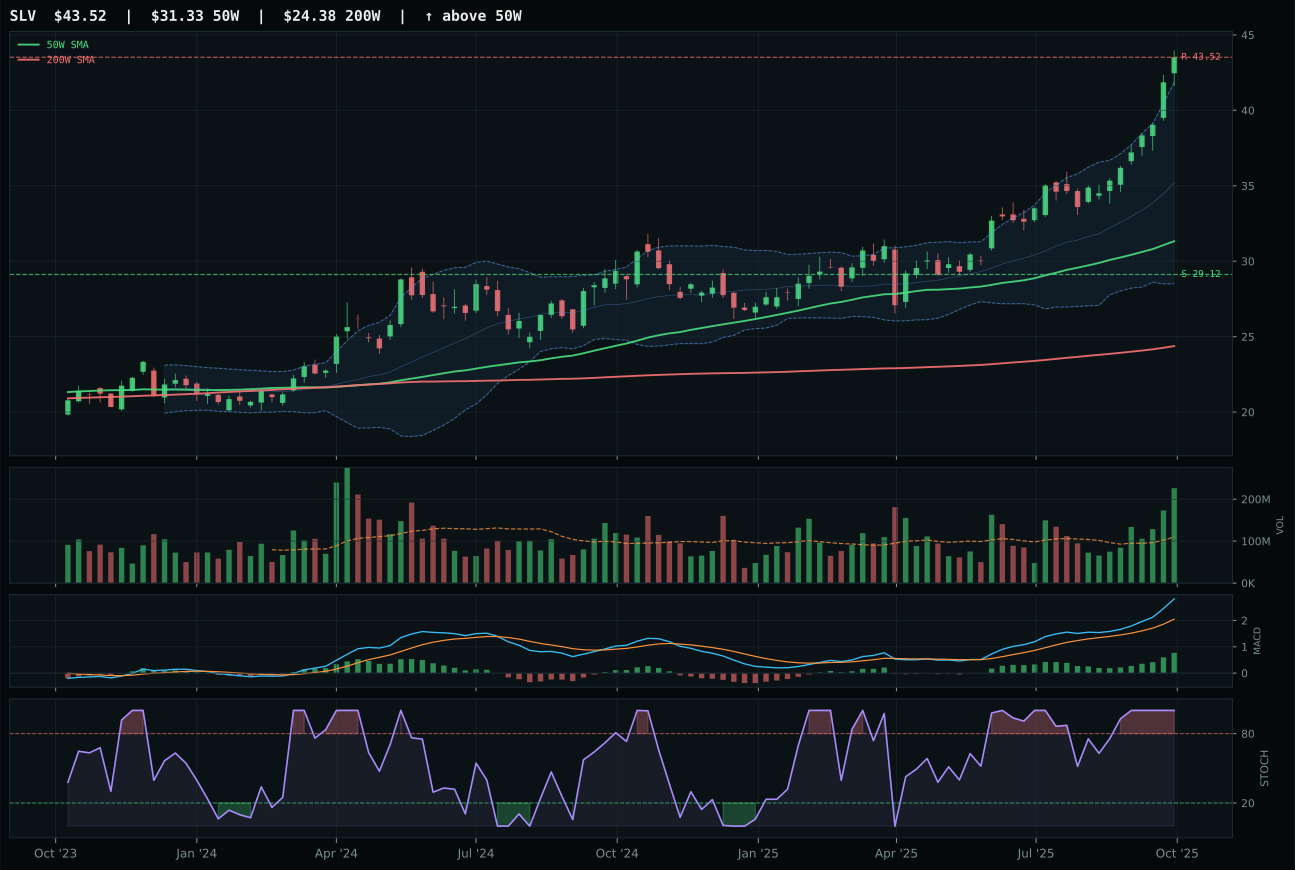
SLV has a vertical extension profile with 22.9% 13-week relative strength versus SPY.
A failed hold above support would weaken the setup.
Actionable but governed by invalidation levels.
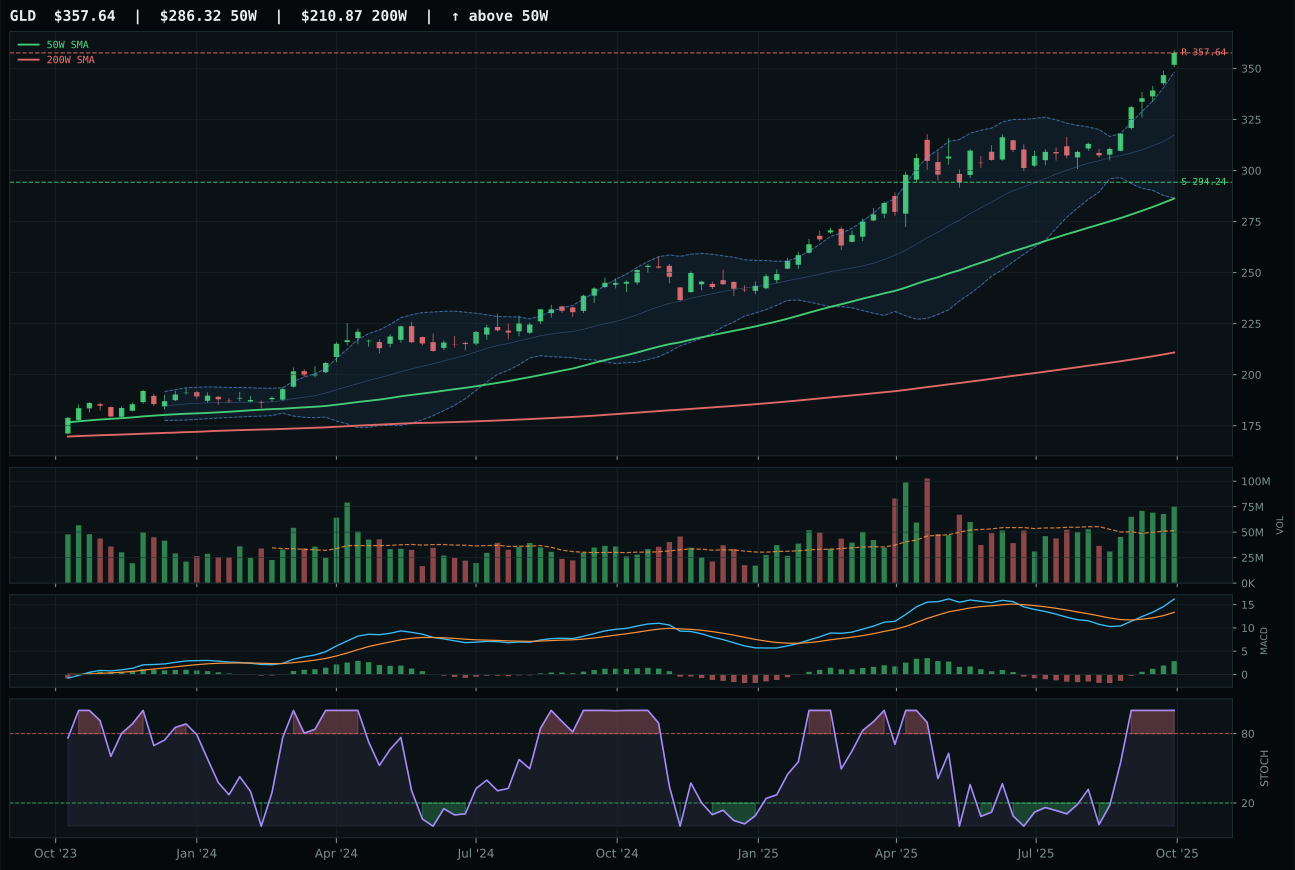
GLD has a vertical extension profile with 9.4% 13-week relative strength versus SPY.
A failed hold above support would weaken the setup.
Actionable but governed by invalidation levels.
SLV wins Precious Metals and earns a top-2 allocation slot at 79.3 with a 1.2-point margin over GDX because it delivers the rare combination of clean vertical extension (38.9% above the 50-week, not GDX's extreme 60.3%), heavier volume confirmation (accumulation at 2.05x the 20-week versus GDX's above-average 1.28x), and category-neutral relative strength that avoids the crowding present in GDX's 15.8% category overweight. SLV's 29.9% 13-week return trails GDX's 45.7%, yet SLV's 22.9% SPY-relative strength versus GDX's 38.7% indicates that silver's move is more balanced between monetary and industrial demand, whereas gold miners are leveraged purely to the monetary hedge. MACD is bullish and improving for both, but SLV's structure (85.6 vs 83.6) and risk/reward (44.9 vs 39.2) favor the less-extended setup. GDX's superior technical evidence (90.7 vs 89.6) cannot overcome its timing liability: at 60.3% above the 50-week, every new buyer is late, and the macro fit (46.0/100) is weaker than SLV's (59.0/100) because defensive rotation hits miners harder.
Precious Metals earns 10% allocation as a top-2 overweight category with a 79.3 score that reflects the strength of the monetary hedge narrative in the current regime. Liquidity stress and credit stress remain active (-5 and -9 in the macro descriptors, respectively), but monetary hedge bid (+14) and the emerging defensive rotation (+7) create a 67.0/100 category-level macro fit that justifies capital elevation. The 13-week momentum is authentic—SLV's 29.9% and GDX's 45.7% drive genuine category breadth—and the volume confirmation is strong at 88.9/100 for SLV, indicating large institutional participation. The Transition/Mixed regime allows both growth and defensive capital to coexist, and precious metals satisfy both mandates: they provide commodity leverage for inflation hedging while functioning as equity-like momentum vehicles with positive volatility carry. The 10% allocation reflects confidence that the monetary hedge bid will persist as credit stress forces central banks toward accommodation, making silver and gold miners superior carry trades relative to Technology or AI names facing the same liquidity headwinds.
AI — SMH
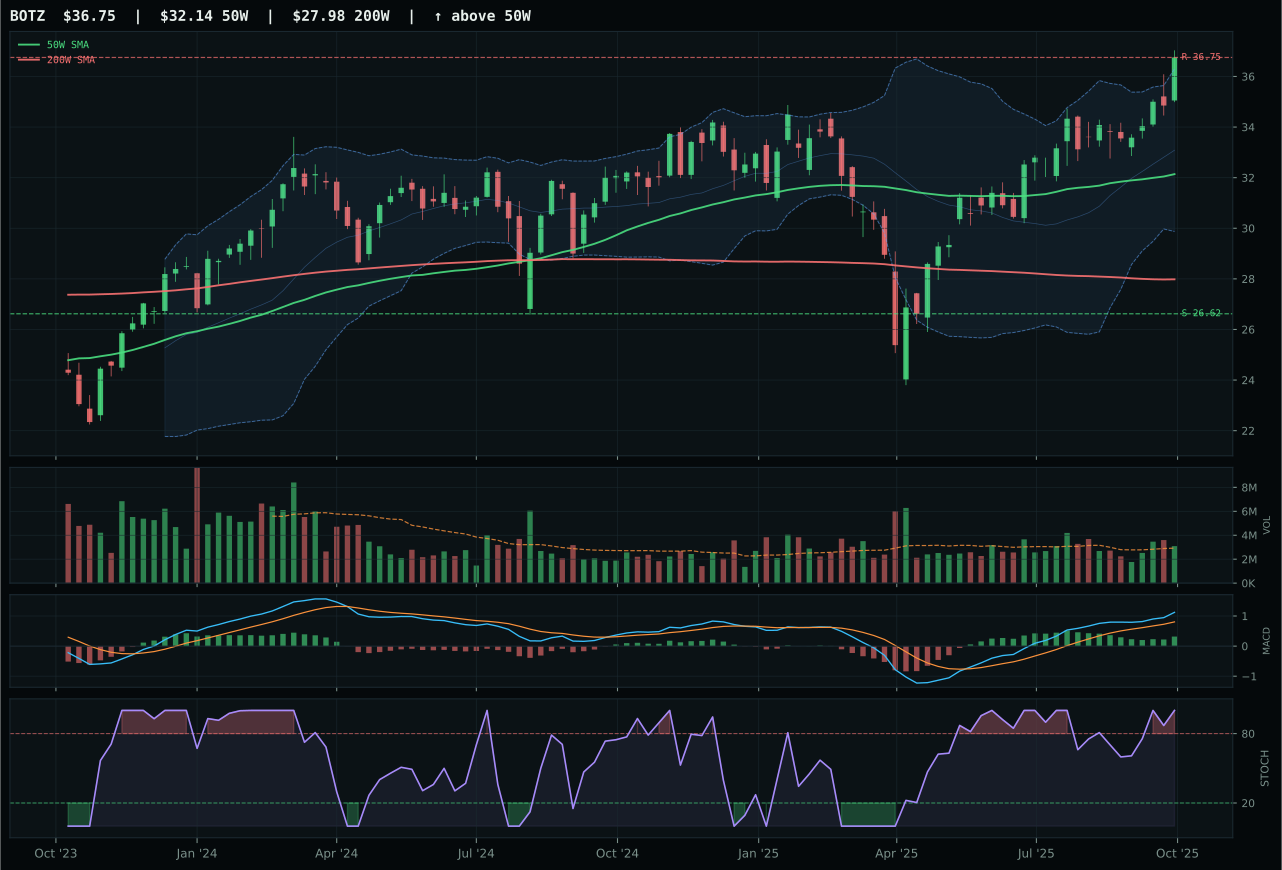
BOTZ has a neutral structure profile with 5.1% 13-week relative strength versus SPY.
A failed hold above support would weaken the setup.
Actionable but governed by invalidation levels.
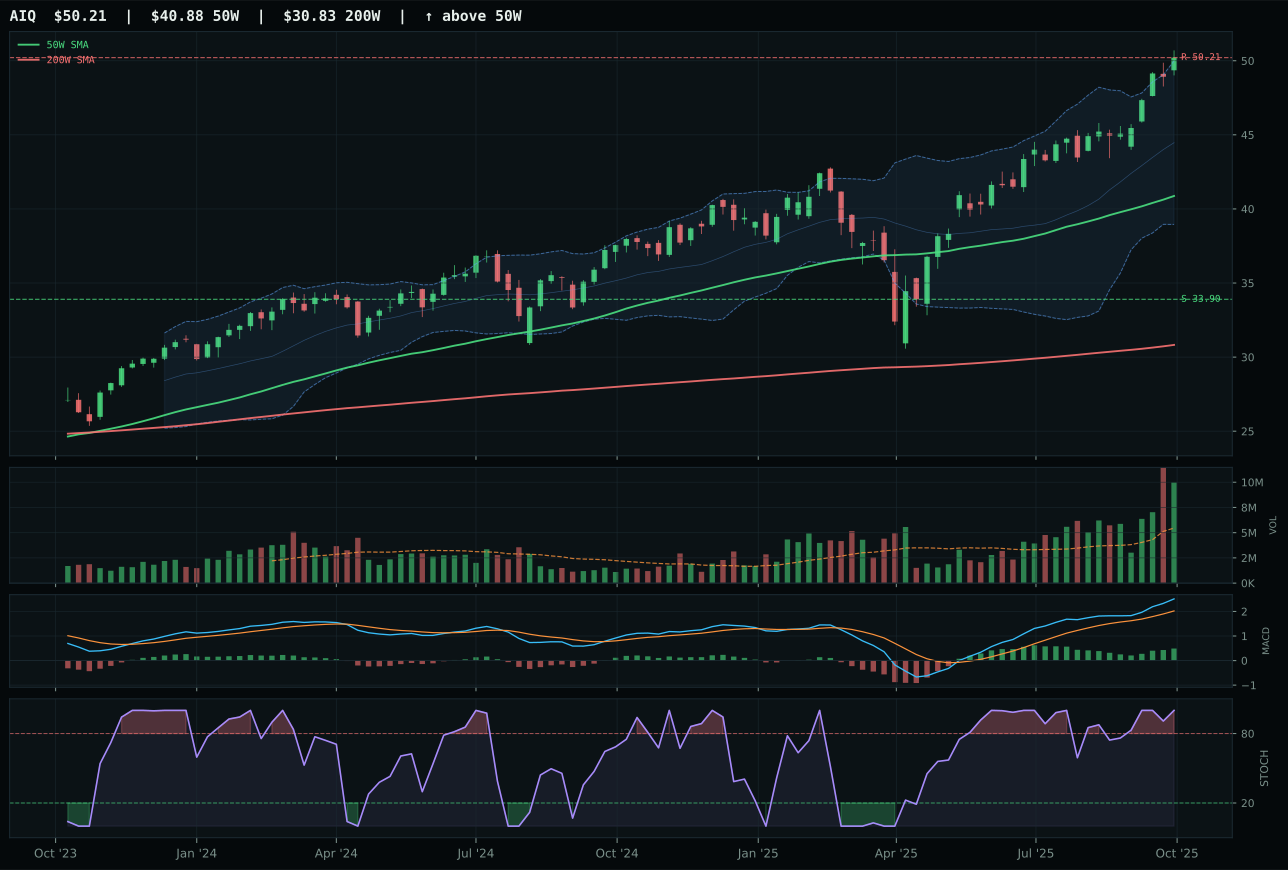
AIQ has a vertical extension profile with 7.1% 13-week relative strength versus SPY.
A failed hold above support would weaken the setup.
Actionable but governed by invalidation levels.
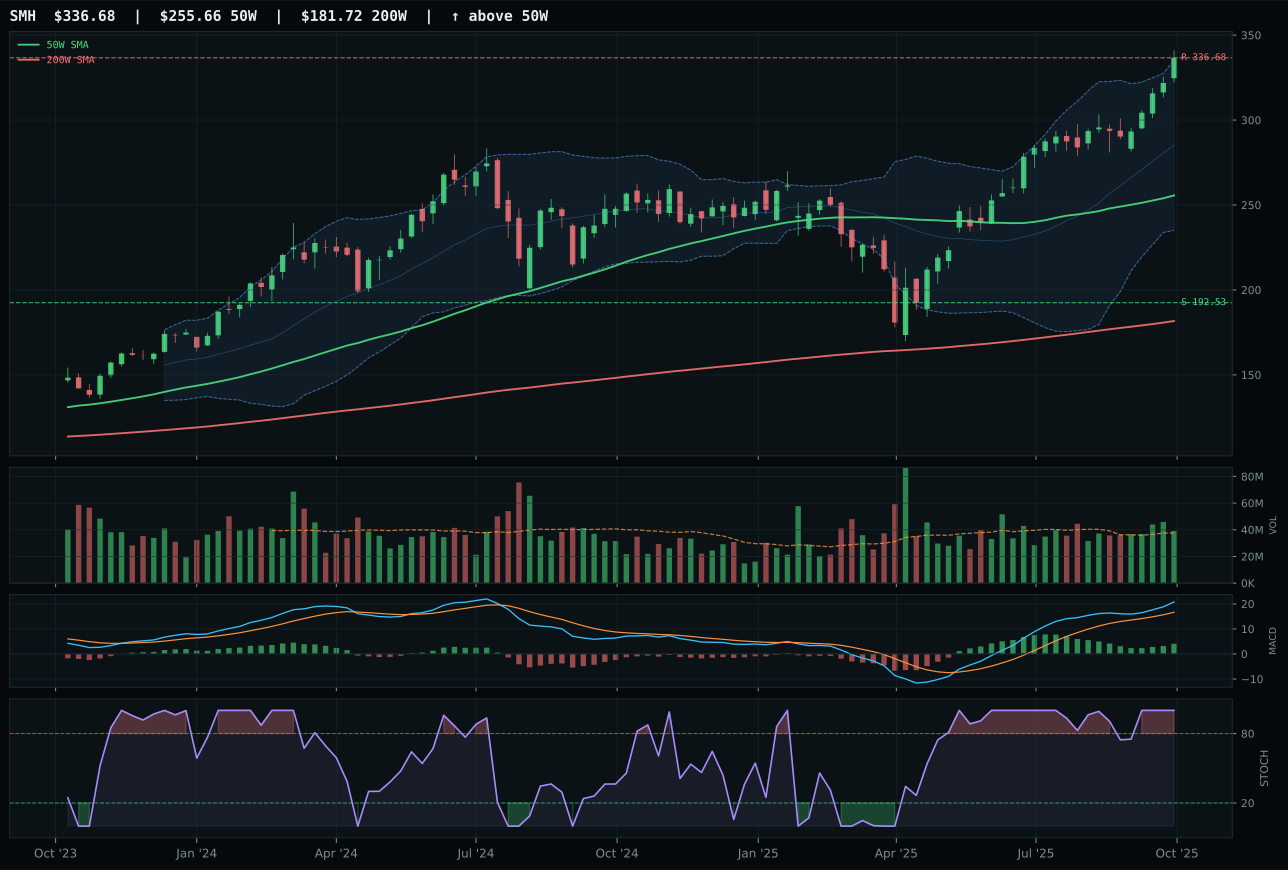
SMH has a vertical extension profile with 11.7% 13-week relative strength versus SPY.
A failed hold above support would weaken the setup.
Actionable but governed by invalidation levels.
SMH wins despite a lower technical evidence score (70.4) than its main competitor BOTZ (81.8) because it owns the decisive category-relative strength edge at 4.6% versus BOTZ's -2.0%, demonstrating that semiconductors are being chosen over robotics as the AI compute proxy in the current market structure. The 13-week return of 18.7% with 11.7% SPY-relative strength and overbought momentum confirmation (stochastic RSI at 1.00) backed by neutral volume creates a setup that buyers are defending despite the 31.7% extension above the 50-week. BOTZ's superior 13-week return of 12.1% and cleaner technical structure (neutral vs vertical extension) prove insufficient when the category itself is repricing the composition of AI exposure away from robotics cyclicality toward semiconductor supply. The scoring gap of -16.2 points between SMH and BOTZ is stark and reflects this compositional repricing, not a superiority in technical purity.
AI ranks third or fourth in category eligibility but receives only 5% allocation in this week's Transition/Mixed regime because two higher-scoring categories—Precious Metals at 79.3 and Industrial Metals at 79.5—capture the 10% tier-2 slots. Although AI's 67.2 category score benefits from strong AI growth sponsorship (+14) and positive risk appetite (+10), the active liquidity stress (-12) and credit stress (-8) descriptors create a 54.0/100 macro fit that penalizes technology-oriented capital deployment. SMH's momentum is real and the 13-week breadth is clean, but the 38.9% downside risk to support (versus 49.5% for precious metals and 74.5% for industrial metals) makes it structurally riskier per unit of allocation capital in an environment where funding conditions are tightening. The 5% position reflects a holding strategy rather than a conviction add; maintaining exposure to AI compute leadership while reserving dry powder for more defensive and commodity-linked opportunities.
Nuclear Energy — URA
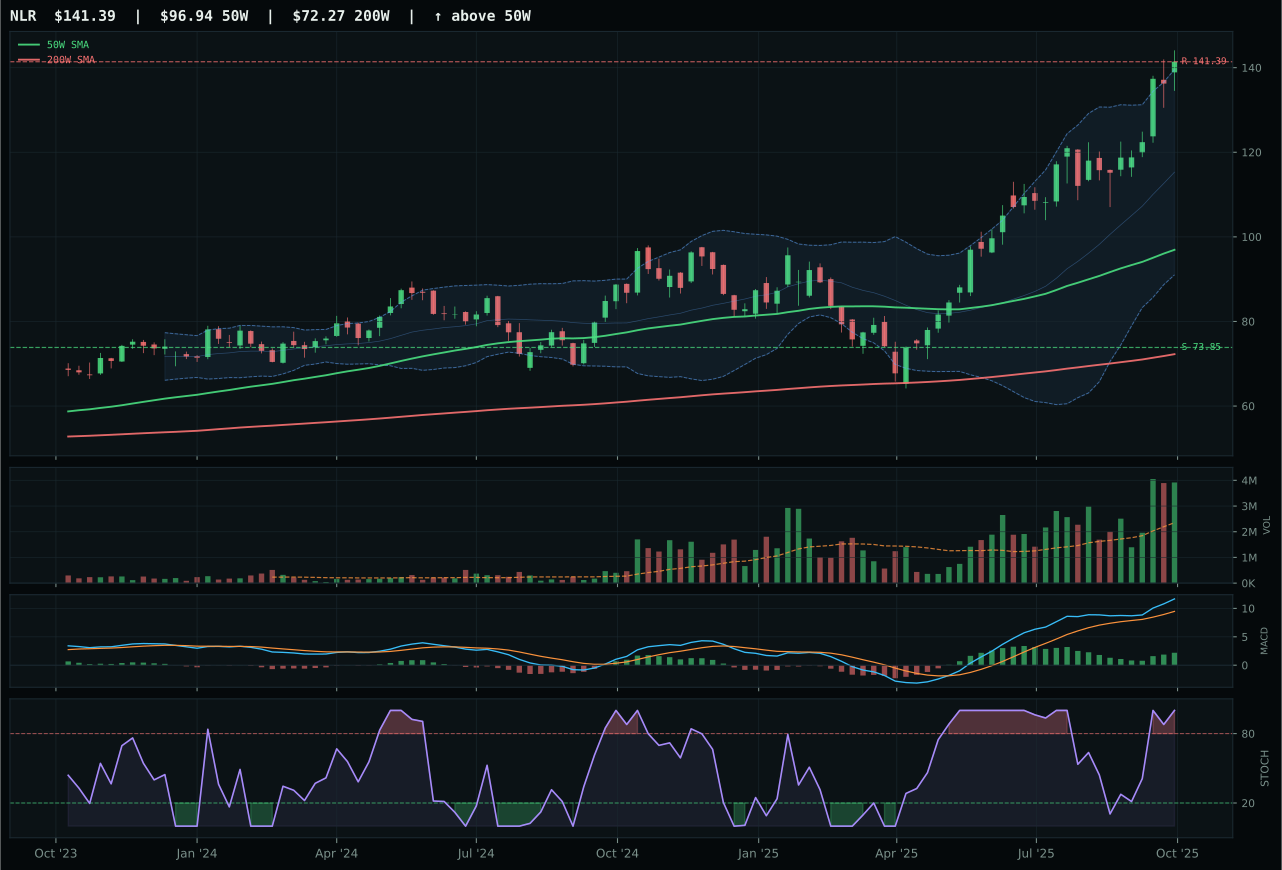
NLR has a vertical extension profile with 23.3% 13-week relative strength versus SPY.
A failed hold above support would weaken the setup.
Actionable but governed by invalidation levels.
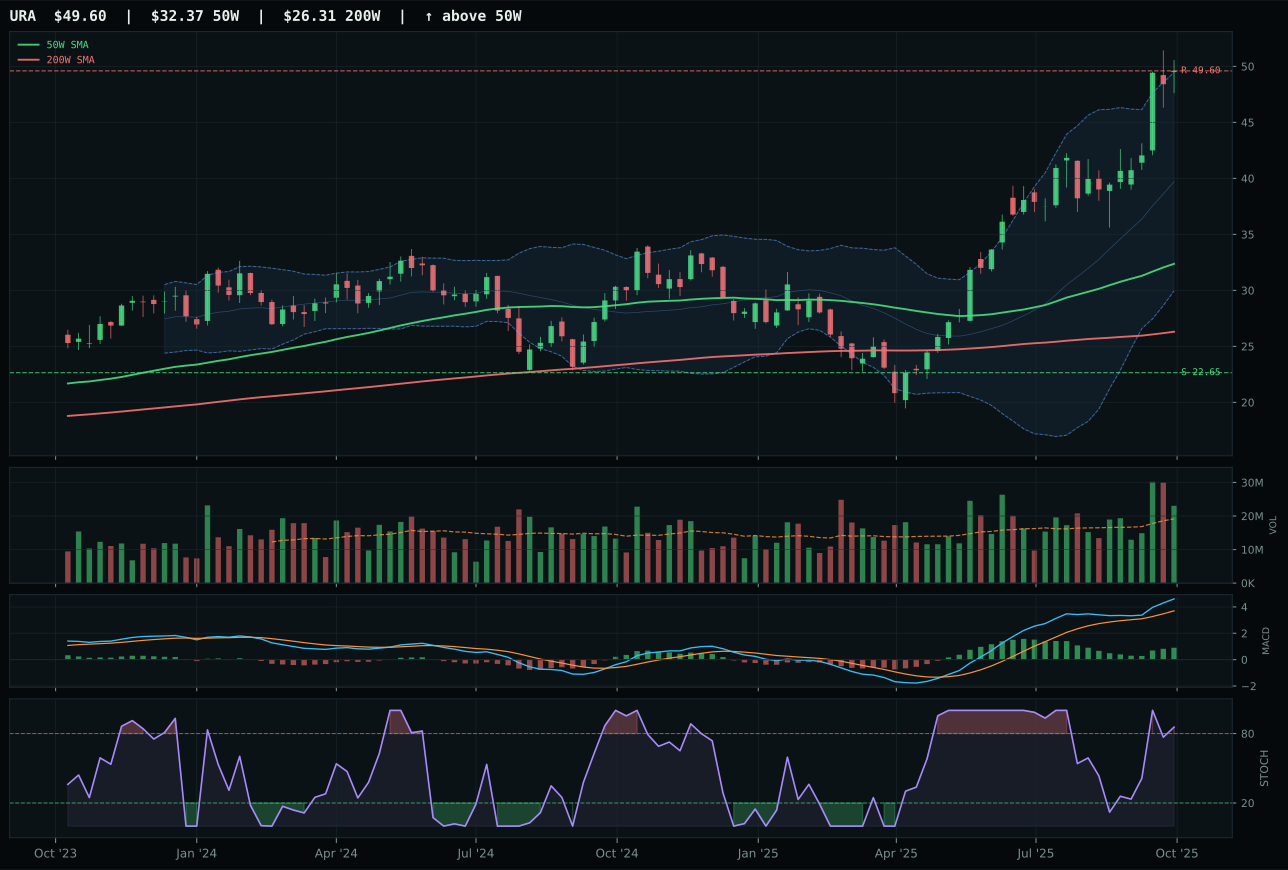
URA has a vertical extension profile with 23.9% 13-week relative strength versus SPY.
A failed hold above support would weaken the setup.
Actionable but governed by invalidation levels.
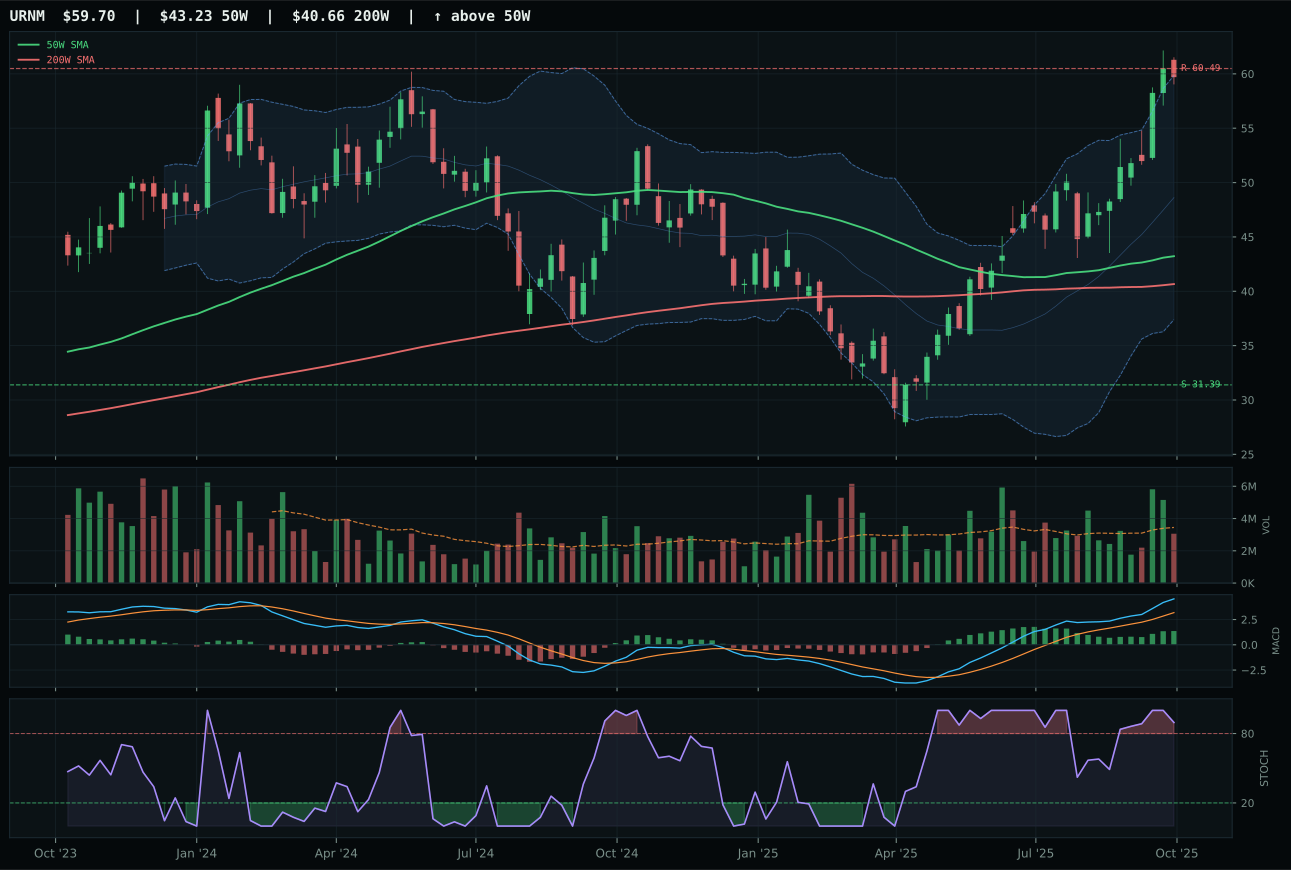
URNM has a vertical extension profile with 19.1% 13-week relative strength versus SPY.
A failed hold above support would weaken the setup.
Actionable but governed by invalidation levels.
URA wins Nuclear Energy at 66.9 with a tight -1.2-point margin over NLR by virtue of fractional category-relative strength (0.6% vs 0.0%), the only discernible technical difference between two remarkably similar setups. Both names sit extended 53.2% and 53.0% above respective 50-week averages with near-identical trend scores (100.0), bullish-and-improving MACD, and overbought stochastic RSI at 0.86 and 1.00. URA's 30.9% 13-week return edges NLR's 30.3%, and volume participation is above-average for both (1.20x and accumulation/confirmation at 2.32x). The separator is structural: URA's vertical extension (78.3 structure score) versus NLR's more aggressive vertical extension, and URA's persistence at 100.0/100 that mirrors NLR's also-exceptional 100.0/100 confirmation of sustained buying pressure. NLR's superior technical evidence (89.5 vs 82.1) and macro fit (54.0 vs 50.0) do not overcome URA's slight category-relative advantage, making this one of the tightest category decisions in the portfolio.
Nuclear Energy receives 5% allocation as tier-2 despite a respectable 66.9 category score because it ranks below the two metals categories in absolute score leadership and because the macro fit of 50.0/100 is neutral—no category-specific descriptor profile feeds NLR or URA's case. Real asset sponsorship (+7) and AI growth sponsorship (+5) provide modest support, but liquidity stress (-7) and credit stress (-5) create offsetting headwinds. The category's appeal is genuine: URA's 30.9% 13-week return and 23.9% SPY-relative strength reflect institutional recognition that uranium is both an energy security asset (geopolitical hedge) and an AI infrastructure play (power grids for data centers). However, the setup is structurally expensive at 53.2% above the 50-week, with risk/reward of only 38.2/100 (downside to support is 119.0%, an extreme asymmetry). The 5% position reflects conviction in the multi-year uranium bull thesis—scarcity, geopolitical supply concentration, and power generation demand—but the entry point is late enough to warrant positioning at tier-2 allocation rather than elevated alongside momentum leaders like COPX and SLV.
Defense & Aerospace — XAR
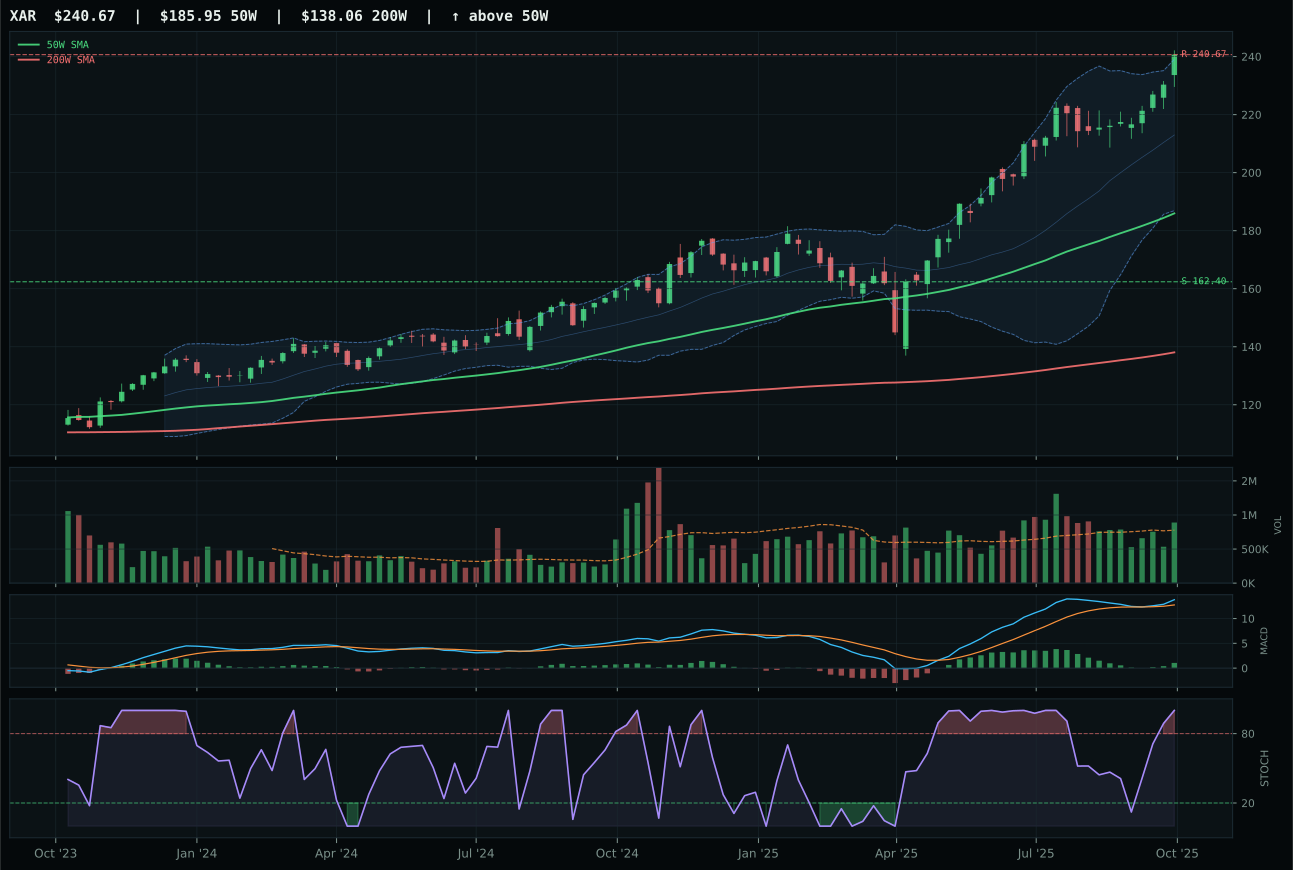
XAR has a vertical extension profile with 8.2% 13-week relative strength versus SPY.
A failed hold above support would weaken the setup.
Actionable but governed by invalidation levels.
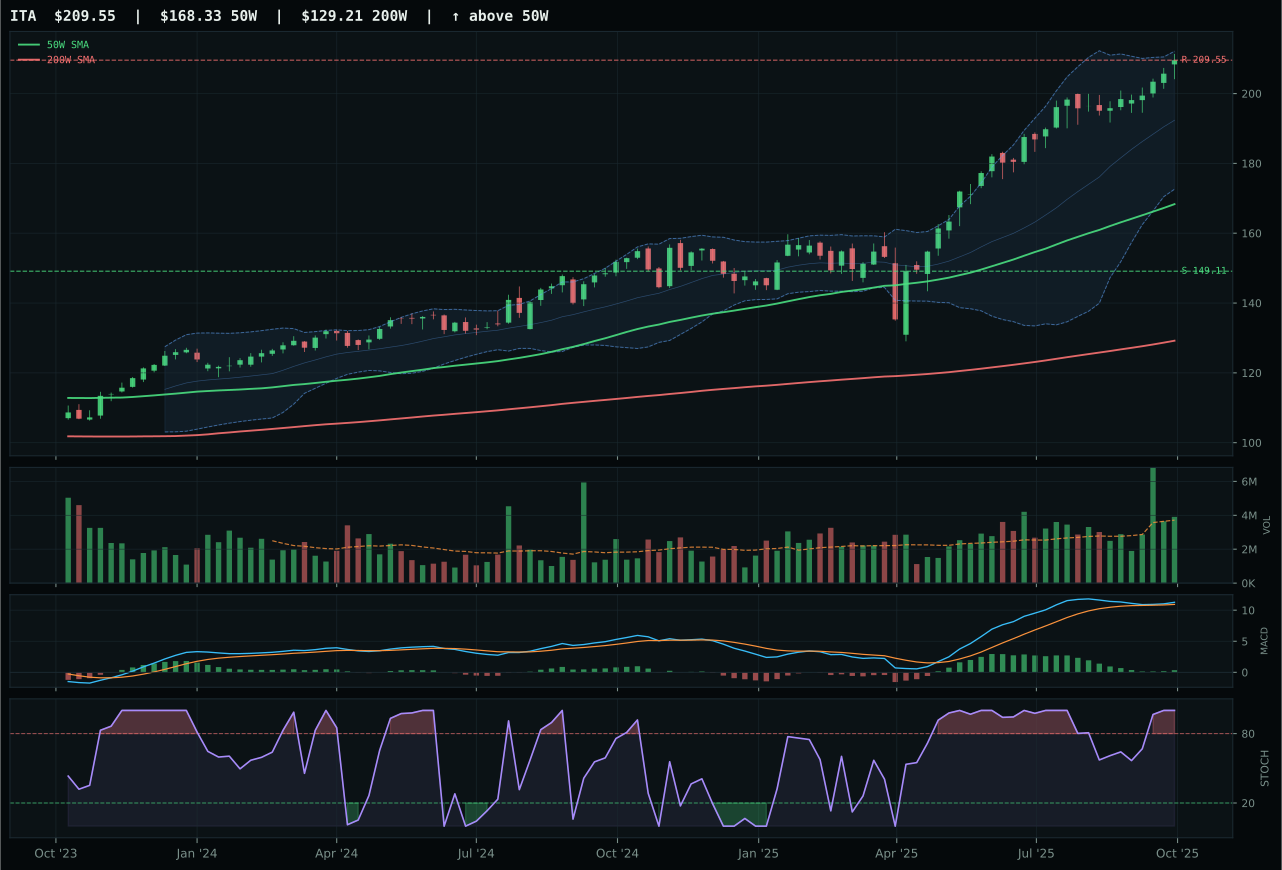
ITA has a vertical extension profile with 5.1% 13-week relative strength versus SPY.
A failed hold above support would weaken the setup.
Actionable but governed by invalidation levels.
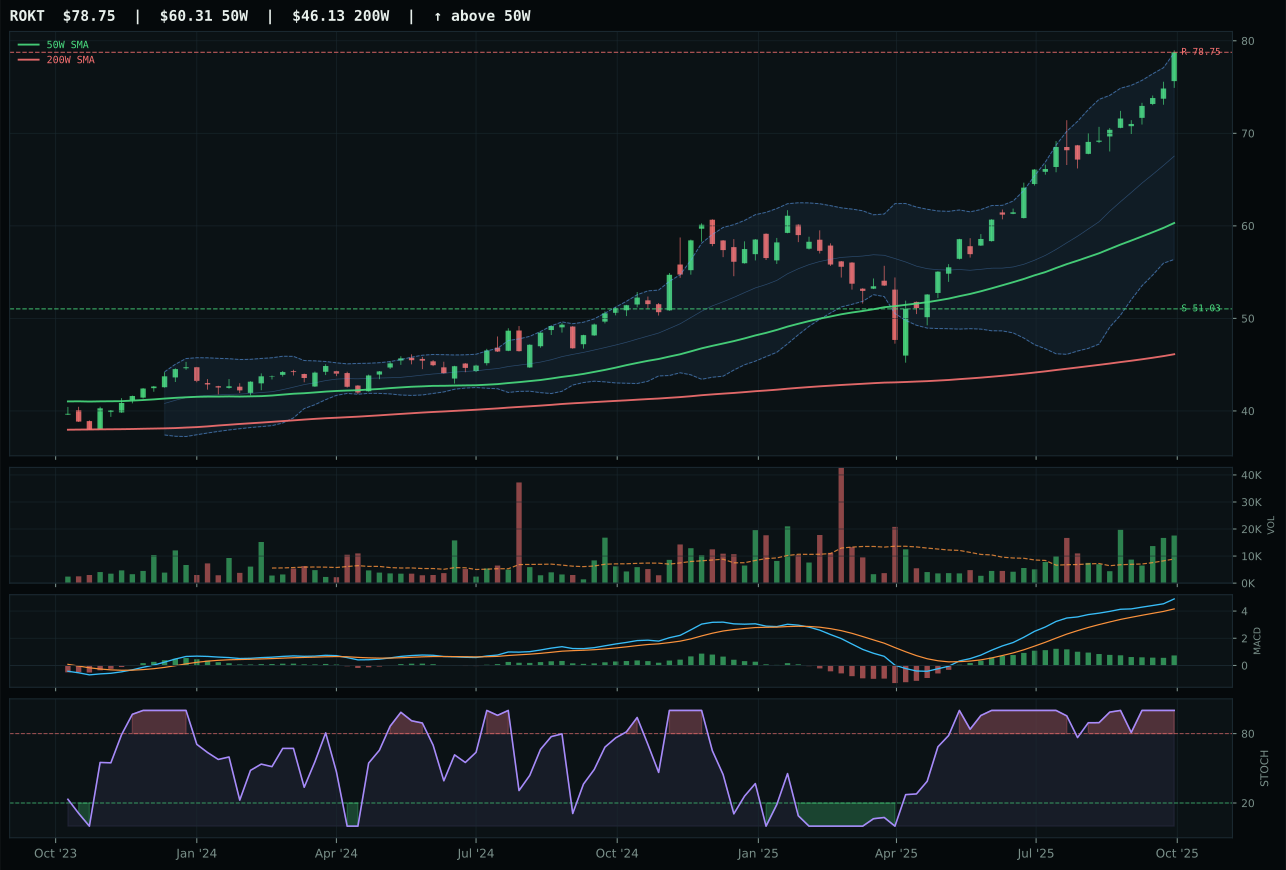
ROKT has a vertical extension profile with 12.2% 13-week relative strength versus SPY.
A failed hold above support would weaken the setup.
Tracked, but not top-2 eligible because: .
XAR wins the Defense & Aerospace category with a 61.2 score and a tight 1.4-point margin over ITA because it combines above-average volume participation (1.14x the 20-week) with a bullish-and-improving MACD and category-neutral relative strength (0.0%), versus ITA's flat volume, bullish-but-flattening MACD, and -3.0% category-relative weakness. Both names sit extended—XAR at 29.4% above the 50-week, ITA at similar levels—but XAR's tighter structure (82.0 vs 80.2) and active accumulation signal reflect sponsor conviction. The 15.2% 13-week return and 8.2% SPY-relative strength are solid but not exceptional; the edge derives entirely from ITA's technical deterioration in momentum and volume confirmation. ROKT's extraordinary SPY-relative strength (12.2%) and 19.2% 13-week return are overshadowed by its 100-point volume score suggesting forced distribution rather than natural institutional accumulation.
Defense & Aerospace receives 5% as a tier-2 category, supported by a defensive rotation descriptor (+8) that benefits timing in the Transition/Mixed regime, but restrained by weak absolute scores and macro fit concerns. The 61.2 category score lags both metals categories substantially, and the absence of a category-specific macro profile (XAR and ITA are evaluated as 'its category expression' with 50.0/100 macro fit each) leaves the allocation decision purely technical. XLU at 60.6 is nearly equivalent, and both defensive categories—Defense & Aerospace and Utilities & Infrastructure—are being held at 5% rather than elevated to 10% because the metal names deliver superior macro sponsorship (monetary hedge bid at +14 for Precious Metals, metals scarcity at +14 for Industrial Metals). The allocation respects the defensive rotation bid and maintains aerospace exposure during geopolitical uncertainty, but the weak category breadth and timing setup prevent elevation in a regime favoring commodity-linked hedges.
Utilities & Infrastructure — XLU
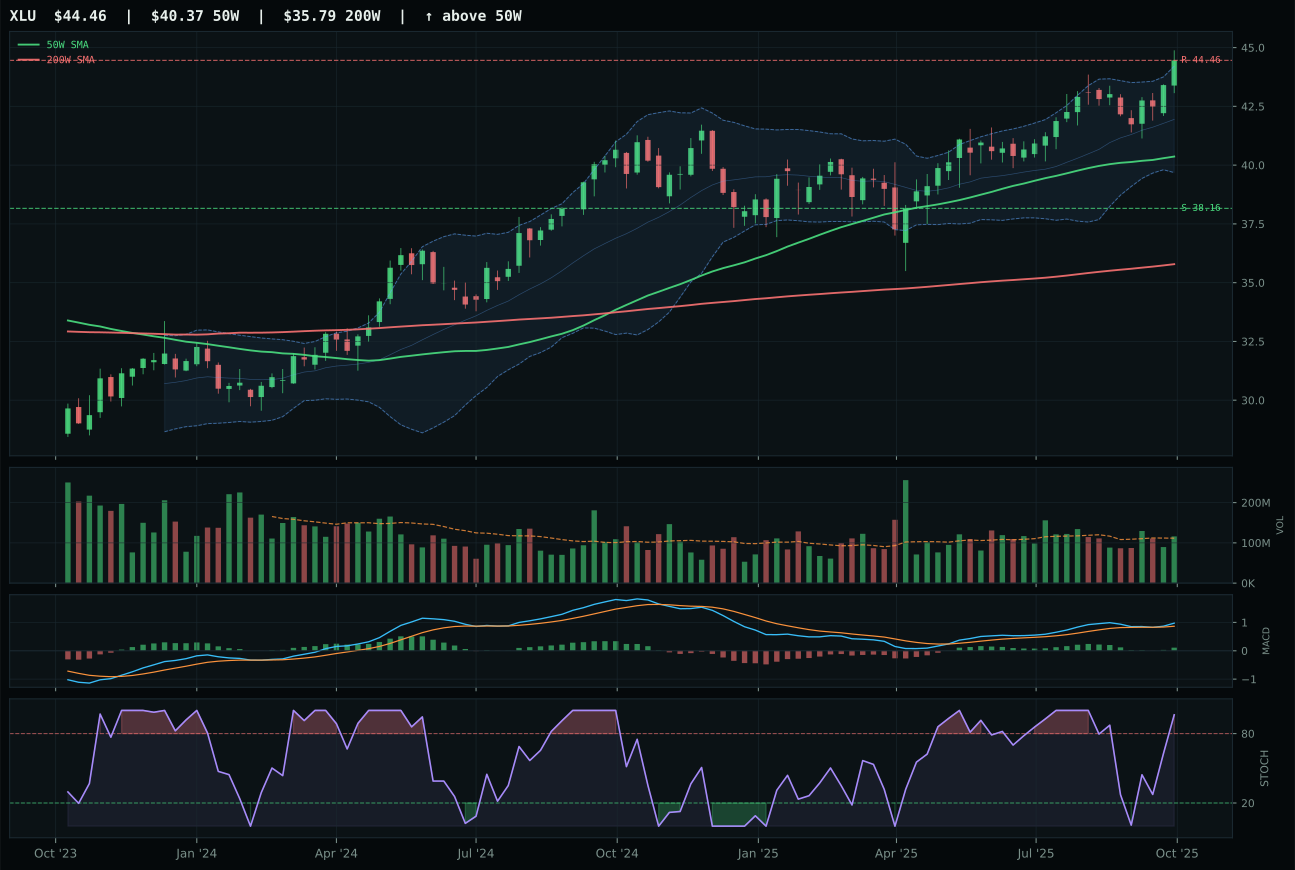
XLU has a neutral structure profile with 1.6% 13-week relative strength versus SPY.
A failed hold above support would weaken the setup.
Actionable but governed by invalidation levels.
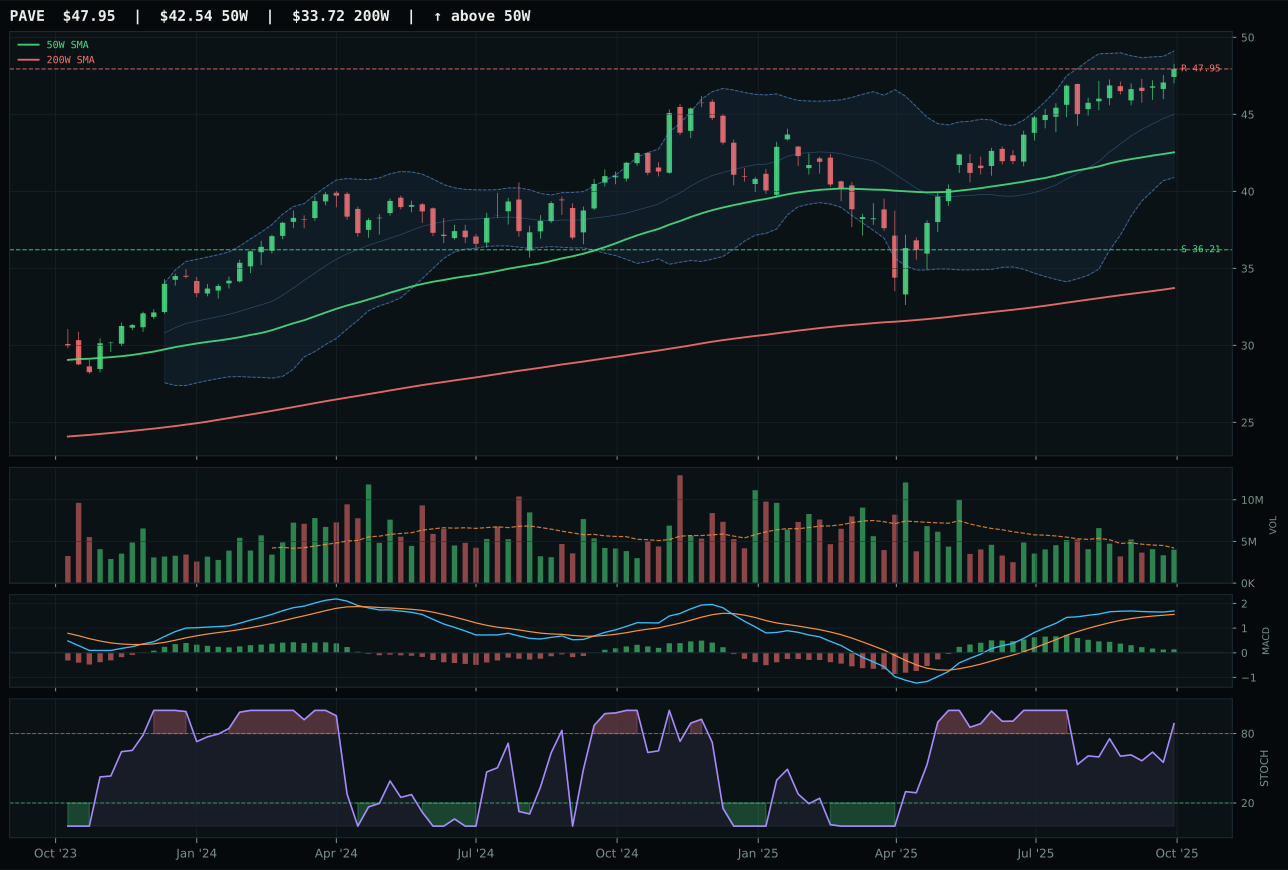
PAVE has a neutral structure profile with 0.0% 13-week relative strength versus SPY.
A failed hold above support would weaken the setup.
Actionable but governed by invalidation levels.
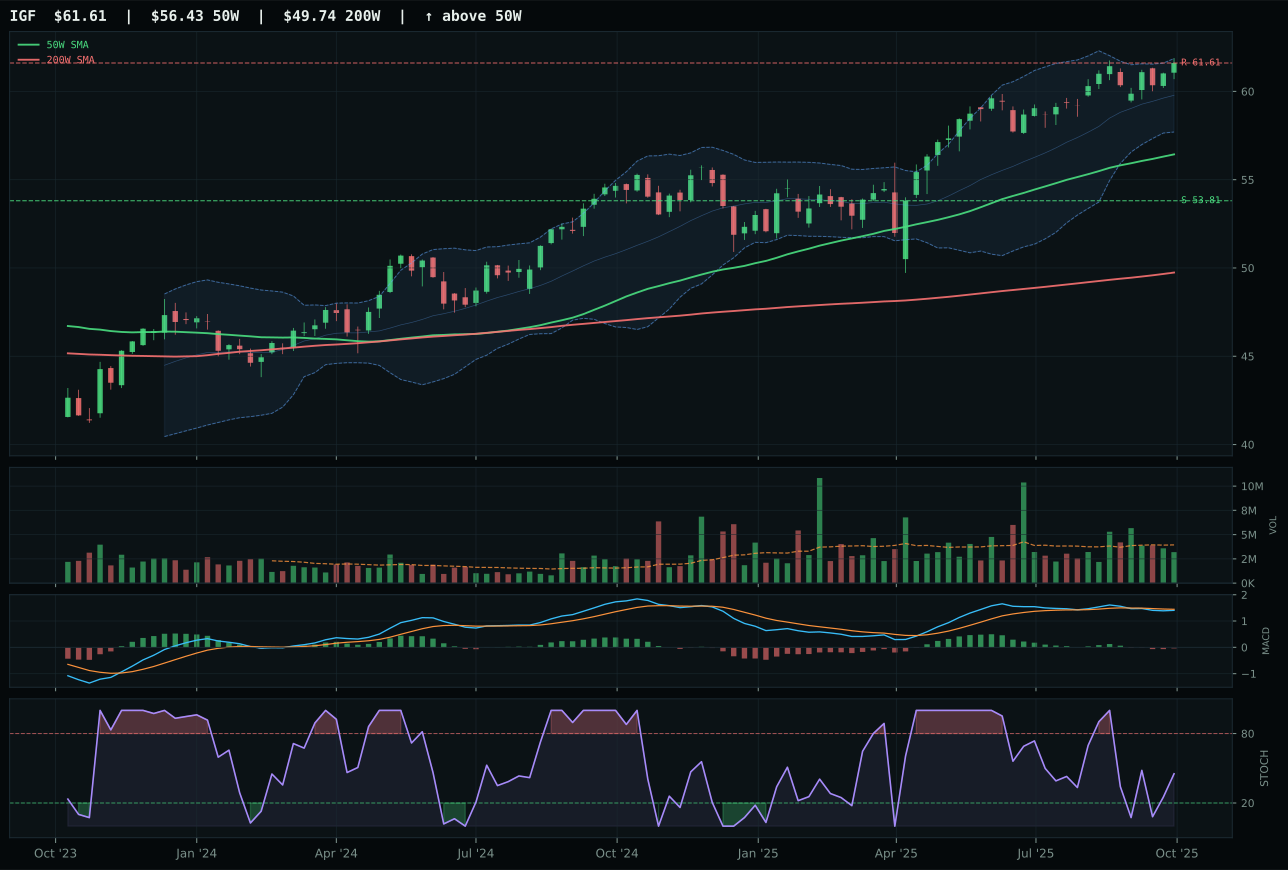
IGF has a neutral structure profile with -2.7% 13-week relative strength versus SPY.
A failed hold above support would weaken the setup.
Actionable but governed by invalidation levels.
XLU wins Utilities & Infrastructure at 60.6 with a 5.8-point margin over PAVE because it combines a cleaner structure (78.1 vs 77.1), improved timing score (59.0 vs 54.0), superior MACD confirmation (bullish and improving vs bullish but flattening), and category-relative strength edge (1.6% vs 0.0%) despite near-identical underlying momentum. Both sit in the 10% extension zone above the 50-week (XLU at 10.1%, PAVE matched), and both trade with neutral volume and overbought stochastic RSI at high levels (96 for XLU, similar for PAVE). The 8.6% 13-week return for XLU trails PAVE's 7.0% minimally, yet XLU's MACD trajectory and slightly lower extreme extension (10.1% vs higher perceived) create a better risk/reward setup (45.7 vs 41.4). PAVE's disadvantage is primarily deteriorating momentum confirmation (bullish but flattening) rather than absolute underperformance, making this another tight category decision where structure and trend quality matter more than raw return breadth.
Utilities & Infrastructure receives 5% allocation as tier-2 because it ranks below the metals categories in score leadership and because the regime shift toward Transition/Mixed favors defensive names but not necessarily at allocation priority when commodity-linked hedges deliver superior momentum. The 60.6 category score benefits from defensive rotation (+12) and the macro fit of 61.0/100 is respectable, reflecting the regime's mixed nature (Transition/Mixed itself provides +4 support). XLU's 1.6% SPY-relative strength is weak compared to COPX's 26.4% or SLV's 22.9%, and the 8.6% 13-week return is thin relative to momentum leaders. However, the allocation respects the defensive rotation descriptor and maintains positioning in regulated utilities for dividend-yield stability and interest-rate sensitivity during a regime where credit stress remains active. The tier-2 position versus tier-1 reflects the portfolio's current preference for commodity scarcity hedges over traditional defensive rotation; as credit stress intensifies further, XLU becomes a candidate for elevation, but the current momentum breadth in metals makes them superior risk-adjusted opportunities per unit of capital deployed.
Technology — XLK
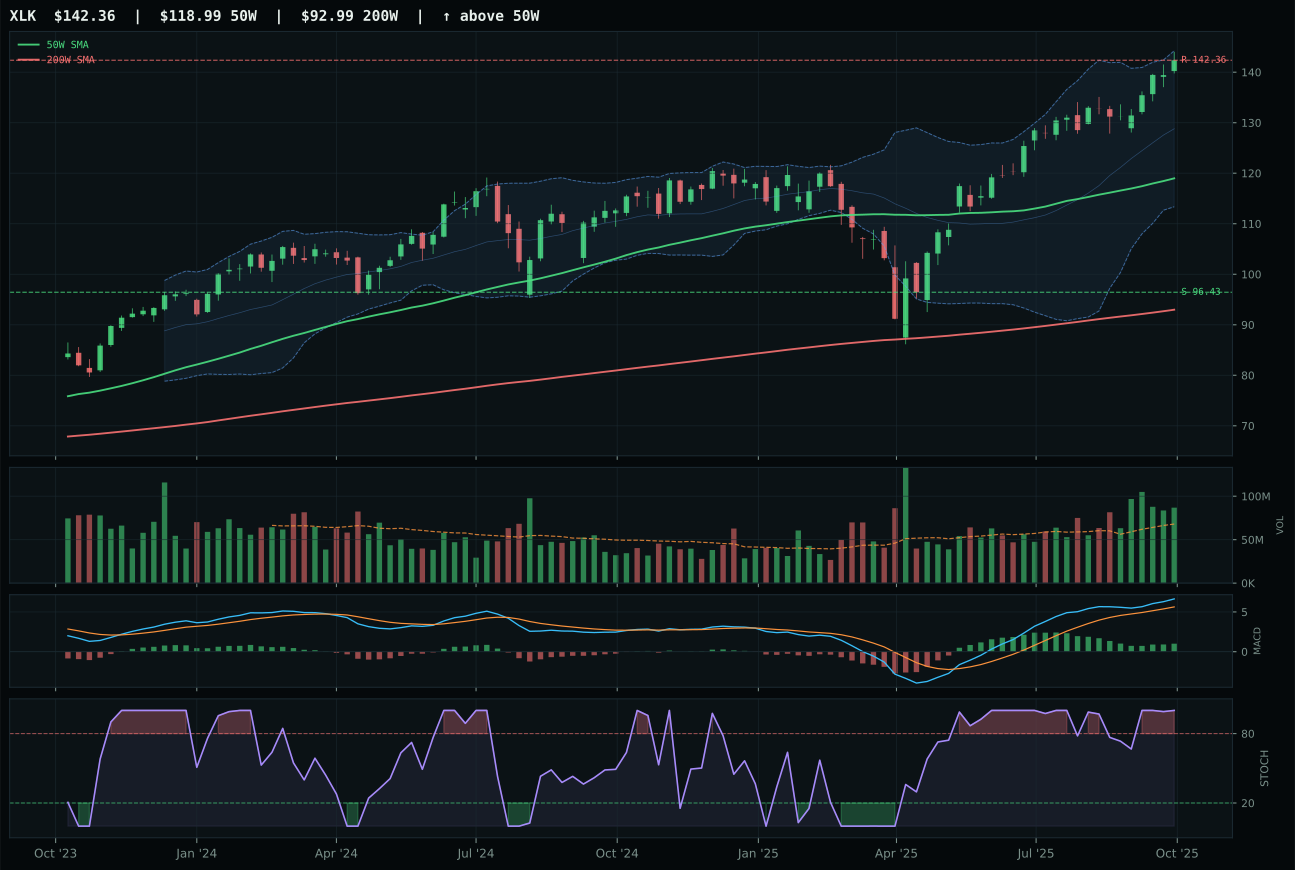
XLK has a vertical extension profile with 3.8% 13-week relative strength versus SPY.
A failed hold above support would weaken the setup.
Actionable but governed by invalidation levels.
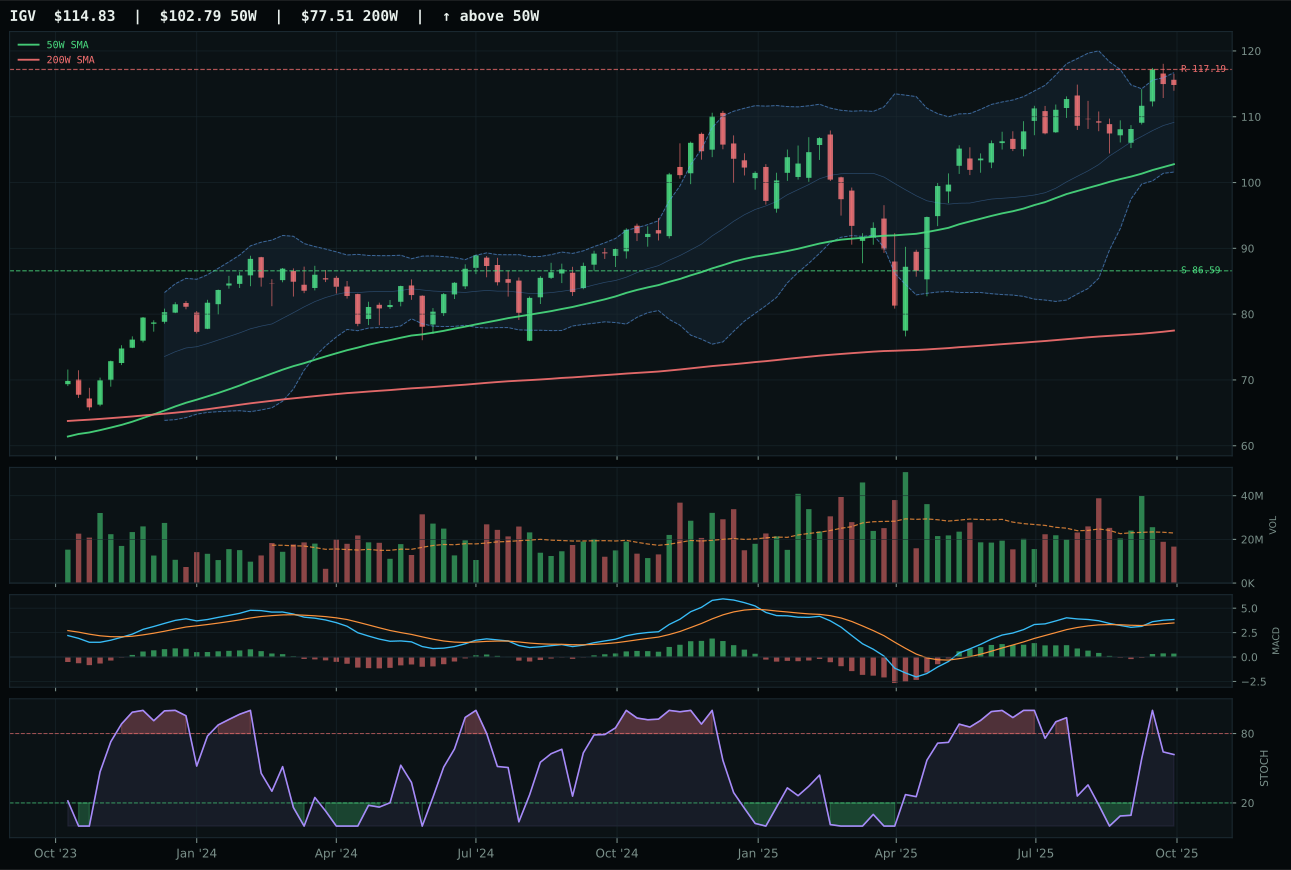
IGV has a neutral structure profile with -3.8% 13-week relative strength versus SPY.
A failed hold above support would weaken the setup.
Actionable but governed by invalidation levels.
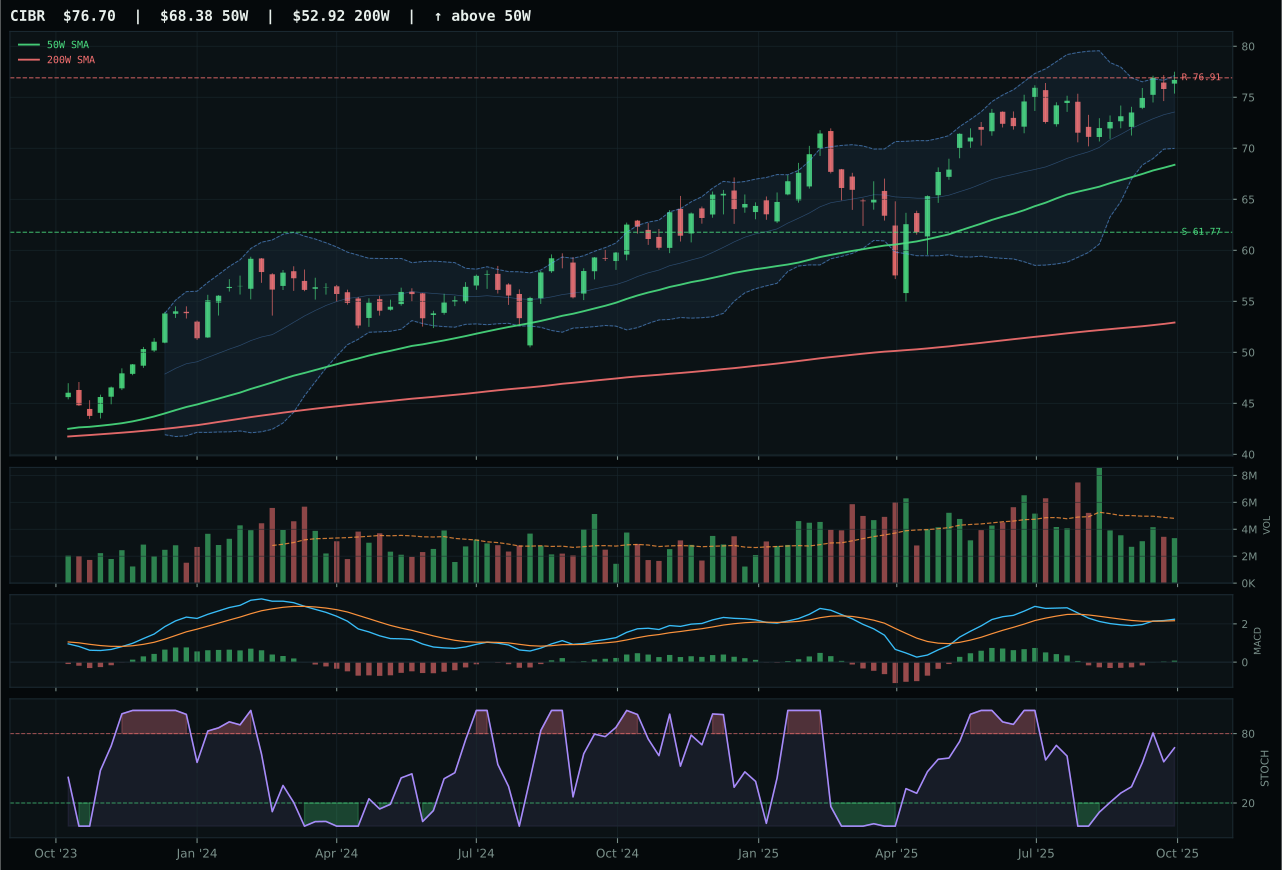
CIBR has a neutral structure profile with -6.0% 13-week relative strength versus SPY.
A failed hold above support would weaken the setup.
Actionable but governed by invalidation levels.
XLK wins the category with a 58.1 score because it holds the clearest relative strength advantage within its peer group—7.6% category-relative strength versus IGV's flat 0.0%—while maintaining positive momentum confirmation. Price sits 19.6% above the 50-week moving average with above-average volume participation at 1.28x the 20-week average, signaling accumulation rather than speculative bounce. MACD is bullish and improving, stochastic RSI reads overbought, and the setup is a vertical extension that depends on buyers defending the current level for continuation. The runner-up IGV suffers from weaker structure (72.5 vs 80.4), thinner volume participation, and a -3.8% relative strength to SPY that leaves it trailing even as its MACD mirrors XLK's bullish posture. The technical evidence gap—88.6 for XLK versus 68.2 for IGV—makes this a clear category decision despite both names exhibiting trend confirmation.
Technology receives 5% allocation this week as a tier-2 category, ranked below the two precious and industrial metals names that captured 10% each. The category's 58.1 score reflects genuine strength in the 13-week return (XLK's 10.8%) and SPY-relative outperformance (3.8%), but the extended setup—19.6% above the 50-week—limits its risk-adjusted appeal when positioning must compete for capital across all ten categories. Macro headwinds matter here: liquidity stress (-10) and credit stress (-7) weigh against the positive risk appetite descriptor (+9), creating a macro fit of only 48.0/100 at the category level. XLK's overbought stochastic and near-term Fibonacci extension near the 52-week high suggest timing asymmetry that outweighs the relative strength advantage. The allocation reflects confidence in the trend but prudent skepticism about entry risk in a Transition/Mixed regime where both equity and credit stress remain active.
Traditional Energy — XLE
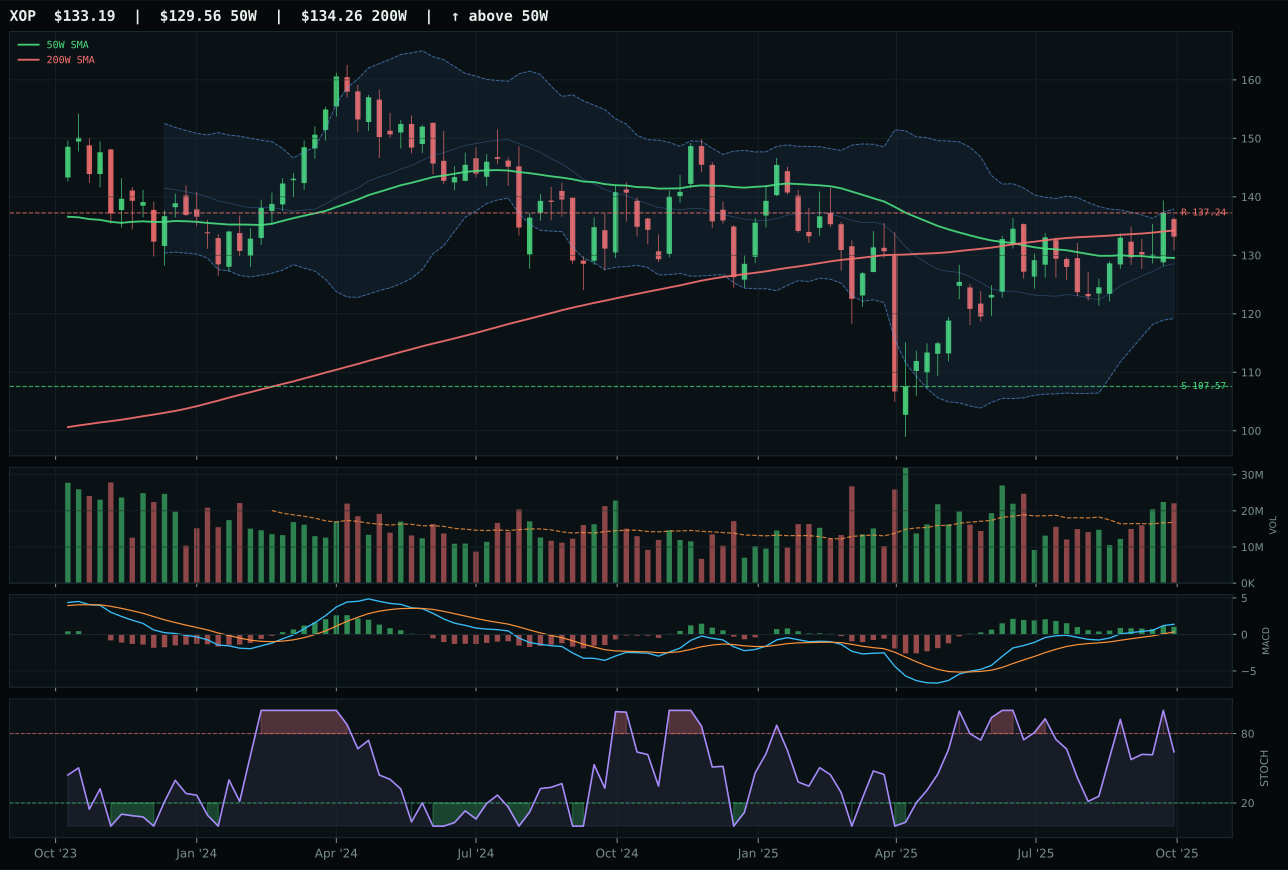
XOP has a compression near 50W profile with -3.9% 13-week relative strength versus SPY.
A failed hold above support would weaken the setup.
Actionable but governed by invalidation levels.
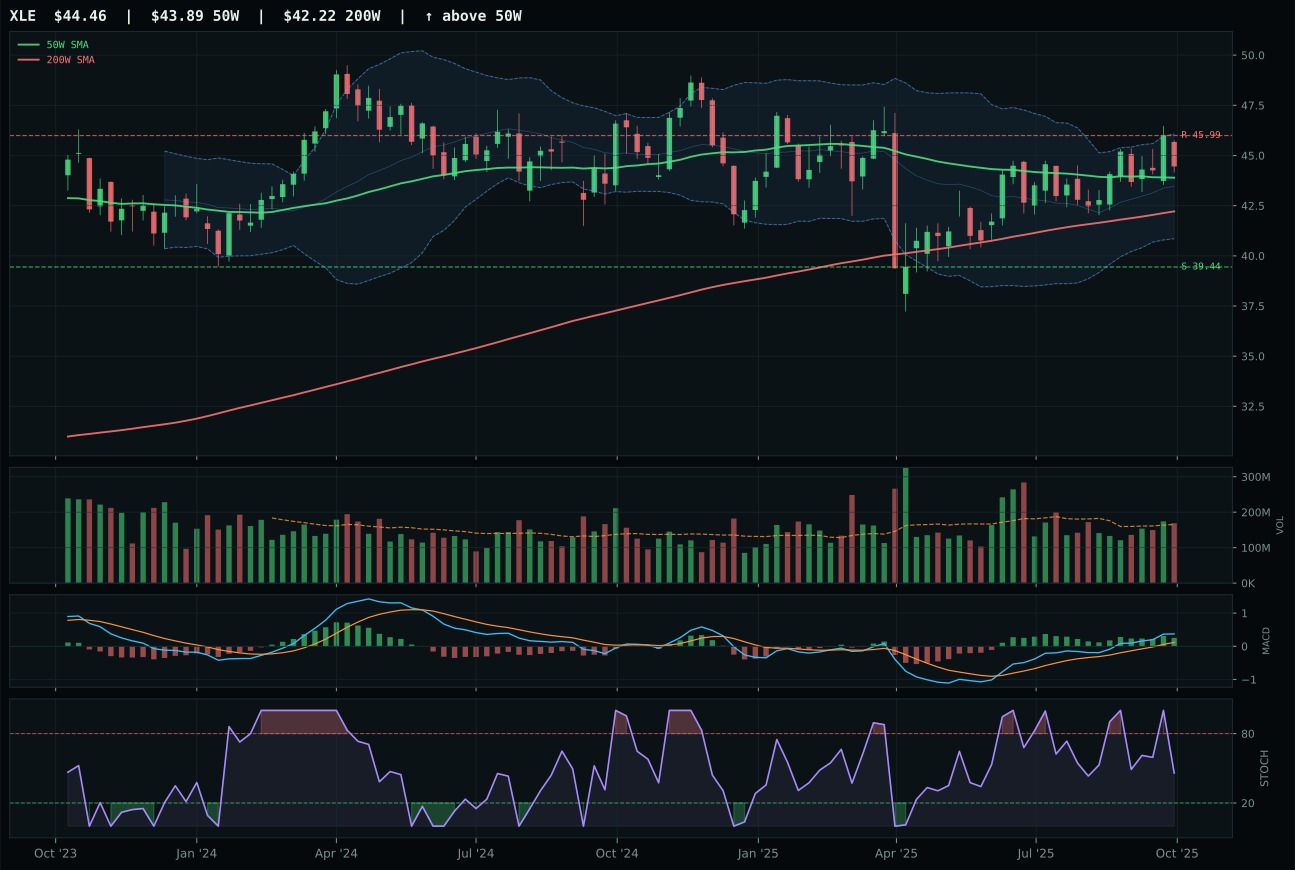
XLE has a compression near 50W profile with -4.9% 13-week relative strength versus SPY.
A failed hold above support would weaken the setup.
Actionable but governed by invalidation levels.
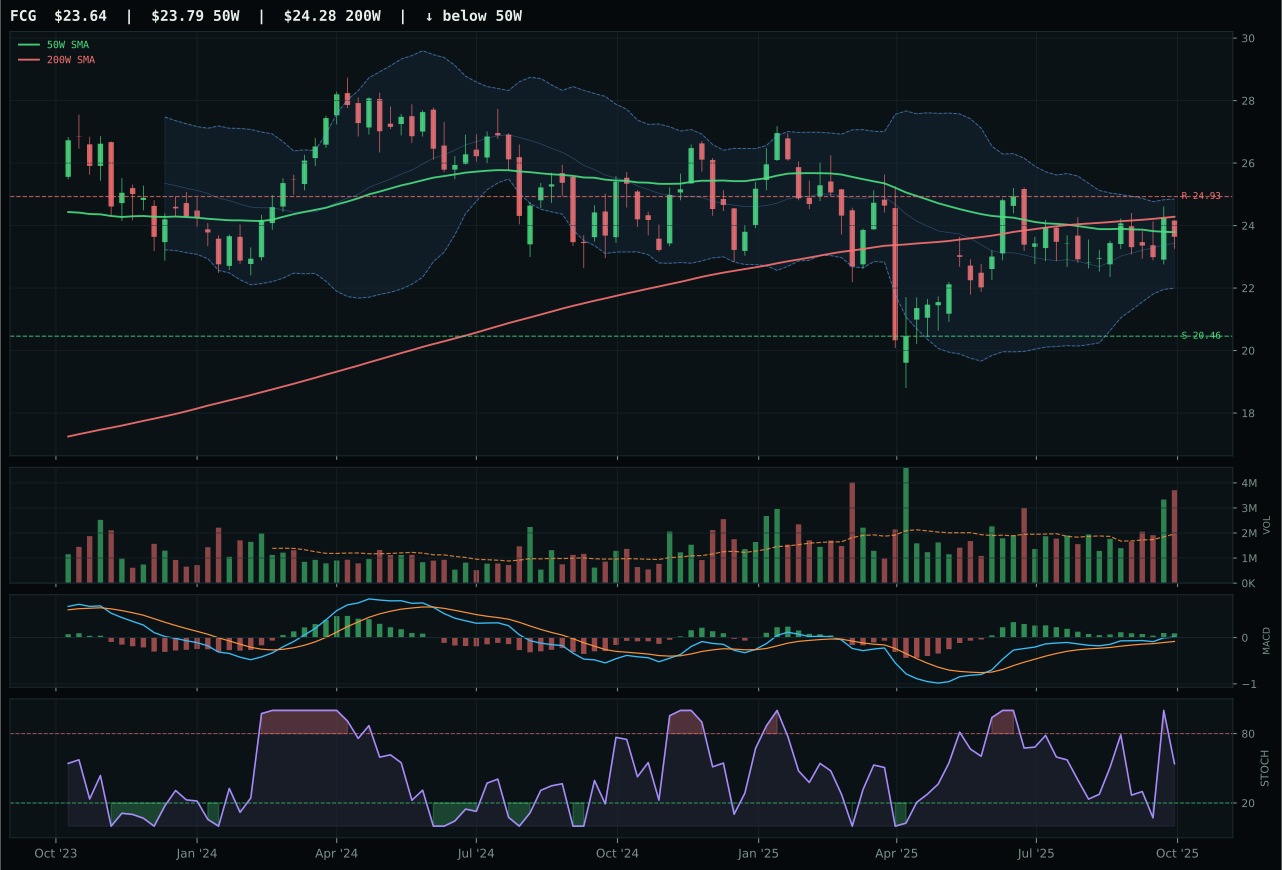
FCG has a compression near 50W profile with -6.1% 13-week relative strength versus SPY.
Extension and support failure are the main tactical risks.
Tracked, but not top-2 eligible because: structurally broken.
XLE wins Traditional Energy with a 38.2 score, but this is a hollow victory reflecting category-wide weakness rather than XLE's own strength. XLE's advantage over XOP is structural precision: its 100.0/100 timing score derives from proximity to the 50-week (only 1.3% away) combined with MACD bullish-and-improving and stochastic RSI falling toward neutral—a coil setup that rewards patience. Risk/reward of 57.7 versus XOP's 47.2 indicates XLE can rally 12.7% to support versus XOP's explosive but stretched upside. The 2.2% 13-week return and -4.9% SPY-relative weakness are poor, yet XLE's neutral volume participation is actually preferable to XOP's above-average participation in a category that is uniformly soft. XOP's superior technical evidence (84.0 vs 72.5) and richer macro fit (40.0 vs 55.0) fail to overcome its timing liability: the setup is compression near 50-week in upper retracement territory, requiring fresh capital to sustain price into resistance at 137.24.
Traditional Energy receives 5% allocation despite a meager 38.2 category score because the Transition/Mixed regime and real asset sponsorship (+7) create a placeholder position that might benefit from commodity breadth turning decisively positive. The 43.0/100 category macro fit reflects real asset sponsorship (+7) offset by credit stress (-7) and liquidity stress (-7), creating a neutral regime effect. XLE's 100.0/100 timing is exceptional and represents the only clean entry point in the category, making the 5% position a tactical positioning trade rather than a conviction bet. The broader context is that energy's 13-week returns (XLE at 2.2%, XOP at 3.1%, FCG at 0.9%) are anemic compared to metals—COPX's 33.4%, SLV's 29.9%—signaling that capital is rotating toward scarcity-driven commodities rather than demand-driven energy. Credit stress remains active, which constrains energy's economic leverage, and the absence of AI-growth tailwinds (unlike copper for data centers or uranium for power grids) leaves energy dependent on pure macro rotation. The 5% holding is a hedge against further dollar weakness and unexpected geopolitical disruption, not a conviction allocation.
Emerging Markets — IEMG
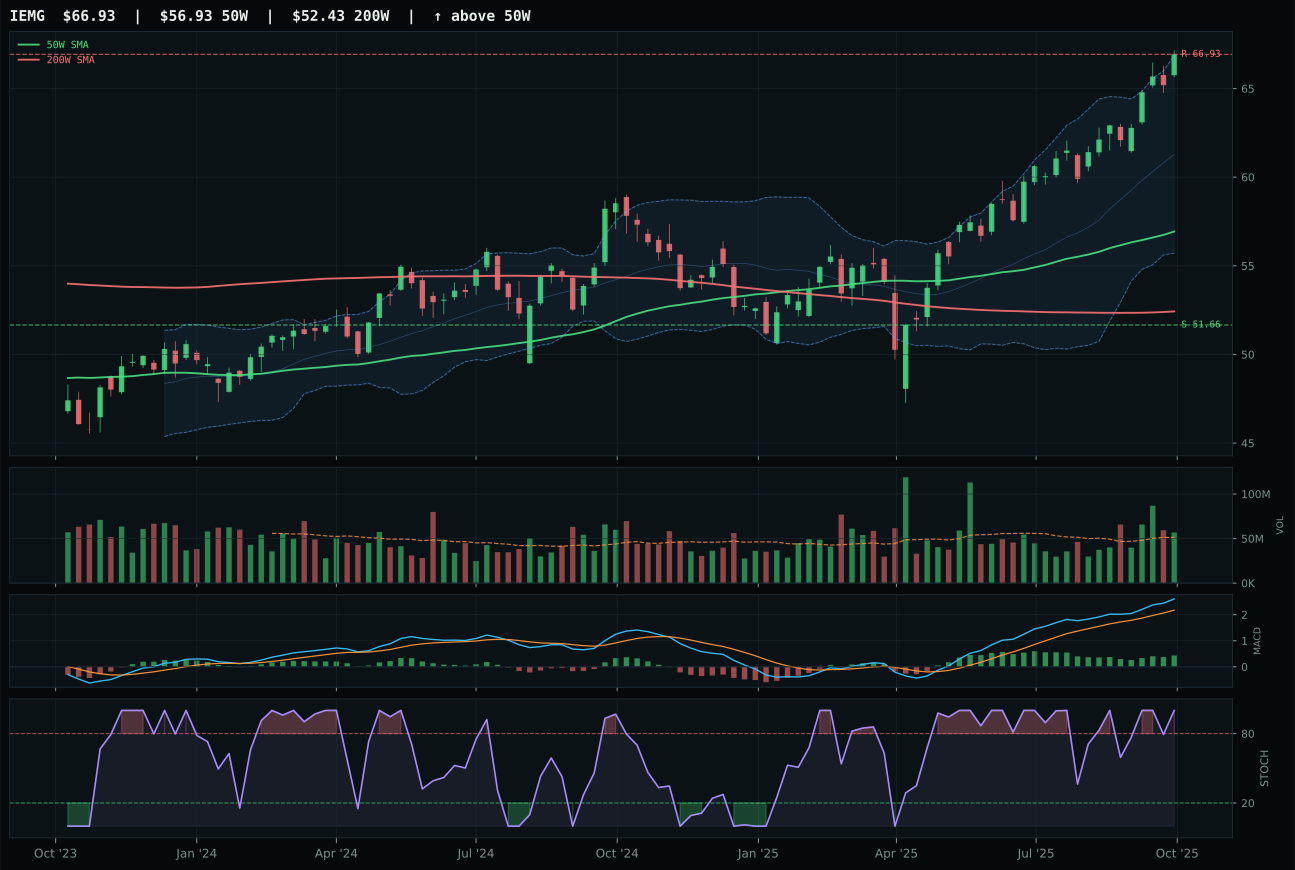
IEMG has a vertical extension profile with 3.4% 13-week relative strength versus SPY.
A failed hold above support would weaken the setup.
Actionable but governed by invalidation levels.
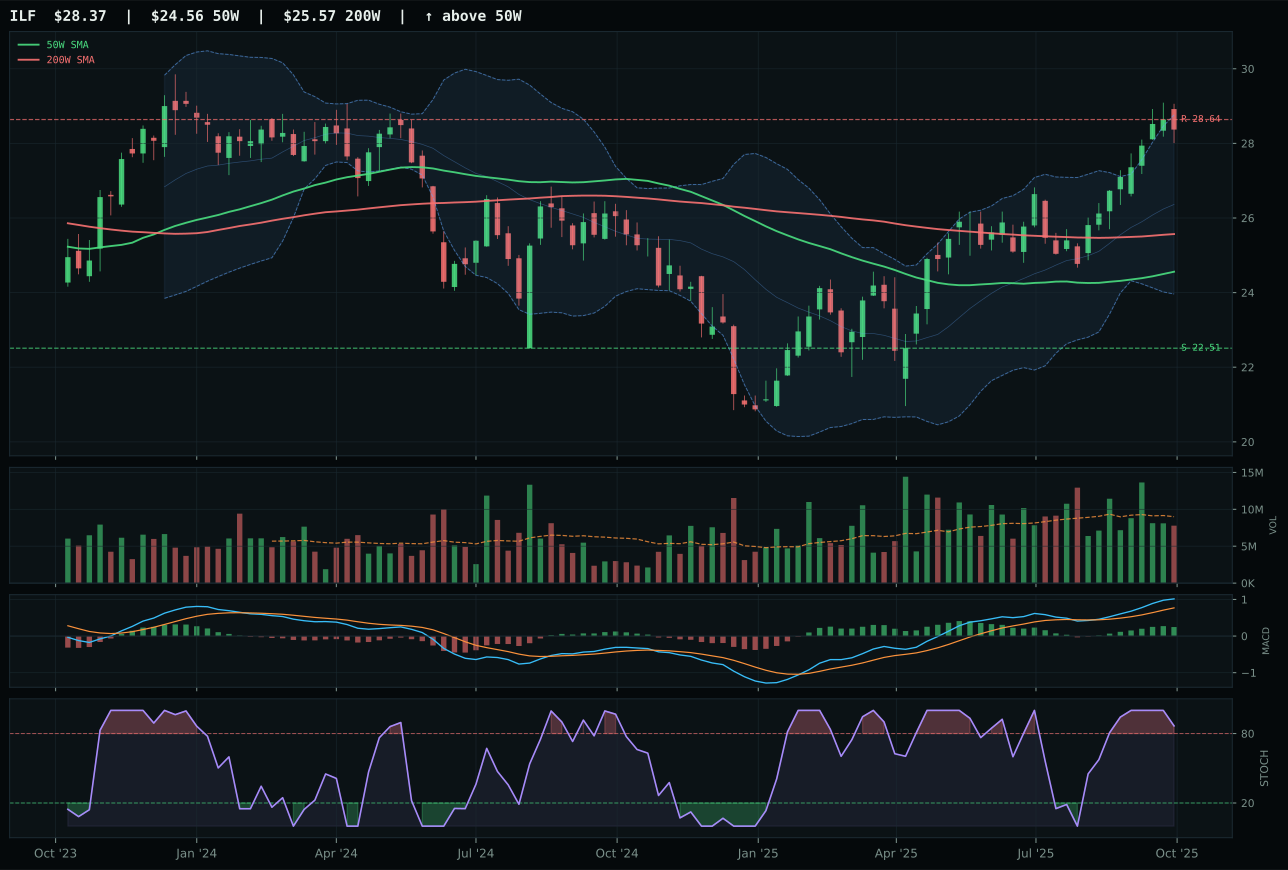
ILF has a vertical extension profile with -0.5% 13-week relative strength versus SPY.
A failed hold above support would weaken the setup.
Actionable but governed by invalidation levels.
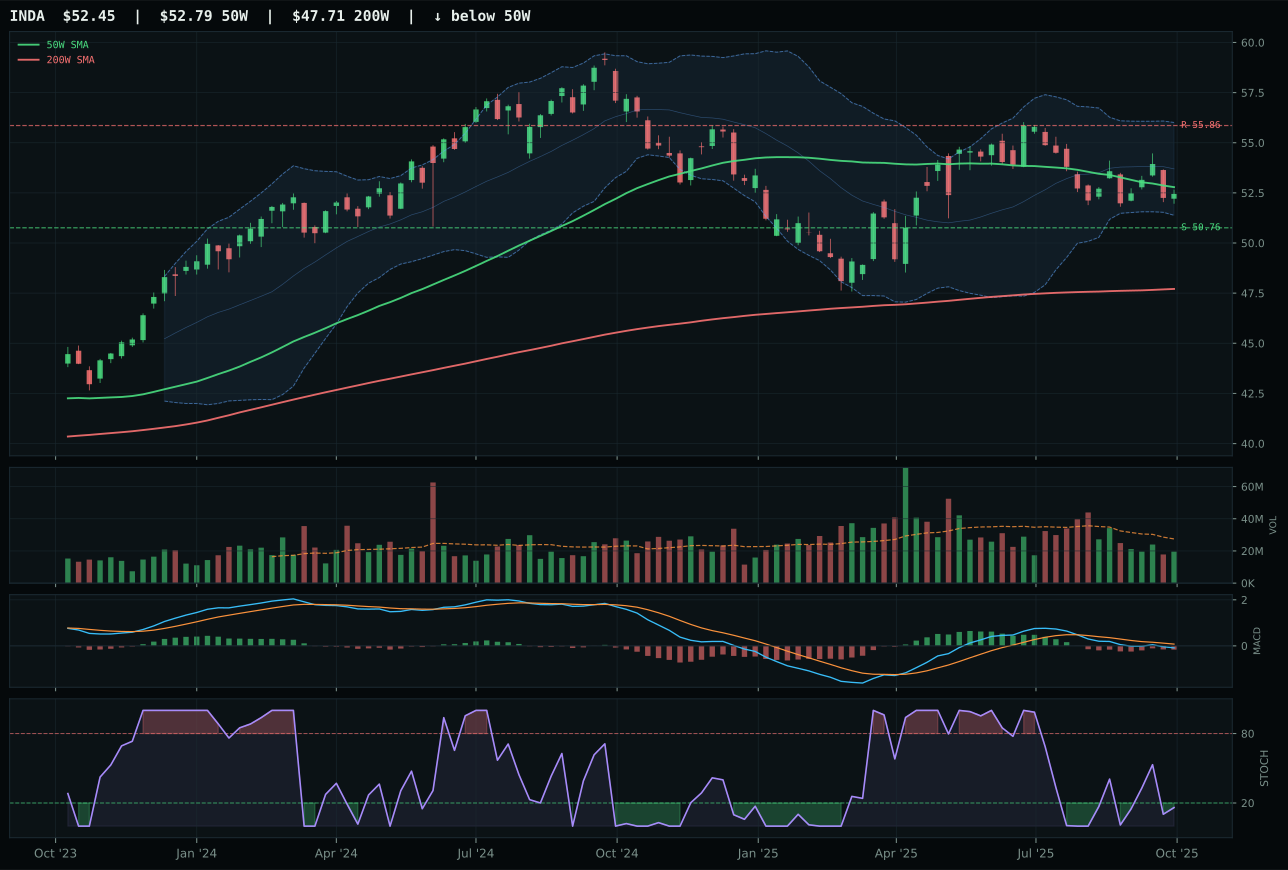
INDA has a pullback into support profile with -13.0% 13-week relative strength versus SPY.
A failed hold above support would weaken the setup.
Actionable but governed by invalidation levels.
IEMG wins Emerging Markets with a 25.2 category score, but the entire category ranks 9th or 10th in exclusion. IEMG's 9.7-point margin over ILF reflects a cleaner structure (83.7 vs 79.9), tighter timing (37.0 vs 27.0), superior volume participation (above-average at 1.11x vs neutral), and category-relative strength advantage (3.9% vs 0.0%) despite both names exhibiting bullish setups and extended price action near 52-week highs. IEMG's 10.4% 13-week return is respectable, and the 3.4% SPY-relative strength provides proof of buying relative to the broader market. However, the category technical evidence of 86.3/100 for IEMG cannot overcome a damning 40.0/100 macro fit driven by credit stress (-10) and liquidity stress (-10) in the Transition/Mixed regime—the exact conditions that penalize emerging-market equity exposure. ILF's additional leverage to commodity breadth positive (+8) and metals scarcity (+5) via Latin America mining cannot compensate for deteriorating technical setup (MACD and stochastic rolling over, timing weaker).
Emerging Markets receives 0% allocation this week, ranking 9th or 10th overall, because the 25.2 category score reflects the regime mismatch between strong technical setup in IEMG (15.1% 13-week absolute return, solidly positive momentum) and overwhelming macro headwinds. The category macro fit of 38.0/100 is one of the weakest across all ten, driven by active credit stress (-10) and liquidity stress (-10) in a Transition/Mixed regime where credit stress is actively deteriorating and funding conditions are tightening. Emerging-market equities are credit-sensitive and foreign-exchange sensitive to dollar strength, making them structurally unattractive in a regime where both credit and liquidity are contractionary. IEMG's vertical extension at 17.6% above the 50-week, while modest relative to semiconductor or metals leaders, still requires fresh capital allocation to sustain, and that capital is flowing instead toward commodity hedges and precious metals. The allocation reflects the hard reality: even when an emerging-market ETF exhibits clean technical structure and above-average volume, a category cannot earn allocation if the macro regime is hostile to credit risk and cross-border capital flows. IEMG would require a sharp pivot in the credit stress descriptor (toward neutral or positive) to earn reconsideration.
Agriculture & Livestock — MOO
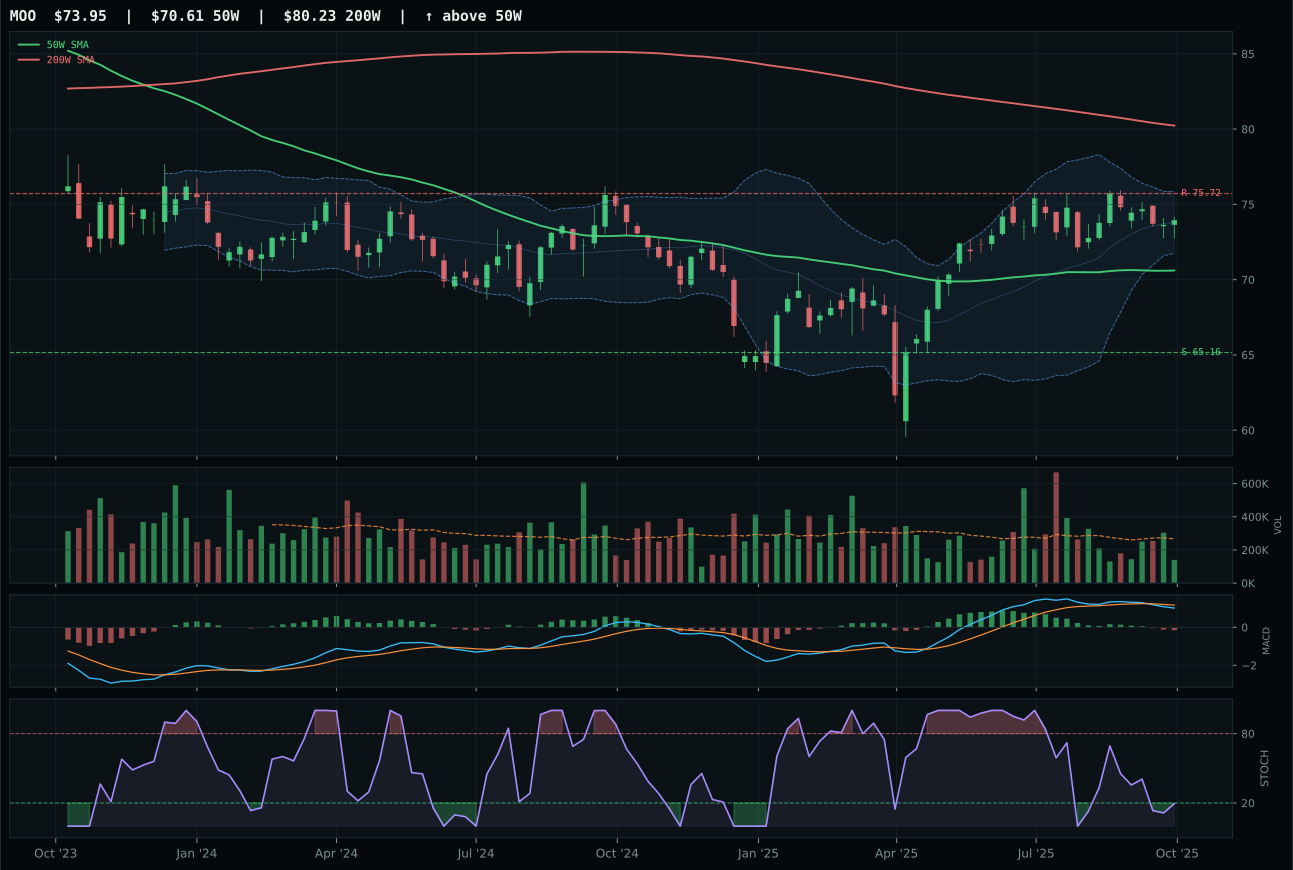
MOO has a neutral structure profile with -8.9% 13-week relative strength versus SPY.
A failed hold above support would weaken the setup.
Actionable but governed by invalidation levels.
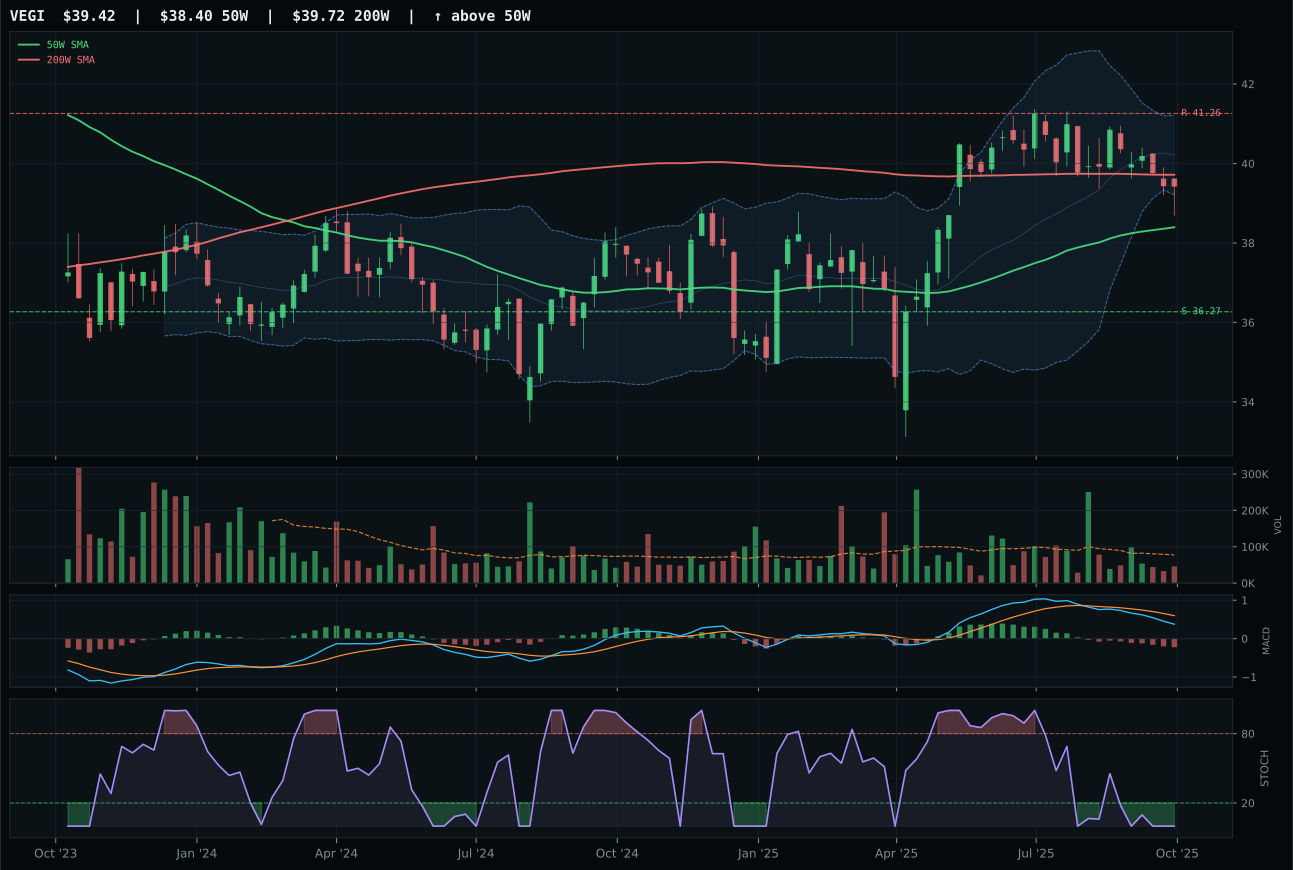
VEGI has a compression near 50W profile with -11.5% 13-week relative strength versus SPY.
A failed hold above support would weaken the setup.
Tracked, but not top-2 eligible because: .
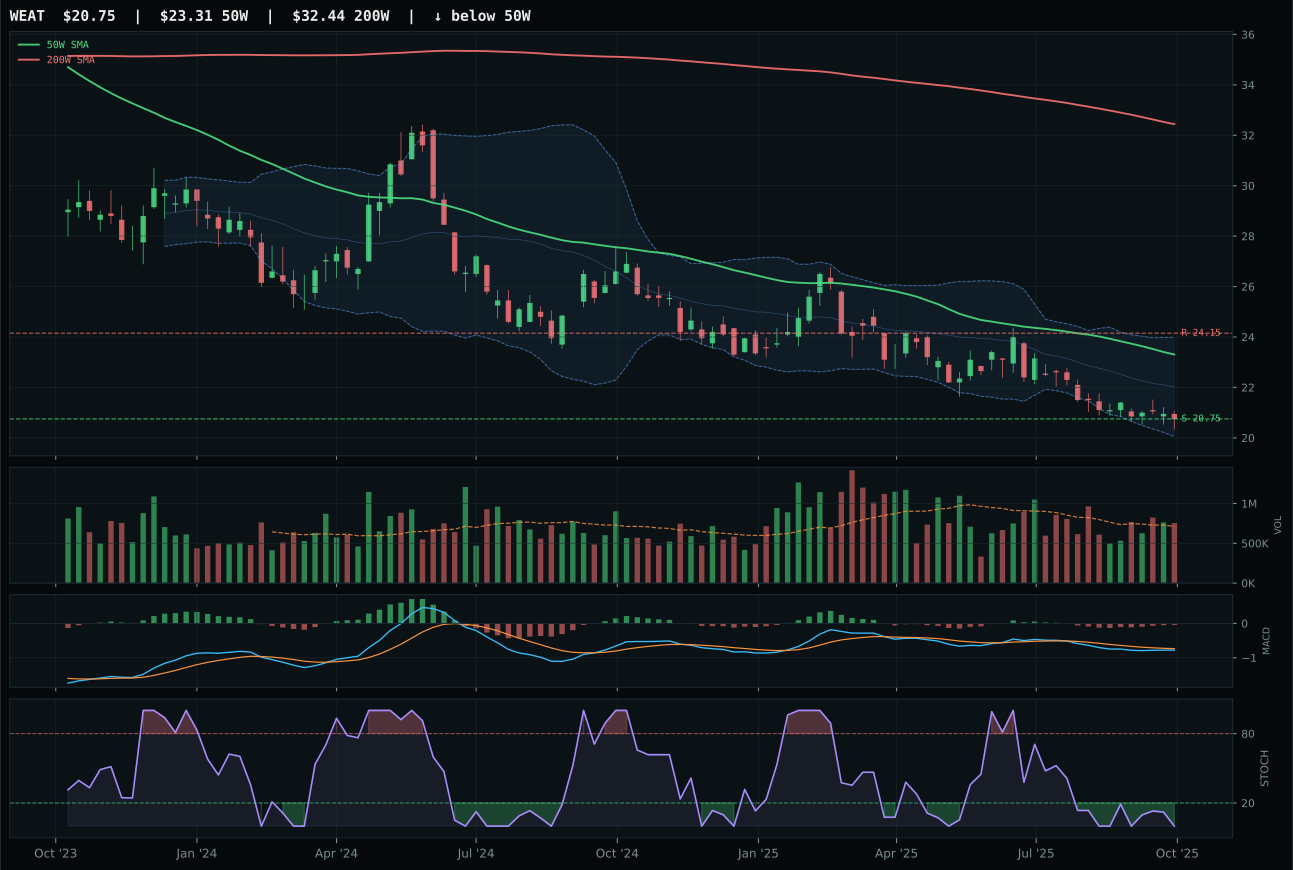
WEAT has a pullback into support profile with -17.4% 13-week relative strength versus SPY.
Extension and support failure are the main tactical risks.
Tracked, but not top-2 eligible because: structurally broken.
MOO wins Agriculture & Livestock, but this is a pyrrhic victory in a category that ranks 9th or 10th overall. The ETF scores 22.7 against VEGI's 9.0 gap, yet MOO still sits below the 50-week moving average (48.6/100 trend score) with bearish MACD and oversold stochastic RSI, relying on timing to justify holding. Its -1.9% 13-week return and -8.9% SPY-relative weakness create momentum confirmation of only 16.7/100—among the lowest across all 50 measured names. The only structural advantage is slightly cleaner composition (cleanliness 50.0 vs 50.0 for VEGI) and a 2.5% category-relative strength that reflects underperformance of peers at -8.9% rather than absolute strength. Volume sits thin at 0.53x the 20-week average, signaling institutional indifference. MOO wins only because the entire three-ETF basket is broken: WEAT's 10.4% 13-week loss and INDA's -6.0% decline leave MOO as the least damaged name.
Agriculture & Livestock receives 0% allocation this week, ranked 9th or 10th overall, because the category score of 22.7 reflects structural weakness that no single name can overcome. Real asset sponsorship (+8) and commodity breadth positive (+5) provide modest macro support, but the category's 59.0/100 macro fit fails to compensate for a technical evidence score of only 32.6/100 for the winning ETF MOO. The broader issue is that the entire agricultural complex is trading below its 50-week and 200-week averages, with thin volume participation and deteriorating momentum confirmation across all three legs of the basket. Liquidity stress (-4) adds friction, and the -8.9% SPY-relative weakness indicates that capital is flowing away from agriculture entirely. This allocation reflects the hard threshold: even when macro descriptors favor real assets, a category cannot earn allocation if its technical setup is broken and its absolute momentum is negative. MOO's timing advantage (85.0/100 due to proximity to the 50-week support) is purely tactical and insufficient to override the category's structural exclusion in a regime where commodity breadth cannot pull agriculture higher.