
2025-09-26
Informational purposes only. The content in this report, including allocations, analysis, and commentary, is provided solely for informational and educational purposes. It does not constitute financial advice, investment advice, trading advice, or any other type of advice. Past performance does not guarantee future results. Always conduct your own research and consult a qualified financial professional before making investment decisions.
Weekly Allocation
| Ticker | Category | Weight | Role |
|---|---|---|---|
| FBTC | 50% | Overlay | |
| COPX | Industrial Metals | 10% | Top-2 (10%) |
| SLV | Precious Metals | 10% | Top-2 (10%) |
| SMH | AI | 5% | Tier-2 (5%) |
| IGV | Technology | 5% | Tier-2 (5%) |
| ILF | Emerging Markets | 5% | Tier-2 (5%) |
| XLE | Traditional Energy | 5% | Tier-2 (5%) |
| URA | Nuclear Energy | 5% | Tier-2 (5%) |
| XLU | Utilities & Infrastructure | 5% | Tier-2 (5%) |
Trade Instructions — Monday Open
Sell the tranche from 2025-08-29 (completing its 4-week hold). Buy the new tranche. Instructions show net portfolio changes — same-asset positions cancel, weight changes show the delta.
| Action | Ticker | Instruction |
|---|---|---|
| SELL | REMX | Sell entire REMX position (2.50% of portfolio) |
| SELL | XLE | Sell 50% of XLE position (reduce 2.50% → 1.25%) |
| SELL | URNM | Sell 33% of URNM position (reduce 3.75% → 2.50%) |
| SELL | AIQ | Sell 17% of AIQ position (reduce 7.50% → 6.25%) |
| SELL | IGF | Sell entire IGF position (1.25% of portfolio) |
| SELL | GDX | Sell entire GDX position (1.25% of portfolio) |
| SELL | XAR | Sell 25% of XAR position (reduce 5.00% → 3.75%) |
| SELL | XLK | Sell entire XLK position (1.25% of portfolio) |
| BUY | COPX | Buy COPX — 22.22% of freed cash (adds 2.50% to portfolio) |
| BUY | ILF | Buy ILF — 11.11% of freed cash (adds 1.25% to portfolio) |
| BUY | URA | Buy URA — 11.11% of freed cash (adds 1.25% to portfolio) |
| BUY | IGV | Buy IGV — 11.11% of freed cash (adds 1.25% to portfolio) |
| BUY | SLV | Buy SLV — 22.22% of freed cash (adds 2.50% to portfolio) |
| BUY | SMH | Buy SMH — 11.11% of freed cash (adds 1.25% to portfolio) |
| BUY | XLU | Buy XLU — 11.11% of freed cash (adds 1.25% to portfolio) |
Current Portfolio After Trade
Combined holdings across all 4 active tranches. Each tranche is 25% of the portfolio.
| Ticker | % of Portfolio | Weight Bar |
|---|---|---|
| FBTC | 50.00% | |
| COPX | 10.00% | |
| AIQ | 6.25% | |
| GLD | 5.00% | |
| ILF | 5.00% | |
| XAR | 3.75% | |
| PAVE | 3.75% | |
| URNM | 2.50% | |
| CIBR | 2.50% | |
| URA | 2.50% | |
| IGV | 2.50% | |
| SLV | 2.50% | |
| SMH | 1.25% | |
| XLE | 1.25% | |
| XLU | 1.25% |
Macro Regime — Transition / Mixed
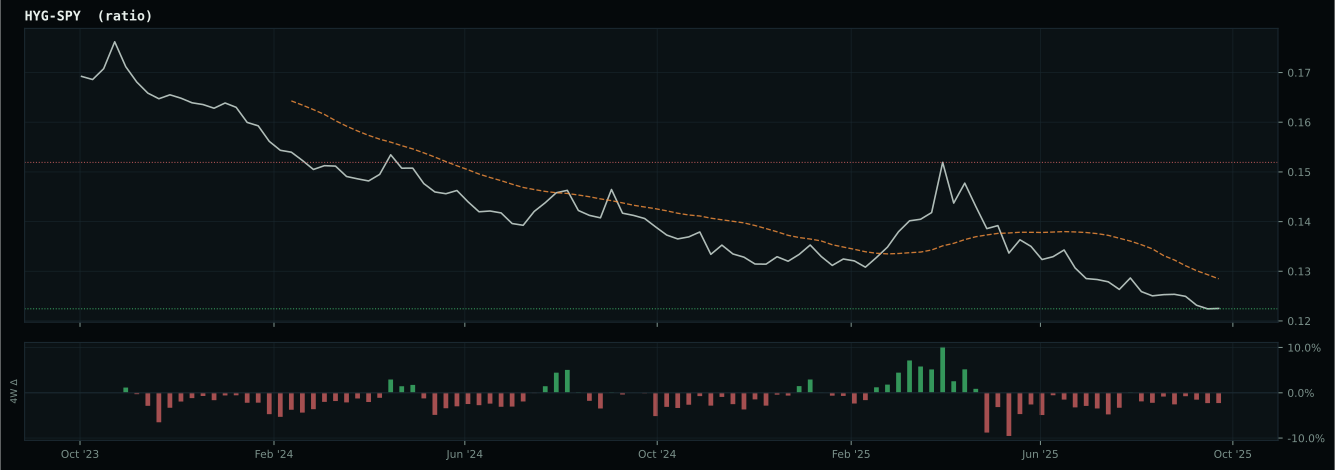
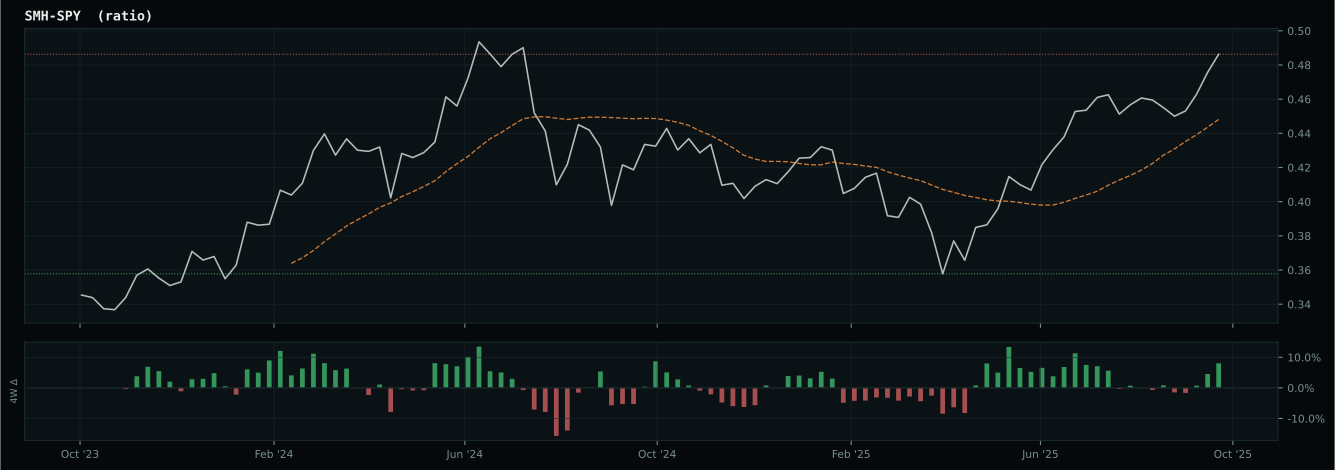
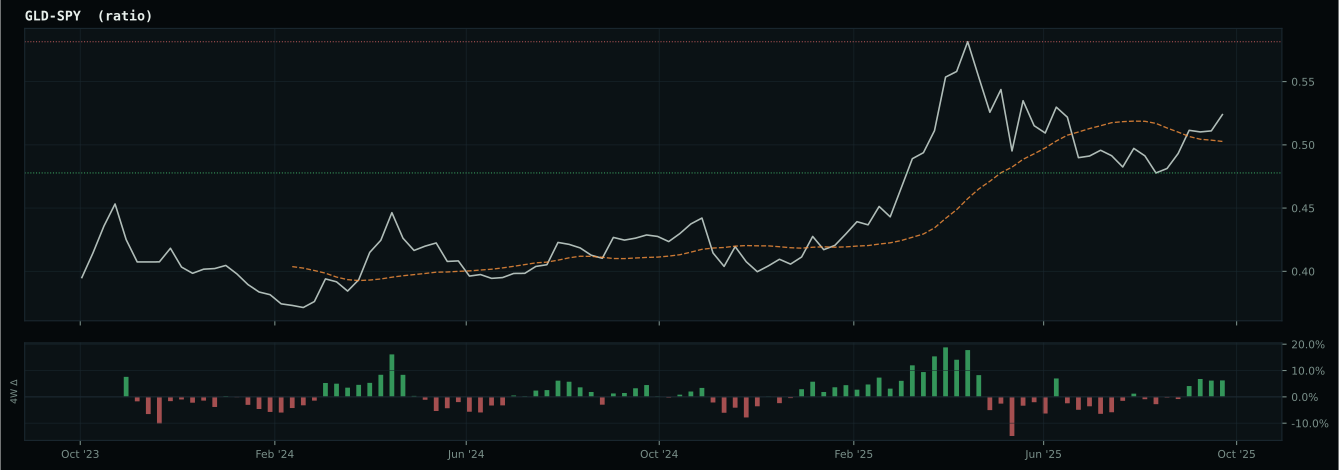
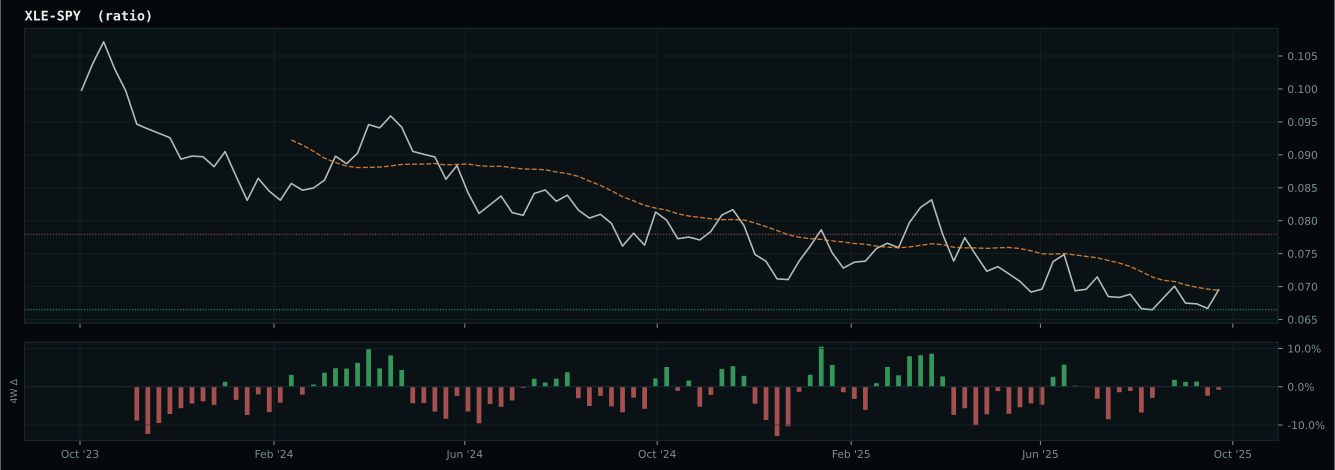
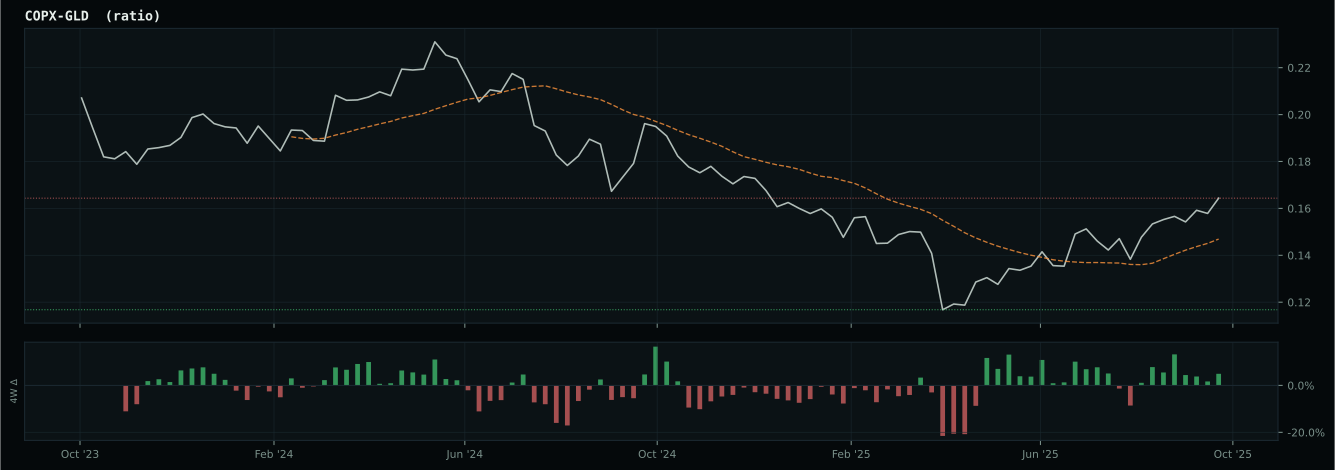
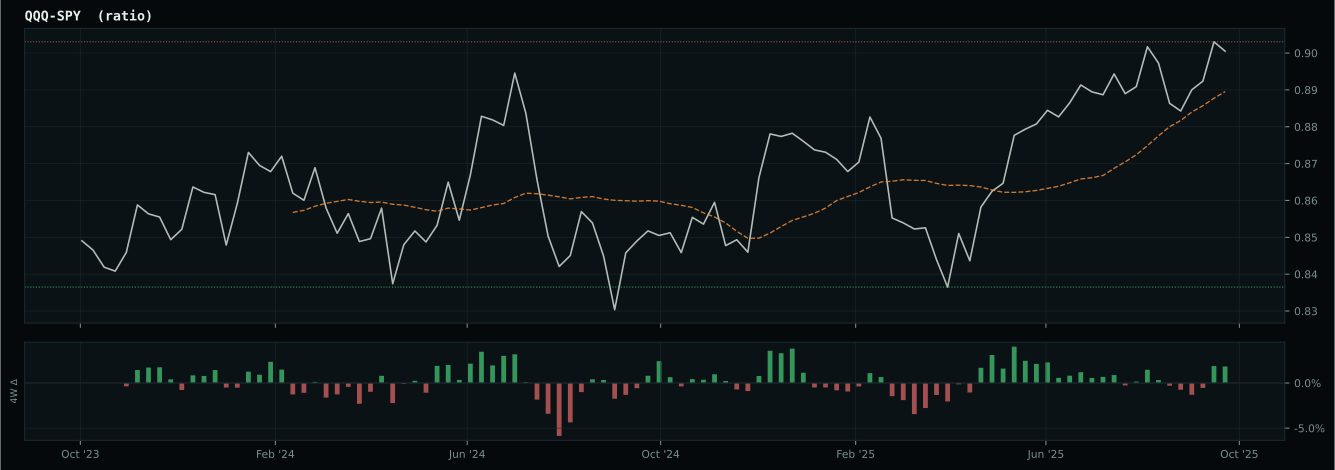
Macro Evidence Charts
Market-implied signals behind the macro regime scores. Each ratio compares two assets; the direction and slope of the ratio is what the macro engine reads.
Crypto Regime — TrendBTC
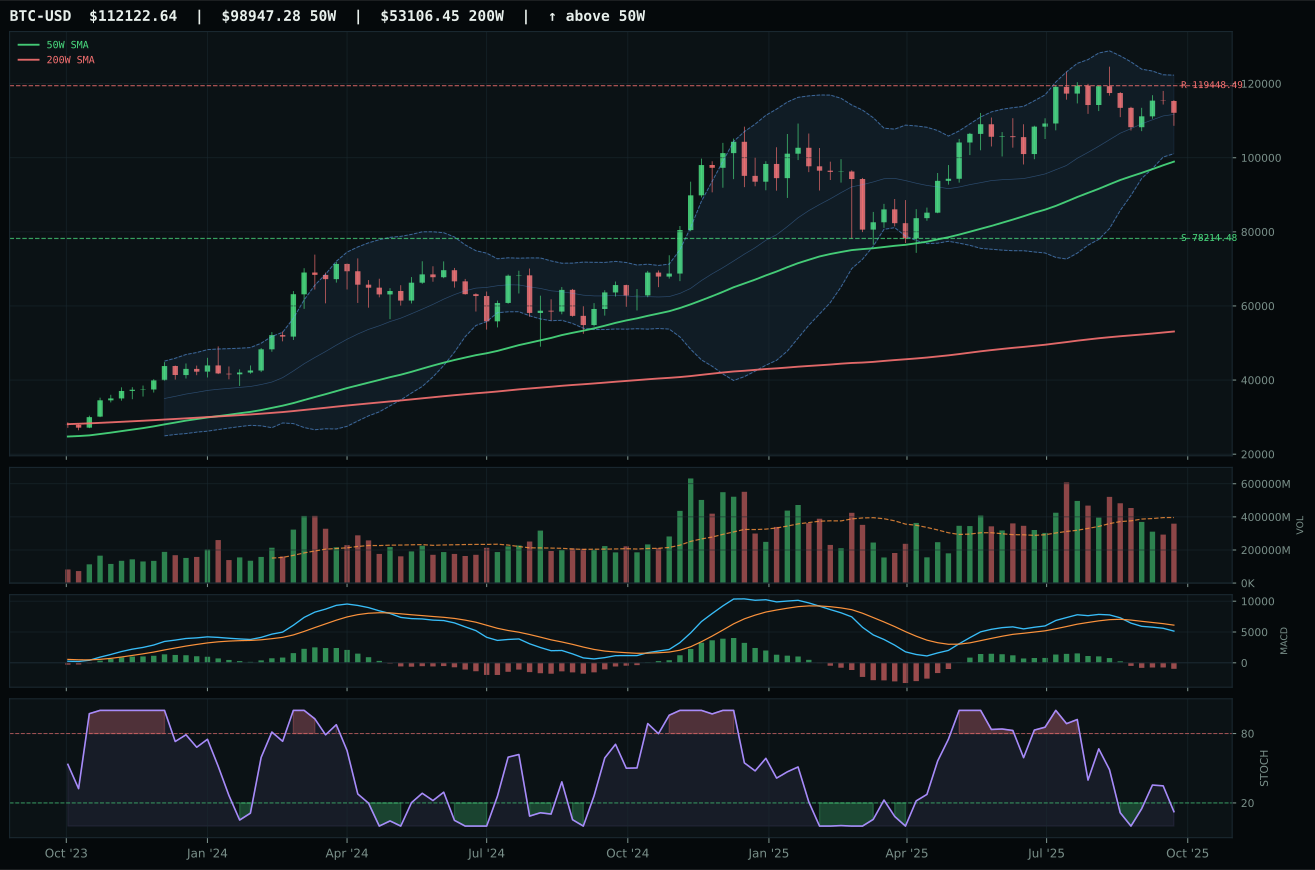
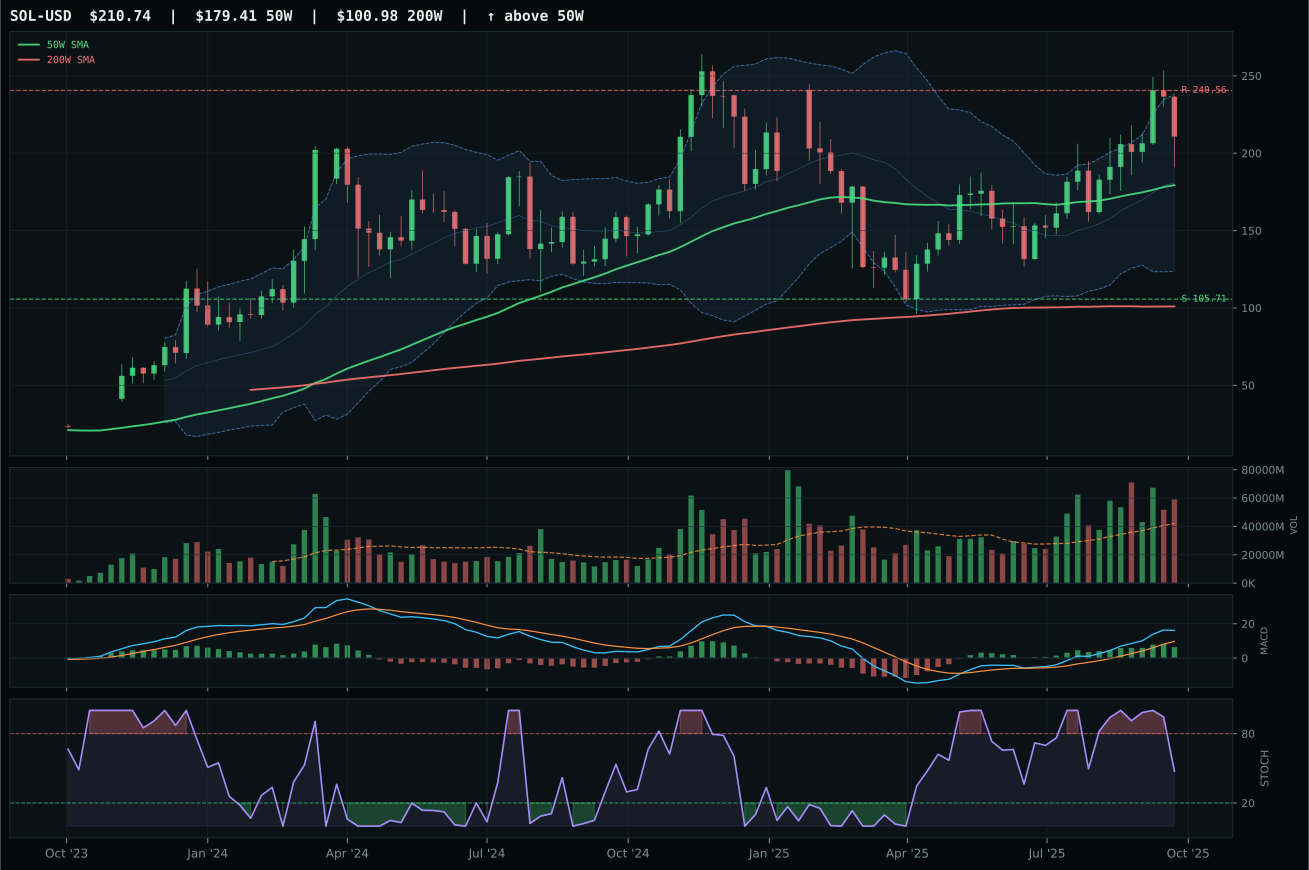
ValueBTC not armed: BTC has not made the first post-breakdown touch of the 200W buy zone after losing the 50W
TrendBTC confirmed: 2 consecutive closes above rising/flat 50W SMA
one or more available conditions failed
Category Rankings
| Rank | Category | Winner | Score | Alloc | 4W Ret | Peers (4W) |
|---|---|---|---|---|---|---|
| 1 | Industrial Metals | COPX | 79.9 | 20% | +6.27% | REMX +9.5% · PICK +5.7% |
| 2 | Precious Metals | SLV | 76.1 | 20% | +1.20% | GDX -8.4% · GLD +5.5% |
| 3 | AI | SMH | 67.8 | 10% | +10.17% | AIQ +6.6% · BOTZ +9.1% |
| 4 | Technology | IGV | 67.3 | 10% | +1.84% | XLK +6.2% · CIBR +2.3% |
| 5 | Emerging Markets | ILF | 62.5 | 10% | +0.35% | IEMG +4.6% · INDA +4.8% |
| 6 | Traditional Energy | XLE | 60.9 | 10% | -3.28% | XOP -5.2% · FCG -5.8% |
| 7 | Nuclear Energy | URA | 56.5 | 10% | +5.70% | URNM -3.6% · NLR +7.9% |
| 8 | Utilities & Infrastructure | XLU | 55.3 | 10% | +5.32% | PAVE +2.9% · IGF +1.6% |
| 9 | Defense & Aerospace | XAR | 51.4 | 0% | +7.95% | ITA +4.9% · ROKT +8.4% |
| 10 | Agriculture & Livestock | MOO | 25.4 | 0% | +1.18% | VEGI +1.0% · WEAT +0.2% |
Industrial Metals — COPX
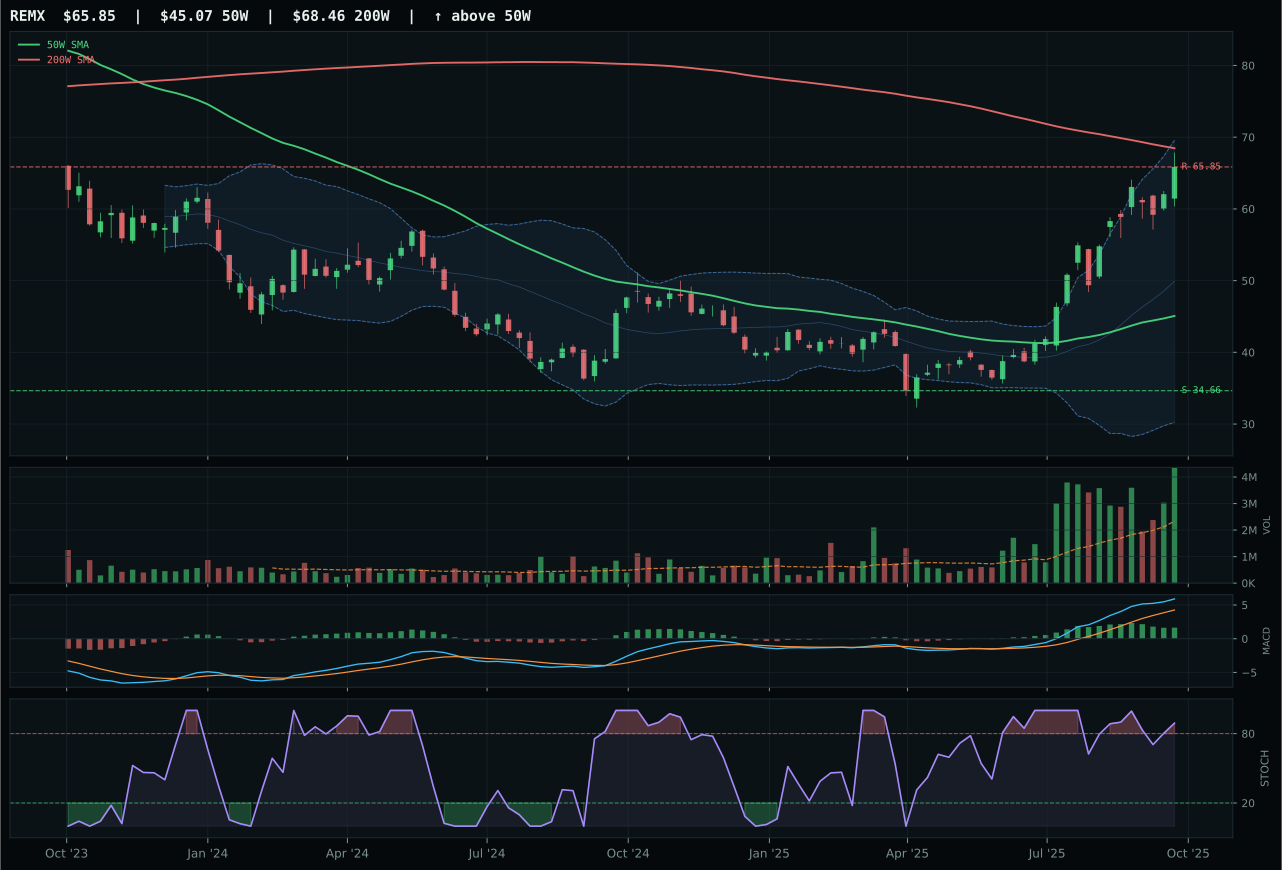
REMX has a vertical extension profile with 52.1% 13-week relative strength versus SPY.
A failed hold above support would weaken the setup.
Actionable but governed by invalidation levels.
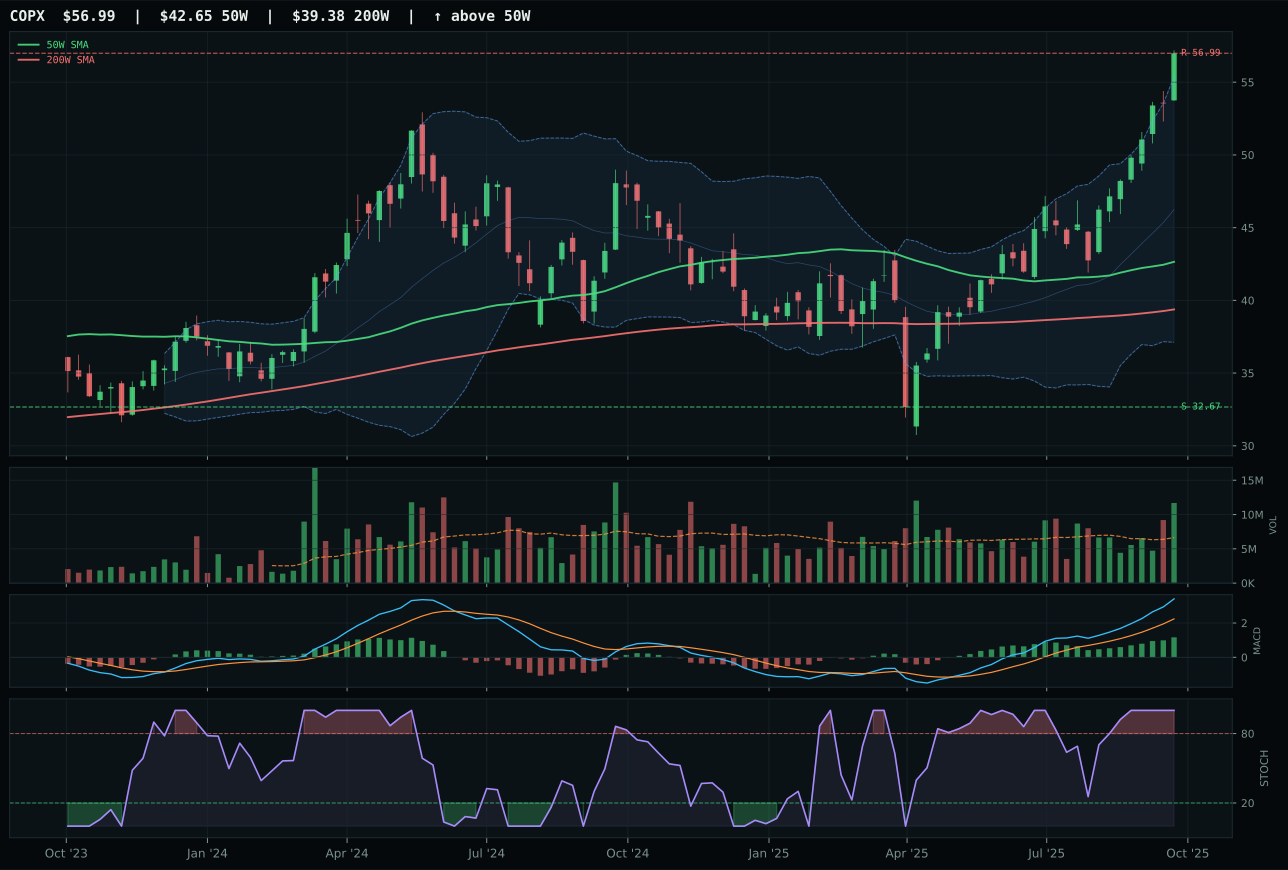
COPX has a vertical extension profile with 19.3% 13-week relative strength versus SPY.
A failed hold above support would weaken the setup.
Actionable but governed by invalidation levels.
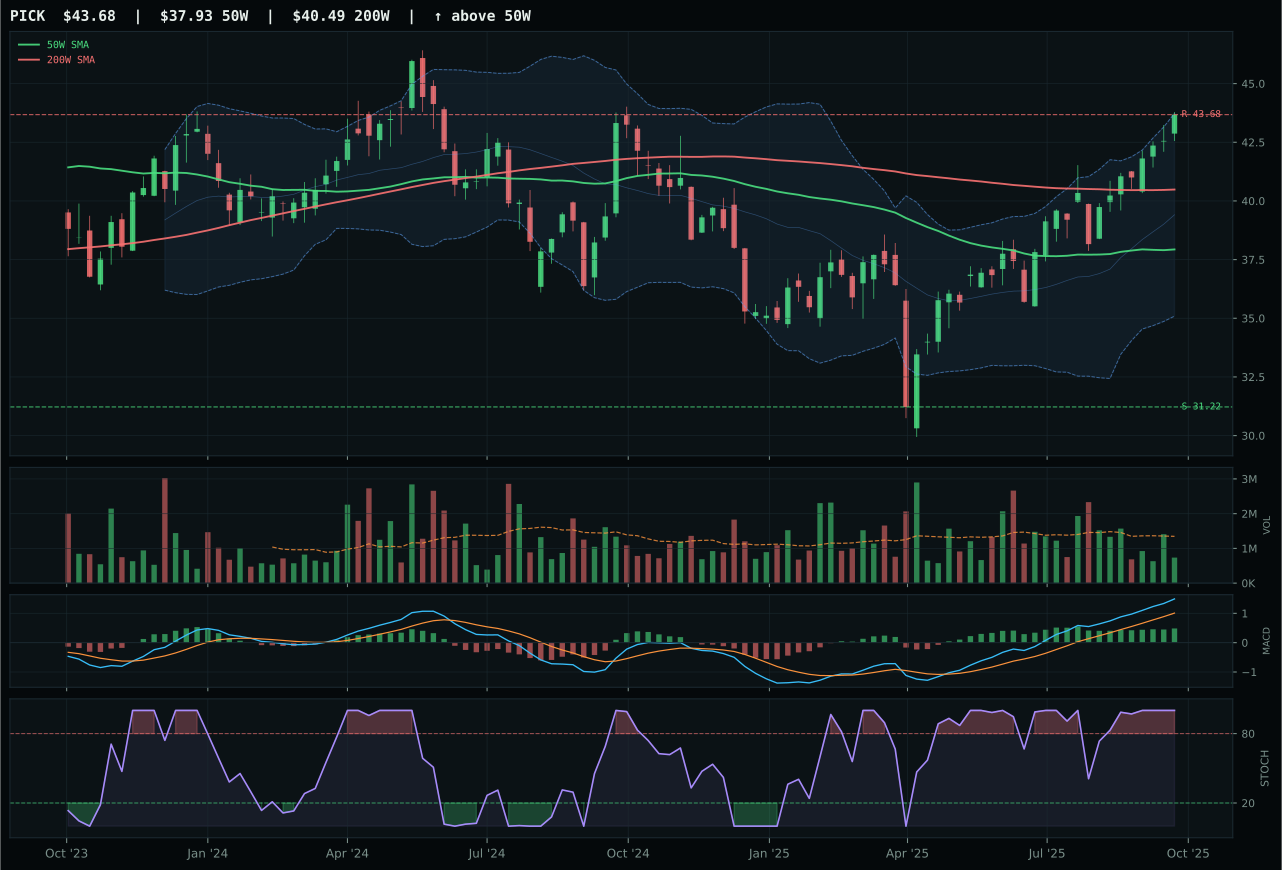
PICK has a vertical extension profile with 7.9% 13-week relative strength versus SPY.
A failed hold above support would weaken the setup.
Actionable but governed by invalidation levels.
COPX wins decisively with a 8.9-point margin over REMX because timing and MACD confirmation separate the two despite nearly identical technical scores. COPX sits 33.6% above the 50W with MACD bullish and improving, while REMX sits 46.1% above with MACD bullish but flattening—a critical deterioration that signals REMX's 59.7% 13W return and 52.1% RS versus SPY reflect past conviction, not fresh sponsorship. COPX's 26.9% 13W return and 19.3% RS versus SPY lag on absolute returns but win on quality: the timing score of 37.0/100 versus 32.0/100 and structure cleanliness of 84.5/100 versus 82.0/100 prove COPX's move is more recent and better-positioned for persistence. Both carry accumulation-level volume, but COPX's MACD acceleration versus REMX's deceleration reveals which narrative has fresh institutional backing.
Industrial Metals earns 10% allocation as the highest-ranked category at 79.9, reflecting copper scarcity and industrial-demand sponsorship in a regime where metals scarcity (+14) and commodity breadth positive (+10) are the dominant macro drivers. COPX's technical evidence of 87.8/100 and macro/narrative fit of 69.0/100 combine to create the portfolio's strongest asymmetry: meaningful downside cushion (74.4% to support) paired with active directional macro sponsorship and fresh technical momentum. The 50% overlay context means Industrial Metals receives an effective 10% allocation from a normal 20% tier-one sleeve, but that capital is deployed into the highest-conviction setup in the category universe this week. Real asset sponsorship (+6) reinforces the thesis. This is the category that benefits most directly from the active Transition/Mixed regime's bifurcation between assets perceived as scarce or structurally constrained versus those dependent on traditional growth narratives.
Precious Metals — SLV
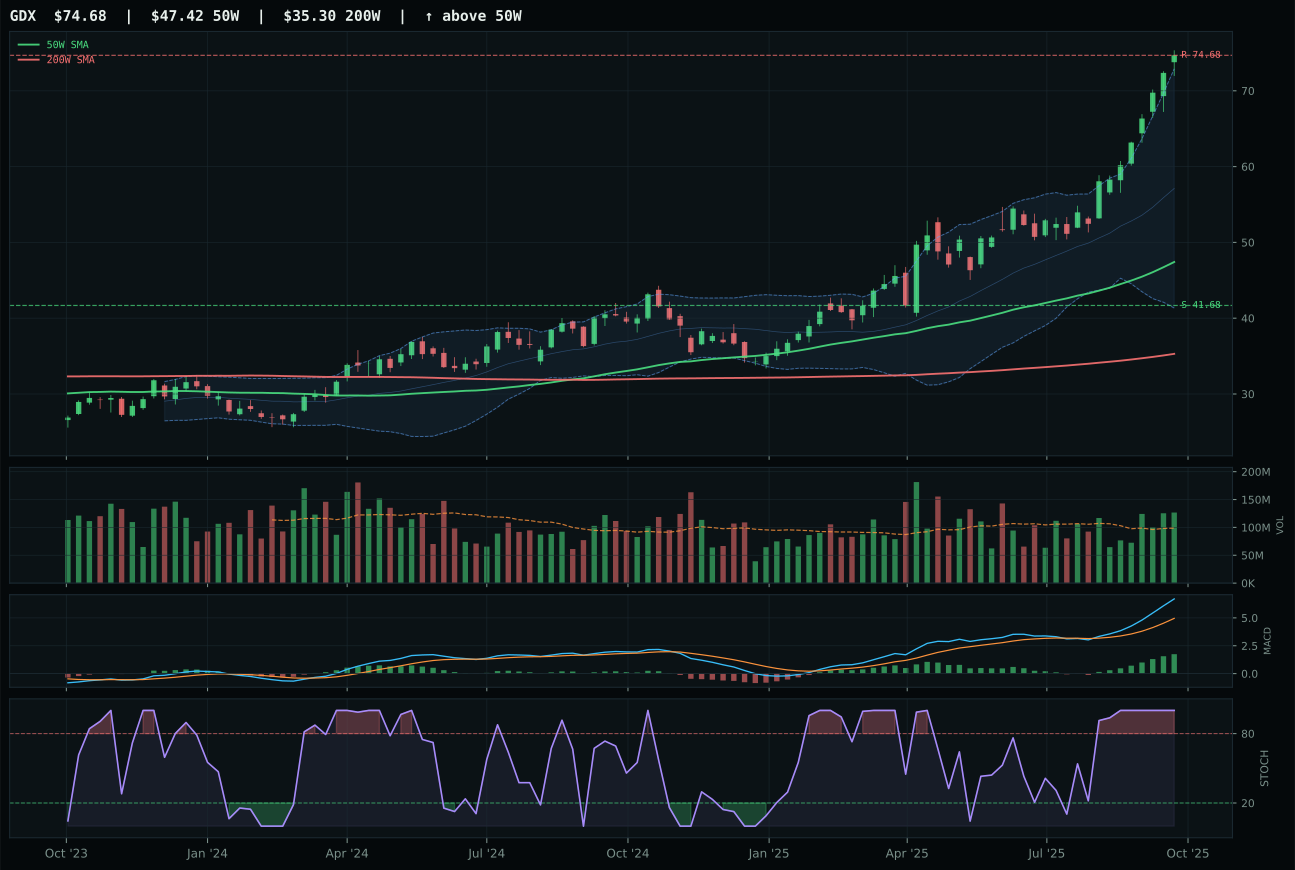
GDX has a vertical extension profile with 39.6% 13-week relative strength versus SPY.
A failed hold above support would weaken the setup.
Actionable but governed by invalidation levels.
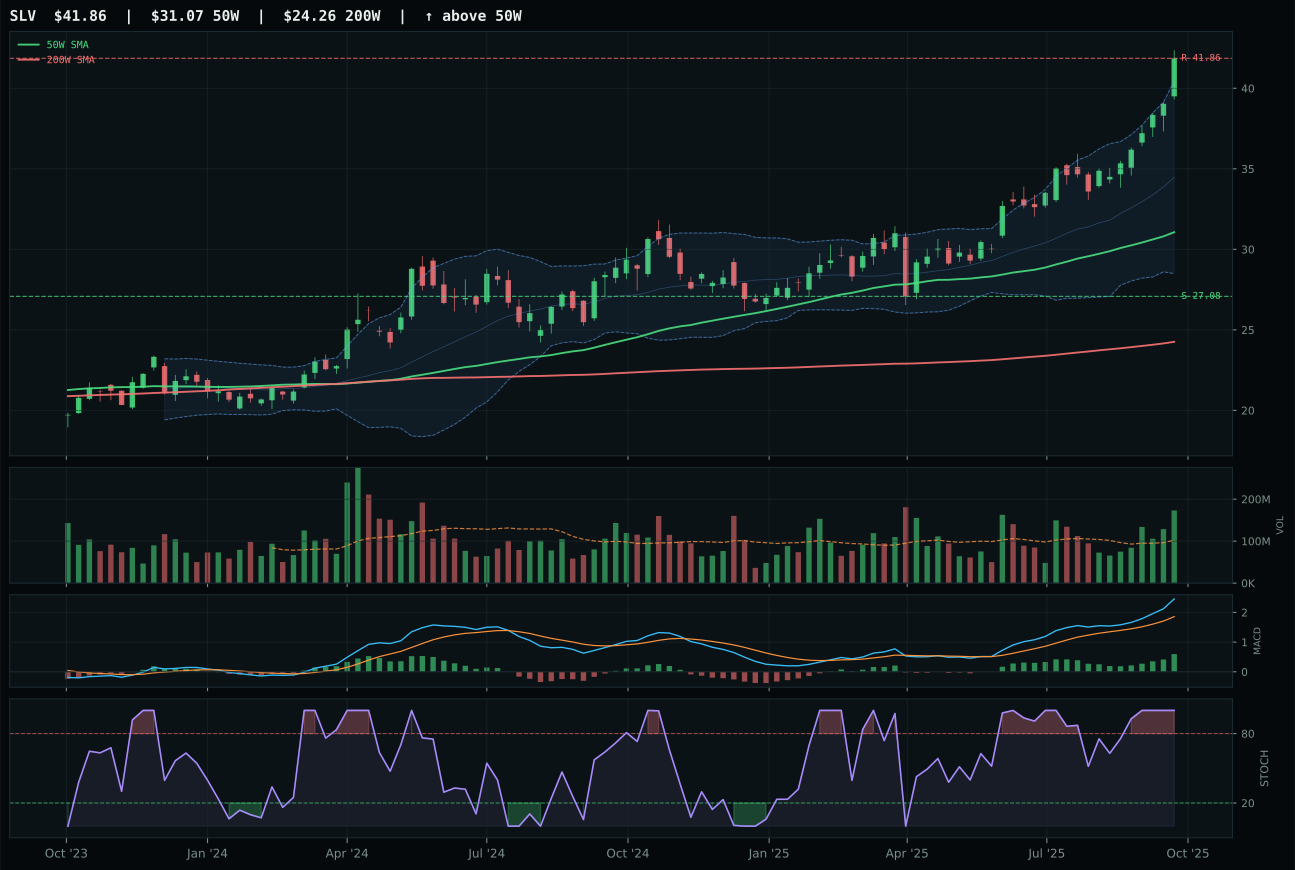
SLV has a vertical extension profile with 20.7% 13-week relative strength versus SPY.
A failed hold above support would weaken the setup.
Actionable but governed by invalidation levels.
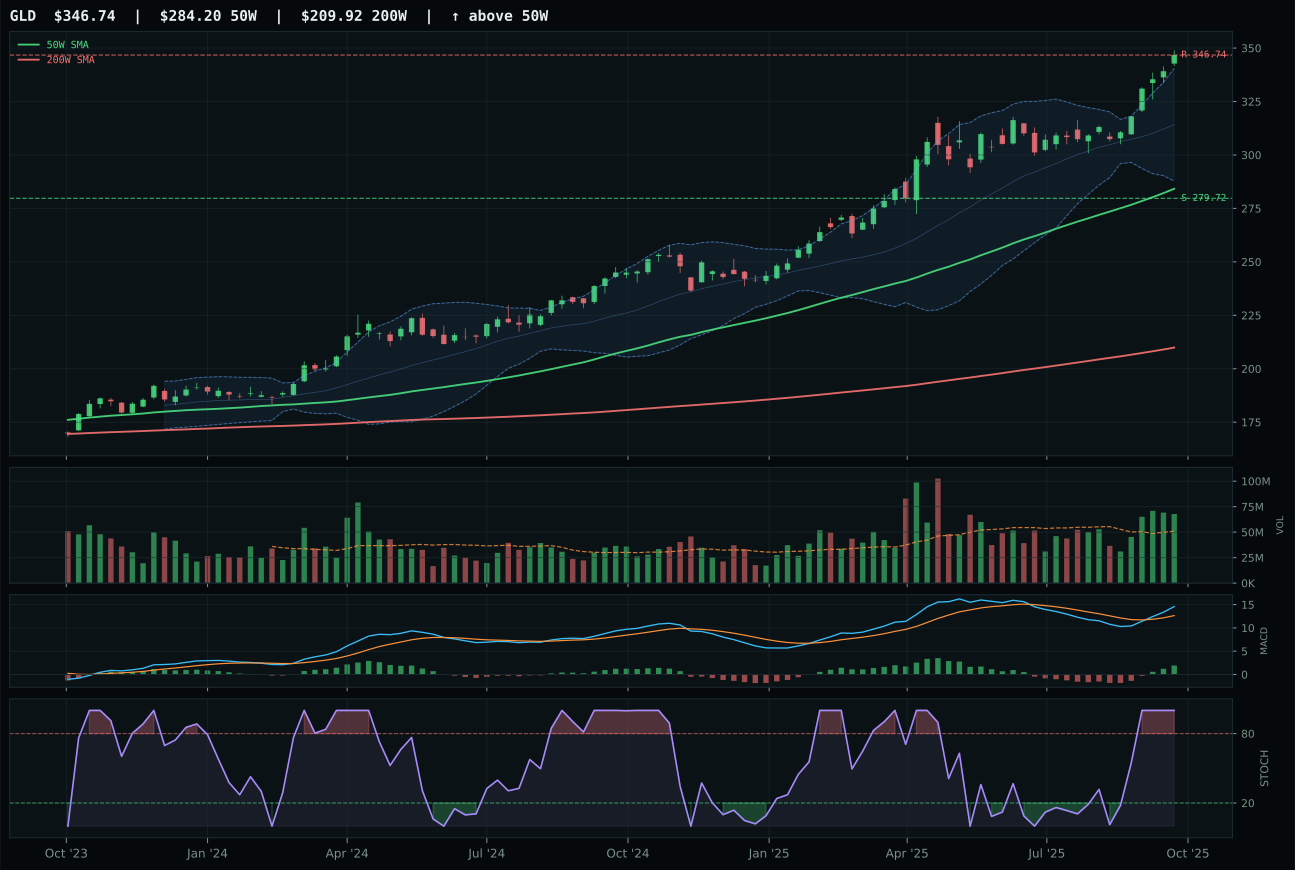
GLD has a vertical extension profile with 7.5% 13-week relative strength versus SPY.
A failed hold above support would weaken the setup.
Actionable but governed by invalidation levels.
SLV wins because it combines the strongest volume-price sponsorship in the category (88.6/100 confirmation, 91.2/100 persistence) with pure momentum dominance: 28.3% 13W return, 20.7% RS versus SPY, and 100/100 momentum confirmation. At 34.7% above the 50W, the extension is severe, yet the 1.70x volume at accumulation/confirmation levels proves institutional buyers are stepping in at the highs—a rare tell that money is chasing conviction rather than squeezing shorts. GDX returns 47.2% in 13W with 39.6% RS versus SPY, a far superior relative move, yet loses because it sits 57.5% above the 50W with only above-average (not accumulation) volume and risk-reward collapsing to 38.8/100. SLV's tighter extension and superior volume sponsorship signal that the monetary-hedge narrative still drives fresh capital; GDX has already discounted the move.
Precious Metals earns 10% allocation as a top-2 category, justified by the 76.1 final score and clean technical leadership in a macro environment where monetary hedge bid (+7) and metals scarcity (+7) are active sponsorship factors. SLV's technical evidence of 88.2/100 and volume-price confirmation at 88.6/100 demonstrate that the setup is not a short-squeeze or late-stage momentum play but genuine fresh accumulation into a narrative with macro legs. The category macro fit of 60.0/100 benefits from monetary hedge tailwind (+14) even as risk appetite positive turns slightly negative (-4), reflecting the hedge nature of the position. The 50% crypto overlay regime halves the effective allocation to 10% of a 20% normal-tier sleeve, positioning Precious Metals as a core tactical hedge against credit stress and currency degradation—a role it is executing cleanly with strong volume sponsorship and technical persistence.
AI — SMH
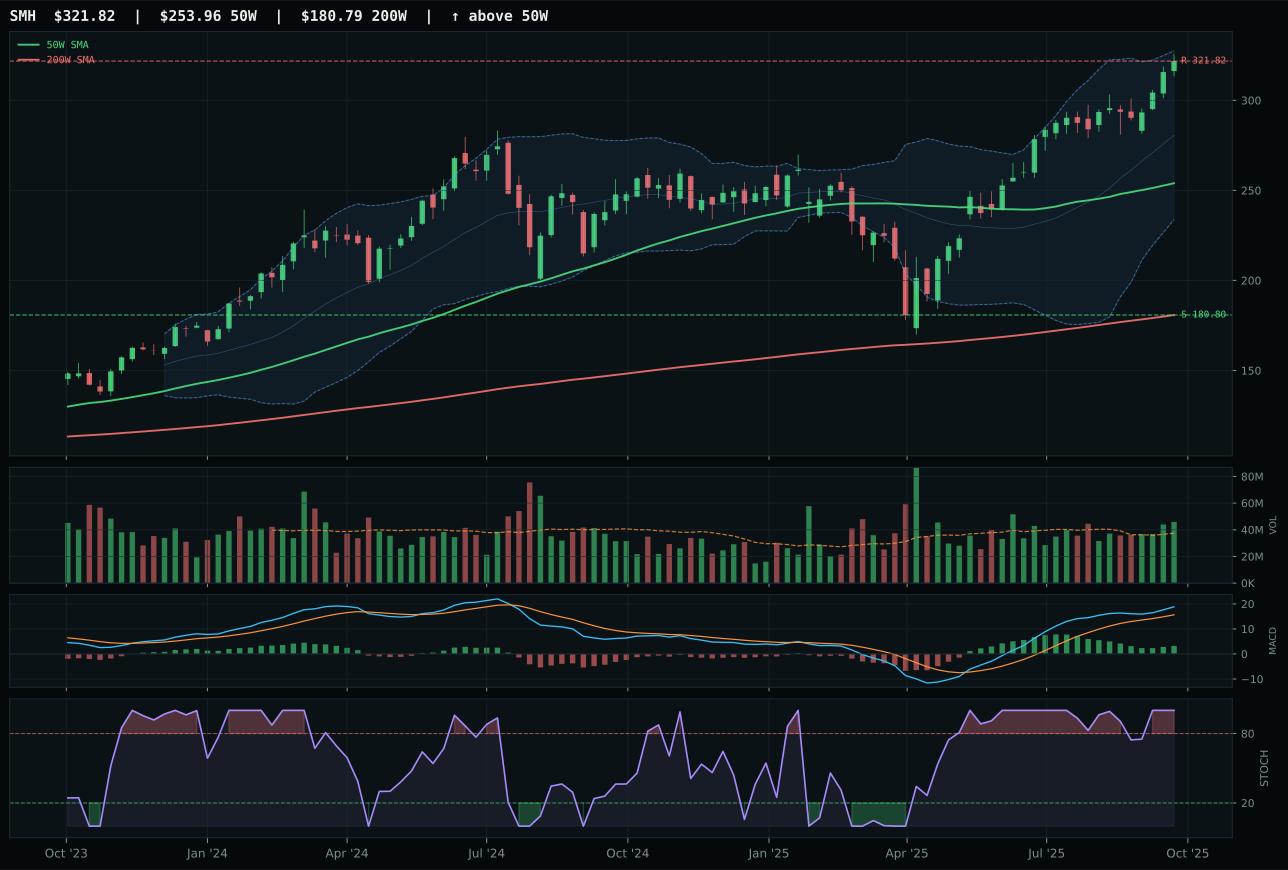
SMH has a vertical extension profile with 8.0% 13-week relative strength versus SPY.
A failed hold above support would weaken the setup.
Actionable but governed by invalidation levels.
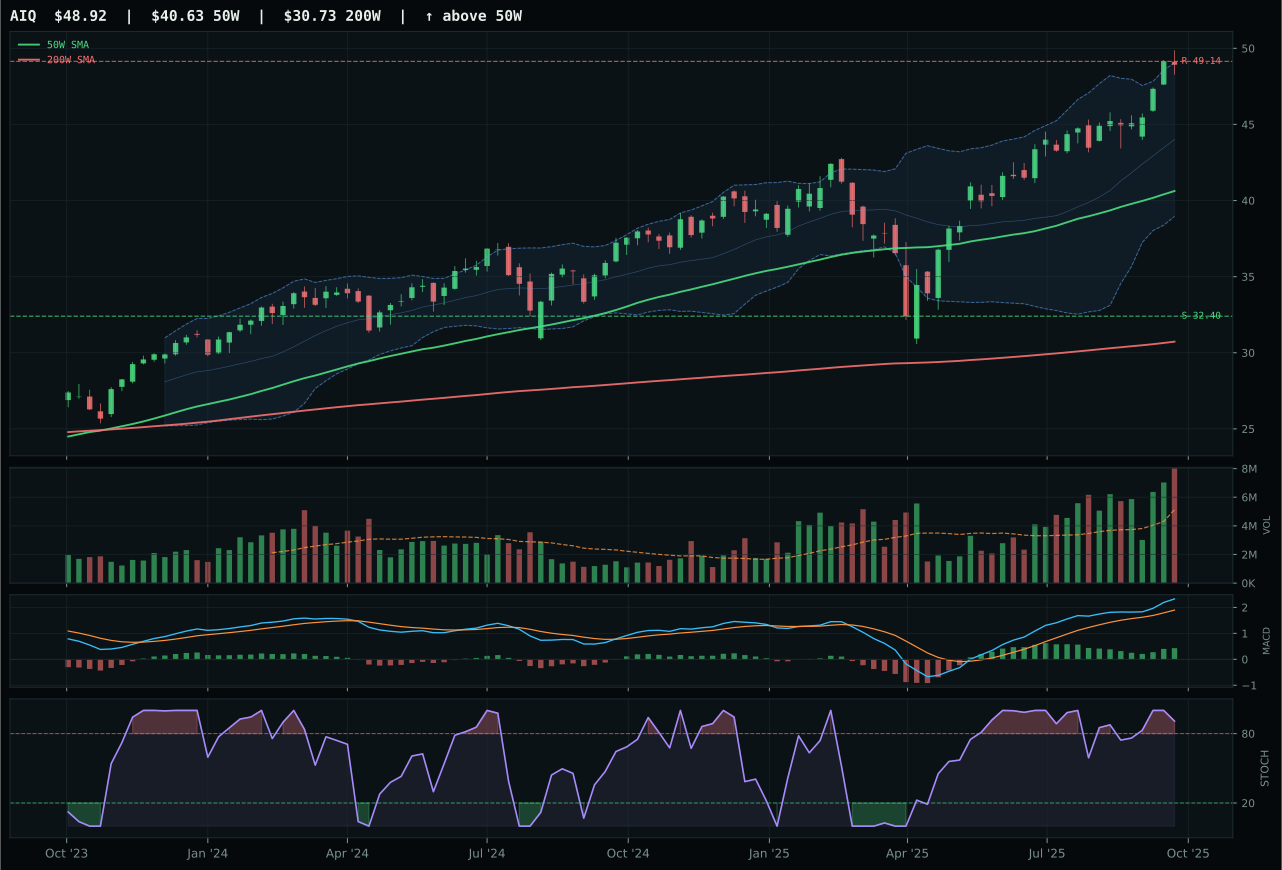
AIQ has a vertical extension profile with 5.2% 13-week relative strength versus SPY.
A failed hold above support would weaken the setup.
Actionable but governed by invalidation levels.
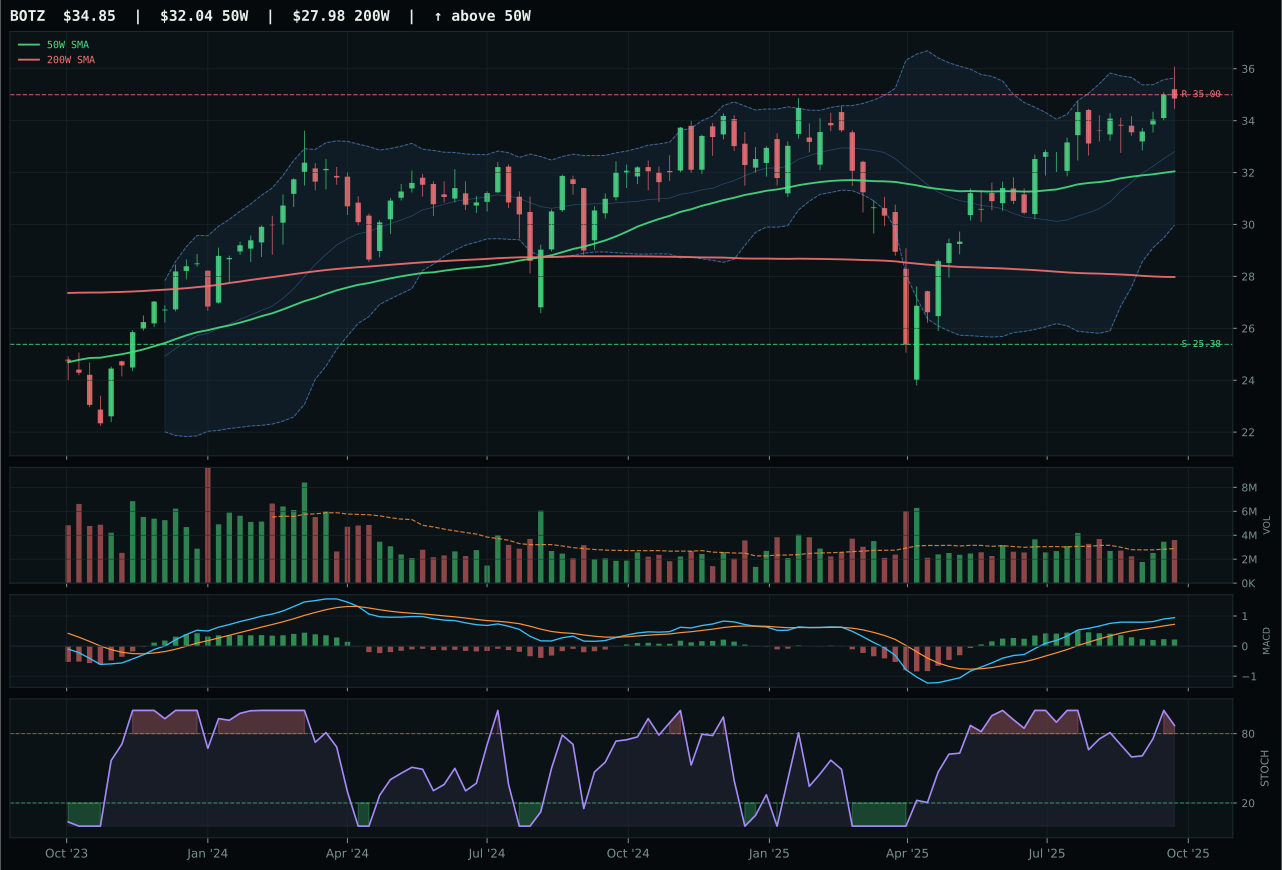
BOTZ has a neutral structure profile with -0.5% 13-week relative strength versus SPY.
A failed hold above support would weaken the setup.
Actionable but governed by invalidation levels.
SMH wins despite sitting 26.7% above the 50W because its momentum confirmation reaches 100/100—4W and 13W returns of 10.9% and 15.6% respectively, paired with above-average volume at 1.22x the 20W average, prove accumulation is sponsoring the move, not distribution. Category-relative strength of 2.8% and RS versus SPY of 8.0% confirm SMH is winning its peer set decisively. The narrow 1.9-point margin versus AIQ masks a structural advantage: SMH's volume-price confirmation at 75.9/100 demonstrates buyers are stepping in at height, while AIQ's distribution pressure and 0.0% category-relative strength indicate insiders and early participants are reducing positions. Extended or not, SMH owns the sponsorship; AIQ is being abandoned.
AI holds 5% as tier-2, a position that reflects its 67.8 final score ranking below COPX and SLV but above the excluded categories. SMH's trend is flawless (100.0/100) and macro fit benefits from active AI growth sponsorship (+14) and risk appetite positive (+10), yet timing collapses to 37.0/100 and risk-reward to 38.9/100 because the 26.7% extension leaves no margin for error. The Transition/Mixed regime actively penalizes late-stage vertical moves; credit stress (-8) creates friction that favors risk-reward setups with downside cushion over pure momentum. AI retains capital allocation because the category macro score of 66.0/100 and technical leadership remain solid, but the risk-asymmetry problem prevents top-2 promotion—entry here requires conviction that momentum sponsors will keep buying into height, a bet better made at lower allocations.
Technology — IGV
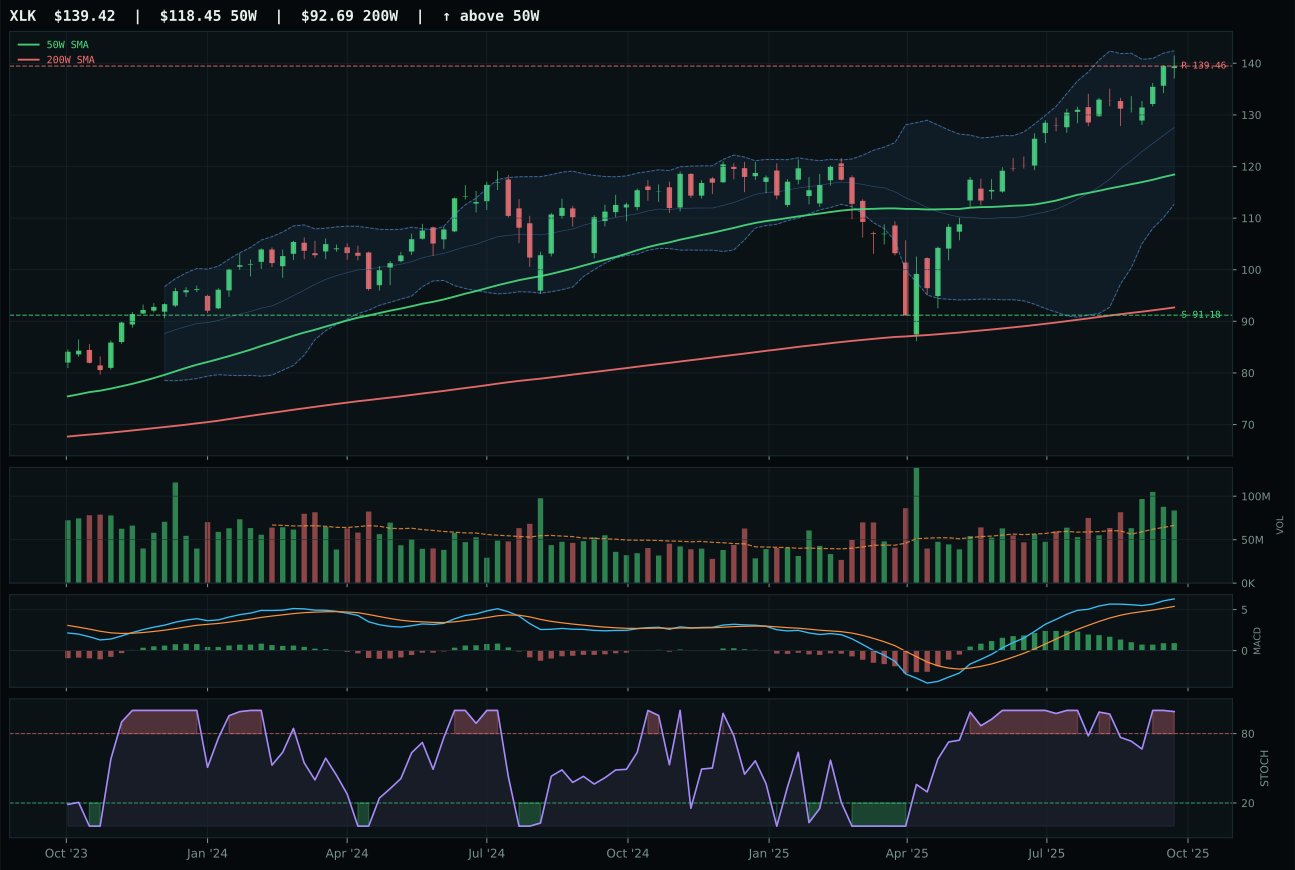
XLK has a vertical extension profile with 3.6% 13-week relative strength versus SPY.
A failed hold above support would weaken the setup.
Actionable but governed by invalidation levels.
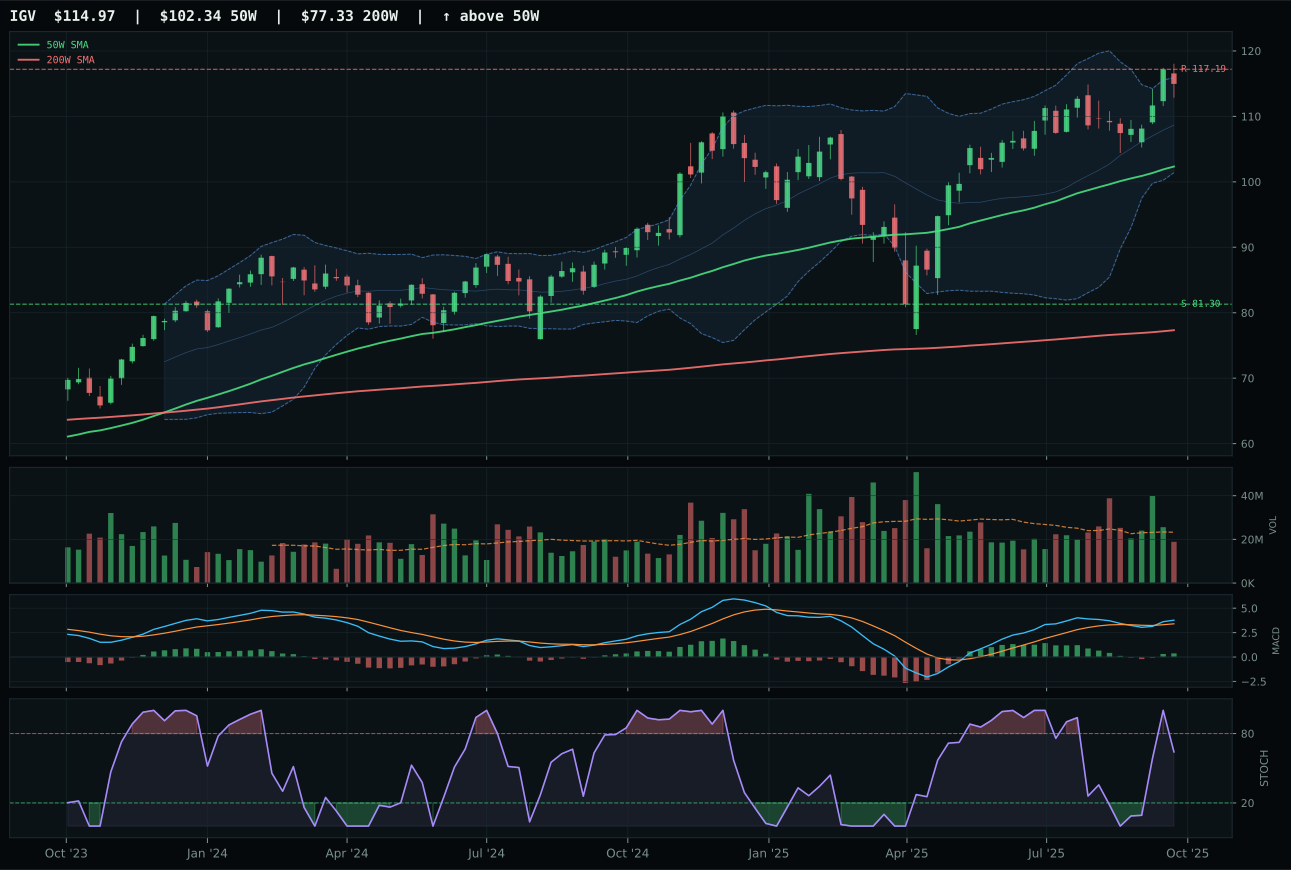
IGV has a neutral structure profile with -1.0% 13-week relative strength versus SPY.
A failed hold above support would weaken the setup.
Actionable but governed by invalidation levels.
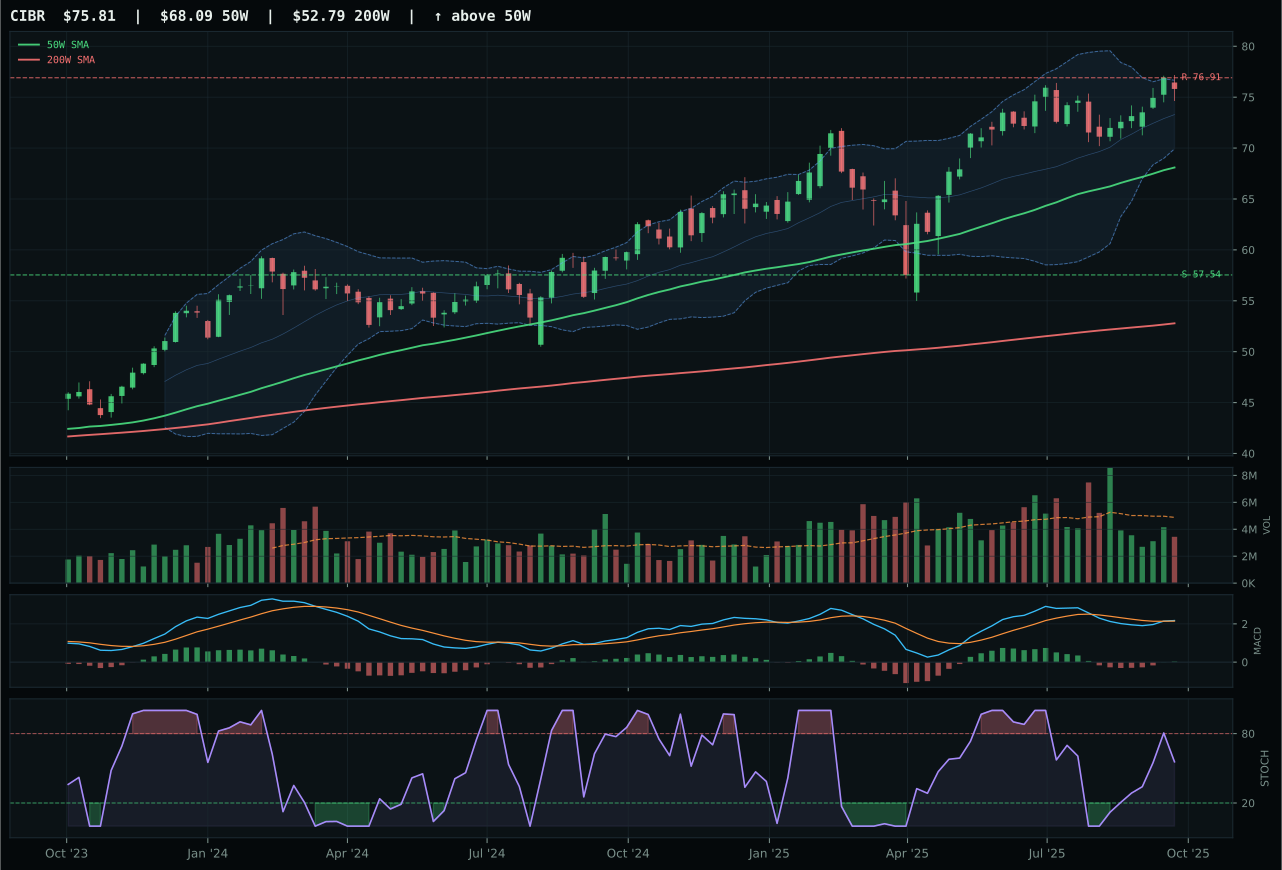
CIBR has a neutral structure profile with -6.0% 13-week relative strength versus SPY.
A failed hold above support would weaken the setup.
Actionable but governed by invalidation levels.
IGV wins the category because its setup offers clean entry geometry where timing, momentum confirmation, and relative strength align without overextension penalty. At 12.3% above the 50W with MACD bullish and improving and stochastic RSI rising mid-zone, the chart presents a neutral structure that rewards fresh accumulation rather than chasing vertical moves. Its 13W return of 6.7% paired with category-relative strength of 0.0% and momentum confirmation at 77.8/100 proves the move is internally sponsored—new money is coming in alongside the advance, not leaving. XLK lost because it sits 17.7% above the 50W with MACD flattening and stochastic RSI overbought, a profile that signals late institutional participation; at that extension, every new buyer is paying full freight for yesterday's conviction, and the technical setup deteriorates into a distribution risk masquerading as momentum.
Technology earns 5% allocation as a tier-2 position, below the top-2 threshold despite a 67.3 final score. The category faced two technical headwinds: IGV's 12.3% extension from the 50W constrains upside risk-reward to -1.9% toward resistance, and macro fit of 58.0/100 reflects a Transition/Mixed regime where AI growth sponsorship (+6) and risk appetite positive (+9) are offset by active credit stress (-7). Two higher-scoring categories—Industrial Metals at 79.9 and Precious Metals at 76.1—secured the 10% top-2 slots by combining superior momentum sponsorship with cleaner risk-reward setups and stronger macro alignment. Technology remains positioned for participation but lacks the asymmetry or macro tailwind that would justify overweighting in a period of regime uncertainty.
Emerging Markets — ILF
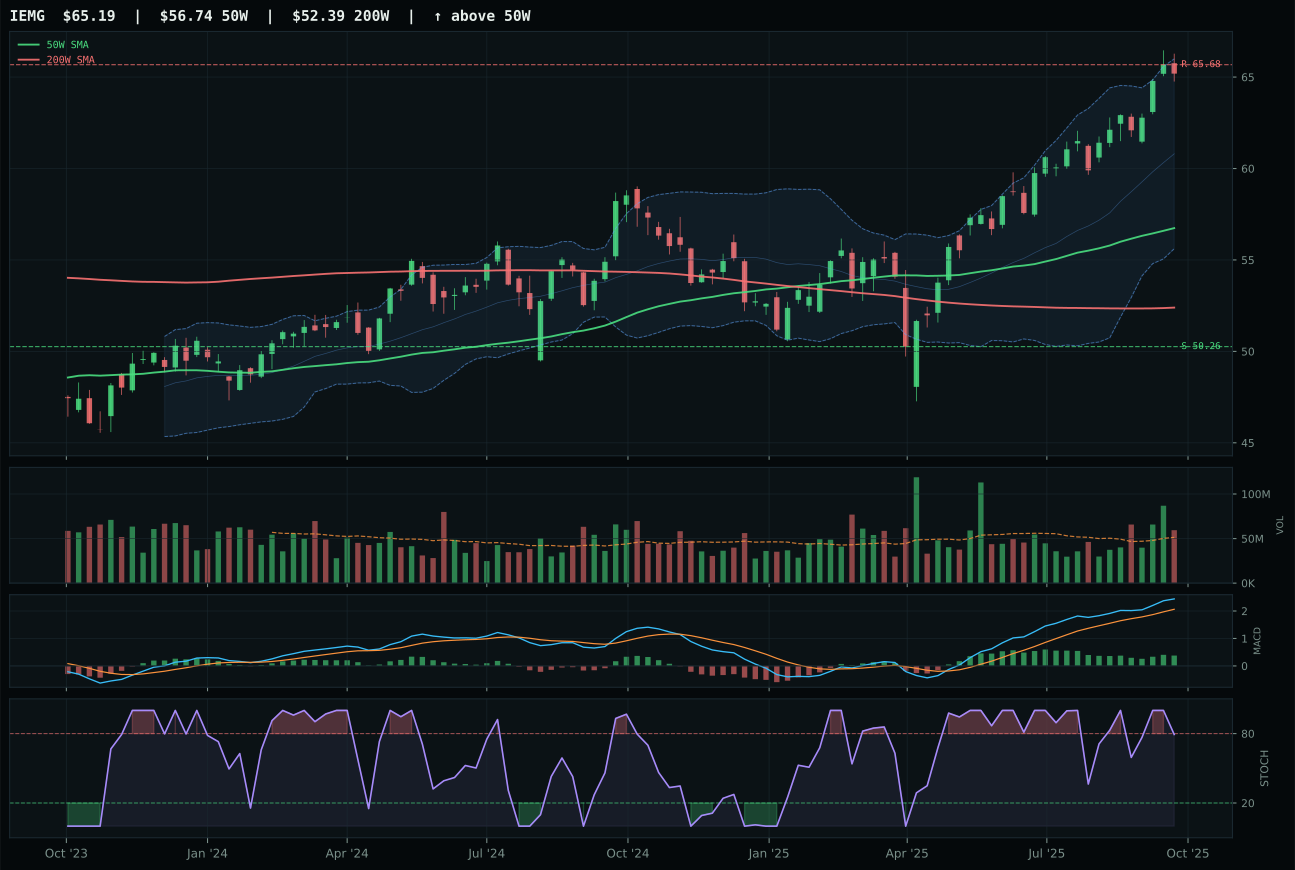
IEMG has a neutral structure profile with 1.5% 13-week relative strength versus SPY.
A failed hold above support would weaken the setup.
Actionable but governed by invalidation levels.
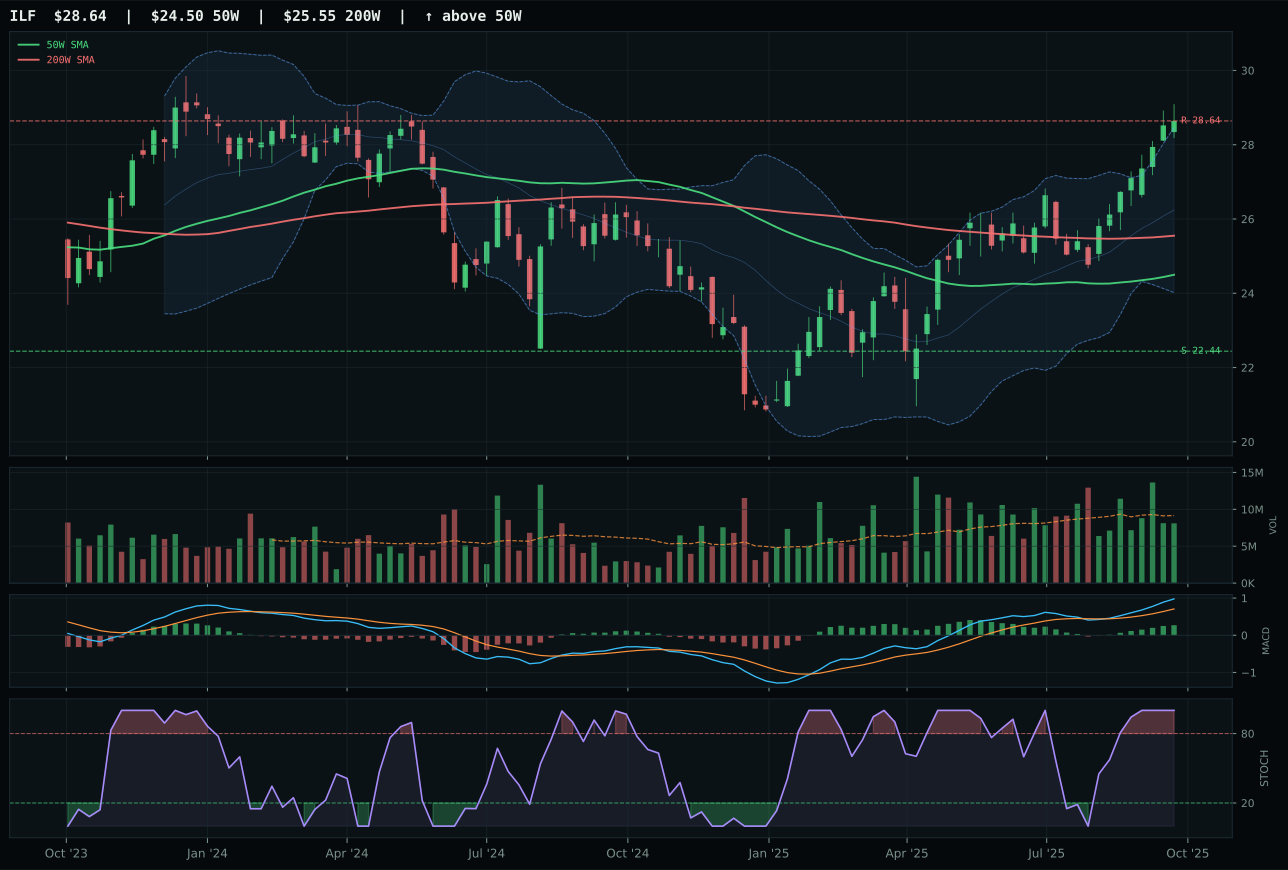
ILF has a vertical extension profile with 3.5% 13-week relative strength versus SPY.
A failed hold above support would weaken the setup.
Actionable but governed by invalidation levels.
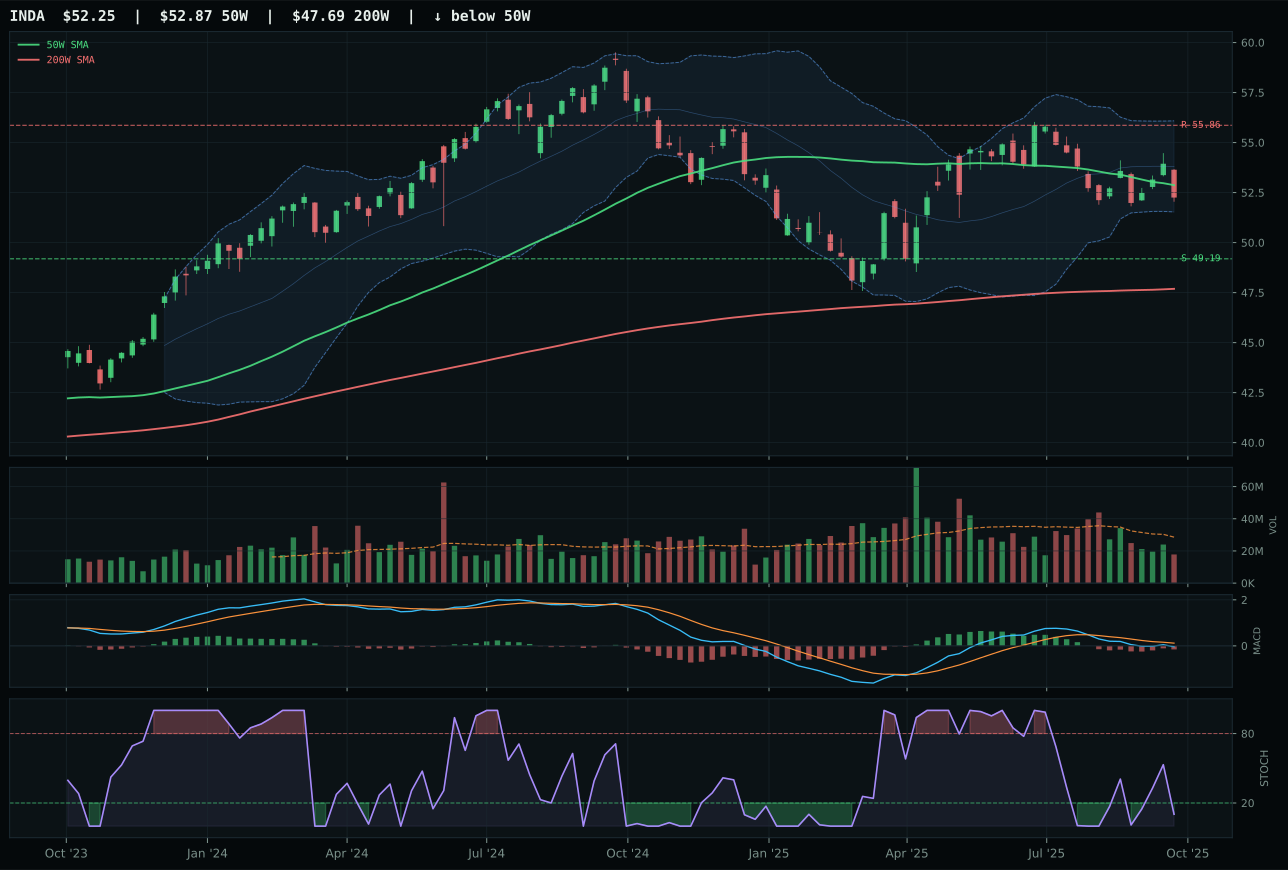
INDA has a compression near 50W profile with -14.1% 13-week relative strength versus SPY.
A failed hold above support would weaken the setup.
Actionable but governed by invalidation levels.
ILF wins narrowly by 10.4 points over IEMG because of superior category-relative strength and better risk-reward geometry. ILF's 11.1% 13W return and 3.5% RS versus SPY pale versus IEMG's 9.1% and 1.5%, yet ILF's 2.0% category-relative strength proves it is outperforming its peer set—a signal that the Latin American commodity and value beta story is being accumulated more aggressively than broad EM. IEMG possesses superior technical evidence at 89.0/100 with neutral structure and rising mid-zone stochastic RSI, yet its risk-reward of 37.5/100 versus ILF's 42.2/100 and weaker category-relative strength (0.0% vs 2.0%) indicate the move, while clean, lacks internal sponsorship from specialist allocators. ILF's extended setup (16.9% above 50W) is offset by the fact that fresh money is choosing commodity-linked EM over broad beta.
Emerging Markets earns 5% allocation as tier-2, with a final score of 62.5 that reflects strong macro tailwinds but technical limitations. Category macro fit of 62.0/100 is supported by em liquidity support (+14), risk appetite positive (+8), offset by credit stress (-10). The active em liquidity support descriptor signals central-bank support and cross-border flow support for EM assets, creating a favorable regime for ILF's Latin American commodity play. ILF's technical evidence of 70.8/100 lags IEMG's 89.0/100, yet the position holds because macro sponsorship is real and ILF's commodity-linkage (commodity breadth positive +8, metals scarcity +5) aligns with portfolio themes. The 16.9% extension from the 50W and 37.0% timing score limit conviction; risk-reward of 42.2/100 offers modest cushion. For Emerging Markets to rise to top-2, either IEMG would need to outperform ILF (reversing relative strength), or macro tailwinds for commodity-linked EM would need to strengthen further, pulling ILF into a cleaner technical setup with MACD re-acceleration.
Traditional Energy — XLE
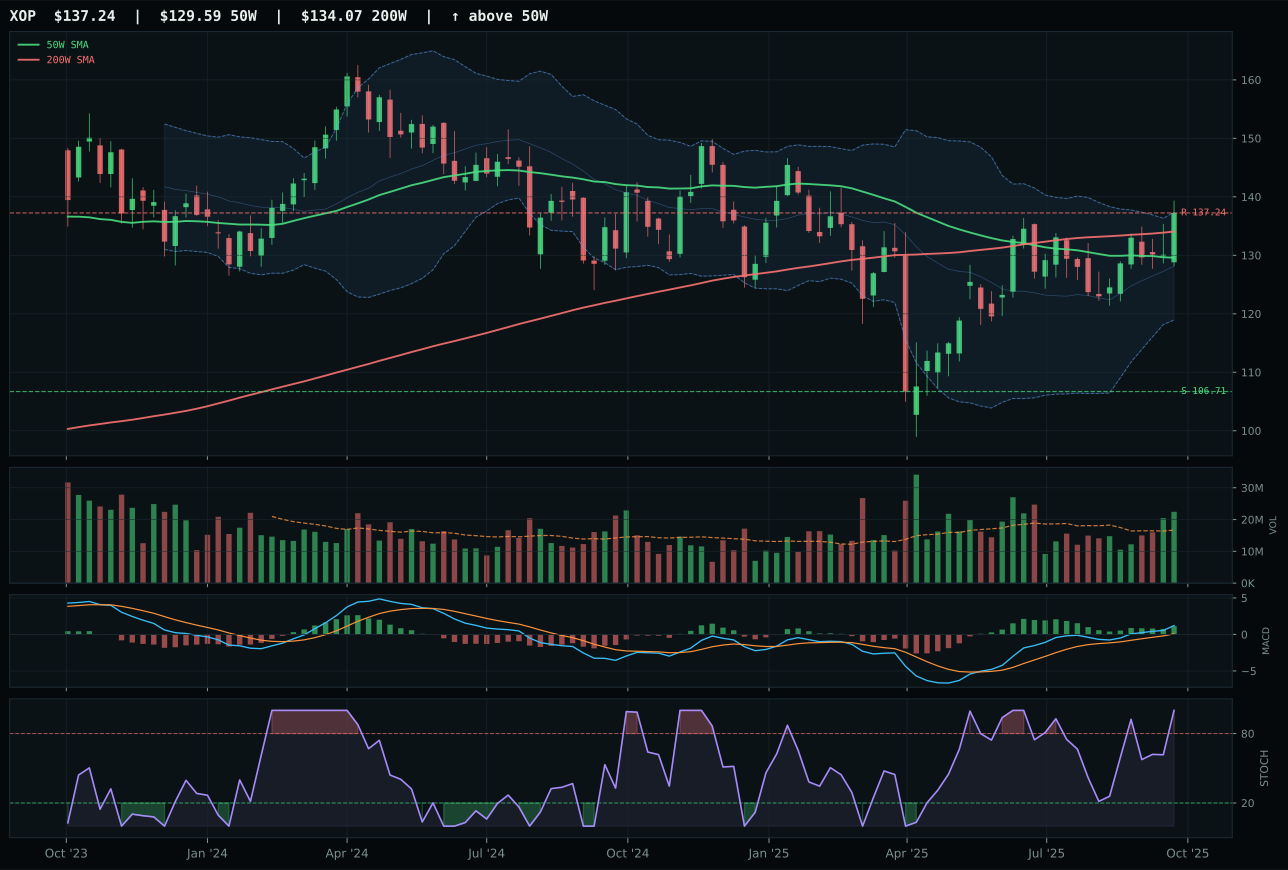
XOP has a neutral structure profile with 0.3% 13-week relative strength versus SPY.
A failed hold above support would weaken the setup.
Actionable but governed by invalidation levels.
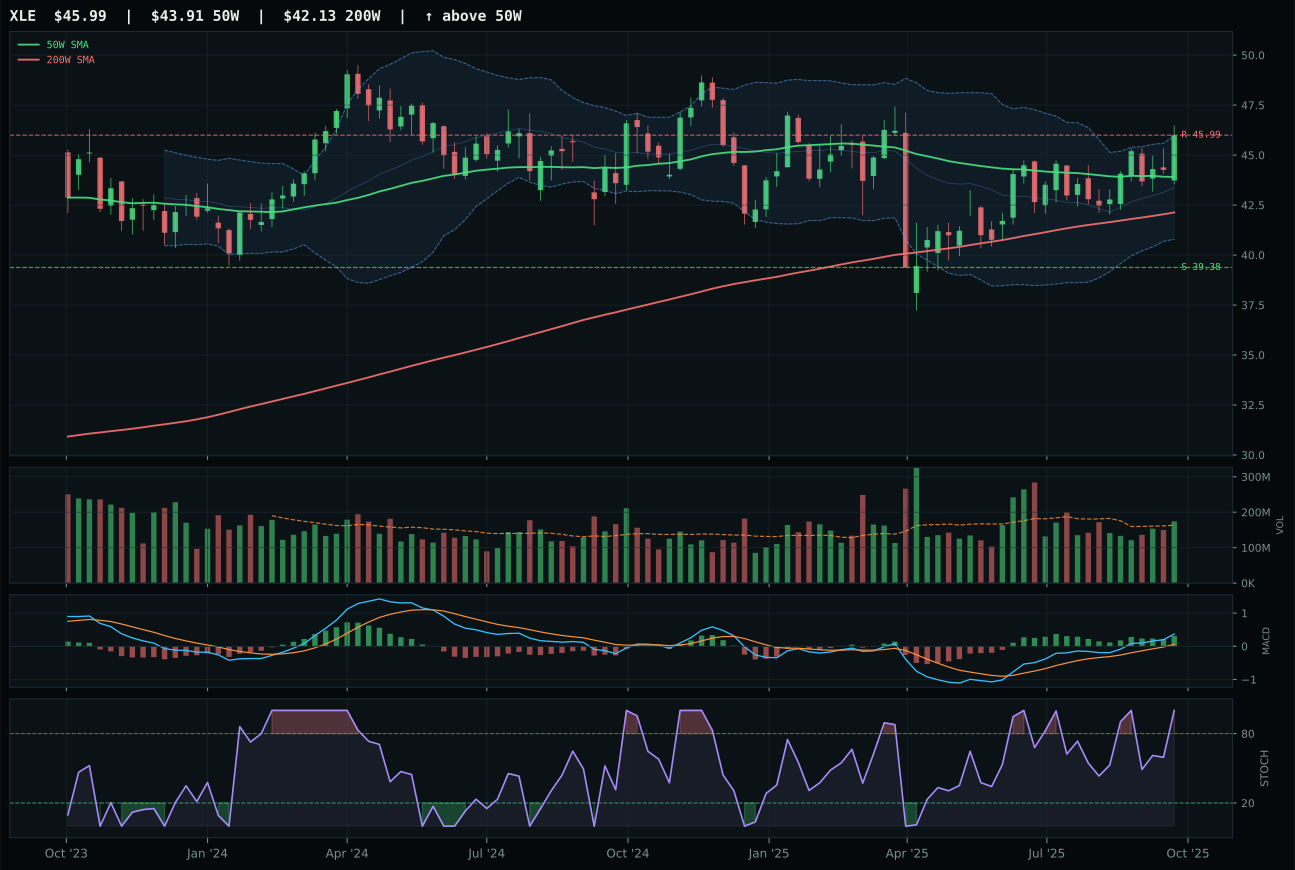
XLE has a neutral structure profile with 0.2% 13-week relative strength versus SPY.
A failed hold above support would weaken the setup.
Actionable but governed by invalidation levels.
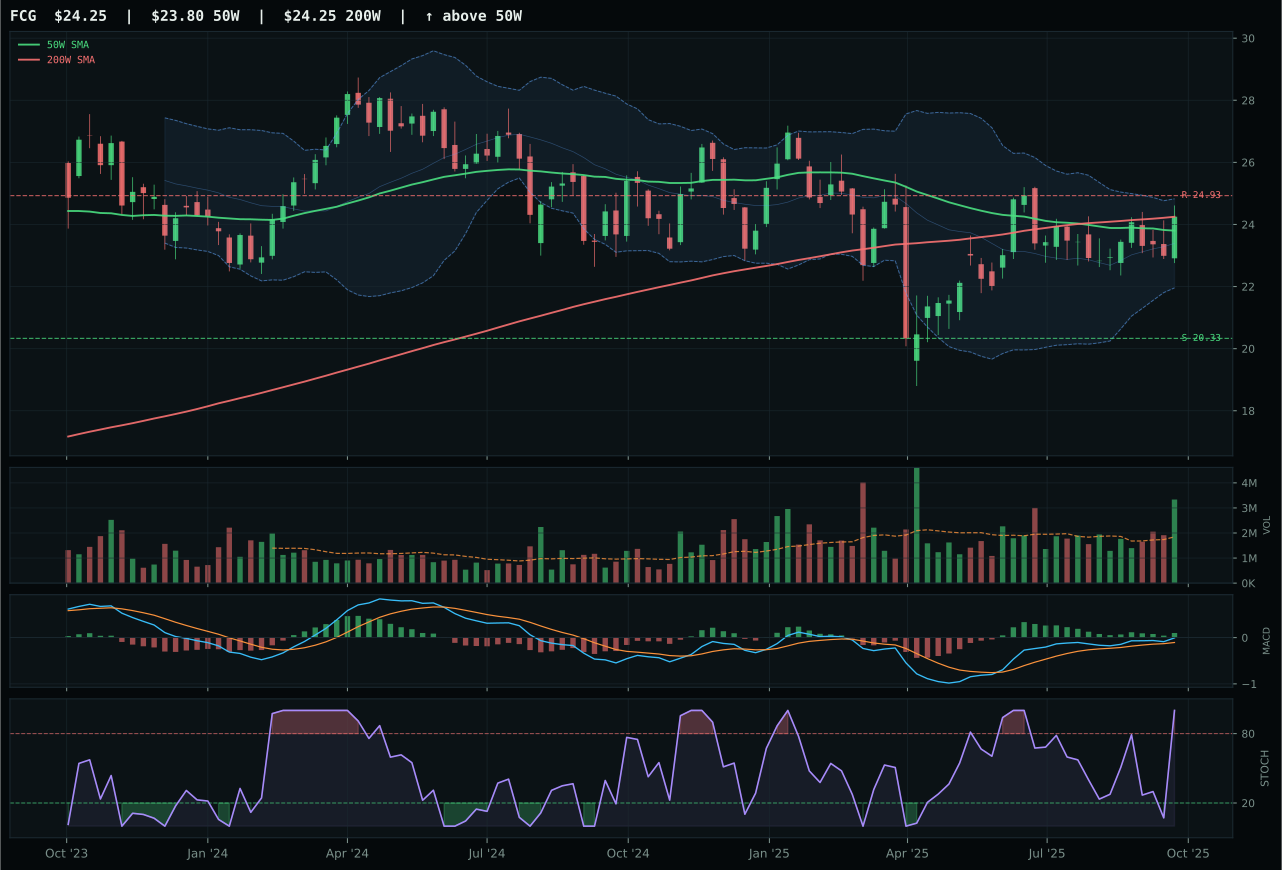
FCG has a compression near 50W profile with -4.0% 13-week relative strength versus SPY.
A failed hold above support would weaken the setup.
Actionable but governed by invalidation levels.
XLE wins because its timing score of 90.0/100 surpasses XOP's 75.0/100 by exploiting a subtle but critical technical advantage: XLE sits only 4.8% above the 50W with MACD bullish and improving and stochastic RSI overbought momentum—a profile that suggests the move is just beginning to attract institutional participation, not late-cycle. XOP, despite superior technical evidence at 81.3/100, sits further extended with timing collapsing because stochastic RSI overbought and Fib zone near 52W high imply the move is mature. Both offer 13W returns near 7.8-7.9%, RS versus SPY near flat to 0.3%, and neutral to above-average volume. The difference is timing signal: XLE's risk-reward of 53.6/100 versus XOP's 50.0/100 reflects XLE's better entry geometry—buyers can accumulate with less extension risk.
Traditional Energy receives 5% allocation as tier-2, a modest position reflecting the 60.9 final score and a macro environment where real asset sponsorship (+7) is offset by active credit stress (-7). The category macro fit of 50.0/100 is neutral; neither the Transition/Mixed regime nor the active descriptor set provides tailwind for energy equity exposure. XLE's technical evidence of 76.7/100 and timing score of 90.0/100 keep the category in the portfolio, but the lack of macro sponsorship and the zero RS versus SPY prevent promotion to top-2. Energy retains a slot because commodity breadth positive is active and some defensive income support may attract flows during regime uncertainty, but capital allocation here is defensive—participation in real-asset moves without conviction about upstream supply narratives. Improvement would require either MACD to accelerate further into the move or a shift in credit-stress macro descriptor from active to inactive, signaling a return to risk-on growth demand.
Nuclear Energy — URA
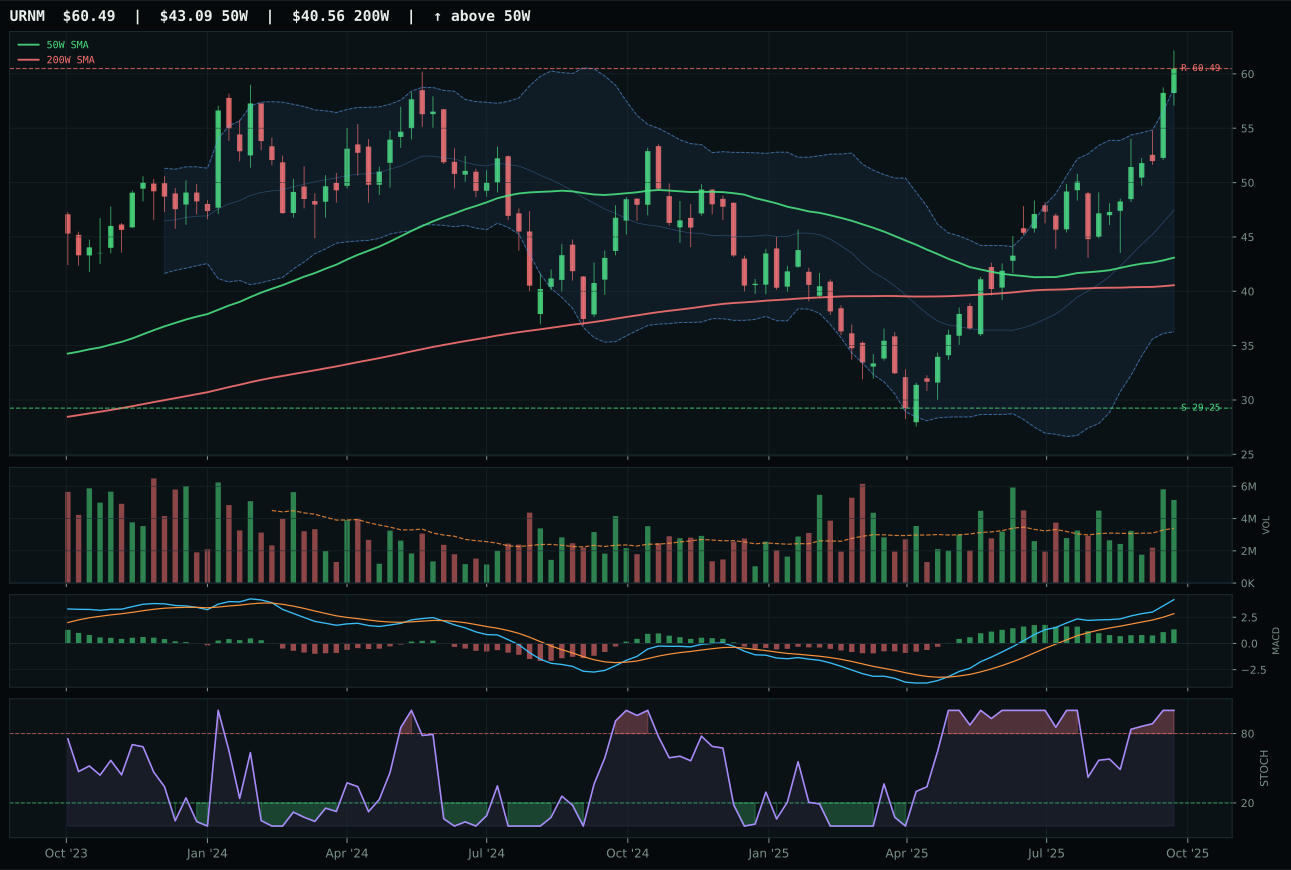
URNM has a vertical extension profile with 20.8% 13-week relative strength versus SPY.
A failed hold above support would weaken the setup.
Actionable but governed by invalidation levels.
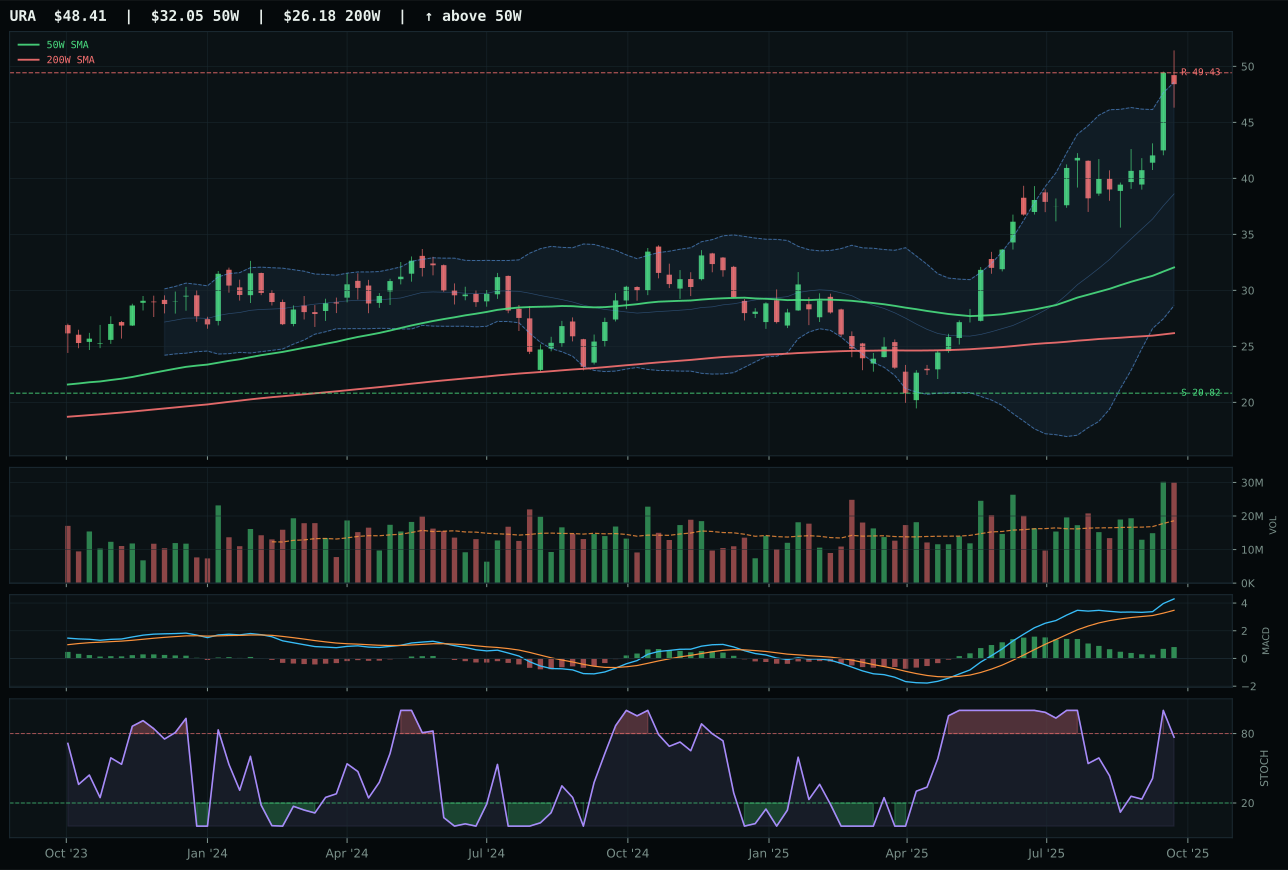
URA has a vertical extension profile with 19.5% 13-week relative strength versus SPY.
A failed hold above support would weaken the setup.
Actionable but governed by invalidation levels.
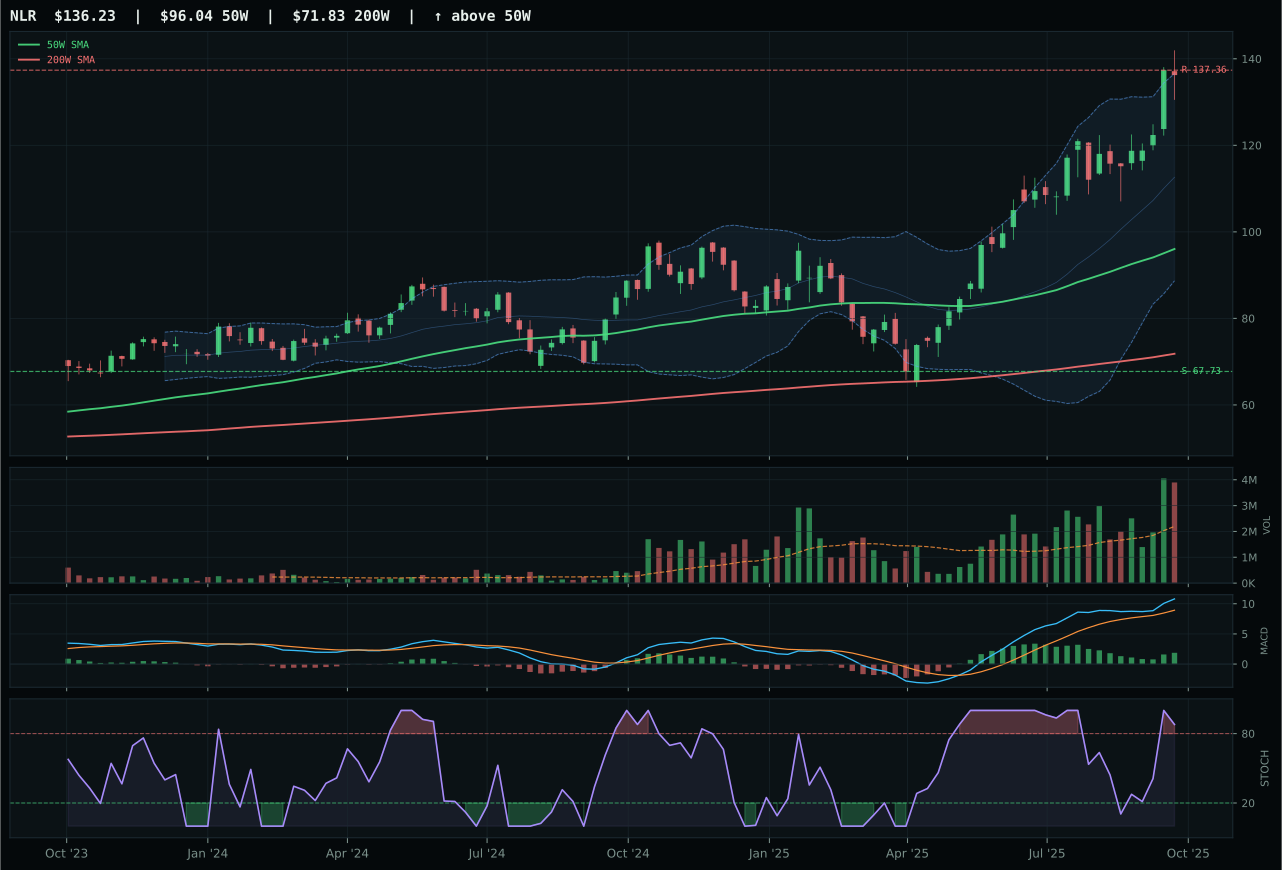
NLR has a vertical extension profile with 16.9% 13-week relative strength versus SPY.
A failed hold above support would weaken the setup.
Actionable but governed by invalidation levels.
URA wins because its timing score of 53.0/100 vastly exceeds URNM's 37.0/100, despite URNM's superior technical evidence at 92.9/100. The separation comes from stochastic RSI profile: URA sits at rising mid-zone (0.77) while URNM is overbought momentum (1.00). At 51.0% above the 50W, URA is severely extended, yet the timing advantage signals fresh retail and longer-term institutional demand is still entering—the rising mid-zone RSI proves the move is not yet exhausted in terms of momentum phase. URNM's 28.4% 13W return and 20.8% RS versus SPY dwarf URA's 27.2% and 19.5%, but URNM's overbought momentum and 37.0% timing score indicate the move is mature and vulnerable to fast retracement. Risk-reward is poor for both, but URA's timing signal offers better odds of near-term persistence.
Nuclear Energy holds 5% allocation as tier-2, justified by the 56.5 final score despite a category macro fit of 57.0/100 where macro support is thin. Real asset sponsorship (+7) and AI growth sponsorship (+5) are offset by credit stress (-5), leaving the category in neutral macro territory. URA's technical leadership is marginal—the 48.1/100 evidence score reflects a setup that is extended and distribution-pressured (1.61x volume at distribution levels, not accumulation). The category earns allocation primarily through momentum confirmation of 100/100 and the relative attractiveness of nuclear as a thematic real-asset play in an uncertain regime. However, the 51.0% extension from the 50W and risk-reward of only 29.3/100 make this a tactical holding vulnerable to fast unwinds. For Nuclear to advance to top-2 or justify increased allocation, URNM's MACD would need to re-accelerate and volume would need to shift from distribution pressure to clean accumulation, signaling that the supply-scarcity narrative is attracting fresh institutional capital rather than late retail chase.
Utilities & Infrastructure — XLU
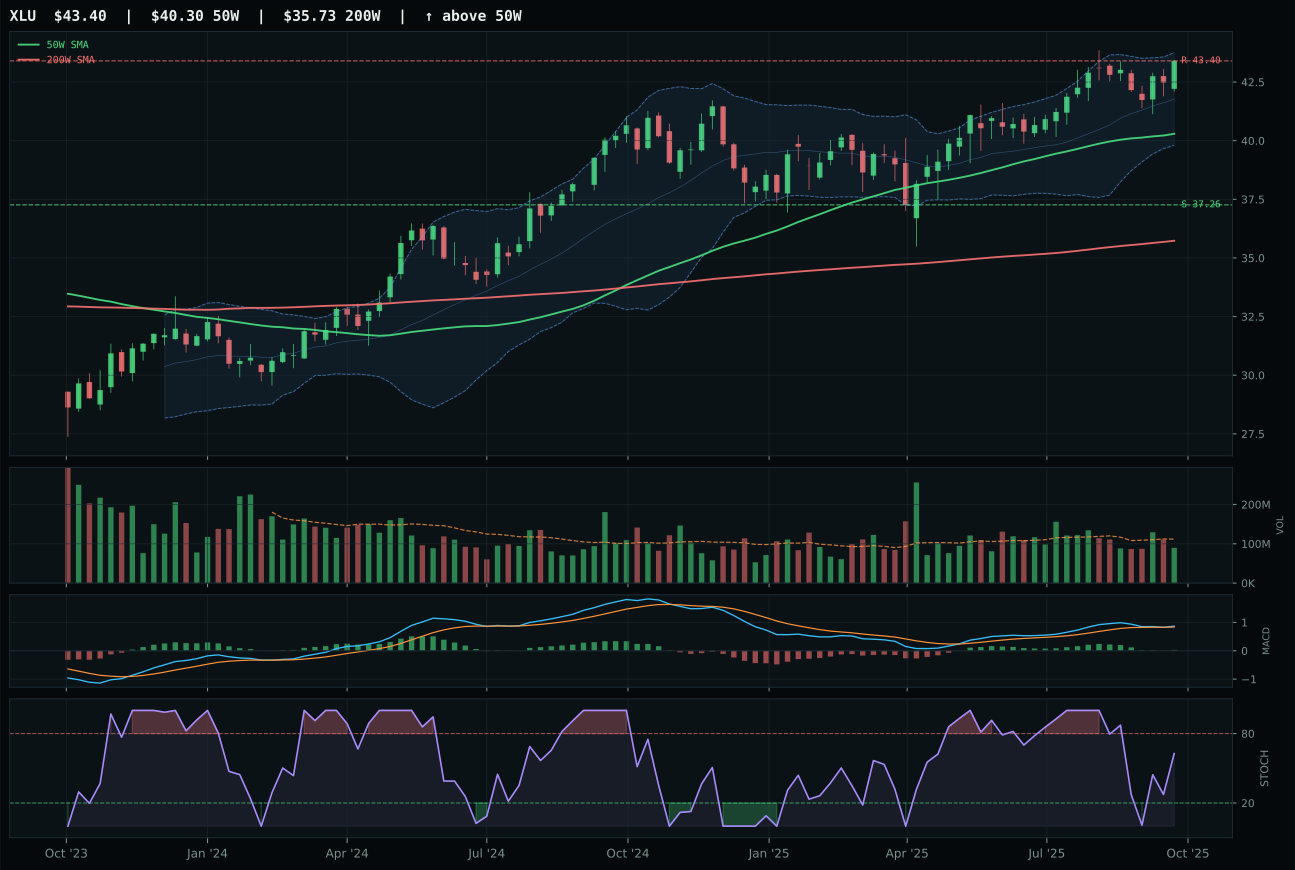
XLU has a neutral structure profile with -0.9% 13-week relative strength versus SPY.
A failed hold above support would weaken the setup.
Actionable but governed by invalidation levels.
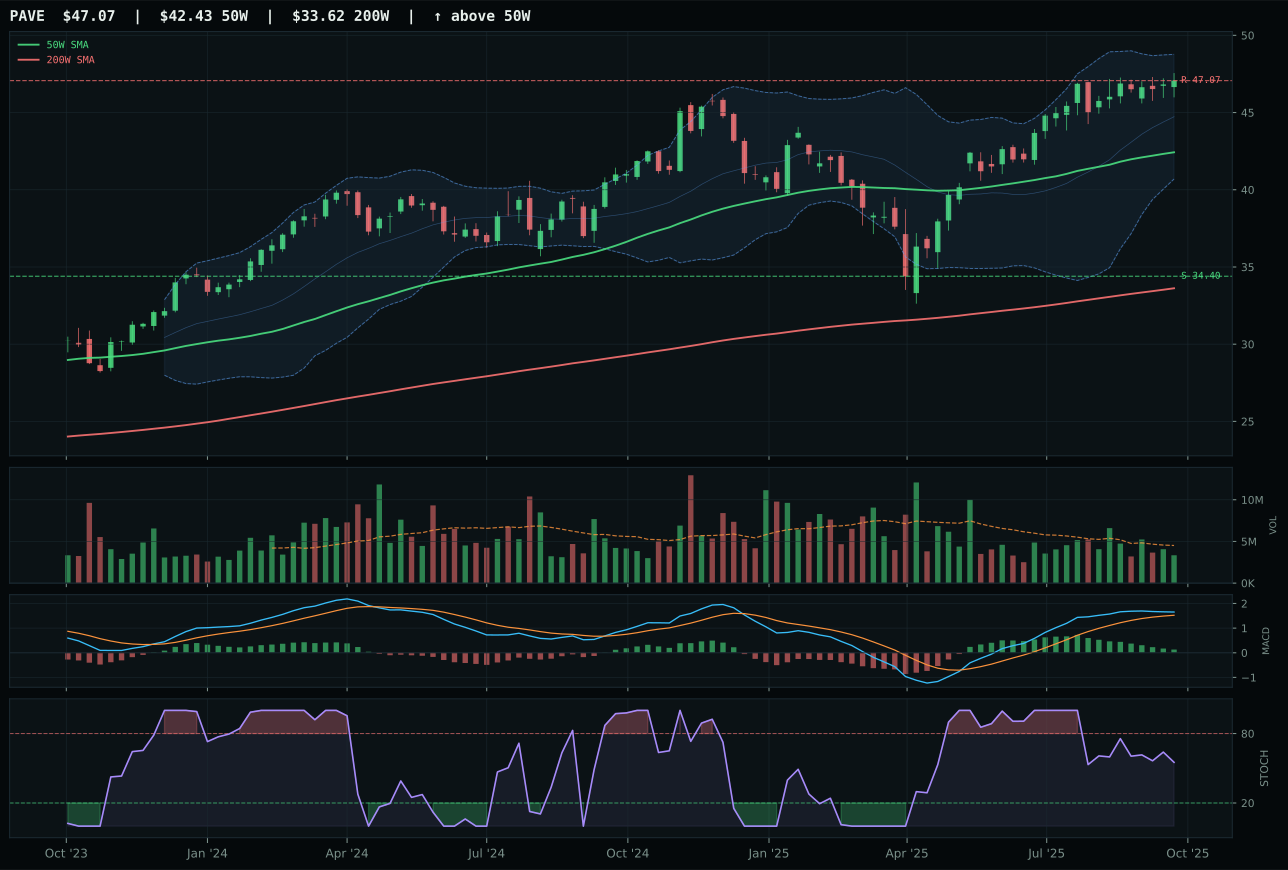
PAVE has a neutral structure profile with 0.1% 13-week relative strength versus SPY.
A failed hold above support would weaken the setup.
Actionable but governed by invalidation levels.
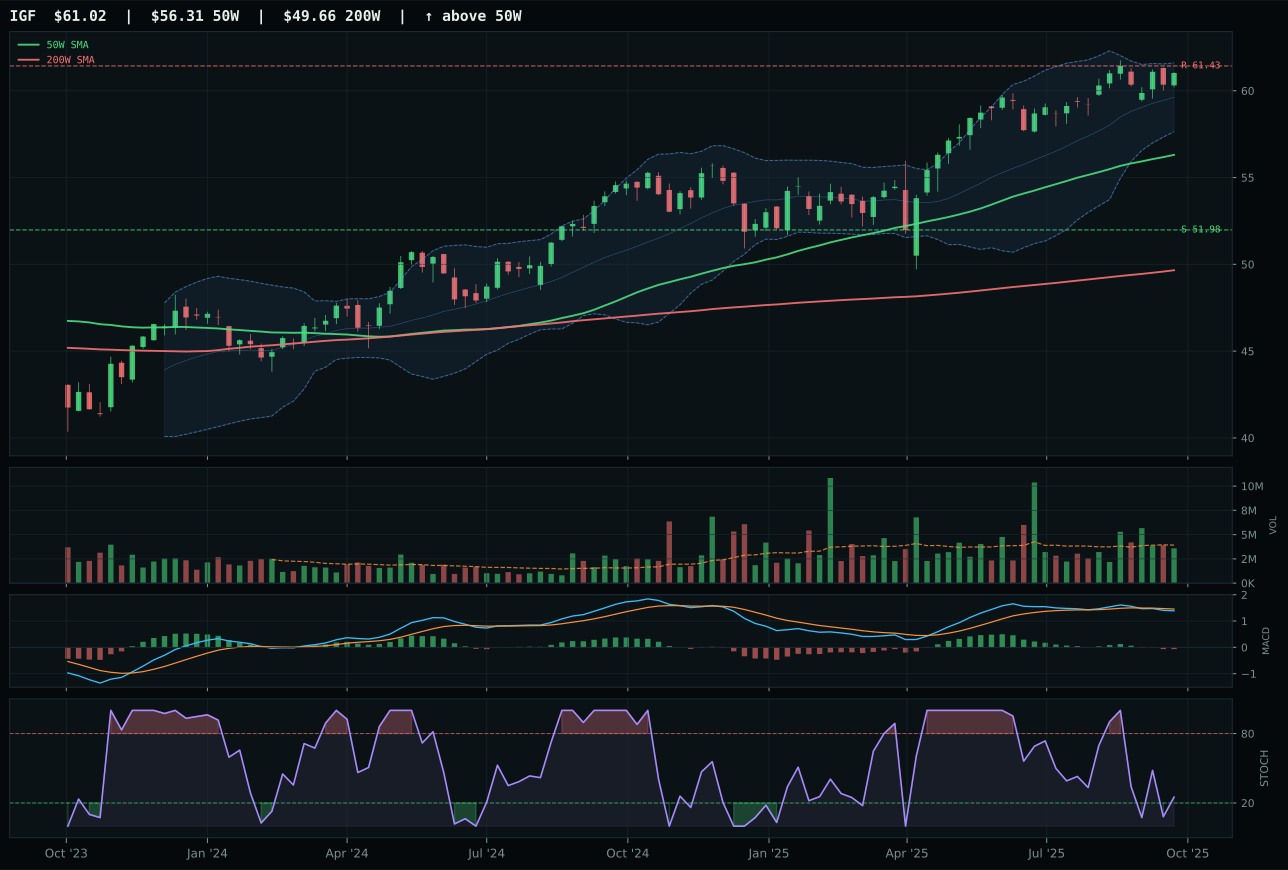
IGF has a neutral structure profile with -3.7% 13-week relative strength versus SPY.
A failed hold above support would weaken the setup.
Actionable but governed by invalidation levels.
XLU wins because its timing score of 78.0/100 substantially exceeds PAVE's 62.0/100, driven by superior stochastic RSI profile and MACD stability. XLU sits 7.7% above the 50W with stochastic RSI rising mid-zone at 0.63 and MACD bullish but flattening—a setup that signals early institutional accumulation into a regulated-utility narrative. PAVE, at a similar distance from moving averages, suffers stochastic RSI falling/neutral and thin volume participation, indicating late-cycle momentum without fresh sponsorship. Both offer defensive 13W returns near 6.7-7.8% and flat RS versus SPY, yet XLU's 45.7/100 risk-reward and structure cleanliness of 78.2/100 versus PAVE's 40.9% and 77.9% show that XLU's entry is fresher and better-positioned. Volume is neutral for XLU versus thin for PAVE—a distinction that matters when seeking institutional backing for a defensive position.
Utilities & Infrastructure receives 5% allocation as tier-2, reflecting the 55.3 final score in a regime where macro support is minimal. Category macro fit of 52.0/100 benefits modestly from the Transition/Mixed state (+4) but is penalized by risk appetite positive (-2)—a descriptor profile that indicates utilities are being considered defensive plays rather than growth engines. XLU's technical evidence of 72.4/100 is solid but not exceptional, and macro/narrative fit of only 47.0/100 shows weak category-specific sponsorship. The position holds because defensive sectors retain structural appeal during regime transitions, and XLU's near-term timing signal of 78.0/100 suggests fresh relative strength into the category. However, the modest 6.7% 13W return, -0.9% RS versus SPY, and neutral momentum confirmation of 66.9/100 confirm this is a tactical holding for stability rather than a conviction growth driver. Utilities would advance to higher allocation only if credit stress shifted from active to dormant (reducing flight-to-safety demand for alternatives) or if growth narratives re-stabilized (lowering relative appeal of defensive yield).
Defense & Aerospace — XAR
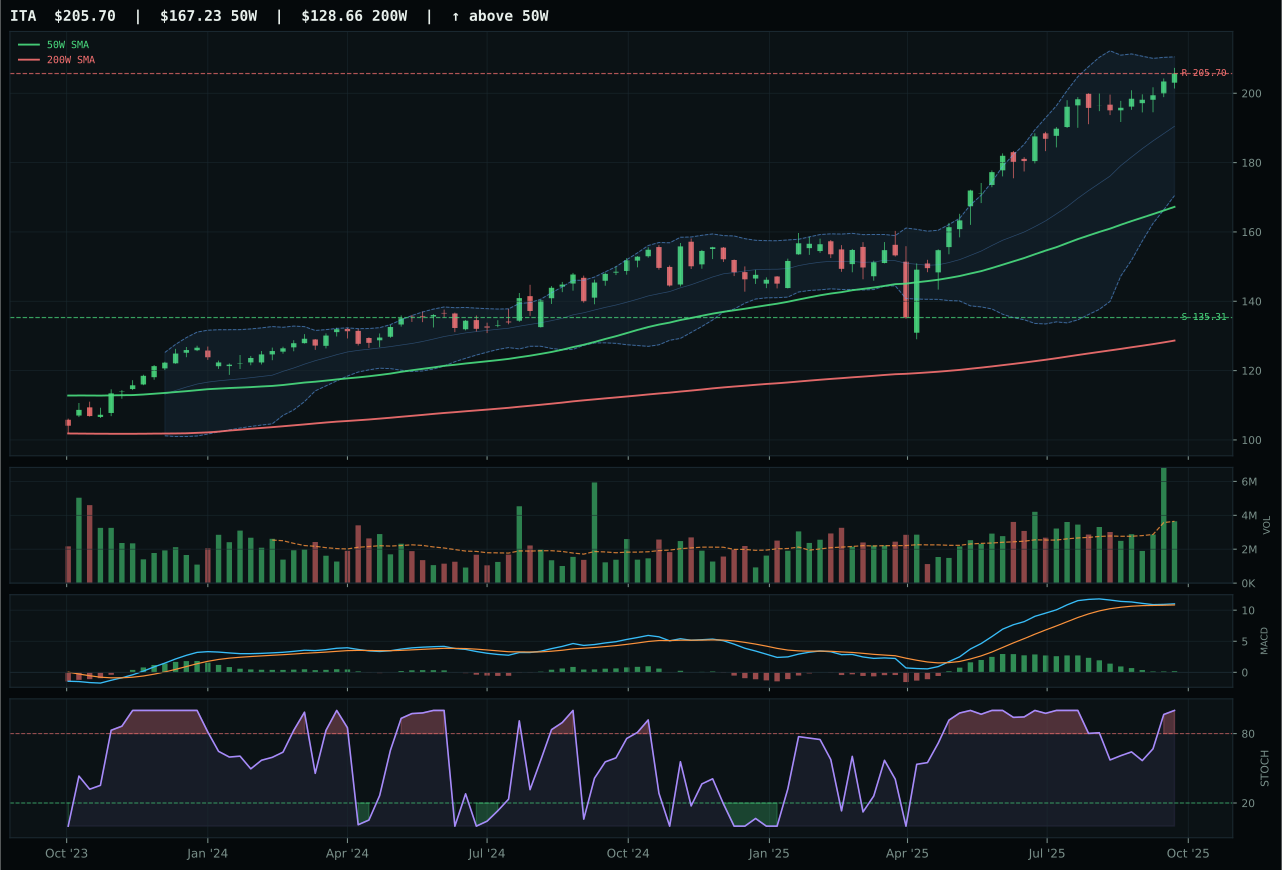
ITA has a vertical extension profile with 2.0% 13-week relative strength versus SPY.
A failed hold above support would weaken the setup.
Actionable but governed by invalidation levels.
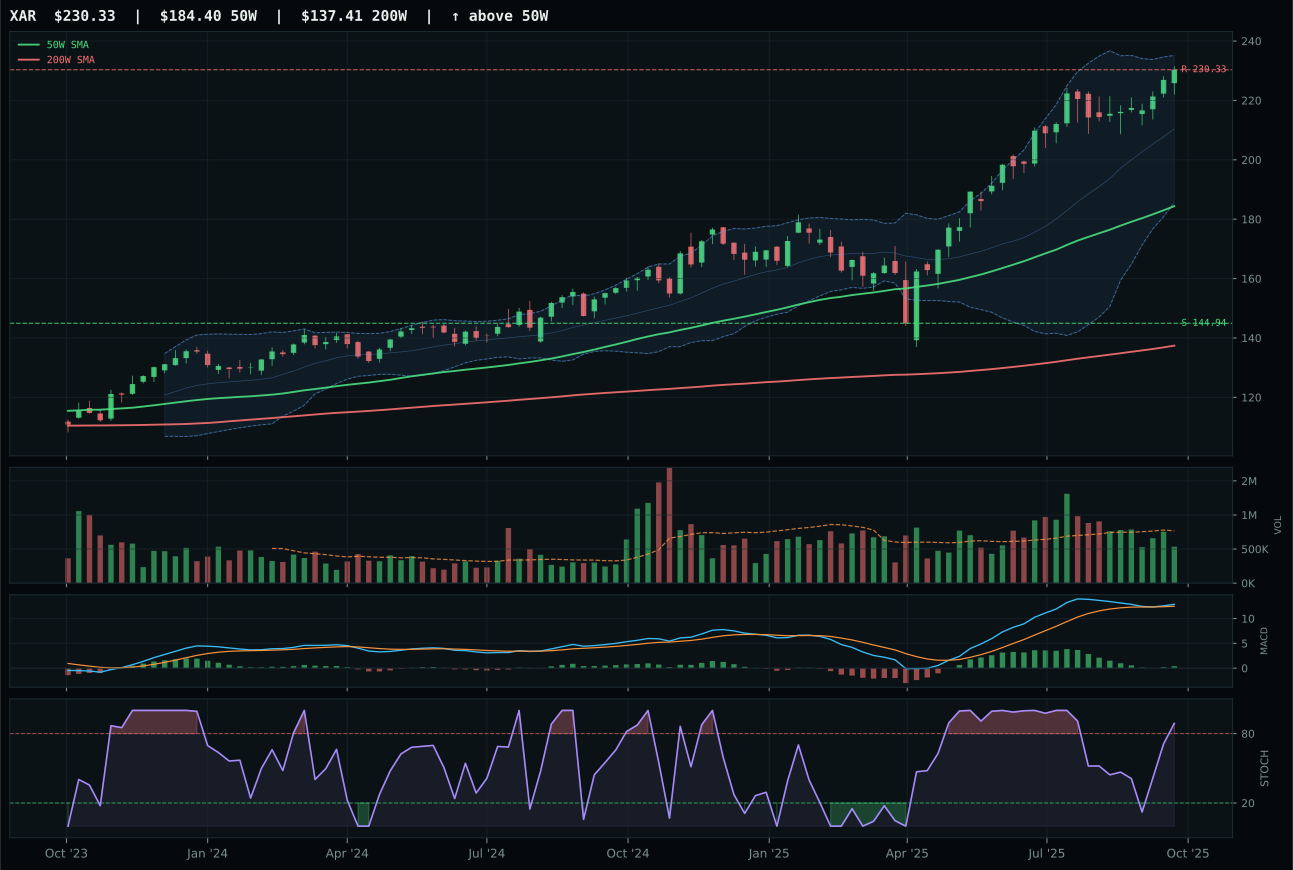
XAR has a vertical extension profile with 2.2% 13-week relative strength versus SPY.
A failed hold above support would weaken the setup.
Actionable but governed by invalidation levels.
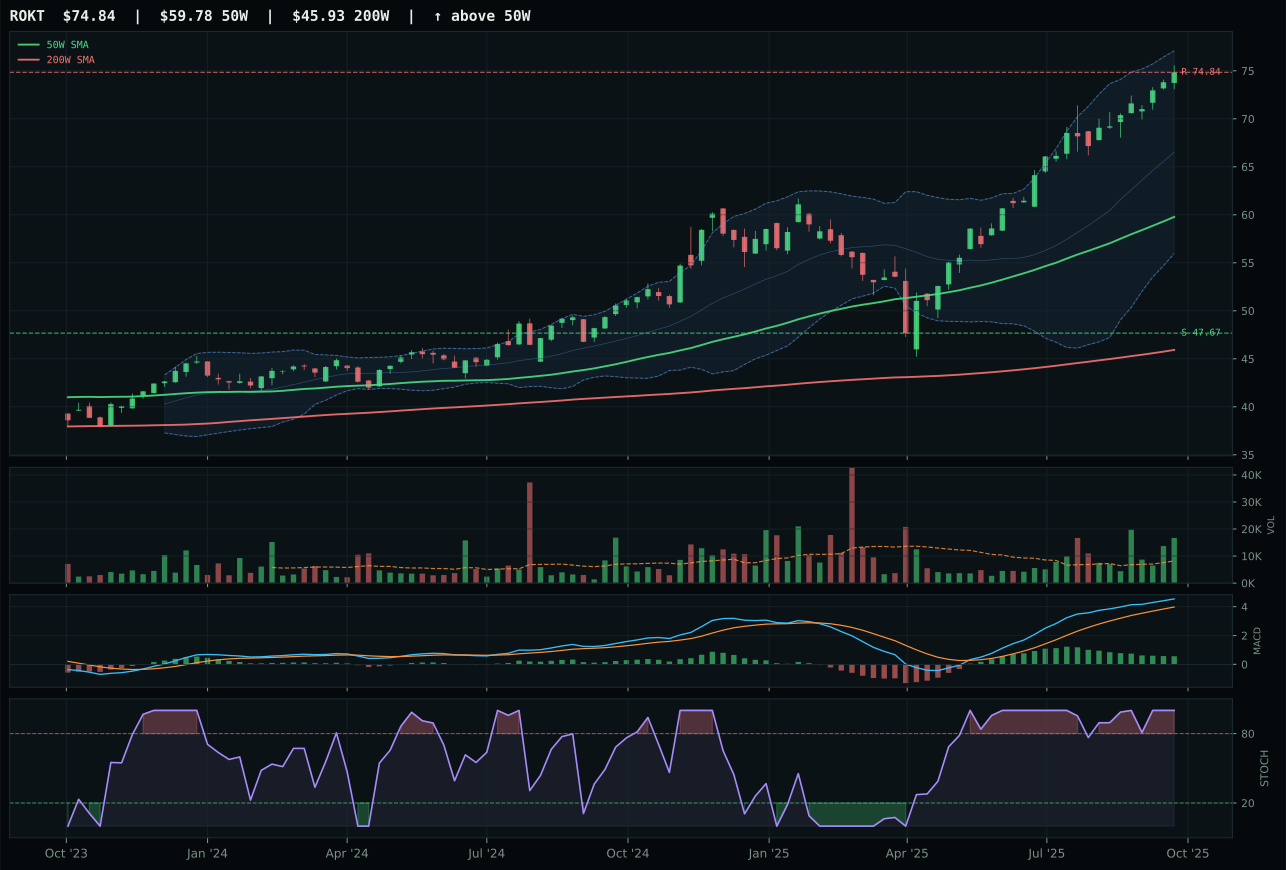
ROKT has a vertical extension profile with 9.1% 13-week relative strength versus SPY.
A failed hold above support would weaken the setup.
Tracked, but not top-2 eligible because: .
XAR wins by default in a category where no ETF possesses a clean technical setup. Price is above the 50W and 200W with positive 50W slope of 0.8%, yet the chart is extended 24.9% from the 50W with MACD bullish but flattening and stochastic RSI overbought at 0.89—a profile that suggests early-stage distribution. XAR's advantage over ITA is marginal (0.6 points); both sit in vertical extension with thin liquidity and deteriorating MACD confirmation. The 9.8% 13W return and 2.2% RS versus SPY are respectable but insufficient to overcome the timing penalty of 32.0/100 and risk-reward of 39.4/100, where upside to resistance is essentially zero and the setup requires near-perfect execution to avoid 58.9% downside retracement.
Defense & Aerospace receives 0% allocation this week, ranked 9th or 10th among the 10 categories. The 51.4 final score reflects a category macro fit of 55.0/100 where no category-specific descriptor tailwind exists; the Transition/Mixed regime offers modest support (+3) and credit stress provides a minor offset (+2), but neither justifies capital deployment into a technical setup where entry risk exceeds opportunity. XAR's thin volume at 0.70x the 20W average and flattening MACD create a liquidity trap: the move looks clean until you try to exit at size. Precious Metals, Industrial Metals, and Technology all offer superior risk-adjusted entries with stronger macro sponsorship. For Defense & Aerospace to earn allocation, XAR's timing would need to improve—specifically, MACD would need to re-accelerate and the 50W slope would need to steepen—signaling fresh institutional sponsorship rather than late-cycle capitulation.
Agriculture & Livestock — MOO
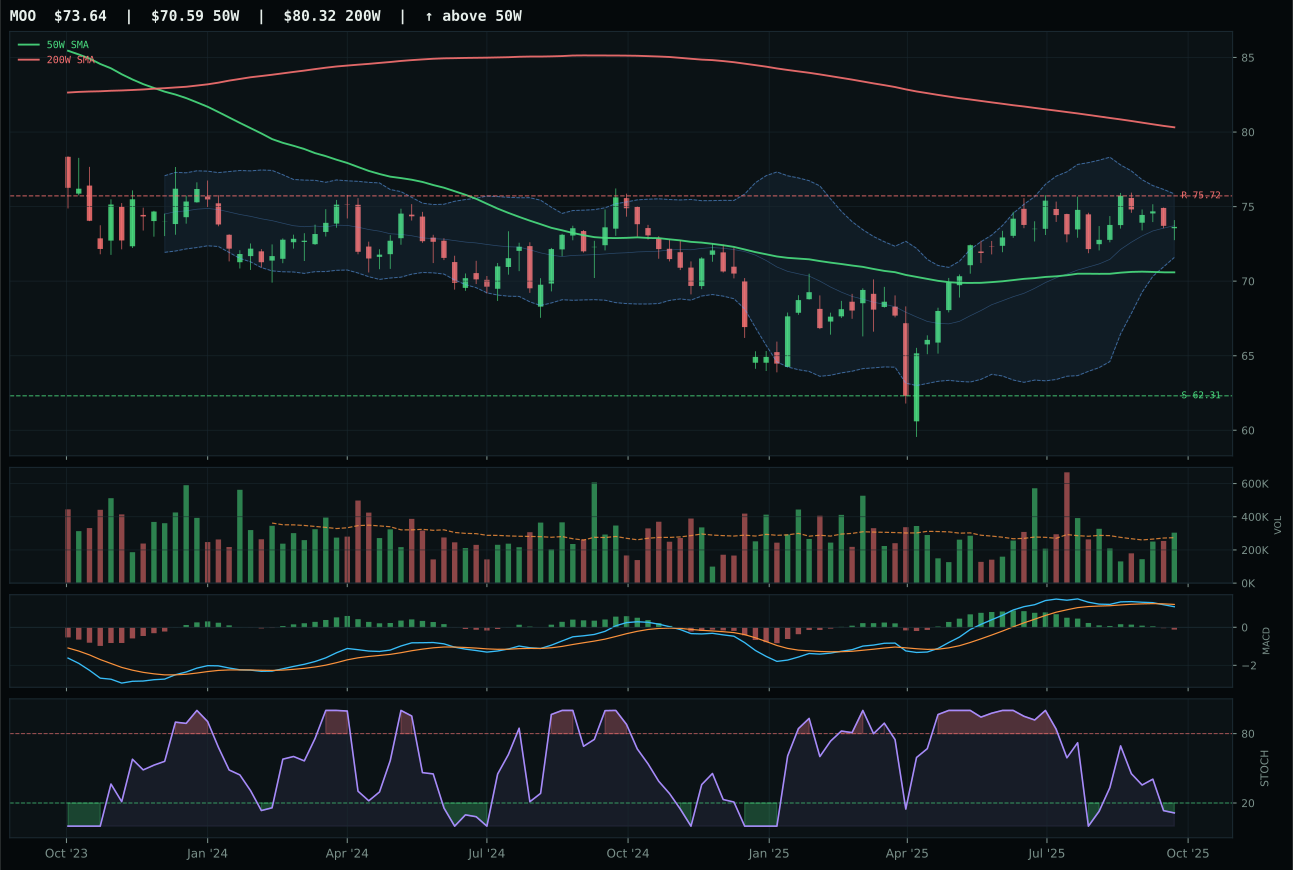
MOO has a neutral structure profile with -7.5% 13-week relative strength versus SPY.
A failed hold above support would weaken the setup.
Actionable but governed by invalidation levels.
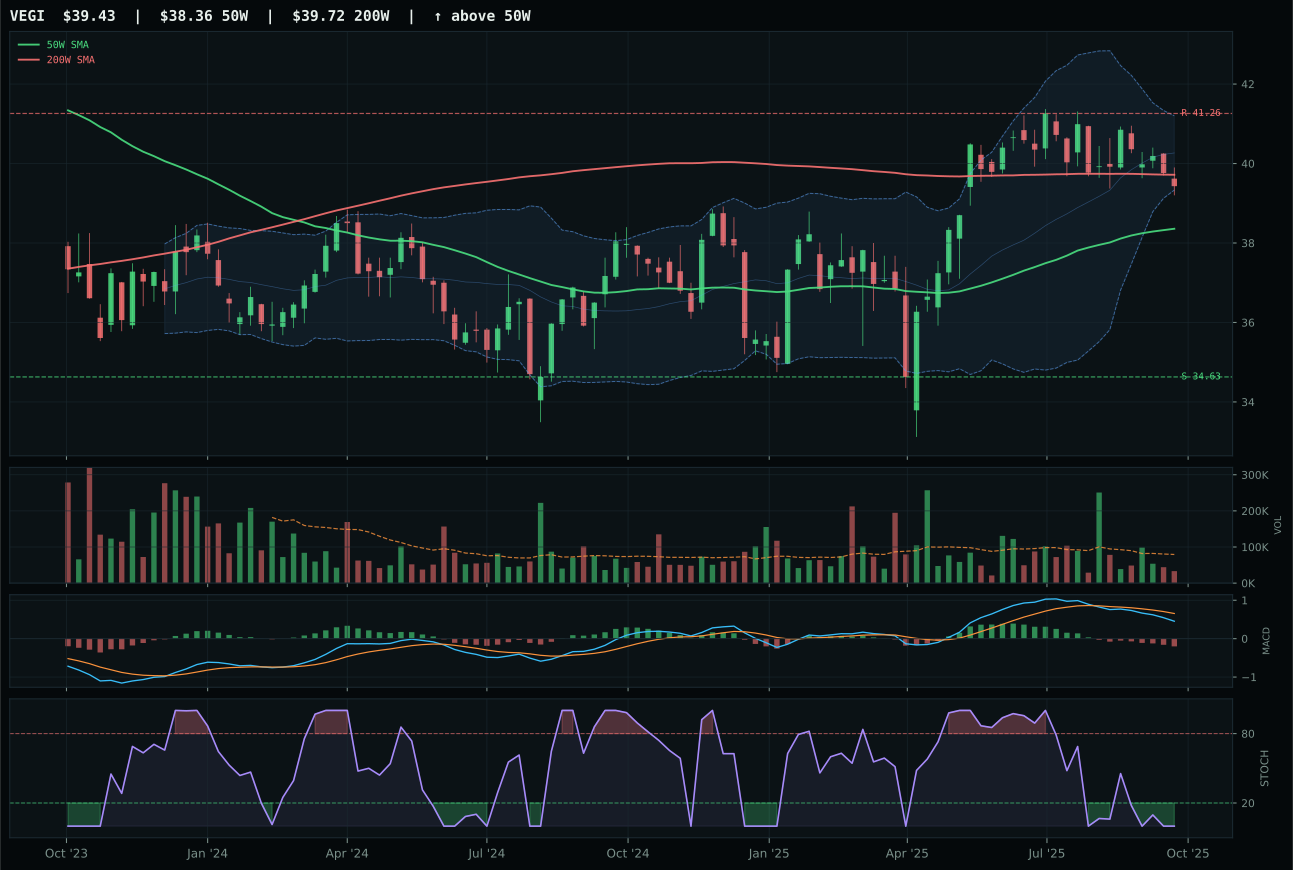
VEGI has a compression near 50W profile with -9.9% 13-week relative strength versus SPY.
A failed hold above support would weaken the setup.
Tracked, but not top-2 eligible because: .
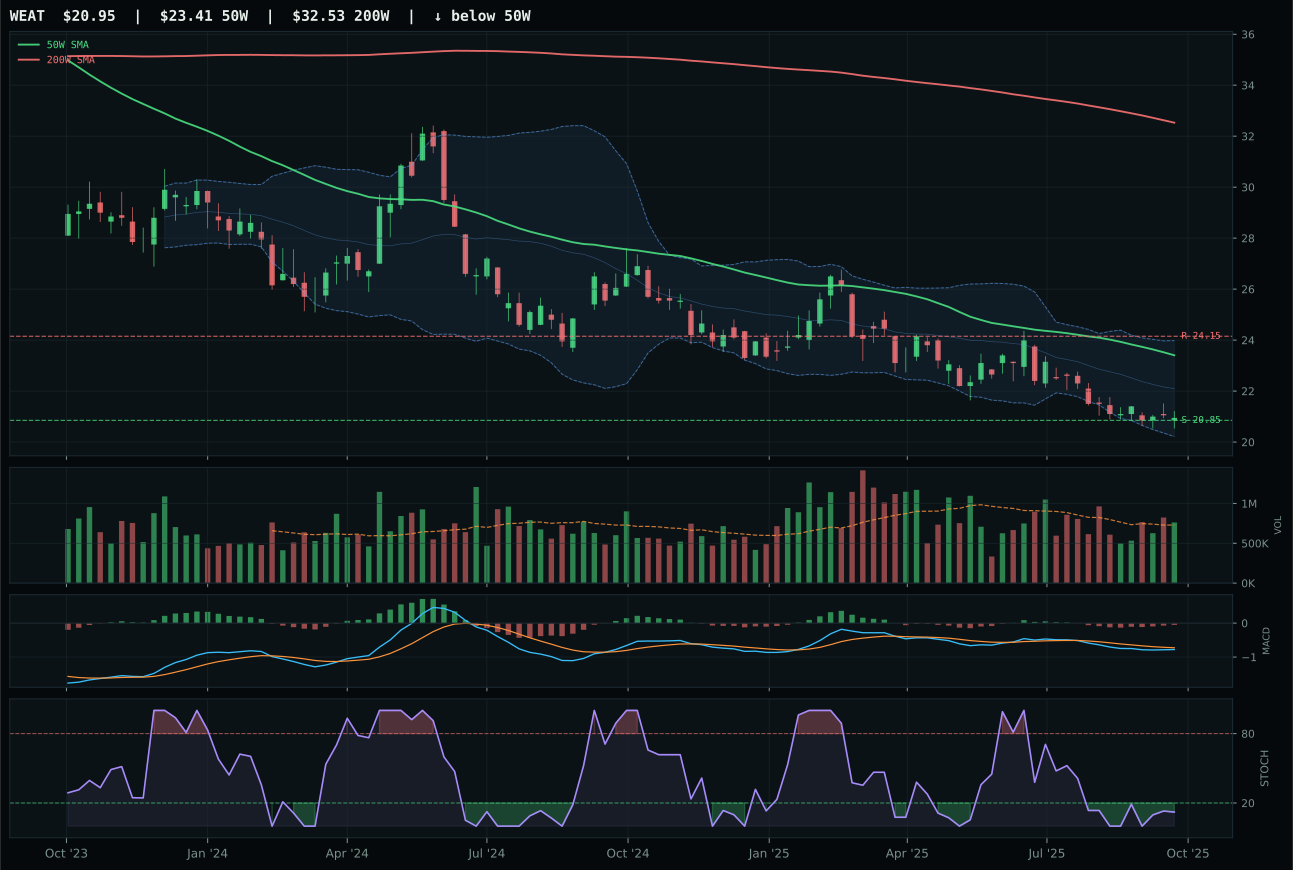
WEAT has a pullback into support profile with -14.1% 13-week relative strength versus SPY.
Extension and support failure are the main tactical risks.
Tracked, but not top-2 eligible because: structurally broken.
MOO wins in a category where all three ETFs are in structural breakdown: price above the 50W but below the 200W, MACD bearish/weakening across the board, and stochastic RSI oversold. MOO's advantage is only that it holds up better than VEGI and WEAT—a 16.3-point gap that reflects MOO's cleaner structure (73.5/100 vs 66.7/100) and above-average volume participation at 1.11x the 20W average, which at least suggests some institutional capitulation buying rather than pure abandonment. The 4.3% proximity to the 50W and timing score of 85.0/100 confirm price is oversold on a near-term basis, but the momentum confirmation of only 28.4/100 and category-relative strength of 2.5% prove the underlying narrative has broken—this is not a leader being accumulated, it is a laggard being marked down.
Agriculture & Livestock receives 0% allocation, ranking 9th or 10th with a final category score of 25.4. The category macro fit of 63.0/100, supported by real asset sponsorship (+8) and commodity breadth positive (+5), cannot overcome the catastrophic technical deterioration: trend score of 40.8/100 reflects price below the 200W and -7.5% RS versus SPY, while momentum confirmation collapses to 28.4/100. The Transition/Mixed macro regime is neutral to negative for agricultural equities when commodity prices themselves lack sponsorship. For MOO to earn even a tier-2 5% allocation slot, the category would need either a sharp reversal in relative strength—price recapturing the 200W with MACD re-accelerating—or a marked shift in commodity macro narrative toward shortage rather than supply glut. Current setup is a bear-market structure with temporary oversold bounce potential, not a conviction position.