
2025-09-19
Informational purposes only. The content in this report, including allocations, analysis, and commentary, is provided solely for informational and educational purposes. It does not constitute financial advice, investment advice, trading advice, or any other type of advice. Past performance does not guarantee future results. Always conduct your own research and consult a qualified financial professional before making investment decisions.
Weekly Allocation
| Ticker | Category | Weight | Role |
|---|---|---|---|
| FBTC | 50% | Overlay | |
| COPX | Industrial Metals | 10% | Top-2 (10%) |
| AIQ | AI | 10% | Top-2 (10%) |
| GLD | Precious Metals | 5% | Tier-2 (5%) |
| URA | Nuclear Energy | 5% | Tier-2 (5%) |
| IGV | Technology | 5% | Tier-2 (5%) |
| XAR | Defense & Aerospace | 5% | Tier-2 (5%) |
| ILF | Emerging Markets | 5% | Tier-2 (5%) |
| PAVE | Utilities & Infrastructure | 5% | Tier-2 (5%) |
Trade Instructions — Monday Open
Sell the tranche from 2025-08-22 (completing its 4-week hold). Buy the new tranche. Instructions show net portfolio changes — same-asset positions cancel, weight changes show the delta.
| Action | Ticker | Instruction |
|---|---|---|
| SELL | URNM | Sell 40% of URNM position (reduce 6.25% → 3.75%) |
| SELL | SMH | Sell entire SMH position (1.25% of portfolio) |
| SELL | IGF | Sell 50% of IGF position (reduce 2.50% → 1.25%) |
| SELL | XLK | Sell 50% of XLK position (reduce 2.50% → 1.25%) |
| SELL | ITA | Sell entire ITA position (1.25% of portfolio) |
| SELL | XLE | Sell 33% of XLE position (reduce 3.75% → 2.50%) |
| BUY | AIQ | Buy AIQ — 28.57% of freed cash (adds 2.50% to portfolio) |
| BUY | XAR | Buy XAR — 14.29% of freed cash (adds 1.25% to portfolio) |
| BUY | PAVE | Buy PAVE — 14.29% of freed cash (adds 1.25% to portfolio) |
| BUY | ILF | Buy ILF — 14.29% of freed cash (adds 1.25% to portfolio) |
| BUY | URA | Buy URA — 14.29% of freed cash (adds 1.25% to portfolio) |
| BUY | IGV | Buy IGV — 14.29% of freed cash (adds 1.25% to portfolio) |
Current Portfolio After Trade
Combined holdings across all 4 active tranches. Each tranche is 25% of the portfolio.
| Ticker | % of Portfolio | Weight Bar |
|---|---|---|
| FBTC | 50.00% | |
| COPX | 7.50% | |
| AIQ | 7.50% | |
| GLD | 5.00% | |
| XAR | 5.00% | |
| PAVE | 3.75% | |
| ILF | 3.75% | |
| URNM | 3.75% | |
| XLE | 2.50% | |
| REMX | 2.50% | |
| CIBR | 2.50% | |
| IGF | 1.25% | |
| XLK | 1.25% | |
| GDX | 1.25% | |
| URA | 1.25% | |
| IGV | 1.25% |
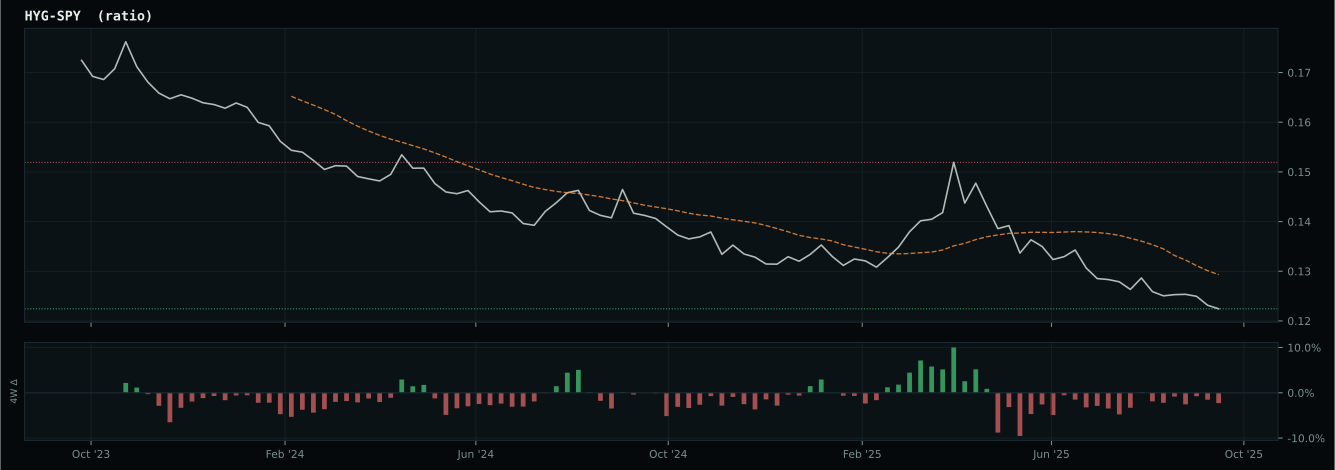
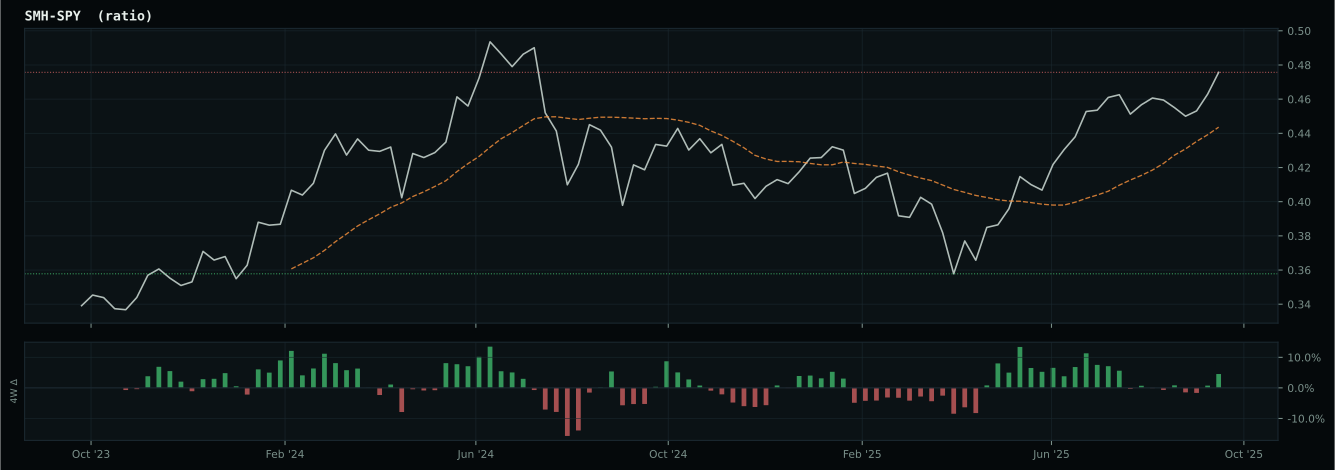
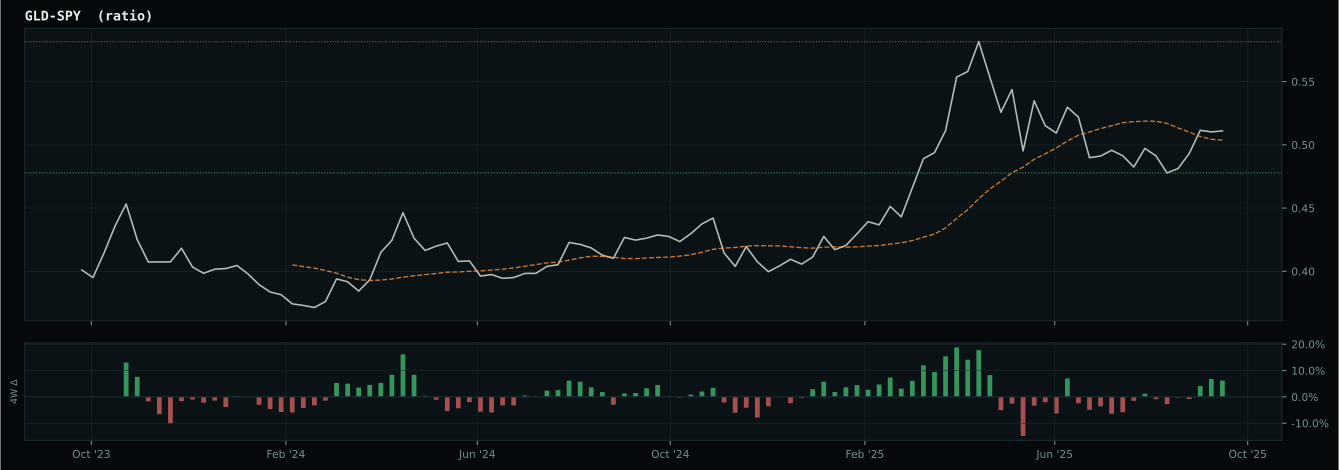
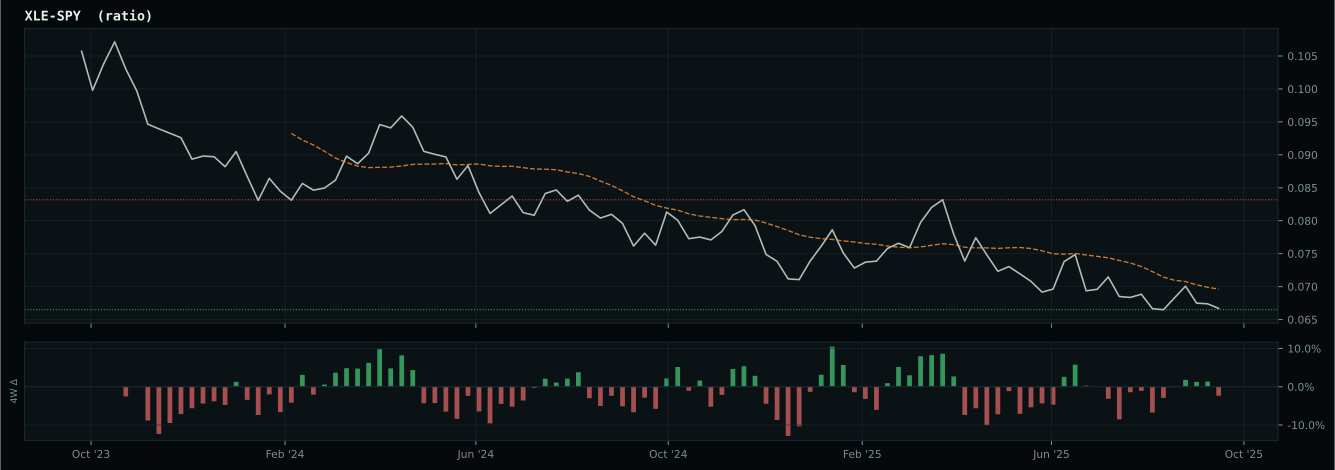
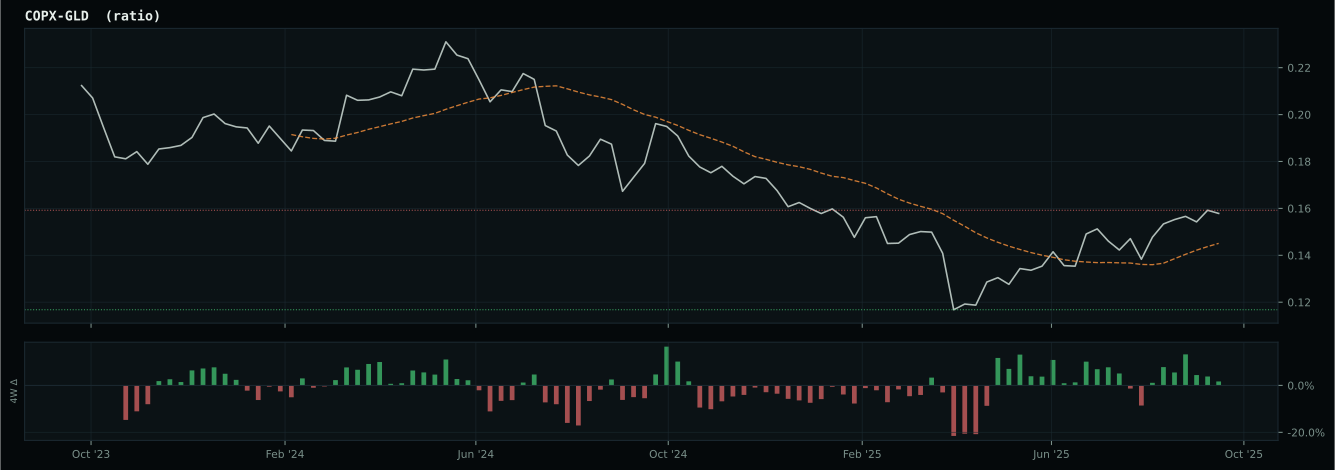
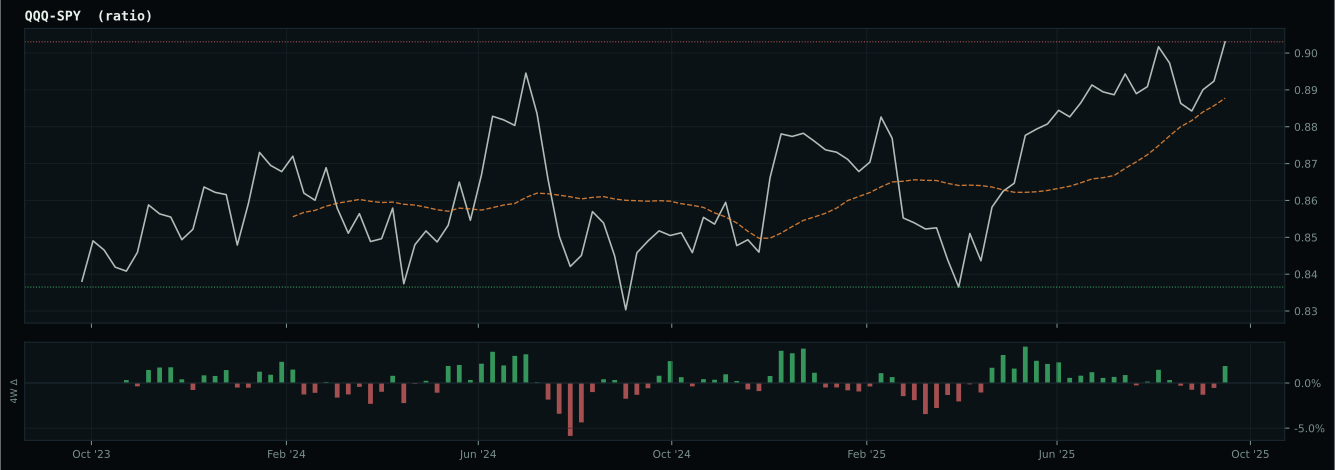
Macro Regime — Disinflation
Macro Evidence Charts
Market-implied signals behind the macro regime scores. Each ratio compares two assets; the direction and slope of the ratio is what the macro engine reads.
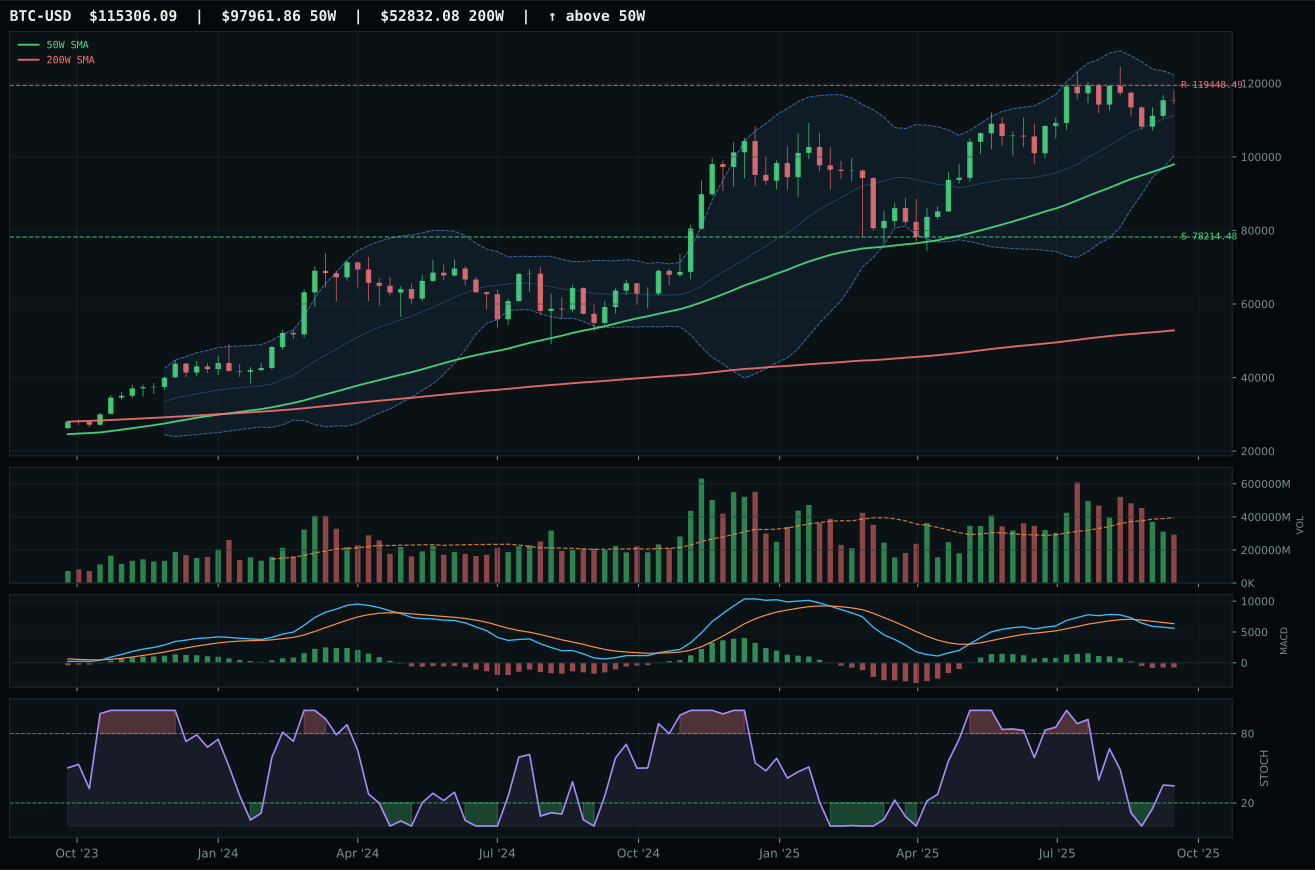
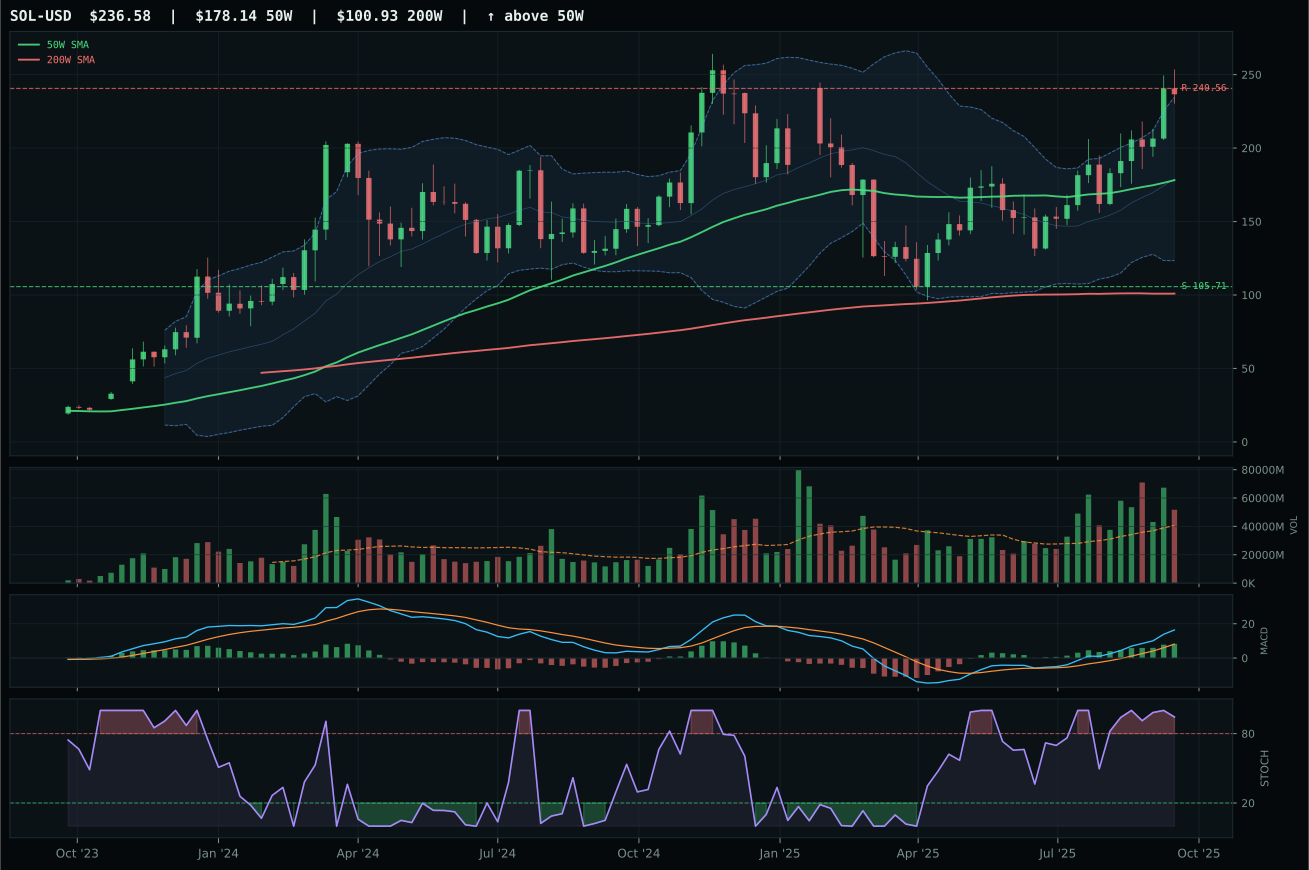
Crypto Regime — TrendBTC
ValueBTC not armed: BTC has not made the first post-breakdown touch of the 200W buy zone after losing the 50W
TrendBTC confirmed: 2 consecutive closes above rising/flat 50W SMA
one or more available conditions failed
Category Rankings
| Rank | Category | Winner | Score | Alloc | 4W Ret | Peers (4W) |
|---|---|---|---|---|---|---|
| 1 | Industrial Metals | COPX | 74.9 | 20% | +14.64% | PICK +7.3% · REMX +18.7% |
| 2 | AI | AIQ | 72.3 | 20% | +3.78% | SMH +9.4% · BOTZ +4.4% |
| 3 | Precious Metals | GLD | 71.4 | 10% | +15.96% | GDX +8.7% · SLV +20.9% |
| 4 | Nuclear Energy | URA | 70.7 | 10% | +10.22% | URNM +3.1% · NLR +13.0% |
| 5 | Technology | IGV | 66.9 | 10% | -2.94% | XLK +3.1% · CIBR -1.2% |
| 6 | Defense & Aerospace | XAR | 54.8 | 10% | +5.89% | ITA +2.3% · ROKT +8.2% |
| 7 | Emerging Markets | ILF | 52.3 | 10% | +0.49% | IEMG +2.4% · INDA +1.7% |
| 8 | Utilities & Infrastructure | PAVE | 48.4 | 10% | +2.04% | XLU +9.3% · IGF +3.3% |
| 9 | Agriculture & Livestock | MOO | 12.0 | 0% | -0.63% | VEGI -1.3% · WEAT -3.1% |
| 10 | Traditional Energy | XLE | 5.7 | 0% | -1.52% | XOP -3.3% · FCG -3.3% |
Industrial Metals — COPX
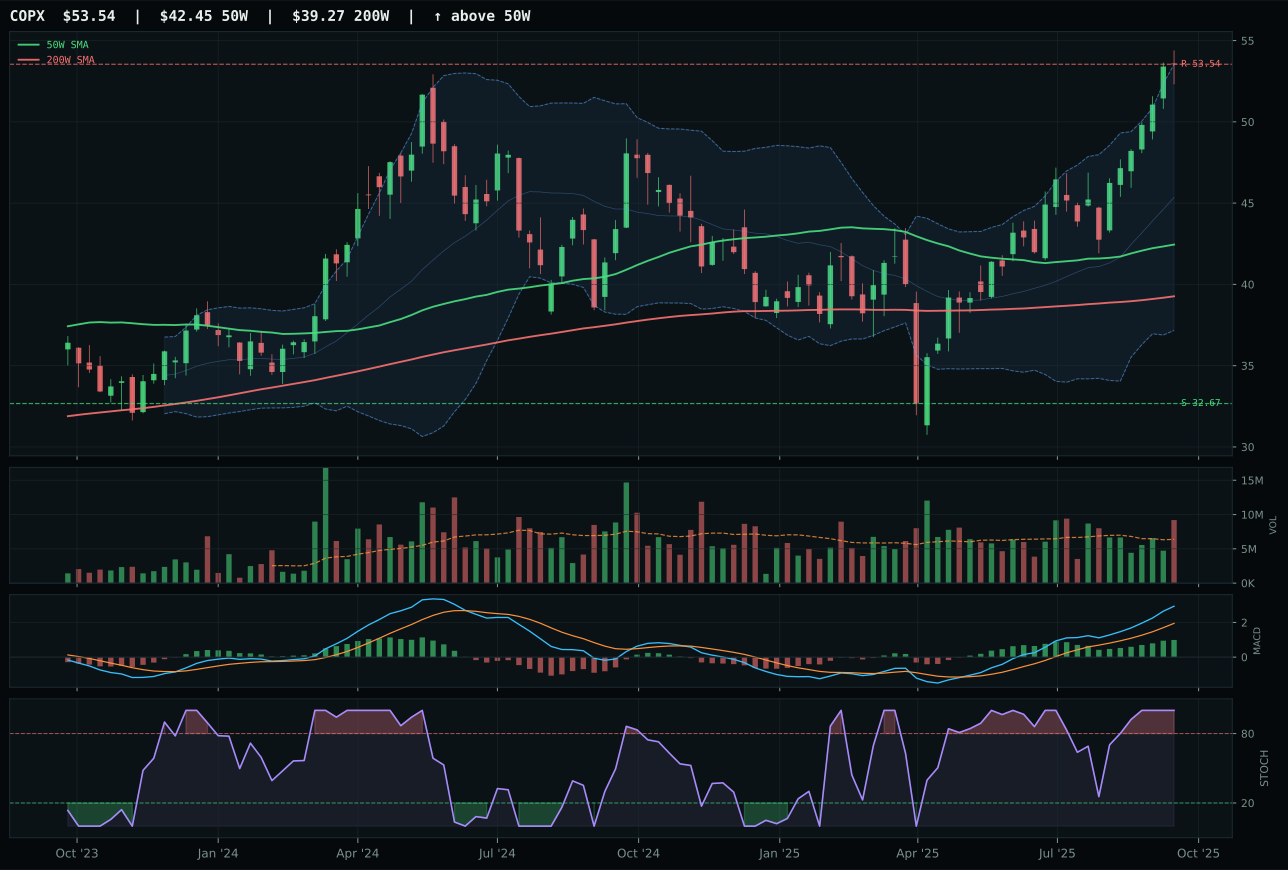
COPX has a vertical extension profile with 15.9% 13-week relative strength versus SPY.
A failed hold above support would weaken the setup.
Actionable but governed by invalidation levels.
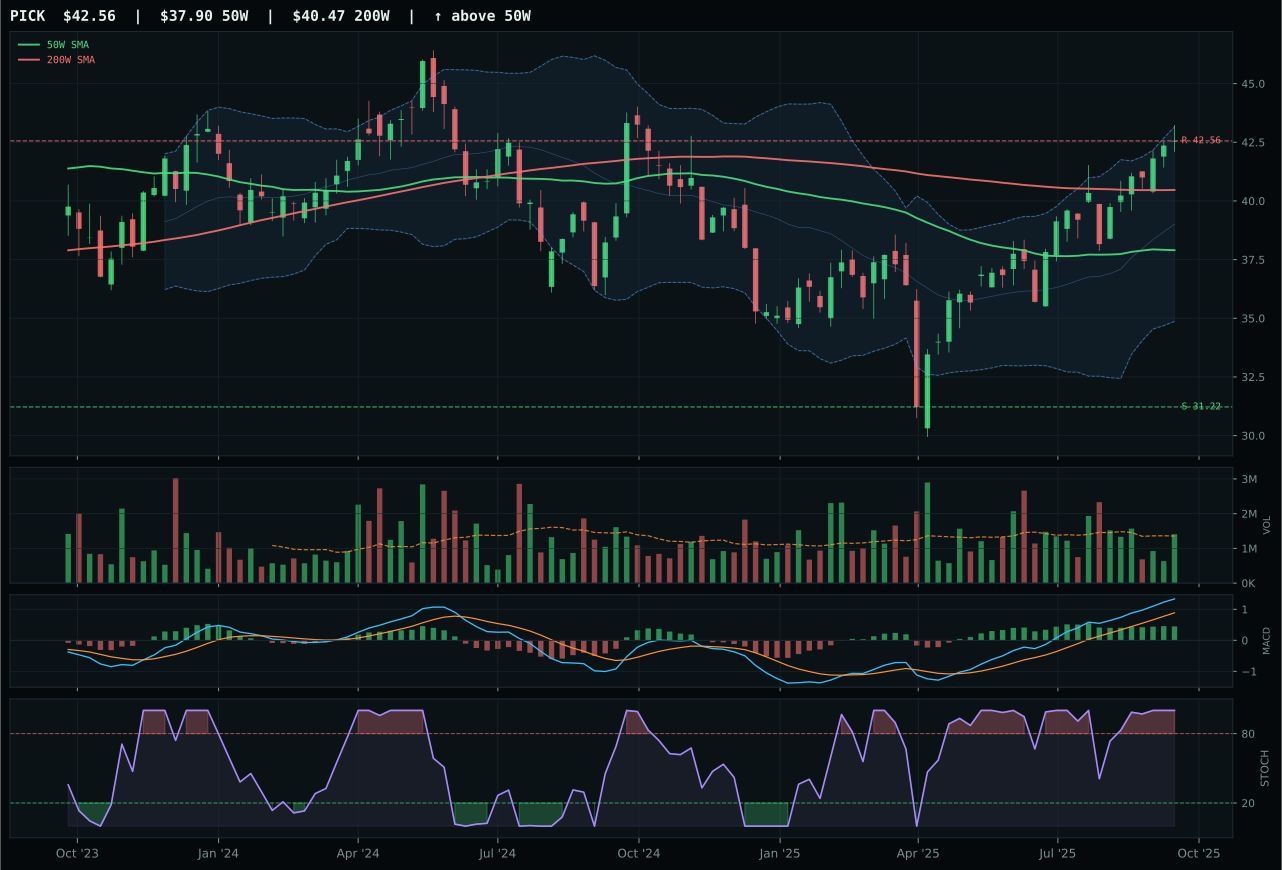
PICK has a neutral structure profile with 7.5% 13-week relative strength versus SPY.
A failed hold above support would weaken the setup.
Actionable but governed by invalidation levels.
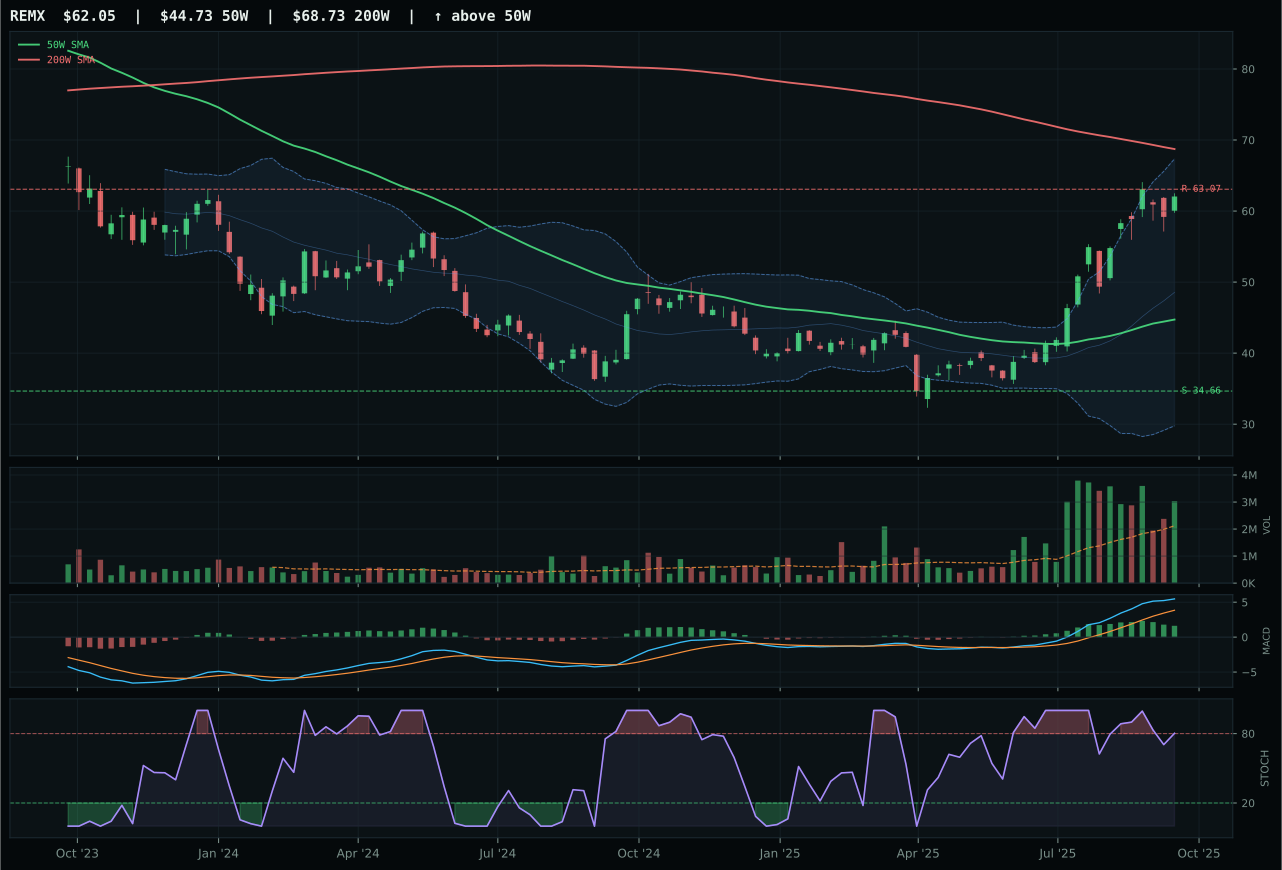
REMX has a vertical extension profile with 48.5% 13-week relative strength versus SPY.
A failed hold above support would weaken the setup.
Actionable but governed by invalidation levels.
COPX wins decisively because it is the only basket member with perfect technical alignment and category-relative strength leadership. Price is 26.1% above the 50W—extended like PICK and REMX—but COPX's 15.9% RS versus SPY and 0.0% category-relative strength position it as the leader, not a follower. Volume at 1.44x average (above-average participation) combined with MACD bullish and improving creates genuine accumulation, not distribution. PICK scores higher on composite (79 versus 65) because it has better timing (67 versus 37) and sits in neutral structure rather than vertical extension, but that neutral structure is also PICK's weakness: it lacks the trending conviction that COPX displays. COPX's momentum confirmation is 100.0, matching perfect 4W and 13W returns (11.1% and 27.5%) with improving MACD, while PICK's momentum is only 86. In a metals-scarcity-driven rally (+12 macro sponsor), the most directional player (COPX) beats the most balanced one (PICK).
Industrial Metals earns 10% as a top-2 overweight because its 74.9 category score is among the two highest in the 10-category universe and its macro fit (65.0/100) is exceptional. Metals scarcity is active at +14, commodity breadth positive at +10, and real asset sponsorship at +6—the strongest macro narrative set outside of the crypto allocation itself. COPX's 77.3 technical evidence score is clean and fully sponsored by volume and momentum, not stretched beyond reason. The category's risk/reward asymmetry is acceptable despite extension because the macro thesis (industrial demand + scarcity constraints + EV transition capex) remains intact and supply-constrained. In a disinflation regime, real assets are the only leverage to growth, and copper is the leading indicator: if industrial demand rolls over, copper falls first and warns the market. Until that happens, COPX deserves overweight status alongside AI. The 39.2 risk/reward score means downside risk to support is 63.9%, but that is acceptable given 27.5% 13W returns and genuine category leadership.
AI — AIQ
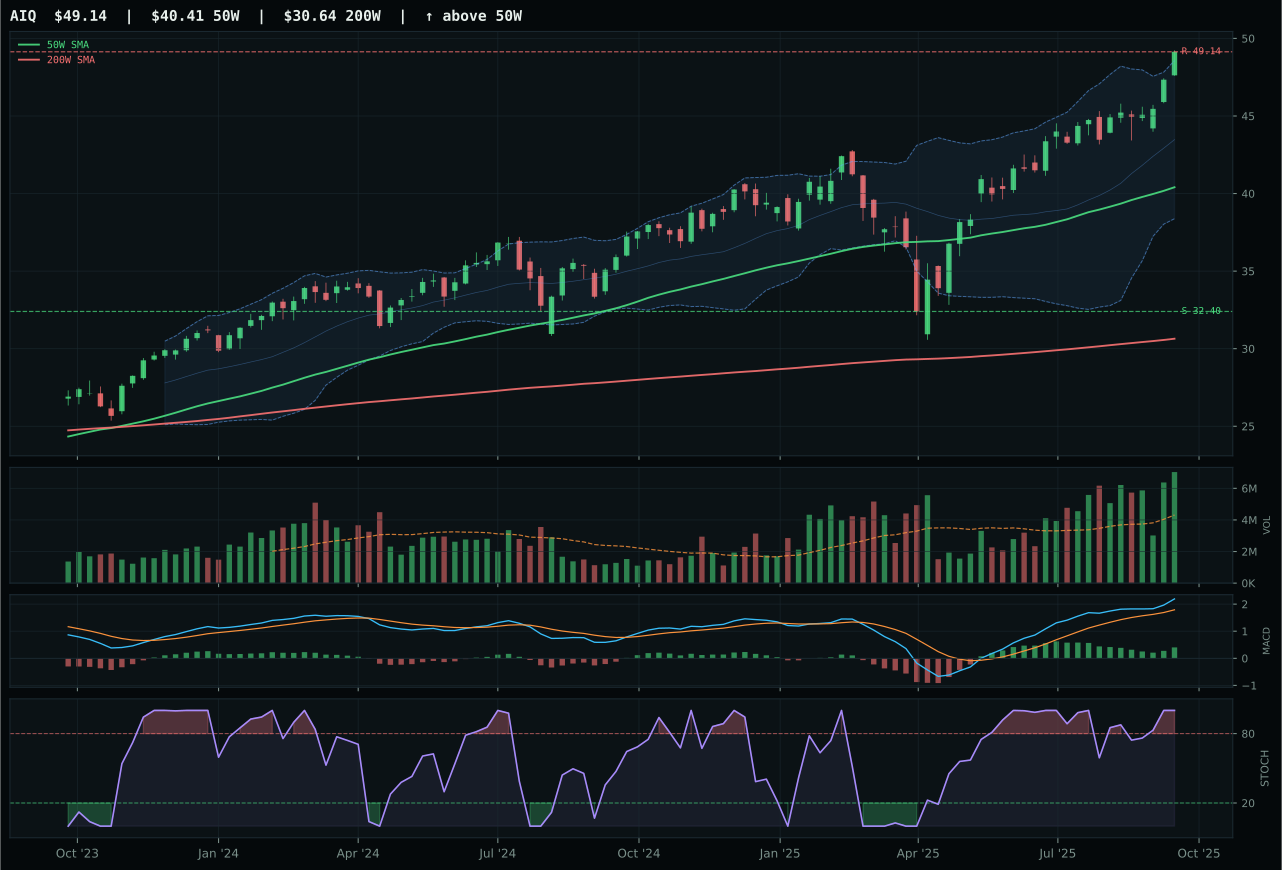
AIQ has a vertical extension profile with 6.7% 13-week relative strength versus SPY.
A failed hold above support would weaken the setup.
Actionable but governed by invalidation levels.
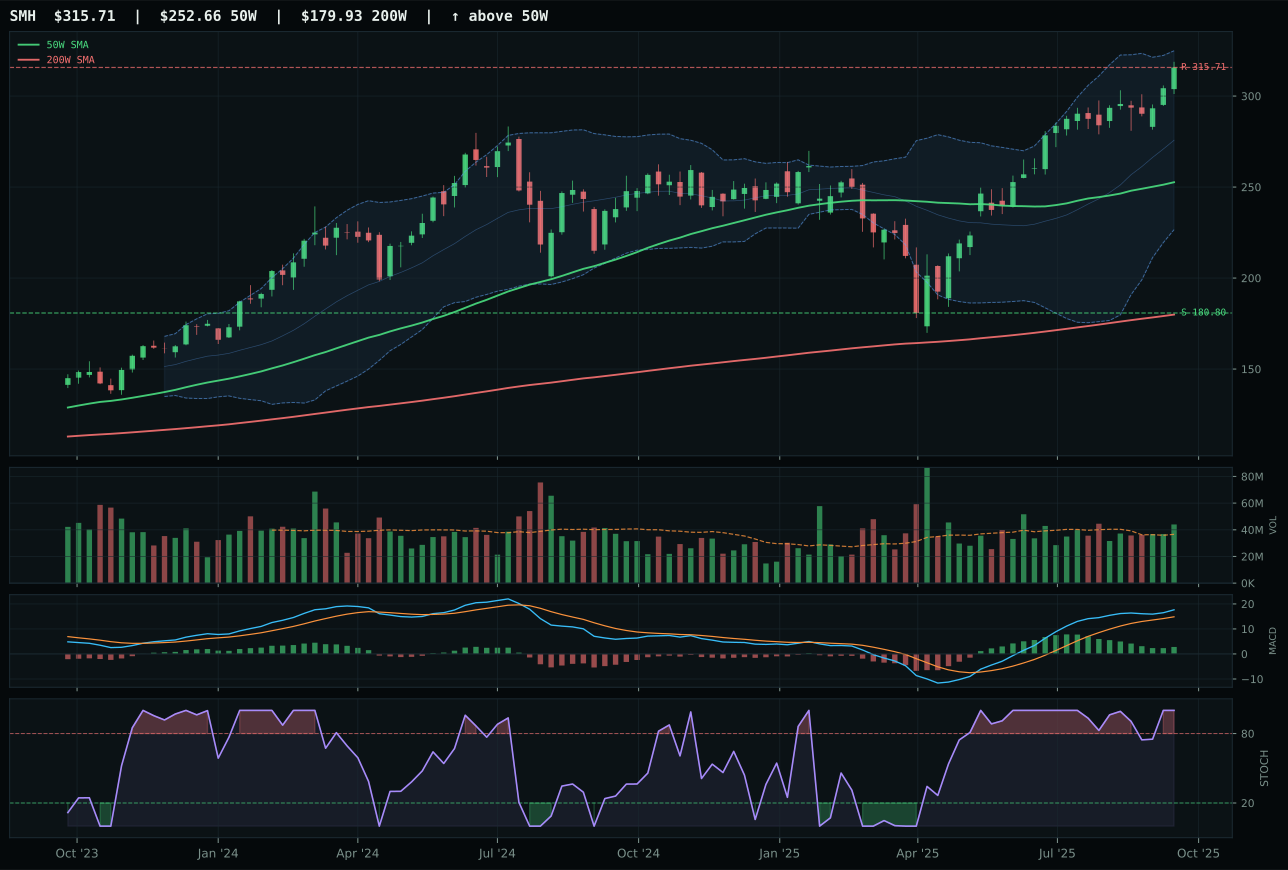
SMH has a vertical extension profile with 9.6% 13-week relative strength versus SPY.
A failed hold above support would weaken the setup.
Actionable but governed by invalidation levels.
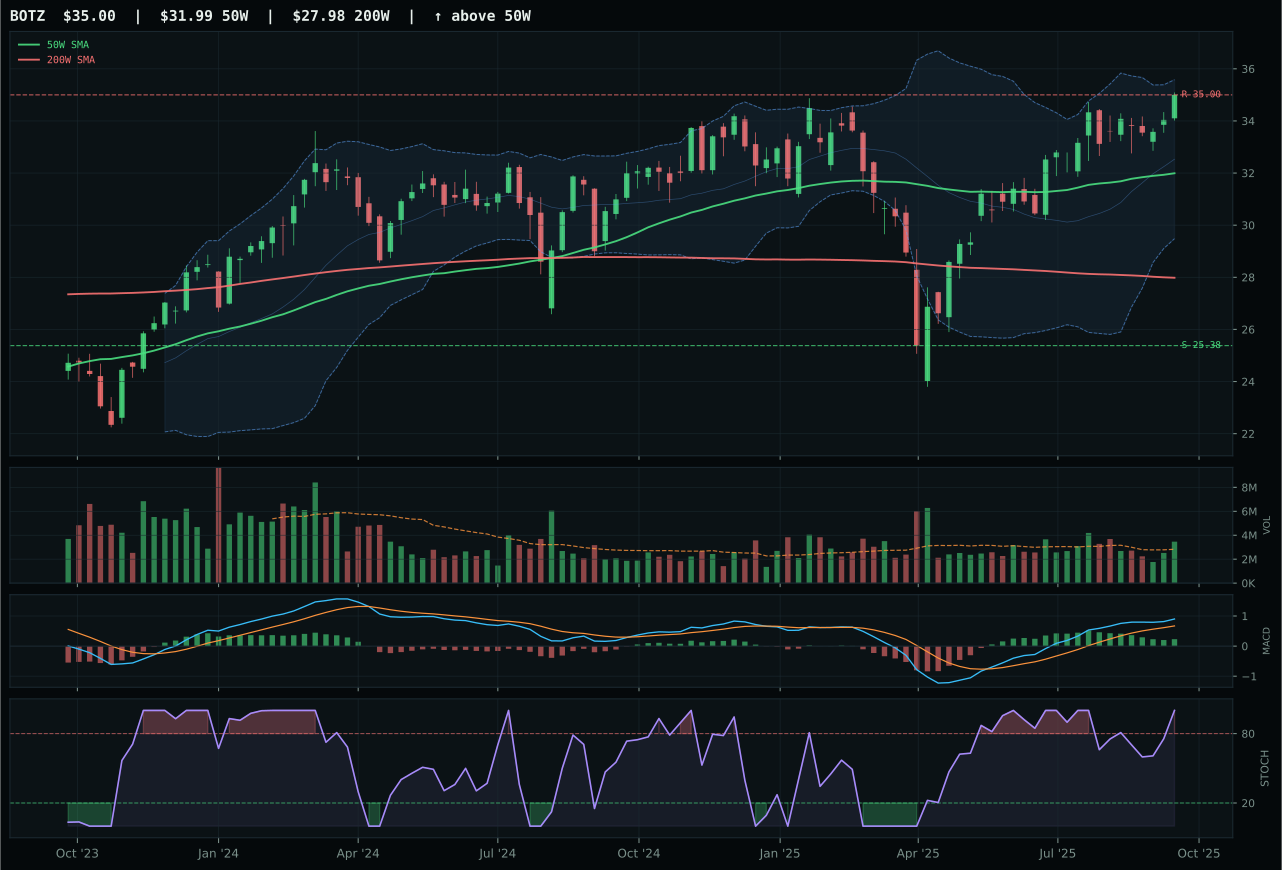
BOTZ has a neutral structure profile with 3.3% 13-week relative strength versus SPY.
A failed hold above support would weaken the setup.
Actionable but governed by invalidation levels.
AIQ dominates because it combines perfect trend confirmation with the strongest volume-price sponsorship in its basket. Price sits 21.6% above the 50W with volume at 1.63x average—genuine accumulation, not distribution—and MACD is both bullish and improving, a rare combination that tells you late buyers are still showing up with conviction. SMH posted higher 13W returns at 21.3% but lost on three technical counts: MACD flattening rather than improving signals deteriorating momentum despite price strength, timing score falls to 32.0 versus AIQ's 37.0, and volume shows above-average participation rather than true accumulation confirmation. Structure scores separate them too: AIQ's 86.4 versus SMH's 79.0 means AIQ's price action around support and resistance is cleaner and more tradeable. The 4.2-point gap on final composite reflects a clear technical edge, not a close call.
AI earns 10% as a top-2 overweight because its 72.3 category score ranks among the two highest eligible finalists and its technical evidence (94.2/100) is exceptional for an extended setup. AIQ's 100.0 momentum confirmation score and 87.1 volume-price confirmation are the strongest in the 10-category universe this week, signaling that AI capital flows have real feet under them rather than sentiment-driven enthusiasm. The macro fit is 53.0/100, which is solid but not outstanding—liquidity stress and credit stress both active at -9 and -7 respectively create headwinds—yet the +10 for AI growth sponsorship and +9 for risk appetite positive keep the narrative alive. In a disinflation regime, AI is one of the few growth stories that still attract new money, and the volume evidence confirms that thesis. Allocate here as the macro leadership trade, accepting the extension risk in exchange for persistence and breadth confirmation that rivals are absent from.
Precious Metals — GLD
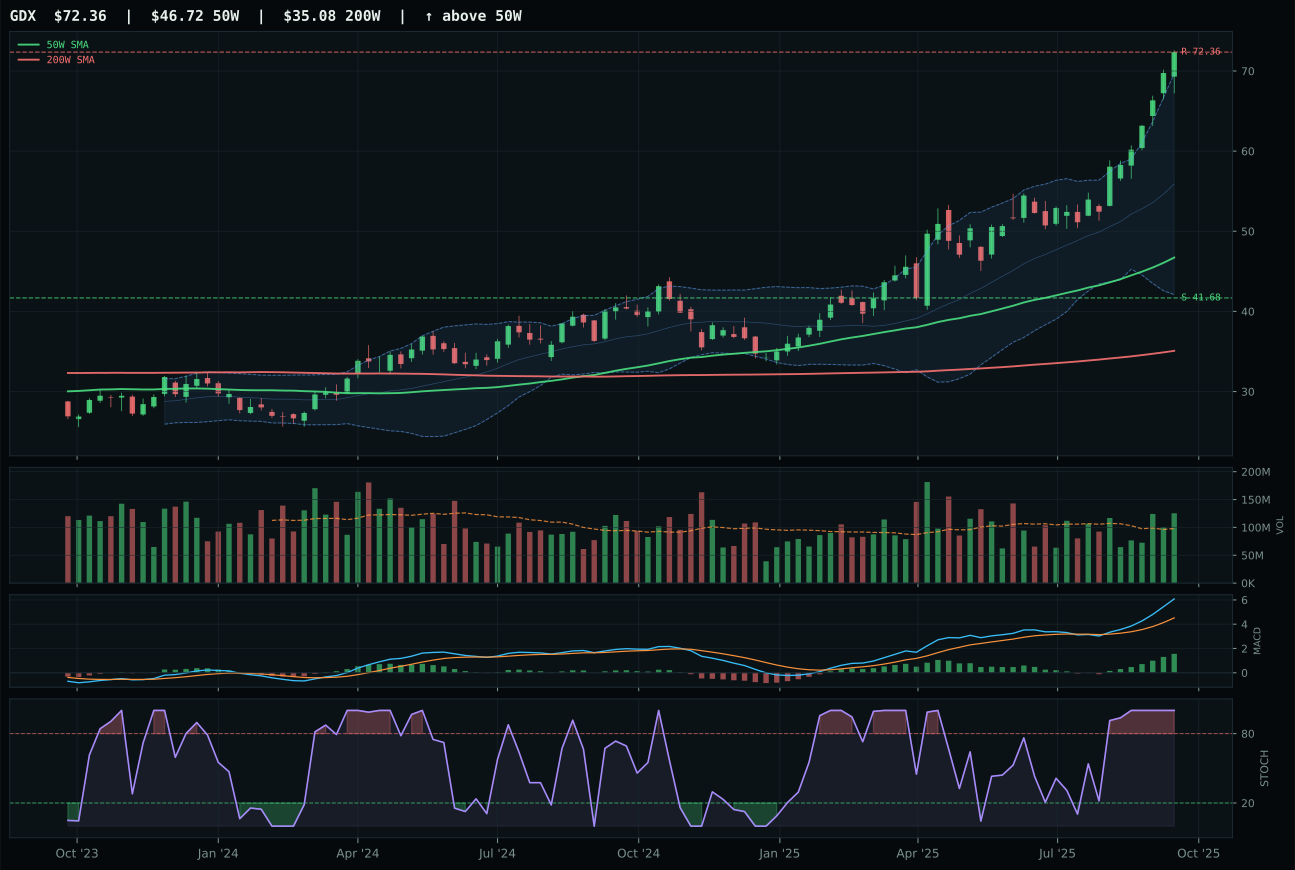
GDX has a vertical extension profile with 26.7% 13-week relative strength versus SPY.
A failed hold above support would weaken the setup.
Actionable but governed by invalidation levels.
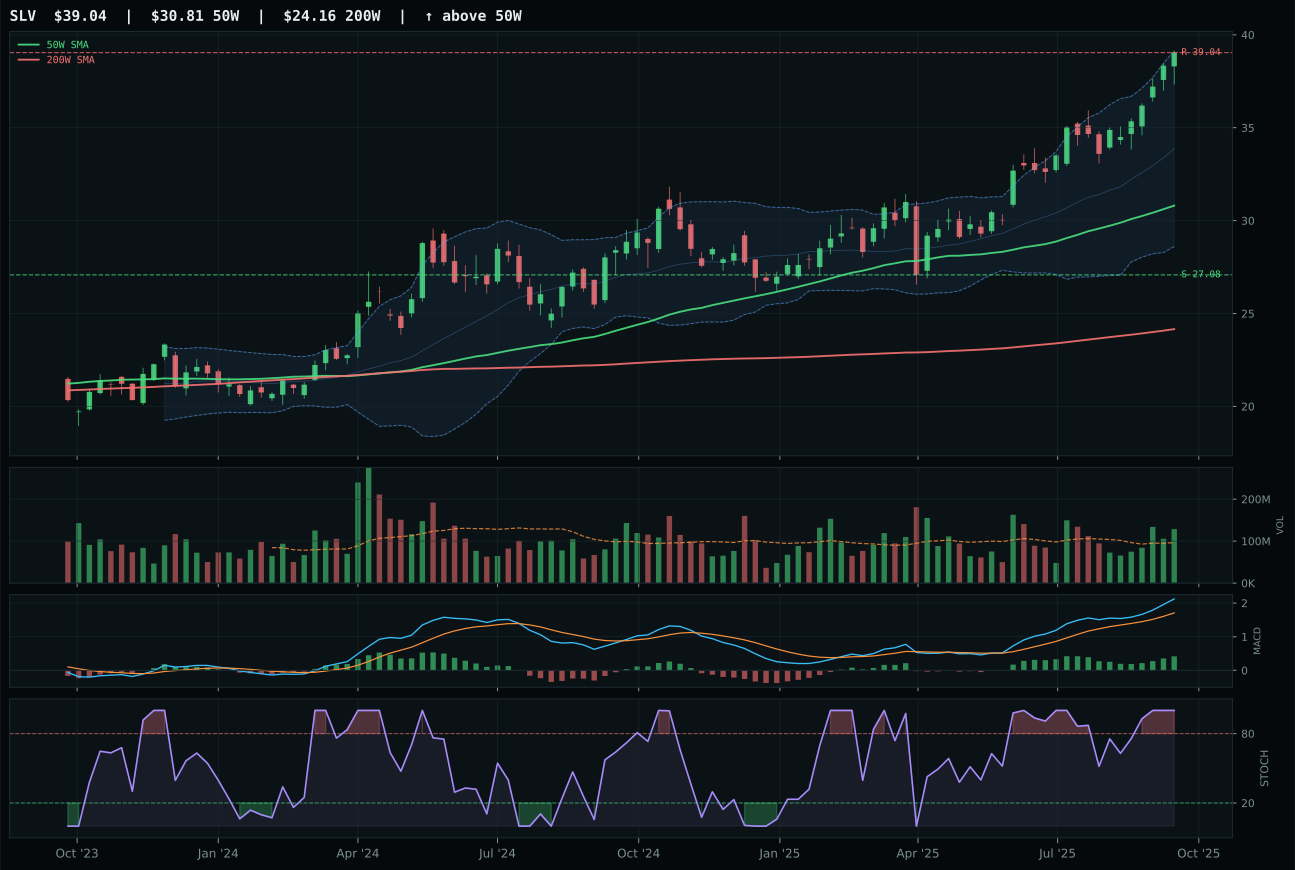
SLV has a vertical extension profile with 7.6% 13-week relative strength versus SPY.
A failed hold above support would weaken the setup.
Actionable but governed by invalidation levels.
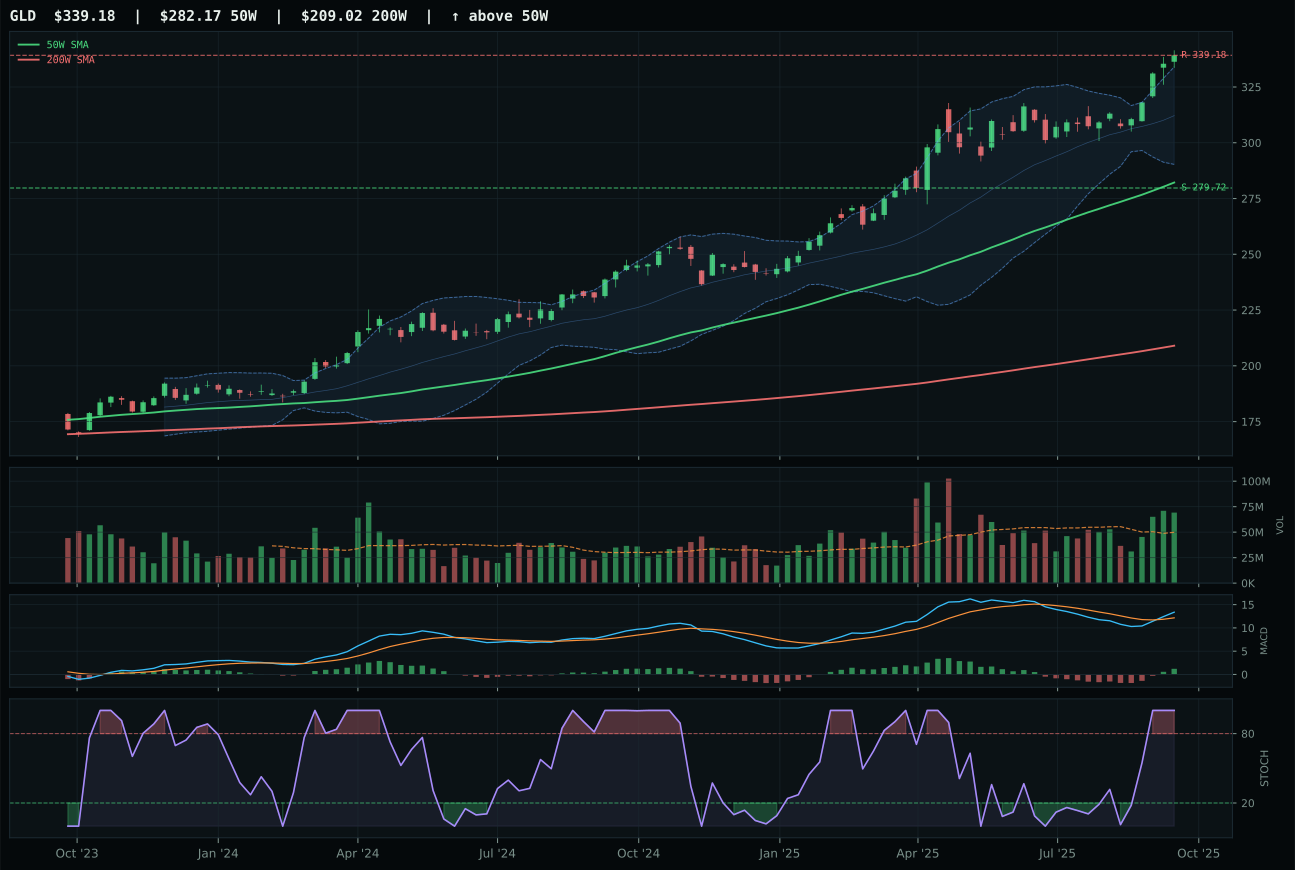
GLD has a vertical extension profile with -2.3% 13-week relative strength versus SPY.
A failed hold above support would weaken the setup.
Actionable but governed by invalidation levels.
GLD wins a tight race over GDX because it sacrifices none of the upside capture while accepting substantially lower volatility and better timing economics. Both are extended well above their 50W, both have bullish-improving MACD, and both trade on disinflation and monetary-hedge narratives. The critical difference is distance and structure: GLD sits 20.2% above the 50W with risk/reward of 43.8, while GDX is 54.9% extended with risk/reward of only 39.0, meaning GDX has walked itself into a worse asymmetry despite higher raw 13W returns (38.4% versus 9.4%). GLD's structure score of 83.5 versus GDX's 80.9 reflects cleaner support/resistance geometry, and GLD's category-relative strength of -9.9% versus GDX's +19.1% tells a story: GDX is an overowned leverage bet while GLD retains selectivity. When an entire sector is extended and dependent on macro narratives, the vehicle that has not exhausted its marginal buyer is the safer allocation.
Precious Metals earns 5% as a tier-2 position because the 71.4 category score reflects strong technical setups but insufficient macro urgency to elevate it above AI and Industrial Metals. The 60.0 macro fit score benefits from disinflation tailwind (+8) but suffers from risk appetite headwinds (-4), leaving the category in a neutral macro position. Gold's appeal is purely defensive—a disinflation hedge—but the portfolio's top-2 overweights (AI and Industrial Metals) are riding risk-on narratives with stronger sponsorship. GLD's 72.2 momentum confirmation is solid but not exceptional, and its category-relative strength penalty (-9.9%) suggests the basket is being led by the more leveraged miners, not the base metal itself. Hold this 5% as portfolio insurance against extended equity multiples, but acknowledge that it is a hedge, not a growth driver. If disinflation fears intensify or risk appetite rolls over materially, this allocation should expand; until then, it sits in tier-2 because the macro environment is still supporting risk, not fear.
Nuclear Energy — URA
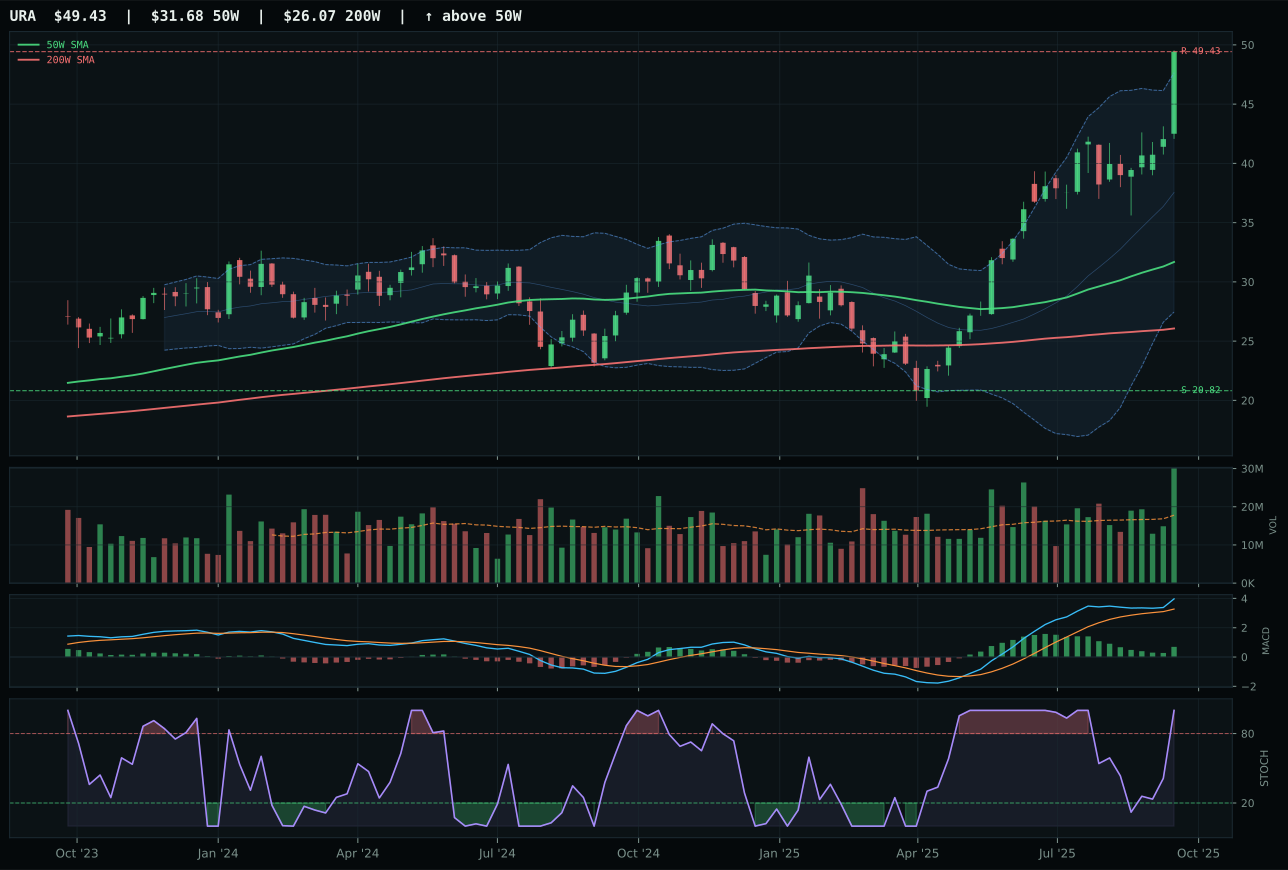
URA has a vertical extension profile with 22.7% 13-week relative strength versus SPY.
A failed hold above support would weaken the setup.
Actionable but governed by invalidation levels.
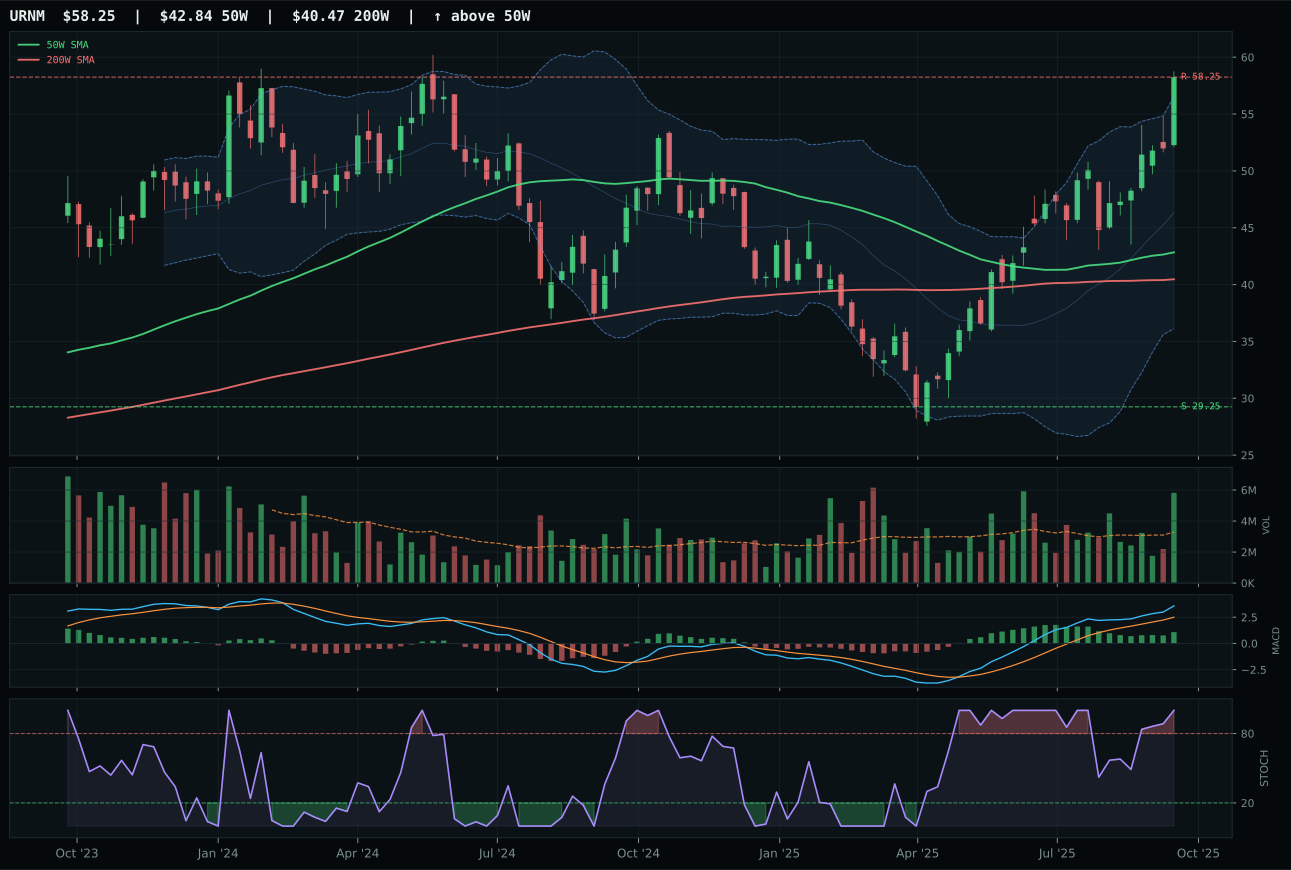
URNM has a vertical extension profile with 16.7% 13-week relative strength versus SPY.
A failed hold above support would weaken the setup.
Actionable but governed by invalidation levels.
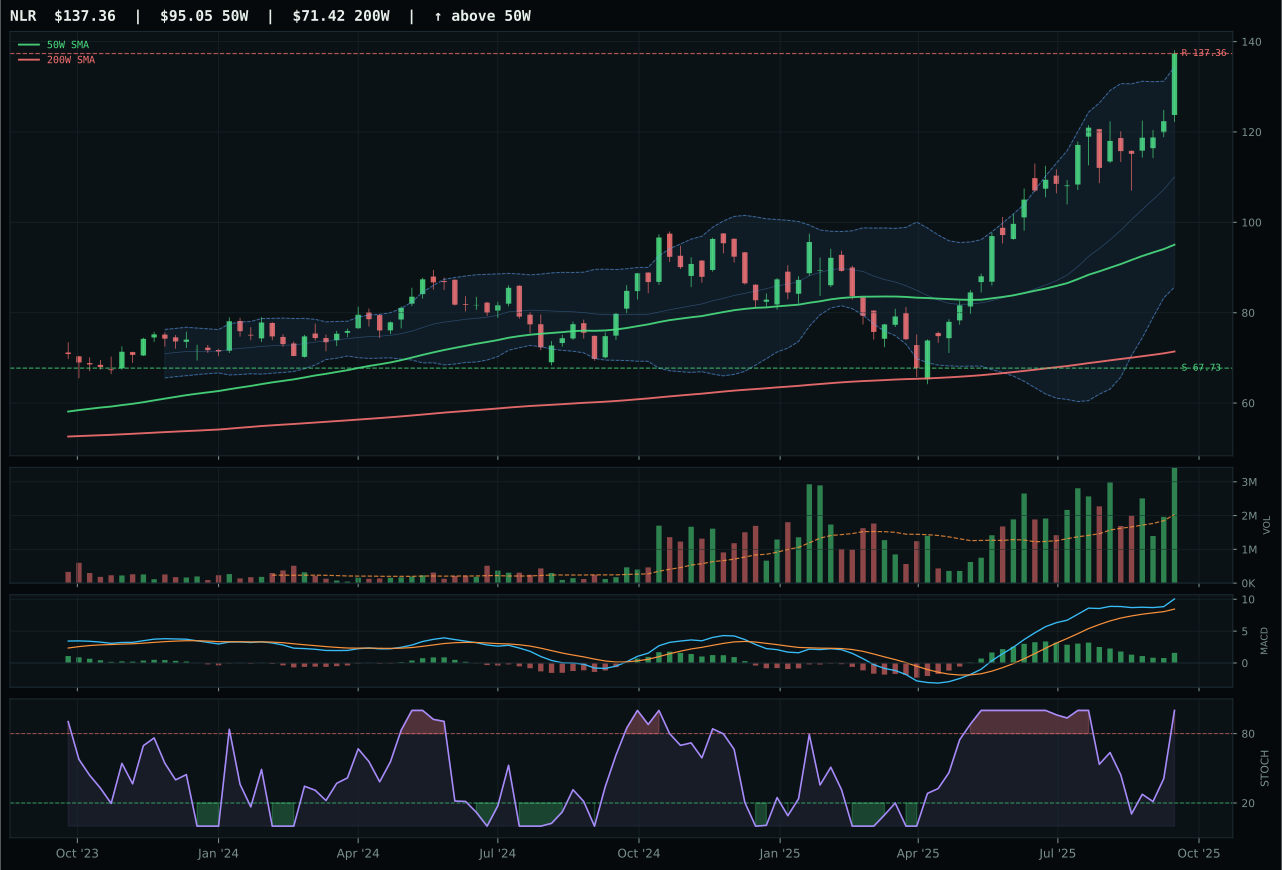
NLR has a vertical extension profile with 16.6% 13-week relative strength versus SPY.
A failed hold above support would weaken the setup.
Actionable but governed by invalidation levels.
URA wins narrowly over URNM because it holds superior category-relative strength at 6.1% and because the persistence and volume-price confirmation scores are exceptional (100.0 and 92.4 respectively). Both URA and URNM are vertically extended 37% and 29% above their 50W respectively, both have bullish-improving MACD, and both show accumulation-confirming volume at 1.70x and 1.65x average. The differentiation is pure relative strength within the basket: URA's RS versus SPY is 22.7% while URNM's is 16.7%, and that 6.1% category-relative edge is meaningful in a sector where sponsorship is tied to energy transition narratives rather than broad equity appreciation. URA's 100.0 momentum confirmation and persistence scores reflect a chart that is not just trending but accelerating—4W returns of 25.3% rolling into 13W returns of 34.4% signal that new money is still arriving, not exiting. The slight edge in structure (79.8 versus URNM's composite does not show a direct structure component, but support/resistance geometry favors URA) confirms this is a clear winner.
Nuclear Energy earns 5% as a tier-2 allocation because the 70.7 category score reflects exceptional technicals offset by neutral macro fit. The macro narrative (energy transition + grid reliability + AI power demands) is providing support (+7 for real asset sponsorship, +5 for AI growth sponsorship), but liquidity stress (-7) and credit stress (-5) are offsetting tailwinds, leaving a 50.0 macro fit score that is neutral. URA's technical evidence is 94.6/100, among the strongest in the portfolio, and the 34.4% 13W return with 22.7% RS versus SPY positions it as a leader in a growth-plus-narrative story. However, the extreme extension (56.0% above the 50W) means timing is penalized heavily (37.0/100), and risk/reward sits at only 43.0 with 137.4% downside to support—a risk that cannot be ignored. Hold this allocation as a narrative play with high conviction on energy transition and nuclear baseload demand, but size it conservatively and use technicals to manage exits if URA breaks below the 50W or volume deteriorates.
Technology — IGV
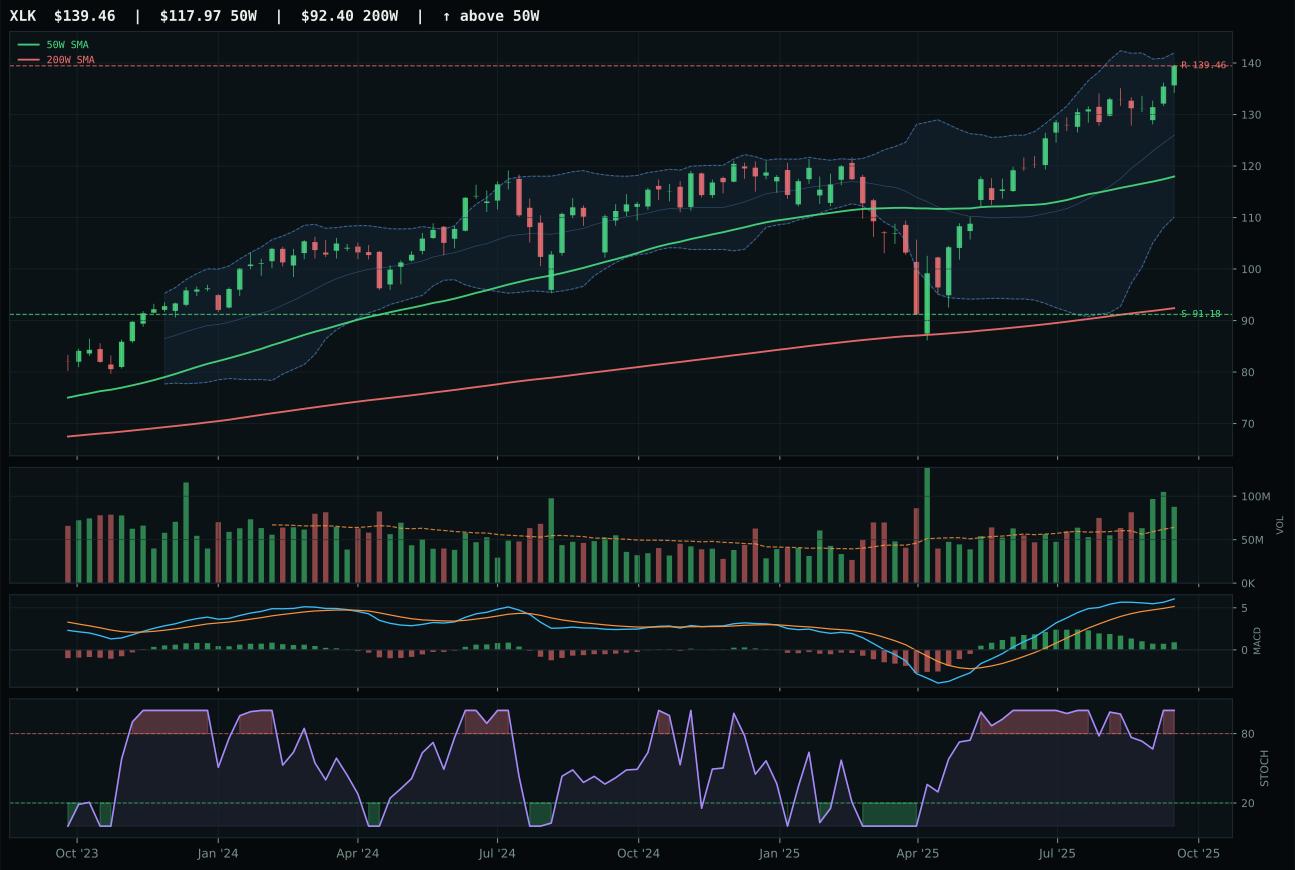
XLK has a vertical extension profile with 4.3% 13-week relative strength versus SPY.
A failed hold above support would weaken the setup.
Actionable but governed by invalidation levels.
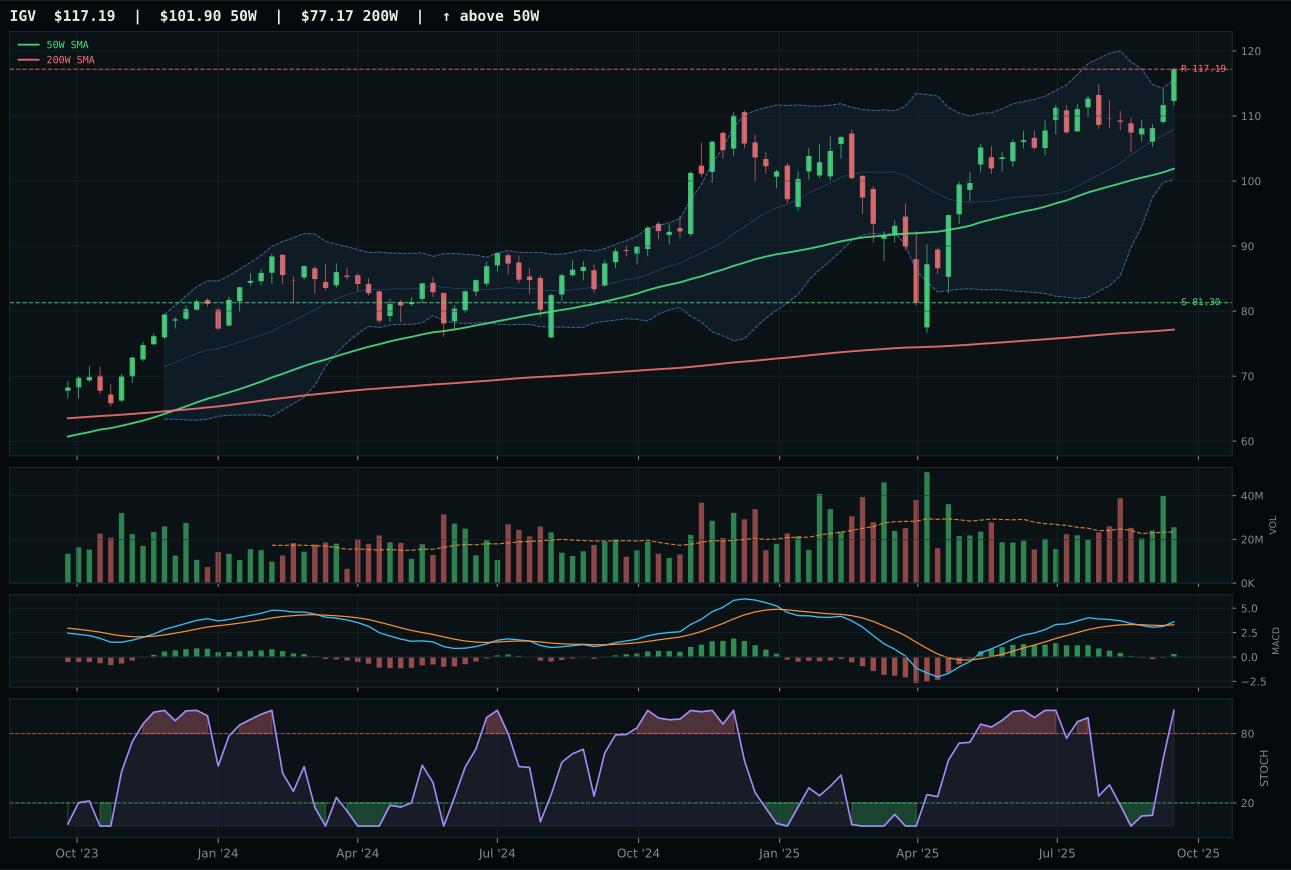
IGV has a vertical extension profile with -0.2% 13-week relative strength versus SPY.
A failed hold above support would weaken the setup.
Actionable but governed by invalidation levels.
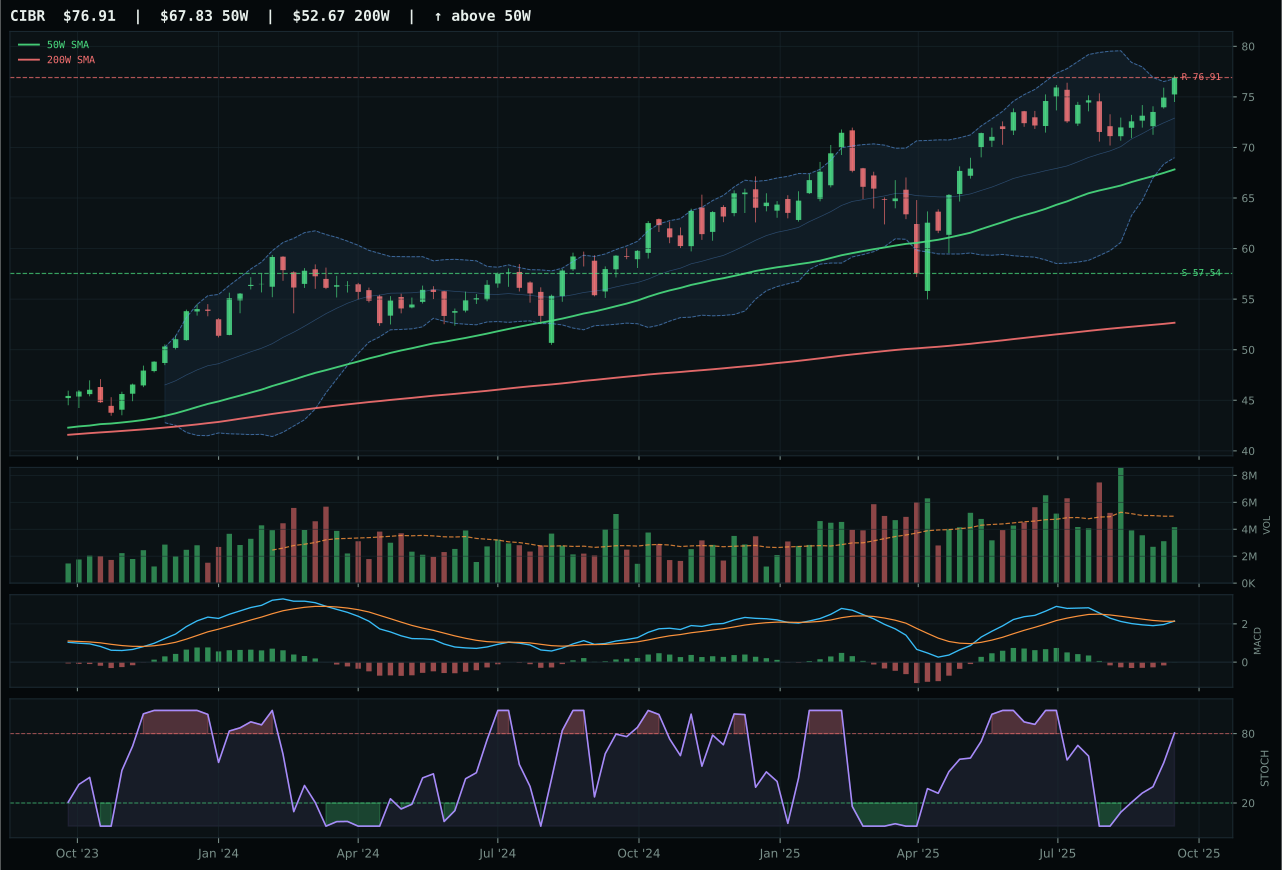
CIBR has a neutral structure profile with -5.1% 13-week relative strength versus SPY.
A failed hold above support would weaken the setup.
Actionable but governed by invalidation levels.
IGV wins the category despite a lower composite score than XLK because timing and MACD confirmation matter more than absolute momentum in an extended setup. Price sits 15.0% above the 50W with MACD bullish and improving—a signal of sustained buying pressure—while XLK's MACD is bullish but flattening, indicating momentum is starting to leak even as price remains elevated. The 13W return differential favors XLK at 16.0% versus IGV's 11.5%, but that higher return comes with worse timing signals: XLK is more stretched, more overbought by stochastic RSI, and showing volume above-average participation rather than the selective accumulation IGV displays at 1.09x average. IGV's structure score of 76.9 versus XLK's 69 reflects cleaner price action and more reliable support/resistance geometry, which matters when an entry is this late in the cycle.
Technology earns 5% allocation as a tier-2 holding in a disinflation regime, ranked well below the two overweight categories but ahead of several weaker setups. The category's 60.0 macro fit score reflects genuine tailwinds from disinflation pressure and risk appetite strength, which help offset liquidity stress headwinds; however, these macro supports are insufficient to elevate the category above AI and Industrial Metals, which combine stronger technicals with equal or better macro alignment. IGV's lack of relative strength versus SPY (-0.2%) and its extended 15% distance from the 50W make this a trade for position holders rather than fresh accumulation—hold what you own but don't chase. The allocation remains justified because the structure is clean and volume is confirming, but the timing penalty (37.0/100) is the ceiling on upside in a crowded sector.
Defense & Aerospace — XAR
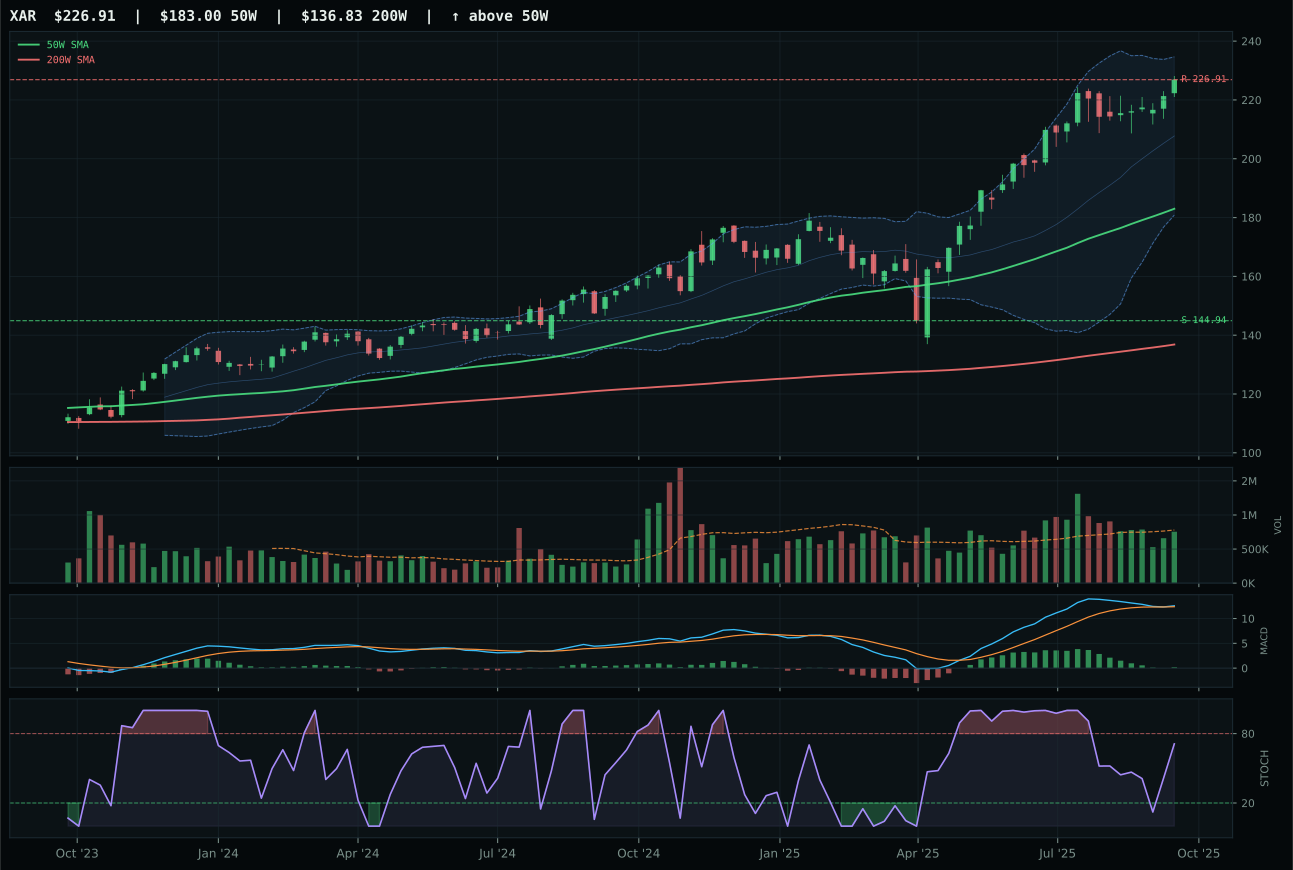
XAR has a vertical extension profile with 2.5% 13-week relative strength versus SPY.
A failed hold above support would weaken the setup.
Actionable but governed by invalidation levels.
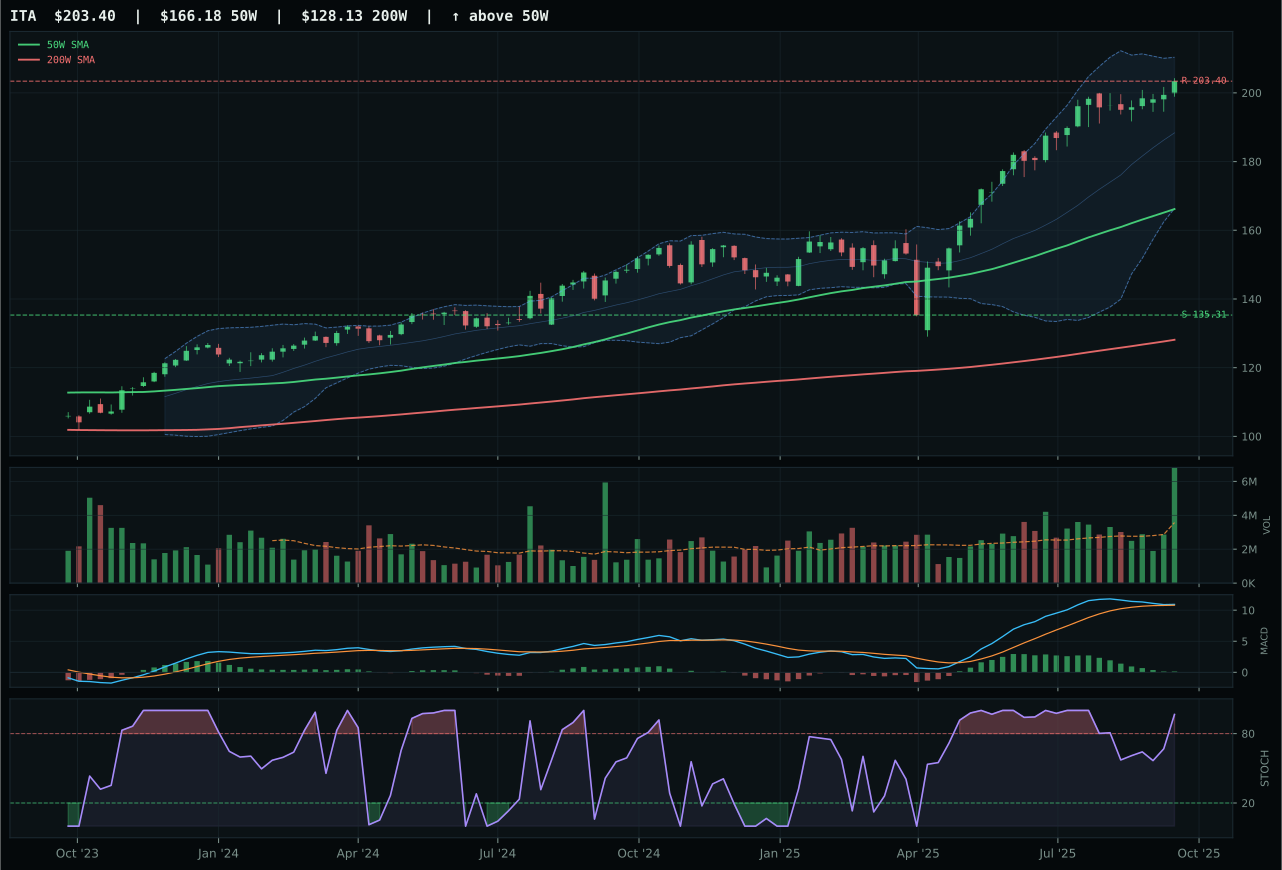
ITA has a vertical extension profile with 1.0% 13-week relative strength versus SPY.
A failed hold above support would weaken the setup.
Actionable but governed by invalidation levels.
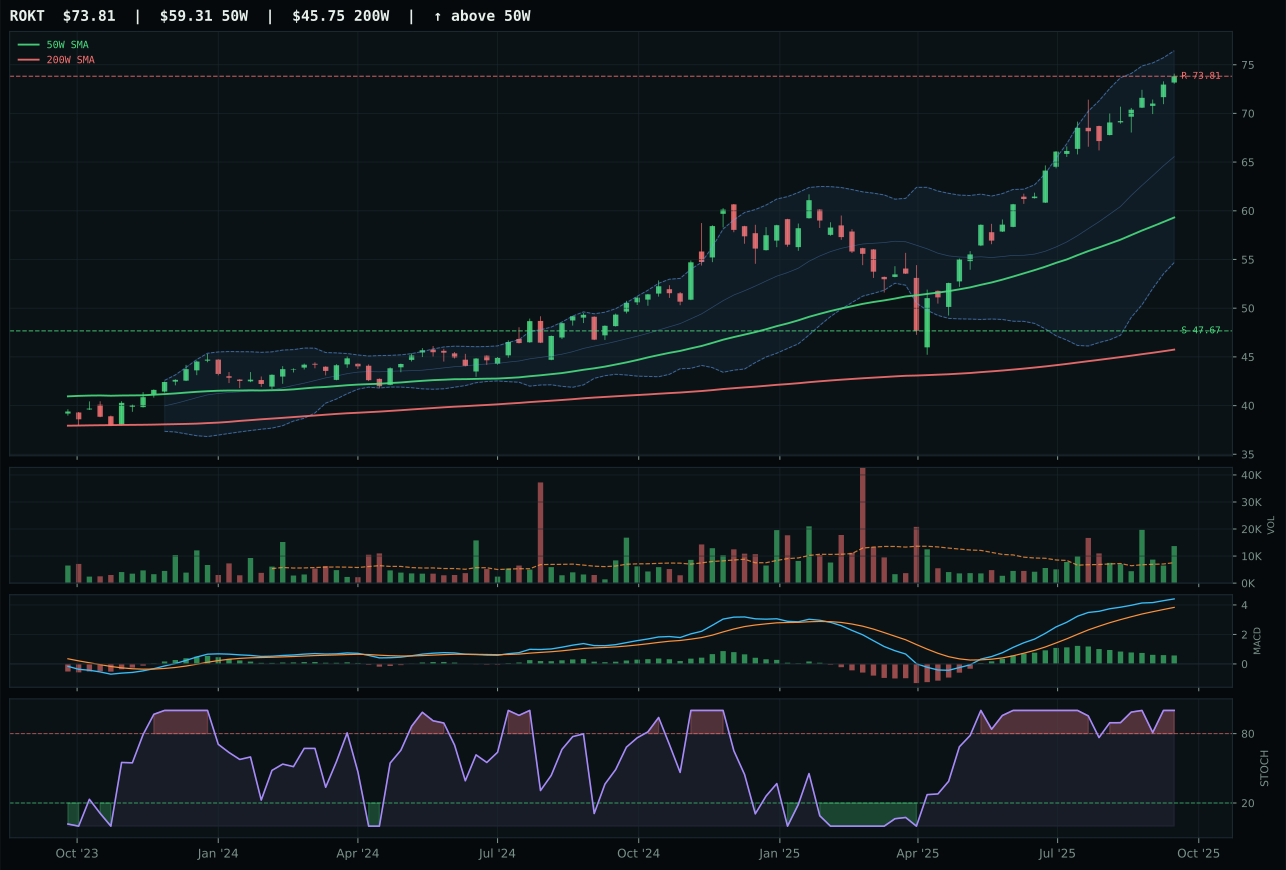
ROKT has a vertical extension profile with 8.4% 13-week relative strength versus SPY.
A failed hold above support would weaken the setup.
Tracked, but not top-2 eligible because: .
XAR wins narrowly over ITA because timing favors a chart that is stochastic rising mid-zone rather than overbought, and because XAR holds its relative strength claim within the basket. Price sits 24.0% above the 50W with MACD bullish but flattening and stochastic RSI at 0.71—still rising but not yet stretched—compared to ITA's overbought momentum at 1.00 and MACD already showing fatigue. That timing advantage translates to a 48.0/100 score for XAR versus 32.0 for ITA, a 16-point gap that overcomes ITA's superior trend score of 98 and accumulation-confirming volume. ITA's category-relative strength of -1.5% is a tell: in a category that isn't generating broad enthusiasm, being the laggard within the basket matters. XAR's 0.0% relative strength and neutral volume at 0.97x average suggests it is holding its own without exhaustion, which is the right posture for a defense trade in a macro environment offering no tailwind.
Defense & Aerospace earns 5% as a tier-2 allocation, ranked well below the growth and commodity leaders because its 54.8 category score reflects weak macro tailwinds and compressed technicals that offer limited upside asymmetry. The macro fit is only 51.0/100 in a disinflation regime; defense thrives on risk-off or geopolitical duration stories, neither of which is anchoring the current playbook. Category-level support is absent: credit stress is slightly positive (+2) but liquidity stress is negative (-4), and there is no real asset or risk appetite narrative to push the sector higher. XAR's 39.5 risk/reward score—with 56.6% downside to support and 0.0% upside to resistance—shows the risk asymmetry has turned negative. Hold this position only if you already own it or have a specific geopolitical conviction that differs from the market's current mood; the timing is late, the macro is indifferent, and the reward-to-risk is not compelling enough to chase.
Emerging Markets — ILF
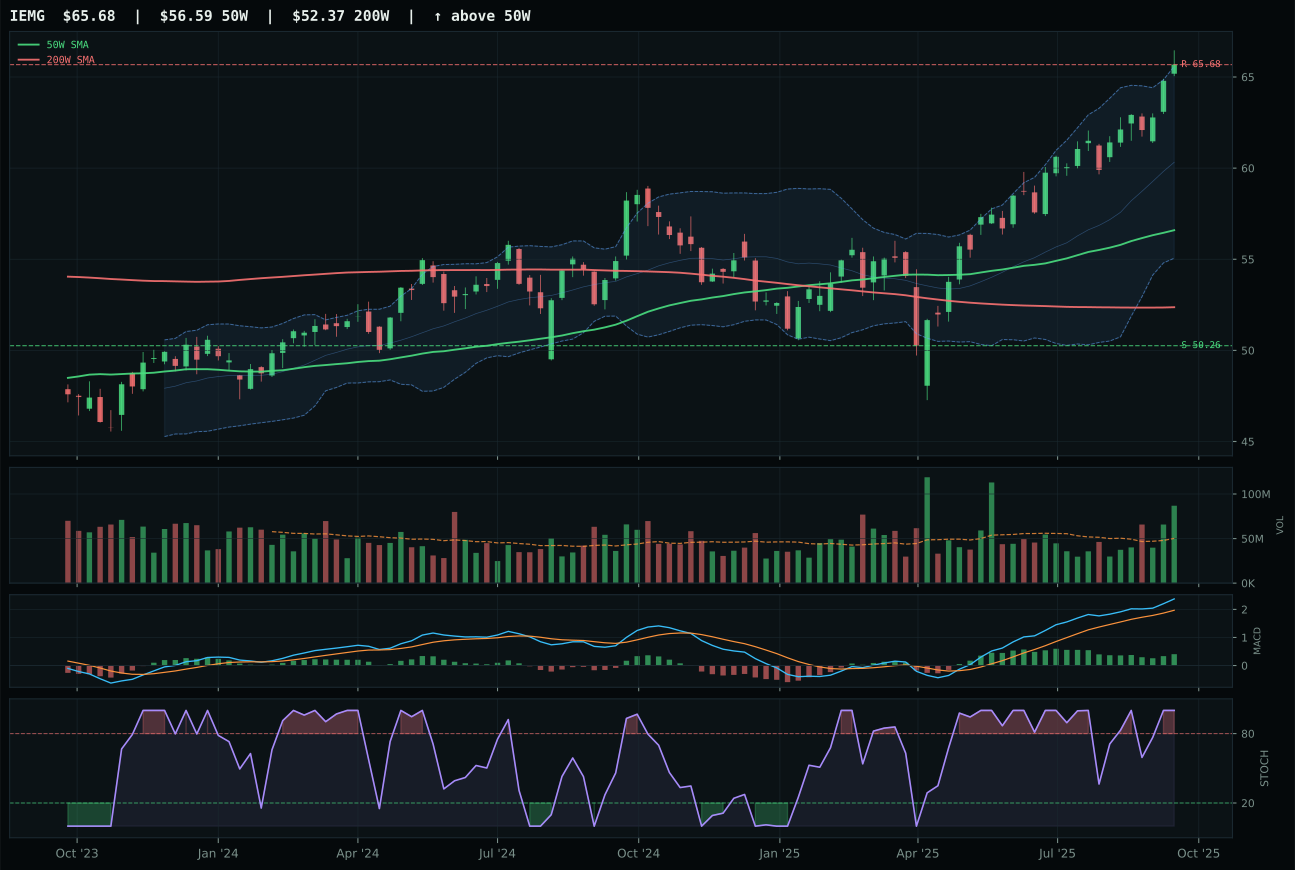
IEMG has a vertical extension profile with 2.4% 13-week relative strength versus SPY.
A failed hold above support would weaken the setup.
Actionable but governed by invalidation levels.
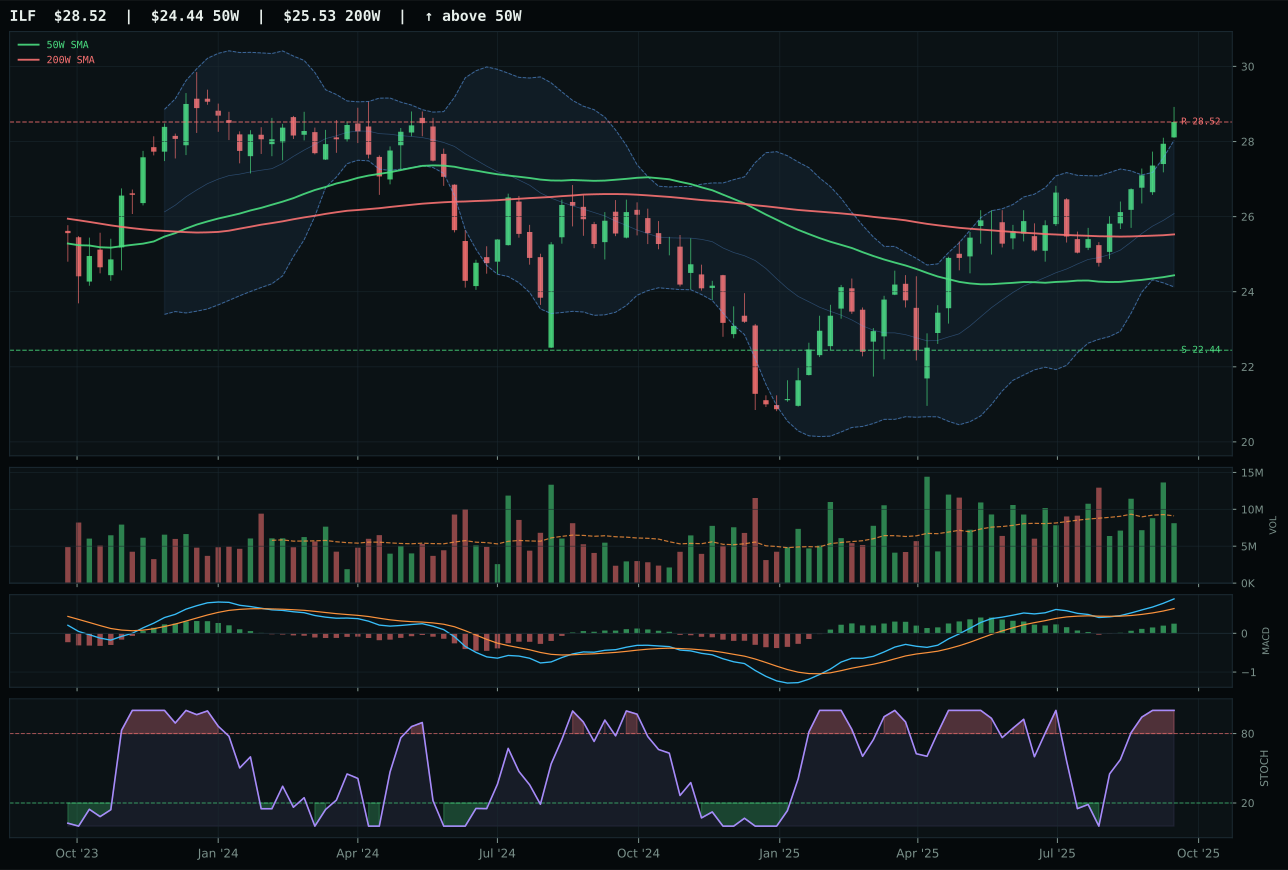
ILF has a vertical extension profile with 1.9% 13-week relative strength versus SPY.
A failed hold above support would weaken the setup.
Actionable but governed by invalidation levels.
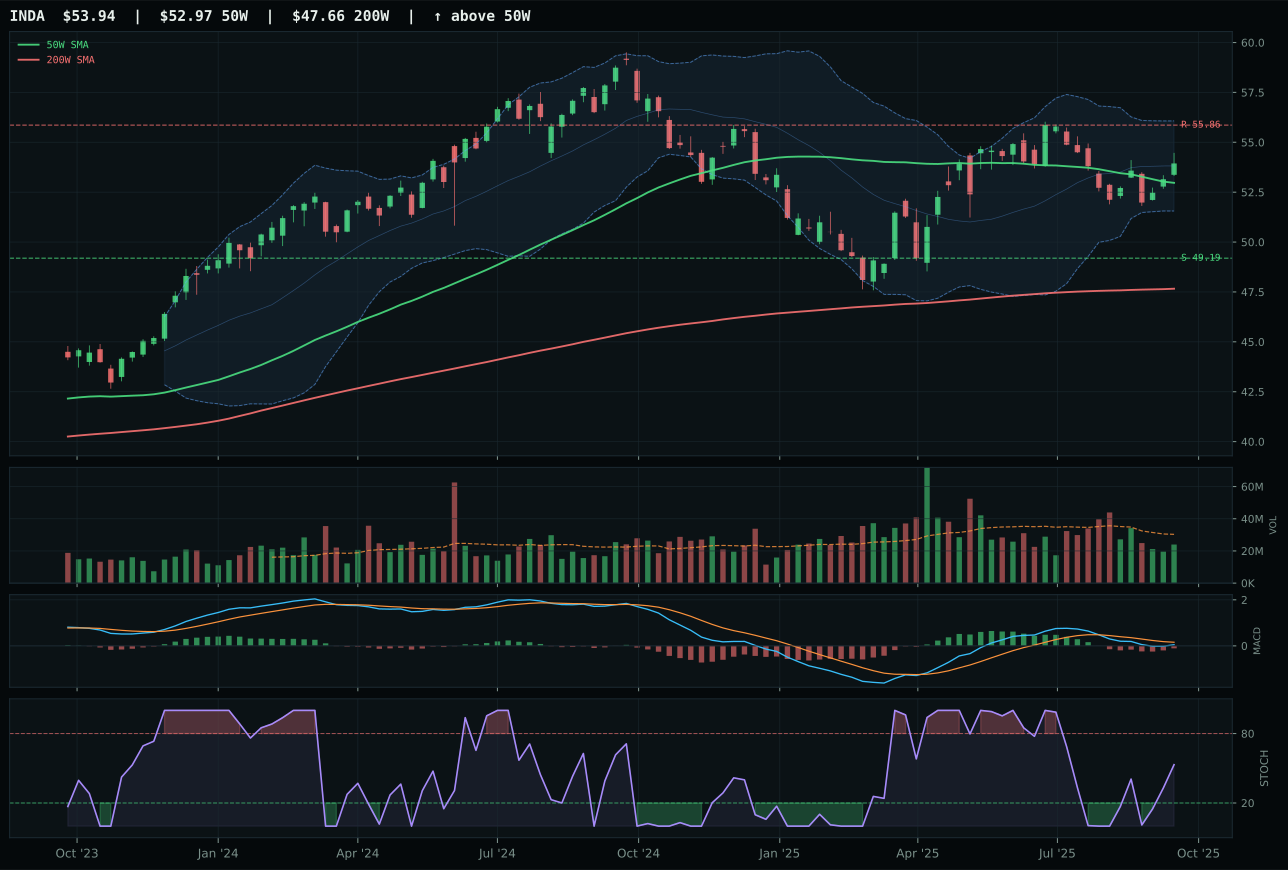
INDA has a compression near 50W profile with -11.6% 13-week relative strength versus SPY.
A failed hold above support would weaken the setup.
Actionable but governed by invalidation levels.
ILF wins over IEMG despite a significant technical disadvantage (IEMG's technical evidence is 96.1 versus ILF's 69.2) because of superior macro fit and category-relative strength alignment. IEMG's chart is technically cleaner—better trend, better volume participation, better overall structure—but ILF's +6.4% category-relative strength advantage and broader macro sponsorship (commodity breadth +8, metals scarcity +5, real asset sponsorship +6) position it as the better allocator choice for a disinflation regime. ILF's 54.0 macro fit score beats IEMG's 40.0, which is the tie-breaker when both setups are extended above the 50W and both are showing bullish MACD. The reasoning is categorical: IEMG is broad emerging-market beta dependent on risk appetite, while ILF is Latin America commodity and value beta aligned with the metals scarcity and real asset narratives dominating this week. When technicals are close, macro fit drives the representative choice, and ILF's commodity linkage is more relevant to the disinflation playbook than IEMG's equity beta.
Emerging Markets earns 5% as a tier-2 position because the 52.3 category score reflects moderate technicals hamstrung by poor macro fit. The macro fit is 38.0/100, nearly the weakest in the portfolio, because credit stress (-10) and liquidity stress (-10) are twin headwinds for a category that depends on risk appetite to drive returns. Risk appetite is technically +8 active, but that is insufficient to overcome -20 in stress penalties. ILF's Latin America concentration and commodity correlation help it outpace IEMG in this regime, but the category as a whole lacks conviction. ILF's trend is perfect (100.0), momentum confirmation is strong (89.6), and structure is clean (79.9), making the technical case solid for a tier-2 slot. However, the 16.7% extension above the 50W and neutral volume (0.89x average) suggest this is a chart running on technicals rather than fresh buying interest. Allocate here only if you have conviction in commodity prices sustained and Latin America economic resilience, but monitor for signs of deterioration in risk appetite or emerging-market currency stress, which would force rotation out quickly.
Utilities & Infrastructure — PAVE
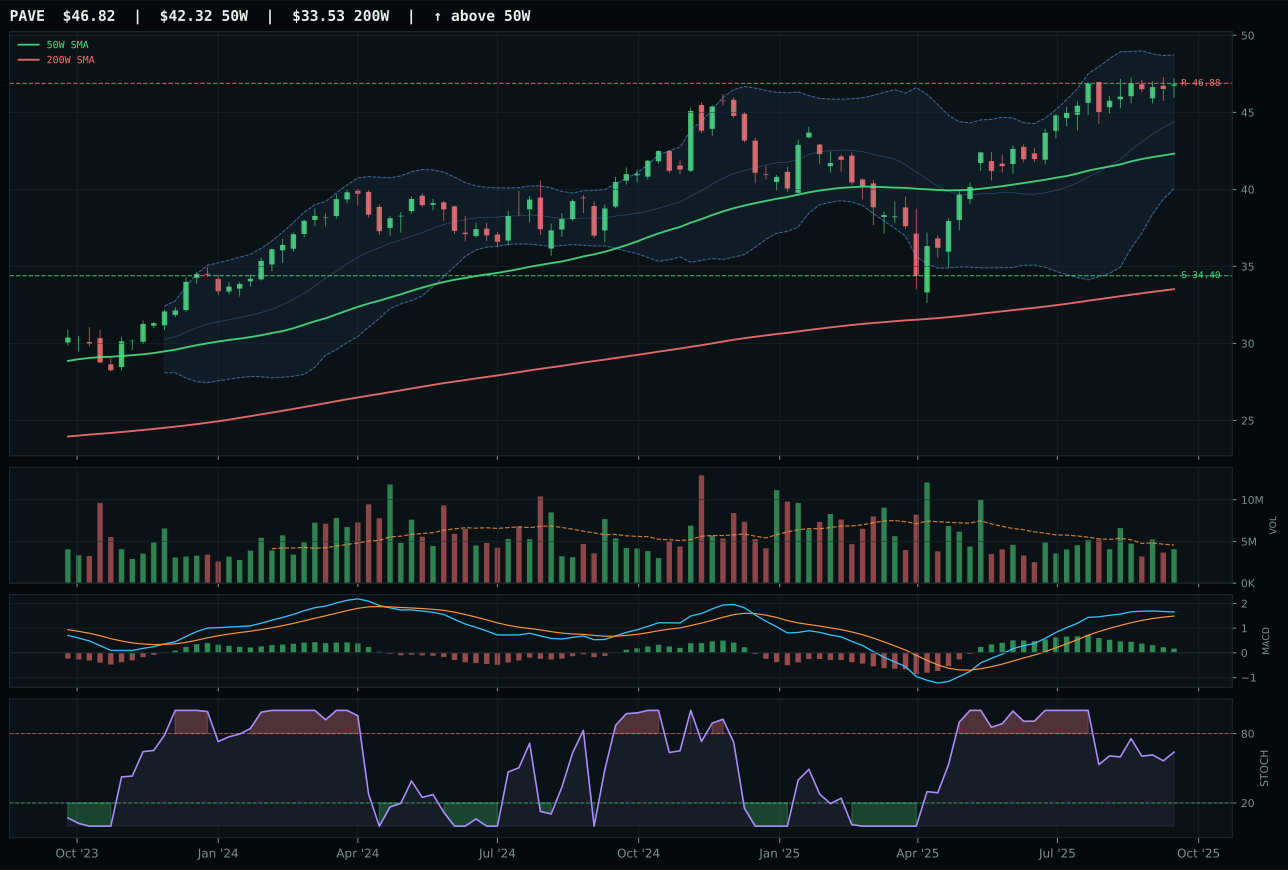
PAVE has a neutral structure profile with -0.1% 13-week relative strength versus SPY.
A failed hold above support would weaken the setup.
Actionable but governed by invalidation levels.
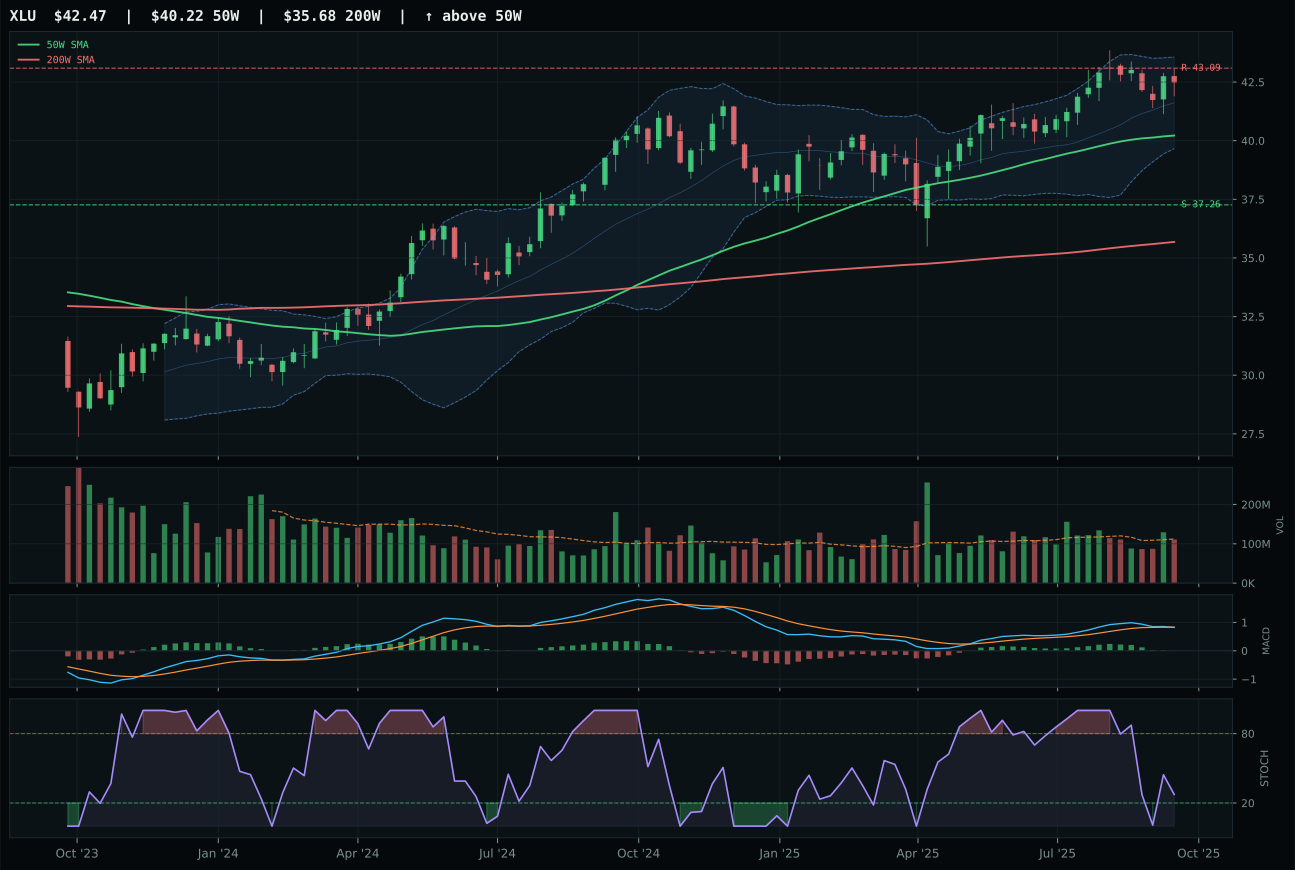
XLU has a neutral structure profile with -6.5% 13-week relative strength versus SPY.
A failed hold above support would weaken the setup.
Actionable but governed by invalidation levels.
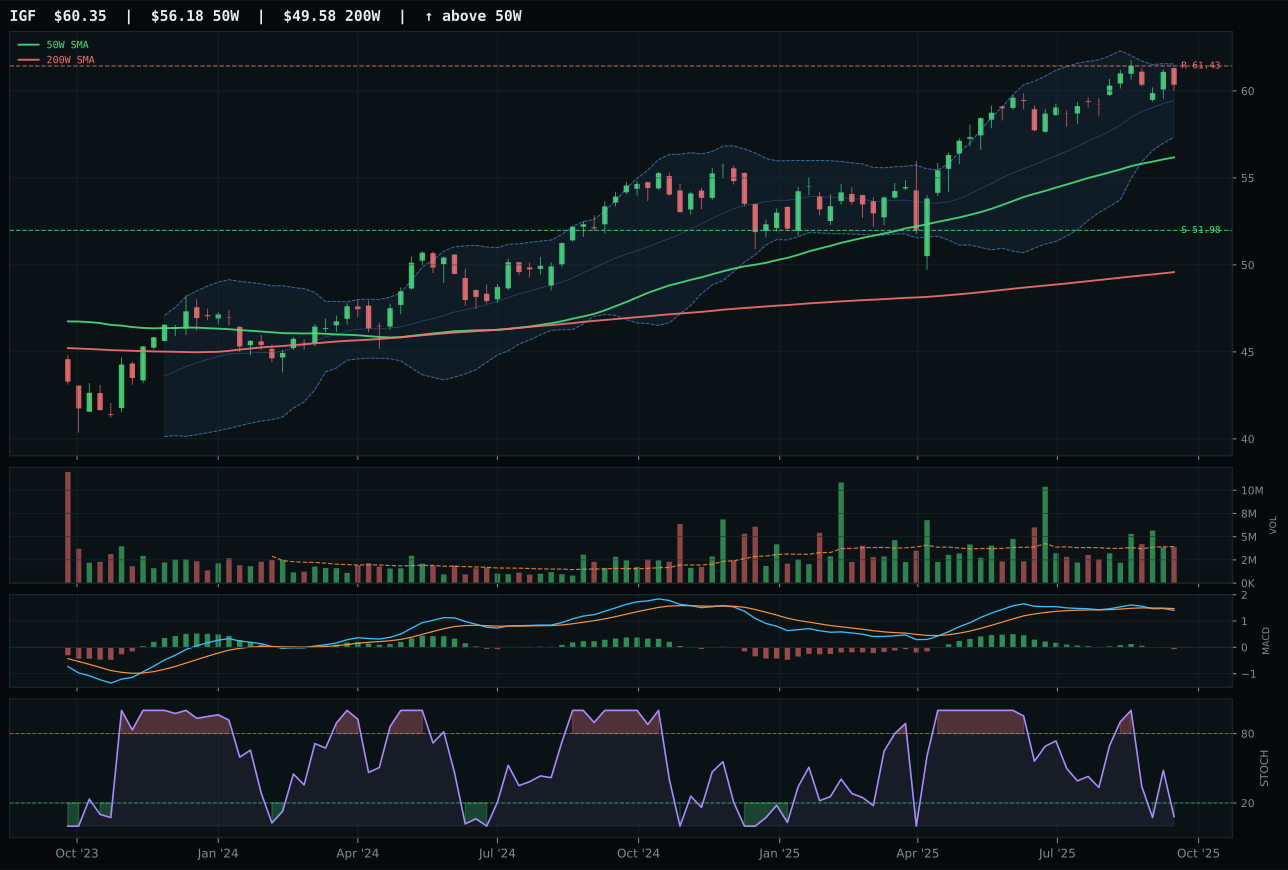
IGF has a neutral structure profile with -7.1% 13-week relative strength versus SPY.
A failed hold above support would weaken the setup.
Actionable but governed by invalidation levels.
PAVE wins decisively over XLU because it retains bullish MACD momentum while XLU's MACD has already turned bearish/weakening, and because PAVE's category-relative strength advantage of 6.4% reflects superior relative purchasing. Price sits 10.6% above the 50W for both—early stage of upside—but the momentum divergence is critical: PAVE's stochastic RSI is rising mid-zone at 0.64 with MACD improving, signaling fresh momentum, while XLU's stochastic is also rising but MACD is weakening, a setup that typically rolls over within 1-2 weeks. PAVE's 70.0 timing score versus XLU's 78.0 reflects the distance penalty (PAVE is closer to the 50W, which is bad for entry but good for risk), but PAVE's 77.1 technical evidence beats XLU's 43.6 decisively. PAVE's 76.5 momentum confirmation score versus XLU's 27 tells the entire story: infrastructure is capturing new capital while utilities are being abandoned.
Utilities & Infrastructure earns 5% as a tier-2 position because its 48.4 category score is middle-of-the-pack and its macro fit (62.0/100) is solid but not exceptional for the current disinflation regime. PAVE's technical evidence (77.1/100) and category-relative strength leadership (+6.4%) position it above XLU and IGF, justifying the representative win. The macro environment offers modest tailwinds: disinflation pressure is +6 (utilities and infrastructure benefit from lower refinance costs), risk appetite is technically +4 but offset by -2 in allocator weighting, and liquidity stress is only -3, milder than in growth categories. However, the category lacks the urgency of AI, Industrial Metals, or Precious Metals. PAVE's neutral structure and neutral volume (0.89x average) suggest this is a position being held rather than accumulated, not a sector attracting new capital flows. The 37.1 risk/reward score with 0.0% upside to resistance means the chart is mature and ready to consolidate or pull back. Hold this 5% for ballast and income, but do not expect outperformance; it is a defensive compromise, not a conviction trade.
Agriculture & Livestock — MOO
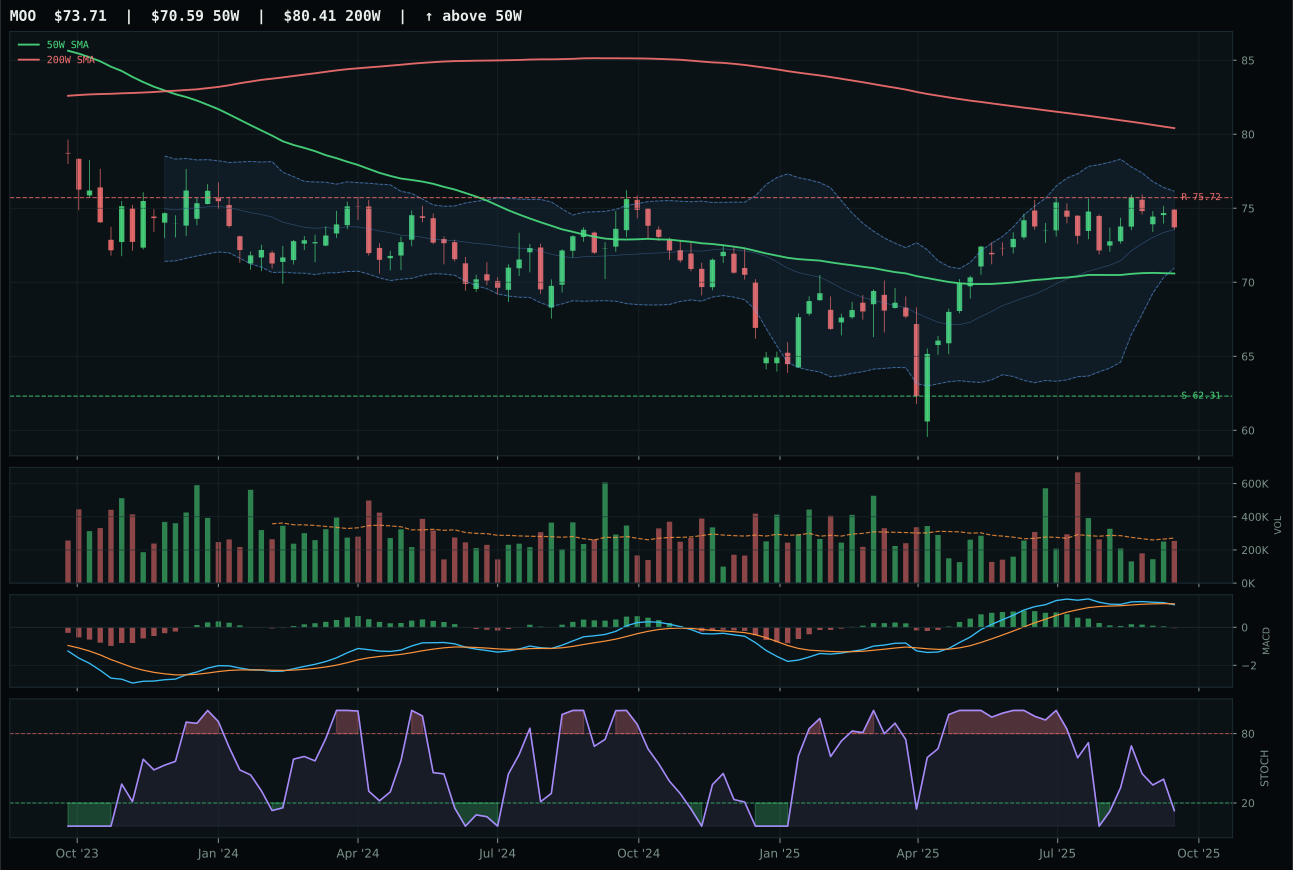
MOO has a neutral structure profile with -11.8% 13-week relative strength versus SPY.
A failed hold above support would weaken the setup.
Actionable but governed by invalidation levels.
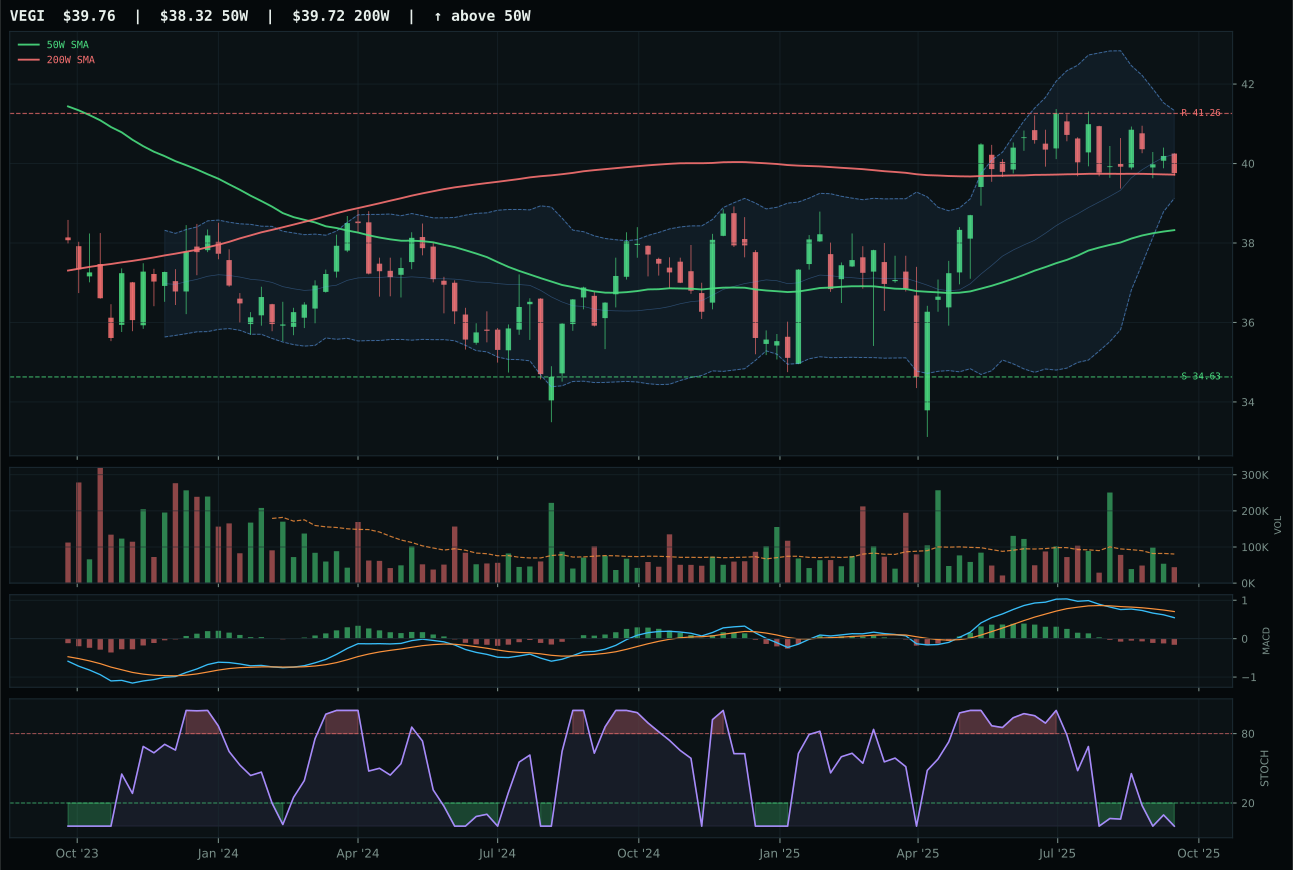
VEGI has a neutral structure profile with -13.7% 13-week relative strength versus SPY.
A failed hold above support would weaken the setup.
Tracked, but not top-2 eligible because: .
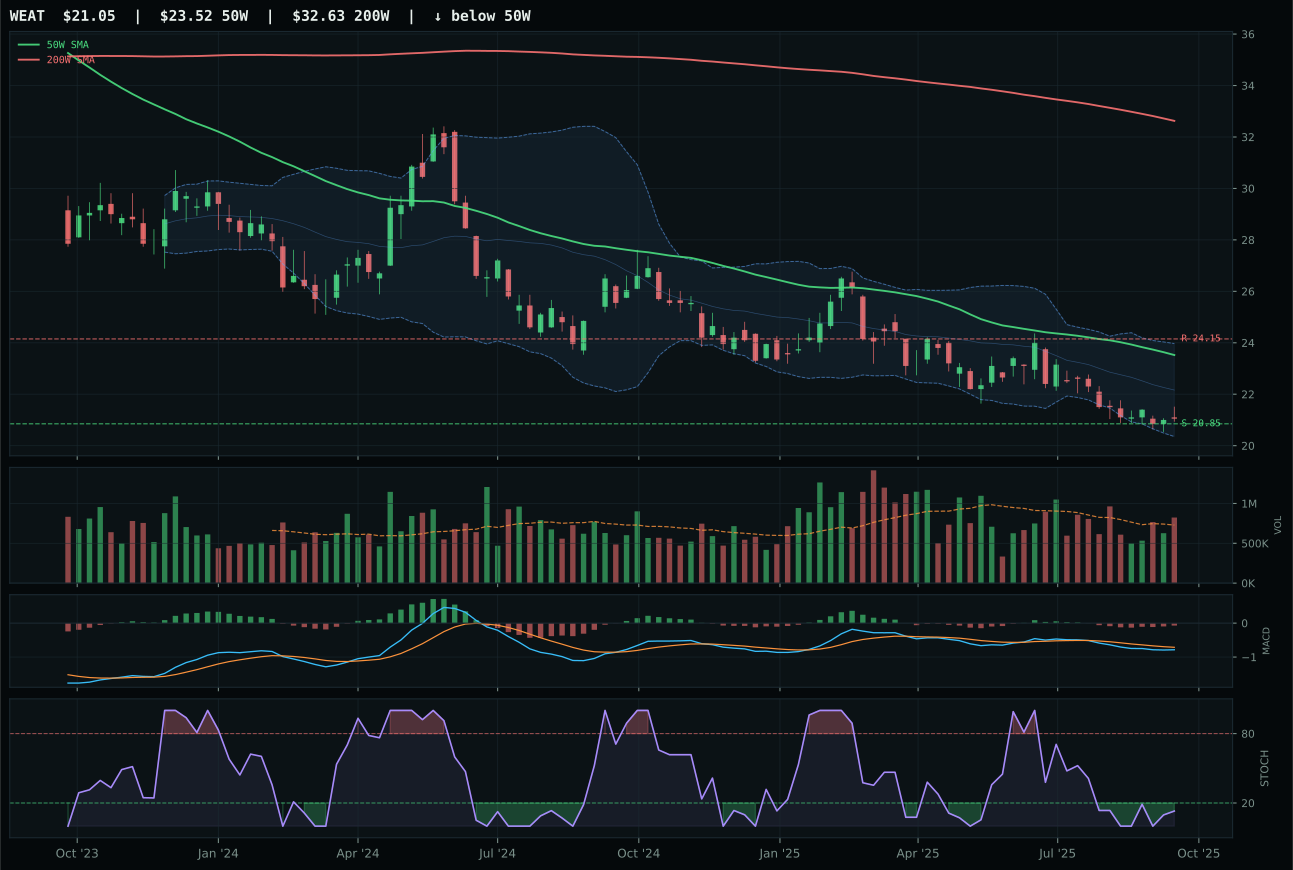
WEAT has a pullback into support profile with -24.0% 13-week relative strength versus SPY.
Extension and support failure are the main tactical risks.
Tracked, but not top-2 eligible because: structurally broken.
Agriculture is excluded from allocation this week, ranked 9th or 10th in final category scores with a 12.0 composite that reflects pure technical failure masked by temporary mean-reversion timing. MOO wins the basket only because its category-relative strength of 2.0% and neutral volume are marginally better than VEGI's thin participation, but this is a hollow victory—price is below the 200W, MACD is bearish/weakening, and 13W returns are flat at -0.1% with SPY-relative strength collapsing at -11.8%. The only reason MOO scores 50 on the composite is timing: at 4.4% from the 50W with stochastic RSI oversold, it technically qualifies as a potential mean-reversion coil. This is the definition of a dead-cat bounce setup, not a healthy accumulation. The sector breadth is broken, real asset sponsorship cannot offset disinflation headwinds (-5 penalty), and the persistence scores (37.5/100) confirm this is a trade, not a trend.
Agriculture & Livestock receives 0% allocation and is excluded from the portfolio because its 12.0 final score reflects structural weakness that timing cannot overcome. The category-level macro fit is 45.0/100, the weakest in the 10-category universe, because disinflation actively hurts agricultural demand (-6 penalty) and commodity breadth support (+5) cannot compensate. MOO's technical evidence is only 29.2/100, a near-crisis score; trend is 37.0, momentum confirmation is 14.1, and volume-price confirmation is 30.0. Every technical pillar is broken. The 50% crypto overlay that halves allocation slots means this category would receive 0% even in a normal week, but its weakness is genuine and macro-driven. For this allocation to shift, agricultural prices would need to decouple from the disinflation narrative, commodity breadth would need to expand across the complex, and prices would need to stabilize above their 200W moving averages—none of which is evident. This sector is in structural decline within the current regime.
Traditional Energy — XLE
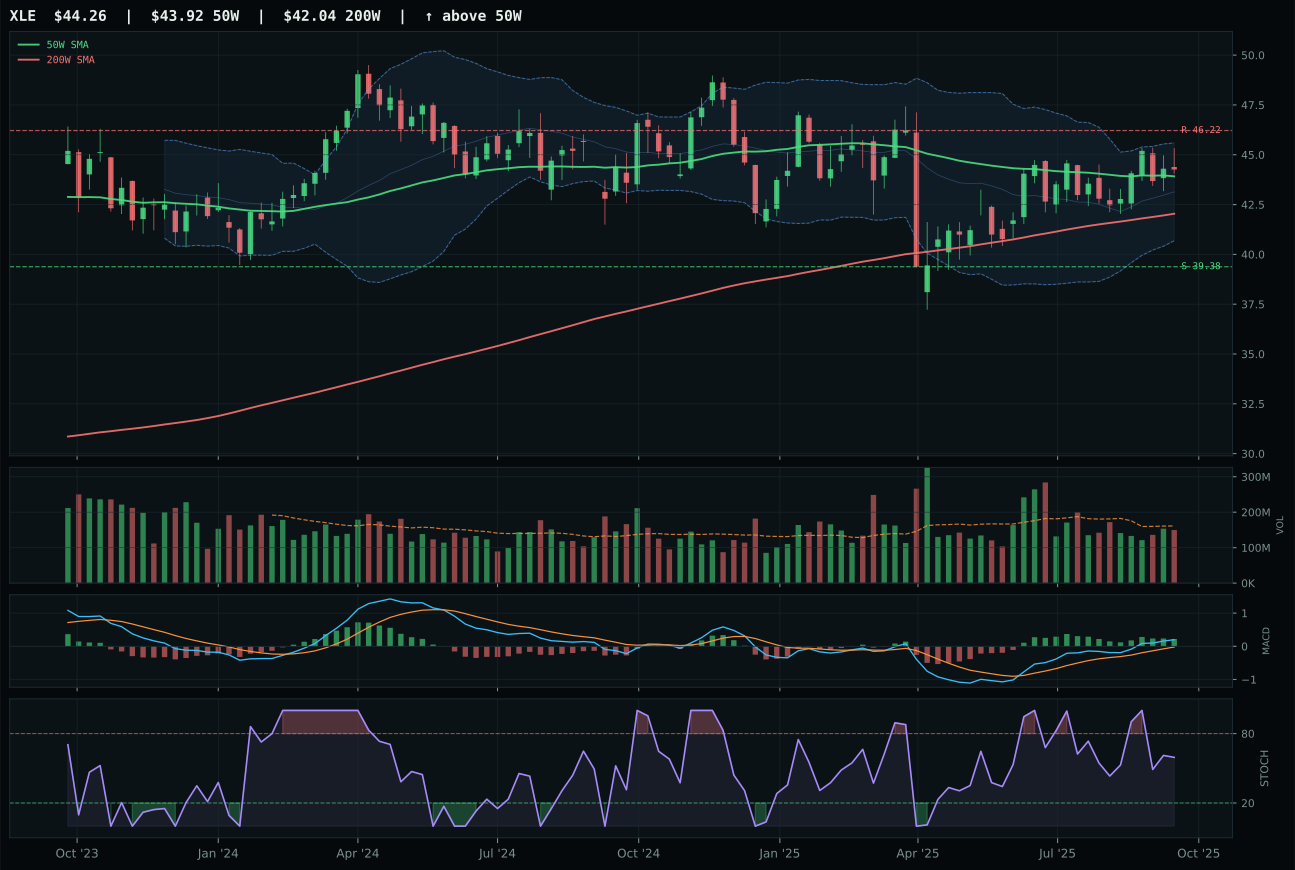
XLE has a compression near 50W profile with -12.2% 13-week relative strength versus SPY.
A failed hold above support would weaken the setup.
Actionable but governed by invalidation levels.
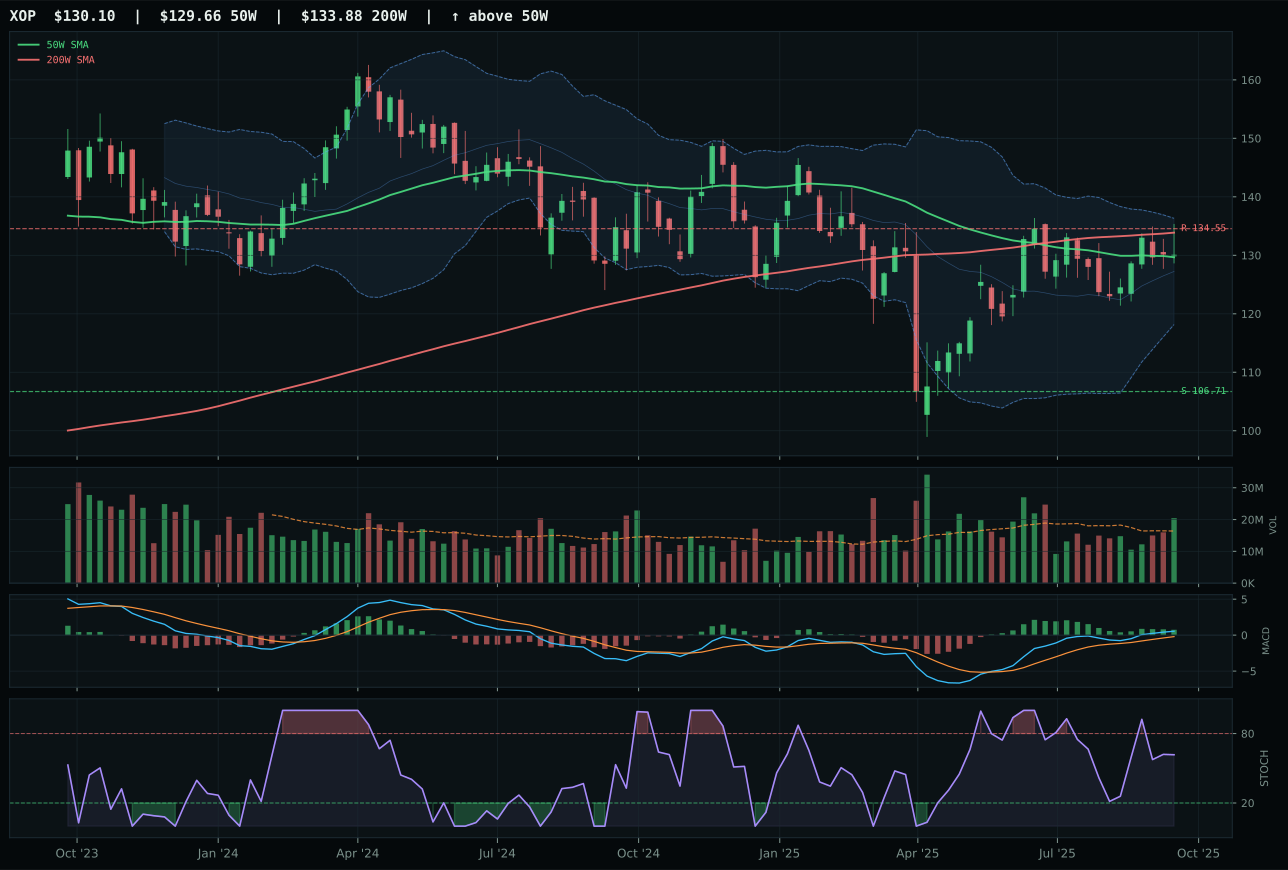
XOP has a compression near 50W profile with -15.0% 13-week relative strength versus SPY.
A failed hold above support would weaken the setup.
Actionable but governed by invalidation levels.
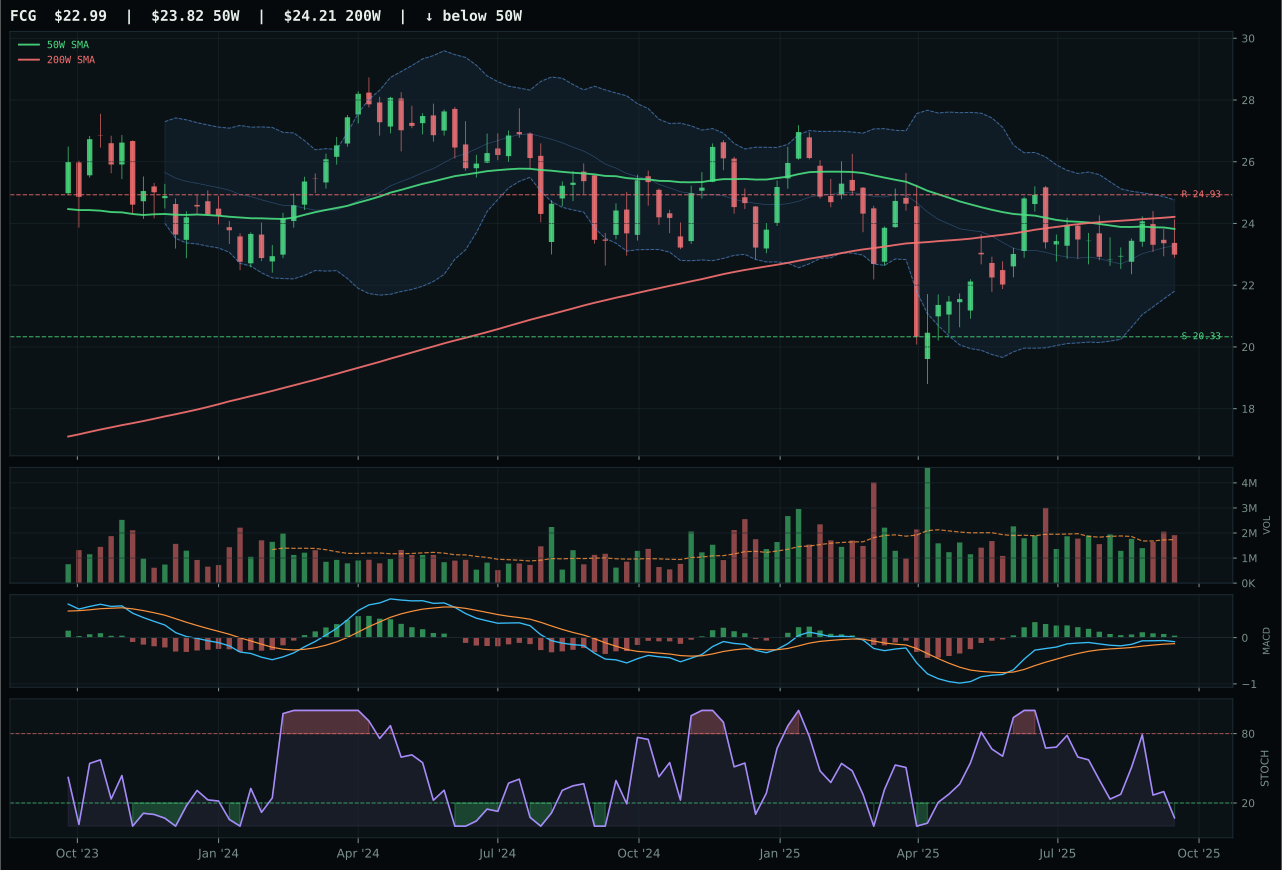
FCG has a neutral structure profile with -19.5% 13-week relative strength versus SPY.
Extension and support failure are the main tactical risks.
Tracked, but not top-2 eligible because: structurally broken.
Traditional Energy is excluded from allocation this week, ranked 9th or 10th in final category scores with a 5.7 composite that reflects a disinflation regime actively hostile to energy demand narratives. XLE wins its basket only on a technicality: price is above both moving averages and MACD is bullish-improving, scoring a perfect 100.0 on timing because it sits 0.8% from the 50W in middle-retracement territory. But this timing advantage masks terminal weakness: 13W returns are -0.5%, RS versus SPY is -11.8%, and momentum confirmation is only 45.8. XOP and FCG are worse, but worse by degree, not kind. The entire category is trapped in compression near the 50W with no volume confirmation (neutral to weak), no relative strength (all three ETFs down double-digits versus SPY), and no macro support. The category-level macro fit is 23.0/100—the worst in the portfolio—because disinflation pressure is a -10 penalty and credit stress is another -7.
Traditional Energy receives 0% allocation because its 5.7 category score reflects a regime mismatch that cannot be traded tactically. The macro environment is actively hostile: disinflation pressure is a -10 headwind, credit stress is -7, and liquidity stress is -7, totaling -24 in active macro penalties with only real asset sponsorship (+5) and +7 from other factors offering offset. In a disinflation regime, energy demand is assumed to be soft, and until inflation re-accelerates or geopolitical supply shocks materialize, energy capital will remain subordinate to growth and metals. XLE's perfect 100.0 timing score is a false comfort signal—it reflects mean-reversion proximity, not trend resumption. The category will return to the portfolio only when (1) macro inflation fears return, (2) crude prices break above structural resistance with volume confirmation, or (3) credit stress indicators reverse sharply, signaling risk-off positioning that favors yield and commodity hedges. None of those conditions are present. This exclusion is macro-driven, not technical, and will persist until the regime fundamentally shifts.